1 Chapter 8. Being responsive to citizens’ expectations: The role of health services in responsiveness and satisfaction 1 Reinhard Busse, Nicole Valentine, Suszy Lessof, Amit Prasad, Ewout van Ginneken 8.1 Introduction The world health report 2000 on the performance of health systems posited responsiveness to citizens’ expectations as a central and particular goal. It pushed forward a debate that frames responsiveness as a valued and desired outcome of health system interventions regardless of the extent to which those interventions lead to health improvement (1). As noted in chapter 3, health services reforms place ever increasing emphasis on meeting citizens’ expectations, improving responsiveness to patients and increasing both population and patient satisfaction. In recent years, many countries have introduced reforms to enhance transparency, patients’ rights and entitlements, choice of provider and access to services – all core elements of responsiveness. These strategic attempts to boost efficiency (by introducing market forces), improve access and increase the quality of the services are also intended to improve a system’s responsiveness to the justified expectations of the population, albeit some of the reforms respond primarily to the articulate and advantaged. The European Observatory’s book on social health insurance (SHI) systems in western Europe (2) marshals evidence around this issue. Saltman et al. (2) show that, on average, these systems are associated with higher levels of responsiveness. However, they hypothesize that this correlation is not directly attributable to the funding mechanism but rather is due to other factors that are more pronounced in SHI countries. For example, the benefit baskets of covered services (i.e. the entitlements of the insured) have been defined more clearly. In addition, on average SHI countries spend a higher percentage of their gross domestic product on health care than tax-funded systems. Such extra costs or trade-offs are cost-effective or justifiable only if they recognize the value of responding to citizens’ expectations. First, this chapter explores the basic concepts behind responsiveness, satisfaction and related terms in section 8.2. The following three sections (8.3–8.5) consider the major approaches and actors to measure them, i.e. primarily WHO, but also the European Union and initiatives 1 In: MCKEE M, FIGUERAS J (eds.) (2012) Health Systems: Health, Wealth and Societal Well-Being. Maidenhead: OUP, p. 175-208

Welcome message from author
This document is posted to help you gain knowledge. Please leave a comment to let me know what you think about it! Share it to your friends and learn new things together.
Transcript
1
Chapter 8. Being responsive to citizens’ expectations: The role of health
services in responsiveness and satisfaction1
Reinhard Busse, Nicole Valentine, Suszy Lessof, Amit Prasad, Ewout van Ginneken
8.1 Introduction
The world health report 2000 on the performance of health systems posited responsiveness to
citizens’ expectations as a central and particular goal. It pushed forward a debate that frames
responsiveness as a valued and desired outcome of health system interventions regardless of
the extent to which those interventions lead to health improvement (1). As noted in chapter 3,
health services reforms place ever increasing emphasis on meeting citizens’ expectations,
improving responsiveness to patients and increasing both population and patient satisfaction.
In recent years, many countries have introduced reforms to enhance transparency, patients’
rights and entitlements, choice of provider and access to services – all core elements of
responsiveness. These strategic attempts to boost efficiency (by introducing market forces),
improve access and increase the quality of the services are also intended to improve a
system’s responsiveness to the justified expectations of the population, albeit some of the
reforms respond primarily to the articulate and advantaged.
The European Observatory’s book on social health insurance (SHI) systems in western
Europe (2) marshals evidence around this issue. Saltman et al. (2) show that, on average,
these systems are associated with higher levels of responsiveness. However, they hypothesize
that this correlation is not directly attributable to the funding mechanism but rather is due to
other factors that are more pronounced in SHI countries. For example, the benefit baskets of
covered services (i.e. the entitlements of the insured) have been defined more clearly. In
addition, on average SHI countries spend a higher percentage of their gross domestic product
on health care than tax-funded systems. Such extra costs or trade-offs are cost-effective or
justifiable only if they recognize the value of responding to citizens’ expectations.
First, this chapter explores the basic concepts behind responsiveness, satisfaction and related
terms in section 8.2. The following three sections (8.3–8.5) consider the major approaches
and actors to measure them, i.e. primarily WHO, but also the European Union and initiatives
1 In: MCKEE M, FIGUERAS J (eds.) (2012) Health Systems: Health, Wealth and Societal Well-Being. Maidenhead: OUP, p. 175-208

2
to ensure patient orientation such as the Picker Institute’s questionnaire for inpatient care
(3,4) or the European Task Force on Patient Evaluations of General Practice (EUROPEP)
instrument to assess primary care (5) . Section 8.6 describes comparative methodology and
results. For example – the basic terms: “responsiveness to the legitimate expectations of the
population for their interaction with the health system” and “satisfaction of the overall
population with the health system” are different but overlapping. Recently, other dimensions
have been added to the debate (e.g. “generosity of the system”), especially through consumer
rights’ initiatives such as the Health Consumer Powerhouse.
Section 8.7 aims to shed some light on the objectives and achievements of the main recent
reforms aimed at increasing responsiveness in European health systems. The chapter
concludes with some reflections about the significance of making responsiveness a health
system goal and its instrumental value for reaching other goals. For example, higher
responsiveness should result in higher utilization of services and better compliance for longer
term treatment, and therefore in better health outcomes (assuming that services are effective
and appropriate).
8.2 Responsiveness and satisfaction – conceptual and measurement issues
Both responsiveness and satisfaction are terms that aim to capture the degree to which health
systems, or their components, are successful in responding to the expectations of the general
population or a population subgroup of patients. A wide range of methods has been used to
attempt to measure responsiveness and/or satisfaction over the last decades, most visibly
work by Blendon et al. (6); population satisfaction questions in Eurobarometer surveys since
1996 (7, 8, 9, 10, 11); the Picker Institute’s development of inpatient satisfaction surveys (3,
4); the EUROPEP instrument to assess general practice (5); and the WHO world health report
2000 (1).
Responsiveness and satisfaction are different but overlapping. WHO quotes “responsiveness
to the legitimate expectations of the population for their interaction with the health system”
(cf. section 8.3). This implies that there can be illegitimate or unjustified expectations too, but
the instrument only captures those that are regarded as legitimate. The “satisfaction of the
overall population with the health system” may be influenced by other expectations (which
experts or policy-makers may consider illegitimate) and factors outside the direct control of
the health-care system (such as government in general, cf. section 8.5). Thus, satisfaction is
likely to be more dependent on expectations than responsiveness surveys – the lower the

3
expectations, the higher the satisfaction with the actual system and vice versa. WHO initially
used a vignette approach in its responsiveness methodology in order to correct for different
expectations but this approach was dropped due to the complex data requirements. It is
extremely difficult to adjust for variations in expectations between countries and this has not
been achieved with any approach to date.
Responsiveness captures various detailed dimensions of the system that users encounter.
Satisfaction analyses the satisfaction of the whole population, i.e. regular (e.g. those with
chronic illness) and irregular users as well as those who do not utilize the system (but still
pay for it). Unlike similar measures in the quality-of-life and satisfaction domains,
responsiveness has an additional criterion that requires self-reports to be based on one (or
several) actual experience(s) with health services in the respondents’ recent past (previous
year). Usually these experiences are based on some type of interaction with the health system
– with a specific person, a communication campaign or another type of event or action that
did not entail direct personal interactions.
The WHO instrument focuses on what happened during actual contact rather than eliciting a
respondent’s satisfaction with, or expectations of, the health system in general. Thus it has
much in common with patient satisfaction instruments such as those developed by the Picker
Institute (cf. section 8.4). These usually contain a question regarding a general assessment of
the care received but are based on patients’ assessments of specific, predefined dimensions of
care. They may rather more accurately termed patient responsiveness surveys.
All the responsiveness and satisfaction surveys mentioned so far are based on surveys among
health system users and/ the general population rather than (for example) expert opinion or
facility audits. This differentiates them from approaches based on an expert assessment of
published data and health system characteristics. The most high-profile of these approaches is
the annual Euro Health Consumer Index produced by the Health Consumer Powerhouse (12)
(see section 8.6 for more details).
8.3 Responsiveness to legitimate expectations: methodology and results
The WHO measure aims to measure the responsiveness of the whole health system to the
whole population (thus far it has been applied mostly to those with ambulatory and/or
inpatient encounters) by examining what actually happens when the system comes into
contact with an individual. This is conceptually different from either a population’s general
satisfaction with its health system or patients’ satisfaction with the care they receive (13).

4
An extensive literature review covered disciplines including sociology, anthropology, ethics,
health economics and management in order to elicit what people value most in their
interactions with the health system. This was used to select a common set of dimensions (or
domains) that characterize the concept of responsiveness. Eight domains were described as
goals for health-care processes and systems; higher average health and lower health
inequalities; and non-impoverishment.
The WHO surveys include two major categories (inpatient and ambulatory care) for
responsiveness, each with a total of eight domains. The detailed contents of these are given in
Box 8.1.
Box 8.1 Contents of the eight dimensions of WHO’s responsiveness surveys
1. RESPECTFUL TREATMENT (DIGNITY) Being shown respect when greeted by and when talking to health-care providers. Having physical examinations conducted in a way that respects your cultural norms.
2. CONFIDENTIALITY OF PERSONAL INFORMATION Having health-care providers listen to you when you talk. Having information about your health and other personal information kept confidential. Having conversations with health-care providers without other people overhearing.
3. CLARITY OF COMMUNICATION Having the health-care providers explain things so you can understand. Giving the patients and family time to ask the health-care provider questions.
4. INVOLVEMENT IN DECISIONS (AUTONOMY) Freedom to discuss other treatment options or care regimes if you want. Being involved as much as you want in deciding about your health care. Freedom to express a preference for an intervention and to select a particular intervention.
5. CONVENIENT TRAVEL AND SHORT WAITING TIMES (PROMPT ATTENTION) Having short travel times and convenient access to health-care facilities. Having short waiting times for consultations and admissions. Having short waiting times for test results. Having short waiting lists for non-emergency surgery. Having nurses available when needed during hospital stay.
6. SURROUNDINGS (BASIC AMENITIES) Having enough space, seating and fresh air in the waiting rooms, examination rooms and hospital wards. Having a clean facility (including clean toilets). having healthy and edible food for patients in hospital. Having comfortable sleeping arrangements for patients staying in hospital.
7. CONTACT WITH THE OUTSIDE WORLD AND MAINTENANCE OF REGULAR
ACTIVITIES (SOCIAL SUPPORT) Having family and friends visit you as much as you want when you are a patient in hospital. Being able to maintain regular activities and keep in contact with family, friends and events in the outside world when you are a patient in hospital.
8. CHOICE OF HEALTH-CARE PROVIDER Being able to choose your health-care provider (place or person). Being able to change health-care provider if you want to. Being able to stay with the same health-care provider if you want to. Being able to consult for a second opinion or with a specialist if so desired.
Source: (14)

5
The data presented in the world health report 2000 were based on expert opinions but WHO
consequently undertook two large population surveys in a number of countries. The multi-
country survey study in 2000/01 (MCS study) (13) and the world health survey in 2002 (15)
(WHS; for details see below) worked mainly via interviews, partly by postal surveys (in the
MCS study). Interviewees in the MCS study were asked to rate their experiences over the
past 12 months. While the questions regarding seven of the eight domains were relevant for
both inpatient and ambulatory care, only inpatients were asked about social support. All
domains included a summary rating question (scaled 1–5, from very good to very bad). In
addition, several domains included report questions on how often a particular experience had
occurred during encounters with the health system (scaled 1–4, from always to never).
Table 8.1 shows the available results for the thirteen EU15 countries in the MCS survey, i.e.
five SHI countries (Luxembourg, Germany, Belgium, France, the Netherlands), seven tax-
financed systems and a mixed system (Greece). WHO’s weights were derived from the
frequencies with which respondents ranked the different elements first. Prompt attention was
perceived as the most important and choice of provider the least. When these are applied to
the different components of responsiveness, the United Kingdom scores best for inpatient
care (followed by Luxembourg and Ireland); Ireland scores highest for ambulatory care
(followed by Germany and the United Kingdom). Unfortunately, no longitudinal data are
available yet so there should be a very cautious interpretation about the impact of system
characteristics and reforms on responsiveness.

6
Table 8.1 WHO’s components of responsiveness for EU15 countries in the MCS survey,
2000-2001
Autonomy Choice Communi-
cation
Confiden-
tiality
Dignity Prompt
attention
Acc
ess
to f
am
ily
an
d
com
mu
nit
y s
up
po
rt
Ba
sic
am
enit
ies
Country
weighted
mean
Relative
order
In Amb In Amb In Amb In Amb In Amb In Amb In Amb In Amb In Amb
Ireland 75 87 88 98 91 94 92 94 91 98 82 95 90 88 87 94 2 1
UK 81 81 93 98 85 85 90 96 94 95 82 81 95 77 88 87 1 3
Sweden 81 83 87 94 89 88 88 86 97 95 74 82 95 74 86 86 4 4
Luxem-bourg
83 83 88 98 90 81 83 82 92 91 83 82 94 74 87 85 2 9
Germany 74 84 85 98 74 85 83 87 85 90 85 94 89 83 82 89 8 2
Belgium 75 79 97 100 87 87 79 81 88 92 73 84 91 75 83 86 5 4
France 71 71 96 100 88 89 83 85 91 95 72 81 90 77 83 86 5 4
Nether-lands
72 80 88 97 82 85 75 77 87 94 85 89 96 72 83 86 5 4
Finland 76 84 60 83 86 88 83 86 85 95 81 86 87 72 79 86 9 4
Spain 61 64 82 85 84 79 83 83 85 83 78 83 80 71 79 79 9 10
Italy 53 58 90 98 74 73 68 69 74 73 78 75 79 61 74 73 11 11
Portugal 66 67 78 85 71 76 70 71 66 71 71 76 74 65 71 73 12 11
Greece 44 48 71 72 49 53 79 81 61 63 61 71 78 59 62 64 13 13
Notes: countries are sorted by average level of overall responsiveness for inpatients and outpatients. No data are available for other countries. In = Inpatient care. Amb = Ambulatory care. Source: Valentine et al. (16) Except for confidentiality, the SHI countries score (on average) from 2%–8% more than tax-
funded countries. The highest and most relevant advantages are seen in the area of choice.
Clearly, this is not due to the SHI funding mechanism itself but rather to deliberate decisions
to allow patient choice of provider in these countries (introduced later and often more
restricted in other countries; cf. section 8.6).
The large differences within the country groups confirm that the funding mechanism is not
the determining factor for higher levels of responsiveness. Countries that choose SHI
contributions rather than taxation put more emphasis on certain dimensions of
responsiveness. For example, France scores lower for prompt attention in inpatient care than

7
most tax-financed countries while the United Kingdom scores higher than almost all of the
SHI countries for both autonomy and choice.
The more restricted character of choice in the United Kingdom compared with SHI countries
raises the question of intercountry comparability. Can the same care receive comparatively
high responsiveness scores when lower expectations are met but lower responsiveness scores
if expectations are high and therefore not met? This question is addressed below.
8.3.1 Responsiveness and population expectations
The WHS 2002 (15) collected data on responsiveness among other aspects related to health
systems performance. Data were collected from 69 countries globally, including 29 Member
States of the WHO European Region .
As described above, respondents were asked to rate their last encounter with the (ambulatory
or inpatient) health-care system on a five-point scale across eight domains. In addition, the
survey contained vignettes depicting a variety of situations that may arise in people’s
interactions with the health-care system. Respondents were asked to rate these hypothetical
experiences on a five-point scale ranging from very bad to very good. Five vignettes were
used for choice and ten vignettes for every other domain. Available data on both
responsiveness and expectations are given in Table 8.2. The data show wide variations in
responsiveness scores – from 55.8 to 91.5 in outpatient care and from 51.6 to 90.3 for
inpatient care. However, there were far fewer variations in expectations (56.3–64.3 in
ambulatory care; 56.6–64.3 in inpatient care).
It is noteworthy that Austria showed both the lowest expectation scores and the highest
responsiveness score. The country with the lowest responsiveness score (Ukraine) had
comparatively high expectation scores. This led to the hypothesis that people with different
expectations rate similar experiences differently. For example, those with low expectations
may rate their last experience as good while those with higher expectations may rate an
experience with similar characteristics and quality as only moderate. Respondents were asked
to rate the vignettes in order to obtain a true measure of a person's experience.
8
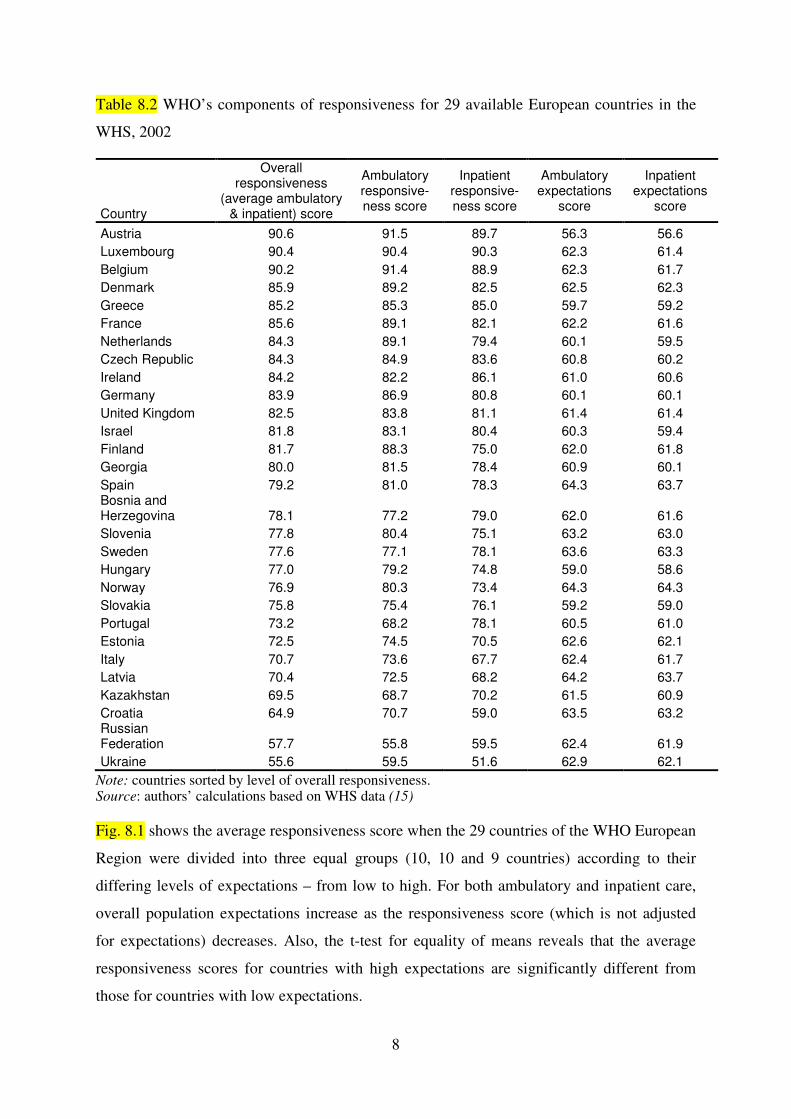
Table 8.2 WHO’s components of responsiveness for 29 available European countries in the
WHS, 2002
Country
Overall responsiveness
(average ambulatory & inpatient) score
Ambulatory responsive-ness score
Inpatient responsive-ness score
Ambulatory expectations
score
Inpatient expectations
score
Austria 90.6 91.5 89.7 56.3 56.6
Luxembourg 90.4 90.4 90.3 62.3 61.4
Belgium 90.2 91.4 88.9 62.3 61.7
Denmark 85.9 89.2 82.5 62.5 62.3
Greece 85.2 85.3 85.0 59.7 59.2
France 85.6 89.1 82.1 62.2 61.6
Netherlands 84.3 89.1 79.4 60.1 59.5
Czech Republic 84.3 84.9 83.6 60.8 60.2
Ireland 84.2 82.2 86.1 61.0 60.6
Germany 83.9 86.9 80.8 60.1 60.1
United Kingdom 82.5 83.8 81.1 61.4 61.4
Israel 81.8 83.1 80.4 60.3 59.4
Finland 81.7 88.3 75.0 62.0 61.8
Georgia 80.0 81.5 78.4 60.9 60.1
Spain 79.2 81.0 78.3 64.3 63.7 Bosnia and Herzegovina 78.1 77.2 79.0 62.0 61.6
Slovenia 77.8 80.4 75.1 63.2 63.0
Sweden 77.6 77.1 78.1 63.6 63.3
Hungary 77.0 79.2 74.8 59.0 58.6
Norway 76.9 80.3 73.4 64.3 64.3
Slovakia 75.8 75.4 76.1 59.2 59.0
Portugal 73.2 68.2 78.1 60.5 61.0
Estonia 72.5 74.5 70.5 62.6 62.1
Italy 70.7 73.6 67.7 62.4 61.7
Latvia 70.4 72.5 68.2 64.2 63.7
Kazakhstan 69.5 68.7 70.2 61.5 60.9
Croatia 64.9 70.7 59.0 63.5 63.2 Russian Federation 57.7 55.8 59.5 62.4 61.9
Ukraine 55.6 59.5 51.6 62.9 62.1
Note: countries sorted by level of overall responsiveness. Source: authors’ calculations based on WHS data (15)
Fig. 8.1 shows the average responsiveness score when the 29 countries of the WHO European
Region were divided into three equal groups (10, 10 and 9 countries) according to their
differing levels of expectations – from low to high. For both ambulatory and inpatient care,
overall population expectations increase as the responsiveness score (which is not adjusted
for expectations) decreases. Also, the t-test for equality of means reveals that the average
responsiveness scores for countries with high expectations are significantly different from
those for countries with low expectations.

9
Fig. 8.1 Relationship between overall responsiveness and population expectations for 29
countries of the WHO European Region (EURO)
Source: World Health Survey 2002 (15)
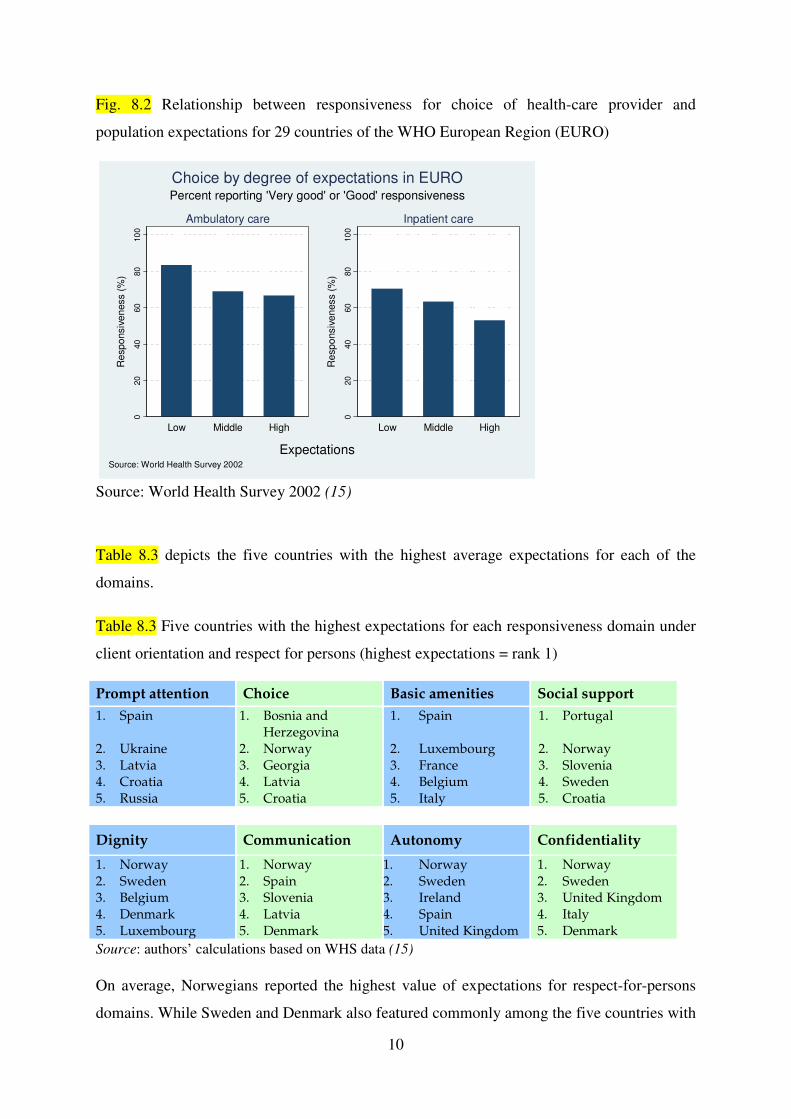
Only prompt attention, communication and choice show a statistically significant association
within individual domains. Fig. 8.2 shows an example of choice of health-care provider.
National populations with low expectations for choice expressed a substantially higher
responsiveness for choice in ambulatory care than populations with higher expectations. For
inpatient care, responsiveness decreased with increasing expectations.
020
40
60
80
10
0
Re
sp
onsiv
en
ess (
%)
Low Middle High
Ambulatory care
020
40
60
80
10
0
Re
sp
onsiv
en
ess (
%)
Low Middle High
Inpatient care
ExpectationsSource: World Health Survey 2002
Percent reporting 'Very good' or 'Good' responsiveness
Responsiveness level by degree of expectations in EURO
10
Fig. 8.2 Relationship between responsiveness for choice of health-care provider and
population expectations for 29 countries of the WHO European Region (EURO)
Source: World Health Survey 2002 (15)
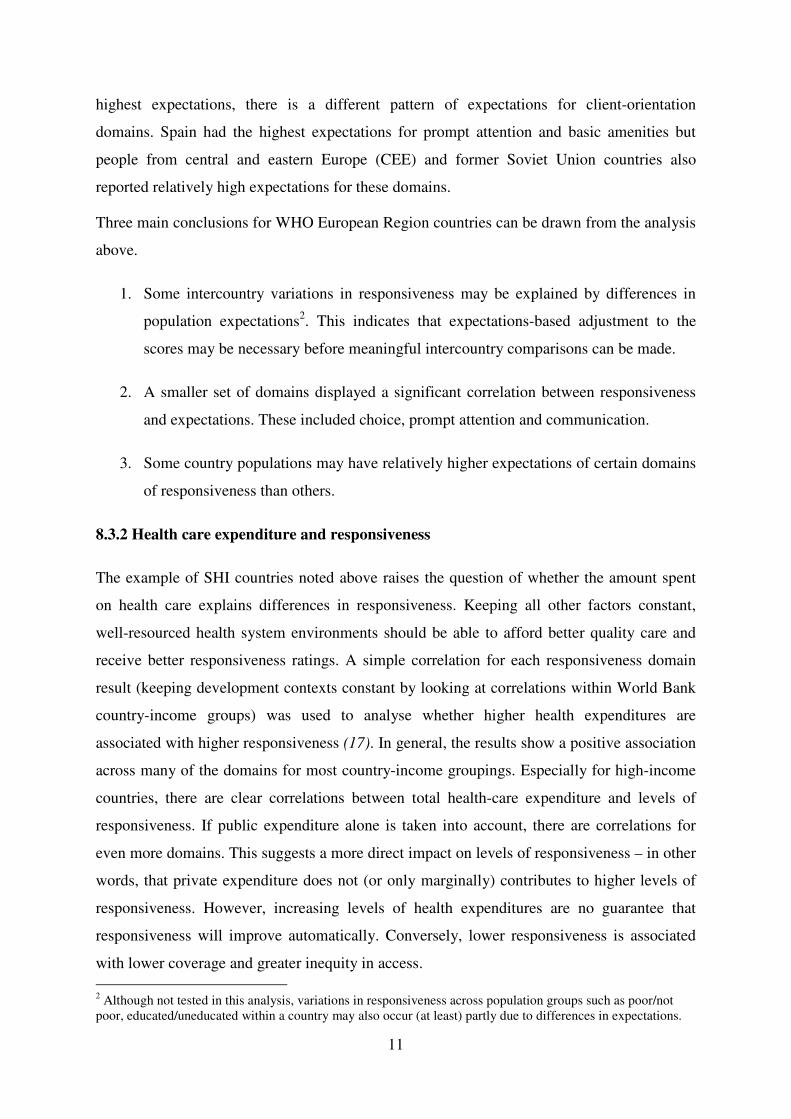
Table 8.3 depicts the five countries with the highest average expectations for each of the
domains.
Table 8.3 Five countries with the highest expectations for each responsiveness domain under
client orientation and respect for persons (highest expectations = rank 1)
Prompt attention Choice Basic amenities Social support
1. Spain 2. Ukraine 3. Latvia 4. Croatia 5. Russia
1. Bosnia and Herzegovina
2. Norway 3. Georgia 4. Latvia 5. Croatia
1. Spain 2. Luxembourg 3. France 4. Belgium 5. Italy
1. Portugal 2. Norway 3. Slovenia 4. Sweden 5. Croatia
Dignity Communication Autonomy Confidentiality
1. Norway 2. Sweden 3. Belgium 4. Denmark 5. Luxembourg
1. Norway 2. Spain 3. Slovenia 4. Latvia 5. Denmark
1. Norway 2. Sweden 3. Ireland 4. Spain 5. United Kingdom
1. Norway 2. Sweden 3. United Kingdom 4. Italy 5. Denmark
Source: authors’ calculations based on WHS data (15) On average, Norwegians reported the highest value of expectations for respect-for-persons
domains. While Sweden and Denmark also featured commonly among the five countries with
020
40
60
80
10
0
Re
sp
onsiv
en
ess (
%)
Low Middle High
Ambulatory care
020
40
60
80
10
0
Re
sp
onsiv
en
ess (
%)
Low Middle High
Inpatient care
ExpectationsSource: World Health Survey 2002
Percent reporting 'Very good' or 'Good' responsiveness
Choice by degree of expectations in EURO
11
highest expectations, there is a different pattern of expectations for client-orientation
domains. Spain had the highest expectations for prompt attention and basic amenities but
people from central and eastern Europe (CEE) and former Soviet Union countries also
reported relatively high expectations for these domains.
Three main conclusions for WHO European Region countries can be drawn from the analysis
above.
1. Some intercountry variations in responsiveness may be explained by differences in
population expectations2. This indicates that expectations-based adjustment to the
scores may be necessary before meaningful intercountry comparisons can be made.
2. A smaller set of domains displayed a significant correlation between responsiveness
and expectations. These included choice, prompt attention and communication.
3. Some country populations may have relatively higher expectations of certain domains
of responsiveness than others.
8.3.2 Health care expenditure and responsiveness
The example of SHI countries noted above raises the question of whether the amount spent
on health care explains differences in responsiveness. Keeping all other factors constant,
well-resourced health system environments should be able to afford better quality care and
receive better responsiveness ratings. A simple correlation for each responsiveness domain
result (keeping development contexts constant by looking at correlations within World Bank
country-income groups) was used to analyse whether higher health expenditures are
associated with higher responsiveness (17). In general, the results show a positive association
across many of the domains for most country-income groupings. Especially for high-income
countries, there are clear correlations between total health-care expenditure and levels of
responsiveness. If public expenditure alone is taken into account, there are correlations for
even more domains. This suggests a more direct impact on levels of responsiveness – in other
words, that private expenditure does not (or only marginally) contributes to higher levels of
responsiveness. However, increasing levels of health expenditures are no guarantee that
responsiveness will improve automatically. Conversely, lower responsiveness is associated
with lower coverage and greater inequity in access. 2 Although not tested in this analysis, variations in responsiveness across population groups such as poor/not poor, educated/uneducated within a country may also occur (at least) partly due to differences in expectations.

12
8.4 Patient responsiveness/ satisfaction surveys: methodology and results
As mentioned in section 8.2, patient satisfaction surveys constitute a third pillar of data.
Usually, they belong more to responsiveness than to satisfaction as they are based on (i)
predetermined domains, and (ii) patients’ actual health-service encounters. They are shown
here as they partly contradict the responsiveness data described in the previous section.
Surveys are available for inpatient and for general practitioner care, the latter being the most
important component of ambulatory care.
8.4.1 Inpatient care
Satisfaction surveys of inpatients have become regular practice in many countries of the
WHO European Region but are seldom comparable, either within or (more likely) between
countries. The Picker Institute questionnaire is an exception. This inpatient survey asks
patients to report problems with particular aspects of their care upon discharge. It
distinguishes seven dimensions of patient-centred care which overlap with the areas of
responsiveness but draws different boundaries between them.
1. Information, communication and education – including clinical status; progress and
prognosis; processes of care; facilitation of autonomy; self-care; and health
promotion.
2. Coordination and integration of care – including clinical care; ancillary and support
services; front-line care.
3. Physical comfort – including pain management; help with activities of daily living;
surroundings and hospital environment.
4. Emotional support and alleviation of fear and anxiety – including clinical status;
treatment and prognosis; impact of illness on self and family; financial impact of
illness.
5. Respect for patients’ values, preferences and expressed needs – including impact of
illness and treatment on quality of life; involvement in decision-making; dignity;
needs; and autonomy.
6. Involvement of family and friends – including social and emotional support;
involvement in decision-making; support for caregiving; impact on family dynamics
and functioning.
13
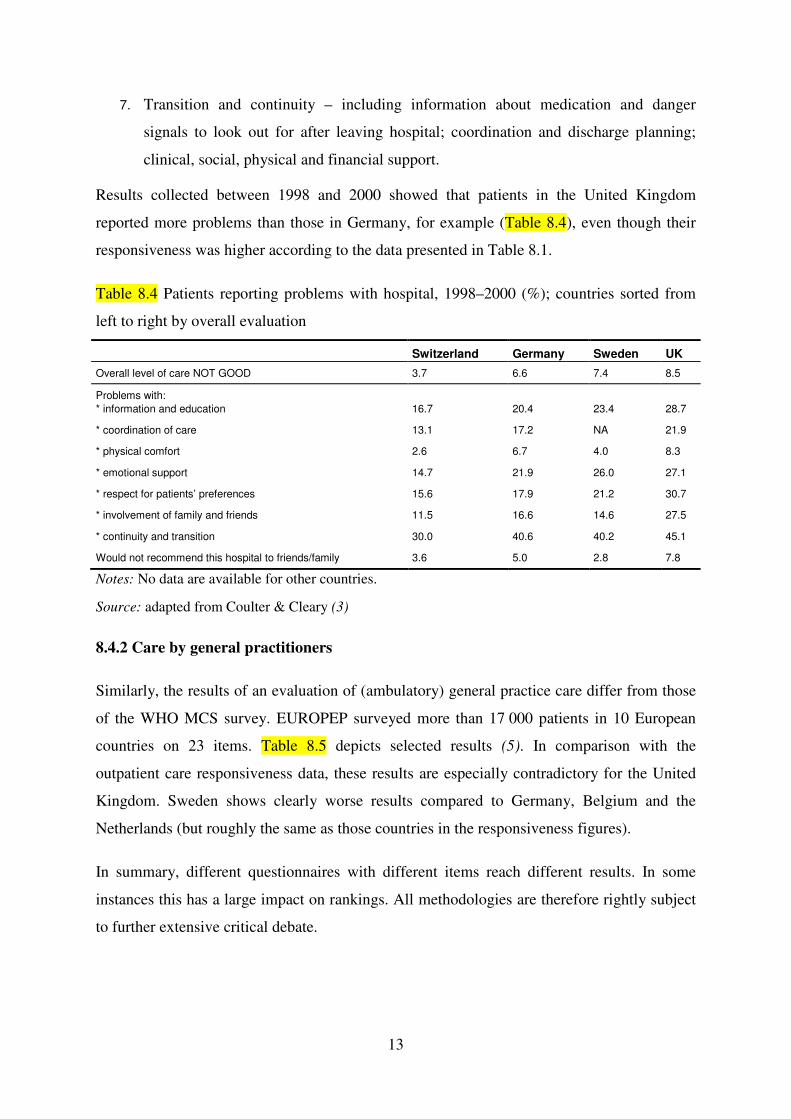
7. Transition and continuity – including information about medication and danger
signals to look out for after leaving hospital; coordination and discharge planning;
clinical, social, physical and financial support.
Results collected between 1998 and 2000 showed that patients in the United Kingdom
reported more problems than those in Germany, for example (Table 8.4), even though their
responsiveness was higher according to the data presented in Table 8.1.
Table 8.4 Patients reporting problems with hospital, 1998–2000 (%); countries sorted from
left to right by overall evaluation
Switzerland Germany Sweden UK
Overall level of care NOT GOOD 3.7 6.6 7.4 8.5
Problems with:
* information and education
16.7
20.4
23.4
28.7
* coordination of care 13.1 17.2 NA 21.9
* physical comfort 2.6 6.7 4.0 8.3
* emotional support 14.7 21.9 26.0 27.1
* respect for patients’ preferences 15.6 17.9 21.2 30.7
* involvement of family and friends 11.5 16.6 14.6 27.5
* continuity and transition 30.0 40.6 40.2 45.1
Would not recommend this hospital to friends/family 3.6 5.0 2.8 7.8
Notes: No data are available for other countries.
Source: adapted from Coulter & Cleary (3)
8.4.2 Care by general practitioners
Similarly, the results of an evaluation of (ambulatory) general practice care differ from those
of the WHO MCS survey. EUROPEP surveyed more than 17 000 patients in 10 European
countries on 23 items. Table 8.5 depicts selected results (5). In comparison with the
outpatient care responsiveness data, these results are especially contradictory for the United
Kingdom. Sweden shows clearly worse results compared to Germany, Belgium and the
Netherlands (but roughly the same as those countries in the responsiveness figures).
In summary, different questionnaires with different items reach different results. In some
instances this has a large impact on rankings. All methodologies are therefore rightly subject
to further extensive critical debate.

14
Table 8.5 Evaluations of general practice care in ten European countries, circa 1998 (%);
countries sorted from left to right by overall evaluation
CH SLO D B ICE NL S N DK UK
Overall evaluation 91 89 88 87 83 80 78 76 74 72
1. Keeping records and data confidential 96 97 94 97 97 95 88 91 96 91
2. Listening to you 96 95 92 93 93 89 85 85 79 83
3. Making you feel you had time during
consultations
96 92 90 92 93 88 85 78 75 80
4. Providing quick services for urgent
problems
96 89 95 93 86 85 84 83 81 71
… (15 other items)
20. Offering you services for preventing
disease
84 85 85 77 74 76 75 67 68 74
21. Getting through to the practice on the
telephone
96 92 95 93 75 71 67 56 53 62
22. Being able to speak to the GP on the
telephone
91 93 87 90 72 72 65 54 59 51
23. Waiting time in the waiting room 79 60 70 66 70 61 65 57 59 50
Notes: No data are available for other countries.
Source: Grol et al. (5)
8.5 Population satisfaction: methodology and results
In principle, the concept of population satisfaction with the whole health system is
straightforward. In fact, it is difficult to measure satisfaction as the answers to all
questionnaires depend on the specific wording of the question asked as well as the answer
categories provided. In the circumstances discussed in this chapter these answers depend
particularly on factors not yet well-understood, i.e. (i) the context in which a survey takes
place, e.g. coloured by recent media coverage of scandals, fraud or underprovision of
services; (ii) no differentiation between the system as a whole and certain subsectors about
which the respondent may be more knowledgeable; or (iii) the inability to differentiate
between the health-care system and government in general.
These caveats need to be kept in mind when drawing international comparisons. Comparisons
of absolute levels of satisfaction should be treated with caution. Cultural and locally temporal
differences in the expression of satisfaction and its dynamics make this a complex tool.
Satisfaction data incorporate underlying expectations so that low satisfaction may mean high
expectations which are unmet. Satisfaction would be higher in other countries with similar
health care but lower expectations.

15
Table 8.6 incorporates data from different surveys over the last 30 years. They share a
common focus on the broader health system, but the actual questions – and therefore the
range of answers which can be considered positive or negative – differ between countries (see
notes to Table 8.6). However, the order can be judged as a relatively good indicator.
Table 8.6 Satisfaction with the health-care system in EU15 countries (%), various surveys
1973/1976-2004; countries sorted according to 2002 survey
1973/76 (A) 1988/91 (B) 1996 (C) 1998 (D) 1998 (E) 1999/2000 (F) 2002 (G) 2004 (H)
Finland 71 86 81 78 74 73
Austria 79 63 73 71 83 67
Belgium 70 63 57 77 65
France 41 65 65 59 78 64 65
Luxembourg 71 67 50 72 58
Denmark 90 91 48 76 52
Sweden 32 67 58 46 59 48
Germany 81 41 66 58 43 50 47 28
Netherlands 84 47 73 70 70 73 46
Spain 21# 36 43 31 38 46 42
UK 85 27 48 57 49 56 31 32
Italy 38 12 16 20 15 26 31 21
Ireland 50 58 23 48 20
Greece 18 16 11 19 19
Portugal 20 16 6 24 14
Notes: (A) level of satisfaction very good or good; (B) “On the whole the system works pretty well,
and only minor changes are necessary to make it work better” (as opposed to “There are some good things in our health-care system, but fundamental changes are needed to make it work better” and “Our health-care system has so much wrong with it that we need to completely rebuild it.”); (C) & (D) Eurobarometer 44.3 (conducted February-April 1996) & Eurobarometer 49 (conducted April-May 1998), “In general, would you say you are very satisfied, fairly satisfied, neither satisfied nor dissatisfied, fairly dissatisfied or very dissatisfied with the way health care runs in (our country)?”: very or fairly satisfied; (E) Eurobarometer 50.1 (conducted November-December 1998), “And, on a scale from 1 to 10, how satisfied are you with health services in (our country)?”: answers 7, 8, 9 or
10; (F): Eurobarometer 52.1 (conducted November-December 1999), “Please tell me whether you are very satisfied, fairly satisfied, not very satisfied or not at all satisfied with each of the following?” “(our country)’s health-care system in general”: very or fairly satisfied; (G) Eurobarometer 57.2 (conducted April-June 2002), “On the whole the system works pretty well” or “There are some good
things in the way health care runs, and only minor changes would make it work better”; (H) The Harris Poll (conducted in June 2004), “feel positively about health-care system (in my country).” Sources: (A) Pescosolido et al. (18); (B) Blendon et al. (19); (C) European Commission 1996 (7); (D) European Commission 1998 (8); (E) European Commission 1999 (9); (F) European Commission 2000 (10); (G) European Commission 2002 (11); (H) Taylor (20)
The positive development in Austria is most striking. Austrians were only fairly satisfied in
the 1970s (rank 4 of 7) and as late as 1996 (7/15) but were much more satisfied in 1998
16
(3/15), 1999/2000 (1/15) and 2002 (2/15). Similar but more stable positive trends can be seen
e.g. in Finland (in spite of the drastic cuts in public health finances in the first half of the
1990s) or Spain3. In contrast, (relative) satisfaction figures have decreased in the United
Kingdom (moving from first position in the 1970s to a midway position in 1999/2000 and
eleventh among the EU15 countries in 2002); the Netherlands; and, to a lesser degree,
Germany. Italy and Portugal score continuously low.
8.6 Comparative methodology and results
The WHO concept of responsiveness was developed following an extensive literature review
covering disciplines such as sociology, anthropology, ethics, health economics and
management in order to elicit what people value most in their interactions with the health
system. This review formed the basis of the set of eight domains mentioned in section 8.3
(14). Many of these domains are present in existing patient questionnaires and studies (e.g.
the Picker surveys or the EUROPEP evaluation), but none of these adequately captures all of
the dimensions that emerged from the literature review. Hence, WHO developed an
instrument (questionnaire) specific to responsiveness in order to cover all of the dimensions
valued by individuals when they interact with health systems.
Table 8.7 demonstrates that the questions on the population’s satisfaction with the health
system in general (or the need to reform it) are in a separate category in the Eurobarometer
surveys and do not overlap directly with any of the WHO responsiveness domains. Similarly,
the Euro Health Consumer Index only partially overlaps with the WHO responsiveness
domains. For example, it expands the concept of prompt attention to include “patients’ rights
and information” (with questions on the existence of patients’ rights legislation, right to a
second opinion, access to own medical record, readily available register of doctors, or a
provider catalogue with quality listing); “generosity of public health-care system” (with
indicators relating to the number of publicly paid cataract operations and kidney transplants
or the inclusion of dental care in the benefit basket); and “pharmaceuticals” (including the
degree of cost-sharing or the speed with which new cancer drugs are deployed in the system).
The Euro Health Consumer Index also includes several outcomes’ dimensions, the results of
which also influence its overall ranking.
3 Data cover the entire period of the transition from a system based largely on social security contributions via a tax-funded national health service type of system to a tax-funded regionalized system.

17
Table 8.7 Selection of questionnaires/studies/surveys/rankings with questions on the
responsiveness domain
WHR 2000a
Picker surveyb
EUROPEP GP practice evaluationc
Eurobarometerd Euro Health Consumer Index e
Outcomes Health-adjusted life years X AMI mortality X Infant deaths X Cancer survival X Potential years of life lost X MRSA infections X Responsiveness/ Satisfaction Respect for dignity X X X Respect for confidentiality X X X Communication X X X Respect for autonomy X X X X Access to prompt attention/ waiting
X X X
Basic amenities X X Access to social support networks
X X
Choice of institution/ care provider
X X
Patients’ rights and information
X
Satisfaction with health system/ need for reform
X
“Generosity” of system X Access to pharmaceuticals X Fairness in financing X Source: Based on a WHO (1); b Jenkinson et al. (4); c Grol et al. (5); d European Commission (11); e Health Consumer Powerhouse (12) Different dimensions may very well produce different results that reflect the selection of
weights, domains and indicators (i.e. surveys capture different phenomena); differences in the
methodology of data collection (e.g. sampling) and interpretation; or actual differences due to
changes in the various health systems over time.
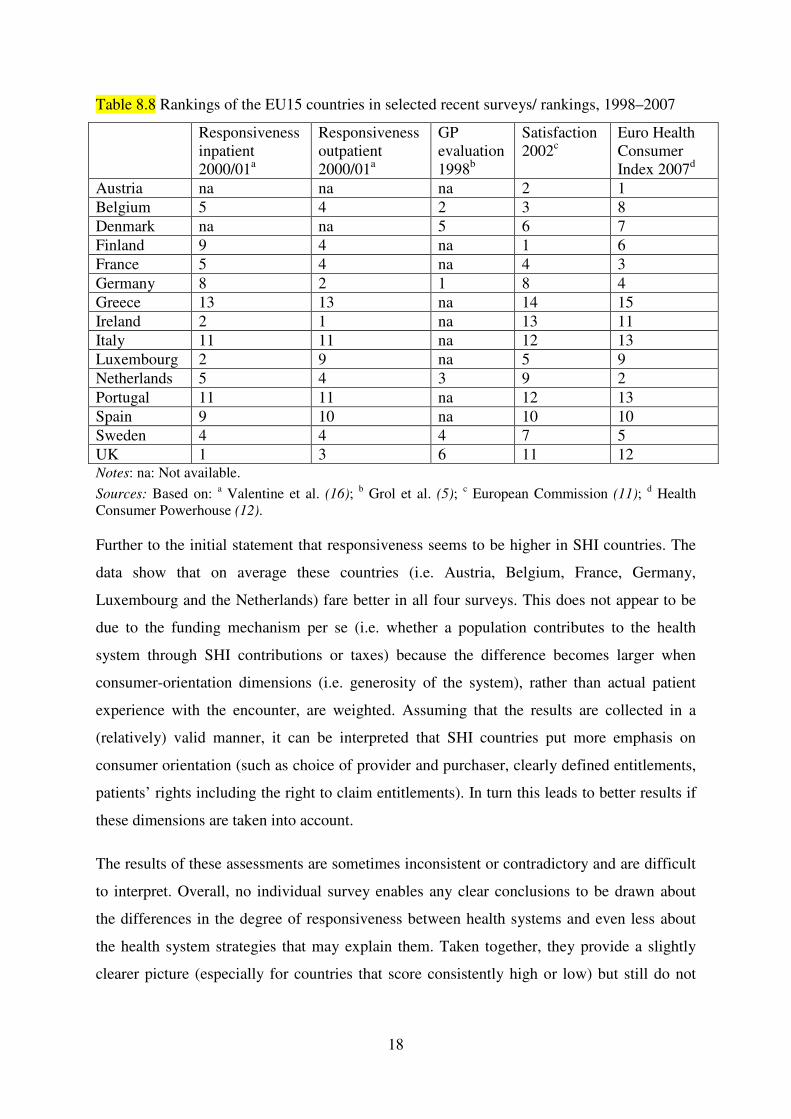
Table 8.8 provides data on the ranks of the EU15 countries in the WHO responsiveness
surveys on inpatient and outpatient care respectively, the EUROPEP instrument to evaluate
GP practices, the Eurobarometer 57.2 question on satisfaction and the 2007 version of the
Euro Health Consumer Index.
18
Table 8.8 Rankings of the EU15 countries in selected recent surveys/ rankings, 1998–2007
Responsiveness inpatient 2000/01a
Responsiveness outpatient 2000/01a
GP evaluation 1998b
Satisfaction 2002c
Euro Health Consumer Index 2007d
Austria na na na 2 1 Belgium 5 4 2 3 8 Denmark na na 5 6 7 Finland 9 4 na 1 6 France 5 4 na 4 3 Germany 8 2 1 8 4 Greece 13 13 na 14 15 Ireland 2 1 na 13 11 Italy 11 11 na 12 13 Luxembourg 2 9 na 5 9 Netherlands 5 4 3 9 2 Portugal 11 11 na 12 13 Spain 9 10 na 10 10 Sweden 4 4 4 7 5 UK 1 3 6 11 12 Notes: na: Not available.
Sources: Based on: a Valentine et al. (16); b Grol et al. (5); c European Commission (11); d Health Consumer Powerhouse (12). Further to the initial statement that responsiveness seems to be higher in SHI countries. The
data show that on average these countries (i.e. Austria, Belgium, France, Germany,
Luxembourg and the Netherlands) fare better in all four surveys. This does not appear to be
due to the funding mechanism per se (i.e. whether a population contributes to the health
system through SHI contributions or taxes) because the difference becomes larger when
consumer-orientation dimensions (i.e. generosity of the system), rather than actual patient
experience with the encounter, are weighted. Assuming that the results are collected in a
(relatively) valid manner, it can be interpreted that SHI countries put more emphasis on
consumer orientation (such as choice of provider and purchaser, clearly defined entitlements,
patients’ rights including the right to claim entitlements). In turn this leads to better results if
these dimensions are taken into account.
The results of these assessments are sometimes inconsistent or contradictory and are difficult
to interpret. Overall, no individual survey enables any clear conclusions to be drawn about
the differences in the degree of responsiveness between health systems and even less about
the health system strategies that may explain them. Taken together, they provide a slightly
clearer picture (especially for countries that score consistently high or low) but still do not
19
provide conclusive advice about the characteristics of the health systems that “explain” the
differences.
However, it is important to note that such surveys do exist and will appear increasingly on the
public’s agenda. Policy-makers have to deal with the pressures exerted by such league tables.
They cannot simply dismiss the data as unreliable even when they are used to call for
ineffective, inequitable or inefficient changes in the health-care system.
8.7 Health-care reforms that aim to increase responsiveness
In many (if not all) European countries, policy-makers have begun to react to the greater
emphasis on – and the populations’ greater demand for – responsiveness in the health-care
system. Important strategies include:
• defining patients’ rights and entitlements and making them transparent (e.g. definition
of benefit baskets and patient rights charters);
• enlarging the benefit basket with services that primarily address dignity (especially
palliative care) rather than health gain;
• addressing the issue of waiting lists;
• introducing or enlarging choice of provider and purchaser.
Strategies to increase the first four WHO dimensions of responsiveness (dignity, autonomy,
confidentiality and communication) also include changes in organizational and policy
development. Staff education and training have been refocused to promote greater respect for
human dignity; to ensure that personnel communicate effectively; and to foster the
appropriate application of confidentiality policies. Information sharing has been made more
effective and mechanisms put in place to allow patients a more autonomous role and to
participate more in clinical decision-making, as legitimate co-producers of care. Such
improvements are very likely to result in better compliance with treatment and care
(particularly among patients with chronic conditions) and can be secured without necessarily
requiring significant additional investment.
20
An indirect approach to influencing provider behaviour can be taken through broader
regulatory initiatives such as the creation of patient rights’ legislation or patient charters4;
specific service guarantees, for example on waiting times; or an ombudsman function.
Patients’ rights are subject to numerous international and regional declarations and
conventions. The increasing complexity of the health-care sector, the technological
developments in medicine and the introduction of market elements in the health-care system
have increased the need to guarantee patients’ rights by law. Some commentators have
questioned the emphasis on the legal approaches to patients’ rights but an explicit
consideration of the patient’s perspective fits well with a general democratic evolution in
many countries.
The concept of patients’ rights is moving from a focus on individual rights ─ that is,
restricting state intervention in the individual’s right to life and privacy ─ to a focus on the
collective right to health care. In addition to ensuring access to health services, the right to
health care has also been interpreted as including consumer participation via procedural
mechanisms to implement their preferences, for example the International Labour
Organization (ILO) Convention No.130, also known as the European Social Code. WHO
took up the subject of citizen participation and collective rights as early as 1994. Its
Declaration on the Promotion of Patients’ Rights in Europe states that “patients have a
collective right to some form of representation at each level of the health-care system in
matters pertaining to the planning and evaluation of services, including the range, quality and
functioning of the care provided” (22).
Another component to ensure transparency and clarity about patients’ rights is an explicit
definition of a benefit basket. This development is usually seen in the context of the health
system’s goal to improve health, as a benefit basket will be designed primarily to ensure that
effective and cost-effective technologies are covered while those that are ineffective or less
cost-effective are omitted. In order to ensure responsiveness it is also important to remember
the right to die in dignity and that most people want to do this at home. This requires
additional palliative-care services and personnel which should be part of the benefit basket.
However, palliative care and hospices have to be treated separately as the usual health
technology assessment (HTA) evaluation mechanisms (with their emphasis on health gain
and cost effectiveness) may disadvantage such services.
4 For an overview of such initiatives within EU countries see (21).
21
It is perhaps even more challenging to create a climate that encourages health service
personnel to treat patients well. Health workers typically value professionalism but where pay
fails to meet legitimate expectations they may become demotivated and fail to deliver the
highest quality care. Those that are paid particularly badly may raise money illicitly,
responding only to informal payments and creating barriers to access. Maintaining
responsiveness therefore implies providing adequate resources – a potentially challenging
proposition. It may be expensive to increase pay but it creates an opportunity to refocus
management and specify expectations. However, health system managers must recognize the
evidence that policies that seek to micromanage clinical behaviour can lead to a loss of
professional identity and undermine autonomy and motivation so that health workers do
exactly what they are meant to, but no more.
Other dimensions of responsiveness (i.e. those that primarily improve the client orientation of
services) are also likely to require a considerable commitment of resources. This is
particularly true if capacity is to be increased in order to reduce waiting times or facilities are
to be improved; and also if new client information systems or new complaints procedures are
required. In combination or separately, policy-makers may also advance responsiveness by
including explicit requirements to meet clients’ expectations in contractual arrangements
(where these apply) or by building them into service delivery strategies.
It has been argued that, in principle, waiting times can be reduced through supply-side
policies if the volume of surgery is considered inadequate and by demand-side policies if it is
not (23). Supply-side policies include raising public capacity by increasing the number of
specialists and beds, or by using capacity available in the private sector. They also include
increasing productivity by funding extra activity; fostering day-surgery; and linking the
remuneration system of doctors and hospitals to the activity performed. On the supply side,
the pronounced and prolonged reductions in long waits for coronary revascularization surgery
in Denmark have been achieved by significant increases in activity, backed up by increases in
capacity. Hospitals that breach the one-month waiting-time target must bear the expense of
the patient’s choice of a different public or private provider (even outside the country).
The striking reductions in long waiting times in England and Spain have been due to a
combination of maximum waiting-time targets, additional activity and changed incentives. In
addition, in Spain there appears to have been a marked fall in mean waiting times for patients
requiring various procedures after financial incentives were linked to the achievement of
waiting-time targets in 1998. Many OECD countries have implemented visible improvements

22
in the efficiency of surgical units, particularly by increasing the share of day surgery.
However, increased activity to reduce waiting times is often swiftly followed by increased
demand that returns waiting times to near their original levels. Any strategy to tackle waiting
times is therefore a combination of increased capacity and approaches aimed at both
providers (financial incentives to provide more services and/or disincentives for failing to
meet targets) and patients (increased choice).
Client orientation can be viewed from two perspectives. Firstly, the collective and individual
influences on care decisions – either when citizens influence the package of care and benefit
coverage or the power of individual patients to get the care they desire or deem necessary.
The second perspective looks at the mechanisms available to citizens to influence health-care
decisions. Following Hirschman’s notions on organizational behaviour these can be grouped
into voice and exit (24). Voice is essentially a political or administrative category, whereas
exit is market-based. Voice mechanisms include information; consultation and assessment of
public views; advocacy groups; formal representation; and patients’ rights. Exit revolves
around consumer choice which is often portrayed as a core issue that touches on fundamental
rights and is instrumental in increasing responsiveness.
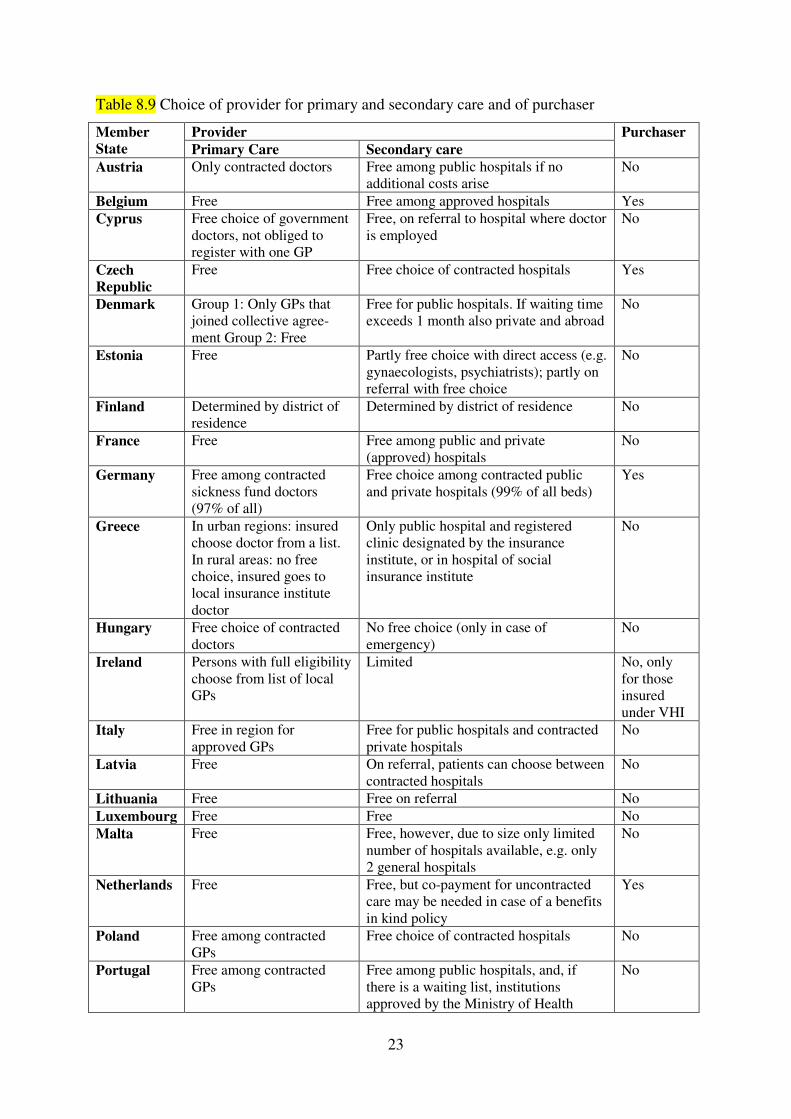
The instrument of choice is used for providers and/or purchasers. Consumers in most
countries have the right to choose their primary care providers (see Table 8.9). In SHI
systems, consumers can also choose ambulatory specialists and hospitals (although gate-
keepers are used in some countries e.g. the Netherlands). Choices are more restricted in
national health service systems although this is changing rapidly in many countries. For
example, patients in Sweden and Norway are allowed to choose any hospital outside their
county of residence; in Denmark this is permissible only if waiting times are not met. Patients
within the English national health service have also seen their hospital choices increase.
Increased consumer choice of providers clearly increases responsiveness but there is debate
over its negative impact on other social objectives, notably equity, cost containment and
allocative efficiency. There is evidence that choice tends to benefit the higher (and usually
better-informed) social classes and thus may lead to increasing health inequalities. The policy
response should not necessarily be to reduce choice in line with the equity in poverty
argument, but rather to focus efforts to ensure wider access to information and support choice
among the underprivileged.
23
Table 8.9 Choice of provider for primary and secondary care and of purchaser
Member
State
Provider Purchaser
Primary Care Secondary care
Austria Only contracted doctors Free among public hospitals if no additional costs arise
No
Belgium Free Free among approved hospitals Yes Cyprus Free choice of government
doctors, not obliged to register with one GP
Free, on referral to hospital where doctor is employed
No
Czech
Republic
Free Free choice of contracted hospitals Yes
Denmark Group 1: Only GPs that joined collective agree-ment Group 2: Free
Free for public hospitals. If waiting time exceeds 1 month also private and abroad
No
Estonia Free Partly free choice with direct access (e.g. gynaecologists, psychiatrists); partly on referral with free choice
No
Finland Determined by district of residence
Determined by district of residence No
France Free Free among public and private (approved) hospitals
No
Germany Free among contracted sickness fund doctors (97% of all)
Free choice among contracted public and private hospitals (99% of all beds)
Yes
Greece In urban regions: insured choose doctor from a list. In rural areas: no free choice, insured goes to local insurance institute doctor
Only public hospital and registered clinic designated by the insurance institute, or in hospital of social insurance institute
No
Hungary Free choice of contracted doctors
No free choice (only in case of emergency)
No
Ireland Persons with full eligibility choose from list of local GPs
Limited No, only for those insured under VHI
Italy Free in region for approved GPs
Free for public hospitals and contracted private hospitals
No
Latvia Free On referral, patients can choose between contracted hospitals
No
Lithuania Free Free on referral No Luxembourg Free Free No Malta Free Free, however, due to size only limited
number of hospitals available, e.g. only 2 general hospitals
No
Netherlands Free Free, but co-payment for uncontracted care may be needed in case of a benefits in kind policy
Yes
Poland Free among contracted GPs
Free choice of contracted hospitals No
Portugal Free among contracted GPs
Free among public hospitals, and, if there is a waiting list, institutions approved by the Ministry of Health
No

24
Slovakia Free among contracted GPs
Free, on referral Yes
Slovenia Free Free choice of public hospital and contracted private hospitals
No
Spain Free in area No choice, according to region (except in case of emergency)
No
Sweden Free Free choice of regional public hospitals and approved private establishments
No
UK Free Patients can choose from a minimum of 4 local providers
No
Sources: Busse and van Ginneken (26); authors’ own compilation
In countries where choice has been extended or there is essentially a free choice of provider
there are concerns about the resulting fragmentation of care and duplication of investigations.
For example, consumers may choose different primary care and ambulatory care providers
for the same episode. While this responds to the expectations of users, it is clinically
undesirable as it gives rise to poorer health outcomes and undermines efficiency by over-
utilizing services. Also, patients value some “treatments”, therapeutic interventions and
medicaments that are neither efficacious nor cost effective. These pose a direct conflict
between responsiveness and efficiency. Policy makers need to manage these trade-offs,
although there is growing evidence that they overestimate the importance that patients attach
to unlimited choice.
Several countries have also introduced a free choice of insurer (notably – Switzerland,
Germany, the Netherlands). The evidence on whether this free choice enhances consumers’
capacity to choose and increases efficiency is rather disappointing. It suggests that the choice
of insurer might not function well for all (particularly for bad risks) and that the information
is not always adequate to support informed choices. Moreover, consumer reluctance to switch
insurers has not heightened competition. There has been little increase in the quality of health
services, either because the funds lack the instruments to do so, as in Germany, or because
they do not use the available instruments, such as selective contracting in the Netherlands. By
contrast, Busse concluded that (generally speaking) the introduction of individual free choice
of insurer in Germany was successful, since it raised the funds’ accountability and stimulated
their development from payers to more active purchasers (25). However, there is no
conclusive evidence that this has increased the responsiveness of the system.
In a review of trade-offs, equity is certainly another key consideration that has potentially
very significant conflicts with responsiveness. Measures to increase responsiveness (e.g.
those that focus on choice) may favour those sectors of the population that are better able to

25
compare and choose between options. This tendency to benefit the younger, healthier, more
affluent and better educated (who can negotiate the services they want) has been termed the
inverse law of participation – widening the equity gap.
Again policy-makers need to be explicit about how they balance competing issues and to be
proactive in pursuing equity; widening access to information about services; and using
positive discrimination strategies to increase access and choice for the socioeconomically
disadvantaged. Policy-makers may also make use of other equity considerations. There is
explicit evidence on disparities in responsiveness, particularly towards ethnic minority
populations. One of the best documented examples is the widespread discrimination against
Roma populations across Europe. Direct and indirect strategies on equity in responsiveness
will tend to improve access and so reduce health inequalities. These may be exacerbated if
strategies overlook the ability of different population groups to benefit from responsiveness
initiatives like choice.
All trade-offs need to be considered within the wider context and the part that responsiveness
can play in producing societal well-being. As always, context is hugely important. This is an
area in which culture plays a very significant part in shaping perceptions, making it
particularly difficult to extrapolate from one country or population group to another. Policy-
makers will need to adjust the priority they attach to responsiveness and the measures they
take to achieve it in order to reflect societal norms and expectations as well as the availability
of resources. However, it is not inevitable that resource constraints (and a commitment to
equity) lead to levelling down to the lowest common (responsiveness) denominator.
8.8 Conclusions
Eight years after the publication of the World Health Report 2000 it is undisputed that
responsiveness, i.e. the reaction of the health system and health service providers to act in
accordance with “the legitimate expectations of the population for their interaction with the
health system” is a value in and of itself and a dimension of health systems that is genuinely
valued by patients and citizens. It can involve significant extra expenditure, which begs the
question, how much extra are societies prepared to pay for responsiveness, and how much
will they pay for equity of responsiveness. However, many strategies that increase
responsiveness are also cost effective in health gain terms. For instance responsiveness leads
to better compliance with treatment which is especially significant for chronic disease
treatments. The role of health system stewards, therefore, must be to promote (as always)

26
good governance, transparency and accountability; to refine the use of existing resources to
enhance responsiveness; and to manage the trade-offs between goals when they arise.
Policy-makers need to be aware, that – while the importance of the concept “responsiveness”
is more or less undisputed – considerable methodological issues remain regarding its
measurement and interpretation. Policy makers thus might begin work to enhance
responsiveness simply by addressing some of the concerns above and taking steps to improve
the quality and comparability of assessments. Certainly, ensuring transparency in the
composition of indices and the attribution of weights; flagging up underlying values; and
promoting rigour in interpretation of results are all areas where health stewardship could (and
should) take a lead and which will support efforts to improve the way health services treat
citizens. Policy makers will need too to play their role in offering and interpreting
information on responsiveness, empowering populations to contribute to decision making
(including that on trade-offs); and in assessing the opportunity cost of investing in
responsiveness rather than other health goals.
References
1. World Health Organization (2000) The World Health Report 2000. Health systems: improving performance, Geneva: World Health Organization.
2. Saltman RB, Busse R, Figueras J (eds.) (2004) Social health insurance systems in western Europe. Buckingham: Open University Press.
3. Coulter, A. and Cleary, P.D. (2001) Patients‘ experiences with hospital care in five countries. Health Affairs, 20(3): 43-53.
4. Jenkinson C, Coulter A, Bruster S. (2002) The Picker Patient Experience Questionnaire: development and validation using data from in-patient surveys in five countries. International Journal for Quality in Health Care 14: 353–358.
5. Grol, R., Wensing, M, Mainz, J. et al. (2000) Patients in Europe evaluate general practice care: an international comparison, British Journal of General Practice, 50: 882-887.
6. Blendon, R., Leitman, R., Morrison, I., Donelan, K. (1990) Satisfaction with Health Systems in Ten Nations. Health Affairs 9(2): 185-192.
7. European Commission (1996) Eurobarometer 44.3. Brussels: European Commission. 8. European Commission (1998) Eurobarometer 49. Brussels: European Commission. 9. European Commission. (1999) Eurobarometer 50.1. Brussels: European Commission. 10. European Commission. (2000) Eurobarometer 52.1. Brussels: European Commission. 11. European Commission. (2002) Eurobarometer 57.2. Brussels: European Commission. 12. Health Consumer Powerhouse. Euro Health Consumer Index 2007. EHCI 2007 report. Health
Consumer Powerhouse AB, 2007. 13. Üstün TB, Chatterji S., Villanueva M., Bendib L., Çelik C., Sadana R., Valentine N., Ortiz J.,
Tandon A., Salomon J., Cao Y., Jun XW., Özaltin E., Mathers C., Murray CJL., (2001), “WHO Multi-country Survey Study on Health and Responsiveness 2000-2001”, GPE
Discussion Paper 37. 14. De Silva A. 2000. A framework for measuring responsiveness. (Discussion Paper 32)
Available at http:// www.who.int/responsiveness/papers/en. Accessed on 11 February 2008.
27
15. Üstün TB, Chatterji, S., Mechbal, A., Murray, CJL., WHS Collaborating Groups (2003). The World Health Surveys. In: Murray CJL., Evans, DB. Eds. Health systems performance
assessment: debates, methods and empiricism. Geneva, World Health Organisation, 797-808. 16. Valentine NB et al. (2003). Health system responsiveness: concepts, domains and
operationalization. In: Murray CJL, Evans DB, eds. Health systems performance assessment: debates, methods and empiricism. Geneva, World Health Organization, 2003.
17. Valentine NB et al. (2008). Responsiveness. In: Smith PC, Mossialos E, Leatherman S, Papanicolas I (eds.). Performance measurement for health system improvement: experiences,
challenges and prospects. Cambridge, Cambridge University Press, in press. 18. Pescosolido, B.A., Boyer CA and Tsui WY (1985). Medical Care in the Welfare State: A
Cross-National Study of Public Evaluations. Journal of Health and Social Behavior 26:276-97
19. Blendon, R., Donelan, K., Jovell, A., Pellise, L., Costas Lombardia, E. (1991) Spain’s Citizens Assess Their Health Care System. Health Affairs 10(3): 216-228.
20. Taylor, H. (2004) In the 5 largest European countries, French health care system most popular at home and most admired abroad. Health Care News 4(12).
21. Nys H, Goffin T (2008) Mapping National Practices and Strategies on Patient Rights. In: Wismar M, Palm W, Figueras J, Ernst K, van Ginneken E (eds.) Cross-Border Healthcare: Mapping and Analysing Health Systems Diversity. Brussels/ Copenhagen: European Observatory on Health Systems and Policies, in press.
22. den Exter, A.P. 2005. “Purchasers as the Public’s Agent.” In J. Figueras, E. Jakubowski and R. Robinson, eds., Purchasing to Improve Health Systems Performance. Maidenhead: Open University Press.
23. Hurst J, Siciliani L (2003) Tackling Excessive Waiting Times for Elective Surgery: A Comparison of Policies in Twelve OECD Countries. OECD HEALTH WORKING PAPERS No. 6. Paris: OECD.
24. Hirschman, A. 1970. Exit, Voice and Loyalty. Cambridge, MA: Harvard University Press. 25. Busse R (2001). Risk Structure compensation in Germany’s statutory health insurance.
European journal of public health 11(2):174-177. 26. Busse R and van Ginneken E (2008) Access to Healthcare Services Within and Between
Countries of the European Union. In: Wismar M, Palm W, Figueras J, Ernst K, van Ginneken E (eds.) Cross-Border Healthcare: Mapping and Analysing Health Systems Diversity. Brussels/ Copenhagen: European Observatory on Health Systems and Policies, in press.
Related Documents