206 Chapter-7 Essential Commodities Regulation & Industries Promotion 7.1 Purpose of the IDR Act 207 7.2 Exemption from Industrial Licensing 208 7.3 Industrial deregulation. 212 7.4 Industrial Policy Prior to 1991 217 7.4.1 Industrial Policy Prior to 1991 231 7.4.2 Review of Pre-1991 Industrial Policy and Liberalisation Trends 236 7.4.3 New Industrial Policy-1991 244 7.5 Evaluation of some Major Industries India 254 7.5.1 Sugar Industry 254 7.5.2 Textile Industry 258 7.5.3 Jute Industry 264 7.5.4 Cement Industry 267 7.5.5 Steel Industry 274 7.5.6 Oil and Gas Industry 283 7.5.7 Aviation Industry 297 7.5.8 Telecommunication Industry 312

Welcome message from author
This document is posted to help you gain knowledge. Please leave a comment to let me know what you think about it! Share it to your friends and learn new things together.
Transcript
206
Chapter-7
Essential Commodities Regulation & Industries Promotion
7.1 Purpose of the IDR Act 207
7.2 Exemption from Industrial Licensing 208
7.3 Industrial deregulation. 212
7.4 Industrial Policy Prior to 1991 217
7.4.1 Industrial Policy Prior to 1991 231
7.4.2 Review of Pre-1991 Industrial Policy
and Liberalisation Trends 236
7.4.3 New Industrial Policy-1991 244
7.5 Evaluation of some Major Industries India 254
7.5.1 Sugar Industry 254
7.5.2 Textile Industry 258
7.5.3 Jute Industry 264
7.5.4 Cement Industry 267
7.5.5 Steel Industry 274
7.5.6 Oil and Gas Industry 283
7.5.7 Aviation Industry 297
7.5.8 Telecommunication Industry 312
207
7.1 Essential Commodities Regulation19
It is responsibility of any Government to ensure equitable supply of
essential commodities to people at reasonable prices. Need for such contract
is necessary in cases of inadequate supply Need for such control is
necessary in cases of inadequate supply and luck of competition. India started
facing severe shortages of many commodities particularly before and during
2nd World War. Government of India, therefore, made certain rules to India
Act, in 1939. This provision continued upto 1946, when Essential Supplies
(Temporary Powers) Act, 1946 was passed. This Act continued upto
26.1.1955. Since shortages continued, it was felt that a permanent measure
for control of Essential Commodities is necessary. Constitution was amended
in 1954 by adding entry No.33 to list 3 of the 7th Schedule to the Constitution.
After this, Essential Commodities Act, 1955 (ECA) was passed, which came
into force on 1.4.1955. The Act has been amended from time to time. Under
Essential commodities Act, Government has power to control production,
supply and distribution of and trade and commerce in certain commodities.
Essential Commodities (Special provisions) Act, 1981 was passed which
contains provisions of special court to try the offences. These Special
provisions have been extended by an ordinance but have now lapsed.
Controls beyond limit are counter – productive :
Government has realized that controls over prices and distribution do
not help in the long run. Most glaring example is that of cement. Severe
distribution and price control was established on cement. The result was that
in view of an-remunerative prices, new units were not being set-up and
existing cement manufacturing units were not taking steps to expand,
renovate or replace old machinery. The result was that shortage of cement
persisted and increased. Government introduced partial decontrol over
cement in February 1982 cement was fully decontrolled on March 1989. After
removal of controls, production of cement picked up and now availability of
19
Taxmans Economics Laws 2003
208
cement is adequate and in fact, customer can choose brand and quality they
require.
Severe price control on bulk drugs is leading to a situation where drug
manufacturers are not investing in basic research as they are unable to
generate enough surplus. This in long range will affect supply and quality.20
7.2 Essential Commodities Act, 1955
The Essential Commodities Act, 1955 was enacted to ensure the easy
availability of essential commodities to consumers and to protect them from
exploitation by unscrupulous traders. The Act provides for the regulation and
control of production, distribution and pricing of commodities which are
declared as essential for maintaining or increasing supplies or for securing
their equitable distribution and availability at fair prices. Exercising powers
under the Act, various Ministries/Departments of the Central Government and
under the delegated powers, the State Governments/UT Administrations have
issued orders for regulating production, distribution, pricing and other aspects
of trading in respect of the commodities declared as essential. The
enforcement/ implementation of the provisions of the Essential Commodities
Act, 1955 lies with the State Governments and UT Administrations.
As per the decisions of the Conference of Chief Ministers held on 21
May 2001, a Group of Ministers and Chief Ministers had been constituted
which recommended that the regulatory mechanism under the Essential
Commodities Act, 1955 should be phased out. Accordingly, the restrictions
like licensing requirement, stock limits and movement restrictions have been
removed from almost all agricultural commodities. Wheat, pulses and edible
oils, edible oilseeds and rice being exceptions, where States have been
permitted to impose some temporary restrictions in order to contain price
increase of these commodities.
20 Taxmann‘s Students guide to economic laws 1999 – Essential Commodities Act, 1955.
209
The list of essential commodities has been reviewed from time to time
with reference to the production and supply of these commodities and in the
light of economic liberalisation in consultation with the concerned
Ministries/Departments administering these commodities. The Central
Government is consistently following the policy of removing all unnecessary
restrictions on movement of goods across the State boundaries as part of the
process of globalisation simultaneously with the pruning of the list of essential
commodities under the said Act to promote consumer interest and free trade.
The number of essential commodities which stood at 70 in the year 1989 has
been brought down to 7 at present through such periodic reviews.
In conformity with the policy of the Government towards economic
liberalisation, Department of Consumer Affairs is committed to the
development of agriculture and trade by removing unnecessary controls and
restrictions to achieve a single Indian Common Market across the country for
both manufactured and agricultural produce and to encourage linkage
between agriculture and industry. With this object in view, this Department
introduced the Essential Commodities (Amendment) Bill, 2005 in the
Parliament in the winter session of 2005 to enable the Central Government to
prune the list of essential commodities to the minimum by deleting all such
commodities which have no relevance in the context of present improved
demand and supply position and to facilitate free trade and commerce. Only
those commodities considered essential to protect the interest of the farmers
and the large section of the people "below the poverty line" are proposed to
be retained under the Essential Commodities Act, 1955.
The Prevention of Black-marketing and Maintenance of Supplies of
Essential Commodities Act, 1980 is being implemented by the State
Governments/UT Administrations for the prevention of unethical trade
practices like hoarding and black-marketing. The Act empowers the Central
and State Governments to detain persons whose activities are found to be
prejudicial to the maintenance of supplies of commodities essential to the
community. Detentions are made by the States/UTs in selective cases to
prevent hoarding and black-marketing of the essential commodities. As per
210
reports received from the State Governments, 119 detention orders were
issued under the Act during the year 2007. The Central Government and the
State Governments also have the power to modify or revoke the detention
orders. The representations made by or on behalf of the persons ordered for
detention are considered and decided by the Central Government.
In the context of unprecedented rise in prices of some essential
commodities in the mid 2006, there had been wide spread concern from
various corners for taking immediate steps to mitigate the rising trend of
prices of essential commodities. Representations from the Chief Ministers of
Punjab and Delhi and also from the Governments of Andhra Pradesh,
Rajasthan and Maharashtra were received for restoration of powers under the
Essential Commodities Act, 1955 for undertaking dehoarding operations in
view of the assumption that there is speculative holding back of stocks
particularly of wheat and pulses in anticipation of further rise in prices. Central
Government has already taken a number of steps to control the price rise in
essential commodities by trying to augment supply including through imports
by reducing the duty level on import of both wheat and pulses to zero.
The situation was further reviewed by the Government and it was
decided with the approval of the Cabinet to keep in abeyance some provisions
in the Central Order dated 15.2.2002 for a period of six months with respect to
wheat and pulses (whole and split), so as to tackle the crises on availability
and prices of these commodities. Accordingly, the Government order No.1373
(E) dated 29.8.2006 by virtue of which the words or expressions made in
respect of purchase, movement, sale, supply, distribution or storage for sale
in the "Removal of (Licensing requirements, Stock limits and Movement
Restrictions) on Specified Foodstuffs Order, 2002" notified on 15.02.2002
have been kept in abeyance for commodities namely wheat and pulses for a
period of six months. The transport, distribution or disposal of wheat and
pulses (whole or split) to places outside the State as well as import of these
commodities have been kept outside the purview of the aforesaid Order of
29.08.2006. The Order of 29.08.2006 was initially in force for a period of 6
months, which was extended thrice for a period of 6 months each by Central

211
Notifications dated 27.02.2007, 31.8.2007 and 28.02.2006. The Order
permitted State/UT Governments to fix stock limits in respect of wheat and
pulses.
To enable the State Governments/UT Administrations to continue to
take effective action for undertaking de-hoarding operations under the
Essential Commodities Act, 1955, the price situation was further reviewed by
the Government and its has been decided with the approval of the Cabinet to
further impose similar restrictions by keeping in abeyance some provisions of
the Central Order dated 15.02.2002 for a period of one year with respect to
edible oils, oilseeds and rice, so as to tackle the rising trend of prices as well
as to ensure availability of these commodities to the common people.
However, it has also been decided that there shall not be any restriction on
the inter-state movement of these items and that imports of these items would
also be kept out of the purview of any controls by the State Governments.
(a) What is essential commodity – see 2(a) of Essential
Commodities Act, 1955 states that ―Essential Commodity means any of the
following classes of commodities.
i. Cattle fodder including oil cakes and other concentrates.
ii. Coal including coke and other derivatives.
iii. Component parts and accessories of automobiles (Omitted)
iv. Cotton and Woolen textiles.
v. Drugs (As defined in Drugs and Cosmetics Act.
vi. Foodstuffs, including edible oil-seeds and oil.
vii. Iron and steel, including manufactured products of iron and
steel.
viii. Paper, including newsprint, paperboard and straw board.
ix. raw cotton, whether ginned or unginned, and cotton seed.
x. raw jute.
xi. any other class of commodity which the control Government
may be notified order, declare to be an essential commodity for
the purpose of this Act, being a commodity with respect to which

212
Parliament has power to make laws by virtue of entry 33 in list –
III in the seventh schedule of the constitution.
(b) ―Food Crops‖ include crops of Sugarcane
(c) ―Sugar‖ Means :
i. any form of sugar certaining more than ninety per cent of
sucrose, including sugar candy.
ii. Khandsari Sugar or bura Sugar or crushed sugar or any sugar in
crystalline or powdered from; or
iii. Sugar in process in vaccum pan sugar factory or raw sugar
produced thereon.
7.3 Govt removes 12 items from Essential Commodities list;
decontrols sugar
The government on Tuesday gave permission to the removal of 12
items from the purview of Essential Commodities Act 1955 in order to lift
controls pertaining to their processing, movement, storage and marketing.
Of the 29 items at present governed by the ECA, 12 will be removed
from its purview and a notification to this effect will be issued shortly, an
official spokesperson said in New Delhi after the meeting of the Union
Cabinet.
The 12 items include textile machinery, textiles made from silk, textiles
made wholly or in part from man-made cellulosic and non-cellulosic filament
yarn.
Other items to be removed are man-made cellulosic and non cellulosic
staple fibers and yarn made from four materials namely wool, man made
cellulosic spun and non-spun fiber and silk.
However, food stuffs, cotton and woolen textiles, raw cotton, either
ginned or unginned and cotton seed, raw jute, jute textiles and yarn wholly
made from cotton will continue to be in the list of the essential commodities.
213
The government by a notified order can declare any commodity as
'essential' for the purpose of ECA 1955. Section 3 of the Act empowers the
government to control production, supply, distribution, trade and commerce of
such commodities.
This gives controlling powers to the state for trading and marketing
these commodities in the country.
Under the Act government controls production and price, regulates
storage, transport, distribution, disposal and consumption of the commodities.
Government approves full decontrol of sugar
The government also cleared giving full effect to decontrol of sugar
during the coming financial year beginning April 1, 2002.
Stating this after a meeting of the Union Cabinet, an official
spokesperson said the sugar decontrol would be effected after futures trading
in the commodity becomes operational.
Sugar at present is a controlled commodity on account of which 15 per
cent of the release in the market is channeled through the Public Distribution
System.
In the event of the full decontrol, to be effected in the next fiscal, millers
will be able to unload the entire quantity in the open market.
There is a three monthly release mechanism under which each factory
is allotted a quantum it can unload in the market and the aggregate
nationwide quota is also fixed. This will, however, stay even after full
decontrol.
In the previous Union Budget, Finance Minister Yashwant Sinha had
described the full sugar decontrol process as irreversible and linked it with the
futures trading in the commodity.
The two are intertwined as full decontrol ensures greater volumes for
futures trading and better chances of price discovery.
214
The government has given in-principle clearance to three companies
for sugar futures, E-Commodities Ltd and E-Sugar India of Bombay and
Hyderabad-based NCS InfoTech who have 10 months to put the process in
place from December 2001.
As part of the phased decontrol, government has also switched over to
three monthly release mechanism, however, mills can only sell one half of
their quota in the first 45 days of a quarter to avoid any crash in prices.
Curbs on movement of grains to go
The Cabinet also decided to remove the requirement of licensing of
dealers as also restrictions on storage and movement of wheat, paddy and
rice, coarse grains, sugar, edible oilseeds and edible oil.
A central order would be issued under Section 3 of the Essential
Commodities Act (ECA), 1955 removing the requirement of licensing and
restrictions on storage and movement of these commodities, an official
spokesperson told reporters.
In view of the relatively more comfortable food situation, it was felt that
restrictions like licensing of dealers, limits on stock and control on movement
are no longer needed, she said.
The government felt restrictions only hampered the growth of the
agricultural sector and promotion of food processing industries in rapidly
changing economic scenario and liberalisation.
Facilitating free trade and movement of foodgrains would enable
farmers to get best prices for their produce, achieve price stability and ensure
availability of foodgrains in deficit areas, the spokesperson said.
Removal of hurdles would also be in the interest of the consumers all
over the country, specially for those in the lower income group, she said.
The Essential Commodities Act, 1955 provides for the control of the
production, supply and distribution of essential commodities.
215
Powers to issue control orders under the Act have been delegated by
the Centre to the state governments.
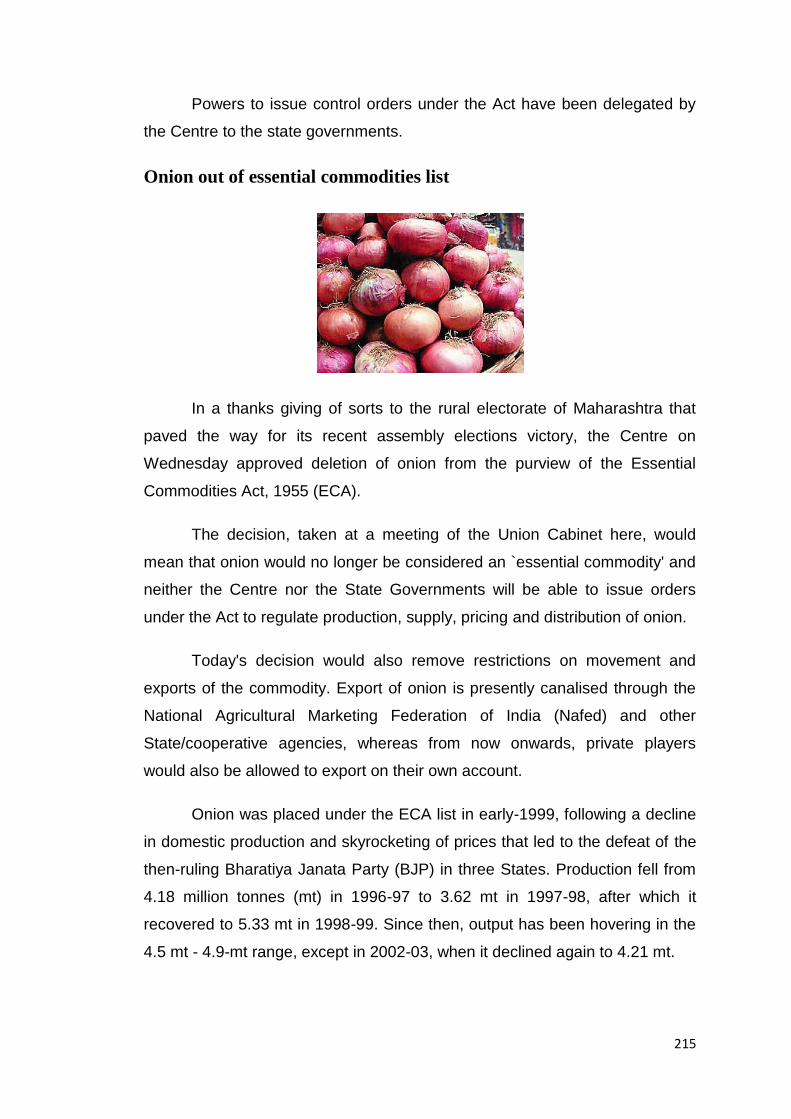
Onion out of essential commodities list
In a thanks giving of sorts to the rural electorate of Maharashtra that
paved the way for its recent assembly elections victory, the Centre on
Wednesday approved deletion of onion from the purview of the Essential
Commodities Act, 1955 (ECA).
The decision, taken at a meeting of the Union Cabinet here, would
mean that onion would no longer be considered an `essential commodity' and
neither the Centre nor the State Governments will be able to issue orders
under the Act to regulate production, supply, pricing and distribution of onion.
Today's decision would also remove restrictions on movement and
exports of the commodity. Export of onion is presently canalised through the
National Agricultural Marketing Federation of India (Nafed) and other
State/cooperative agencies, whereas from now onwards, private players
would also be allowed to export on their own account.
Onion was placed under the ECA list in early-1999, following a decline
in domestic production and skyrocketing of prices that led to the defeat of the
then-ruling Bharatiya Janata Party (BJP) in three States. Production fell from
4.18 million tonnes (mt) in 1996-97 to 3.62 mt in 1997-98, after which it
recovered to 5.33 mt in 1998-99. Since then, output has been hovering in the
4.5 mt - 4.9-mt range, except in 2002-03, when it declined again to 4.21 mt.
216
But the 2003-04 crop has been a bumper one of well over 5 mt, leading
to a glut and piling up of huge stocks, particularly in Maharashtra, which
accounts a third of the country's total onion production. "The production and
availability of onion during the last five years has, by and large, been
satisfactory. The price trend of onion has also not shown any abnormality
during this period. The removal of unnecessary restrictions and relaxation of
controls on onion will give fair returns to growers, promote consumer interest
and free trade," an official release said.
The release added that onion being a perishable commodity, storage
problems coupled with controls/interventions had led to distress sales by
farmers at very low prices, causing them economic hardship. Moreover, no
Control Order has been issued for regulating production, distribution of onion
since 1999.
Following onion's deletion, the ECA's purview is now limited to 15
items, which includes foodstuffs (including edible oilseeds and oil), petroleum
products, drugs, fertilisers, cotton (including yarn and textiles), raw jute
(including textiles), iron & steel, coal, fertilisers and cattle fodder.

217
7.4 Industry Promotion
Industry
Industries (Development and Regulation) Act, 1951 (IDRA) was passed
in early stages after independence. India and ideal of socialistic model for
development and growth. ―Planned Economy‖ was the goal. It was envisaged
to introduce licensing for proper industrial growth. Many industries were
nationalized upto 1984.
However, it was observed later that policy of compulsory industrial
licensing was stifling industrial growth instead of promoting it. Many industries
taken over by Government (now called Public Sector Undertakings) continue
to be sick and are causing a great drain on our economy. It was expected that
public sector undertakings (PSU) will command the heights and will lead the
industrial growth. Unfortunately, banning a few undertakings, other have
became models of inefficiency poor productivity and corruption. Realising this
government has not taken over any unit almost for 25 years. New Industrial
Policy (NIP) announced in July 1991 has made radical departure from earlier
policies. Most of the industries (barring a few) are delliansed. The IDRA Act
has lost most of its relevance in the present situation.
Purpose of the IDR Act
Industry refers to the people or companies engaged in a particular kind
of commercial enterprise. It is described it as the manufacturing of a good or
218
service within a category. It is the secondary sector in economics, also
coming under the private sector.
Economies tend to follow a developmental progress that takes them
from a heavy reliance to agriculture and mining to manufacturing industry, and
then move on to a more service based economy.
1. Primary sector: mainly includes raw material extraction industries such as
mining and farming. It is mainly the conversion of natural resources into
primary products that are used as raw material by other industries. The
manufacturing industries that aggregate, package, purify or process the raw
material near the primary producers are normally considered part of this
sector, especially if the raw material is unsuitable for use in its original form, or
if it is difficult to transport it to long distances. Developing countries are more
dependent on this sector. In developed the same sector becomes more
mechanized and high-tech, requiring smaller manpower. Hence, while
developing countries have a major part of the workforce involved in this
industry, the developed countries have a higher percentage involved in
secondary and tertiary sectors as compared to the primary sector.
2. Secondary sector: involves refining, construction, and manufacturing. This
sector creates a finished and useable product. The sector is divided into light
and heavy industry. The sector consumes large amount of energy and needs
factories and often heavy machinery to convert raw material into a finished
product. These also produce large amount of waste product in the process,
often environmentally hazardous. However, manufacturing is an important
part of economic growth and development. It increases export possibilities,
thus improving GDP of the country. This ion turn funds infrastructure in the
economy and health facilities, among other life initiatives. This sector is more
open to international trade and competition than service.
3. Tertiary sector: deals with services (such as law and medicine) and
distribution of manufactured goods. When contrasted to the wealth producing
sectors like secondary and primary sectors, tertiary sector is a wealth
consuming sector. When the wealth consuming and wealth producing sectors

219
are balanced, the economy grows, but if the tertiary sector grows bigger than
the first two, the economy declines. Service sector, as it is called, offers
services or 'intangible goods'. The services are provided to businesses and
final consumers. It may involve distribution or transport and sales of goods
from producer to consumer. This sector also includes the soft parts of the
economy such as the insurance, tourism, banking, education, retail. Typically,
the output is in the form of content (info), advice, service, attention experience
or discussion. Service economy refers to a model where as much economic
activity as possible is treated as service.
4. Quaternary sector: knowledge industry focusing on technological
research, design and development such as computer programming, and
biochemistry. It is a comparatively new division. It is an extension of the three-
sector hypothesis of industrial evolution. It principally concerns the intellectual
services: information generation, information sharing, consultation, education
and research and development. It is sometimes incorporated into the tertiary
sector but many argue that intellectual services are distinct enough to warrant
a separate sector. Entertainment is also an important part of this sector.
The purpose of the IDR Act was to implement the industrial policy. It
provides for The development and regulation of major industries IDR Act
envisages balanced industrial growth all over India and optimum use of
available resources and infrastructure. IDR Act also sees that the industries
do not suffer due to financial mismanagement or technical inefficiency or
operational defects. In certain cases Act provides for investigation by Union
Government in cases of mismanagement and misadministration.
220
Industrialization: A New Era
Though agriculture has been the main preoccupation of the bulk of the
Indian population, the founding fathers saw India becoming a prosperous and
Modern State with a good industrial base. Programs were formulated to build
an adequate infrastructure for rapid industrialization.
Since independence, India has achieved a good measure of self-
sufficiency in manufacturing a variety of basic and capital goods. The output
of the major industries includes aircraft, ships, cars, locomotives, heavy
electrical machinery, construction equipment, power generation and
transmission equipment, chemicals, precision instruments, communication
equipment and computers. Early planners in free India had to keep in mind
two aims: all-round development and generation of large-scale job
opportunities. Economic development strategies were evolved with an eye on
these twin objectives.
New International Economic Order
As a responsible and progressive member of the international
community, India is continuing her untiring efforts to bring about a constructive
dialogue between the developed and developing countries in their quest for a
cooperative approach towards a new International Economic Order. India is
convinced that the establishment of an equitable International Economic
Order involving structural and other, change is the only answer to the various
economic ills and problems of development confronting the world today.

221
Economic Restructuring
The international confidence in India's economy has been fully
restored.
The reforms launched have made India an attractive place for
investment. Duties have been lowered, repatriation of profit made liberal and
levels of foreign equity raised considerably, and 100% in case of export
oriented industry.
While several multinational companies have entered the Indian market,
some Indian companies have also begun to gain international recognition. In
the field of computer software, India is among the major exporting nations with
an overflow of scientists in the field.
With the conclusion of the Uruguay Round of Multilateral Trade
Negotiations, India decided to join the new World Trade Organization,
successor to GATT. India hopes that developing countries will not suffer on
account of any protectionism.
On its part, India has opened several sectors hitherto restricted to the
public sector. The rupee is convertible on the trade account. In 1994, exports
grew by 17%. Figures for 1995-96 show that exports grew at a rate of 28.8%.
About 90% of India's import are financed by export earnings. The Non-
Resident Indian (NRI) enjoys special incentives to invest in India like tax
exemption and higher interest rates on deposits.
NRIs
The government acknowledges the great role that the vast number of
Indians living and working abroad, the Non-Resident Indians can play in
accelerating the pace of development in the country. In the 1980s, the NRIs
contribution through their remittances was instrumental to a large extent in
stabilizing the balance of payment situation. Several initiatives have been
taken to attract NRI investments - in industry, shares and debentures. The
NRIs are allowed 100% investment in 34 priority and infrastructure facilities on

222
non-repatriation basis. Approval is given automatically on investment in
certain technical collaborations. They can buy Indian Development Bonds and
acquire or transfer any property in India without waiting for government
approval. The Foreign Exchange Regulation Act has been amended to permit
NRIs to deal in foreign currency and they can also bring in five kg of gold.
There are programs to utilize the scientific and technical talents of the NRIs
with the help of the Council of Scientific and Industrial Research.
Infrastructure
In view of their crucial importance, power, transport and other
infrastructure industries are owned by the State. As a result of special
attention given to the area in recent years, the infrastructure industries have
been growing at the rate of 9 to 10 per cent annually.
Power: The generation of power has increased impressively in recent
years. In 1990-51, India generated 6.6 billion-kilowatt hour of electricity, in
1995-96 the figure was 380.1 billion-kilowatt hour. The installed capacity,
which was 1400 MW at Independence in 1947, has crossed 83,288 MW The
policy of inviting private sector has been well received; about 140 offers that
can generate over 60,000 MW of power have came in.
Coal: Coal is the primary source for power generation in India. The
country has huge reserves of coal approximately 197 billion tons. A sufficient
amount of lignite (brown coal used in thermal power stations) is also available.
India produced about 270 million tons of coal in 1995-96. The government
now welcomes private investment in the coal sector, allowing companies to
operate captive mines.
Petroleum and Natural Gas: The recent exploration and production
activities in the country have led to a dramatic increase in the output of oil.
The country currently produces 35 million tons of crude oil, two thirds of which
is from offshore areas, and imports another 27 million tons. Refinery
production in terms of crude throughput of the existing refineries is about 54
million tons.

223
Natural gas production has also increased substantially in recent years,
with the country producing over 22,000 million cubic meters. Natural gas is
rapidly becoming an important source of energy and feedstock for major
industries. By the end of the Eighth Five-Year Plan, production was likely to
reach 30 billion cubic meters.
Railways: With a total route length of 63,000 Kin and a fleet of 7000
passenger and 4000 goods trains, the Indian Railways is the second largest
network in the world. It carries more than 4000 million passengers per year
and transports over 382 million tons of freight every year. It is well equipped to
meet its demands for locomotives, coaches and other components.
Lately, the Railways have launched a massive gauge conversion drive
as about a third of the track is meter or narrow gauge. With improvement in
tracks, plans are afoot to introduce faster trains. Very soon, certain prestigious
long distance trains will be running at 160 Kin per hour.
The Railways have also started a scheme to privatize several services
that will include maintenance of railway stations, meals, drinking water and
cleaning of trains.
Road Transport : The roadways have grown rapidly in independent
India. Ranging from the cross-country link of the national highways to the
roads in the deepest interiors, the country has a road network of
2.1 million-km. India also manufactures most of its motorized vehicles -cars,
jeeps, trucks, vans, buses and a wide range of two-wheelers of various
capacities. While Indian scooters have established a good foreign market, the
car industry is also looking up with several foreign companies setting up
plants in India.
Shipping : The natural advantage of a vast coastline requires India to
use sea transport for the bulk of cargo transport. Following the policy of
liberalization, the Indian shipping industry, major ports, as also national
highways and water transport have been throw open to the private sector.
224
Shipping activity is buoyant and the number of ships registered under
the Indian flag has reached 471. The average age of the shipping fleet in India
is 13 years, compared to 17 years of the international shipping fleet. India is
also among the few countries that offer fair and free competition to all
shipping companies for obtaining cargo. There is no cargo reservation policy
in India.
Aviation : India has an aviation infrastructure, which caters to every
aspect of this industry. Hindustan Aeronautics Limited (HAL) is India's gigantic
aeronautical organization and one of the major aerospace complexes in the
world.
India's international carrier, Air India, is well known for its quality
service spanning the world. Within the country, five international airports and
more than 88 other airports are linked by Indian Airlines. Vayudoot, an
intermediate feeder airline, already links more than 80 stations with its fleet of
turboprop aircraft and it plans to build and expand its network to over 140
airports in the far-flung and remote areas of the country. Pawan Hans, a
helicopter service, provides services in difficult terrain.
The Government has adopted a liberal civil aviation policy with a view
to improving domestic services. Many private airlines are already operating in
the country.
Pipelines : Oil and natural gas pipelines form an important
transportation network in the country. The country completed recently, on
schedule, one of its most ambitious projects, the 1700 km Hazira-Bijaipu
Jagdishpur pipeline. Costing nearly Rs. 17 billion, the pipeline transports liquid
gas from the South Bassein offshore field off Mumbai to Jagdishpur and
Aonla, deep in the mainland in Uttar Pradesh. Besides, India has nearly 7,000
km of pipeline mainly for the transportation of crude oil and its products.
Telecommunications : With rapid advances in technology, India now
uses digital technology in telecommunications, which derives advantage from
its ability to interface with computers. The present strategy focuses on a
balanced growth of the network rapid modernization, a quantum jump in key
225
technologies, increased productivity, and innovation in organization and
management. Moving towards self-reliance, besides establishing indigenous
R&D in digital technology, India has established manufacturing capabilities in
both the Government and private sectors.
The private sector is expected to play a major role in the future growth
of telephone services in India after the opening of the economy. The recent
growth in telecommunications has also been impressive. Till September 1996,
the number of telephone connections had reached 126.1 lakh (12.6 million).
Soon every village panchayat will have a telephone. By 1997, cellular services
in most major urban areas were functional, and telephone connections were
available on demand. India is linked to most parts of the world by E-mail and
the Internet.
Key Industries
Steel : The iron and steel industry in India is over 122 years old.
However, a concerted effort to increase the steel output was made only in the
early years of planning. Three integrated steel plants were set up at Bhilai,
Durgapur and Rourkela. Later two more steel plants, at Bokaro and
Vishakhapatanam, were set up. Private sector plants, of which the Tata Iron
and Steel Company (TISCO) is the biggest, have been allowed to raise their
capacity. The Steel Authority of India (SAIL), which manages the public sector
plants, has undertaken a Rs. 40,500 crore program to modernize them.
During 1995,96, production of salable steel in the country was about 21.4
million tons. The five SAIL plants accounted for over half of this: The export of
iron and steel jumped from 9.10 lakh tons in 1992-93 (valued at Rs.'708 crore)
to over 20 lakh tons (Rs. 1940 crore).
TISCO and a large number of mini steel plants in the country contribute
about 40% of the steel production in the country. The Government has given
a push to sponge iron plants to meet the secondary sector's requirement of
steel scrap.
226
Engineering and Machine Tools : Among the Third World countries,
India is a major exporter of heavy and light engineering goods, producing a
wide range of items. The bulk of capital goods required for power projects,
fertilizer, cement, steel and petrochemical plants and mining equipment are
made in India. The country also makes construction machinery, equipment for
irrigation projects, diesel engines, tractors, transport vehicles, cotton textile
and sugar mill machinery. The engineering industry has shown its capacity to
manufacture large-size plants and equipment for various sectors like power,
fertilizer and cement. Lately, air pollution control equipment is also being
made in the country. The heavy electrical industry meets the entire domestic
demand.
Electronics : The electronics industry in India has made rapid strides
in recent years. The country produces electronics items worth over Rs. 200
billion annually. Exports are also rising; in 1995-96 they reached Rs. 4.5
billion. The software export during the same year reached Rs 2.5 billion.
Compared to 1994-95, the software export growth in 1995-96 rose by an
impressive 70%. The Software Technology Park scheme for attracting
investments has proved successful. The relative low cost of production in
India makes items made in India competitive in the world market.
Some of the major items manufactured in India are computers,
communication equipment, broadcasting and strategic electronics, television
sets, microwave ovens and washing machines.
The compound growth of the computer industry has been 50% during
the last five years. Almost the entire demand for floppy disk drives, dot matrix
printers, CRT terminals, keyboards, line printers and plotters is met from
indigenous production. With the availability of trained technical manpower,
computers have been identified as a major thrust area. Special emphasis has
been given to software export.
The Indian software industry has developed skill and expertise in areas
like design and implementation of management information and decision

227
support systems, banking, insurance and financial applications, artificial
intelligence and fifth generation systems.
Recognition for the Indian computer software industry has been global.
Indian software enterprises have completed projects for reputed international
organizations in 43 countries.
Textiles : Textiles, the largest industry in the country employing about
20 million people, account for one third of India's total exports. During 1995-
96, textile exports were estimated at Rs. 35,504.6 crore which was 13.3%
more than the 1994-95 figure. In recent years, several controls have been
removed and in October 1996, a new long-term Quota policy was announced
to boost exports over the next three years, till 1999. Per person production of
cloth is 20 meters after adopting liberalisation as a part of economy.
Public Sector : The public sector contributed to the initial development
of infrastructure and diversification of industrial base. It is now being exposed
to competition. Part equity of some units is being disinvested. But many core
and strategic areas, important for economy and self-reliance, will remain in
the public sector.
Research and Development
Research and Development activities are supported by the
governments at the Center and the states as well as by public and private
sector undertakings. The Department of Scientific and Industrial Research
recognizes over 1200 in-house R & D units. About 200 research laboratories
exist in government departments and agencies. The benefits of the R & D
works are reaching various fields like industry, agriculture and commerce.
Planning for Development
The Planning Commission headed by the Prime Minister, draws up
five-year plans under the guidance of the National Development Council to
ensure growth, self-reliance, modernization and social justice. Its role has
been redefined in the eighth plan document: from a centralized planning
228
system, India is moving towards indicative planning which will outline the
priorities and encourage a higher growth rate. The Rs. 4,000 billion eighth
plan envisaged a growth rate of 5.6%.
Traditional Industry
Indian handicrafts have withstood competition from machines over the
years. The skills are passed on from one generation to the next. The
handicraft and handloom sector is a major source of rural employment and
earns substantial foreign exchange. Traditional textiles are as popular abroad
as they are within the country. The major export items include hand-knotted
carpets, art metalware, hand-printed textiles and leather, wood and cane
wares.
Exemption from Industrial Licensing
See 29B(i) authorises Union Government to exempt any industry or
class of industries from any of provisions of the Act. Presently, Union
Government has exempted most of the industries from the provisions of
licensing. There are only few industries (like paper, drugs and
pharmaceuticals, etc.) which require licence. Licence is not required for other
industry. Five industries (arms and ammunition) atomic energy, mineral oils,
minerals for atomic energy and railway transport) are reserved for public
sector. No licence is required for any other industry. However, the conditions
are (a) prescribed locational restrictions are explained below should be
observed (b) the product should not be reserved for small scale sector.
Information by de-licensed Industries
Industries which are exempt from licensing provisions or registration
procedure, have to only submit information in prescribed form – called
―Industrial Entrepreneurs Memorandum. (From IEM).
Regulating Supply and Prices : Union Government can provide for
regulating supply and distribution any industrial article by issuing a notified
order sec 189 (1) of IDRA. Such order can before (a) price control (b)

229
regulating distribution, transport, possession, use or consumption (c)
prohibiting the with holding from sale of any article (d) requiring a person to
sell industrial product to a particular class of persons. The sale can be at
controlled price or mutually agreed price, at price prevalent in market (e)
regulating or prohibiting, any class of commercial or financial transactions
respect of the industrial product. (f) requiring that product should be marked
with price, display, stock and display prices (g) collecting information or
statistics for regulating above matters. (h) incidental or supplementary matters
in respect of above like licences, permits, records etc.
De-licensing of many industries – New Industrial Policy envisages that
some industries will be reserved exclusively for public sector. Excluding these
industries, no industry will require licence, subject to certain conditions.
Items Reserve Exclusively for Public Sector
Annexure-I of policy statement gives list of 5 industries reserved for
public sector. These are: Arms and Ammunition and allied defence
equipment. Atomic Energy, Mineral. Oils, Minerals and Railway Transport. As
per National Mineral Policy, 1993, minerals and minerals bearing areas have
been de-reserved in respect of 13 minerals namely iron are manganese ore.
chrome ore, gypsum, sulphur, gold, diamond, copper, lead, zinc, tin,
molybdenum and wolfram. Out of ‗mineral oils‘, petroleum (other than crude)
and its distillation products are no more reserved for public sector.
Products Requiring Licensing
Annexure – II contains list of 6 industries for which industrial licensing
is compulsory – after deletion of items upto 14.07.1997. These are alcoholic
drinks, cigars and cigarettes, electronic aerospace and defence equipment
industrial explosives, hazardous chemicals and drugs and pharmaceuticals as
announced in Drugs Policy – Original list contained 18 limits – white goods,
motor cars, paper and news print except biogases based units, plywood,
veneer and other wood based products, animals fats and oils, asbestos and
asbestos based products, tanned or dressed furskin and chamois leather and

230
plywood products appearing in that list have been subsequently removed.
Coal & Lignite and petroleum (other than crude) and its distillation products
have been removed from the list w.e.f. 8th June, 1998. Sugar has been
delicensed in August 1998. The only condition is that distance between 2
sugar mills should be minimum 15 kms.
Industrial Policy
After Independence, the Government of India spelt out its approach to
the development of the industrial sector in the Industrial Policy Resolution
1948. This was followed by the Industrial Policy Resolution, 1956. In between,
the government introduced the Industries (Development and Regulation) Act,
1951 to regulate and control the development of the private sector. In 1969,
MRTP Act (Monopolies and Restrictive Trade Practices Act) was adopted to
prevent concentration of economic power and control monopolies. Another
legislation that had considerable implications for industrial policy (as far as the
participation of foreign companies in industrial sector of India is concerned)
was the Foreign Exchange Regulation Act (FERA) adopted in 1973. However,
all these measurers which guided and determined the State intervention in the
field of industrial development failed in achieving the objectives laid down for
them. They also created a number of inefficiencies, distortions and rigidities in
the system. Therefore, the government started liberalizing the industrial policy
in 1970s and 1980s. The most drastic liberalisation was carried out in 1991
when a New Industrial Policy was announced.
We shall discuss the MRTP, Act in chapter 32 on ‗Private Sector in the
Indian Economy‘ and the FERA in chapter 40 on ‗Multinational Corporations,
FERA and FEMA.‘ Other constituents of industrial policy are discussed in this
chapter. The focus of discussion in this chapter, therefore is on:
Industrial Policy Resoultions of 1948 and 1956
Industries (Development and Regulation) Act, 1951
Critical review of pre-1991 industrial policy and liberalisation trends
New industrial Policy, 1991 and its critical appraisal.

231
7.4.1 Industrial Policy Prior to 199121
Industrial Policy Resolution, 1948
The first important industrial policy statement was made in the
Industrial Policy Resolution, 1948. The Resolution accepted the importance of
both private and public sectors in the industrial economy of India. It divided
the industries into the following four categories:
1. Industries where State had a monopoly. In this category, three
fields of activity were specified – arms and ammunition, atomic energy and rail
transport.
2. Mixed sector. In this category, the following 6 industries were
specified – coal, iron and steel, aircraft manufacture, ship building,
manufacture of telephone, telegraph and wireless apparatus (excluding radio
sets) and mineral oils. New undertakings in this category were to be set up by
the State but existing private undertakings were allowed to continue for 10
years after which the government was to review the situation and acquire any
existing undertaking after paying compensation on a fair and equitable basis.
3. The field of government control. 18 industries of national
importance were included in this category. The government did not undertake
the responsibility of developing these industries but considered them of such
importance that their regulation and direction was necessary. Some of the
industries included were – automobiles, heavy chemicals, heavy machinery,
machine tools, fertilizers, electrical engineering, sugar, paper, cement, cotton
and woolen textiles.
4. The field of private enterprise. All other industries (not included in
the above three categories) were left open to the private sector. However, the
State could take over any industry in this sector also if its progress was
unsatisfactory.
21
Misra & Puri, Indian Economy, 2010, Himalaya Publication. Pg.381
232
The 1948 Resolution also accepted the importance of small and
cottage industries as they are particularly suited for the utilization of local
resources and for creation of employment opportunities.
Industries (Development and Regulation) Act, 1951
To control and regulate the process of industrial development in the
country, an Act was passed by the Parliament in October 1951. Known as the
Industries (Development and Regulation) Act, 1951, the Act came into force
on May 8, 1952. Though it aimed at both, development and regulation of
private sector, its main task over the years has been to concentrate more on
the ‗regulation‘ aspect. The objectives that the Act sought to accomplish were
: (i) the regulation of industrial investment and production according to plan
priorities and targets; (ii) protection of small entrepreneurs against competition
from large industries; (iii) prevention of monopoly and concentration of
ownership of industries; and (iv) balanced regional development with a view to
reducing disparities in the levels of development of different regions of the
economy. It was hoped that through the instrument of industrial licensing, the
State would be able to (i) direct investment into the most important branches,
(ii) correlate supply and demand in the domestic market, (iii) eliminate
competition and (iv) ensure the optimum utilization of social capital.
1. Restrictive Provisions. Under this category come all measures
designed to curb unfair practices adopted by industries. These provisions
were as follows: (i) Registration and licensing of industrial undertakings –
Undertaking of all those industries which were included in the schedule of the
Industries (Development and Regulation) Act, 1951 were required to be
registered whether they come under the private sector or the public sector.
Even in the existing undertakings intended expanding the activities, they
required prior permission of the government; (ii) Enquiry of industries listed in
the schedule – The responsibility of the State does not end with the
registration or granting of licences to the undertakings. If the working of a
particular industrial unit was not satisfactory (say, for example, there was
substantial underutilization of capacity or product was not up to the mark or
cost of production and price were excessive), the government could set up an

233
enquiry into the affairs of the particular undertaking; and (iii) Cancellation of
registration and licence – If a particular industrial undertaking had succeeded
in obtaining industrial licence and registration by submitting wrong information
the government could cancel the registration under article 10(A) of the Act. In
the same way, the government could cancel the licence if the undertaking was
not set up within the stipulated period.
2. Reformative Provisions. In this category, following provisions were
considered: (i) Direct regulation or control by the government – If the
government felt that a particular industry was not being run satisfactorily, it
could issue directions for carrying out reforms. If these directions were not
heeded to, the government could take over the management and control of
that unit in its hands; (ii) Control on price, distribution, supply, etc. – The
government was empowered in the Act to regulate or control the supply,
distribution and price of the product manufactured by units belonging to the
industries listed in the schedule of the Act, if it so wished; and (iii)
Constructive measures – To inspire mutual confidence and elicit co-operation
from the workers, the government established Central Advisory Council and a
number of Development Councils for different products.
In the initial stages 37 industries (specified under the Act) were brought
under the purview of the Act which was later extended to include 70
industries. Of these specified industries only those units were brought under
the Act where the capital employed was Rs. 1 lakh or more. Since the net of
coverage was too small, it was decided to cover all units (irrespective of size)
under the Act in 1953 but the excessive administrative strain brought upon the
authorities as a consequence of this decision, compelled them to scrap this
decision in 1956. It was stated that henceforth the Act would be applicable
only to enterprises employing 50 or more workers if worked with the aid of
power or employing 100 or more workers if worked without the aid of power.
In 1960 another change was made and all enterprises with fixed capital of
Rs.10 lakh or less were exempted from the licensing procedure. The
exemption limit was raised to Rs.25 lakh in 1963 and (subject to certain
conditions) to Rs. 1 crore in 1970. The March 1978 industrial policy statement

234
liberalised the licensing policy further by raising the exemption limit from Rs.1
crore to Rs. 3 crore. It was later raised to Rs.5 crore. The government
announced a major package of industrial delicensing during the year 1988-89.
This package provided that henceforth, only projects involving an investment
in fixed assets of more than Rs.50 crore, if they are located in backward
areas, or more than Rs.15 crore if they are located in non-backward areas
would require industrial licences.
Industrial Policy Resolution, 1956
The 1956 Resolution laid down the following objectives for the
industrial policy : (i) to accelerate the rate of growth and to speed up
industrialization; (ii) to develop heavy industries and machine making
industries; (iii) to expand public sector; (iv) to reduce disparities in income and
wealth; (v) to build up a large and growing cooperative sector; and (vi) to
prevent monopolies and the concentration of wealth and income in the hands
of a small number of individuals.
These objectives, it was thought, would help in generating more
employment opportunities an in raising the standard of living of the masses.
For this purpose, stress was laid on cooperation between public and private
sectors but an increasing role was envisaged for the former so that, in due
course of time, it could gain ‗commanding heights‘ of the economy.
The 1956 Resolution divided the industries into the following three
categories:
1. Monopoly of the State. In this category, 17 industries were included
whose future development was to be the exclusive responsibility of the State.
These were listed in Schedule-A appended to the Resolution. Of the 17
industries, 4 industries – arms and ammunition, atomic energy, railway and air
transport – were to be government monopolies. In the remaining 13
industries, new units were to be established by the State but existing private
units were allowed to subsist and expand. New units in the private sector
could also be allowed ‗when the national interest so required.‘

235
2. Mixed sector of public and private enterprise. In this section 12
industries listed in Schedule B (appended to the Resolution) were included.
These were: all other minerals (except minor minerals), road transport, sea
transport, machine tools, ferro-alloys and tool steels, basic and intermediate
products required by chemical industries such as manufacture of drugs
dyestuffs and plastics, antibiotics and other essential drugs, fertilizers,
synthetic rubber, chemical pulp, carbonization of coal, and aluminum and
other non-ferrous metals not included in the first category. In these industries,
State would increasingly establish new units and increase its participation but
would not deny the private sector opportunities to set up units or expand
existing units.
3. Industries left for private sector. All industries not listed in
schedules ‗A‘ or ‗B‘ were included in the third category. These industries were
left open to the private sector. Their development was to depend on the
initiative and enterprise of the private sector, though even here the State
could start any industry in which it was interested.
The 1956 Resolution emphasized the mutual dependence of public and
private sectors. The only 4 industries in which private sector was not allowed
to function were arms and ammunition, atomic energy, railways and air
transport. In all other industries, either the private sector was allowed to
operate freely or its help could be obtained if the government deemed fit.
However, the private sector was to remain subject to various government
regulations and controls as specified in Industries (Development and
Regulation) Act, 1951 and other related regulations.
The 1956 Resolution recognized the importance of small-scale and
cottage industries just as the 1948. Resolution had done. It also called for the
reduction in regional imbalances and inequalities. For this purpose, it
advocated that transport facilities, power and other facilities should be
provided in backward regions.
As compared to the 1948 Resolution, the 1956 Resolution considerably
enlarged the area of operation of the public sector as the exclusive

236
responsibility of the State was enlarged from 6 to 17 industries (Schedule A).
In addition, another category including 12 industries (Schedule B) was defined
where the State could participate on an increasing scale. However, the 1956
Resolution dropped the ‗threat‘ of nationalization that the 1948 Resolution
contained and the division of industries in different categories was more
flexible in the former as compared to the latter. The fact is that the basic
objective of both the Resolutions was the same-strengthening the mixed
economy structure of the country.
7.4.2 Review of Pre-1991 Industrial Policy and Liberalisation Trends
The actual operation of the industrial policy (particularly the industrial
licensing policy) has been a subject of much debate and criticism. Several
studies on the implementation of the licensing policies and the functioning of
the industrial approval system pointed out a number of flaws and deficiencies.
Reports of the various Committees and Commissions appointed by the
government itself (Monopolies Enquiry Commission in April 1964, Dr. R. K.
Hazari in 1965 and Dutt Committee in 1967) pointed out that the licensing
policy had failed to achieve its objectives. In many cases, the results were just
the opposite of what the government had planned. The main points of
criticism have been as follows:
1. Licensing and underutilization of capacity. Licensing was
supposed to ensure creation of capacities according to plan priorities and
targets. However, no clear priorities for private sector were laid down in plans
and therefore the private sector chose those industries which appeared more
profitable. In many cases, these industries happened to be luxury industries
and frequently they also satisfied the technical curiosity of the D.G.T.D.
(Directorate General of Technical Development) and were, therefore, granted
licenses in defiance of the needs of essential industries producing
commodities for mass consumption.
The grant of a licence to an enterprise was no guarantee that the
production capacity permitted would actually be installed. The government
had the right to take away a licence only several years later. Because of this
237
fact, capacity created, in some cases, was less than allowed. Many industries
(especially those belonging to the large monopoly houses) indulged in such
practices to restrict output and raise prices. Since the government had no
guarantee that the licensed capacity would actually be installed within the
stipulated time, it adopted the practice of granting licences for capacities far in
excess of the plan targets, from the end of the Second Plan. In those cases
where actual implementation was larger than expected (as, for example, in
the case of paper industry, cement industry and ceramic production) a sizable
unutilized capacity appeared. In some cases, overlicensing of an industry
deterred the licencees from implementing their full licensed capacities for fear
of excessive capacity creation in the industry. As a consequence of this,
industries over-licensed in the Third Plan were marked by under fulfillment of
capacity.
2. Licensing and concentration of economic power. As noted by
Aurobindo Ghosh, in India: ―It is industrial licensing which limits the areas of
private investment and also determines entry into specific industries. The total
volume of licensable private investment is normally (though not always) fixed
in relation to the total Plan target of private investment in industry. This
generally holds true of licensing in particular industries also; i.e., in
correspondence with Plan targets of capacity in specific industries. In such a
situation, oligopolistic rivalry proceeds principally through competition for
investment opportunities at the stage of entry into the industry itself.‘ This
explains the behavior of the large industrial houses in India who sought ―Pre-
emption of investment opportunities‖ though acquiring as much industrial
licences as possible thereby ensuring an increasing share of new capacities
created on the one hand, and on the other hand keeping out potential rivals.
Since a major objective of the Industries (Development and regulation) Act
was the prevention of monopoly and concentration of the ownership of
industries, it was expected to foil the attempt of the large industrial houses.
However, as all Enquiry Committees have noted, the operation of licensing
policy actually helped the large houses in achieving their ends in a number of
ways. As noted by the Dutt Committee, the licensing authorities many times
used their discretionary powers in favour of the large houses. This ―has been
238
revealed through their different practices, e.g., their early intimation of
impending licensing to an applicant, inadequate scrutiny and/or expeditious
disposal of licence applications, ‗on file decisions‘ without going through the
Licensing Committee, reversal of earlier decisions, etc.‖
3. Discretionary powers of licensing authorities. Martinussen has
pointed out that because of the considerable discretionary powers vested in
the regulatory agencies, the whole system tended to promote corruption, rent-
seeking and discrimination based on personality relationships.
In this context, Martinussen emphasizes two features of the formal
bureaucratic institutions functioning in India: First, ―although separated from
the rest of society by effective socialization processes and specific rules which
govern their behavior, government officials often remain loyal to outside social
networks. They are inclined in general to favour members of their own social
network.‖ Second, ―the individual government official at higher levels of the
hierarchy is vested with considerable discretionary powers in his discharging
of administrative functions. This has increased the scope for outside influence
and for discrimination based on personalistic relationships.‖
Because of the loyalty to outside social networks and personalistic
relationships, a strong nexus between high government officials and
managers of large industrial houses emerged in this country. As a result, the
actual functioning of the industrial approval system in India favoured large
industrial houses. In his empirical study, Martinussen found that none of the
large industrial houses included in his sample had sustained severe setbacks
due to government regulations. On the contrary, the managers or the board
members of large industrial houses told him that they had received all the
licences they wanted, although with some delay in most of the cases. Even
with regard to industries explicitly reserved for the public sector, several of the
respondents cited instances where their companies had obtained permissions
to set up units or expand production. The whole system of operational
controls simply favoured large business houses as only they had enough
resources to cope with the bureaucracy in Delhi. Newcomers and smaller
enterprises could rarely exploit personalistic relationships with the government

239
officials and were therefore left out. Thus, the industrial approval system
impeded entry of new promoters and entrepreneurs, contrary to official
objectives.
4. Licensing and regional imbalances. One of the avowed objectives
of industrial licensing policy was the reduction in regional inequalities and
imbalances. However, the actual operation of this policy has accomplished
just the opposite – it tended to increase regional inequalities. As noted by the
Dutt Committee, the four industrially advanced States of Maharashtra,
Gujarat, West Bengal and Tamil Nadu benefited the most from the operation
of this policy. For example, in the decade 1955-65, these four industrially
advanced States accounted for 59.3 per cent of the applications and 62.42
per cent of the licences approved. On the other hand, the poor States of
Bihar, Orissa, Uttar Pradesh and Madhya Pradesh received only 15.5 per cent
of total licences approved. These trends continued in later years also. For
instance, during the thirteen years period 1979 to 1992, the four industrially
advanced States of Maharashtra, Gujarat, Tamil Nadu and West Bengal
received 46.4 per cent of total licences issued whereas the combined share of
Bihar, Orissa, Madhya Pradesh and Uttar Pradesh was only 16.2 per cent.
Because of this discrimination against the backward regions, the
government decided to issue more licences to such regions. However, even
here the developed States benefited more as it were their backward areas
that got more licences as compared to the backward areas of the poor States.
For instance, of the total 2,321 licences issued to backward areas during 1982
to 1992, backward areas of the four developed States of Maharashtra,
Gujarat, Tamil Nadu and West Bengal got 37.6 per cent licences while the
backward areas of Bihar, Orissa and Madhya Pradesh got only 9.8 per cent of
the total licences.
5. Delays in processing of applications. Two developments added
significantly to the burden on both the regulatory authorities and the private
entrepreneurs. On the one hand, the coverage and degree of detail of the
regulations was increased significantly (for instance an amendment to IDR Act
in 1953 made it compulsory for companies to obtain a licence for the

240
production of any ‗new article‘ while in 1956 industrial activity and products
were defined in much greater detail, thus adding to the number of
permissions required), while on the other hand, industrial growth and
diversification increased the scarcity of resources allocated administratively.
The outcome was increasing delays in the processing of applications.
Moreover, the Licensing Committee worked in a very haphazard and adhoc
manner and there were no definite criteria adopted for acceptance or rejection
of applications. This lack of explicit economic criteria was accompanied by the
generally poor quality of techno-economic examinations conducted by the
Directorate General of Technical Development (D.G.T.D.) which also took an
unnecessarily long time for disposing of cases and submitting its
recommendations to the Licensing Committee. All these factors impeded
industrial growth.
The Liberalisation Trends
Because of the above criticisms indicating the failure of the industrial
licensing policy in achieving its objectives, the Government of India
announced a number of liberalisation measures in the Industrial Licensing
Policy announced in 1970, 1973 and 1978. In 1980, the government came
forward with an Industrial Policy Statement which served as a guideline to
various liberalisation measures undertaken all through the 1980s. Some of
these measures were as follows:
1. Exemption from Licensing. The limit of exemption from licensing
was continuously raised upwards. In March 1978 the limit was fixed at Rs.3
crore. During 1980s it was first raised to Rs.5 crore in 1983 and then to a
whopping Rs.15 crore for projects located in non-backward areas and Rs.50
crore for projects located in non-backward areas and Rs.50 crore for projects
located in backward areas in 1988-89 (under certain conditions).
2. Relaxations to MRTP and FERA Companies. Under the pretext of
expanding industrial production and promoting exports, various concessions
were provided to companies falling under the MRTP Act (Monopolies and
Restrictive Trade Practices Act) and FERA (Foreign Exchange Regulation

241
Act). The most important relaxation related to the raising of the limit for MRTP
companies from rs.20 crore to Rs.100 crore (i.e., by five time) at one stroke in
March 1985. In May 1983, the government notified that MRTP companies are
eligible to set up, without the approval of the government, new capacities in
industries of high national importance or industries with import substitution
potential or those using sophisticated technology. On December 24, 1985, the
government permitted the unrestricted entry of large industrial houses and
companies governed by FERA into 21 high-technology items of manufacture.
With this permission, the large industrial houses falling within the purview of
the MRTP Act and FERA companies were allowed to freely take up the
manufacture of 83 items. The government specified a list of 33 broad groups
of industries under Appendix I in which MRTP and FERA companies were
permitted to set up capacities provided the concerned items are not reserved
for the small-scale or public sectors. Various other concessions like regulation
of excess capacity and capacity re-endorsement, facilities to set up industries
in backward areas etc. were also granted to MRTP and FERA companies.
3. Delicensing. With a view to encouraging production, the
government delicensed 28 broad categories of industries and 82 bulk drugs
and their formulations. For these industries only registration with the
Secretariat for Industrial Approvals was now required: no licence had to be
obtained under the Industries (Development and Regulation) Act. This was
subject to the conditions that the undertakings concerned do not fall within the
purview of the Monopolies and Restrictive Trade Practices (MRTP) Act or the
Foreign Exchange Regulation Act (FERA), that the article of manufacture was
not reserved for the small-scale sector and that the undertaking concerned
was not located within specified urban locales. During 1989-90, some more
industries were delicensed.
4. Re-endorsement of Capacity. With a view to improving capacity
utilization in industries, the government announced a scheme of capacity re-
endorsement in April, 1982. During 1986, this scheme was liberalised to allow
undertakings which had achieved 80 per cent capacity utilization (as against
94 per cent earlier) to avail of the facility. The re-endorsed capacity was to be

242
calculated by taking the highest production achieved during any of the
previous five years plus one-third thereof. The undertakings which were able
to achieve capacity utilization equal to the re-endorsed level were to get
further re-endorsement according to the highest production achieved in
subsequent years. The number of industries for which automatic re-
endorsement of capacity was not available was reduced from 77 to 26. With a
view to encourage modernization, renovation, replacement, etc., the
government announced in 1986 exemption from licensing requirements of
increases up to 49 per cent over licensed capacity.
5. Broad Banding of Industries. The scheme of broad banding of
industries was introduced in 1984. This implied classification under broad
categories – of two wheelers, four-wheelers, as well as machinery for
fertilizers, pharmaceuticals, and paper and pulp etc., into generic categories.
Thus, to take one example, cars, jeeps, light, medium and heavy commercial
vehicles, etc., were clubbed together into the generic category of ―four
wheelers‖. This measure was intended to enable the manufacturers to change
their product-mix rapidly to match changes in demand patterns without
incurring procedural delays and other costs associated with seeking
amendments to their industrial licences. Broad-banding was extended in
stages to cover 45 broad industry groups.
6. Minimum Economic Scales of Operation. Another important
concept introduced in the field of industrial licensing was that of minimum
economic level of operation. This was introduced in 1986. The idea was to
encourage realization of economies of scale by expansion of existing installed
capacities of undertakings to minimum economic levels of operation. With this
end in view, minimum economic capacities (MECs) were specified for 108
industries till 1989. Expansion of existing installed capacities was encouraged
upto these MECs if they fell short of the latter. During 1989-90, MECs were
specified for some more industries.
7. Development of Backward Areas. For promoting the development
of backward areas, the government extended the scheme of delicensing in
March 1986 to MRTP/FERA companies in respect of 20 industries in

243
Appendix I for location in centrally declared backward areas. The scheme was
later extended to 49 industries for location in any centrally declared backward
area and to 23 non-Appendix – I industries for location in category ‗A‘
backward districts. The conditions permitting MRTP and FERA companies to
establish non-Appendix I industries in backward districts were also liberalised.
Recognizing that one of the impediments blocking the industrialization
of backward areas of the country is the absence of infrastructural facilities, the
government announced the decision in 1988-89 to set up 100 growth centres
spread across the country over a period of five years or so. It was decided to
provide funds of the order of Rs.25 crore to Rs.30 crore to each growth centre
for creating infrastructural facilities of a high order.
8. Incentives for Export Production. Various concessions were
announced by the government in its industrial policy and export-import policy
from time to time to promote the expansion of exports. As mentioned earlier,
MRTP and FERA companies were permitted (outside the Appendix I
industries) if the product is predominantly for export. With a view to providing
fillip to production in industries of high national priority and/or those meant
exclusively for export, the government introduced Section 22-A in the MRTP
act whereby it could notify industries or services to which Section 21 and 22 of
the Act will not apply. In October 1982, all 100 per cent export oriented
industries set up in the Free Trade Zones were exempted from Sections 21
and 22 of the Act. In addition, the government identified some industries
which were especially important from export angle. These industries were
allowed 5 per cent automatic growth per annum, upto a limit of 25 per cent in
a plan period over and above the normal permissible limit for 25 per cent
excess production over the authorized capacity.
9. Enhancement of Investment Limit for SSI Units and Ancillary
Units. As stated earlier, the July 1980 Statement fixed the investment limit for
small-scale industries at Rs. 20 lakh and for ancillary units at Rs.25 lakh. In
March 1985 these limits were enhanced to Rs.25 lakh and Rs.45 lakh
respectively. For tiny units, the investment limit stood at Rs.2 lakh. A
government notification issued in April 1991 raised the investment limit for
244
small-scale industry from Rs.35 lakh to rs.60 lakh. In August 1991, the
investment limit for tiny units was raised to Rs.5 lakh. In February 1997, the
investment limit for small-scale units and ancillary units was raised to Rs.3
crore. The investment limit for tiny units was raised from Rs.5 lakh to Rs.25
lakh. The investment limit for small-scale industry was reduced to Rs.1 crore
in 1999. Now MSMED Act, 2006, has raised this investment limit to Rs.5 crore
for manufacturing enterprises and Rs.2 crore for service enterprises.
7.4.3 New Industrial Policy, 1991
In line with the liberalisation measures announce during the 1980s, the
government announced a New Industries Policy on July 24, 1991. This new
policy de-regulates the industrial economy in a substantial manner. The major
objectives of the new policy are ―to build on the gain already made, correct the
distortions or weaknesses the might have crept in, maintain a sustained
growth in productivity and gainful employment, and attain international
competitiveness.‖ In pursuit of these objectives, the government announced a
series of initiatives in respect the policies relating to the following areas:
A. Industrial Licensing
B. Public Sector Policy
C. MRTP Act
D. Foreign Investment and Technology
A package for the small and Tiny Sectors of industry was announced
separately in August 1991.
Abolition of Industrial Licensing
Industrial licensing policy in India has been governed by the Industries
(Development and Regulation) Act, 1951. As we have discussed above,
industrial licensing policy and procedures have been liberalised considerably
from time to time. Yet, the industrial licensing policy has all along been
resented to by the entrepreneurs as it led to unnecessary governmental

245
interference, delays in investment decisions and bureaucratic red-tapism,
corruption etc. Not only this, the industrial licensing policy was also unable to
achieve the objectives laid down for it by the government. On account of
these considerations, and in order to liberalise the economy and to enable the
entrepreneurs to make investment decisions on the basis of their own
commercial judgment, the 19991 the 1991 industrial policy abolished
industrial licensing for all but 18 industries. The 18 industries for which
licensing was kept necessary were as under – coal and lignite; petroleum
(other than crude) and its distillation and brewing of alcoholic drains; sugar;
animal fats and oils; cigars and cigarettes; asbestos and asbestos-based
products; plywood and other wood based products; raw hides and skins and
leather; tanned on dressed furskins; motor cars; paper and newsprint;
electronic aerospace and defence equipment; industrial explosives;
hazardous chemicals; drugs and pharmaceuticals; entertainment electronics;
and white goods (domestic refrigerators, washing machines, airconditioners,
etc.). With the passage of time, most of these industries have also been
delicensed. As of now, licensing is compulsory for only 5 industries. These are
alcohol, cigarettes, hazardous chemicals, electronics aerospace and defence
equipment, and industrial explosives.
In respect of delicensed industry, no approval is required from the
government. However, entrepreneurs are required to file and Industrial
Entrepreneur Memorandum (IEM) to the Secretariat for Industrial Approvals
(SIA) provided the value of investment on plant and machinery of such, unit is
above Rs.10 crore.
Public Sector‟s Role Diluted
The 1956 Resolution had reserved 17 industries for the public sector.
The 1991 industrial policy reduced this number to 8: (1) arms and
ammunition, (2) atomic energy (3) coal and lignite, (4) mineral oils, (5) mining
of iron ore, manganese ore, chrome ore, gypsum, sulphur, gold and diamond,
(6) mining of copper, lead, zinc, tine, molybdenum and wolfram, (7) minerals
specified in the schedule to the atomic energy (control of production and use
order), 1953, and (8) rail transport. in 1993, items 5 and 6 were deleted from

246
the reserved list. In 1998-99, items 3 and 4 were also taken out from the
reserved list. On May 9, 2001, the government opened up arms and
ammunition sector also to the private sector. This now leaves only 3 industries
reserved exclusively for the public sector – atomic energy, minerals specified
in the schedule to the atomic energy (control of production and use order)
1953, and rail transport.
The new industrial policy also states that the government will undertake
review of the existing public enterprises in low technology, small-scale and
non-strategic areas as also when there is low or nil social consideration or
public purpose. Sick units will be referred to the Board for Industrial and
Financial Reconstruction (or a similar body) for advice about rehabilitation and
reconstruction. For enterprises remaining in the public sector, it is stated that
they will be provided a much greater degree of management autonomy
through the system of MOU (memorandum of understanding).
The government has also announced its intention to offer a part of
government shareholding in the public sector enterprises to mutual funds,
financial institutions, the general public enterprises to mutual funds, financial
institutions, the general public and the workers. A beginning in this direction
was made in 1991-92 itself by divesting part of the equities of selected public
sector enterprises. Over the period 1991-92 upto 2009-10, the government
has raised Rs.57,683 crore through this means. The new industrial policy
indicates the government‘s intention to invite a greater degree of participation
by the private sector in important areas of the economy.
Other Liberalisation Measures
1. Industrial location policy liberalised. In a departure from the
earlier locational policy for industries, the new industrial policy provided that in
locations other than cities of more than 1 million population, there will be no
requirement of obtaining industrial approvals from the Centre, except for
industries subject to compulsory licensing. In cities with a population of more
than 1 million, industries other than those of a non-polluting nature were
required to be located outside 25 kms. of the periphery.

247
Major amendment in the industrial location policy was effected during
1997-98. The requirement of obtaining industrial approvals from the Central
government (except for the industries under compulsory licensing) for
establishing units at locations not falling within 25 kms. of the periphery of
cities having a population of more than 1 million was dispensed with.
However, notified industries of a non-polluting nature such as electronics,
computer software and printing, may be located within 25 kms of the
periphery of cities with more than 1 million population. Other industries are
permitted only if they are located in designated industrial areas set up prior to
July 25, 1991. Zoning and Land Use Regulations as well as Environment
legislation continue to regulate industrial locations.
2. Abolition of Phased Manufacturing Programmes for new
projects. To increase the pace of in-digenisation in manufacturing, Phased
Manufacturing Programmes have been in force in a number of engineering
and electronic industries. The new industrial policy has abolished such
programmes in future as the government feels that due to substantial reforms
made in the trade policy and the devaluation of the rupee, there is no longer
any need for enforcing the local content requirements on a case-by-case,
administrative basis. Various incentives that are currently available to
manufacturing units with existing Phased Manufacturing Programmes will
continue.
3. Removal of mandatory convertibility clause. A large part of
industrial investment in India is financed by loans from banks and financial
institutions. These institutions have followed a mandatory practice of including
a convertibility clause in their lending operations for new projects. This has
provided them an option of converting part of their loans into equity if felt
necessary by their management. Although this option has not generally been
exercised, it has often been interpreted as an unwarranted threat to private
firms of takeover by financial institutions. The new industrial policy has
provided that hence forth financial institutions will not impose this mandatory
convertibility clause.
248
Appraisal of New Industrial Policy
According to J. C. Sandesara, the new industrial policy seeks to raise
efficiency and accelerate industrial production in five different ways:
(1) A number of changes in industrial licensing policy, foreign
investment, foreign technology agreements and MRTP. Acts are such as to
do away with the prior clearance of the government. In such cases, project
time and, therefore, project cost will be reduced. Material and human
resources engaged in cultivating contacts and ‗getting things done‘ will be
released for more productive uses. Thus, efficiency will improve.
(2) The changes in respect of foreign investment and foreign
technology agreements are also designed to attract capital, technology and
managerial expertise from abroad. This will raise the availability of such
scarce resources in the country on the one hand, and will improve the level of
efficiency of production on the other hand.
(3) Some changes as regards public sector may enhance the
‗allocative efficiency‘. Opening‘. Opening up of the areas so far reserved for
the public sector to the private sector implies an opening for the sector which
has, by and large, given a better account of itself. Closure, liquidation or
rehabilitation etc. of sick/weak public sector units will free resources for more
productive use. Similarly, privatization may make for improved efficiency of
the public sector, through its being subjected to the stock market discipline.
(4) Other measures in this area such as purposeful formulation and
implementation of Memorandum of Understanding and its monitoring,
professionalization and greater autonomy may be expected to improve the
performance of the enterprises that will remain in the public sector.
(5) Greater emphasis in controlling and regulating monopolistic,
restrictive and unfair trade practices and the strengthening of the powers of
the MRTP Commission will curb anti-competitive behavior of firms in the
monopolistic, oligopolistic and ineffectively competitive markets and thus
promote competition and efficiency.
249
However, the new industrial policy 1991 has invited scathing criticism
from a number of quarters. The main points of criticism are as follows:
1. Erratic and fluctuating industrial growth. As noted above, the
new industrial policy considerably reduced the interventionist barriers to the
entry of domestic and foreign investors, resulting in what has been proclaimed
as a much more competitive environment in the industrial sector. It was hoped
that this ‗much more competitive environment‘ would, in itself, induce higher
growth rates in the industrial sector. However, as discussed in Chapter 26,
this has not happened. In fact, the rate of growth in the industrial sector
declined in the post-reform period (particularly during the latter half of 1990s).
For instance, the rate of growth of industrial production was only 5.0 per cent
per annum during the period of the Ninth Plan (1997-98 to 2001-02) whereas
it was 7.8 per cent per annum in the pre-reform decade (1980-81 to 1991-92).
During 1990s as a whole (1990-91 to 1999-2000), the rate of growth of
industry was only 5.7 per cent per annum. What is more, the decade of 1990s
witnessed erratic and fluctuating industrial growth rates in different years
leading to conditions of instability and uncertainty. However, the industrial
sector registered strong positive growth of 8.2 per cent per annum during the
period of the Tenth Plan (2002-03 to 2006-07).
The suggests that ―liberalisation per se has not been enough to ensure
high rates of growth of investment and productive activity, and that other
strategies may be necessary to encourage the ‗animal spirits‘ of
entrepreneurs.‖
2. Distortions in production structure. From the point of view of long
run industrial development, the most important group of industries is the group
of capital goods industries. However, the rate of growth of this group of
industries fell drastically from 9.4 per cent per annum during 1980s to only 4.7
per cent per annum over the Ninth Plan period. This points to the distortions in
production structure during 1990s.
3. Threat from foreign competition. In the early euphoria of
liberalisation, the private sector industrialists welcomes the new industrial
250
policy 1991 but they soon came to realize that opening up the Indian economy
to foreign competition meant more and cheaper imports, more foreign
investment, opportunities to the MNCs (multinational corporations) to raid and
takeover their enterprises, and worse, their inability to meet the challenge
from MNCs due to their weak economic strength vis-à-vis the MNCs. In the
new liberalised scenario that has emerged in the post-1991 reform phase, the
Indian businessmen are facing unequal competition from MNCs. The unequal
competition stems from a number of reasons discussed in detail in the section
on ‗Effects of Globalisation‘ on ―Globalisation and its Impact on the Indian
Economy.‖ As stated therein, the Indian enterprises suffer from ‗size
disadvantages‘ as they are just minuscules in comparison with MNCs‘ they
have for long operated in a protectionist environment which promoted
inefficiencies in production; the cost of capital to Indian business is much
higher than for MNCs; they are very weak financially in comparison with
MNCs; high multiple and cascading indirect taxes – especially at the local
level, where they are not applicable to foreign imports – result in making
Indian goods uncompetitive; etc. On account of these reasons, the Indian
industry associations (particularly the Confederation of Indian Industry) have
recently adopted a very critical attitude to the government‘s new industrial
policy. The basic position of CII is the India has moved from too much
protection to too little protection, which may eventually result in policy-induced
de-industrialisation. The overall business demand is for a level playing field.
4. Dangers of business colonalisation. The various measures to
promote foreign investment contained in the new industrial policy and the
various concessions to such investment announced in recent years have
provided opportunities to MNCs to penetrate the Indian economy and gobble
up Indian enterprises. Baldev Raj Nayar has pointed out three strategies
adopted by the MNCs to penetrate the Indian economy through FDI (foreign
direct investment). One, some foreign investors have bought off existing local
brands alongwith the branded products with the aim of replacing such
products with their own internationally known products, eliminating in the
process the possibility of competition from the local products. Two, some
foreign investors initially opted for joint ventures with Indian partners to gain

251
easy foothold in the domestic industry but, once having consolidated their
position, reduced the Indian partner to a subordinate position or simply ousted
him. Thus, many Indian businessmen feel that MNCs simply use them as a
‗door mat‘ for entry and spread risk only to be dumped later. Three, some
foreign investors, even as they started out with local partners in a joint
venture, then went on to set up parallel 100 per cent subsidiaries of their own
in the same field, which were then favoured with greater sources and more
modern technology, rendering the joint venture uncompetitive and useless.
The aggression which MNCs have shown to devour domestic enterprise has
raised the dangers of business colonalisation.
5. Misplaced faith in foreign investment. Various policy
pronouncements of the government in recent years indicate that it expects
foreign investment to help in technological up gradation of the industrial sector
and push up export earnings. However, this faith in foreign investment is
misplaced. As pointed out by H. K. Paranjape, none of the MNCs operating in
this country has attempted to develop India as an important base for a
significant part of its world-wide research and development work. Despite
various tax concessions and incentives none of the multinationals tried to
expand export markets. They undertook export activities only to the extent
they were compelled to do so under export obligations, or when it was found
necessary to do so in order to be able to earn foreign exchange for importing
some of their essential requirements.
Coming to the import of foreign technology, Paranjape again expresses
some reservations. According to him, in the whole eagerness to import foreign
technology, little attention seems to have been paid to the possibility that
production and managerial technologies found more suitable in other
countries may not necessarily prove to be the best in our circumstances. As
correctly pointed out by him, one of the very purposes of India‘s
industrialization is to ensure that our very large manpower resources are
effectively utilized. This implies the adoption of labour-intensive and capital
saving technologies in whichever areas it is feasible to do so. This may imply
252
major readjustments in technologies that have developed in the labour scarce
and capital abundant rich countries. This will not be an easy task.
6. Personalistic relationships and corrupt practices continue to
prevail. As stated earlier, the ‗licence permit raj‘ of the pre-1991 period
provided ample scope for rent seeking as the entire operations of the
industrial licensing policy were governed by personalistic relationships.
According to John Dengbol-Martinussen while delicensing and de-regulation
has undoubtedly discouraged rent seeking and corruption at the Central
government level, these practices have continued and may have even
increased at the State government level. This is due to the reason that while
the number of interaction points between government officials and
entrepreneurs have declined at ‗the Union level, they have generally
increased at the State level providing ample scope for continued interaction
on a personalistic basis.
References :
1. Aurobindo Ghosh, ―Investment Behaviour of Monopoly Houses –
Economics of Pre-emption‖, Economic and Political Weekly, November
2, 1974, p.1868.
2. John Degnbol-Martinussen, Policies, Institutions and Industrial
Development (new Delhi, 2001). p.89.
3. Ibid., p.89.
4. Ibid., p.89.
5. Ibid.,pp.91-2.
6. Computed from Government of India, Hand Book of Industrial
Statistics, 1992, Table 77, pp.194-5, and Hand Book of Industrial
Statistics, 1993, Table 100, pp. 192-3.
7. Computed from Government of India, Hand book of Industrial
Statistics, 1989, Table 104, p.166, Hand Book of Industrial Statistics,
1992, Table 79, p.198 and Hand Book of Industrial Statistics, 1993,
Table 102, p.196.
8. John degnbol – Martinussen, op.cit., pp.88-9.
253
9. For a detailed discussion refer to the chapter on ―Private Sector in the
Indian Economy‖ and the chapter on ―Multinational Corporation, FERA
and FEMA.‖
10. Government of India, Handbook of Industrial Policy and Statistics,
2001, p. 10.
11. Under the automatic route, prior approval is not required; only the
reporting stipulations have to be met for monitoring purposes. The
automatic approval reduces the scope of discretionary use of powers
by the Foreign Investment Promotion Board.
12. J. C. Sandesara, ―New Industrial Policy: Questions of Efficient Growth
and Social Objectives,‖ Economic and Political Weekly, August 3 10,
1991, p.1870.
13. C. P. Chandrasekhar and Jayati Ghosh. The Market that Failed,
Decade of Neoliberal Economic Reforms in India (New Delhi, 2002)
p.23.
14. John Degnbol Martinussen, op.cit., p.151.
15. Baldev Raj Nayar, Globalization and nationalism (New Delhi, 2001)
pp.173-4.
16. H. K. Paranjape, ―New Industrial Policy: A Capitalist Manifestic
Economic and Political Weekly, October 26, 1991, p.2476.
17. John Degnbol-Martinussen, op.cit., pp.205-6.
254
7.5 Evaluation of Some Major Industries of India
7.5.1 Sugar Industry
India is the largest producer and consumer of sugar in the world. Sugar
industry is the second largest agro-based industry in the country next only to
textiles. About 45 million sugarcane farmers, their dependents and a large
agricultural force, constituting 7.5 per cent of the rural population, is involved
in sugarcane cultivation, harvesting and ancillary activities. Besides, about 0.5
million skilled and semi-skilled workers, mostly from rural areas, are engaged
in the sugar industry. The sugar industry in India has been a focal point for
socio-economic development in the rural areas by mobilizing rural resources,
generating employment and higher income, transport and communication
facilities.
The history of sugar industry in India begins in 1903 when a sugar
factory was set up in Bihar and U.P. each. In 1932 there were 32 factories
operating in the country. In that year tariff protection was granted to the
industry and, as a result, the number of factories shot up to 137 by 1937 and
India became self-sufficient in sugar. Because of the extensive cultivation of
sugarcane as a commercial crop in northern India, the sugar industry was
localized for quite some time in U.P. and Bihar. For instance, in 1936-37, 85
per cent of the sugar production came from these two States. Their share in
1960-61 also stood at about 60 per cent. However, in the last four decades,
the industry has developed at a fast rate in Maharashtra, Andhra Pradesh,
Karnataka and Tamil Nadu. Since the sugar mills in these States have been
set up in recent decades, their production efficiency in greater and costs of
production lower as compared to the mills in U.P. and Bihar. At present, there
are 582 sugar factories in the country (as against 138 during 1950-51). The
aggregate capacity of these factories is 197.97 lakh tones.
Production of sugar has increased by leaps and bounds in the planning
period. From 11.34 lakh tones in 1950-51, production of sugar shot up to
51.48 lakh tones in 1980-81 and further to the record level of 132.77 lakh
tones in 1991-92. This enabled India to become the largest producer of

255
sugarcane and sugar in the world leaving the other major producers – Brazil
and Cuba – way behind. Sugar production touched an all-time high of 201.32
lakh tones in 2002-03 but fell to 139.58 lakh tones in 2003-04 due to drought
in major sugar producing States like Maharashtra, Karnataka and Tamil Nadu
and Wooly Aphids pest infestation.15 Sugar production in 2007-08 sugar
season (October-September) stood at 263 lakh tones and this fell steeply to
only 146.80 lakh tones in 2008-09 forcing the government to allow imports to
augment domestic availability and cool prices.
Sugar Policy of the Government
The sugar economy in the country has traditionally been a highly
controlled one and the industry was delicensed only recently in September
1998. The Janata Government way back in 1977 did try to decontrol sugar but
this decontrol proved to be short-lived as sugar prices crashed in the absence
of a monthly quota release mechanism. Therefore, controls were reimposed
soon. Since 1979, the government has been following a policy of dual prices
through which a specified percentage of total production of each sugar factory
is procured as levy sugar at notified prices for distribution through the PDS
(public distribution system). The ratio of levy sugar and free sale sugar from
1992-93 to the end of December 1999 was 40:60. The levy to free sale ratio
was reduced from 40:60 to 30:70 from January 2000 and subsequently to
15:85 and 10:90 with effect from February 1, 2001 and March 1, 2002
respectively. The levy share has been reduced to 10 per cent because
families above poverty line are now not to be provided sugar from the PDS
(excepting North East States, hill States and island territories) with the result
that the government would now require much less levy sugar for distribution
through the PDS.
In January 1997, the sugar industry was brought under a regime of free
licensing, which entitled the time-bound grant of licences without a due-
diligence exercise or a ministerial revaluation of the project. As a result of this
policy, there was a scramble for the creation of additional capacity. On the
eve of delicensing in September 1998, the number of licences granted for new
mills stood at 236 while those for capacity expansion stood at 1800. Additional

256
capacity sanctioned was a much as 150 lakh tones in just two years against
the then prevailing total capacity of 134 lakh tones. The biggest draw for the
setting up new capacity was the incentives offered with the licences:
exemption from the supply of levy sugar for a period ranging from 5 to 10
years (i.e., the new units could sell 100 per cent of their production in open
market for a number of years) and preferential treatment from the financial
institutions, the preferential treatment from the financial institutions, the
primary lenders. ―This meant that a mill could recover its cost in 5 years, make
profits in the remaining 5, and conveniently, turn sick once the incentives
expired. What the government was offering was a sweet haven for fly-by-night
operators. Not surprisingly, a few existing mills also snapped up licences to
pre-empt competition.‘‘16
Sugar Development Fund
Under the Sugar Cess Act 1982, a cess of Rs.14.00 per quintal is
collected on all sugar produced in the country and an amount equal to the
same is credited in the Sugar Development Fund (SDF) created under the
SDF Act 1982. The Fund has benefited the domestic industry by providing
loans at concessional rates to sugar factories for modernization and
expansion of capacities, rehabilitation development of sugarcane, providing
grants for industrial research etc.
Problems of Sugar Industry
1. Problem of mounting losses. Sugarcane prices have been
increasing over the years as the costs of production have been rising on the
one hand, and on the other hand, the government feels that a remunerative
price policy is a must for growers so that the incentive to grow more remains.
Since cane prices account for as much as 60 per cent of the cost of producing
sugar this, in turn, implies that the cost of producing sugar has been
increasing year after years. However, the realizations from the sale of sugar
are not rising adequately to meet these increasing costs resulting in heavy
losses to sugar units. Naturally, the arrears of sugarcane due to farmers are
rising.

257
2. Fixation of high sugarcane prices by the State governments.
The pricing of sugarcane is affected by a number of factors, the most
important being the Statutory Minimum Price (SMP) and the State Advised
Price (SAP), SMP is the price for sugarcane fixed by the Central government
on the basis of cost of production of sugarcane. SAP is the price fixed by the
State government taking into account the specific recoveries and conditions in
that particular State. Sugarcane pricing has become a highly politicized issue
and it has been observed that the basis of fixing SAP is quite arbitrary and
has no bearing with the increase in the cost of production. As a result, the
difference between SAP and SMP has been growing.
3. The question of minimum economic size. The minimum economic
size, as it exists in India, is 2,500 tonnes of cane crushed per day . This is
much less than the minimum economic size in other countries. For instance,
in Thailand the average plant size is of 10,000 against the average of 1,400 in
this country. According to some experts, the sheer size makes us lose out on
the economies of scale. Also, the small MEs makes efficient use of by-
products impossible.
4. Old machinery. Like jute and cotton textiles, some sugar factories
also require replacement of old machinery and modernization of production
techniques. The need is particularly great for the sugar factories located in
U.P. and Bihar.
5. Low sugar recovery. The sugar recovery from the canes, as also
the yield of cane crop, has been stagnant for a long time for want of any major
breakthrough in breeding better varieties of sugarcane. The average recovery
extraction) rate for the Indian sugar mills is just 9.5 to 10 per cent, against 13
to 14 per cent in some other sugar producing countries.
6. Failure to follow a consistent policy. The government has not
followed a consistent long-term policy for sugar. It has varied between
complete control, partial controls and total decontrol. In 1967-68, the sugar
factories were required to supply 60 per cent of output to government at ‗levy‘
or control prices while there maining output could be sold in the market at

258
market price. The proportion of levy sugar was later raised to 70 per cent. The
Janata government removed all controls in 1978 but with the return of the
Congress government to power, partial controls with dual pricing were again
imposed. Presently, the sugar producers are required to supply 10 per cent in
the form of ‗levy‘ sugar while the remaining 90 per cent is the free sale quota.
7.5.2 Textile Industries
Textile industry is the largest industry of modern India. It contributes
about 4.0 per cent of GDP, 14 per cent of total industrial output and provides
employment to over 35 million people. Together with allied agriculture sector,
it provides employment to over 82 million people. The contribution of this
industry to export earnings of the country is about 13.5 per cent. It is the only
industry which is self-reliant, from raw material to the highest value added
products, viz., garments/made-ups. The first cotton mill was set up in Kolkata
in 1818. However, the industry made a real beginning in 1854 when a cotton
mill was set up in Mumbai. In fact, the industry got localized in Mumbai and
Ahmedabad as would be clear from the fact that in 1911 Mumbai City had 33
per cent of the total number of mills and provided employment to 45 per cent
of the total workers of the industry. Ahmedabad had 19 per cent of the mills
and provided employment to 13.6 per cent of the workers. Outside Mumbai
City, some mills were located in Sholapur, Baroda and other minor local
centres in Mumbai State. In the United Provinces (Uttar Pradesh), Kanpur had
5 large mills and dominated the industry of U.P. In the post-Independence
period, important centres of this industry have been Mumbai, Ahmedabad,
Sholapur, Kanpur, Kolkata, Indore and Coimbatore. India‘s textile industry
continues to be predominantly cotton based, more than 56 per cent of fabric
consumption in the country being accounted for by cotton (as against the
world average of 46 per cent).
Expansion of the Textile Industry
There are four sectors in the textile industry – mill sector, power loom
sector, handloom sector and hosiery. The latter three are jointly considered
under the heading ‗decentralized sector‘. Over the years, the government has

259
granted many concessions and incentives to the decentralized sector with the
result that the share of this sector in total production has increased
considerably. For example, while the share of the mill sector in total fabric
production was 76 percent in 1950-51, it fell to 38 per cent in 1980-81 and
further to 0.8 per cent in 2008-09. The share of the decentralized sector
correspondingly rose from 24 per cent in 1950-51 to 99.2 per cent in 2008-09.
Of the total output of 54,966 million square metres of textiles in 2008-09, the
share of the mill sector was only 1.,796 million square metres – the rest
53,170 million square metres being contributed by the decentralized sector.
Of the three sub-sectors – handlooms, powerlooms and hosiery – in
the decentralised sector, it is the powerlooms sub sector that has grown at a
faster pace. For instance, in 2008-09 , the share of powerlooms in total textile
production was as large as 63.1 per cent while hosiery contributed 22.0 per
cent and handloom 12.1 per cent. There are many reasons for the fast
development of the powerloom sub-sector : (i) government‘s favourable
policies on synthetic fabric industry; (ii) ability of this sub-sector to introduce
flexibility in the product mix in line with the market situation; (iii) low labour
costs achieved indirectly through the flexible use of labour itself resulting
inlower cost of production, and providing and edge in the market; and (iv)
increase in exports from the powerloom sub-sector.
With the aim of developing the four sectors of the industry viz., mills,
powerlooms, hosiery and handlooms in an integrated manner, the
government announced a new Textile Policy in June 1985. The main objective
of this policy was to enable the industry to increase production of cloth of
good quality at reasonable prices for the vast population of the country as well
as for export purposes. A Textile Modernisation Fund of Rs.750 crore was
created in 1986 to meet the modernization requirements of the textile industry.
A Textiles Workers‘ Rehabilitation Fund was set up to provide interim relief to
workers rendered unemployed as a consequence of permanent closure of the
textile units. Another measure of significant importance has been the
delicensing of the textile industry as per the Textile (Development and
Regulation) Order 1993. Under the new policy, prior approval of the
260
government is not necessary to set up textile units including powerlooms. The
technology Upgradation Fund Scheme (TUFS) was launched in 1999 to
enable textile units to take up modernization projects, by providing an interest
subsidy on borrowings. Under TUFS, loans worth Rs.66,284 crore were
disbursed to 25,777applicants upto June 30, 2009. National Textile Policy
2000 targeted increase in textile and apparel exports form $11 billion to $50
billion by 2010 with the share of garments at $25 billion. Scheme for
Integrated Textile Parks (SITP) was launched in 2005. Under this scheme, 40
integrated textile parks of international standards, covering weaving, knitting,
processing and garmenting sectors with project proposals worth Rs.4, 149
crore have been sanctioned.
Problems of Textile Industry
1. Availability of raw materials. The Indian textile industry continues
to be predominantly cotton based. This would be clear from the fact that
cotton accounts for more than 73 per cent of the total fibre consumption in the
spinning mills and 56 per cent of the total fibre consumption in the textile
sector. Naturally in those years when the production of raw cotton in small,
the cotton textile industry faces a serious problem. The target o raw cotton
was kept at 7 million bales in the Third Plan but the achievement was merely
4.9 million bales. There were extreme shortfalls in some other plans as well.
Such shortfalls in the production of raw cotton as compared to the targets
affected the expansion programmes of the textile industry adversely.
However, things have now changed. From period of low level of output and
shortages, raw cotton has now reached an era of self-sufficiency with
production touching the level of 23.2 million bales in 2008-09. The cause for
concern now is the fluctuating and highly volatile prices of cotton month after
month. Such large fluctuations adversely affect the decentralized sector and
handloom weavers in particulars.
2. Poor quality and low productivity of cotton. Productivity of cotton
in India is very low. In fact, cotton yield is only around half of the world
average (in comparison with China, the productivity is just one-third). Not only
this. Cotton cultivation is done in India by small farmers with very small farms
261
and with improper technology and methodology. Outdated farm practices and
poor maintenance of the market yards have earned Indian cotton the label of
the world‘s most contaminated cotton. This poor quality of cotton is creating
difficulties for the spinning industry.
3. Outdated plant and machinery. Since the cotton textile industry is
fairly old in India and a number of mills were set up long back, the machinery
and equipment have grown old and outdated and need fast replacement.
Production with the help of such outdated machinery results in higher costs
and poor quality of product. According to a study by Doraisamy, out of 35
million spindles installed in the country, as many as 9 million need to be
scrapped while another 16 million need modernization of varying degrees.11
4. Fiscal structure skewed against modern, integrated mils. The
fiscal structure in India has been biased against the modern, integrated mills
with the result that the organised textile industry has not been able to attract
much investment in modernization in the last three – four decades. Both in
weaving and processing we have small and tiny units dominating the sector
with outmoded technology and sub-optimal scales. In the process of trying to
protect what should be marginal segments of an expanding industry in which
India traditionally has had competitive advantage, fiscal policy has been killing
the industry itself. The net result is that India is left without domestic
production of quality textiles needed by the largest and most lucrative
segments of the garment trade.
5. Interest burden and NPAs. With steady erosion in their profits,
most mills find it difficult to repay their loans. Most of these loans date back to
early 1990s when interest rates ranged from 16 to 18 per cent. Today, the
textile industry accounts for a significant portion of the NPAs (non-performing
assets) of the banking sector in the country (in fact, it has the dubious
distinction of having made the maximum contribution to the NPAs of the
banking sectors). For a large number of technically viable mills, the pressure
of unbearable interest burden has been the limiting factor to growth
(expansion and modernization) and even to survival.

262
6. Labour problems. The cotton textile industry has been faced with
frequent labour problems. While some problems of labour are genuine it is no
doubt true that the cotton textile mills have become the playground for
personal rivalries and the testing ground for some political groups. Protests
from labour have also come in way of modernization of textile mills due to fear
of displacement and unemployment. For instance, according to one estimate,
a single worker can oversee 48 automatic looms while he can manage only 6
non-automatic looms. The problem is aggravated by the fact that due to
stagnant demand conditions, there is little possibility of the displaced labour
being employed elsewhere in the sector.
7. Eroding cost competitiveness. India suffers from a competitive
disadvantage vis-à-vis its competitors like China. Pakistan and Taiwan. For
example, compared with China and Pakistan, Indian salaries and wages are
higher by 30 to 60 pr cent. It is also estimated that Indian spinners pay 100-
150 per cent more than their competitors for their power, making power cost
12 per cent of the production cost as against 5-7 per cent of the competition.
8. Dismantling of MFA and India‘s export prospects. Since January
1, 1974 the textile and clothing industry came to be governed by MFA (multi-
fibre arrangement). The MFA handed countrywide quotas for exports of
textiles. India had bilateral arrangement under MFA with USA, Canada,
Australia, countries of the European Union, etc. More than 70 per cent of
India‘s clothing exports were to quota countries of USA and EU. However, in
accordance with the Agreement of Textiles and Clothing (ATC), 1995 (which
is a part of WTO agreements), the MFA was dismantled with effect from
January 1, 2005. This opened up the textile industry to free competition at the
international level from January 1, 2005 for the first time in 30 years. There
was a wide consensus among many economists that China and India will gain
from this. Garment shops set up in small countries to take advantage of
quotas will die; India and China – with their investment capacity, cotton and
synthetic fibres, and economies of scale – will sweep the board. Within one
year of the MFA regime coming to an end, Indian textile exports grew at a rate
of 22 per cent. However, Indian textiles and clothing exports faced many ups
263
and downs after that, initially due to appreciation of Indian Rupee in 2007-08
and subsequently on account of global meltdown. Moreover, the performance
of India‘s textile continues to lag substantially behind that of China in terms of
rate of growth of exports and share in world textile exports. While China has
created huge capacities and capitalized on economics of scale, India has an
incredibly fragmented industry which is simply not geared to meet the
challenges of a rapidly changing global industry. There are hundreds of
thousands of powerloom units producing most of the fabrics in the country
with the share of the organized mill industry being negligible. How can this
miniscule mill sector pull up the entire industry ? It is also to be noted that
while China is moving aggressively towards modernization and upgradation
and pumping in large sums of money in building up its textiles and clothing
industry, the Indian industry has shown complacency and distinct lack of
enterprise. China‘s industry also has a cost advantage and better
infrastructure. Therefore, many experts have argued that India will lose out
the race to China.
Repeal of Cotton Ginning and Pressing Factories Act-1925
1. The Cotton Ginning and Pressing factories Act, 1925 enacted on the
8th day of August, 1925 provided for periodical filing of returns, maintenance
of registers, marking of bales and other rule making powers for the Central
and State Governments for the purpose of regulating the ginning and pressing
factories.
2. There have been changes in the pattern of processing, marketing and
consumption of cotton since the enactment of the act. In the market driven
economy needing quality products modernisation of ginning and pressing
factories is essential. Further, in the present liberalized industrial scenario the
restrictions laid down in the Cotton Ginning and Pressing Factories Act, 1925
are not required any longer and the Cotton control Order, 1986 issued under
the Essential Commodities Act, 1955 would cover provisions considered
essential to regulate working of ginning and pressing factories in future so
long as cotton remains as an essential commodity. Hence it was considered
that the said Act be repealed.

264
3. The repeal will also provide a thrust and incentive to the modernisation
efforts in the cotton ginning and pressing sector to ensure quality processing
of cotton and charging remunerative price for the service provided for.
7.5.3 Jute Industries
Te jute industry is one of the oldest in the country. The first power-
driven jute mill was established in the country at rishra near Kolkata in 1859
and since then the industry has made rapid progress. Most o the development
of the jute industry has taken place in Bengal. The partition of the country
gave a set-back to the industry as major jute growing areas went over to
Bangladesh. in fact, only 25 per cent of jute growing areas were left within the
country. Therefore, the government made concerted efforts to increase the
production of raw jute within the country. As a result, area under jute
increased from 6.52 lakh acres in 1947-48 to 1.4 million acres by 1950-51 and
the output of raw jute rose from 1.6 million bales to 3.3 million bales over the
same period. Production of mesta was also encouraged to be used in mixture
with jute. The total area under jute and mesta stood at 0.9 million hectares in
2008-09 and their production stood at 10.4 million bales. The production of
jute and mesta textiles increased form 837 thousand tones in 1950-51 to
1,074 thousand tones in 1981-82 and further to 1,369 thousand tones in
2008-09. Globally, India is the largest producer and second largest exporter of
jute goods and this sector provides employment to 40 lakh farm families, as
well as direct and indirect employment to 4 lakh workers. There are 77 jute
mills in the country of which 60 are in West Bengal.
Problems of Jute Industry
1. The emergence of substitutes. Perhaps the most important
problem plaguing the jute industry is the demand recession emanating mainly
from the emergence of substitutes. Jute bags have been rapidly losing their
place to synthetic bags both at home and abroad. At home, the packaging of
foodgrains, fertilizers, cement and sugar is increasingly being done in
synthetic bags in place of jute bags. For instance, domestic consumption of
jute products reached its peak in 2001-02, when it touched 1.5 million reached

265
its peak in 2001-02, which it touched 1.5 million tones, tones. Subsequently it
kept falling in the next five years to 1.1 million tones basically due to the use
of synthetic products. In the international market, adoption of new techniques
of transportation and discovery of synthetic substitutes has reduced the
demand for jute goods.
2. Use of outmodes plant and equipment. A number of jute mills in
India are very old and carry out production with obsolete machinery. Such
production is uneconomic since costs of production are very high. Naturally
these mills require replacement of machinery and modernization. This is all
the more necessary because India‘s main competitors in international market,
Bangladesh and China, have new mills possessing modern machinery and
are accordingly posing a serious threat to India‘s jute exports.. If India is to
face this challenge it must scrap and replace the 100 year old looms. With the
new sophisticated looms that are now being produced in the developed
countries, per man production can be raised as much as 12 times more than
the present per man production.
3. Irregular power supply. There has been severe power crisis in
west Bengal in a number of years resulting in the imposition of power cuts on
jute industry. Naturally the production of jute manufactures suffered seriously
in these years.
4. Competition from imports. The government has removed duty on
imports of raw jute and jute products from Bangladesh, Pakistan, Nepal and
China. With zero duty, imported materials are Rs.250-300 a tone cheaper
than the domestic products. This has increased imports of jute creating
difficulties for domestic producers.8
5. Other Problems. The jute industry is plagued by many other
problems also like historically high an-machine ratio, burgeoning wage and
input costs, and a mismatch between the installed capacity and actual
production.
Saddled with these problems, a number of units in the jute industry
have turned sick and many are being run under arrangements reached with
266
the approval of the BIFR (Board for Industrial and Financial Reconstruction).
Faced with this peculiar situation, the jute industry has no resources to
undertake large-scale modernization and rehabilitation programmes. In fact,
as noted by A.V.Krishnan, the industry is carrying a large surplus labour force
of which a substantial number has already reached the retirement age but te
industry is finding itself unable to retire them due to paucity of funds.9
The Emerging Opportunities
The above discussion indeed presents a dismal picture of the jute
industry but the future seems to be good. This is on account of the following
factors :
1. There is ample scope of diversification and production of value
added products. A large area for non-traditional jute items, jute decorative and
other jute specialties (like tea bags, jute reinforced plastic, geo-textiles,
decorative including furnishing, soft luggage, shopping bags, carpets and
matting, apparels, blankets and non-woven‘s) remains to be explored. This
can open upon tremendous possibilities for expansion of demand for jute
goods in future. The advantages of the new and value added products have
generated considerable interest in the commercial use of jute on a large
scale. Krishnan notes that the textile manufacturers, particularly in the South,
are directing their attention now towards cotton-jute blended yarn due to high
cost of cotton yarn for some uses. In years to high cost of cotton yarn for
some uses. In years to come, the South might well emerge as the largest
manufacturing base for value added jute products in the country.
2. The development of the market for new value-added jute
products is an excellent opportunity for the industry to direct its attention,
penetrate and create new export markets with brand name ‗Indian Jute‘.
Whatever efforts at diversification have been undertaken so far, have reaped
rich dividends as would be clear from the fact that the share of diversified
products in total jute exports has increased considerably over the years.
Moreover, notes Krishnan, as jute fibre is not only environment friendly and
fire retardant but also bio-degradable with capacity to promote safety

267
standards, some top car manufacturers in Germany have plants to use it. Jute
is also being used increasingly as a soil saver. This can help jute in
recapturing the export markets.
Keeping in view the immense possibilities for diversified products, the
government set up the National Centre for Jute Diversification (NCJD) in 1995
as a body under the Ministry of Textiles. NCJD is playing an important role in
the commercialization of technologies for the manufacture of jute-diversified
products and creating awareness about the uses of this natural fibre in non-
conventional application. The government formulated the first ever National
Jute Policy 2005 with an objective of increasing production, improving quality,
ensuring remunerative prices to the jute farmers and enhancing per hectare
yield. On June 2, 2006 the government approved the implementation of the
Jute Technology Mission (JTM) at an estimated cost of Rs.355.55 crore. JTM
comprises four mini-mission: (1) Minimission I – Strengthening of Research
and Development; (2) Mini-mission II – transfer of technology; (3) Mini-
mission III – development of marketing infrastructure; and (4) Mini-mission IV
– modernization / upgradation of technology of jute sector, and initiation of
activities for promotion of jute diversified products.10
7.5.4 Cement Industry
Manufacture of cement was first started in Madras in 1904. A real
beginning was, however, made in 192-13 when three companies were
formed. By the time the plans started, there were 21 factories with an annual
capacity of 3.28 million tones. The government had a complete control on the
production, distribution and price of cement and this dampened the growth of
the cement industry. In 1977, the government announced that 12 per cent
post-tax return on net worth was fair enough and retention prices would be
fixed to ensure it. This provided an initial momentum for investment in the
industry. The real impetus was provided when partial decontrol was
announced in 1982. Under this policy, all existing cement units were required
to give up to 66.6 per cent of their installed capacity as levy at controlled price
(for new units and sick units the requirement was kept at 50 per cent of
installed capacity). The balance production was treated as ‗non-levy cement‘

268
and was allowed to be sold in the market at the ruling prices. The most
important objective of the new policy of partial decontrol was to eliminate
black marketing and bring down the price in the free market. The government
intended to fully dismantle the controls and, keeping this end in view,
liquidated the levy system in a phased manner. The 1989 Budged announced
total decontrol of cement. Thus, from a phase of total controls, the cement
industry passed through a phase of total decontrol in March 1989. The
cement industry was delicensed in 1991. The industry responded favorably to
the government initiatives and the production capacity increased from 29
million tones in 1982 to 113 million tones in 1999-2000 – an expansion of 84
million tones in just 18 years. At present, there are 159 large cement plants in
the country with an installed capacity of 163.45 million tones per annum.
Besides, there are about 332 mini-cement plants with an estimated installed
capacity or 11.10 million tones per annum. The production of cement was 21
million tones in 1981-82. This rose to 45.8 million tones in 1989-90 and 181.4
million tones in 2008-09 – a substantial expansion by all means. Now India is
the second largest producer of cement in the world after China. However, it is
distant second.
An event of significant importance from the long-term point of view has
been the process of consolidation and ‗mergers an acquisitions‘ witnessed in
the cement industry during recent period (particularly since 1997-98). The
leaders are now finding it economical to acquire an existing under utilized/il-
managed company rather than to float a new company.
Mini Cement Plants
In order to exploit smaller deposits of limestones scattered all over the
country and in remote and inaccessible areas, the government announced
guidelines for the setting up of mini cement plants (having a capacity ranging
between 50 tonnes and 200 tonnes a day). The major advantages of mini
cement plants are increased employment opportunities in rural areas,
dispersal of industrial activity and reducing strain on the transportation
infrastructure. As stated above, there are about 332 mini cement plants in the
country with an aggregate capacity of about 11.10 million tones. Most of the

269
mini cement plants in India are located in Andhra Pradesh, Karnataka,
Madhya Pradesh, Gujarat and Rajasthan.
The Regional Distribution
Capacity-wise, the western region dominates the rest of the country
with 40.5 per cent followed by the southern region (28.9 per cent), northern
region (20.6 per cent) and lastly, the eastern region contributing 10 per cent to
the total capacity. Since the industry is ‗location-specific‘, it has resulted in
formation of clusters of companies at suitable limestone reserves. At present,
there are seven clusters manufacturing a total of 55.3 per cent of the total
production while the remaining plants, which are scattered, manufacture the
remaining 44.7 per cent. As emphasized by N. Srinivasan, addition to cement
capacity in clusters in coming years should be so planned that they match the
growing demand of the States in the region concerned. A quantum jump in
addition to capacity in a cluster could lead to market distortions. ―While it is
important to assess ‗what‘ capacity is to be created it is more important to
know ‗where‘ to create it.‖17
Problems of Cement Industry
The above brief discussion shows that the cement scenario has
undergone a sea change – from that of shortages and premiums just a few
years ago to that of surplus production now. However, this surplus production
has brought in its wake new problems like cut-throat competition,
unremunerative prices and deepening financial crisis. The main problems of
the cement industry are outlined below.
1. Burden of high tariffs. The cement industry is facing high tariffs –
high excise duty, sales tax, royalty on limestone and coal etc. The excise duty
on cement has been steadily rising. According to the development council for
cement industry, the total levies on cement per tone amount to as much as
Rs.66.8 per tone. The effective burden on cement amounts to as much as
Rs.35 per cent of the retail price of cement and 47 per cent of the ex-factory
price excluding excise, sales tax and freight. This is much higher as compared

270
to the burden in other countries making the Indian cement industry
internationally uncompetitive.
2. Poor quality of coal. Coal is an important input in the cement
industry and accounts for 15 to 20 per cent of cash expenses in the
manufacture of cement. On an average 250 kg. of coal is required to produce
one tone of cement. Coal in India has to be moved over long distances of
1,000 to 1,200 km to some plants in North, South and West India. There is a
severe shortage of coal for the cement industry. Moreover, with the capacity
addition in the cement industry projected for the Eleventh Plan, the annual
requirement of coal would substantially go up from the current level of 28.68
million tones to 57.97 million tones by the end of the Eleventh Plan.18 The
quality of coal supplied to cement units is also highly unsatisfactory as only D,
E and F grades of coal are supplied to these units. The ash content in Indian
coal is very high and this restricts production. To meet the twin problems of (i)
shortage of coal and (ii) poor quality of coal (due to high ash content), the
emphasis on imports of coal is now increasing. However, this option, in
addition to involving expenditure of foreign exchange resources, also places
those cement plants at a disadvantage which are located far from ports as
they have to incur extra costs for double handling and freight.
3. The power shortage. Power is another important requirement and
alongwith coal forms 40 per cent of the total cost. Power cuts, unsteady and
inadequate power supply from State Electricity Boards have created serious
problems for cement units. This is all the more so as the production of cement
is a continuous process requiring uninterrupted power supply to operate
efficiently. To cope with the problem for cement units. This is all the more so
as the production of cement is a continuous process requiring uninterrupted
power supply to operate efficiently. To cope with the problem of power
shortage, cement companies have been obliged to make heavy investments
in captive power generation and also auxiliary generation in wind farms,
particularly in plants located in coastal areas.
4. Transportation problem. Transportation costs make up around 20
per cement of the total cement price. The industry predominately depends on
271
railways, but due to shortage of wagons, cement dispatches by rail have
declined over the years. The Indian Railways has introduced an ‗Own Your
Wagon (OYW) Scheme‘ wherein cement companies have been allowed to
purchase wagons. This has led to some marginal improvement and has
enabled the cement companies to tide over distribution bottlenecks. However,
the increased distribution cost is forcing companies to pass the costs to the
customers.
5. Demand constraints. Till the year 1990-91, the demand for cement
was mainly dependent on government spending as the government with a 40
per cent off take was the single largest consumer of cement. However, due to
financial constraints, the government was forced to cut down on a wide range
of developmental activities. This resulted in a demand constraint. In recent
years, the policy of liberalisation and the opening up of the infrastructure
sector to the private sector and the foreign sector, have given a push to the
demand for cement. NHDP (National Highway Development Programme)
alone has been estimated to generate demand for 10 million tones of cement.
The growth of the housing sector, which has been assisted by lower interest
rates, and a favorable tax treatment of home loans, has also helped assist
cement demand. As a consequence, massive investments in the setting up of
new units and expansion of existing units in the cement industry have taken
place in recent years pushing up the production capacity and actual
production level of cement considerably.
6. Underutilization of capacity.
Underutilisation of capacity is a recurrent feature of cement industry.
Underutilisation is particularly marked in the cement plants located in the
Eastern region. One of the main factors accounting for low capacity utilization
in this region has been the demand constraint. Because of underutilization of
capacity, the cement plants are not able to reap the benefits of economies of
scale. Thus, they are not able to minimize costs of production at their
prevailing levels of production. They also waste scarce resources like power,
skills, and so on which hurt the bottomline in the long run.
272
7. Cement Technology
For a long period of time, many cement plants have used the
uneconomical wet process technology. Due to the high labour and
maintenance costs and smaller size, these plants had a high cost of
production. Their obsolete technology also resulted in a lot of wastage of coal
and electricity. In recent years, there has been a gradual shift from wet to
modern, fuel efficient dry process plants. Most of the new plants have adopted
state-of-the-art technology and have been implementing modernization
programmes to improve the performance of existing plants. This has resulted
in better capacity utilization, higher productivity, reduced energy consumption
and better quality of cement (comparable to the best in the world).
The Eleventh Five Year Plan targets a capacity addition of 118 million
tones during the Plan period (2007-12) This would require a total investment
of rs.52,400 crore.19
NOTES
1. Rohit Viswanath, ―Neves of Streel‖, Businessworld, October 23, 2006,
p.50.
2. Ramprasad Sengupta, ―The Steel Industry‖, in Subir Gokam, Anindys
Sen and Rajendra R. Vaidya (ed.), The Structure of Indian Industry
(New Delhi, 2004), p. 205.
3. Ramprasad Sengupta, ―Steel Industry‖, in Kaushik Basu (ed.). The
Oxford Companion to Economics in India, (Delhi, 2007), p.502.
4. Government of India, Economic Survey, 2009-10, (Delhi, 2010), p.219.
5. Government of India, Economic Survey, 2007-08 (Delhi, 2008), p.193
6. Rohit Viswanath, op.cit., pp.50-51
7. ―National Steel Policy – Some Substance‖. Economic and Political
Weekly, November, 12, 2005, pp.4776-7.
8. Business Standard, February 17, 2008, p.5.
273
9. A.V.Krishnan, ―Jute: Value Addition, Main Hope,‖ The Hindu: Survey of
India Industry, 19996, p.379.
10. Government of India, India 2010 – A Reference Annual (new Delhi,
2010), p.648.
11. Quoted in V. Mariappan and K. Chidambaram, ―Public SEctor Textile
Mills: Productivity Performance‖, Economic and Political Weekly, April
19, 2003, p. 1552.
12. Kishore Jethanandani, ―Trade in Textiles,‖ The Economic Times,
January 25, 26 & 27, 1990.
13. Manikram Ramaswamy, ―Textiles: Awaiting a New Lease of Life.‖ The
Hindu Survey of Indian Industry, 2001. pp.281-3.
14. Latha Jishnu, ―Too Little, Too Late,‖ Businessworld, November, 15,
2004, pp. 32-3; and Ashok V. Desai, ―Textiles Will Fail Us – and Why?‖
Businessworld, October 18, 2004, p.26.
15. Government of India, India 2006 – A Reference Annual (New Delhi,
2006), p. 422.
16. Rohit Saran, ―Sugar Industry: Dealicensing Disinterest‖, Business
Today, September 22, 1998, p.28.
17. N. Srinivasan, ―Cement: Capacity Location Problems‖, The Hindu –
Survey of Indian Industry, 1995, p. 365.
18. Government of India, Planning Commission, Eleventh Five Year Plan
2007-12 (Delhi, 2008), Volume III, p.171.
19. Ibid, p.170.

274
7.5.5 Iron and Steel
Steel industry reforms - particularly in 1991 and 1992 - have led to
strong and sustainable growth in India‘s steel industry.
Since its independence, India has experienced steady growth in the
steel industry, thanks in part to the successive governments that have
supported the industry and pushed for its robust development.
Further illustrating this plan is the fact that a number of steel plants
were established in India, with technological assistance and investments by
foreign countries.
In 1991, a substantial number of economic reforms were introduced by
the Indian government. These reforms boosted the development process of a
number of industries - the steel industry in India in particular - which has
subsequently developed quite rapidly.
The 1991 reforms allowed for no licenses to be required for capacity
creation, except for some locations. Also, once India‘s steel industry was
moved from the listing of the industries that were reserved exclusively for the
public sector, huge foreign investments were made in this industry.
Yet another reform for India‘s steel industry came in 1992, when every
type of control over the pricing and distribution system was removed, making
the modern Indian Steel Industry extremely efficient, as well as competitive.

275
Additionally, numbers of other government measures have stimulated
the growth of the steel industry, coming in the form of an unrestricted external
trade, low import duties, and an easy tax structure.
India continually posts phenomenal growth records in steel production.
In 1992, India produced 14.33 million tones of finished carbon steels and 1.59
million tones of pig iron. Furthermore, the steel production capacity of the
country has increased rapidly since 1991 - in 2008, India produced nearly
46.575 million tones of finished steels and 4.393 million tones of pig iron.
Both primary and secondary producers contributed their share to this
phenomenal development, while these increases have pushed up the demand
for finished steel at a very stable rate.
In 1992, the total consumption of finished steel was 14.84 million tones.
In 2008, the total amount of domestic steel consumption was 43.925 million
tones. With the increased demand in the national market, a huge part of the
international market is also served by this industry. Today, India is in seventh
position among all the crude steel producing countries.
The following are the premier steel plants operating in India:
Salem Steel Plant at Tamil Nadu
Bhilai Steel Plant at Chattisgarh
Durgapur Steel Plant at West Bengal
Alloy Steel Plants at West Bengal
Visvesvaraya Iron and Steel Plant in Karnataka
Rourkela Steel Plant at Orissa
Bokaro Steel Plant at Jharkhand
The earliest successful attempt to manufacture iron and steel by
modern methods was made in the country at Barakar in 1875 for the
production of pig iron. This was taken over by the Bengal Iron Company in
1889. However, the first effort at large scale production was made when Tata
Iron & Steel Company (TISCO) was set up in Jamshedpur in 1907. The Indian
Iron and Steel Company (IISCO) were set up at Burnpur in 1919. The first unit
276
in the public sector, now known as the Visveswaraya Iron and Steel Works
Ltd., started functioning at Bhadravati in 1923.
Progress in the Post-Independence Period
After Independence, special attention was paid to the development of
the iron and steel industry. The Second Plan which aimed at laying strong
foundations of industrial development naturally gave top priority to the
development of the iron and steel industry. This would be clear from the fact
that the investment on steel programme in the Second Plan alone was about
2.5 times the combined new investment undertaken by the public and private
sector on the industrial programmes in the First Plan. Three steel plants of
one million tones ingot capacity each were set up in the public sector at Bhilai,
Rourkela and Durgapur. Besides, expansion programme to double the
capacity of the two private sector plants, namely, TISCO and IISCO to 2
million tones and 1 million tones respectively were also taken into hand.
The three steel plants set up in the public sector came into operation in
stages between 1959 and 1962. The Third Plan placed emphasis on
expansion of these plants and the setting up on a new steel works at Bokaro.
The Fourth Plan steel programme was based on the maximum utilization of
steel capacity and preparation of plans to set up three new steel plants at
Salem in Tamil Nadu, Vijaynagar in Karnataka and Visakhapatnam in Andhra
Pradesh. The Bokaro Steel Plan was commissioned on February 26,1978.
With this the total installed ingot capacity which stood at 8.9 million tones on
March 31, 1974, increased to 11.6 million tones as on March 31, 1980. The
government also took over the management of IISCO in 1972 and acquired its
ownership in 1976 to improve its working.
Prior to 1973, of the four steel plants in the public sector, the plants at
Bhilai, Rourkela and Durgapur were owned and managed by the Hindustan
steel Limited (HSL) and the Bokaro Steel Plant by Bokaro Steel Limited
(BSL), In 1973, the government set up the Steel Authority of India Ltd. (SAIL).
HSL and BSL became the wholly owned subsidiaries of sail. The
management of IISCO is also under SAIL. Visvesvaraya Iron and Steel Ltd.
277
was taken over by SAIL in August 1989. Thus SAIL is now the main
integrated steel company. Vishakhaptam Steel Plant of Rashtriya Ispat Nigam
Ltd. (RINL), was commissioned in July 1992. It is the best laid out steel plant
in the country with a capacity of three million tones. In the private sector, Tata
Iron and steel Company (TISCO) is the first integrated steel plant. It is located
at Jamshedpur. Other important players in the private sector are Essar,
Mukand (having the biggest mini steel plant in the country), Lloyds, Jindal,
Nippon Denro Ispat Ltd., Mahindra Ugine Steel Company Ltd., FACOR,
Mardia Steel Ltd., etc. India is now the fifth largest crude steel producing
country in the world. This sector represents around Rs.90,000 crore of capital
and directly provided employment to over five lakh people.
Liberalisation of Steel Policy
Iron and steel industry was reserved for the public sector in the 1956
Industrial Policy Resolution which had stated that while existing units in the
private sector would be allowed to continue and expand, new units will be set
up in the public sector only. However, due to acute shortage of steel in 1960s
and 1970s and increase in the demand of steel by the re-rolling and
engineering industries, the government liberalised the steel policy. The
process of liberalisation initiated in 1983 has been progressively extended. In
1986 private sector was allowed to produce steel using EAF (Electric Arc
Furnace) process. Small blast furnaces were allowed only if they used
optimum energy. In February 1988, expansion of units was permitted within n
overall capacity ceiling of upto 250,000 tonnes per annum. The enhancement
of capacity upto 150 per cent of the existing licensed capacity was allowed
within the overall ceiling limit. However, certain conditions were imposed.
To liberalise and rationalize the manufacture of steel and steel-based
products, remove unnecessary restrictions, and promote minimum economic
scales of production, the government issued a new set of guidelines on June
6, 1990. Under the new policy, the private sector was allowed to set up steel
plants with a capacity of up to one million tones per annum and, for this
purpose, they were allowed the freedom to choose between the electric arc
furnace and blast furnace processes. Subsequent to the announcement of the
278
substantial liberalisation measures in July 1991, the government removed the
iron and steel industry form the list of industries reserved for the public sector
and also exempted it from the provision of compulsory licensing. The
government also abolished price and distribution controls on iron and steel
manufactured by integrated steel plants with effect from January 16, 1992.
The Freight Equalization Scheme was also withdrawn. The iron and steel
sector is now almost entirely open with no sectoral reservations, with no
licensing, pricing, distribution and import controls. This is a radical departure
for an industry which has experienced near exclusive public sector monopoly,
canalized imports, protective import tariffs and government regulated
domestic prices.
Production, Consumption and Exports of Steel
The production of finished steel (including secondary producers) rose
from 1.04 million tones in 1950-51 to 6.82 million tonnesin 1980-81 and 57.2
million tones in 2008-09. The production of pig iron was 5.3 million tones in
2007-08 and 6.2 million tones in 2008-09. The consumption of finished steel
in 2005-06 was 41.4 million tones which rose to 52.4 million tones in 2008-09
was 5.08 million tones and 4.44 million tones respectively.
Problems of Iron and Steel Industry
The development and expansion of the industrialization programmes of
a country depends crucially on the development and expansion of the iron
and steel industry. It is mainly due to the emphasis laid on the development of
this industry in the post-Independence period and the progress registered by it
that India‘s industrial base has now become strong enough to meet the
requirements of rapidly expanding engineering goods industries, machine
building industries, machine tools industries and a number of other capital
goods, intermediate goods and consumer goods industries. Naturally, a set-
back in the iron and steel industry due to any reasons whatsoever has to be
viewed with concern since it has adverse repercussions on the numerous
industries associated with it. Let us now consider some of the problems that
the steel industry has had to face:

279
1. Rise in input costs. Raw materials such as iron ore and coal
constitute on average 70 per cent of the total costs of steel companies. In
2005-06, prices of iron ore costs of steel companies. In 2005-06, prices of iron
ore shot up by 71 per cent and coal by 50 per cent. As a result, a third of the
large steel players‘ profits were wiped out.1 In 2008-09, the Indian iron and
steel industry was hit hard by the spiraling cost of imported coking
coal/metcoke.
2. Shortage of coal and power. The steel plants frequently face
problems in obtaining adequate quantities of the desired quality of coking
coal. This has often forced the steel plants to restrict the pushing of coke
ovens. In addition, Indian coking coal has a high ash content mainly because
of the sedimentary nature of their origin. In the 1950s the steel plants were
designed for using coal with 17 per cent ash content. Over the years, as
mining proceeded deeper and to lower seams, the ash content increased to
25 per cent. Every one per cent increase in ash brings down the production of
blast furnaces by 2-3 per cent. In addition, coke rate goes up and quality of
the product goes down. To keep the ash content of the blend at around 15 per
cent, the dependence on imported coal has to be increased which is obtained
at a considerably higher cost as compared with domestic coal (while price of
domestic coal is in the range of $40-45 per tone, that of imported coal is in
the range of $70 per tonne). Power shortages also affect the functioning of
steel plants adversely. For instance, inadequate power availability from
Damodar Valley Corporation (DVC) has adversely affected the performance
of SAIL.
3. Technologically obsolescence. Some public sector steel plants
are today victims of technological obsolescence. In respect of blast furnace
productivity, consumption of coke and tap-to-tap time in convertors, most of
the integrated steel plants are half as efficient as the steel plants in the rest of
the world. For example, in terms of hot metal output per cubic metre of
working volume per day, the performance has been 1.11-1.33 for Bokaro,
1.21 – 1.26 for Vishakhapatnam Steel Plan and 1.87 for the G-furnace (new
furnace) for TISCO while the same has been in the order 2.3-2.8 on a typical

280
Japanese Furance. Similarly, the tap-to-tap time in the blast furnace in the
TISCO plant has been in the range of 70-136 minutes while the same is 20-30
minutes in a Japanese firm. Not only in material value productivity, even in
terms of labour productivity, has Indian steel industry lagged considerably
behind the developed countries. While labour productivity in Indian stele
industry ranges between 39 tonnes per man year to 228 tonnes per man year,
it ranges between 300-500 tonnes per man year in the steel industry of
industrialized countries.3 It is also due to technological obsolescence that
energy consumption in Indian steel mills still continues to be considerably
higher than in steel mills of the developed countries. For instance, while
energy constitutes about 20 per cent or one-fifth of the total cost of steel
making in the latter, it is as high as 33 per cent (almost one-third) of the total
cost of steel making in India.
4. Inefficient management. The management and control of steel
plants leaves much to be desired. The top management often comprises non-
specialised, non-technical people who are often unequal to the task of
providing the requisite managerial competence in the complex and capital
intensive projects as the steel plants, in fact, are. The management also
works under severe constraints like undue political interference, frequent
labour disputes etc.
5. The demand constraint. The steel industry has faced rough time
during a number of recent years due to a slump in demand following reduction
in government‘s planned expenditure, lack of investment in the housing and
infrastructure sectors, and additional capacity creation based on assumed
growth in consumption which did not materialize. As a result, there was huge
piling up of inventories resulting in downward pressure on prices and deep
erosion in the profitability of the steel producers. The latest instance of this
was the latter half of the year 2008-09 when the domestic demand for steel
was adversely impacted by economic slowdown and, in particular, by
slackening demand in some of its leading end-use segments. As a result,
domestic steel prices started declining from September 2008 and the pace of
growth of production slowed down considerably.

281
6. Menace of dumping. Already in distress over the failure of domestic
demand to increase, the misery of the Indian steel industry was compounded
by the alarming downtrend in international price during the late 1990s. In
respect of certain steel products, the decline in prices was as much as 40 to
40 per cent. This led to unhealthy practices like dumping which pulled down
domestic prices and eroded the bottom-line of the local steel markers. The
lower tariff regime in the current era of liberalisation and the unrestricted
import of all iron and steel material under the new export-import policy made
things worse for the domestic producers of steel. What is more worrying is the
fact that seconds and defective grades of steel were dumped into the
economy. These were no match to the quality products turned out by the
Indian steel mills but spoiled the market of domestic steel markers.
The Eleventh Five Year Plan has listed the problems faced by the steel
industry as follows : ―depleting iron ore resources, inadequate availability of
coal, inadequate sintering and pelletization capacities and poor transport
infrastructure for movement of raw materials.‖ Outlay for the steel sector in the
Eleventh Plan has been kept at Rs.37,318 crore.
Facing the Challenges
To face the problems mentioned above, the Indian steel industry has
adopted a multi-pronged strategy consisting of the following steps;
1. Control raw materials. To tackle the problem or rising costs of raw
materials, the Indian steel companies are devising strategies to ‗control‘ raw
materials. For example, companies are acquiring captive iron ore mines to
control iron ore supplies. For instance, Jindal South West (JSW) is making
efforts to source at least 50 per cent of its iron ore requirements from it s
captive mines in Karnataka. As for coke, companies are now setting up their
own coke oven batteries where they can manufacture it from raw coal.
2. Intergrate. India‘s companies are also engaged in backward
integration to mitigate risks. For instance, Bhushan Steel and Strips buys hot-
rolled steel – used to manufacture high-end cold rolled and galvanized steel-
282
from the market. Now it is setting up a 3 million-tonne hot-rolled steel
manufacturing plant in Orissa. Another area of backward integration is power.
For example, in 2005-06 JSW commissioned a 100-MW captive power plant
in Vijayanagar which helped reduced power costs by nearly 25 per cent.
3. Engineer the finances. Steel in capital intensive industry and many
companies resort to long-term loans. The recent upturn in the sector enabled
many companies to pay off their long-term debts early and in general, interest
payments have also come down. Thus, companies are saving through debt
restructuring.
4. Expand. The massive expenditure on infrastructure development
has created extensive opportunities for the steel companies (for example,
Phase I of National Highways Development Programme alone led to a
demand for 1 million tone of steel). To benefit from these opportunities,
companies have started expanding capacities. For example, SAIL has
embarked upon a Rs.35,000 crore expansion plan. Similar expansions are
being undertaken by Tata Steel (which recently acquired Corus), JSW,
Mukand, Bhushan Steel etc.
Since India ha significant resources of iron ore and coal, India is an
attractive destination for global steel companies such as Posco and Mittal
Steel. Therefore, smaller Indian companies can be subject to hostile bids from
these golobal players. To stave off this danger, it is expected that
consolidation in India will happen among the domestic players in the near
future.
The Government of Indian approved the National Steel Policy (NSP)
2005 in October 2005. The long-term goal of NSP is to ensure that India has a
modern and efficient steel industry, capable of standing upto international
competition and catering to the growing domestic demand for steel. The NSP
envisages a threefold role for the State in the now deregulated Indian steel
industry – (1) as a catalyst for ―triggering‖ domestic demand, (2) as a
facilitatory to do away with supply side constraints, including the finance
constraint, and (3) as a co-coordinator to ―manage‖ the eternal environment
283
effectively, However, as correctly pointed out by Economic and Political
Weekly, success on all these fronts is suspect. For example, it is not clear
how the government can boost the domestic demand for steel with the FRBM
(Fiscal Responsibility and Budget Management) Act in place and neo-liberal
ideology dictating fiscal conservatism. As far as doing away with supply side
constraints is concerned, this would imply heavy financial assistance and
commitments to private sector capitalists who decide to invest (particularly
due to the capital intensive nature of the steel industry). This would put
pressure on the resources of financial institutions and push up their non-
performing assets (this is what happened in the first half of 1990s when initial
deregulation of the steel industry had led to a surge of investments in the
sector). As far as ―managing‖ the external environment is concerned, the NSP
has no strategy in place. It has nothing concrete to say about how India plans
to deal with steel-industry related subsidies, dumping, and the filing of anti-
dumping and countervailing duty cases. Overall the NSP simply lacks
substance.
7.5.6 Oil & Gas Industry in India22
The origin of oil & gas industry in India can be traced back to 1867
when oil was struck at Makum near Margherita in Assam. At the time of
Independence in 1947, the Oil & Gas industry was controlled by international
22
www.petroleum.nic.com.

284
companies. India's domestic oil production was just 250,000 tonnes per
annum and the entire production was from one state - Assam.
The foundation of the Oil & Gas Industry in India was laid by the
Industrial Policy Resolution, 1954, when the government announced that
petroleum would be the core sector industry. In pursuance of the Industrial
Policy Resolution, 1954, Government-owned National Oil Companies ONGC
(Oil & Natural Gas Commission), IOC (Indian Oil Corporation), and OIL (Oil
India Ltd.) were formed. ONGC was formed as a Directorate in 1955, and
became a Commission in 1956. In 1958, Indian Refineries Ltd, a government
company was set up. In 1959, for marketing of petroleum products, the
government set up another company called Indian Refineries Ltd. In 1964,
Indian Refineries Ltd was merged with Indian Oil Company Ltd. to form Indian
Oil Corporation Ltd.
During 1960s, a number of oil and gas-bearing structures were
discovered by ONGC in Gujarat and Assam. Discovery of oil in significant
quantities in Bombay High in February, 1974 opened up new avenues of oil
exploration in offshore areas. During 1970s and till mid 1980s exploratory
efforts by ONGC and OIL India yielded discoveries of oil and gas in a number
of structures in Bassein, Tapti, Krishna-Godavari-Cauvery basins, Cachar
(Assam), Nagaland, and Tripura. In 1984-85, India achieved a self-sufficiency
level of 70% in petroleum products.
In 1984, Gas Authority of India Ltd. (GAIL) was set up to look after
transportation, processing and marketing of natural gas and natural gas
liquids. GAIL has been instrumental in the laying of a 1700 km-long gas
pipeline (HBJ pipeline) from Hazira in Gujarat to Jagdishpur in Uttar Pradesh,
passing through Rajasthan and Madhya Pradesh.
After Independence, India also made significant additions to its refining
capacity. In the first decade after independence, three coastal refineries were
established by multinational oil companies operating in India at that time.
These included refineries by Burma Shell, and Esso Stanvac at Mumbai, and
by Caltex at Visakhapatnam. Today, there are a total of 18 refineries in the
285
country comprising 17 in the Public Sector, one in the private sector. The 17
Public sector refineries are located at Guwahati, Barauni, Koyali, Haldia,
Mathura, Digboi, Panipat, Vishakapatnam, Chennai, Nagapatinam, Kochi,
Bongaigaon, Numaligarh, Mangalore, Tatipaka, and two refineries in Mumbai.
The private sector refinery built by Reliance Petroleum Ltd is in Jamnagar. It
is the biggest oil refinery in Asia.
By the end of 1980s, the petroleum sector was in the doldrums. Oil
production had begun to decline whereas there was a steady increase in
consumption and domestic oil production was able to meet only about 35% of
the domestic requirement. The situation was further compounded by the
resource crunch in early 1990s. The Government had no money for the
development of some of the then newly discovered fields (Gandhar, Heera
Phase-II and III, Neelam, Ravva, Panna, Mukta, Tapti, Lakwa Phase-II,
Geleki, Bombay High Final Development schemes etc. This forced the
Government to go for the petroleum sector reforms which had become
inevitable if India had to attract funds and technology from abroad into the
petroleum sector.
The government in order to increase exploration activity, approved the
New Exploration Licensing Policy (NELP) in March 1997 to ensure level
playing field in the upstream sector between private and public sector
companies in all fiscal, financial and contractual matters. This ensured there
was no mandatory state participation through ONGC/OIL nor there was any
carried interest of the government.
To meet its growing petroleum demand, India is investing heavily in oil
fields abroad. India's state-owned oil firms already have stakes in oil and gas
fields in Russia, Sudan, Iraq, Libya, Egypt, Qatar, Ivory Coast, Australia,
Vietnam and Myanmar. Oil and Gas Industry has a vital role to play in India's
energy security and if India has to sustain its high economic growth rate.
286
Liberalisation Of Indian Economy Its Impact On Indian Oil & Gas
Sector
1. Liberalisation of Indian Economy & Its Impact On Indian Oil & Gas
Sector.
2. For four decades following Independence , the Indian economy was
under a socialist, dirigiste leash. The laws of demand and supply took a
backseat to the diktats of faceless bureaucrats.
3. Unsurprisingly, the economy could only crawl along, plagued by high
rates of inflation, unemployment and inefficiency - the consistently
meagre rates of growth produced by it coming to be contemptuously
termed the "Hindu rate of growth" the world over.
4. The central pillar of the policy was import substitution, the belief that
India needed to rely on internal markets for development, not
international trade — a belief generated by a mixture of socialism and
the experience of colonial exploitation.
5. The problems steadily mounted and in 1991, the economy stood on the
verge of collapse due to an acute foreign exchange shortage crisis.
6. In 1991, after the International Monetary Fund (IMF) had bailed out the
bankrupt state, the government of P.V. NarasimhaRao and his finance
minister Manmohan Singh started breakthrough reforms.
7. The new policies included opening for international trade and
investment, deregulation, initiation of privatisation, tax reforms, and
inflation-controlling measures.
8. Energy Policy & Regulation
9. Various agencies within Indian government oversee energy policy in
India and include the Ministry of Petroleum and Natural Gas, the
Ministry of Coal, the Ministry of Non-Conventional Energy Sources, the

287
Ministry of Environment and Forests, the Department of Atomic
Energy, and the Ministry of Power.
10. Under the Ministry of Petroleum and Natural Gas are the Directorate
General of Hydrocarbons (DGH) and the Oil Coordination Committee.
11. The DGH was set up in 1993 to oversee petroleum exploration
programs, develop plans for the state-owned oil enterprises and private
companies, and oversee efficient utilization of gas fields.
12. The Oil Coordination Committee oversees, plans, regulates, and
advises on the downstream sector.
13. The Gas Authority of India Limited (GAIL) is responsible for
transportation and marketing of natural gas.
14. State-owned companies like the Oil and Natural Gas Corporation
(ONGC) and Oil India Limited (OIL), which manage exploration and
production activities, and the Indian Oil Corporation (IOC), which
secures oil from abroad, also help shape the direction of energy policy.
15. Hydrocarbon Vision 2025
16. Lack of a comprehensive energy policy is a barrier to foreign
investment in long-term energy projects in India.
17. To address the absence of a policy, the government released in early
2000 Hydrocarbon Vision 2025, a study whose recommendations may
become official policy.
18. The study suggests, among other things, that India revise foreign
ownership regulations for refinery operations to allow 100% foreign
ownership.
19. The study calls for elimination of government subsidies for petroleum
over the course of the next 3-5 years.
288
20. The government is being encouraged to allow domestic gas prices to
float to international levels which would affect the 25% of the gas
market that is protected by government price controls.
21. Furthermore, the study set down a goal to supply 90% of India‘s
petroleum and diesel needs from domestic sources.
22. India suffers from low drilling recovery rates. Recovery rates in Indian
fields average only about 30%, well below the world average. The
government hopes one of the benefits to opening up the energy
industry to foreign companies will be access to better technology which
will help improve recovery rates.
23. Wary of a growing reliance on imported oil, the government announced
the New Exploration Licensing Policy (NELP) in 1997, which opened
the door to involvement by foreign energy companies.
24. Foreign firms were initially hesitant to bid on oil exploration rights, and
as a result no bids were received from foreign energy companies in
1999. However, by early 2000 India had awarded 25 oil exploration
blocks. The largest contract went to Reliance Industries of India, which
together with Niko Resources of Canada, won 12 oil exploration blocks.
25. Additionally, the government is encouraging Indian energy companies
to get involved in exploration and production projects in other Asian
countries to make them more competitive in the international arena and
develop their technical prowess.
26. Indian companies have become active in other oil projects in Asia,
Sudan, Australia, and Russia. In early 1999, IOC and ONGC formed a
strategic alliance designed to improve the international competitiveness
of both firms.
27. Refining & Petrochemicals

289
28. India is becoming a major global market for petroleum products.
Consumption of petroleum products rose from 57 million tons in 1991-
1992 to 107 million tons in 2000.
29. The India Hydrocarbon Vision 2025 report estimates future refinery
demand at 368 million tons by 2025.
30. For India to meet its ambitious refinery expansion goals it will need
help from multinationals and private Indian companies.
31. The main focus of a liberalization program that began in the mid-
nineties has been greater access to the refinery sector for private
companies and a green light for joint ventures with state-run
enterprises.
32. One approach has been tax breaks such as granting plants completed
by 2003 a five-year tax holiday.
33. Regulatory reform has entered into the picture, allowing foreign firms
that invest in excess of $400 million in refinery operations to sell refined
products.
34. Natural Gas
35. Natural gas now supplies about 7% of India's energy. Consumption of
natural gas rose from 628 billion cubic feet (bcf) per year in 1995, to
752 bcf in 1999. Power generation, fertilizers, and petrochemicals
production are industries that have been turning to natural gas as an
energy feedstock. Natural gas will become a bigger part of the energy
picture for India, primarily as a way to reduce dependence on foreign
oil.

290
Petrol and Diesel prices deregulated in India
The Government of India has taken a bold decision to deregulate petrol
and diesel (partially) prices in India and also come up with a price hike.
As usual the vote bank politicians on the UPA alliance, opposition
leaders and the left have voiced their protest. They claim that they are ‗with
the people of India‘ and whole lot of other crap. Two of the most politically
spoiled states in India – The West Bengal and Kerala – have readily jumped
on to ‗celebrate‘ the situation with a ‗Hartal‘ (strike). But do they even know
how pampered the people of India already are how much they are misusing
one of the most limited natural resources such as petrol (LPG and diesel as
well)?
What does deregulation means ?
Decontrolling or deregulating the petrol prices mean that, the
government will no longer be subsidizing petrol prices and the prices will be
purely linked to the international crude prices. In the case of diesel, though, it
will be only partially regulated – the reason being an attempt to avoid sudden
spike in inflation.
Why should Petrol cost more ?
As all of us know, petrol (or Gasoline) is produced out of crude oil
which is a natural resource that‘s available in limited quantity. It is a matter of
a few years before the crude gets totally exhausted. Although, there have
been several crude discoveries in India, we are still dependent on the OPEC
291
(Oil Producing and Exporting Countries) to import crude and refine it to
produce petrol, LPG, diesel, aviation fuel, kerosene etc.
Petrol production cost
The crude oil costs $79 a barrel (159 Litres). Since this has to be
transported to India via the marine root, there is a shipping cost. Let‘s say it‘s
something like 10%. Since the import duty on crude oil was waived sometime
back, let us not count that part. Hence by the time the crude arrives in India, it
is already costing something like $85 per 159L.
So the petrol refining calculation goes as follows :
Cost of 1 barrel crude: $85 or Rs. 3910.00 (exchange rate of 46)
Quantity of petrol produced from 1 barrel crude: 72L (45.4%)
Since almost 100% of the crude is refined into some product or other,
we can calculate the raw material cost of producing 72L or petrol as 45.4% of
the price of crude barrel.
Hence 72L petrol‘s material cost alone is 3910 * 45.4 / 100 = Rs.
1775.00
Raw material cost of 1L of Petrol = 1775.00 / 72 = @25 rupees
Obviously, the raw materials alone do not contribute to a product. You
need electric power, thousands of paid employees, machinery, maintenance
etc to finally produce petrol. So finally when it‘s of consumable form, it is
costing around 30 rupees in the oil refining spot itself.
Taxes, marketing and distribution cost
The following are the other additional expense before you can
consume the petrol at your favorite gas station:
Excise duty
Education tax
292
VAT
Distribution and transportation cost
Dealer commission
As I understand, all the above added up comes to around 27 rupees
per litre of petrol the majority of the cost is towards excise duty, transportation
cost and VAT (Isn‘t it a pity you have to spend more petrol or diesel to
distribute petrol?)
Essentially, one litre of petrol, by the time it reaches the petrol filling
stations, is costing you already Rs. 57/- without any profit added to the
petroleum marketing companies. Obviously most of these companies are
state run companies and hence cannot afford to reap 100% profit. Let‘s turn
our back on them and tell them that you can make say 20% profit. And if you
add that your 1L of petrol should actually cost you around Rs. 68/-
Now, aren‘t you really lucky that it‘s available below Rs.60/- even with
the latest hike in petrol prices?
Subsidy woes
The story is not over yet. One needs to do similar calculations for other
products such as diesel, aviation fuel, kerosene and LPG. Unfortunately
diesel is the primary thing that fuel public transport and distribution system in
India and kerosene – LPG are house hold lifesavers when it comes to cooking
purposes. In order to curb the inflation and protect the below poverty line
people, the government has to subsidize it big time. A part of this subsidy cost
is absorbed by the government while the oil marketing companies bear the
other half. This puts some pressure on the government to increase taxes on
luxury consumption sectors such as airlines by increasing aviation or jet fuel
prices. They are also taxed heavily which is mainly borne by the rich or upper
middle class people in India.
293
Why deregulation of petrol prices is good?
The deregulation of petrol prices will definitely increase the rate of
inflation in short term. Virtually there will be immediate price rise in
commodities and other consumables. However, for long term I think it is a
good move because at the end it will definitely reduce our long term debt and
fiscal deficit. Our overall economy will get stabler in this case.
Secondly, this measure will be a boost to the oil producing and
marketing companies to recover their losses immediately. Remember, lakhs
of people work in these huge companies and they need a life too. Moreover,
the government run oil companies will be candidates for disinvestment which
means that the government can lower their fiscal deficits further with
additional income.
The other advantage is that the inflation, at the moment, is a fake
figure. You will get to know the actual inflation and variation of commodity
prices only when the petrol prices move according to the international crude
prices.
This will also bring in big private players (e.g. Reliance) into the petrol
marketing game. Remember that companies like Shell and Reliance used to
provide excellent quality of petrol and service until Reliance pumps were
forced to close down due to government regulations. This kind of competition
will eventually bring in good service, good quality and in the future competitive
pricing as well. The immediate woes will be compensated in the mid term –
that‘s my strong belief.
The government, in the meantime, should try to reduce the excise
duties and restructure the VAT to minimize the impact of immediate fuel price
rise on inflation and the poor people.
Long term solutions to curb petrol prices
In the long term, there are several viable solutions that needs to be
done from the sourcing point to distribution and consumption.

294
There are possibilities of under sea pipes (just like the one we were
planning with Iran for gas sourcing) from the vendor nation to India to reduce
shipping cost. This has a very good long term positive impact though initial
cost of incorporation is high.
The oil refining companies sourcing and storing mechanism needs to
be optimized in a way that when the crude prices are low, we are able to store
more. I am not sure, how much of optimization is done in this regard. Since
we keep getting new and new governments every few years, they may not go
for a long term plan for the same. Please remember that not too long back,
the crude prices were at $35 or so per barrel.
There is a scope for improving the internal distribution system as well.
Though, India has a huge geographical region, we can still have oil
distribution pipes from refineries directly to the regional distribution centers.
This needs long term planning.
Oil
India had about 5.6 billion barrels (890,000,000 m3) of proven oil
reserves as of January 2007, which is the second-largest amount in the Asia-
Pacific region behind China. Most of India's crude oil reserves are located in
the western coast (Mumbai High) and in the northeastern parts of the country,
although considerable undeveloped reserves are also located in the offshore
Bay of Bengal and in the state of Rajasthan.
The combination of rising oil consumption and fairly unwavering
production levels leaves India highly dependent on imports to meet the
consumption needs. In 2006, India produced an average of about 846,000
barrels per day (bbl/d) of total oil liquids, of which 77%, or 648,000 bbl/d
(103,000 m3/d), was crude oil. During 2006, India consumed an estimated
2.63 Mbbl/d (418,000 m3/d) of oil. The Energy Information Administration
(EIA) estimates that India registered oil demand growth of 100,000 bbl/d
(16,000 m3/d) during 2006. EIA forecasts suggest that country is likely to
experience similar gains during 2007 and 2008.

295
Sector organisation
India‘s oil sector is dominated by state-owned enterprises, although the
government has taken steps in past recent years to deregulate the
hydrocarbons industry and support greater foreign involvement. India‘s state-
owned Oil and Natural Gas Corporation (ONGC) is the largest oil company,
and also the country‘s largest company overall by market capitalization.
ONGC is the leading player in India‘s upstream sector, accounting for roughly
75% of the country‘s oil output during 2006, as per Indian government
estimates.
As a net importer of oil, the Government of India has introduced
policies aimed at growing domestic oil production and oil exploration activities.
As part of the effort, the Ministry of Petroleum and Natural Gas crafted the
New Exploration License Policy (NELP) in 2000, which permits foreign
companies to hold 100% equity possession in oil and natural gas projects.
However, to date, only a handful of oil fields are controlled by foreign firms.
India‘s downstream sector is also dominated by state-owned entities, though
private companies have enlarged their market share in past recent years.
Natural gas
As per the Oil and Gas Journal, India had 38 trillion cubic feet (Tcf) of
confirmed natural gas reserves as of January 2007. A huge mass of India‘s
natural gas production comes from the western offshore regions, particularly
the Mumbai High complex. The onshore fields in Assam, Andhra Pradesh,
and Gujarat states are also major producers of natural gas. As per EIA data,
India produced 996 billion cubic feet (Bcf) of natural gas in 2004.
India imports small amounts of natural gas. In 2004, India consumed
about 1,089×109 cu ft (3.08×10¹⁰ m3) of natural gas, the first year in which the
country showed net natural gas imports. During 2004, India imported
93×109 cu ft (2.6×10⁹ m3) of liquefied natural gas (LNG) from Qatar.
Sector Organization
As in the oil sector, India‘s state-owned companies account for the bulk
of natural gas production. ONGC and Oil India Ltd. (OIL) are the leading

296
companies with respect to production volume, while some foreign companies
take part in upstream developments in joint-ventures and production sharing
contracts (PSCs). Reliance Industries, a privately-owned Indian company, will
also have a bigger role in the natural gas sector as a result of a large natural
gas find in 2002 in the Krishna Godavari basin.
The Gas Authority of India Ltd. (GAIL) holds an effective control on
natural gas transmission and allocation activities. In December 2006, the
Minister of Petroleum and Natural Gas issued a new policy that allows foreign
investors, private domestic companies, and national oil companies to hold up
to 100% equity stakes in pipeline projects. While GAIL‘s domination in natural
gas transmission and allocation is not ensured by statute, it will continue to be
the leading player in the sector because of its existing natural gas
infrastructure.
Final thoughts
I think our citizens (and even people from rest of the world) are
misusing petroleum products and this kind of abuse needs to be first
controlled via price hikes and then by introducing alternate energy options and
technologies to optimize the usage. There is a lot of scope for India to take
out those old, fuel inefficient vehicles from our roads. I think the taxation
needs to be restructured so that people and families who own more than one
vehicle should be taxed more. There can be several other long term steps to
improve the overall situation but please remember that at the end of it the
petrol will anyhow get exhausted.
And a request to our great politicians who always oppose what the
government is trying to implement. If you are really with the people of India,
please come up with real practical suggestions to improve the situation. It
wouldn‘t be too long before you will be stone-pelt by the younger generation
for preventing them an opportunity to live in a developed country by 2020.
And my questions to my friends (not the poor) who are earning in
thousands and lakhs. How dare you crib about a three rupees rise in petrol

297
while you still prefer to drive to office alone in a 5, 10 or 15 lakh car?. More
over I haven‘t seen you cribbing while spending 1000 rupees for a dinner or
while buying a shirt worth 1500 rupees.
7.5.7 Aviation Industries in India.
The history of civil aviation in India started with its first commercial flight
on February 18, 1911. It was a journey from Allahabad to Naini made by a
French pilot Monseigneur Piguet covering a distance of about 10 km. Since
then efforts were on to improve the health of India's Civil Aviation Industry.
The first domestic air route between Karachi and Delhi was opened in
December 1912 by the Indian State Air Services in collaboration with the
Imperial Airways, UK as an extension of London-Karachi flight of the Imperial
Airways.
The aviation industry in India gathered momentum after three years
with the opening of a regular airmail service between Karachi and Madras by
the first Indian airline, Tata Sons Ltd. However this service failed to receive
any backing from the Indian Government.
At the time of independence nine Air Transport Companies were
operational in the Indian Territory. Later the number reduced to eight when
the Orient Airways shifted its base to Pakistan. The then operational airlines
were Tata Airlines, Indian National Airways, Air service of India, Deccan
Airways, Ambica Airways, Bharat Airways and Mistry Airways.
With an attempt to farther strengthen the base of the aviation sector in
India, the Government of India together with Air India (earlier Tata Airline) set
298
up a joint sector company, Air India International, in early 1948. With an initial
investment of Rs. 2 crore and a fleet of three Lockheed constellation aircrafts,
Air India started its journey in the Indian aviation sector on June 8, 1948 in
Mumbai (Bombay)-London air route.
For many years since its inception the Indian Aviation Industry was
plagued by inappropriate regulatory and operational procedures resulting in
either excessive or no competition. Nationalization of Indian Airlines (IA) in
1953 brought the domestic civil aviation sector under the purview of Indian
Government. Government's intervention in this sector was meant for removing
the operational limitations arising out of excess competition.
Air transportation in India now comes under the direct control of the
Department of Civil Aviation, a part of the Ministry of Civil Aviation and
Tourism of Government of India.
Aviation by its very nature constitutes the elitist part of our country's
infrastructure. This sector has substantial contribution towards the
development of country's trade and tourism, providing easier access to the
areas full of natural beauty. It therefore acts as a stimulus for country's growth
and economic prosperity.
The 1978 Airline Deregulation Act partially shifted control over air travel
from the political to the market sphere. The Civil Aeronautics Board (CAB),
which had previously controlled entry, exit, and the pricing of airline services,
as well as intercarrier agreements, mergers, and consumer issues, was
phased out under the CAB Sunset Act and expired officially on December 31,
1984. The economic liberalization of air travel was part of a series of
―deregulation‖ moves based on the growing realization that a politically
controlled economy served no continuing public interest. U.S. deregulation
has been part of a greater global airline liberalization trend, especially in Asia,
Latin America, and the EUROPEAN UNION.
Network industries, which are critical to a modern economy, include air
travel, railroads, electrical power, and TELECOMMUNICATIONS. The air travel
sector is an example of a network industry involving both flows and a grid.

299
The flows are the mobile system elements: the airplanes, the trains, the
power, the messages, and so on. The grid is the infrastructure over which
these flows move: the airports and air traffic control system, the tracks and
stations, the wires and cables, the electromagnetic spectrum, and so on.
Network EFFICIENCY depends critically on the close coordination of grid and
flow operating and INVESTMENT decisions.
Under CAB REGULATION, investment and operating decisions were
highly constrained. CAB rules limiting routes and entry and controlling prices
meant that airlines were limited to competing only on food, cabin crew quality,
and frequency. As a result, both prices and frequency were high, and load
factors—the percentage of the seats that were filled—were low. Indeed, in the
early 1970s load factors were only about 50 percent. The air transport market
today is remarkably different. Because airlines compete on price, fares are
much lower. Many more people fly, allowing high frequency today also, but
with much higher load factors—74 percent in 2003, for example.
Airline deregulation was a monumental event. Its effects are still being
felt today, as low-cost carriers (LCCs) challenge the ―legacy‖ airlines that were
in existence before deregulation (American, United, Continental, Northwest,
US Air, and Delta). Indeed, the airline industry is experiencing a paradigm
shift that reflects the ongoing effects of deregulation. Although deregulation
affected the flows of air travel, the infrastructure grid remains subject to
government control and economic distortions. Thus, airlines were only
partially deregulated.
Benefits of Partial Deregulation
Even the partial freeing of the air travel sector has had overwhelmingly
positive results. Air travel has dramatically increased and prices have fallen.
After deregulation, airlines reconfigured their routes and equipment, making
possible improvements in capacity utilization. These efficiency effects
democratized air travel, making it more accessible to the general public.

300
Airfares, when adjusted for INFLATION, have fallen 25 percent since
1991, and, according to Clifford Winston and Steven Morrison of the
Brookings Institution, are 22 percent lower than they would have been had
regulation continued (Morrison and Winston 2000). Since passenger
deregulation in 1978, airline prices have fallen 44.9 percent in real terms
according to the Air Transport Association. Robert Crandall and Jerry Ellig
(1997) estimated that when figures are adjusted for changes in quality and
amenities, passengers save $19.4 billion dollars per year from airline
deregulation. These SAVINGs have been passed on to 80 percent of
passengers accounting for 85 percent of passenger miles. The real benefits of
airline deregulation are being felt today as never before, with LCCs
increasingly gaining market share.
The dollar savings are a direct result of allowing airlines the freedom to
innovate in routes and pricing. After deregulation, the airlines quickly moved
to a hub-and-spoke system, whereby an airline selected some airport (the
hub) as the destination point for flights from a number of origination cities (the
spokes). Because the size of the planes used varied according to the travel
on that spoke, and since hubs allowed passenger travel to be consolidated in
―transfer stations,‖ capacity utilization (―load factors‖) increased, allowing fare
reduction. The hub-and-spoke model survives among the legacy carriers, but
the LCCs—now 30 percent of the market—typically fly point to point. The
network hubs model offers consumers more convenience for routes, but point-
to-point routes have proven less costly for airlines to implement. Over time,
the legacy carriers and the LCCs will likely use some combination of point-to-
point and network hubs to capture both economies of scope and pricing
advantages.
The rigid fares of the regulatory era have given way to today‘s
competitive price market. After deregulation, the airlines created highly
complex pricing models that include the service quality/price sensitivity of
various air travelers and offer differential fare/service quality packages
designed for each. The new LCCs, however, have far simpler price
structures—the product of consumers‘ (especially business travelers‘)

301
demand for low prices, increased price transparency from online Web sites,
and decreased reliance on travel agencies.
As prices have decreased, air travel has exploded. The total number of
passengers that fly annually has more than doubled since 1978. Travelers
now have more convenient travel options with greater flight frequency and
more nonstop flights. Fewer passengers must change airlines to make a
connection, resulting in better travel coordination and higher customer
satisfaction.
Industry Problems after Deregulation
Although the gains of economic liberalization have been substantial,
fundamental problems plague the industry. Some of these problems are
transitional, the massive adjustments required by the end of a half century of
strict regulation. The regulated airline monopolies received returns on capital
that were supposed to be ―reasonable‖ (comparable to what a company might
expect to receive in a competitive market), but these returns factored in high
costs that often would not exist in a competitive market. For example, the
airlines‘ unionized workforce, established and strengthened under regulation
and held in place by the Railway Labor Act, gained generous salaries and
inefficient work rules compared with what would be expected in a competitive
market. Problems remain in today‘s market, especially with the legacy airlines.
Health of the Industry
The airlines have not found it easy to maintain profitability. The industry
as a whole was profitable through most of the economic boom of the 1990s.
As the national economy slowed in 2000, so did profitability for the legacy
airlines. Consumers became more price-sensitive and gravitated toward the
lower-cost carriers. High labor costs and the network hub business model hurt
legacy airlines‘ competitiveness. Hub-and-spoke systems decreased unit
costs but created high fixed costs that required larger terminals, investments
in INFORMATION technology systems, and intricate revenue management
systems. The LCCs have thus far successfully competed on price due to

302
lower hourly employee wages, higher PRODUCTIVITY, and no pension deficits. It
remains to be seen whether the LCC cost and labor structures will change
over time.
The Air Transport Association reports that the U.S. airline industry
experienced net losses of $23.2 billion from 2001 through 2003, though the
LCCs largely remained profitable. While the September 11, 2001, terrorist
attack and its aftermath are a major factor in the industry‘s hardships, they
only accelerated an already developing trend within the industry. The industry
was experiencing net operating losses for many reasons, including the mild
recession, severe acute respiratory syndrome (SARS), and the increase in
LCC services and the decline in business fares relied on by legacy carriers.
Higher fuel prices, residual labor union problems, fears of terrorism, and the
intrusive measures that government now uses to clear travelers through
security checkpoints are further drags on the industry.
Remaining Domestic Economic Controls
As a form of regulation, ANTITRUST laws inhibit post-deregulation
restructuring efforts, making it harder to bring salaries and work rules into line
with the realities of a competitive marketplace. The antitrust regulatory laws
inhibit the restructuring of CORPORATIONS and block needed consolidation; the
antitrust authorities view with suspicion efforts to retain higher prices.
Historically, the CAB had antitrust jurisdiction over airline mergers. When
Congress disbanded the CAB in 1985, it temporarily transferred merger
review authority to the Department of Transportation (DOT). In 1989, the
Justice Department assumed merger review jurisdiction from the DOT that,
when combined with its antitrust authority under the Sherman Act, makes it
the primary antitrust regulator of the airline industry.
The Justice Department has contested past merger proposals,
including Northwest‘s attempt to gain a controlling interest in Continental and
the merger of United Airlines and US Airways. Antitrust law also applies to
international alliances, arrangements that attempt to ameliorate restrictive
foreign ownership and COMPETITION laws. While labor contracts, airport asset

303
management, and other business practices are themselves high barriers to
restructuring, these difficulties are magnified by antitrust regulatory hurdles.
Cabotage restrictions, discussed below, also limit competition.
Reservation Systems
During the regulatory era, rates were determined politically and
changed infrequently. The CAB had to approve every fare, limiting the airlines‘
ability to react to demand changes and to experiment with discount fares.
After deregulation, airlines were free to set prices and to change them
frequently. That was possible only because the airlines had earlier created
computer reservation systems (CRSs) capable of keeping track of the
massive inventory of seats on flights over a several-month period.
The early CRSs allowed the travel agent to designate an origin-
destination pair and call up all available flights. The computer screen could
show only a limited number of flights at one time, of course; thus, some rule
was essential to rank-order the flights shown. CRSs were available only to
travel agents and, beginning in 1984, were highly regulated to ensure open
access to airlines that had not developed their own CRS system. The DOT
regulations restricted private agreements for guaranteeing access. However,
the growth of INTERNET travel sites and direct access to airline Web sites
created new forms of competition to the airline reservation systems.
Therefore, the DOT allowed the CRS regulations to expire in 2004.
Problems with Political Control of the Grid
A network can be efficient only if the flows and the grid interact
smoothly. The massive expansion of air travel should have resulted in
comparable expansions—either in the physical infrastructure or in more
sophisticated grid management. Government management of the air travel
grid has resulted in political compromises that cause friction with the smooth
flow across the grid. Flight delays are increasing due to a lack of aviation
infrastructure and the failure to allocate air capacity efficiently. The Air
Transport Association estimates that delays cost airlines and passengers
304
more than five billion dollars per year due to the increased costs for aircraft
operation and ground personnel and loss of passengers‘ time. The FAA
predicts that the number of passengers will increase by 60 percent and that
cargo volume will double by 2010.
Airports
Airport construction and expansion face almost insurmountable political
and regulatory hurdles. The number of federal requirements associated with
airport finances has grown considerably in recent years and is tied to the
awarding of grants from the federal Airport Improvement Program (AIP). Since
1978, only one major airport has been constructed (in Denver), and only a few
runways have been added at congested airports. Airport construction faces
significant nonpolitical barriers, such as vocal ―not in my back yard‖ (NIMBY)
opposition and environmental noise and emissions considerations. Federal
law restricts the fees airports charge air carriers to amounts that are ―fair and
reasonable.‖ These fee restrictions, although promoted as a way to provide
nondiscriminatory access to all aircraft, limit an airport‘s ability to recover
costs for air carriers‘ use of airfield and terminal facilities. Allowing airports
more flexibility to price takeoffs and landings based on SUPPLY and DEMAND
would also help ease congestion at overburdened airports.
Air Traffic Control
Air traffic control involves the allocation of capacity and has a complex
history of government management. Unfortunately, the Federal Aviation
Administration (FAA), which manages air traffic control, made bad upgrading
decisions. The advanced system funded by the FAA was more than a decade
late and never performed as hoped. The result was that the airline expansion
was not met by an expanded grid, and congestion occurred.
Better technology for air traffic control will help efficient navigation and
routings. Global Positioning System (GPS) navigation technology holds great
promise for more precise flight paths, allowing for increased airplane traffic.
Ultimately, however, a privately managed system that allows for better
305
coordination of airline investment and operation decisions will be necessary to
ease congestion. Air traffic control operation is a business function distinct
from the regulation of air traffic safety. Using pricing mechanisms to allocate
the scarce resource of air traffic capacity would reduce congestion and more
efficiently allocate resources.
Implementing cost-based structures by privatizing air traffic control is a
controversial and politically daunting issue in the United States, but twenty-
nine nations—including Canada—have already separated their traffic systems
from their regulating agency. Air traffic control PRIVATIZATION will likely be
driven by the decreasing ability of the Airport and Airways Trust Fund to
deliver the necessary financial support.
Currently, the FAA rations flights by delay on a first-come, first-served
basis—a system that creates overcrowding during peak hours. A system
based on pricing at rates determined by voluntary contractual arrangements
of market participants, not government regulators, would reduce this
overcrowding. One of the results would be the use of ―congestion pricing,‖
such as rush hour surcharges or early bird discounts.
Airport Access
FAA rules that limit the number of hourly takeoffs and landings—called
―slot‖ controls—were adopted in 1968 as a temporary measure to deal with
congestion and delays at major airports. These artificial capacity limitations—
known as the high density rule—still exist at JFK, LaGuardia, and Reagan
National. However, limiting supply through governmental fiat is a crude form
of demand management. Allowing increased capacity and congestion pricing,
and allowing major airports to use their slots to favor larger aircraft, would
lead to better results.
306
Remaining International and Economic Rules
International Competition
―Open Skies‖ agreements are bilateral agreements between the United
States and other countries to open the aviation market to foreign access and
remove barriers to competition. They give airlines the right to operate air
services from any point in the United States to any point in the other country,
as well as to and from third countries. The United States has Open Skies
agreements with more than sixty countries, including fifteen of the twenty-five
European Union nations. Open Skies agreements have been successful at
removing many of the barriers to competition and allowing airlines to have
foreign partners, access to international routes to and from their home
countries, and freedom from many traditional forms of economic regulation. A
global industry would work better with a globally minded set of rules that
would allow airlines from one country (or investors of any sort) to establish
airlines in another country (the right of establishment) and to operate domestic
services in the territory of another country (cabotage). However, these
agreements still fail to approximate the freedoms that most industries have
when competing in other global markets.
National Ownership
National ownership laws are an archaic barrier to a more competitive
air travel sector. These rules seem to reflect a concern for national security,
even though many industries as strategic as the airline industry do not have
such restrictions.
Federal law restricts the percentage of foreign ownership in air
transportation. Only U.S.-registered aircraft can transport passengers and
freight domestically. Airline citizenship registration is limited to U.S. citizens or
permanent residents, partnerships in which all partners are U.S. citizens, or
corporations registered in the United States in which the chief executive
officer and two-thirds of the directors are U.S. citizens and where U.S. citizens
hold or control 75 percent of the capital stock. Only U.S. citizens are able to

307
obtain a certificate of public convenience and necessity, a prerequisite for
operation as a domestic carrier.
Additional Problems Resulting from the 9/11 Response
After 9/11, safety and security regulation responsibilities were given to
the new Transportation Security Administration (TSA) within the Department
of Homeland Security. Created just months after 9/11, the TSA is an
outgrowth of the belief that only the government can be entrusted to perform
certain duties, especially those related to security. No one has clearly
established that a government whose employees are difficult to fire, even for
incompetence, will do better than a private employer who can more easily fire
incompetent workers.
In September 2001, Congress passed the Air Transportation Safety
and System Stabilization Act, which authorized payments of up to five billion
dollars in assistance to reimburse airlines for the post attack four-day
shutdown of air traffic and attributable losses through the end of 2001. It also
created and authorized the Air Transportation Stabilization Board (ATSB) to
provide up to ten billion dollars in loan guarantees for airlines in need of
emergency capital. While the ATSB risked the kind of mission creep that is
inevitable in an industry subsidy program, the deadline for applications to the
ATSB has passed. Of the ten billion dollars authorized by Congress for these
loan guarantees, the board actually committed less than two billion.
The main thrust of the plan was on making civil aviation sector
financially self sustaining. From this point of view, efforts to generate larger
internal resources are being made. The civil aviation sector has recently been
opened up to private sector and private airlines have captured substantial
share of this traffic on trunk routes. Under the Ninth Plan, it was proposed to
provide adequate capacity in air transport operations. The objective was also
to ensure healthy competition between the private and the public sector.
During the Tenth Plan, an outlay of Rs.12,928 crore was provided to
the Ministry of Civil Aviation out of which rs.7,792 crore was spent. There was
308
a massive expansion in air transport services during this Plan due to opening
up of domestic skies to private carriers. Important developments in the airline
and airport sector included : (1) modernization and restructuring of Delhi and
Mumbai airports launched through joint venture companies; (2) development
of Greenfield airports at Bangalore and Hyderabad on a Build-Own-Operate-
Transfer basis with PPP (public-private partnership); (2) approval of
modernization of 35 non-metro airports and 13 other airports to world-class
standards in phases; (4)liberalization of FDI (foreign direct investment) limit
upto 100 per cent through automatic route for setting up Greenfield airports;
(5) acquisition of modern and technologically advanced aircraft for Air India
Ltd., Air India Charters Ltd., and Indian Airlines Limited; (6) liberalization of
bilateral air services agreement in line with the contemporary developments in
international civil aviation sector; (7) adoption of a limited Open Sky Policy in
international travel to meet the traffic demand during peak season; and (8)
adoption of trade facilitation measures in custom procedures to facilitate
speedy clearance of air cargo.
The Eleventh Plan has laid down the following objectives for the civil
aviation sector: (i) providing world class infrastructure facilities; (ii) providing
safe, reliable and affordable air services so as to encourage growth in
passenger and cargo traffic; and (iii) providing air connectivity to remote and
inaccessible areas with special reference to north-eastern part of the country.
The total projected outlay for the Ministry of Civil Aviation in the Eleventh Plan
has been kept at Rs.43,560 crore at 2006-07 prices.
Air India and Indian Airlines operating in the international secotr and
domestic sector respectively since 1953 are both in the public sector. They
enjoyed monopoly statues for a considerable period of time. However, in
recent years, a larger number of private sector companies have entered the
civil aviation sector as the government has ended the monopoly of Air India
and Indian Airlines by repealing the Air Corporation Act, 1953. Air India and
Indian Airlines were merged on August 27, 2007 to form National Aviation
Company of India Ltd. (NACIL). Presently, there are three companies in the
public sector – NACIL, Air India Charters Ltd., and Alliance Air. In addition,
309
there are seven private scheduled operators. A new category of scheduled
airlines i.e., Scheduled Air Transport (Regional) services has been introduced
to enhance connectivity to smaller cities and within a region. Two cargo
airlines are also operating scheduled cargo services in the country.
The main thrust of the plan was on making civil aviation sector
financially self sustaining. From this point of view, efforts to generate larger
internal resources are being made. The civil aviation sector has recently been
opened up to private sector and private airlines have captured substantial
share of this traffic on trunk routes. Under the Ninth Plan, it was proposed to
provide adequate capacity in air transport operations. The objective was also
to ensure healthy competition between the private and the public sector.
During the Tenth Plan, an outlay of Rs.12,928 crore was provided to
the Ministry of Civil Aviation out of which rs.7,792 crore was spent. There was
a massive expansion in air transport services during this Plan due to opening
up of domestic skies to private carriers. Important developments in the airline
and airport sector included : (1) modernization and restructuring of Delhi and
Mumbai airports launched through joint venture companies; (2) development
of Greenfield airports at Bangalore and Hyderabad on a Build-Own-Operate-
Transfer basis with PPP (public-private partnership); (2) approval of
modernization of 35 non-metro airports and 13 other airports to world-class
standards in phases; (4)liberalization of FDI (foreign direct investment) limit
upto 100 per cent through automatic route for setting up Greenfield airports;
(5) acquisition of modern and technologically advanced aircraft for Air India
Ltd., Air India Charters Ltd., and Indian Airlines Limited; (6) liberalization of
bilateral air services agreement in line with the contemporary developments in
international civil aviation sector; (7) adoption of a limited Open Sky Policy in
international travel to meet the traffic demand during peak season; and (8)
adoption of trade facilitation measures in custom procedures to facilitate
speedy clearance of air cargo.
The Eleventh Plan has laid down the following objectives for the civil
aviation sector: (i) providing world class infrastructure facilities; (ii) providing
safe, reliable and affordable air services so as to encourage growth in
310
passenger and cargo traffic; and (iii) providing air connectivity to remote and
inaccessible areas with special reference to north-eastern part of the country.
The total projected outlay for the Ministry of Civil Aviation in the Eleventh Plan
has been kept at Rs.43,560 crore at 2006-07 prices.
Air India and Indian Airlines operating in the international secotr and
domestic sector respectively since 1953 are both in the public sector. They
enjoyed monopoly statues for a considerable period of time. However, in
recent years, a larger number of private sector companies have entered the
civil aviation sector as the government has ended the monopoly of Air India
and Indian Airlines by repealing the Air Corporation Act, 1953. Air India and
Indian Airlines were merged on August 27, 2007 to form National Aviation
Company of India Ltd. (NACIL). Presently, there are three companies in the
public sector – NACIL, Air India Charters Ltd., and Alliance Air. In addition,
there are seven private scheduled operators. A new category of scheduled
airlines i.e., Scheduled Air Transport (Regional) services has been introduced
to enhance connectivity to smaller cities and within a region. Two cargo
airlines are also operating scheduled cargo services in the country.
The main thrust of the plan was on making civil aviation sector
financially self sustaining. From this point of view, efforts to generate larger
internal resources are being made. The civil aviation sector has recently been
opened up to private sector and private airlines have captured substantial
share of this traffic on trunk routes. Under the Ninth Plan, it was proposed to
provide adequate capacity in air transport operations. The objective was also
to ensure healthy competition between the private and the public sector.
During the Tenth Plan, an outlay of Rs.12,928 crore was provided to
the Ministry of Civil Aviation out of which rs.7,792 crore was spent. There was
a massive expansion in air transport services during this Plan due to opening
up of domestic skies to private carriers. Important developments in the airline
and airport sector included : (1) modernization and restructuring of Delhi and
Mumbai airports launched through joint venture companies; (2) development
of Greenfield airports at Bangalore and Hyderabad on a Build-Own-Operate-
Transfer basis with PPP (public-private partnership); (2) approval of

311
modernization of 35 non-metro airports and 13 other airports to world-class
standards in phases; (4)liberalization of FDI (foreign direct investment) limit
upto 100 per cent through automatic route for setting up Greenfield airports;
(5) acquisition of modern and technologically advanced aircraft for Air India
Ltd., Air India Charters Ltd., and Indian Airlines Limited; (6) liberalization of
bilateral air services agreement in line with the contemporary developments in
international civil aviation sector; (7) adoption of a limited Open Sky Policy in
international travel to meet the traffic demand during peak season; and (8)
adoption of trade facilitation measures in custom procedures to facilitate
speedy clearance of air cargo.
The Eleventh Plan has laid down the following objectives for the civil
aviation sector: (i) providing world class infrastructure facilities; (ii) providing
safe, reliable and affordable air services so as to encourage growth in
passenger and cargo traffic; and (iii) providing air connectivity to remote and
inaccessible areas with special reference to north-eastern part of the country.
The total projected outlay for the Ministry of Civil Aviation in the Eleventh Plan
has been kept at Rs.43,560 crore at 2006-07 prices.
Air India and Indian Airlines operating in the international secotr and
domestic sector respectively since 1953 are both in the public sector. They
enjoyed monopoly statues for a considerable period of time. However, in
recent years, a larger number of private sector companies have entered the
civil aviation sector as the government has ended the monopoly of Air India
and Indian Airlines by repealing the Air Corporation Act, 1953. Air India and
Indian Airlines were merged on August 27, 2007 to form National Aviation
Company of India Ltd. (NACIL). Presently, there are three companies in the
public sector – NACIL, Air India Charters Ltd., and Alliance Air. In addition,
there are seven private scheduled operators. A new category of scheduled
airlines i.e., Scheduled Air Transport (Regional) services has been introduced
to enhance connectivity to smaller cities and within a region. Two cargo
airlines are also operating scheduled cargo services in the country.
312
Conclusion
Air travel is a network industry, but only its flow element— the
airlines—is economically liberalized. The industry is still structurally adjusting
to a more competitive situation and remains subject to a large number of
regulations. The capital, work rules, and compensation practices of the airline
industry still reflect almost fifty years of political protection and control.
We are finally seeing the kinds of internal restructuring among airlines
that was expected from deregulation. Yet, government still has much to do to
ensure that the airline market will thrive in the future. The FAA is a command-
and-control government agency ill-suited to providing air traffic control
services to a dynamic industry. Land slots and airport space should be
allocated using market prices instead of through administrative fiat.
International competition will increase, and rules regarding national ownership
need to change accordingly.
If the government deregulates the grid and transitions toward a market
solution, the benefits of flow deregulation will increase, and costs for air
travelers will fall even more.
7.5.8 Telecommunications Reform and the Emerging „New-
Economy‟: The Case of India23
Telecommunications reform in recent years in almost all developed and
developing nations created an opportunity to attract foreign direct investment.
The investments have been taking place mainly in the emerging ‗new‘
economy sector. The main drivers of this sector are the information
technology (knowledge-based) and the liberalisation and reform in
telecommunications. Among the developing nations, the Indian economy
faired better in attracting foreign direct investment in this sector due to the
economic reform measures continued since 1991. The economic and the
regulatory reforms brought into the telecommunications sector of India have
been addressed. Second, the emergence of the ‗new-economy‘ and its
23
www.trai.gov.in/npt1999.htm.
313
contribution to growth has been investigated. Finally, the challenges for the
Indian economy in managing the newly emerged economic opportunities have
been discussed.
Introduction
The dynamism of global telecommunications markets is widely
attributed to rapid technological development and an increasingly liberal policy
environment. Over the past decade, a large number of Asian economies,
including India, have also embarked on reform paths, and witnessed
significant expansion of their telecommunication networks and tremendous
improvements in quality. Furthermore, it is not always apparent where the
improved performance is because of specific policy choices rather than in
spite of them, and where more could have been achieved had policy been
different. Choices have to be made regarding the privatisation of state-owned
telecommunications operators, the introduction of competition, the opening of
markets to foreign investment and the establishment of pro-competitive
regulations.
While there is growing consensus that each of these elements is
desirable, there are few countries that have immediately gone all the way on
all fronts.
The Indian authorities have realised that development of an effective
and efficient telecommunications sector is a key to the growing international
competitiveness of the country. The government launched several reform
measures in telecommunications in the last decade. Since 1991, the
telecommunications sector has expanded exponentially as a result of these
measures. In 1972, the country had only a million telephone lines, by 1996 it
had more than 14 million, by 2000 more than 25 million and by June 2002
more than 41 million (Nasscom, 2002; Kathuria, 2000; World Bank, 1995). To
examine the tele-communications reforms in India since 1991 and to
investigate the emergence of the ‗new-economy‘ out of the expanded and
modern telecommunications network over the last twelve years. Finally, the
challenges ahead have been identified in order to remain competitive.

314
Section two presents a systematic analysis of the economic reform
measures in telecommunications industry. Section three provides an account
on the industry structure during the pre- and post-reform era, section four
covers the regulatory reform introduced since 1991, section five addresses
the emerging ‗new economy‘ sector and its challenges. Finally, a conclusion
has been drawn.
Economic Reform
The economic reform agenda in telecommunications has been
addressed in two policy documents produced in 1994 and 1999 popularly
known as: National Telecom Policy 1994 (NTP, 1994) and New Telecom
Policy 1999 (NTP, 1999). These policies are briefly presented below:
1. National Telecom Policy 1994
A major programme has been undertaken to expand and upgrade
India‘s telecom network since 1991. The programme includes: complete
freedom of telecom equipment manufacturing, privatisation of services, liberal
foreign investment and new regulation in technology imports. Simultaneously,
the government-managed Department of Telecommunications (DoT) has
been restructured to remove its monopoly status as the service provider. Most
value-added services, including cellular phones and radio pagers, which were
virtually non-existent in the pre-reform era, have grown at an unprecedented
rate (Hossain, 1998). The government programme was formalised on a
telecom policy statement called ―National Telecom Policy 1994‖ on 12 May
1994 (full record of this policy can be found in www.trai.gov.in/ntp1994.htm).
The major provisions the NTP94 have incorporated are:
• to allow new entrants to provide basic telephone services to
supplement DoT‘s service;
• to maintain DoT‘s status as sole provider of long distance services and
confirms that DoT will remain a government Department;

315
• to set targets for providing all villages with access to a telephone by the
end of 1997;
• to endorse the existing policy whereby the private sector will be the
main provider of value-added services;
• to encourage pilot projects which envisage inflow of new technology
and management techniques generally involves foreign investment;
and to indicate that the mechanism will be set up to protect consumer
interests and ensure fair competition.
What was the outcome of NTP94? Compared to its commitments and
provisions endorsed by 1994 statement, the outcome was less satisfactory.
Only a handful of the targets set by this policy agenda was achieved. –
―For example, as against providing one Public Call Office (PCO) per
500 urban Indian population and the telephone coverage of 576,490 villages
in India, the DoT has achieved an urban penetration of one PCO per 522 and
has been able to provide telephone services to only 310,000 villages.
However, the DoT also has provided 8.73 million telephone lines against the
eight-five year plan target of 7.5 million telephone lines.‖
Overall, the NTP94 was not sufficient to make the India‘s
telecommunications sector fully open and liberalised. The incumbent
monopoly (DoT) was indifferent in implementing the national telecom policy
effectively due to its lack of commitment and also due to the instability at the
Centre (frequent changes of governments) over 1994 and 1998. This paved
the way for designing a new policy framework for telecommunications which
was called the New Telecom Policy 1999 (NTP99) and was delivered by the
new government led by BJP coalitions.
2. The New Telecom Policy 1999
The New Telecom Policy 1999 (NTP99) was developed at the
backdrop of three major events witnessed by the Indian economy after the
reform process began in 1991. First, although NTP94 was a right step to bring
316
reform in the telecommunications industry, it failed to achieve a desired goal
until 1997.
―Overall, the NTP99 is a comprehensive and progressive telecom
policy framework. It addresses the outstanding issues of telecommunications
development and the challenges of modern telecommunications technology.
NTP 99 recognises the crucial role of private sector investment in the
development process of the sector and to bridge the much-needed financial
resources gap.‖
Among other things the NTP99 has endorsed policies under 5 policy
frameworks:
• Framework for Services Deployment
• Framework for Licensing of Telecom Services
• Framework for Restructuring of Telecom Organisations
• Framework for Further Liberalisation of Services
• Framework for Regulation.
Each of these policy frameworks will be discussed further in the
subsequent relevant sections of this paper.
3. Post-Reform Industry Structure
Under the Indian constitution, only the central government can legislate
on telecommunications. The central government has been the monopoly
provider of telecommunications services through the Department of
Telecommunications (DoT), which is under the jurisdiction of the central
government‘s Ministry of Communications.
3.1 Industry structure before reform
Before 1989, a Telecom Board with a director-general at the helm
steered the Board on behalf of the central government. The DoT corporatised
two of its operational wings in 1986. These are called Videsh Sanchar Nigam

317
Limited (VSNL), responsible for international operations and Mahanagar
Telephone Nigam Limited (MTNL), which has operational responsibility for
providing telephone services in metropolitan Delhi and Mumbai, which
comprise nearly a quarter of the total telecom network. The rest of the country
remained under the jurisdiction of the DoT. In May 1989, the Telecom Board
was replaced by a Telecommunications Commission with a much broader
mandate than the board. Telecommunications operations were divided into
five areas and headed by five full time members of the Commission. These
areas are: telecom policy, regulation, technical research and development,
design and manufacture of equipment, and provision of telecommunications
services. The Secretary of the DoT holds the position of Commission
Chairman.
Table 1 presents the industry structure before NTP94 was introduced.
Although the Indian economy embraced economic reform agenda in 1991, the
reform in telecommunications began with the design of the NTP94 statement.
By the end of March 1995, the country had 9.38 million telephone lines with
installed capacity of a further 10 million lines. The demand for telephone
sources over the last ten years has grown by almost 12.2 per cent with actual
growth in installation of 11.8 per cent. The total workforce in the industry stood
at 470,000 persons.
3.2 Industry structure after reform
Immediately after the announcement of NTP94, the
telecommunications industry in India came to terms with the on-going reform
process in the sector. All players in the sector, foreign and local private
investors and subscribers anticipated a major shake up of the industry after
this policy statement came into being. As shown in the previous section,
NTP94 was a half-hearted step on the part of the central government to bring
major reform in telecommunications in India. Eventually, the implementation
of this policy was not able to make major breakthrough in the growth of the
sector until the NTP99 came out and was regarded as a comprehensive
programme of telecommunications policy reform in India. This section
presents the industry structure and shape after the introduction of the NTP94.
318
Table 2 presents the performance for basic services since 1996. Fixed
or basic services have been provided by two major public carriers after
liberalisation in early 1990s. The DoT (now Bharat Shanchar Nigam Limited,
BSNL) has been covering all of India except two metros: Delhi and Mumbai.
BSNL‘s share has increased from 79 per cent to 86 per cent between Mar-97
and June-01 while the share for MTNL has dropped from 21 per cent to below
13 per cent of the total connections. This suggests that the basic services
have expanded all over India except in Delhi and Mumbai.
In the early years after liberalization, India restricted the number of
licenses awarded in basic services. The market was divided into separate
circles and the policy admitted one private operator in each to compete with
the incumbent BSNL. New entrants were allowed to offer intra-circle long
distance services, but the BSNL maintained its monopoly on inter-circle long
distance telephony. Recently, in the year 2001, the policy was changed to
allow unlimited entry into each circle for basic services and subsequent to the
bidding process 22 license agreements have been signed. As opposed to the
fixed license fee regime based on which licenses were awarded earlier, fresh
licenses have been issued on the basis of a one time entry fee and a
percentage of revenue share that is linked to the area of operation1. Table 3
presents the details of the new licenses issued.
In total, before liberalisation India‘s basic service comprised only 9.5
million, it has increased by almost 4.5 times to 42 million in 2003. By all
means, the growth of basic telecommunications services in India has been
phenomenal over the last five years. The prospect in the future is brighter with
the policies in place under NTP99.
This policy‘s framework for service deployment suggests the following
initiatives:
1 License fees is fixed as 12, 10 and 8 per cent of gross revenues for
Circles A, B and C respectively.

319
• Availability of basic telephone services on demand by year 2002
• Target of teledensity of 7 per cent by year 2005 and 15 per cent by
year 2010
• Completion of full rural telephone coverage by year 2002
• Target of rural teledensity of 4 per cent by year 2010
• Provision of Internet access in all Indian districts by year 2000
• Encouragement of sharing infrastructure facilities by all service
providers
• Expeditious clearances for right-of-way to all service providers
• Direct interconnectivity of telecom networks as far as possible
• Identification of some areas as special thrust areas for service
deployment
• Permission to use Ku-band satellite communications for long distance
data communications
• Acceptance of all recommendations of the national Informatics Task
Force in relation to ISPs.
The other growth area of the Indian telecommunications industry is the
cellular mobile market.
Table 4 presents a brief profile of this market. The number of cellular
subscribers in the country exceeded 10 million at the end of 2002 compared
to mere 0.2 million in 1996. In the year 2001, the compound annual growth
rate of subscribers was in excess of 90 per cent. Private participation in the
cellular market was introduced in 1994. Initially fourteen licences were
awarded, two in each of the four metros: Delhi, Mumbai, Chennai and
Kolkata. Non-metro areas (Circles A, B and C) are serviced by other private
service providers.
320
Introduction of private service providers in the mobile market has
revolutionised the industry over the last five years. The NTP-99 attempts to
create an environment to expand the subscriber base further in coming years.
It provides for public sector entities BSNL and MTNL to be the third operator
in each service area, while recently bidding for the fourth license resulted in
licenses being awarded to 17 more operators.
Table 5 provides details of the existing players circle wise. The overall
growth of basic services and mobile phone services are presented in
Table 6. In Delhi and Mumbai the growth in fixed line services was 21
per cent during this period while in the case of mobile services in four metros
the growth has been 71 per cent between 2000 and 2001. However, the all
India figures have been staggering for both the markets. The fixed line service
has been nearly doubled and the mobile services grew by almost 10 times.
This suggests that the telecom industry in India has been responding very
positively to the reform measures introduced in early 1990s and to the policies
incorporated in NTP 94 and NTP 99.
4. Regulatory Reform
India‘s economic reform in telecommunications goes hand in hand with
regulatory reform from the early 1990s. Telecommunications regulatory
reform in India can be divided into two categories: reform introduced under
the NTP94 and reform introduced under the NTP99. This section presents an
illustration on reform measures taking these two documents into
consideration.
4.1 Regulatory reform under NTP94
The regulatory reform began with introduction of an independent
regulatory agency called the ―Telecom Regulatory Authority of India (TRAI)‖ in
March 1997. NTP-94 had a provision to introduce such an independent entity
to regulate telecommunications in India. The need for such an authority was
felt due to on-going liberalisation and economic reform introduced to the

321
industry following the government‘s publication of NTP94. Among other
things, NTP94 has brought the following changes in the industry:
• New entry for basic telephone services will be permitted as duopolies
(that is, DoT and one other operator) in the twenty one ‗Circles‘ into
which the country has been divided;
• DoT will retain the long distance monopoly for five years after which
the decision would be reviewed; and
• Foreign ownership of telecom operators will be welcome up to 49 per
cent of equity (from World Bank, 1995: 104-5).
With all these changes in place an independent regulator for the
industry was overdue. The Telecom Regulatory Authority of India Act 1997
established the Telecom Regulatory Authority of India (TRAI) in January
1997, with a view to provide an effective regulatory framework and adequate
safeguards to ensure fair competition and protection of consumer interests.
To achieve the objectives of the TRAI Act, TRAI was given power to give
directions to service providers, make regulations, notify tariffs by Order, and
adjudicate disputes arising between government (in its role as service
provider) and any other service provider. Among all the powers and duties, its
authority and jurisdiction to settle disputes among the service providers has
been important. However, there was a ruling by Delhi High Court against the
TRAI about its power and jurisdiction in July 1998. The High Court ruled, ―it
was not mandatory for the Indian government to seek recommendations of
the TRAI prior to issuing licences for telecommunications services in the
country‖. The judgement affirmed the powers of the DoT, i.e. the government,
to issue licenses without recommendations from TRAI. It also clarified that
TRAI did not have the power to over-ride the license conditions. The High
Court concluded that ―the powers of the TRAI cannot be construed as a
precondition precedent to the exercise of any other powers by the DoT on
behalf of the government under the Indian Telegraph Act No.13 of 1885‖. With
this ruling in place the new and the independent telecom regulator in India
had a controversial and bumpy start. In addition, another High Court judgment
322
in January 2000 observed that the TRAI Act 1997 did not empower the
regulator to fix interconnection terms and conditions between service
providers and that TRAI had merely a policing function in this regard. This
meant that the Calling Party Pays (CPP) regime for cellular mobile that TRAI
sought to introduce in November 1999 that inter-alia specified explicit revenue
shares for calls from Basic to the cellular network could not be implemented.
Soon after this judgement the TRAI Act was amended and a new Act, the
TRAI (Amendment) Act 2000 was introduced. These episodes of conflict
between the incumbent and the regulator undermined the credibility of the
regulator during the initial years of telecom liberalisation in India. Prior to this,
DoT was responsible for the industry regulation as a part of government
operation. According to Selvarajah, ―overall, the TRAI has the powers and
functions of a typical telecom regulator‖. It appears that in practice the TRAI
faced major hurdles to function appropriately in the initial period due to some
High Court rulings sought by the DoT about the jurisdiction and obligations of
the TRAI. This has made TRAI less effective and has forced a process of
continuous transformation in the early years.
The next section provides a brief overview of the players in regulation
as it stands in India at present.
4.1.1 Players in Regulation
India‘s telecommunications sector is regulated by the Ministry of
Communications through three government bodies — the Telecom
Commission, the Department of Telecommunications, and the Telecom
Regulatory Authority of India. The Telecom Commission performs the
executive and policy-making function, the DoT is the policy-implementing
body while the TRAI performs the function of an independent regulator.
a) Department of Telecommunications, Ministry of Communications
The Department of Telecommunications, Ministry of Communications,
is the Authority in India that looks after the licensing and overall policy making
in India. Until recently, DoT was also the main service provider. The service
provider role has been separated from DoT, and is now functioning as a

323
corporate body, Bharat Sanchar Nigam Limited (BSNL). Two other
government corporations are also important service providers. Mahanagar
Telephone Nigam Limited (MTNL) operates in Mumbai and Delhi as a service
provider with license for, inter alia, basic service, cellular mobile and Internet
access. Videsh Sanchar Nigam Limited (VSNL) has a monopoly in the
international call segment and has a license for providing some other services
including the Internet. The government is a major shareholder in both MTNL
and VSNL, and has substantive control over the decisions of these service
providers. In fact, they may also end up competing with each other for the
same market. This has already started happening in certain cases, for
instance, with MTNL and VSNL for the Internet market. A competitive situation
would require greater autonomy for MTNL and VSNL.
(b) Telecom Regulatory Authority of India
On 24 January 2000, an Ordinance amended the TRAI Act 1997 and
altered a number of aspects. For example, the adjudicatory role of the TRAI
has been separated and has been provided to a Telecom Dispute Settlement
and Appellate Tribunal (TDSAT)
This Tribunal has been provided the powers to adjudicate any dispute
(i) between a licensor and a licensee;
(ii) between two or more service providers;
(iii) between a service provider and a group of consumers.
TDSAT has been given additional powers those it inherited from TRAI;
for example, it can settle disputes between licensor and licensee. Further, the
decisions of the Tribunal may be challenged only in the Supreme Court. The
remaining functions of TRAI have been better defined and increased; for
instance, with respect to powers relating specifically to interconnection
conditions. TRAI now has the power to ‗fix the terms and conditions of inter-
connectivity between the service providers‘ (TRAI (Amendment) Act 2000),
instead of ‗regulating arrangements between service providers of sharing
324
revenue from interconnection‘ (TRAI ACT 1997). The new legalisation
signaled an attempt to re-establish a credible regulator. The government
would be required to seek a recommendation from TRAI when issuing new
licenses. The adjudication of licensor-licensee disputes would be undertaken
by an independent tribunal specialised in telecom. In terms of interconnection
arrangements, TRAI was given the powers to override the provisions of
license agreements signed with DoT. However, while there has been an
increase in the powers of the Authority (other than dispute settlement), the
Ordinance has led to a weakening of the guarantee that was provided in the
Act with respect to the five year working period for the TRAI Chairman and
Members. This statutory guarantee was done away with by the Ordinance,
which provides for less stringent conditions for removal of any Authority
Member or Chairman. To that extent, the independence of the Authority has
been whittled down. More on TRAI is provided in the next section.
In its present form, the CCI Bill also envisages the dispute settlement
function to be performed by the Communications Dispute Settlement
Appellate Tribunal (CAT)
4.2. Regulatory reform under NTP 99
Since the regulatory outcome of the NTP94 has been disappointing,
the government proposed new regulatory policies in its NTP99 policy
statement.
The regulatory reform introduced by the NTP99 can be summarised as
follows:
• Reaffirm the commitment for strong and independent telecom regulator
• Arbitration powers to the regulator in settling disputes between the
government and other service providers
• Jurisdiction of licensing and policy making will, however, continue to
fall under the government
• Prohibition of the provision of voice services over the Internet Protocol
325
• Recognition of the need for changes in the existing telecom
legislations.
The opening up of the Internet sector set the background to NTP-99, is
a major attempt to plug the loopholes in the 1994 policy. Its enunciation of
policy objectives is itself a marked improvement. Provision of 'universal
service' (including unconnected rural areas, re-targeted for year 2002) is
sought to be balanced by the provision of sophisticated telecom services
capable of meeting needs of the country's economy. The latter objective is
further amplified to include 'Internet' access to all district head quarters
(DHQs) by 2000 and providing high speed data and multimedia capabilities to
all towns with a population of 200,000 and above by 2002. Apart from a target
average penetration of 7 per cent by year 2005 (and 15 per cent by 2010),
targets for rural 'tele-density' have been set to increase from the current level
of 0.4 per cent to 4 per cent during the same period.
To meet these teledensity targets, an estimated capital expenditure of
Rs. 4,000 billion for installing about 130 million lines will be required.
Recognizing the role of private investment, NTP-99 envisages multiple
operators in the market for various services.
The most important change has been a shift from the existing license
fee system to one based on a one-time entry fee combined with revenue
share payments.
NTP-99 allows DoT/MTNL to enter as third cellular mobile operators in
any service area if they wish to provide these services. To ensure a level
playing field, DoT and MTNL will have to pay license fee, but DoT‘s license
fee will be refunded because it has to meet the Universal Service Obligations.
It is worth noting that to the extent that the fee will be specifically refunded to
bear the cost of Universal Service Obligation (USO), this aspect should be
accounted for when calculating the USO levy and apportioning the revenues
from that levy.

326
5. The Challenges Ahead
The emergence of ‗new‘ economy as a separate identity in the Indian
economy is no doubt a huge boost for generating additional export revenues
to achieve a healthy current account balance. The sector, however, is not
immune from facing challenges in the future. In the present globalisation era,
there is always a threat of competition from other developing countries such
as China and South East Asian nations. In this section, an investigation on the
challenges has been attempted. Before identifying the challenges and the
weaknesses of the Indian economy against its competitors, let us first
summarise the strength gained by India so far.
• Telecommunications technology and expanding teledensity found to be
the major driver of the emerging ‗new‘ economy sector. Indian union and state
capital cities where the IT and ITE services industry is based have teledensity
of 14 per 100 against the all India density of only 3 per 100. The subscribers
for fixed line network increased by 8 folds since 1991, while the cellular
phones increased by 30 folds since 1997.
6. Conclusion
Telecommunications service in India is an example of a paradox of the
1990s. Despite the telecom policy and telecom regulation being controversial,
communication has been the fastest growing sector of the Indian economy.
There is still an opportunity to reform and simplify the regulatory framework
further and maintain the growth rates during the next decade as seen in the
past. What are the lessons from the Indian experience? First, the analysis of
the India telecom sector presents a picture of ―managed competition‖. While
the traditional public monopoly is coming to an end, effective competition has
been hard to achieve for a number of reasons. The incumbent with an
extensive network has retained market power. The number of networks that
have come up or are about to come up are limited because of the costs of
building the network. The availability of spectrum is a constraint in the market
especially for cellular mobile services. Given these circumstances, however,

327
the expansion of telecommunications services has been phenomenal over the
last decade.
Second, new market-based approaches to the supply of telecommuni-
cations services have been introduced in India and technological changes
have led to cost reduction and expanded scope of product choice. The
number of initiatives on the drawing board makes impressive reading and
present immense opportunity for the sector and thus for the economy. TRAI
has already issued consultation papers on Internet Telephony and
Interconnection and opening of international long distance (ILD) services to
private competition. These initiatives suggest a greater reliance on market
forces than before. As market-based approach to the provision of telecom
services has been adopted, the question to be addressed is whether there
should be more or less regulatory intervention.
Third, following the widespread adoption of market-based approaches
to the supply of telecommunications services, there is also a growing
consensus that regulators should not be involved in detailed ―management‖ of
the sector. Instead, the regulators‘ role is seen to involve maintenance of a
regulatory environment conducive to the efficient supply of
telecommunications services to the public. Also, while there is likely be an
increase in regulatory activity around the time of introduction of competition,
the level of regulatory intervention can be expected to reduce once
competitive markets are established. Regulation where none is justified can
distort or undermine competition.
Finally, under the given market-based approach and the current
regulatory framework in place, the telecommunications industry has
contributed to establish a ‗new‘ sector in the economy driven by the
IT/Software and IT enabled services. Within a short period of time, the ‗new‘
economy sector has substantially contributed to reversing the age old current
account problem and has created hundreds and thousands of jobs in newly
established domestic companies and in India based major MNCs. These
achievements, however, are not immune from any threat in the future. The
major challenges can be identified in terms of India‘s image problem to

328
outside world, gradual withdrawal of tax incentives in place, WTO intervention
on behalf of the other member nations and direct competition faced from East
and South East Asian nations.
Table 1: Basic telecom information for pre-reform period
Number of telephone lines as at 31 March 1995 9.38 million
Installed capacity of telephone lines 10.00 million
Demand for telephones (FY 1995) 12.50 million
Growth in telephone lines (FY 1985 to FY 1994) 11.8 per cent
Growth in telephone demand (FY 1985 to FY 1994) 12.2 per cent
Total workforce (telecom services) 470,000
Source: Hossain (1998) cited from Hossain and Chatterjee (1996)
Table 2:
Phone connections and share of main operators between
1996-97 & 1998-99 Operator Connections ('000) Share (%)
Mar-97 Jun-01 Mar-97 Jun-01
BSNL (all India) 11,530 28,484 79.29 86.01
MTNL (Mumbai, Delhi) 3,012 4,322 20.71 13.05
Bharti, (M.P.) - 122 - 0.37
Hughes, (Maharashtra). - 84 - 0.25
Tata, (A.P.) - 69 - 0.21
Reliance, (Gujarat) - 0.14 - 0.00
STL, (Rajasthan) - 13 - 0.04
HFCL (Punjab) - 24 - 0.07
All India 14,542 33,118 100.00 100.00
Source: Kathuria (2000) and Tele.net Volume 2 Issue No. 8 August 2001
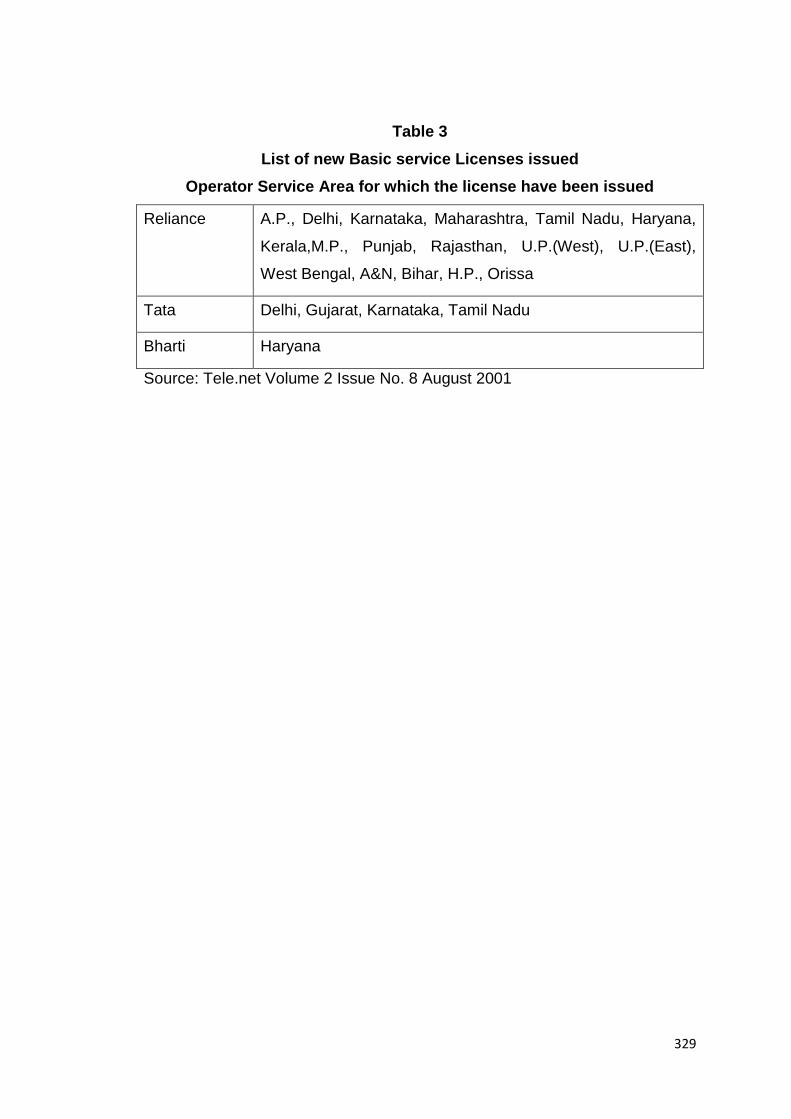
329
Table 3
List of new Basic service Licenses issued
Operator Service Area for which the license have been issued
Reliance A.P., Delhi, Karnataka, Maharashtra, Tamil Nadu, Haryana,
Kerala,M.P., Punjab, Rajasthan, U.P.(West), U.P.(East),
West Bengal, A&N, Bihar, H.P., Orissa
Tata Delhi, Gujarat, Karnataka, Tamil Nadu
Bharti Haryana
Source: Tele.net Volume 2 Issue No. 8 August 2001

330
Table 4
Mobile market share (%)
Region Mar-97 Mar-98 Mar-99 Mar-00 Mar-01 Aug-01
All
Metros
(Delhi,
Mumbai,
Chennai
and
Kolkata)
325,967
(69)
551,757
(-6)
519,543
(53)
795,931
(71)
1,362,592
(28)
1,750,789
Rest of
India
13,064
(2430)
330,559
(104)
675,903
(61)
1,088,380
(103)
2,214,503
(39)
3,071,398
All India 339,031
(160)
882,316
(35)
1,195,446
(58)
1,884,311
(90)
3,577,095
(35)
4,822,187
Note: Figures in parentheses show percentage of growth
Source: Kathuria (2000) and Tele.net Volume 3 Issue No. 1 January 2002

331
Table 5
List of Cellular Service Providers and their Area of Operation
Category City/Circle Operator1 Operator2 Operator3 Operator4
Metros Delhi Bharti Essar MTNL Batata
Mumbai BPL MNTL MTNL Bharti
Chennai RPG Skycell - HMTL
Calcutta Spice UMTL - Reliance
A' Circle
Maharashtra BPL Birla AT&T - Bharti
Gujarat Fascel Birla AT&T - Bharti
A.P. Tata Bharti - HMTL
Karnatka Bharti Modicom - HMTL
T.N. BPL Aircel - Bharti
B' Circle
Kerala Escotel BPL - Bharti
Punjab Modicom - - Escotel
Haryana Escotel ADL - Bharti
U.P.(W) Escotel - - Bharti
U.P.(E) ADL Koshika - Escotel
Rajasthan ADL Hexacom - Escotel
M.P. RPG Reliance - Bharti
W.B. Reliance - - -
C' Circle
H.P. Bharti Reliance - Escotel
Bihar Reliance - BSNL -
Orissa Reliance - - -
Assam Reliance - - -
N.E. Reliance - - -
Source: Tele.net Volume 3 Issue No. 1 January 2002
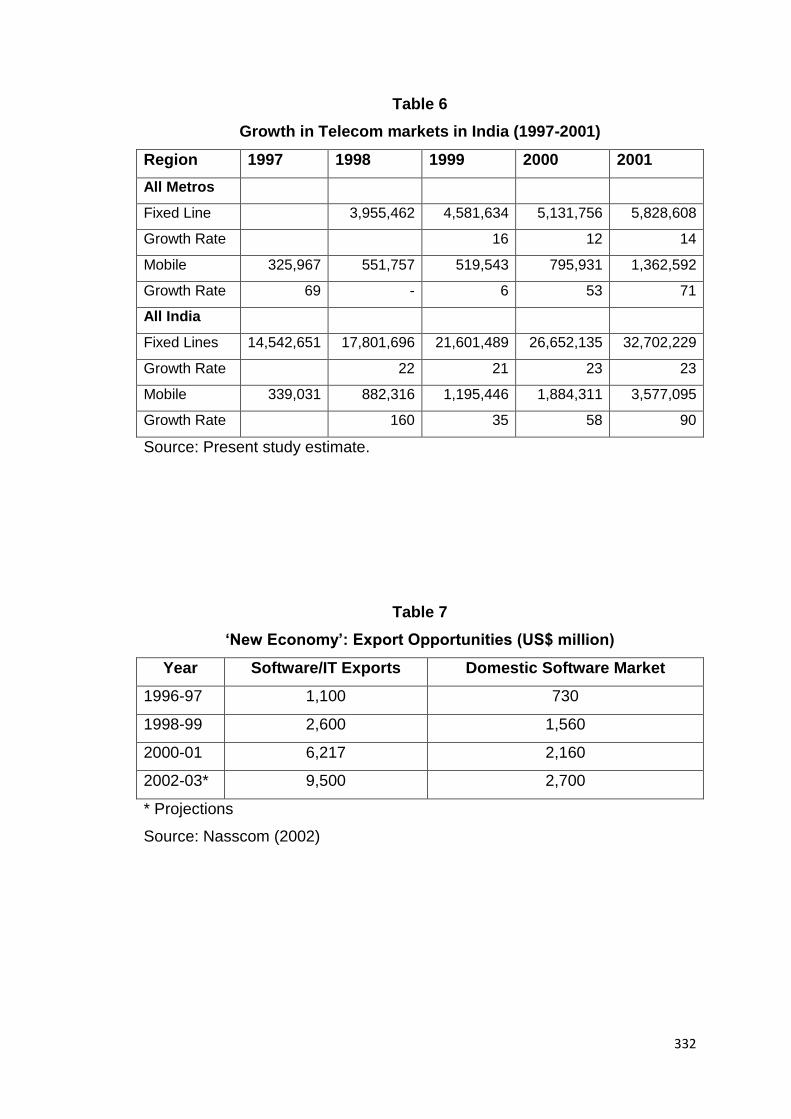
332
Table 6
Growth in Telecom markets in India (1997-2001)
Region 1997 1998 1999 2000 2001
All Metros
Fixed Line 3,955,462 4,581,634 5,131,756 5,828,608
Growth Rate 16 12 14
Mobile 325,967 551,757 519,543 795,931 1,362,592
Growth Rate 69 - 6 53 71
All India
Fixed Lines 14,542,651 17,801,696 21,601,489 26,652,135 32,702,229
Growth Rate 22 21 23 23
Mobile 339,031 882,316 1,195,446 1,884,311 3,577,095
Growth Rate 160 35 58 90
Source: Present study estimate.
Table 7
‗New Economy‘: Export Opportunities (US$ million)
Year Software/IT Exports Domestic Software Market
1996-97 1,100 730
1998-99 2,600 1,560
2000-01 6,217 2,160
2002-03* 9,500 2,700
* Projections
Source: Nasscom (2002)
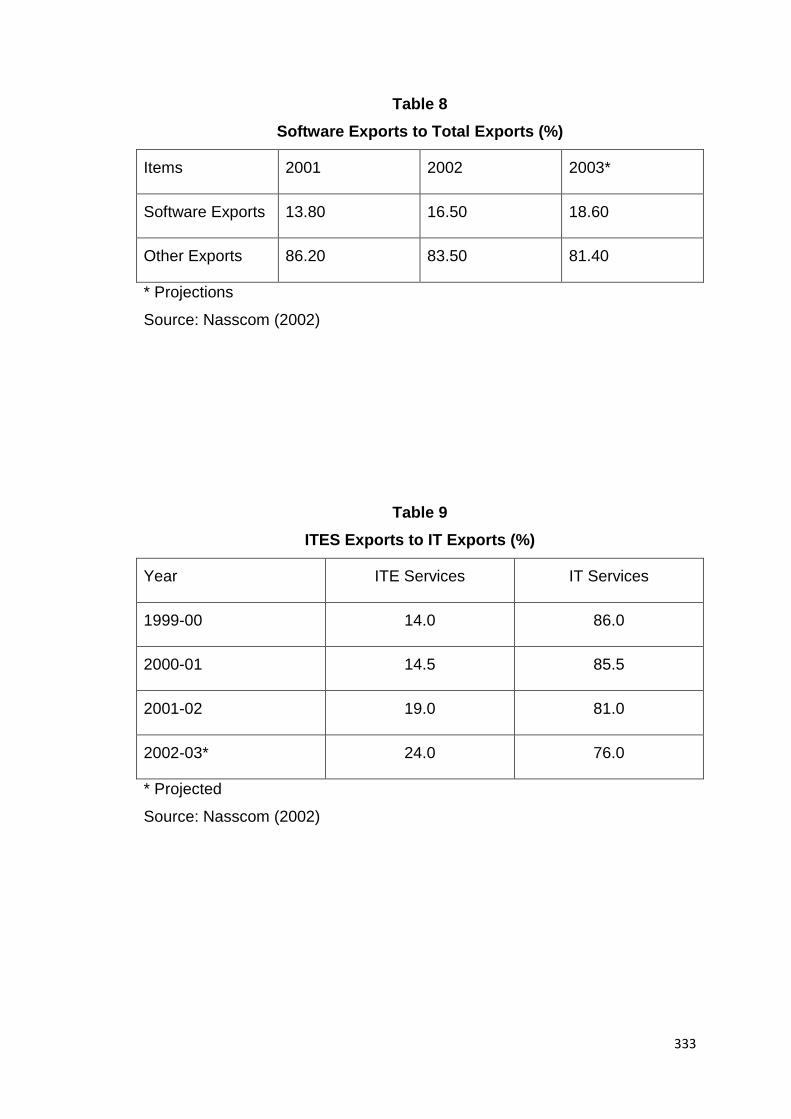
333
Table 8
Software Exports to Total Exports (%)
Items 2001 2002 2003*
Software Exports 13.80 16.50 18.60
Other Exports 86.20 83.50 81.40
* Projections
Source: Nasscom (2002)
Table 9
ITES Exports to IT Exports (%)
Year ITE Services IT Services
1999-00 14.0 86.0
2000-01 14.5 85.5
2001-02 19.0 81.0
2002-03* 24.0 76.0
* Projected
Source: Nasscom (2002)

334
Table 10
Key Segments of Global ITES/BPO
Item Contact/
Back
Office
Transcri-
ption
Content
Other
Call
Centre
Operations
Translation
Develop-
ment
Services
(1) (2) (3) (4) (5)
Global
Market
*Market
Size
($ million,
2002)
8,600 2,000 425 2,200 250
Indian
Market
Size ($ml,
2002)
380
(4.5)
600 (30) 32 (7.5) 440 (20) 43 (17)
Minimum
Invest.
$3,000
to
$1-2.5ml
$1-2.5ml $0.5ml $10ml $10-15ml
Source: Nasscom‘s Handbook (2002)
References
Department of Telecommunications (1994). The National Telecom Policy
1994, Government of India, New Delhi.
Department of Telecommunications (1999). The New Telecom Policy 1999,
Government of India, New Delhi. www.trai.gov.in
International Telecommunications Union (1999). Trends in
Telecommunications

335
Kathuria, R. ( 2000). ‗Telecom policy reforms in India‘, Global Business
Review, 1:2:
Telecom Regulatory Authority of India Act 1997. No. 24 of 1997, New Delhi
Telecom Regulatory Authority of India (1998). ―Consultation Paper on
Framework and Proposals for Telecom Pricing.‖ , New Delhi.
Telecom Regulatory Authority of India (1999). ―Consultation Paper on
Introduction of Competition in Domestic Long Distance Communications.‖,
New Delhi.
The Telecom Regulatory Authority of India (Amendment) Ordinance (2000).
Tele.net Volume 3 Issue No. 1 January 2002
Related Documents


