Chapter 7 and 8 Review Name___________________________________Date____________________Period_________________ Write complete answers, using complete sentences where necessary. Show your work when possible. MULTIPLE CHOICE. Choose the one alternative that best completes the statement or answers the question. Suppose you were to collect data for the pair of given variables in order to make a scatterplot. Determine for each variable if it is the explanatory variable, the response variable, or whether it could be both. 1) Hot chocolate sales , heater sales 1) A) Hot chocolate sales : explanatory Heater sales : both B) Hot chocolate sales : explanatory Heater sales : response C) Hot chocolate sales : both Heater sales : both D) Hot chocolate sales : both Heater sales : explanatory E) Hot chocolate sales : response Heater sales : explanatory 2) Teacher: weekly salary , teacher: years of experience 2) A) Teacher: weekly salary : explanatory Teacher: years of experience : both B) Teacher: weekly salary : both Teacher: years of experience : explanatory C) Teacher: weekly salary : explanatory Teacher: years of experience : response D) Teacher: weekly salary : response Teacher: years of experience : explanatory E) Teacher: weekly salary : both Teacher: years of experience : both Suppose you are to form a scatterplot by collecting data for the given pair of variables. Determine the likely direction, form, and strength. 3) Gallons remaining in tank , miles driven since filling up 3) A) Negative, nonlinear, moderate B) Negative, straight, moderate C) Positive, nonlinear, strong D) Negative, nonlinear, strong E) Positive, straight, moderate 4) Student: high grade point average , student: studying consistency 4) A) Negative, straight, moderate B) Negative, nonlinear, moderate C) Positive, nonlinear, moderate D) Positive, straight, moderate E) Positive, no form, strong 1

Welcome message from author
This document is posted to help you gain knowledge. Please leave a comment to let me know what you think about it! Share it to your friends and learn new things together.
Transcript
Chapter 7 and 8 Review
Name___________________________________Date____________________Period_________________
Write complete answers, using complete sentences where necessary. Show your work whenpossible.MULTIPLE CHOICE. Choose the one alternative that best completes the statement or answers the question.
Suppose you were to collect data for the pair of given variables in order to make a scatterplot. Determine for eachvariable if it is the explanatory variable, the response variable, or whether it could be both.
1) Hot chocolate sales, heater sales 1)A) Hot chocolate sales: explanatory
Heater sales: bothB) Hot chocolate sales: explanatory
Heater sales: responseC) Hot chocolate sales: both
Heater sales: bothD) Hot chocolate sales: both
Heater sales: explanatoryE) Hot chocolate sales: response
Heater sales: explanatory
2) Teacher: weekly salary, teacher: years of experience 2)A) Teacher: weekly salary: explanatory
Teacher: years of experience: bothB) Teacher: weekly salary: both
Teacher: years of experience: explanatoryC) Teacher: weekly salary: explanatory
Teacher: years of experience: responseD) Teacher: weekly salary: response
Teacher: years of experience: explanatoryE) Teacher: weekly salary: both
Teacher: years of experience: both
Suppose you are to form a scatterplot by collecting data for the given pair of variables. Determine the likely direction,form, and strength.
3) Gallons remaining in tank, miles driven since filling up 3)A) Negative, nonlinear, moderateB) Negative, straight, moderateC) Positive, nonlinear, strongD) Negative, nonlinear, strongE) Positive, straight, moderate
4) Student: high grade point average, student: studying consistency 4)A) Negative, straight, moderateB) Negative, nonlinear, moderateC) Positive, nonlinear, moderateD) Positive, straight, moderateE) Positive, no form, strong
1

Determine whether the scatterplot shows little or no association, a negative association, a positive association, a linearassociation, a moderately strong association, or a very strong association (multiple associations are possible).
5) 5)
A) Negative association, moderately strong associationB) Negative association, linear associationC) Linear association, moderately strong associationD) Linear association, very strong associationE) Negative association, linear association, very strong association
6) 6)
A) Positive association, moderately strong associationB) Moderately strong associationC) Little or no associationD) Negative association, linear associationE) Negative association, moderately strong association
2

SHORT ANSWER. Write the word or phrase that best completes each statement or answers the question.
Draw the specified histogram.7) A survey was conducted in 26 counties to determine the percentage of teenagers who had
used marijuana and other drugs. Data are displayed in the following scatterplot. Make ahistogram of the other drugs.
7)
8) Data collected from 20 students in Statistics classes included their heights (in inches) andweights (in pounds), and are displayed in the following scatterplot. Make a histogram ofthe weights of the children.
8)
3

MULTIPLE CHOICE. Choose the one alternative that best completes the statement or answers the question.
Several scatterplots are given with calculated correlations. Which is which?9) 1) 2)
3) 4)
a) -0.712, b) 0.001, c) 0.061, d) 0.916
9)
A) 1a, 2b, 3c, 4dB) 1b, 2c, 3a, 4dC) 1d, 2a, 3b, 4cD) 1c, 2a, 3d, 4cE) 1b, 2c, 3d, 4a
4
10) 1) 2)
3) 4)
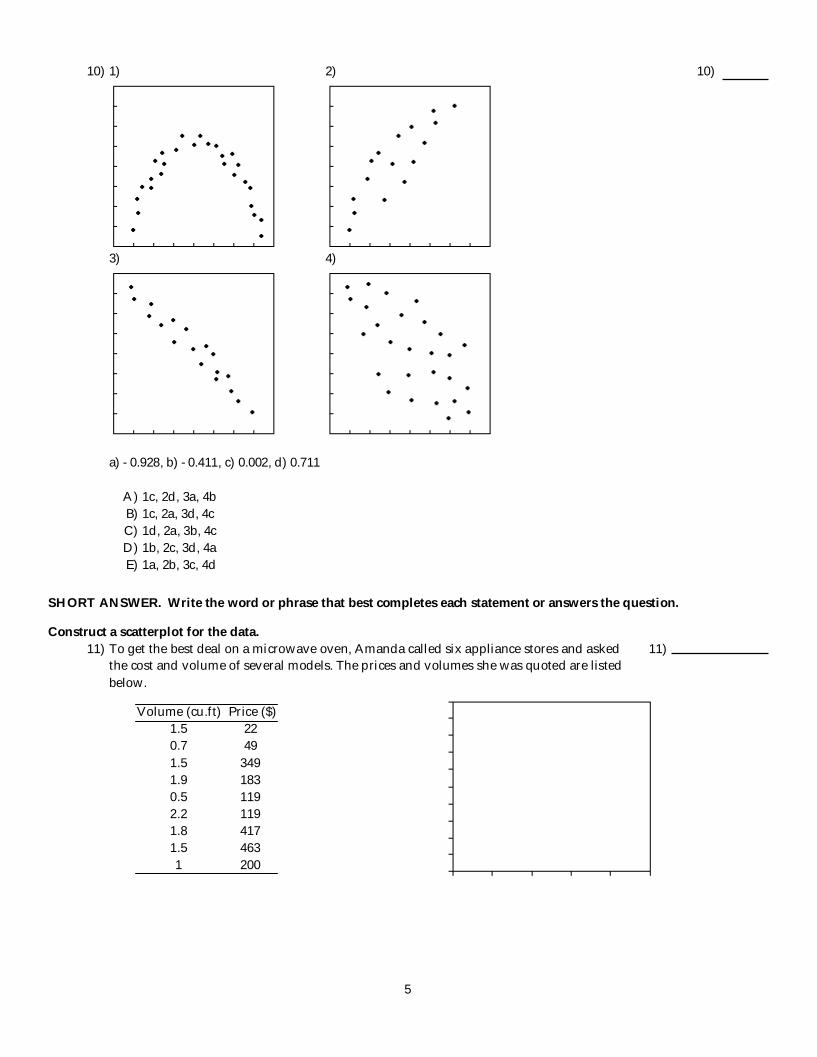
a) -0.928, b) -0.411, c) 0.002, d) 0.711
10)
A) 1c, 2d, 3a, 4bB) 1c, 2a, 3d, 4cC) 1d, 2a, 3b, 4cD) 1b, 2c, 3d, 4aE) 1a, 2b, 3c, 4d
SHORT ANSWER. Write the word or phrase that best completes each statement or answers the question.
Construct a scatterplot for the data.11) To get the best deal on a microwave oven, Amanda called six appliance stores and asked
the cost and volume of several models. The prices and volumes she was quoted are listedbelow.
Volume (cu.ft) Price ($)1.5 220.7 491.5 3491.9 1830.5 1192.2 1191.8 4171.5 4631 200
11)
5

12) The table contains the weights (in pounds) and heights (in inches) of 9 randomly selectedadults.
Weight (lb) Height (in.)145 68145 65125 60130 62128 70130 65155 75150 72135 68
12)
MULTIPLE CHOICE. Choose the one alternative that best completes the statement or answers the question.
Find the correlation.13) The paired data below consist of the height of children (in inches) and their reading scores.
Height (in.) Reading Scores46.75 62.951.25 67.948.75 64.952.25 71.952.75 72.954.25 75.947.75 64.955.25 76.9
13)
A) 0.943 B) 0.983 C) 0.963 D) 0.985 E) 0.981
14) A study was conducted to compare the average time spent in the lab each week versus coursegrade for computer students. The results are recorded in the table below.
Number of hours spent in lab Grade (percent)10 9611 5116 62 9 58 7 8915 8116 4610 51
14)
A) 0.017 B) 0.462 C) 0.371 D) -0.335 E) -0.284
6

Solve the problem.15) A shop owner tries to predict heater sales by displaying the sales of hot chocolate and heaters on
the following scatterplot. Does the scatterplot of hot chocolate sales and heater sales indicate that itis appropriate to calculate the correlation?
15)
A) Yes: the direction is positive.B) No: the relation must be linear.C) Yes: the relation is linear.D) Yes: the relation is strong.E) Yes: the two variables are quantitative.
16) A science instructor assigns a group of students to investigate the relationship between the pH ofthe water of a river and its water's hardness (measured in grains). Some students wrote theseconclusions: "there was a very strong correlation of 1.47 between pH of the water and water'shardness." Is the calculation of the correlation appropriate?
16)
A) No: there is little or no association.B) No: correlation must be equal to 1.C) Yes: correlation can be greater than 1.D) No: correlation cannot be greater than 1.E) Yes: the pH and the hardness of the water are data collected from the same river.
7

17) Soda is often considered unhealthy because its content is high in both caffeine and refined sugar.But are the two related? Caffeine and refined sugar contents (in milligrams) of 12 ounces of severalbrands of soda are shown on the following scatterplot. The correlation between caffeine andrefined sugar is 0.145. Describe the association.
17)
A) Weak linear relation in a positive directionB) Weak curved relation in a positive directionC) Strong linear relation in a positive directionD) Weak nonlinear relation in a positive directionE) No evidence of relation
18) Soda is often considered unhealthy because its content is high in both caffeine and refined sugar.But are the two related? Caffeine and refined sugar contents (in milligrams) of 12 ounces of severalbrands of soda are shown on the following scatterplot. The correlation between caffeine andrefined sugar is 0.155. Describe the association.
18)
A) No evidence of relationB) Weak curved relation in a positive directionC) Weak nonlinear relation in a positive directionD) Strong linear relation in a positive directionE) Weak linear relation in a positive direction
8
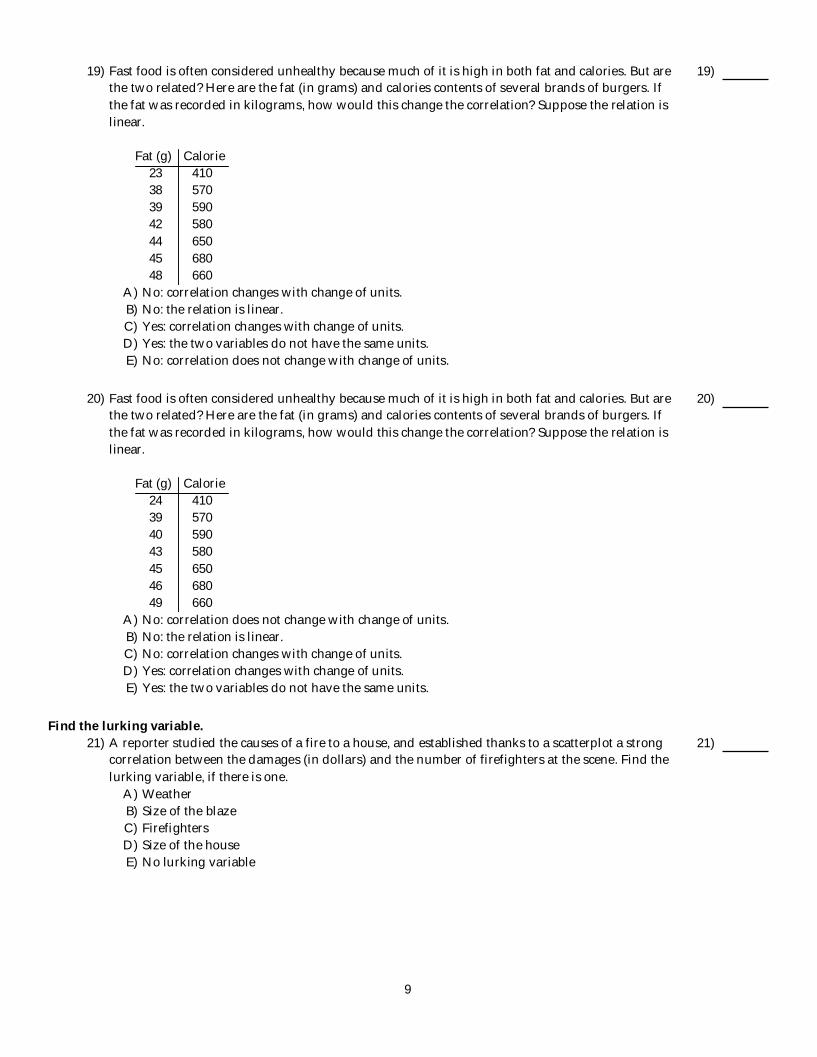
19) Fast food is often considered unhealthy because much of it is high in both fat and calories. But arethe two related? Here are the fat (in grams) and calories contents of several brands of burgers. Ifthe fat was recorded in kilograms, how would this change the correlation? Suppose the relation islinear.
Fat (g) Calorie23 41038 57039 59042 58044 65045 68048 660
19)
A) No: correlation changes with change of units.B) No: the relation is linear.C) Yes: correlation changes with change of units.D) Yes: the two variables do not have the same units.E) No: correlation does not change with change of units.
20) Fast food is often considered unhealthy because much of it is high in both fat and calories. But arethe two related? Here are the fat (in grams) and calories contents of several brands of burgers. Ifthe fat was recorded in kilograms, how would this change the correlation? Suppose the relation islinear.
Fat (g) Calorie24 41039 57040 59043 58045 65046 68049 660
20)
A) No: correlation does not change with change of units.B) No: the relation is linear.C) No: correlation changes with change of units.D) Yes: correlation changes with change of units.E) Yes: the two variables do not have the same units.
Find the lurking variable.21) A reporter studied the causes of a fire to a house, and established thanks to a scatterplot a strong
correlation between the damages (in dollars) and the number of firefighters at the scene. Find thelurking variable, if there is one.
21)
A) WeatherB) Size of the blazeC) FirefightersD) Size of the houseE) No lurking variable
9

22) A teacher studied students' grades and established with a scatterplot a strong correlation betweenSAT scores and college grades. Find the lurking variable, if there is one.
22)
A) CollegeB) High schoolC) AttendanceD) IQE) No lurking variable
Fill in the missing information.
23)^
^
_ x sx
_ y sy r y = b0 + b1x
2.1 1.2 ? 120 ? y = -120 + 60x
23)
A) y = -117.9; r = 0.50B) y = -48; r = 0.02C) y = 6; r = 0.60D) y = -246; r = 0.50E) y = 126; r = -0.60
24)^
^
_ x sx
_ y sy r y = b0 + b1x
? ? 20 3 -0.6 y = 30 - 4x
24)
A) x = 12.5; sx = 0.90
B) x = 10; sx = 1.80
C) x = -50; sx = 12.50
D) x = 2.5; sx = 0.45
E) x = 50; sx = -15.00
Tell what the residual plot indicates about the appropriateness of the linear model that was fit to the data.25) 25)
A) Model is appropriate.B) Model is not appropriate. The relationship is nonlinear.C) Model may not be appropriate. The spread is changing.
10

26) 26)
A) Model is appropriate.B) Model is not appropriate. The relationship is nonlinear.C) Model may not be appropriate. The spread is changing.
Answer the question appropriately.27) If you create a regression model for predicting the weight of a motorcycle (in pounds) from its
length (in feet), is the slope most likely to be 0.8, 8, 80, 800, or 8000?27)
A) 800 B) 8000 C) 80 D) 8 E) 0.8
28) Exercise physiologists are investigating the relationship between lean body mass (in kilograms)and the resting metabolic rate (in calories per day) in sedentary males.
Predictor Coef StDev T PConstant 264.0 276.9 0.95 0.363Mass 22.563 6.360 3.55 0.005
S = 144.9 R-Sq = 55.7% R-Sq(adj) = 51.3%
Bases on the computer output above, which of the following is the best interpretation of the valueof the slope of the regression line?
28)
A) For each additional kilogram of lean body mass, the resting metabolic rate increases onaverage by 144.9 calroies per day.
B) For each additional kilogram of lean body mass, the resting metabolic rate increases onaverage by 264.0 calories per day.
C) For each additional kilogram of lean body mass, the resting metabolic rate increases onaverage by 22.563 calories per day.
D) For each additional calorie per day for resting metabolic rate, the lean body mass increaseson average by 264.0 kilograms.
E) For each additional calorie per day for the resting metabolic rate, the lean body massincreases on average by 22.563 liograms.
29) The relationship between the number of games won by a minor league baseball team and theaverage attendance at their home games is analyzed. A regression to predict the averageattendance from the number of games won has an R2 = 29.9%. The residuals plot indicated that alinear model is appropriate. What is the correlation between the average attendance and thenumber of games won.
29)
A) 0.299 B) 0.837 C) 0.089 D) 0.701 E) 0.547
11
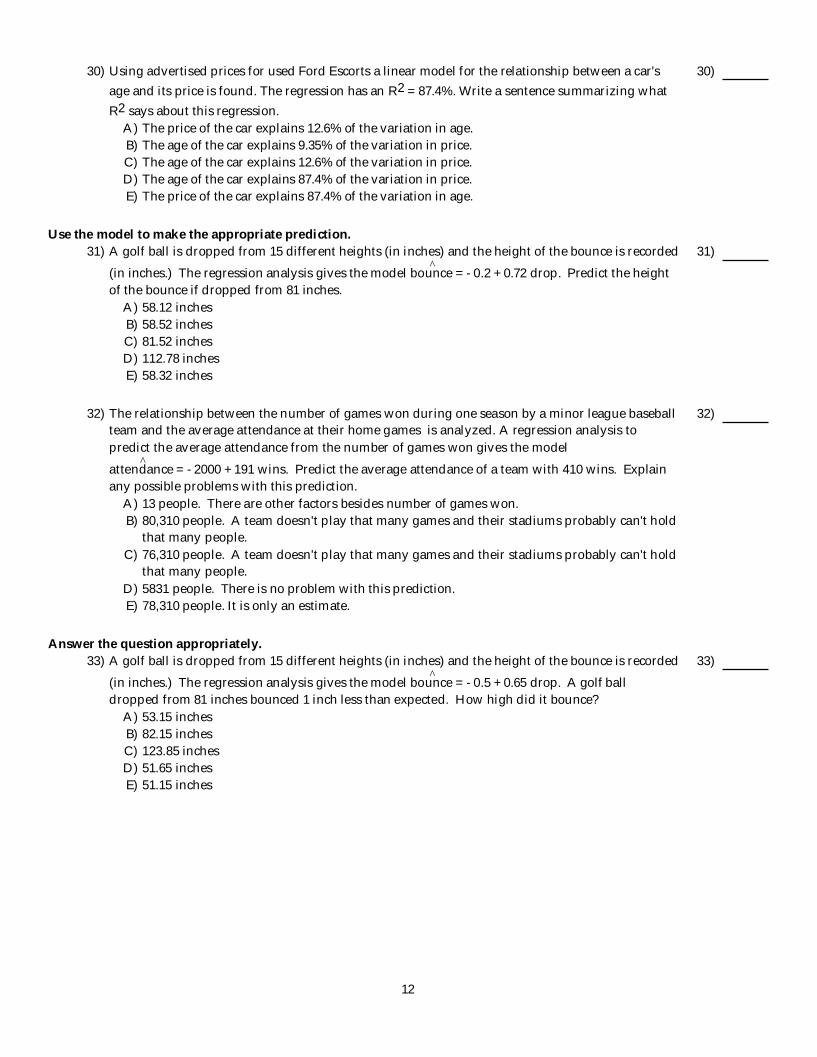
30) Using advertised prices for used Ford Escorts a linear model for the relationship between a car'sage and its price is found. The regression has an R2 = 87.4%. Write a sentence summarizing whatR2 says about this regression.
30)
A) The price of the car explains 12.6% of the variation in age.B) The age of the car explains 9.35% of the variation in price.C) The age of the car explains 12.6% of the variation in price.D) The age of the car explains 87.4% of the variation in price.E) The price of the car explains 87.4% of the variation in age.
Use the model to make the appropriate prediction.31)
^A golf ball is dropped from 15 different heights (in inches) and the height of the bounce is recorded
(in inches.) The regression analysis gives the model bounce = -0.2 + 0.72 drop. Predict the heightof the bounce if dropped from 81 inches.
31)
A) 58.12 inchesB) 58.52 inchesC) 81.52 inchesD) 112.78 inchesE) 58.32 inches
32)
^
The relationship between the number of games won during one season by a minor league baseballteam and the average attendance at their home games is analyzed. A regression analysis topredict the average attendance from the number of games won gives the model
attendance = -2000 + 191 wins. Predict the average attendance of a team with 410 wins. Explainany possible problems with this prediction.
32)
A) 13 people. There are other factors besides number of games won.B) 80,310 people. A team doesn't play that many games and their stadiums probably can't hold
that many people.C) 76,310 people. A team doesn't play that many games and their stadiums probably can't hold
that many people.D) 5831 people. There is no problem with this prediction.E) 78,310 people. It is only an estimate.
Answer the question appropriately.33)
^A golf ball is dropped from 15 different heights (in inches) and the height of the bounce is recorded
(in inches.) The regression analysis gives the model bounce = -0.5 + 0.65 drop. A golf balldropped from 81 inches bounced 1 inch less than expected. How high did it bounce?
33)
A) 53.15 inchesB) 82.15 inchesC) 123.85 inchesD) 51.65 inchesE) 51.15 inches
12

34)^
A golf ball is dropped from 15 different heights (in inches) and the height of the bounce is recorded
(in inches.) The regression analysis gives the model bounce = -0.5 + 0.66 drop. A golf ballcompany is trying to show that its new ball will increase your driving distance. If the new ball isdropped from several heights would the company rather see positive or negative residuals.Explain.
34)
A) Positive. This would mean the ball is bouncing more than expected and you would morelikely be able to hit it longer.
B) Neither. The ball should bounce the same as expected otherwise it wasn't manufacturedproperly.
C) Negative. The ball isn't bouncing as high as expected so you would more likely be able to hitit longer.
D) Negative. This would mean the ball is bouncing more than expected and you would morelikely be able to hit it longer.
E) Positive. This would mean the ball is being dropped from higher distances so you wouldmore likely be able to hit it longer.
Explain what is wrong with each interpretation. Assume calculations are done correctly.35) A sociology student does a study to determine whether people who exercise live longer. He claims
that someone who exercises 7 days a week will live 15 years longer than someone who doesn'texercise at all.
35)
A) Predictions based on a regression line are for average values of y for a given x. The actual lifeexpectancy will vary around the prediction.
B) Predictions based on a regression line are for average values of x and y. The actual averagelife expectancy changes every year so an accurate prediction is impossible.
C) A linear model is inappropriate for sociology studies.D) There is nothing wrong with the interpretation.E) The R2 has to be greater than 90% to make a statement like this.
36) A sociology student does a study to determine whether people who exercise live longer. He claimsthat someone who exercises 7 days a week will live 15 years longer than someone who doesn'texercise at all.
36)
A) The R2 has to be greater than 90% to make a statement like this.B) There is nothing wrong with the interpretation.C) Predictions based on a regression line are for average values of y for a given x. The actual life
expectancy will vary around the prediction.D) Predictions based on a regression line are for average values of x and y. The actual average
life expectancy changes every year so an accurate prediction is impossible.E) A linear model is inappropriate for sociology studies.
13

Use the given data to find the equation of the regression line. Round to 3 significant digits, if necessary.37) Ten students in a tutor program were randomly selected. Their grade point averages (GPAs) when
they entered the program were less than 2.5. The following data were obtained regarding theirGPAs on entering the program versus their current GPAs.
Entering GPA (E) Current GPA (C)2.5 2.61.8 2.12.3 2.51.6 1.61.5 2.02.0 2.42.1 2.22.4 2.71.9 2.32.1 2.3
37)
A)^C = 2.51 + 0.529E
B)^C = 0.873 + 0.627E
C)^C = 0.0065 + 0.879E
D)^C = 0.711 + 0.346E
E)^C = 0.527 + 0.873E
38) Ten students in a tutor program were randomly selected. Their grade point averages (GPAs) whenthey entered the program were less than 2.5. The following data were obtained regarding theirGPAs on entering the program versus their current GPAs.
Entering GPA (E) Current GPA (C)2.5 2.61.8 2.12.3 2.51.6 1.61.5 2.02.0 2.42.1 2.22.4 2.71.9 2.32.1 2.3
38)
A)^C = 2.51 + 0.529E
B)^C = 0.711 + 0.346E
C)^C = 0.527 + 0.873E
D)^C = 0.0065 + 0.879E
E)^C = 0.873 + 0.627E
Answer the question appropriately.39) Residuals are . . . 39)
A) the difference between observed responses and values predicted by the model.B) variation in the data that is explained by the model.C) data collected from individuals that is not consistent with the rest of the group.D) possible models not explored by the researcher.E) none of these.
14
Related Documents


