Chapter 6: Measuring and Managing Customer Relationships Chapter 6 Measuring and Managing Customer Relationships QUESTIONS 6-1 Nonfinancial measures such as customer satisfaction and customer loyalty are important in managing relationships with customers, but an excessive focus on improving customer performance with only these metrics can lead to deteriorating financial performance. To balance the pressure to meet and exceed customer expectations, companies should also be measuring the cost to serve each customer and the profits earned, customer by customer. 6-2 Examples of differences between customers who have high and low costs-to-serve may be drawn from the chapter’s Exhibit 6-1, part of which appears below. High Cost-to-Serve Customers Low Cost-to-Serve Customers • Order custom products • Order standard products • Small order quantities • Large order quantities • Customized delivery • Standard delivery • Manual processing; high order error rates • Electronic processing (EDI) with zero defects • Large amounts of pre- • Little to no pre- – 196 –

Welcome message from author
This document is posted to help you gain knowledge. Please leave a comment to let me know what you think about it! Share it to your friends and learn new things together.
Transcript

Chapter 6: Measuring and Managing Customer Relationships
Chapter 6Measuring and Managing Customer RelationshipsQUESTIONS
6-1 Nonfinancial measures such as customer satisfactionand customer loyalty are important in managingrelationships with customers, but an excessive focuson improving customer performance with only thesemetrics can lead to deteriorating financialperformance. To balance the pressure to meet andexceed customer expectations, companies should alsobe measuring the cost to serve each customer and theprofits earned, customer by customer.
6-2 Examples of differences between customers who havehigh and low costs-to-serve may be drawn from thechapter’s Exhibit 6-1, part of which appears below.
High Cost-to-Serve Customers Low Cost-to-Serve Customers• Order custom products • Order standard
products• Small order quantities • Large order
quantities• Customized delivery • Standard delivery• Manual processing;
high order error rates• Electronic
processing (EDI) with zero defects
• Large amounts of pre- • Little to no pre-
– 196 –
Atkinson, Solution Manual t/a Management Accounting, 6E
sales support (marketing, technical,and sales resources)
sales support (standard pricing and ordering)
• Large amounts of post-sales support (installation, training, warranty, field service)
• No post-sales support
• Pay slowly (have high accounts receivable from customer)
• Pay on time (low accounts receivable)
6-3 Companies should not necessarily avoid high cost-to-serve customers. The high cost of serving suchcustomers can be caused by their unpredictable orderpatterns, small order quantities for customizedproducts, nonstandard logistics and deliveryrequirements, and large demands on technical andsales personnel. Activity-based pricing may be usedto ensure that companies charge prices that are highenough to cover the high costs of serving suchcustomers. Customers may, in response, change theirbehavior to become lower cost-to-serve customers.Companies may also improve the process used toproduce, sell, deliver, and service customers inorder to improve customer profitability.
6-4 The 80-20 rule as applied to sales revenues refers
to the common finding that when companies rank products and customers from the highest sales volume to the lowest, they generally find that their top-selling 20% of products or customers generate about 80% of total sales.
6-5 The typical shape of a graph of cumulative profits
– 197 –

Chapter 6: Measuring and Managing Customer Relationships
versus percentage of customers ranked from most profitable to least profitable is a “whale curve,” inwhich the most profitable 20% of customers generate about 180% of total profits; this is the peak, or hump of the whale above sea level. The middle 60% of customers approximately break even, and the least profitable 20% of customers lose about 80% of total profits, leaving the company with its 100% of total profits (“sea level” in the whale curve represents the company’s actual reported profits). The hump (or maximum height) of a cumulative profitability curve generally hits 150% to 250% of total profits, and this height is usually achieved by the most profitable 20% to 40% of customers.
6-6 Service companies, even more so than manufacturing companies, must focus on customer costs and profitability sales because the variation in demand for organizational resources is much more customer driven than in manufacturing organizations. A manufacturing company producing standard products cancalculate the cost of producing the products without regard to how their customers use them. In this sense, the manufacturing costs are customer independent.Of course, the costs of marketing, selling, order handling, delivery, and service of the products mightbe customer specific. For service companies, in contrast, customer behavior determines the quantity of demands for organizational resources that produce and deliver the service to customers.
6-7 Consider customers who maintain checking accounts ata bank. One customer may maintain a high cash balancein his checking account; make very few deposits, withdrawals, balance inquiries, or service requests; and use only electronic channels (i.e., automatic
– 198 –
Atkinson, Solution Manual t/a Management Accounting, 6E
teller machines and the Internet). Another customer may manage her checking account balance very closely,keeping only the minimum amount on hand, and use her account heavily by making many small withdrawals and deposits via manual transactions with bank tellers. The consequence of the customers’ very different use of the bank’s resources is that the second customer is much more costly to serve than the first customer.
6-8 The four broad groups of actions that managers mightuse to transform unprofitable customers into profitable ones are: Improve the processes used to produce, sell,
deliver, and service the customer. Deploy menu-based pricing to allow the customer
to select the features and services it wishes to receive and pay for.
Enhance the customer relationship to improve margins and lower the cost to serve that customer.
Use more discipline in granting discounts and allowances.
6-9 A pricing waterfall chart depicts the multiple revenue leaks from list price caused by special allowances and discounts granted to obtain the order and build customer loyalty.
6-10 Salespersons’ incentives or compensation plans that set minimum quotas and commissions based on sales revenue, and tie bonuses and rewards to achieving sales revenues above a stretch target contribute to unprofitable customer relationships. Such arrangements encourage salespeople to close
– 199 –

Chapter 6: Measuring and Managing Customer Relationships
deals and generate revenues without regard to the cost of fulfilling the special arrangements negotiated in the deal and the impact of discounts and allowances granted to close the deals.
6-11Life-cycle profitability analysis weighs theexpected value of the stream of a customer’s netmargins against the cost of acquiring the customer.Companies must understand variation of customerdemands across multiple products and services andthe expected length of each customer’s relationshipwith the company (given potentially costly retentionefforts), in order to calculate each customer’stotal life-cycle profitability. The analysisinvolves identifying characteristics of profitablecustomers. Companies can then direct their marketingefforts accordingly to specific segments that aremost likely to yield and retain profitablecustomers. Acquiring the information necessary forlife-cycle profitability analysis and using thisinformation to calculate life-cycle profitabilitythus provides insights about which customer groupsare likely to be profitable over the expected lifeof a customer’s relationship with the company.
6-12No. Experts now agree that it is a mistake for acompany to use the satisfaction score as its onlycustomer metric. A customer’s satisfaction is anattitude or belief stemming from a feeling that theproduct or service has generally delivered on thecustomer’s expectation of performance. But havingattitudes and beliefs are not actions; a customer’sattitude toward a product or a company does notreadily translate into the desired behavior ofrepeated and increased purchases of the product orservice, or customer loyalty.
6-13Loyal customers are valuable for several reasons.Three reasons are required in this question; thechapter lists the following five reasons:
– 200 –
Atkinson, Solution Manual t/a Management Accounting, 6E
1.Loyal customers have a greater likelihood to repurchase, and the costs to retain them are generally much lower than the cost to acquire an entirely new customer.
2.Loyal customers can persuade others, through word of mouth, to become new customers; they can becomereferences for potential future customers.
3.Loyal customers are less likely to defect when a competitor offers a similar product at the same orslightly lower price.
4.Loyal customers are often willing to pay a price premium to retain a known and trusted relationshipwith a key supplier.
5.Loyal customers are willing to collaborate with the supplier to improve performance and develop new products.
6-14Customer retention rate, though a traditionalcustomer loyalty metric, is a poor indicator of acustomer’s loyalty. This is because customers oftenremain with their current supplier because ofinertia, high switching costs, or the current lackof an alternative supplier.
6-15The five stages of a hierarchy for categorizingcustomer satisfaction and loyalty are:1.Satisfied customers, as measured by how well a
customer’s expectations have been met or exceeded in an individual transaction or long-term relationship.
2. Loyal customers, as measured the customer devoting an increasing “share of wallet” for repeat purchases from the same supplier.
3.Committed customers, those who not only purchase frequently from the supplier but also tell others about the supplier’s great products and service.
– 201 –

Chapter 6: Measuring and Managing Customer Relationships
4.Apostle customers, committed customers who have credibility and authority when they recommend the supplier to friends, neighbors, and colleagues.
5.Customer “owners,” who take responsibility for thecontinuing success of the supplier’s product or service.
A company should strive to have more of itscustomers in categories 3, 4, and 5 above, sincetheir willingness to recommend the company to othersand to collaborate with it to continually improveproduct features and service makes them far morevaluable, with a much higher customer lifetimevalue, than customers who are merely satisfied withthe most recent transaction.
Companies that offer personalized services tocustomers, such as by a Nordstrom salesperson, orthat offer rewards to loyal customers can generatehigh customer loyalty. These loyal customers thenrecommend the companies to others. Online companiessuch as amazon.com generate customer loyalty becauseprovide a good selection of desired products,competitive prices, easy ordering, quick delivery,and reviewers’ comments on products. Loyalcustomers, in turn, provide comments on products;helpful reviews in conjunction with the otherpositive attributes of the company contribute tocontinuing and growing customer loyalty.
6-16The net promoter score is computed based onresponses to the question, “How likely is it thatyou would recommend [Company X] to a friend orcolleague?” Customers respond on a scale from 1(extremely unlikely) to 10 (extremely likely), with5 representing a neutral point. The net promoterscore is the percentage of customers who are“promoters” (score of 9 or 10) less the percentagewho are “detractors” (scores of 1 through 6). Thenet promoter score is recommended based on research
– 202 –

Atkinson, Solution Manual t/a Management Accounting, 6E
that finds that a customer’s willingness torecommend a company is strongly correlated withfuture growth and profits. In contrast, a customerretention rate, a traditional customer loyaltymetric, can be a poor indicator of a customer’sloyalty. This is because customers may remain with asupplier because there no alternatives or simplybecause of inertia. Research suggests that“promoters” are the only truly loyal customers and“detractors” may harm the company’s reputation andbrand value.
– 203 –

Chapter 6: Measuring and Managing Customer Relationships
EXERCISES
6-17
(a) Ashton Brown
Sales$430,00
0 $350,000
Cost of goods sold$220,00
0 $155,000
Gross margin$210,00
0 $195,000Marketing, selling, distribution, and administrative expenses: 33% × sales
$141,900 $115,500
Operating profit $68,100 $79,500Operating profit/Sales 15.84% 22.71%-
(b)Sales
$430,000 $350,000
Cost of goods sold$220,00
0 $155,000
Gross margin$210,00
0 $195,000Marketing, selling, distribution, and administrative expenses Sales representative travel $9,000 $42,000 Service customers 15,000 110,000 Handle customer orders 1,000 12,000 Ship to customers 24,000 72,000Total activity expenses $49,000 $236,000
Operating profit$161,00
0 –$41,000Operating profit/Sales 37.44% –11.71%
– 204 –

Atkinson, Solution Manual t/a Management Accounting, 6E
(c)
The activity-based costing method provides moreaccurate assignments of marketing, selling,distribution, and administrative expenses byidentifying activities consumed by each customerand assigning costs to customers based on theiractivity usage. In this example, Brown placessmaller orders, orders more frequently, andrequires more after-sales support (travel andservice support) than Ashton does.
6-18(a) $873,600/20 operators = $43,680 per operator
$43,680/1,560 productive hours/operator = $28.00per hour
(b) (i) 0.1 + (10 × 0.02) = 0.3 hours
0.3 hours × $28/hour = $8.40
(ii)0.06 hours × $28/hour = $1.68
– 205 –

Chapter 6: Measuring and Managing Customer Relationships
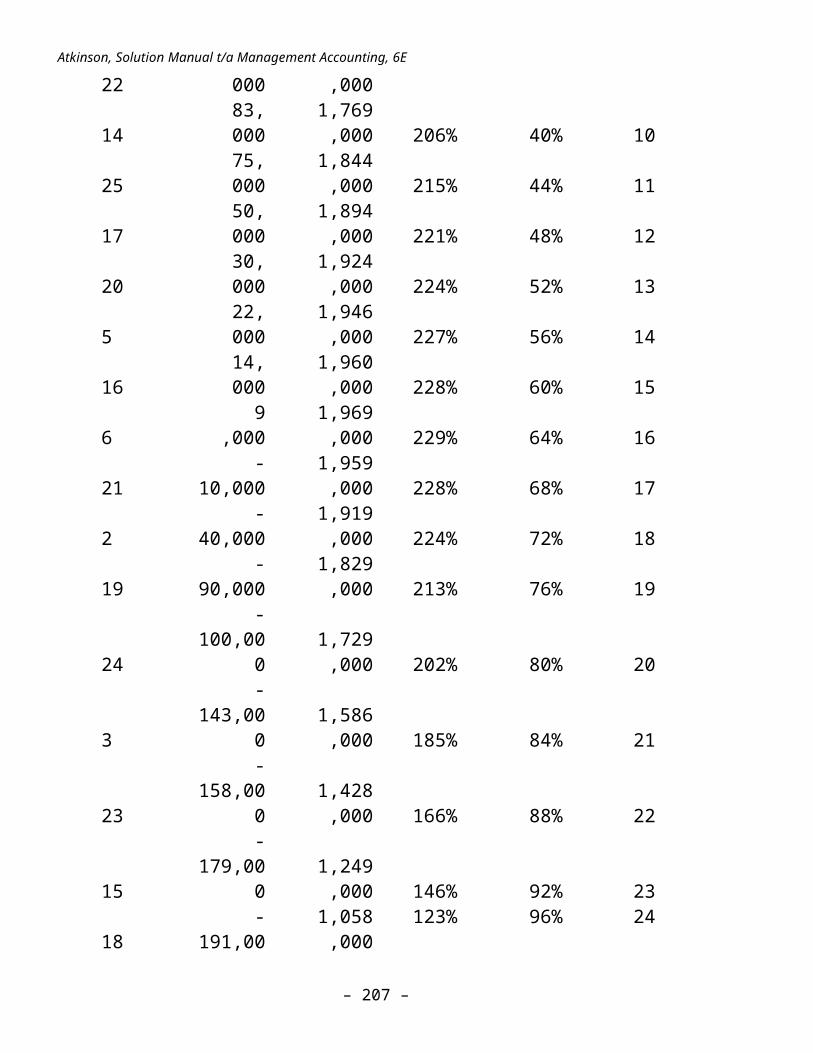
6-19(a) Students can refer to the In Practice box ontextbook page 224. The following table shows thecustomer profits sorted from largest tosmallest, the cumulative profit after addingeach customer, and the cumulative profitpercentages that were used to plot the whalecurve shown below. In addition, the first row(rank 0) was included below so that the graphbegins at 0.
Customer
NumberSortedProfit
Cumulative
Profit
Cumulative
Profit %
Cumulative
Percentof
Customers
ProfitRank
0$0
$0 0% 0% 0
13
264,000
264,000 31% 4% 1
9
259,000
523,000 61% 8% 2
12
233,000
756,000 88% 12% 3
1
221,000
977,000 114% 16% 4
4
217,000
1,194,000 139% 20% 5
11
208,000
1,402,000 163% 24% 6
7
101,000
1,503,000 175% 28% 7
10
96,000
1,599,000 186% 32% 8
87, 1,686 197% 36% 9
– 206 –
Atkinson, Solution Manual t/a Management Accounting, 6E
22 000 ,000 14
83,000
1,769,000 206% 40% 10
25
75,000
1,844,000 215% 44% 11
17
50,000
1,894,000 221% 48% 12
20
30,000
1,924,000 224% 52% 13
5
22,000
1,946,000 227% 56% 14
16
14,000
1,960,000 228% 60% 15
6
9,000
1,969,000 229% 64% 16
21
-10,000
1,959,000 228% 68% 17
2
-40,000
1,919,000 224% 72% 18
19
-90,000
1,829,000 213% 76% 19
24
-100,00
0 1,729
,000 202% 80% 20
3
-143,00
0 1,586
,000 185% 84% 21
23
-158,00
0 1,428
,000 166% 88% 22
15
-179,00
0 1,249
,000 146% 92% 23 18
-191,00
1,058,000
123% 96% 24
– 207 –

Chapter 6: Measuring and Managing Customer Relationships
0
8
-200,00
0 85
8,000 100% 100% 25
– 208 –

Atkinson, Solution Manual t/a Management Accounting, 6E
0%
50%
100%
150%
200%
250%
0 20% 40% 60% 80% 100%
Cumula
tive P
rofit Pe
rcent
Cum ulative percentage of custom ers, ranked from m ost-to-least profitable
Cum ulative Custom er Profitability
Actualnet profitActual net profit
(b) The most profitable 20% of the customers (i.e.,the most profitable 5 out of 25 customers)generated 139% of the profit, as shown in thetable in part (a).
(c) The least profitable 20% of the customers (i.e.,the least profitable 5 customers) lost (202% –100%) = 102% of the profit.
6-20(a) A company might transform its breakeven or losscustomers into profitable ones through processimprovements that lower the costs of servingcustomers. For example, if most customers aremigrating to smaller order sizes, companiesshould strive to reduce the costs of processessuch as setup and order handling so thatcustomer preferences can be accommodated withoutraising overall prices. One way to become moreefficient in handling orders is to encouragecustomers to access a purchasing web page andplace their orders over the Internet. This wouldsubstantially lower the cost of processing largequantities of small orders. If customers have apreference for suppliers offering high variety,manufacturing companies can try to customizetheir products at the latest possible stage, aswell as use information technology to enhance
– 209 –
Chapter 6: Measuring and Managing Customer Relationships
the linkages from design to manufacturing sothat greater variety and customization can beoffered without cost penalties.
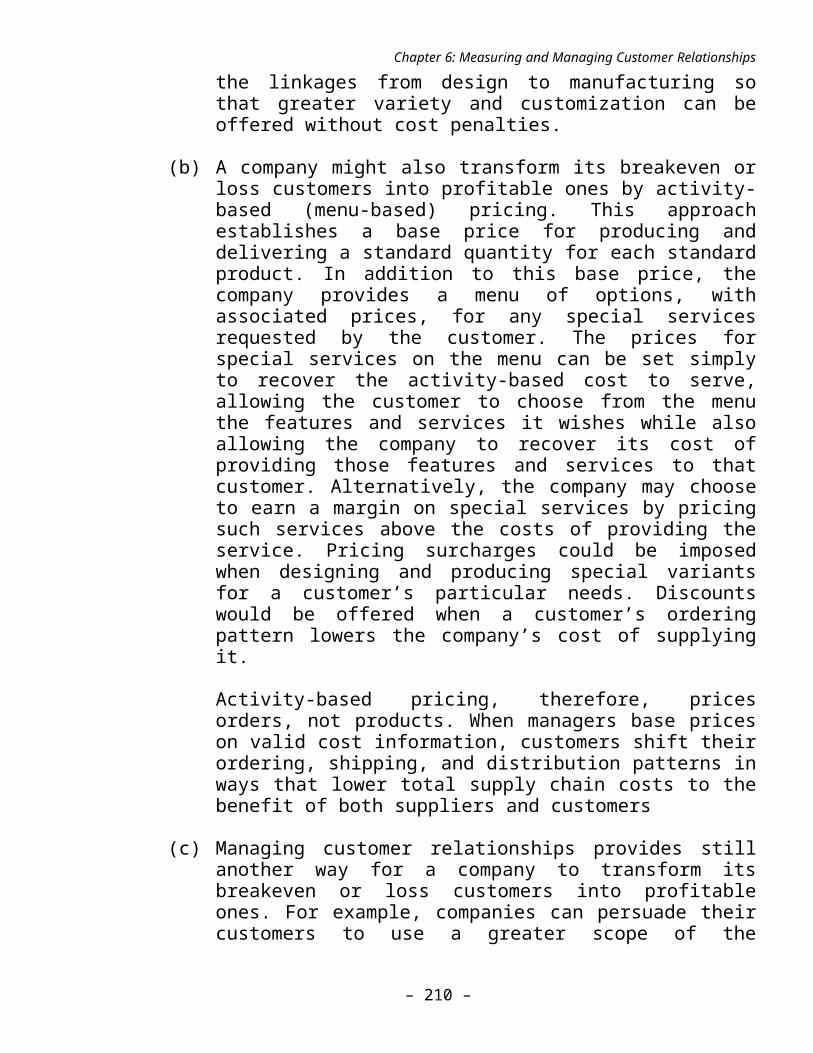
(b) A company might also transform its breakeven orloss customers into profitable ones by activity-based (menu-based) pricing. This approachestablishes a base price for producing anddelivering a standard quantity for each standardproduct. In addition to this base price, thecompany provides a menu of options, withassociated prices, for any special servicesrequested by the customer. The prices forspecial services on the menu can be set simplyto recover the activity-based cost to serve,allowing the customer to choose from the menuthe features and services it wishes while alsoallowing the company to recover its cost ofproviding those features and services to thatcustomer. Alternatively, the company may chooseto earn a margin on special services by pricingsuch services above the costs of providing theservice. Pricing surcharges could be imposedwhen designing and producing special variantsfor a customer’s particular needs. Discountswould be offered when a customer’s orderingpattern lowers the company’s cost of supplyingit.
Activity-based pricing, therefore, pricesorders, not products. When managers base priceson valid cost information, customers shift theirordering, shipping, and distribution patterns inways that lower total supply chain costs to thebenefit of both suppliers and customers
(c) Managing customer relationships provides stillanother way for a company to transform itsbreakeven or loss customers into profitableones. For example, companies can persuade theircustomers to use a greater scope of the
– 210 –

Atkinson, Solution Manual t/a Management Accounting, 6E
company’s products and services. The marginsfrom increased purchases contribute to coveringcustomer-related costs that do not increaseproportionately with volume, such as the cost ofthe salesperson assigned to the account.Companies can establish minimum order sizes fromunprofitable customers, so that the margins fromhigher volumes more than cover the costs ofprocessing an order and setting up a productionrun for the customer.
(d) Finally, companies might transform theirbreakeven or loss customers into profitable onesby using their activity-based costing systems totrace all revenue deductions, as wellpromotional costs and allowances, to individualorders and customers in order to calculateactual, realized profit or loss, customer bycustomer. This approach should lead todisciplined discounts and allowances instead ofa situation where companies fail to see all ofthe revenue leaks from list price because theyrecord the discounts and allowances in differentsystems and make the revenue deductions atdifferent times of the year. Without adisciplined approach to discounts andallowances, companies might find that variousfunctional areas (e.g., salespeople, the financegroup, and marketing) independently offerdiscounts or allowances during the year, leadingto breakeven or loss customers because of thelarge total deductions from revenues.
6-21(a) Firms may fail to see all of the revenue leaksfrom list price on orders because they recordthe discounts and allowances in differentsystems and make the revenue deductions atdifferent times of the year. For example, theprompt payment discount may be recorded by thefinance department in an aggregate incomestatement account (sales deductions); the
– 211 –

Chapter 6: Measuring and Managing Customer Relationships
finance department may lump all freight costsinto a general financial statement accountlabeled as transportation expenses. It does notlink either the purchase discount or the freightexpense back to a customer or an individualorder. The volume discount may be refunded tothe customer only once it has accumulatedsufficient volume to qualify, and it is notlinked back to the individual transactions thatqualified for the volume discount. Withdiscounts and allowances recorded into differentaccounts and at different times, no manager seesthe complete picture for individual orders andconsequently no one realizes how much revenueloss occurs with individual orders.
(b) Once firms become aware of pricing waterfallsleading to undesirably large sales discounts,they can use their activity-based costingsystems to trace all revenue deductions, as wellpromotional costs and allowances, to individualorders and customers in order to calculaterealized profit or loss by order or by customer.Using this information, companies canperiodically (e.g., every quarter) calculate anoperating income statement for every customer.Furthermore, companies can use the activity-based information on MSDA costs to basesalesperson incentives on order and customerprofits, not just sales.
– 212 –
Atkinson, Solution Manual t/a Management Accounting, 6E
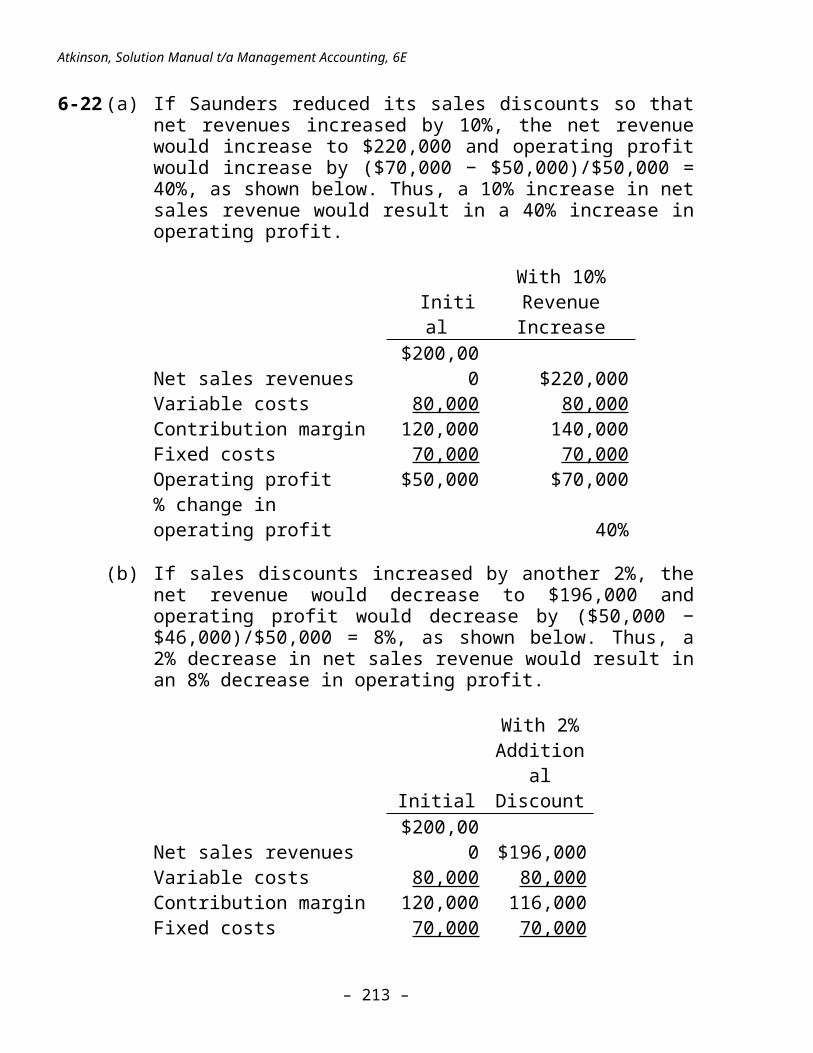
6-22(a) If Saunders reduced its sales discounts so thatnet revenues increased by 10%, the net revenuewould increase to $220,000 and operating profitwould increase by ($70,000 − $50,000)/$50,000 =40%, as shown below. Thus, a 10% increase in netsales revenue would result in a 40% increase inoperating profit.
With 10% Initi
alRevenueIncrease
Net sales revenues$200,00
0 $220,000Variable costs 80,000 80,000Contribution margin 120,000 140,000Fixed costs 70,000 70,000Operating profit $50,000 $70,000% change in operating profit 40%
(b) If sales discounts increased by another 2%, thenet revenue would decrease to $196,000 andoperating profit would decrease by ($50,000 −$46,000)/$50,000 = 8%, as shown below. Thus, a2% decrease in net sales revenue would result inan 8% decrease in operating profit.
With 2%
Initial
Additional
Discount
Net sales revenues$200,00
0 $196,000Variable costs 80,000 80,000Contribution margin 120,000 116,000Fixed costs 70,000 70,000
– 213 –

Chapter 6: Measuring and Managing Customer Relationships
Operating profit $50,000 $46,000% change in operating profit 8%
(c) Let x% = the percentage change in net salesrevenue. Under the circumstances in thisproblem,
Change in operating profit = (Initial revenue ×x%)
Percentage change in operating profit =
(Initial revenue × x%)/(Initial operatingprofit) =
x% × (Initial revenue)/(Initial operatingprofit)
Thus, the higher the ratio of sales to operatingprofit, the larger the change in operatingprofit in response to a change in x.Equivalently, the lower the ratio of operatingprofit to sales, the larger the change inoperating profit in response to a change in x.This implies that the higher the ratio ofoperating profit to sales, the smaller thechange in operating profit in response to achange in x.
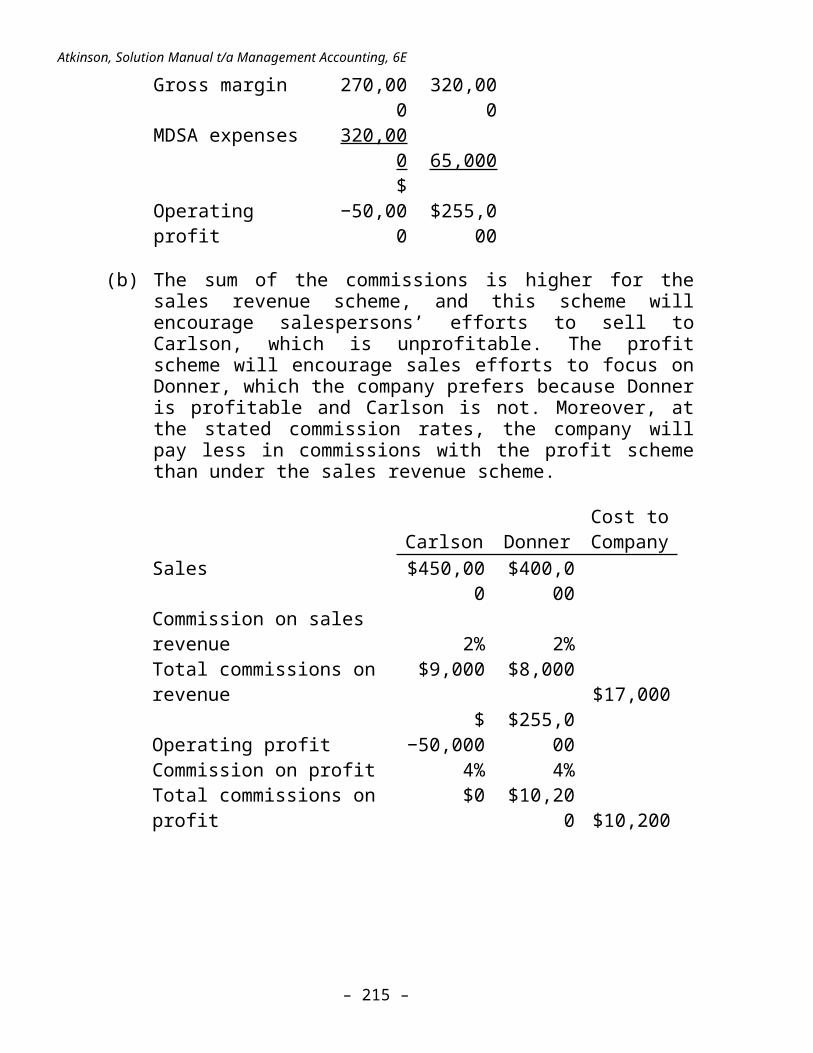
6-23(a) Based on the information given, Donner is moreprofitable and Carlson is unprofitable:
Carlson
Donner
Sales $450,000
$400,000
Cost of goods sold
180,000
80,000
– 214 –
Atkinson, Solution Manual t/a Management Accounting, 6E
Gross margin 270,000
320,000
MDSA expenses 320,000 65,000
Operating profit
$−50,00
0$255,0
00
(b) The sum of the commissions is higher for thesales revenue scheme, and this scheme willencourage salespersons’ efforts to sell toCarlson, which is unprofitable. The profitscheme will encourage sales efforts to focus onDonner, which the company prefers because Donneris profitable and Carlson is not. Moreover, atthe stated commission rates, the company willpay less in commissions with the profit schemethan under the sales revenue scheme.
Carlson DonnerCost toCompany
Sales $450,000
$400,000
Commission on sales revenue 2% 2%Total commissions on revenue
$9,000 $8,000 $17,000
Operating profit$
−50,000$255,0
00Commission on profit 4% 4%Total commissions on profit
$0 $10,200 $10,200
– 215 –
Chapter 6: Measuring and Managing Customer Relationships
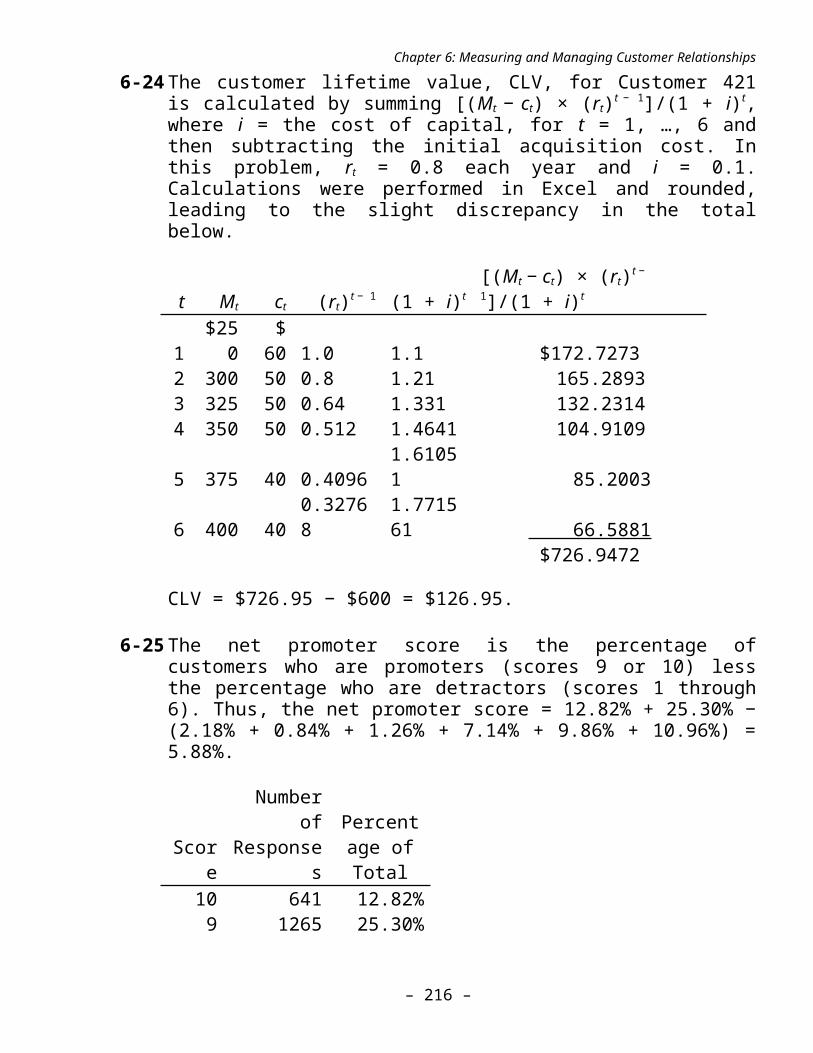
6-24The customer lifetime value, CLV, for Customer 421is calculated by summing [(Mt c− t) × (rt)t − 1]/(1 + i)t,where i = the cost of capital, for t = 1, …, 6 andthen subtracting the initial acquisition cost. Inthis problem, rt = 0.8 each year and i = 0.1.Calculations were performed in Excel and rounded,leading to the slight discrepancy in the totalbelow.
t Mt ct (rt)t − 1 (1 + i)t[(Mt c− t) × (rt)t −
1]/(1 + i)t
1$250
$60 1.0 1.1 $172.7273
2 300 50 0.8 1.21 165.28933 325 50 0.64 1.331 132.23144 350 50 0.512 1.4641 104.9109
5 375 40 0.40961.61051 85.2003
6 400 400.32768
1.771561 66.5881
$726.9472
CLV = $726.95 − $600 = $126.95.
6-25The net promoter score is the percentage ofcustomers who are promoters (scores 9 or 10) lessthe percentage who are detractors (scores 1 through6). Thus, the net promoter score = 12.82% + 25.30% −(2.18% + 0.84% + 1.26% + 7.14% + 9.86% + 10.96%) =5.88%.
Score
Numberof
Responses
Percentage ofTotal
10 641 12.82%9 1265 25.30%
– 216 –

Atkinson, Solution Manual t/a Management Accounting, 6E
8 1254 25.08%7 228 4.56%6 548 10.96%5 493 9.86%4 357 7.14%3 63 1.26%2 42 0.84%1 109 2.18%
5,000
– 217 –
Chapter 6: Measuring and Managing Customer Relationships
PROBLEMS
6-26This question is designed to generate discussion onwhat constitutes a desirable customer. Although acredit customer who charges a large dollar volume andpays the balance in full on time each month isprobably a good credit risk, the customer is not themost profitable to the credit card issuer. (However,some credit card issuers may generate indirectadditional revenue from such customers by working withadvertisers to selectively add advertising inserts tothese customers.) All credit card purchases generatemerchant fees; the credit card issuer hopes togenerate additional income through interest paymentsand late fees.
Type 6 is the least desirable type of customerbecause that type generates no revenue but causesthe issuer to incur costs to send statements. Type 1is preferable to Type 6, but less preferable thanall the remaining types because of the short-term,low-interest arrangement. Type 3 is preferable totype 4 because of the late fees, and type 4 ispreferred to type 5 because of the higher balanceson which interest is paid. Type 2 is probably lesspreferred than types 3 and 4, and possibly type 5.The suggested complete ordering will depend on therelative dollar magnitudes assumed. A reasonableordering, from most preferred to least preferred, is3, 4, 2, 5, 1, 6.
– 218 –
Atkinson, Solution Manual t/a Management Accounting, 6E
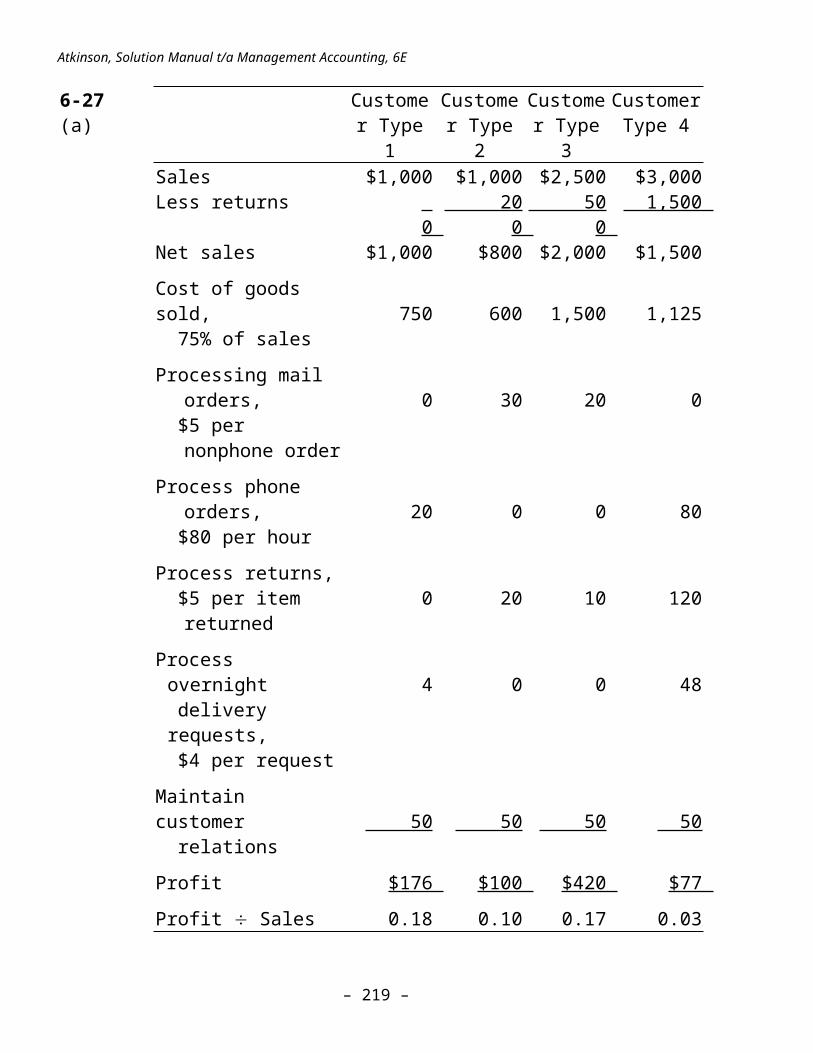
6-27 (a)
Customer Type
1
Customer Type
2
Customer Type
3
CustomerType 4
Sales $1,000 $1,000 $2,500 $3,000 Less returns
0 20
0 50
0 1,500
Net sales $1,000 $800 $2,000 $1,500 Cost of goods sold, 75% of sales
750 600 1,500 1,125
Processing mail orders,
$5 per nonphone order
0 30 20 0
Process phone orders,
$80 per hour20 0 0 80
Process returns, $5 per item
returned0 20 10 120
Process overnight
delivery requests,
$4 per request
4 0 0 48
Maintain customer relations
50 50 50 50
Profit $176 $100 $420 $77 Profit Sales 0.18 0.10 0.17 0.03
– 219 –

Chapter 6: Measuring and Managing Customer Relationships
(b) Although customer type 4 has the highest sales,it has the highest dollar returns and the lowestprofit. Customer type 3 is by far the mostprofitable, even though its sales are less thancustomer type 4’s (but customer type 3’s netsales exceed customer 4’s). Customer types 1 and2 are more profitable than customer type 4 intotal dollars and in percent of sales. Customertype 1 returns the highest profit as a percentof sales, slightly above customer type 3’sratio. Cost of goods sold represents 75% ofsales revenue, so the remaining costs as apercent of sales pertain to each customer’sinteraction with the company. Customer type 4 isthe most expensive to service because it ordersfrequently, places orders in a costly manner(one hour on the phone), returns many items, andrequests overnight deliveries. Customer type 1is fairly low-cost to serve in spite of orderingby phone and requesting overnight deliverybecause this customer type orders only once ayear and does not return merchandise. Aside fromreturns, customer types 2 and 3 are fairly low-cost to serve because they order via mail andrequest regular delivery rather than overnightdelivery.
(c) Kronecker can seek to reduce the serviceactivity usage or improve efficiency to reducethe cost of providing services. For example,Kronecker might ask customers the reason forreturns, and follow up with ways to reduceproblems that caused the returns. The companymight also explore ways to make phone orderingmore efficient, to reduce the time spent on thephone. Kronecker may also charge fees to handleovernight delivery requests.
6-28Key points in the essay should include the itemsbelow. Exercise 6-19 provides a numerical examplefor developing a whale curve.
– 220 –

Atkinson, Solution Manual t/a Management Accounting, 6E
Exhibit 6-2 illustrates an 80-20 graph for salesrevenues, with cumulative percent of products orcustomers on the x-axis and cumulative percent ofrevenue on the y-axis. To prepare such a graph forn products, rank the products from highest tolowest revenue in spreadsheet column B. In columnA, enter the ranks (integers from 1 to n). Computethe cumulative percent of products in column C bydividing each product rank by n and displaying theresult in percent format. These percents will beplotted along the x-axis. Compute the cumulativerevenues in column D and cumulative revenuepercentages (divide each entry in column D by thetotal of all revenues in column D) in column E.Beginning with the highest-revenue product, plotthe point indicating (Product 1’s percentage incolumn C, Product 1’s revenue percentage in columnE). Continuing with the second-highest-revenueproduct, plot the point indicating (Product 2’spercentage in column C, cumulative percent ofrevenue for products 1 and 2 in column E).Continue to plot (cumulative percent of products,cumulative percent of revenue) in this manneruntil points representing all the products havebeen plotted, as in Exhibit 6-2. A graph forcustomers would be plotted similarly.
Typically, companies find that their top-selling20% of products or customers generate about 80% oftotal sales. The lowest volume 40% of products orcustomers generates only 1% of total sales.
Although the 80–20 law applies well to salesrevenues, it does not apply to profits.
The “In Practice: Building a Whale Curve ofCustomer Profitability” describes in detail how toprepare a whale curve with a spreadsheet andExcel. (Also see Exercise 6-19, which describesadding a starting point of 0.) Briefly, rank thecustomers from most profitable to least profitable(or most unprofitable). Beginning with the mostprofitable customer, plot the point indicating(Customer 1’s percentage, Customer 1’s percent of
– 221 –

Chapter 6: Measuring and Managing Customer Relationships
total profit). Continuing with the next mostprofitable customer, plot the point indicating(Customer 2’s percentage, cumulative percent oftotal profit). Continue to plot (customerpercentage, cumulative percent of profit in thismanner until points representing all the customershave been plotted, as in Exhibit 6-3. Exhibit 6-3 provides a typical whale curve ofcumulative customer profitability. The mostprofitable 20% of customers generated about 180%of total profits; this is the peak, or hump of thewhale above sea level. The middle 60% of customersapproximately break even, and the least profitable20% of customers lose 80% of total profits,leaving the company with its 100% of total profits(“sea level” in the whale curve represents thecompany’s actual reported profits). The hump (ormaximum height) of a cumulative profitabilitycurve generally hits 150% to 250% of totalprofits, and this height is usually achieved bythe most profitable 20% to 40% of customers.
– 222 –

Atkinson, Solution Manual t/a Management Accounting, 6E
6-29 (a)
Customer1
Customer2
1.Volume discount if 20 or more units are ordered 2% 2%
2.Pay in full in 15 days 3%3.Cooperative advertising
allowance for featuring the company’s products in its advertisements 4% 4%
4.Take a large shipment before the end of the quarter in advance of an expected seasonal increasein demand 5%
5.Online ordering discount 2% 2%6.Rebate on sales during
specific promotional periods 2%
7.Free freight 3% Total 21% 8%
(b) Randolph Company’s management may havebeen unaware of the potentially largediscounts offered to its customers becausethe discounts and allowances arise fromdifferent sources and are recorded indifferent systems. In addition, the revenuedeductions may occur at various times ofthe year. For example, the prompt paymentdiscount may be recorded by the financedepartment in an aggregate income statementaccount (sales deductions); the financedepartment may lumps all freight costs intoa general financial statement accountlabeled as transportation expenses. Themarketing department may initiate thecooperative advertising allowance, volume
– 223 –

Chapter 6: Measuring and Managing Customer Relationships
discount allowance, and rebates. Withdiscounts and allowances recorded intodifferent accounts and at different times,no manager sees the complete picture forindividual orders and consequently no onerealizes how much revenue loss occurs withindividual orders.
(c) Once firms become aware of pricing waterfallsleading to undesirably large sales discounts,they can use their activity-based costingsystems to trace all revenue deductions, as wellpromotional costs and allowances, to individualorders and customers in order to calculaterealized profit or loss by order or by customer.Using this information, companies canperiodically (e.g., every quarter) calculate anoperating income statement for every customer.Furthermore, companies can use the activity-based information on MSDA costs to basesalesperson incentives on order and customerprofits, not just sales. Randolph Company canalso evaluate whether it wants to continueoffering free freight to Customer 1.
6-30 (a)
Customer1
Customer2
Customer3
Customer4
CLV $42.47 −$253.94 −$129.14 $27.73
Supporting calculations appear below. Thecustomer lifetime value, CLV, is calculated bysumming [(Mt c− t) × (rt)t − 1]/(1 + i)t across each ofthe t years retained, where i = the cost ofcapital, and then subtracting the initialacquisition cost. In this problem, i = 0.1.Calculations were performed in Excel androunded, leading to the slight discrepancy inthe total.
Customer 1:
– 224 –

Atkinson, Solution Manual t/a Management Accounting, 6E
t Mt ct
(rt)t −
1 (1 + i)t[(Mt c− t) × (rt)t −
1]/(1 + i)t
1$27
5 $0 1 1.1 $ 250.002 275 0 1 1.21 227.273 275 0 1 1.331 206.61
4 275 0 1 1.4641 187.83
5 275 0 1 1.6105 170.75
$1,042.47CLV = $1,042.47− $1,000 = $42.47
Customer 2:
t Mt ct (rt)t − 1(1 +
i)t[(Mt c− t) × (rt)t −
1]/(1 + i)t
1$30
0 $0 1 1.1 $272.732 300 0 1 1.21 247.933 300 0 1 1.331 225.39
$746.06CLV = $746.06 − $1,000 = −$253.94
Customer 3:
t Mt ct (rt)t − 1(1 +
i)t[(Mt c− t) × (rt)t −
1]/(1 + i)t
1$27
5 $0 1.0 1.1 $250.002 275 0 0.9 1.21 204.553 275 0 0.81 1.331 167.36
4 275 0 0.729 1.4641 136.93
5 275 0 0.6561 1.6105 112.03
$870.86CLV = $870.86 − $1,000 = −$129.14
– 225 –

Chapter 6: Measuring and Managing Customer Relationships
Customer 4:
t Mt ct (rt)t − 1(1 +
i)t[(Mt c− t) × (rt)t −
1]/(1 + i)t
1$275 $50 1 1.1 $ 204.55
2 275 25 1 1.21 206.61
3 300 0 1 1.331 225.39
4 300 0 1 1.4641 204.90
5 300 0 1 1.6105 186.28
$1,027.73CLV = $1,027.73 − $1,000 = $27.73
(b) Comparing Customer 1 to Customer 2, even thoughCustomer 1’s net margins (margins minus costs toserve) per year are smaller, the longer timeperiod more than compensates for the smaller netmargins, yielding a larger CLV. ContrastingCustomer 1 and Customer 3, we see the importanceof retention. A slight decrease in the retentionrate changes the CLV from positive to negative.In comparing Customer 4 to Customers 1 and 3,note that Customer 4 has same total (M − c) asCustomers 1 and 3. The additional cost to serveand retain Customer 4 in years 1 and 2 providesnet benefits in the form of higher margins inlater periods, yielding a positive CLV that isonly slightly lower than Customer 1’s.Contrasting Customer 3 and Customer 4 againillustrates the importance of the retentionrate. The additional cost to serve and retainCustomer 4 in years 1 and 2 provides netbenefits and helps create the difference betweena positive CLV for Customer 4 and a negative CLVfor Customer 3.
– 226 –
Atkinson, Solution Manual t/a Management Accounting, 6E
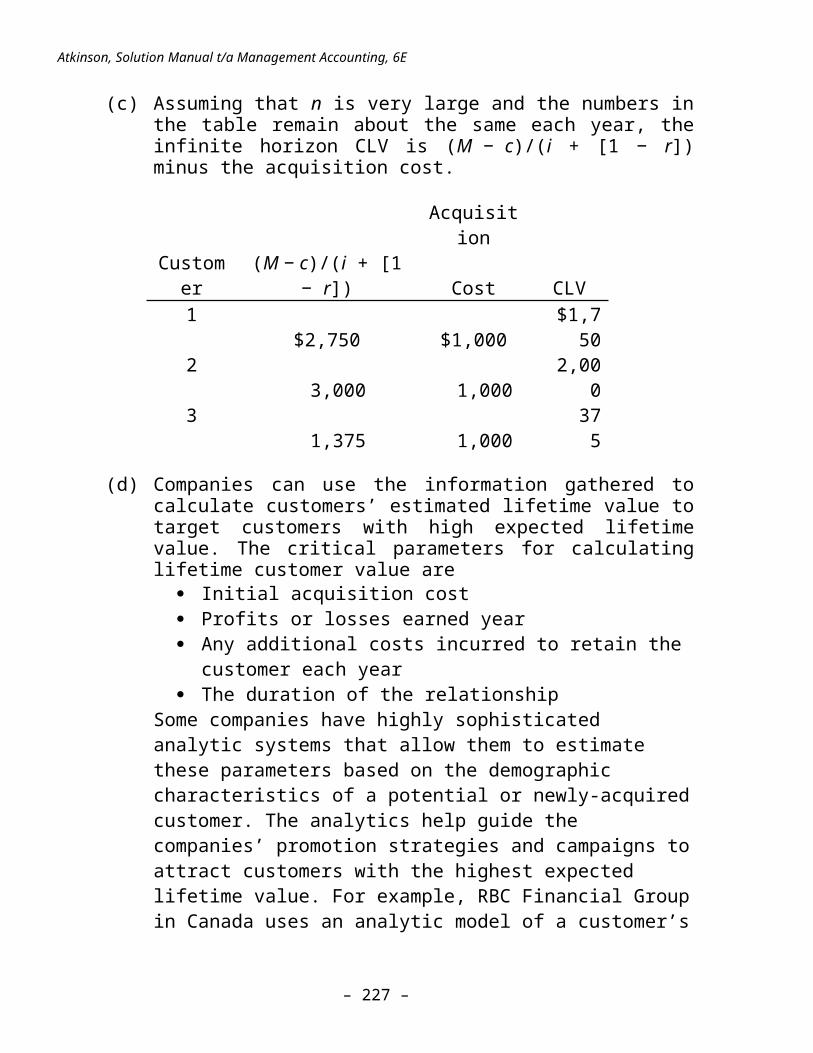
(c) Assuming that n is very large and the numbers inthe table remain about the same each year, theinfinite horizon CLV is (M − c)/(i + [1 − r])minus the acquisition cost.
Acquisition
Customer
(M − c)/(i + [1− r]) Cost CLV
1$2,750 $1,000
$1,750
2 3,000 1,000
2,000
3 1,375 1,000
375
(d) Companies can use the information gathered tocalculate customers’ estimated lifetime value totarget customers with high expected lifetimevalue. The critical parameters for calculatinglifetime customer value are
Initial acquisition cost Profits or losses earned year Any additional costs incurred to retain the
customer each year The duration of the relationship
Some companies have highly sophisticated analytic systems that allow them to estimate these parameters based on the demographic characteristics of a potential or newly-acquiredcustomer. The analytics help guide the companies’ promotion strategies and campaigns toattract customers with the highest expected lifetime value. For example, RBC Financial Groupin Canada uses an analytic model of a customer’s
– 227 –
Chapter 6: Measuring and Managing Customer Relationships
future profitability based on age, tenure with the bank, number of products and services already used at the bank, and the customer’s potential to purchase additional products and services, grow account balances, and generate fee-based income.1 The bank assigns a personal account representative to its estimated high lifetime value customers, ensures that their phone calls get picked up quickly, and provides them with ready access to credit at attractive terms.
6-31The net promoter score is likely to have the greatestpredictive power for repeat purchases and growth inbusiness-to-customer settings where customers havefrequent interactions with companies. The score islikely to have the least predictive power in business-to-business settings where purchasing decisions aremade by highly sophisticated professionals. In thiscase, it is better to ask, “How likely is it that youwill continue to purchases products or services fromCompany X?”
CASES
6-32The responses below are based on “SurvivalStrategies: After Cost Cutting, Companies TurnToward Price Increases,” by Timothy Aeppel, The WallStreet Journal (September 18, 2002, p. A1).
(a) Jergens’ president based the price on what hedetermined to be the cost of producing the orderof 10 odd-sized fasteners from scratch. The costincluded setup for the odd size and overtimelabor. The company actually produced the odd-
1 V. G. Narayanan, “Customer Profitability and Customer Relationship Management at RBC Financial Group,” HBS Case # 102-043.
– 228 –

Atkinson, Solution Manual t/a Management Accounting, 6E
sized fasteners by producing full-size fastenersand then shortening 10. This method was lesscostly than setting up the equipment to run asmall batch of the required odd size.
(b) Goodyear had been rewarding its sales forcebased on volume, providing an incentive for thesales force to deeply discount prices to largedistributors. The discounts were so substantialthat the large distributors could resell thetires to smaller distributors (even withtransportation costs to other regions), reducingGoodyear’s sales at higher prices to smallerdistributors. Goodyear responded by cutting thediscounts to large distributors, removingdiscount approval authority from the sales forceand transferring it to a “tactical pricinggroup” that determines whether Goodyear canprofitably match a competitor’s prices. Goodyearalso modified its sales force bonus scheme toinclude a “revenue per tire” metric.
(c) Emerson discovered that customers were willingto pay about 20% more than Emerson’s initiallyproposed cost-based price of $2,650 for a newcompact sensor. Emerson priced the sensor at$3,150. Note that the article does not provideinformation on how Emerson determined productcosts that it used as a basis for its markups. Atraditional cost system is more likely toundercost a low-volume or customized productbecause it allocates manufacturing support coststo products based on unit-level drivers. Anactivity-based costing system more accuratelyassigns costs based on resource usage.
(d) Wildeck, “a maker of metal guard rails,mezzanines and material lifts for factories andwarehouses,” promoted packages that includedinstalling its products. The installations bringhigher profit than parts catalog sales. Wildeck
– 229 –
Chapter 6: Measuring and Managing Customer Relationships
responded to a competitor’s lower-pricedstorage-rack protector by developing its own“lite” version and pricing it much lower thanthe competitor’s price. When customers calledabout purchasing the lite version, they wereinformed of the benefits of the originalversion, and most of these customers bought theoriginal version. An accurate costing system,such as a good activity-based costing systemthat includes both manufacturing andnonmanufacturing costs of providing goods andservices to customers, provides reasonablyprecise information to managers for makingdecisions about the mix of products and servicesto offer to customers and prices to charge inorder to generate the desired level ofprofitability.
(e) Union Pacific introduced a minimum price thatwas higher than a third of its customers paid.The company was not concerned if it lost thesecustomers because customers who were payinghigher prices would fill up the newly freespace. Dropping unprofitable customers will notlead to an immediate increase in profit if theassociated capacity-related costs are committedcosts and the resources cannot be put to otherprofitable use.
6-33Midwest Office Products2 (HBS Case 9-104-073)
2 Copyright © 2005 by the President and Fellows of HarvardCollege. Harvard Business School Teaching Note 5-105-084.This teaching note was prepared by Professor Robert S. Kaplanas an aid to instructors in the classroom use of the “MidwestOffice Products” case, HBS No. 104-073. Reprinted bypermission of Harvard Business School. The teaching noteshave been adapted for use with the textbook.
– 230 –

Atkinson, Solution Manual t/a Management Accounting, 6E
Midwest is a revised version of Dakota OfficeProducts (HBS Case No. 102-021), designed tointroduce students to time-driven activity-basedcosting. Midwest is a constructed example, but onebased on the actual experiences of several medicaldistribution and office products companies. Itsimplifies many of the complex processes that wouldarise in an actual application, but thesimplification enables students to construct a time-driven ABC model for Midwest in a relatively shortamount of time. Instructors can discuss with theclass how to extend the model to capture morecomplex and realistic situations. The costing offive representative orders gives students insightsabout the power and management implications of theapproach.
The case is simple enough that it can be used as afirst activity-based costing case. Given that thetime-driven approach is both simpler and morepowerful than original ABC, I now prefer tointroduce students directly to this approach, ratherthan introduce ABC in its original form, and thenmigrate them to the time-driven approach.
Teaching Objectives
Introduce students to time-driven activity-basedcosting through a simplified numerical exercisebased on actual company situations. Enable studentsto propose actions that would transform unprofitableorders and customers into profitable ones.
Assignment (for the standalone case)
Read
– 231 –

Chapter 6: Measuring and Managing Customer Relationships
“Time-Driven Activity-Based Costing” Harvard BusinessReview reprint #R0411J“Activity-Based Costing and Capacity” HBS No.
105-059Optional: ABC Pen Factory Tutorial HBS No. 103-
704
The Kaplan–Anderson Harvard Business Review article onTime-Driven ABC (#R0411) should be sufficient tointroduce students to ABC even if they have notpreviously studied the subject. Should instructorswant a more comprehensive introduction to “original”ABC, they can consider: R.S. Kaplan, “Introductionto Activity-Based Costing,” HBS Note No. 197-076(Boston: Harvard Business School Publishing, 1997).
The technical note on ABC and capacity can beoptional or background reading. It helps studentsunderstand why ABC cost driver rates should be basedon practical capacity, not actual utilization. Thismay shorten discussion that otherwise arises inclass about what happens to cost driver rates afterorder mix changes and process efficiencies reducethe demand on organizational resources. The ABC PenFactory Tutorial provides an on-line demonstrationof why companies can benefit from ABC. It shows howABC captures cost behavior better than traditional,volume-based costing.
– 232 –
Atkinson, Solution Manual t/a Management Accounting, 6E
Textbook Assignment Questions (adapted from theoriginal case questions):
(a) Based on the interviews and data in the case,estimate:
(1) The cost of processing cartons through thefacility
(2) The cost of entering electronic and manualcustomer orders
(3) The cost of shipping cartons on commercialcarriers
(4) The cost per hour for desktop deliveries
(b) Using this capacity cost rate information,calculate the cost and profitability of the fiveorders in Exhibit 6-10. What explains the variationin profitability across the five orders?
(c) On the basis of your analysis, what actionsshould John Malone take to improve Midwest’sprofitability? Include suggestions for managingcustomer profitability.
(d) Suppose that currently, Midwest processes 40,000manual orders per year, with a total of 200,000line items to enter, and processes 30,000electronic orders.
i. How much unused practical capacity does thecompany have?
ii. If the company’s efforts to encourage customerswho order manually to change to electronicordering results in 20,000 manual orders peryear, 100,000 line items to enter, and 50,000electronic orders, how many order entry
– 233 –

Chapter 6: Measuring and Managing Customer Relationships
operators will the company require? If orderentry resource costs can be reduced inproportion to the number of employees, what willbe the cost savings from the changes?
iii. Returning to the original information in (d), ifthe company’s process improvement efforts resultin a 20% reduction in time to perform each ofthe three order entry activities, how many orderentry operators will the company require? Iforder entry resource costs can be reduced inproportion to the number of employees, what willbe the cost savings from the processimprovements?
Discussion
Introductory Remarks
If this is the students or executives’ firstexposure to activity-based costing, I often start withthe data in TN Exhibit 6-1, taken from a company Iconsulted with in 1995. While flying to the company, Ithought about how to motivate the discussion with thesenior executive team about whether to adopt activity-based costing. In reading the company’s annual report,I saw the 10-year summary, which I have excerpted inTN Exhibit 6-1. During the past ten years, the companywas fortunate to have had a sales increase of nearly135%, as sales had increased from $2.08 billion to$4.89 billion. Conventional cost accounting thinkingfocuses on distinguishing between fixed and variablecosts. If this company had any significant fixed costsduring a period when sales increased by 135%, thecompany’s main problem would be the frequency withwhich it would have to deposit cash into its bank
– 234 –

Atkinson, Solution Manual t/a Management Accounting, 6E
accounts. But as the study of cost of goods sold andgross margin revealed, the CGS—rather than decreasingas a percentage of sales, as it would have to if anyfixed costs existed—actually increased as a percentageof sales. So not only were CGS not fixed, they werenot even variable (that would have produced a constantgross margin percentage). In fact, the CGS were super-variable costs, rising faster than sales.
A similar result was found in “below the grossmargin line” costs—selling, general, andadministrative costs. Despite many accountantstreating these as “fixed costs,” these SG&A costs werealso super-variable, increasing faster than sales.These finding set the stage for the ABC cost model,trying to understand why companies, operating with atraditional volume-based cost system, typicallyincrease their sales by offering more variety,features, and service, leading to costs rising fasterthan sales. An ABC model helps a company identify whenit has not recovered all the incremental costsassociated with an order that has special features,such as small order quantities, expedited ordering,and customized delivery options.
Analysis
Q: What are the operating processes at Midwest OfficeProducts?
I try to get the students help me get the simpleprocess flow model below on the top of the board:
Process
– 235 –

Chapter 6: Measuring and Managing Customer Relationships
Receive and Store Enter Custom erO rders
Distributeor Ship
ProcessVariety
none m anual or electronic com m ercial or desktop
Receive and Store Enter Custom erO rders
Distributeor Ship
ProcessVariety
none m anual or electronic com m ercial or desktop
Students may also comment on the differential lengths of time that customers take to pay.
I then describe how to build an ABC model for thethree processes performed by Midwest:Step 1: Assign costs to processesStep 2: Calculate practical capacity of processesStep 3: Calculate cost rate of supplying capacityStep 4: Assign costs to orders or products based on their use of capacity
I start with the warehouse process to receive andstore a carton:(a) (1)Q: What does it cost to process a carton through the
distribution center?The cost of the warehouse personnel is calculated bysubtracting the cost of the delivery personnel (notinvolved with warehouse operations) from the totaldistribution center personnel cost. To this cost mustbe added the cost of operating the warehouse.
1.Cost of process:$2,320,000 + 2,000,000 = $4,320,000
2.Practical capacity 80,000cartons
3.Cost rate for supplying capacity = $54 per carton
– 236 –

Atkinson, Solution Manual t/a Management Accounting, 6E
You should ask what assumption is made by thiscalculation. The answer, of course, is that allcartons place the same demands on warehouse resources.The follow up question, therefore, is when would thisassumption be violated? The hoped-for responses are:
1.Cartons can be of varying size, and thereforeoccupy differential amounts of space
2.Cartons can stay in storage for varying amounts oftime, consuming differential quantities of days ofcubic storage space
3.Cartons can require different quantities of time bywarehouse personnel to process; as a specificexample, a customer order may ask for a less thancarton quantity to be shipped. In this case, awarehouse person has to break open the carton, pickthe desired quantity of materials, and then packagethem up to be shipped to the customer. Suchbreakpack quantities are far more expensive toprocess per unit than carton-sized quantities.
All of these complexities can be handled by aslightly more complex ABC model. The analyst couldtreat the warehousing function as consisting of twosub-processes, one for supplying space (cost per cubicmeter per day) and one for supplying warehousepersonnel time (cost per hour). In this way, productsthat take up much space and stay in storage longerwill have higher costs assigned to them than productspackaged in small cartons that turn over quickly inthe warehouse. Similarly, breakpack quantities willhave more costs assigned to them than standard,carton-sized quantities. To introduce such complexityinto the case would lead to students (and the
– 237 –
Chapter 6: Measuring and Managing Customer Relationships
instructor) spending more time building the model,which is why I did not incorporate them. But theinstructor should point out how the cost model couldbe easily expanded to incorporate these more realisticsituations, as long as the company had data on cartonsize, product-specific turnover rates, and actualquantities ordered—as it almost always would.
Q: What else is missing from the calculation ofwarehousing cost?
We do not have enough information to assign somegeneral and administrative costs related to warehousepersonnel. General and selling (G&S) costs arereported as a single line item in the incomestatement, and the project team did not collectinformation about how these might be traced to orderhandling costs. This was a deliberate omission in thecase. Some students will allocate these costs as apercentage markup over the $54 per carton warehouseprocessing costs. I then question the rationale forsuch a procedure, asking them what assumption thisallocation method makes. The answer is an assumptionthat G&S costs are proportional to warehouseprocessing costs, which they almost surely are not. Itry to get the class to understand that usingpercentage markups to allocate indirect and supportcosts is indefensible. The percentages bear no causalrelationship back to the cost incurrence. Ifinstructors follow Midwest Office Products with a caseon customer profitability, they can point out thatsome G&S costs relate to customers not to processingorders, and that this cost assignment will bediscussed in a subsequent case.
– 238 –

Atkinson, Solution Manual t/a Management Accounting, 6E
The instructor has the option to give a littlelecturette at this point, pointing out that a morecomplete costing model would perform an ABC analysisfor each component of G&S expenses—such as humanresources, finance, and information technology costs—so that the costs of these departments can be moreaccurately driven directly to processes based on thedemands that the processes make on each of thecorporate support departments. The instructor can goback to an example reported by Tom Johnson of howWeyerhaeuser assigned its corporate supportdepartments to its business units using cost drivers,not percentages.3
(a) (2)
Customer Order Entry
Having explored approaches for driving warehousingcosts to orders, the instructor can now turn toestimating order entry costs. Again the four-partnumerical sequence should be straightforward to elicitfrom the class:
Calculate cost per hour for the resources doing the order entry
1.Cost of resources performing order entry$840,000
2.Capacity of order entry resources: 16 1,500 hours = 24,000
3 H.T. Johnson and D.A. Loewe, “How Weyerhaeuser Manages Corporate Over head Cost,” Management Accounting, August 1987, pp. 20–26.
– 239 –

Chapter 6: Measuring and Managing Customer Relationships
3.Cost of order entry process $35/hour (or $0.583/minute)
4.Assign costs based on use of resourcesEntering a manual customer order:0.150 35 =
$5.25/manual orderEntering a line item on order 0.075 35 = 2.625/line itemValidating an EDI order0.100 35 = 3.50/EDI order
As with the previous discussion (on warehousingcosts), the instructor can ask the class about whatassumptions are being made by the above calculation.Again, G&S costs are excluded because we don’t havesufficient information to assign them analytically.The core assumption is that all electronic orders takethe same amount of time to validate or verify, and allmanual orders take the same amount of time to enterthe basic information, independent of the complexityof the order (other than the number of line items in amanual order). More realistically, some orders may bemore complex to handle: expedited orders, ordersrequiring special packaging or delivery instructions,and, in general (beyond the Midwest case example),international orders, orders of fragile items, etc.This is a good time to review the concept of timeequations, discussed in Chapter 5 and the Kaplan-Anderson HBR article, as an easy and effective toolfor handling order complexity. TN Exhibit 6-2 shows aslide that can be used to illustrate time equations.Emphasize with the class that this type of complexitywas suppressed in the Midwest case to reduce classpreparation time. The other important point to be made
– 240 –

Atkinson, Solution Manual t/a Management Accounting, 6E
about time equations is that the information on ordercharacteristics is generally available from thecompany’s ERP or automated order entry system, so thateach order can be individually costed based on itsspecific characteristics. This feature enables time-driven ABC to incorporate far more process complexityand diversity than original ABC, which would requireseparate activity pools to be set up to handle eachmajor variation in order diversity and complexity.
If time permits the instructor can also work with theclass to learn how to update the time-driven ABCmodel: This material is optional to cover, especiallyin a 75-minute class.
Q: What causes a cost rate ($/hour) or unit timeestimate to change?
Suppose through a business process improvement (suchas TQM, or 6 sigma), Midwest improves the process sothat manual customer orders can be handled 20% faster.It can then just reduce the unit time estimate by 20%putting 0.15 × (1 −.20) = 0.12 into the ABC program orExcel spreadsheet.
If Midwest grants its order entry clerks a 6% raise,modify the resource cost and re-estimate the cost perhour (from $35/hour to $37.10/hour). Similarly, ifMidwest grants them an extra holiday or vacation day,reduce the practical capacity of these resources, andrecalculate the cost per available hour. Studentsshould see how simple it is to keep a time-driven ABCmodel current, by modifying hourly cost and unit timeestimates based on known shifts in the process.
– 241 –
Chapter 6: Measuring and Managing Customer Relationships
The class can now turn to costing the third majorprocess, distributing orders to customers. Theinstructor can ask:
(a) (3)
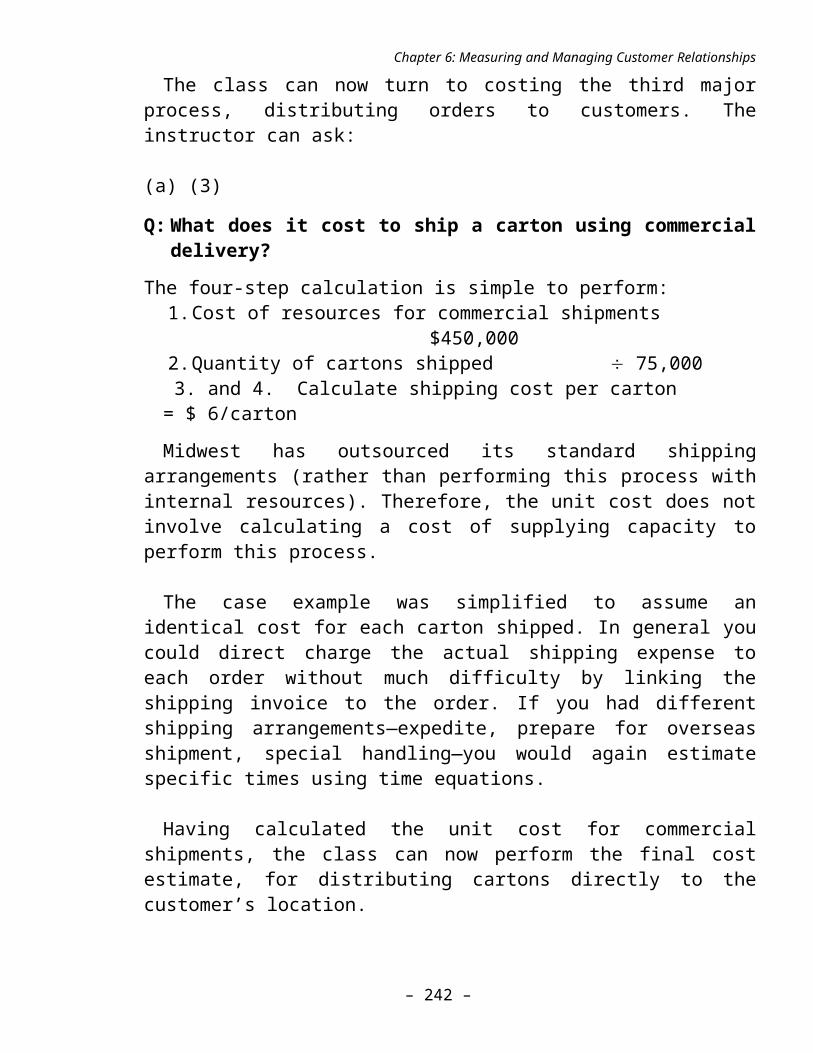
Q: What does it cost to ship a carton using commercialdelivery?
The four-step calculation is simple to perform:1.Cost of resources for commercial shipments
$450,0002.Quantity of cartons shipped 75,000 3. and 4. Calculate shipping cost per carton = $ 6/cartonMidwest has outsourced its standard shipping
arrangements (rather than performing this process withinternal resources). Therefore, the unit cost does notinvolve calculating a cost of supplying capacity toperform this process.
The case example was simplified to assume anidentical cost for each carton shipped. In general youcould direct charge the actual shipping expense toeach order without much difficulty by linking theshipping invoice to the order. If you had differentshipping arrangements—expedite, prepare for overseasshipment, special handling—you would again estimatespecific times using time equations.
Having calculated the unit cost for commercialshipments, the class can now perform the final costestimate, for distributing cartons directly to thecustomer’s location.
– 242 –

Atkinson, Solution Manual t/a Management Accounting, 6E
(a) (4)Q: How much does a desktop delivery cost?
1.Cost of desktop delivery resources: $200,000 +250,000 = $450,000
2.Number of hours available for DD = 4 × 1,500 6,000
3.Cost rate for desktop delivery= $75/hour
Students may propose two alternative methods for calculating the cost of desktop deliveries. One option, based on an original ABC calculation, assumes an identical cost per carton for desktop delivery:
$450,000/2,000 DD’s = $225 per DD
The error in this calculation is that it doesn’tallow for variation in desktop deliveries, some may beclose others may be far away. Also, some cartons maybe part of a large order delivered to a customerlocation, while others may be for a sole delivery of acarton. The actual delivery cost varies by number ofdeliveries, not the number of cartons in a delivery.Thus the original ABC calculation above contains twosources of error.The other method estimates a standard cost per
delivery. This allows number of deliveries rather thannumber of cartons to be the cost driver. With 2,000deliveries, the standard cost is $225 per delivery.While this calculation avoids the second problemabove, it still assumes that all deliveries areequally costly, thereby suppressing the differentcosts associated with delivering to nearby versusdistant customers. The preferred procedure, which is
– 243 –

Chapter 6: Measuring and Managing Customer Relationships
both accurate and simple to implement, is to use the$75 per hour costing rate, and calculate the timerequired for each delivery. You can point out thattoday’s technology and information systems (such asGPS to track trucks in real time and hand-heldcomputers that truck drivers can use to log in uponarrival and departure at a customer’s location) enableMidwest to use cost drivers that are more specific andaccurate for individual customers, rather thanaverages! In general, Midwest could even track thetime used at the customer’s site if it had to deliverto multiple locations.
At Kemp’s, the dairy company described in the sidebarof the assigned HBR article, drivers have computerentry device in their trucks. They record when leavinga company’s warehouse, when they arrive at the nextsite, and when they leave that site. The data areautomatically uploaded to Kemp’s ERP and costingsystem.
For desktop deliveries, orders are costed only forthe capacity they use. Suppose the same $450,000 ofresources for desktop delivery were supplied duringthe year but only 1,500 desktop deliveries were made.Then the traditional cost per DD would have beencalculated at $300 per direct delivery, not the $225previously calculated. So the cost assigned fluctuateswith capacity utilization, which is not a good idea.With the time-driven approach, the cost rateautomatically stays at $75/hour and orders are chargedonly for the hours they use. The cost of unusedcapacity is reported each month—for managementattention. This is subject of the technical note,
– 244 –

Atkinson, Solution Manual t/a Management Accounting, 6E
which can be assigned as optional reading for theclass.
At this point, the instructor can step back from thecalculation details to get the class focused on thebig picture, about when and why companies benefit fromhaving a more accurate costing system.
Q: When is it worth tracking this much detail tocustomer orders (the cost of processes and the unittimes used on the process by various orders ordeliveries)?
1.The Willie Sutton rule:4 Look for areas withlarge expenses in indirect and supportresources, especially where such expenseshave been growing over time. Operationswhere almost all expenses are direct laborand direct materials, which can already bedirectly traced to individual products bytraditional costing systems, may have lessneed for ABC systems.
2.High Diversity rule: Look for a situation inwhich large variety exists in products,
4 Willie Sutton was a successful bank robber in the United Statesduring the 1950s. Willie, who was eventually captured at his home not far from a local police station, was asked during his initial interrogation, “Why do you rob banks?” Willie replied, with the wisdom that had made him successful for many years, “That’s where the money is!” When developing ABC systems, we should follow Willie’s sage advice (but not his particular application of the insight) to focus on high cost areas where improvements in visibility and action could produce major benefits to the organization. Applying an ABC analysis to a set of resource expenses that are below 1% of total spending will not lead to highpayoffs to the organization.
– 245 –

Chapter 6: Measuring and Managing Customer Relationships
customers, or processes. For example,consider a facility that produces matureand newly introduced products, standardand custom products, and high-volume andlow-volume products. For marketing andselling expenses, companies may have amixture of customers who order high-volume, standard products with few specialdemands as well as customers who order insmall volumes, special products, andrequire large quantities of pre-sales andpost-sales technical support.
(b) and (c)
We are finally ready to cost the five orders. Irecommend having a student estimate the cost for Order1 and Order 2 and then hand out TN Exhibit 6-3, whichcontains the proposed solution, based on the modelcost estimates
Order 1 and Order 2 seem identical, except that theprice for Order 2 is 4% higher because it involvesdirect delivery. Thus Order 2’s gross margin issubstantially higher than for Order 1. Companiesoperating with a traditional or contribution margincosting system will celebrate the success of theirdirect delivery option. But the ABC analysis revealsthat Order 2 requires far more resources to fulfill,involving $300 of delivery resources, $4.38 more inorder entry resources (because of manual order entry),and nearly $20 more in finance charges because of itslong collection period. So rather than being the moreprofitable order, Order 2 has a profit margin of minus
– 246 –

Atkinson, Solution Manual t/a Management Accounting, 6E
40%, compared to the attractive positive 6.6% netmargin from Order 1.
One can go into more detail by showing that thecustomer has willingly paid $24 extra for the directdelivery option, but Midwest has incurred $294 inhigher delivery costs to offer this option. Directdelivery is part of Midwest’s differentiatingstrategy, to develop more sales and higher customerloyalty by offering additional features and servicethat the customer values (and is willing to pay morefor). But a differentiation strategy is onlysuccessful if the value created by the differentiation(the $24 price premium) exceeds the company’s cost($300) for providing the differentiating service. Inthis case, the differentiation strategy is a quitespectacular failure, at least for single cartondeliveries.
Orders 3 and 4 are the same as Orders 1 and 2 exceptthat they are scaled by a factor of 10. Order 4 nowmakes a positive profit contribution and it isbreaking even on its direct delivery service; theincremental revenues of $24 per carton now generate$240 of additional revenues, which equals theincremental costs of $240 ($300 – $60) for directversus commercial delivery of the cartons. Also, bypaying in 120 days, rather than 30 days, its financingcosts are nearly $200 higher than for Order 3. Inaddition, manual ordering costs decrease profits. Soeven with the higher scale of operations, with a grossmargin $240 higher than for Order 3, Order 4 has lessthan half the profit margin of Order 3.
– 247 –

Chapter 6: Measuring and Managing Customer Relationships
Order 5 illustrates the impact of the hidden costsassociated with manual order entry and long paymentterms. It is the same as Order 3, except for manualversus electronic ordering and payment in 120 ratherthan 30 days. These seemingly innocuous changes reducethe profit margin by nearly 50%, a very importantissue for companies with small operating margins.
Q: What do you suggest Midwest should do, based on itsnew cost estimates?I recommend grouping the recommendations under the
three columns, shown below, without necessarilylabeling the columns as you accept suggestions fromthe class.
Process Improve Pricing
OrderAcceptance/Modify CustomerRelationships
Route optimization
Specific chargesfor DD based on number of drop points, distance(time) traveled
Reject small orders; establish minimum order size
Migrate customers to more efficient channels (EDI)
Discounts for EDI orders
Limit distances for DD
Improve efficiency of warehouse operations, and order entry process
Menu-based pricing
Standard delivery, packaging
– 248 –
Atkinson, Solution Manual t/a Management Accounting, 6E
Customer picks up at warehouse;price quoted FOB
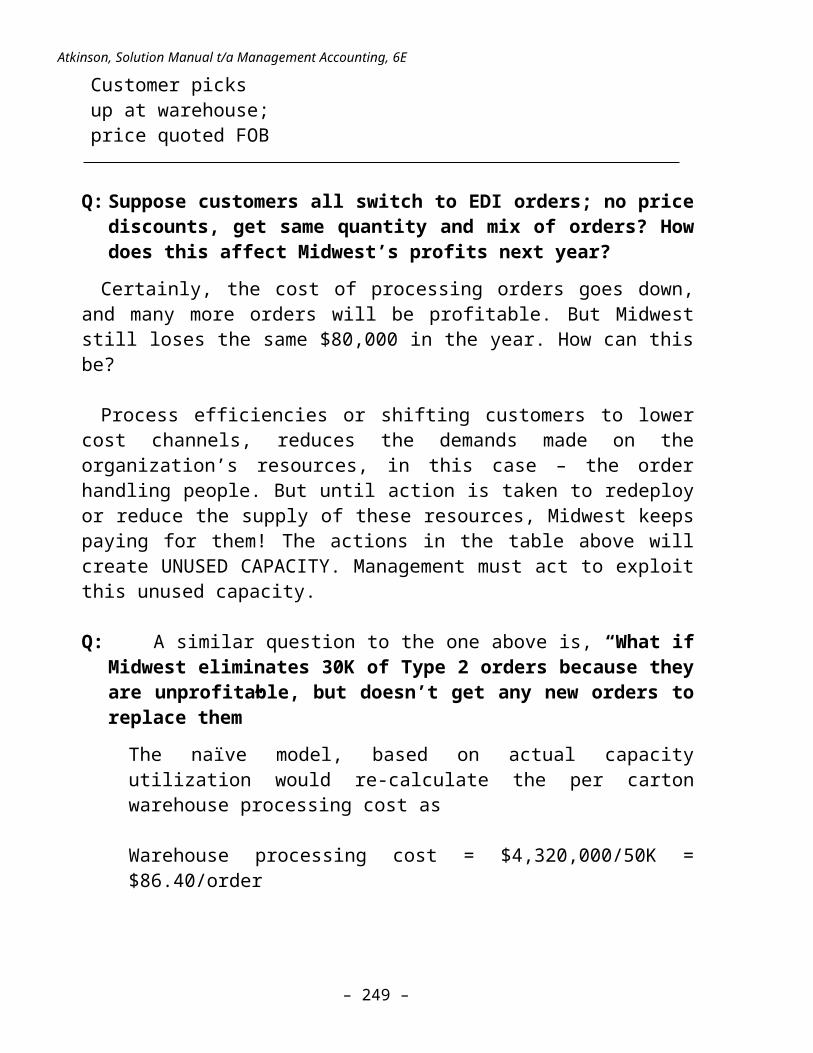
Q: Suppose customers all switch to EDI orders; no pricediscounts, get same quantity and mix of orders? Howdoes this affect Midwest’s profits next year?Certainly, the cost of processing orders goes down,
and many more orders will be profitable. But Midweststill loses the same $80,000 in the year. How can thisbe?
Process efficiencies or shifting customers to lowercost channels, reduces the demands made on theorganization’s resources, in this case – the orderhandling people. But until action is taken to redeployor reduce the supply of these resources, Midwest keepspaying for them! The actions in the table above willcreate UNUSED CAPACITY. Management must act to exploitthis unused capacity.
Q: A similar question to the one above is, “What ifMidwest eliminates 30K of Type 2 orders because theyare unprofitable, but doesn’t get any new orders toreplace them”The naïve model, based on actual capacityutilization would re-calculate the per cartonwarehouse processing cost as
Warehouse processing cost = $4,320,000/50K =$86.40/order
– 249 –

Chapter 6: Measuring and Managing Customer Relationships
The risk to Midwest is it now starts to drop Type4 and Type 5 orders leading to a death spiral.This is why resources should be costed atpractical capacity, not actual utilization. It isbetter to keep the warehousing cost rate at $54per carton and report 30K × $54 = $1,620K asunused capacity.
You can close the class by pointing out the next stepsin extending the ABC analysis beyond the accuratecosting of individual orders:
Analyze and assign general and selling costs Drive selling and order costs to customer;
calculate cost-to-serve individual customers Customer profitability: aggregate all orders by
individual customers(d)
i.Using the order entry times stated in part (a)(2), if Midwest processes 40,000 manual ordersper year, with a total of 200,000 line items toenter, and processes 30,000 electronic orders,then Midwest requires (40,000 × 0.15) + (200,000× 0.075) + (30,000 × 0.1) = 24,000 hours peryear, which equals the current practicalcapacity. Therefore, the company needs all 16operators and there is no unused capacity.
ii. Midwest will require (20,000 × 0.15) +(100,000 × 0.075) + (50,000 × 0.1) = 15,500hours per year, which requires 10.33 operators.The cost per operator is $840,000/16 = $52,500.If order entry costs can be reduced in
– 250 –
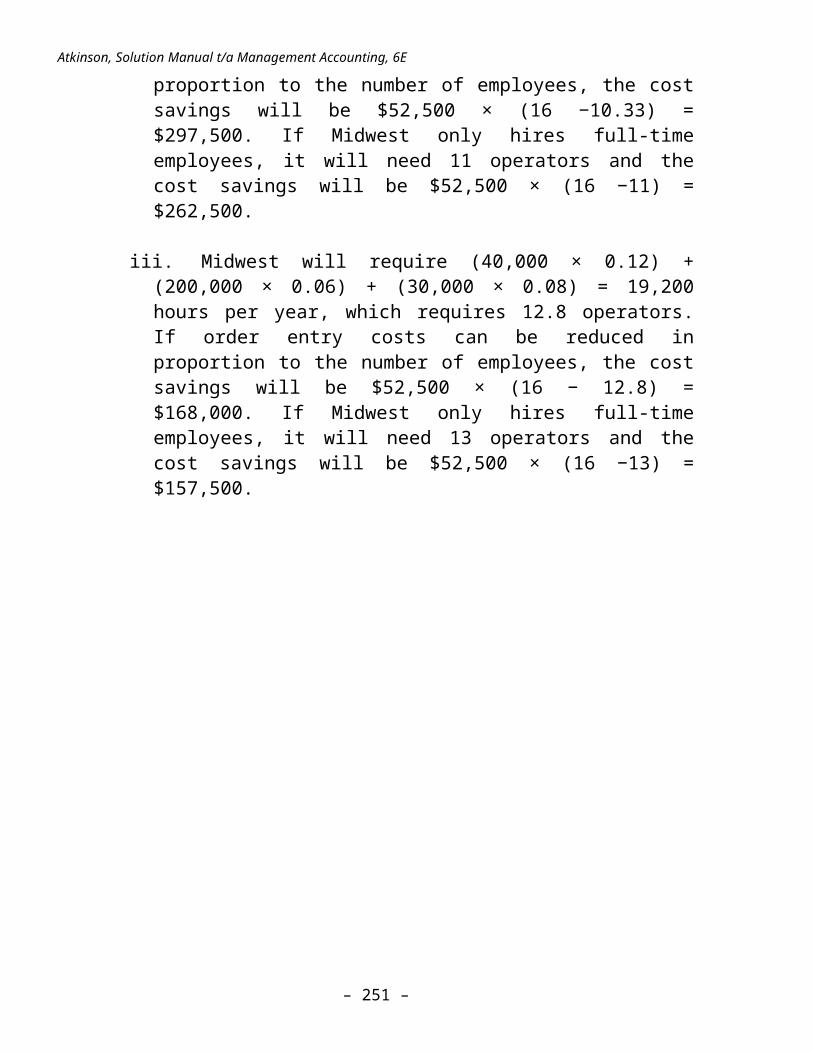
Atkinson, Solution Manual t/a Management Accounting, 6E
proportion to the number of employees, the costsavings will be $52,500 × (16 −10.33) =$297,500. If Midwest only hires full-timeemployees, it will need 11 operators and thecost savings will be $52,500 × (16 −11) =$262,500.
iii. Midwest will require (40,000 × 0.12) +(200,000 × 0.06) + (30,000 × 0.08) = 19,200hours per year, which requires 12.8 operators.If order entry costs can be reduced inproportion to the number of employees, the costsavings will be $52,500 × (16 − 12.8) =$168,000. If Midwest only hires full-timeemployees, it will need 13 operators and thecost savings will be $52,500 × (16 −13) =$157,500.
– 251 –
Chapter 6: Measuring and Managing Customer Relationships
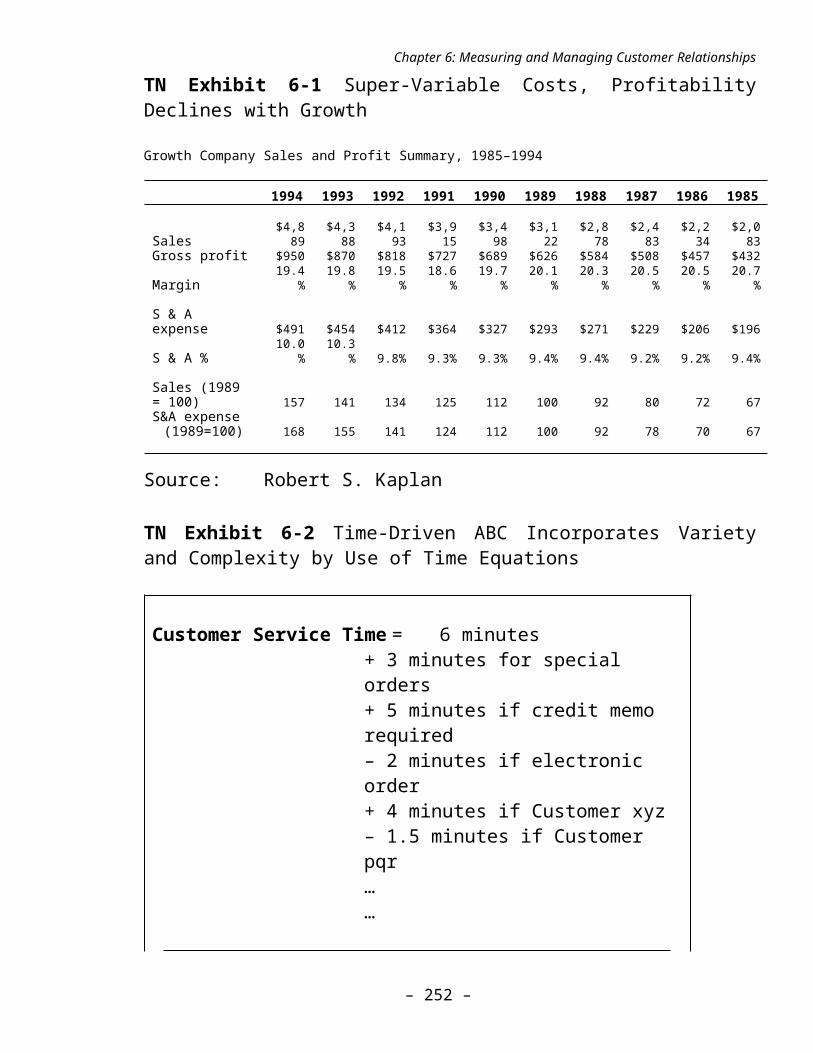
TN Exhibit 6-1 Super-Variable Costs, ProfitabilityDeclines with Growth
Growth Company Sales and Profit Summary, 1985–1994
1994 1993 1992 1991 1990 1989 1988 1987 1986 1985
Sales$4,8
89$4,3
88$4,1
93$3,9
15$3,4
98$3,1
22$2,8
78$2,4
83$2,2
34$2,0
83Gross profit $950 $870 $818 $727 $689 $626 $584 $508 $457 $432
Margin19.4
%19.8
%19.5
%18.6
%19.7
%20.1
%20.3
%20.5
%20.5
%20.7
%
S & A expense $491 $454 $412 $364 $327 $293 $271 $229 $206 $196
S & A %10.0
%10.3
% 9.8% 9.3% 9.3% 9.4% 9.4% 9.2% 9.2% 9.4%
Sales (1989 = 100) 157 141 134 125 112 100 92 80 72 67S&A expense (1989=100) 168 155 141 124 112 100 92 78 70 67
Source: Robert S. Kaplan
TN Exhibit 6-2 Time-Driven ABC Incorporates Varietyand Complexity by Use of Time Equations
Customer Service Time = 6 minutes+ 3 minutes for special orders+ 5 minutes if credit memo required– 2 minutes if electronic order+ 4 minutes if Customer xyz– 1.5 minutes if Customer pqr……
– 252 –
Atkinson, Solution Manual t/a Management Accounting, 6E
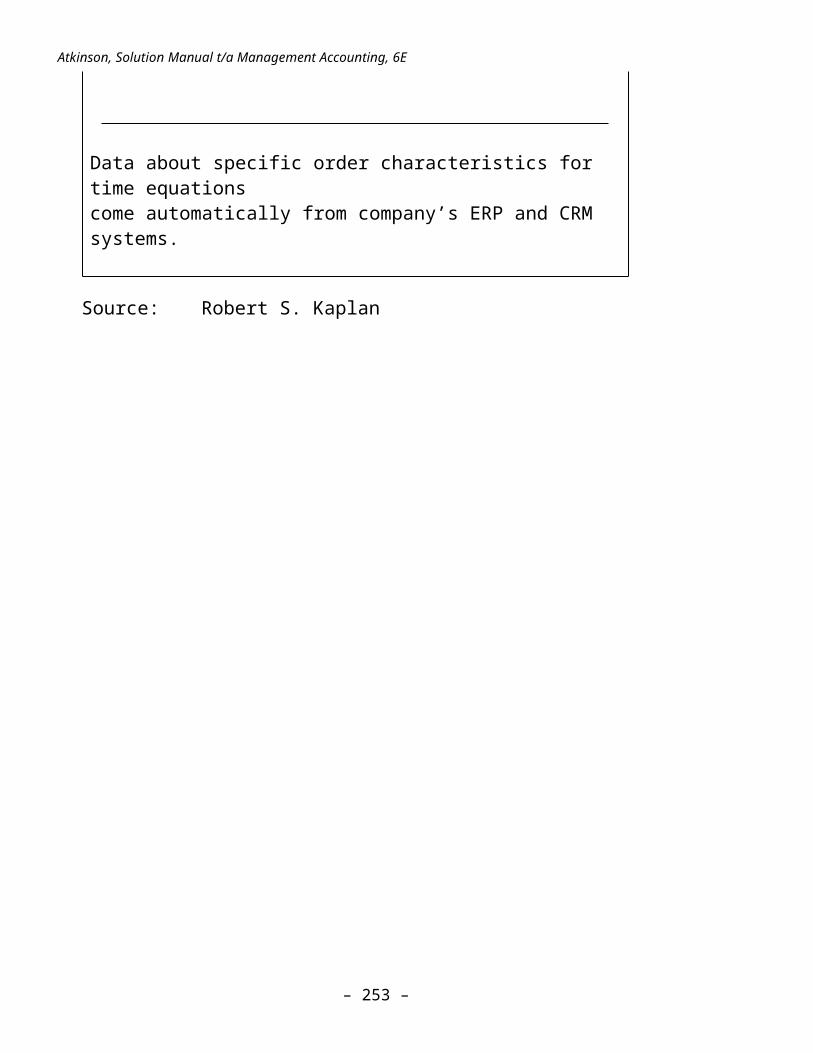
Data about specific order characteristics for time equations come automatically from company’s ERP and CRM systems.
Source: Robert S. Kaplan
– 253 –

Chapter 6: Measuring and Managing Customer Relationships
TN Exhibit 6-3 Five Order Profitability1 2 3 4 5
Sales $610.00
$634.00
$6,100.00
$6,340.00
$6,100.00
Cost of items purchased
500.00 500.00
5,000.0
0 5,000.0
0 5,000.0
0 Gross margin $110.0
0$134.0
0$1,100.
00$1,340.
00$1,100.
00Processing cartons 54.00 54.00 540.00 540.00 540.00Shipping cartons, commercial
6.00 0.00 60.00 0.00 60.00
Desktop deliveries 0.00 300.00 0.00 300.00 0.00Process manual order 0.00 5.25 0.00 5.25 5.25Process line items, manual orders
0.00 2.63 0.00 26.25 26.25
Validate EDI order 3.50 0.00 3.50 0.00 0.00Interest on receivable
6.10 25.36
61 .00
253 .60
244.00
Total processing costs
$ 69.60
$387.24
$ 664.50
$1,125.10
$ 875.50
Order profitability $ 40.40
($253.24)
$ 435.50
$ 214.90
$ 224.50
Return on sales 6.6% -39.9% 7.1% 3.4% 3.7%
Source: Robert S. Kaplan
– 254 –
Related Documents