146 CHAPTER - 6 PERIGLACIAL ENVIRONMENT, PROCESSES AND LANDFORMS 6.1 Introduction to Periglacial environment In literal meaning Periglacial is an adjective originally referring to climatic and geomorphic conditions found in the edges of Pleistocene ice sheets and glaciated areas (as proposed by the Polish geologist Lozinski, 1912) but has later on been widely used in geomorphology to describe any place where geomorphic processes related to intense frost action occur. Since that time, the term has undergone substantial revision and no universally accepted definition came into being. Some researchers have suggested rigorous definitions based solely upon climate like Troll (1944). Peltier (1950) also suggested that the periglacial climate was charecterised by mean annual air temperatures of between -15 0 C and -1 0 C, precipitation of between 120 and 1400 mm per annum. He also identified periglacial environment to have ‘intense frost action, strong mass movement, and the weak importance of running water’. In its original meaning a periglacial area was not buried by glacial ice but was subject to intense freezing cycles and exhibits permafrost weathering and erosion characteristics. The severe frost action and frozen ground promote significant mechanical weathering, fine and coarse-grain sorting, and mass movements (Péwé, 1969 & 1975). As Péwé suggested though Permafrost is not prerequisite, it is practically ubiquitous in the periglacial environment. Washburn (l979) identified periglacial as ‘.... primarily terrestrial, non-glacial processes and features of cold climates characterised by intense frost action regardless of age and proximity to glaciers’. The term 'Periglacial' is employed in this broad sense to-day. Hence, the term periglacial refers to the conditions, processes and landforms associated with cold, non-glacial environments. Approximately 25 percent of the earth's land surface qualifies as periglacial at this time (Gerrard 1992, c.f. Chattopadhyay, 1998). Periglacial geomorphology developed in the 1940s–1960s as a branch of climatic geomorphology. In the initial stages periglacial geomorphology focused on Quaternary studies and Palaeo-Environmental reconstructions, later on it emphasized on current geomorphic activity in cold regions, as per Embleton & King, (1975). In the 1960s–1970s periglacial geomorphology was dominated by the freeze- thaw phenomena along with frost action as the sole periglacial

Welcome message from author
This document is posted to help you gain knowledge. Please leave a comment to let me know what you think about it! Share it to your friends and learn new things together.
Transcript
146
CHAPTER - 6
PERIGLACIAL ENVIRONMENT, PROCESSES AND LANDFORMS
6.1 Introduction to Periglacial environment In literal meaning Periglacial is an adjective originally referring to climatic and
geomorphic conditions found in the edges of Pleistocene ice sheets and glaciated areas (as
proposed by the Polish geologist Lozinski, 1912) but has later on been widely used in
geomorphology to describe any place where geomorphic processes related to intense frost action
occur. Since that time, the term has undergone substantial revision and no universally accepted
definition came into being. Some researchers have suggested rigorous definitions based solely
upon climate like Troll (1944). Peltier (1950) also suggested that the periglacial climate was
charecterised by mean annual air temperatures of between -150 C and -10 C, precipitation of
between 120 and 1400 mm per annum. He also identified periglacial environment to have
‘intense frost action, strong mass movement, and the weak importance of running water’. In its
original meaning a periglacial area was not buried by glacial ice but was subject to intense
freezing cycles and exhibits permafrost weathering and erosion characteristics. The severe frost
action and frozen ground promote significant mechanical weathering, fine and coarse-grain
sorting, and mass movements (Péwé, 1969 & 1975). As Péwé suggested though Permafrost is
not prerequisite, it is practically ubiquitous in the periglacial environment. Washburn (l979)
identified periglacial as ‘.... primarily terrestrial, non-glacial processes and features of cold
climates characterised by intense frost action regardless of age and proximity to glaciers’. The
term 'Periglacial' is employed in this broad sense to-day. Hence, the term periglacial refers to
the conditions, processes and landforms associated with cold, non-glacial environments.
Approximately 25 percent of the earth's land surface qualifies as periglacial at this time (Gerrard
1992, c.f. Chattopadhyay, 1998).
Periglacial geomorphology developed in the 1940s–1960s as a branch of climatic
geomorphology. In the initial stages periglacial geomorphology focused on Quaternary studies
and Palaeo-Environmental reconstructions, later on it emphasized on current geomorphic activity
in cold regions, as per Embleton & King, (1975). In the 1960s–1970s periglacial geomorphology
was dominated by the freeze- thaw phenomena along with frost action as the sole periglacial

geomorphic activity. Such a view was severely criticized in the 1980s–1990s based both on
monitoring studies and on time–space multiscale approaches that attempted to search for the real
past and present processes responsible for the landform geometry. According to Andre, (2009)
the role of rock properties and the pre-Quaternary history of slope systems were re-evaluated and
taken into account, thereby minimizing the dominance of only cold climatic conditions and
related processes. The interest of genuine periglacial landforms as geo-indicators of climate
change was growing. Polar and Alpine regions are nowadays considered as the prime location for
analyzing climatic changes, and presently periglacial geomorphologists are greatly involved in
the detection, monitoring and prediction of environmental changes which is well indicated
through periglacial landform evolution. Thus, the evolution of periglacial geomorphology over
the past six decades has been in accordance with the quantitative and technological revolution
and its application in the field of Quaternary Geomorphology as a whole.
French (1976) identified four types of periglacial environments.
1. High arctic climates in polar latitudes; with large seasonal but small diurnal temperature
fluctuations (e.g., the Canadian arctic).
2. Continental subarctic climates with large seasonal but small diurnal temperature pattern;
extreme annual temperature range (e.g., interior Alaska including the upper Copper River
watershed).
3. Alpine climates in the middle latitudes with large seasonal and diurnal temperature
fluctuations (e.g., the summits of the European Alps, Himalaya etc).
4. Other climates of low annual temperature range in azonal locations widely distributed
with small seasonal and diurnal temperature fluctuations (e.g., some subarctic islands and some
summits of the South American Andes and the Hawaiian Seamounts).
Presently, two distinct domains of periglacial environment in the world are considered:
1) Arctic and Sub-arctic zones (ice-free polar desert and Northern forests) where thick layer
of permafrost or perennially frozen ground occurs, and
2) Alpine zones (mountain regions above timber-line and close to snow-ice and glaciers).
147

148
6.2 Periglacial processes and landforms Periglacial environment is dominated by some typical processes leading to the formation
of unique landform patterns. Some processes are Zonal in nature like the frost action and
weathering processes along with some types of mass movements while others are Azonal
operating in either humid (fluvial) or semi arid (Aeolian) environments (Dylik, 1964 & French,
1976). Even if the Late Pleistocene period is considered periglacial conditions occurred a number
of times, but of varying duration and intensity and they too are charecterised by three conditions,
namely a) intense frost action, b) presence of continuous or discontinuous perennially frozen
grounds and c) strong wind action.
The processes that are charecterised in the periglacial regions of the present day are
discussed as follows:
A. Frost Weathering or Gelifraction is the chief process, preparing bed rock for erosion. It
includes the various weathering processes like development of permanently frozen ground
(Permafrost) with ice segregation combined with thermal contraction of ground under intense
freeze and thaw. It also initiates disintegration of surface rocks by frost wedging and a
complex of frost activity within the seasonally thawed layer like frost heaving, soil churning,
frost cracking, frost shattering etc as conceived by Ball and Goodier (1970). In areas outside
the permafrost ground during warmer season water penetrates in the rock body through
cracks and fissures and on freezing (as a result of 9% volume increase) it exerts pressure thus
breaking down the rock in smaller fragments.
The frost action process is most important in periglacial landscape modification, of which
freeze-thaw cycle is the dominant one. Three basic frost action processes are separately
enlisted below, though they occur in a combined manner. They are:

Plate 6.1: Frost wedging on the bed rock in Rohtang pass area
Plate 6.2: Partly snow covered snow shattered rocks along with development of ice wedges in Rohtang Pass area.
Plate 6.3: Evidences of frost shattering and frost heaving in moist geliflucted slopes in Beas Kund region. 149
150
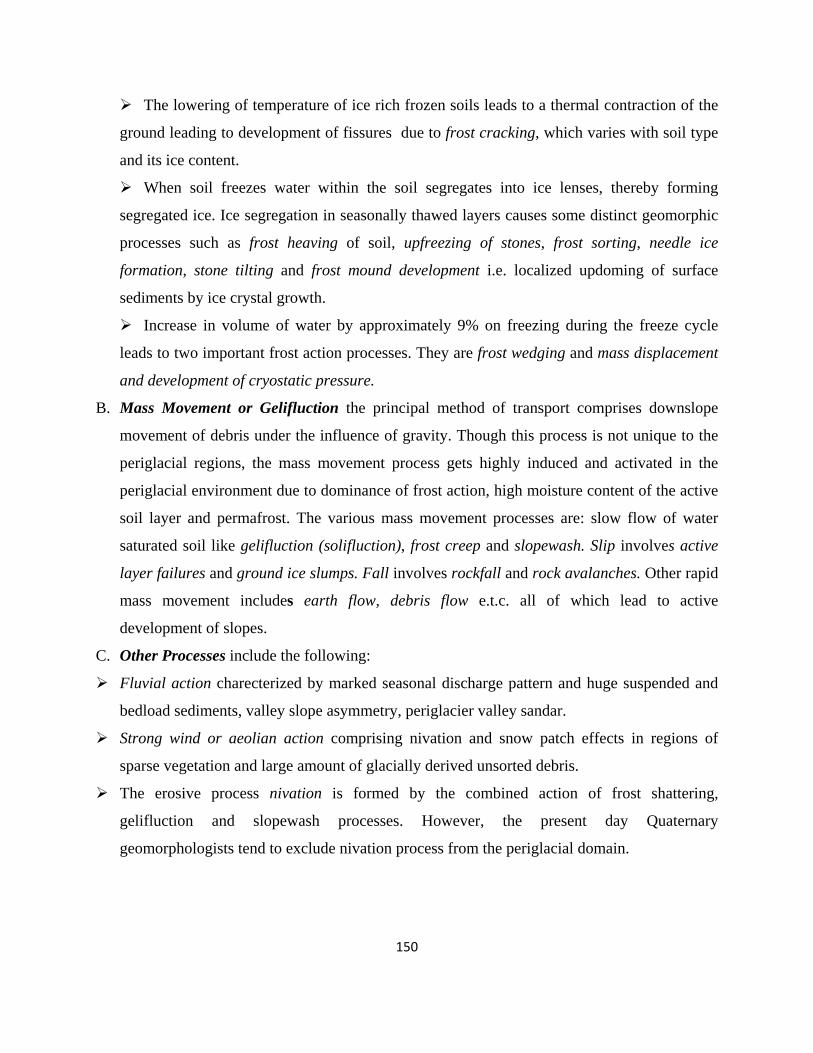
The lowering of temperature of ice rich frozen soils leads to a thermal contraction of the
ground leading to development of fissures due to frost cracking, which varies with soil type
and its ice content.
When soil freezes water within the soil segregates into ice lenses, thereby forming
segregated ice. Ice segregation in seasonally thawed layers causes some distinct geomorphic
processes such as frost heaving of soil, upfreezing of stones, frost sorting, needle ice
formation, stone tilting and frost mound development i.e. localized updoming of surface
sediments by ice crystal growth.
Increase in volume of water by approximately 9% on freezing during the freeze cycle
leads to two important frost action processes. They are frost wedging and mass displacement
and development of cryostatic pressure.
B. Mass Movement or Gelifluction the principal method of transport comprises downslope
movement of debris under the influence of gravity. Though this process is not unique to the
periglacial regions, the mass movement process gets highly induced and activated in the
periglacial environment due to dominance of frost action, high moisture content of the active
soil layer and permafrost. The various mass movement processes are: slow flow of water
saturated soil like gelifluction (solifluction), frost creep and slopewash. Slip involves active
layer failures and ground ice slumps. Fall involves rockfall and rock avalanches. Other rapid
mass movement includes earth flow, debris flow e.t.c. all of which lead to active
development of slopes.
C. Other Processes include the following:
Fluvial action charecterized by marked seasonal discharge pattern and huge suspended and
bedload sediments, valley slope asymmetry, periglacier valley sandar.
Strong wind or aeolian action comprising nivation and snow patch effects in regions of
sparse vegetation and large amount of glacially derived unsorted debris.
The erosive process nivation is formed by the combined action of frost shattering,
gelifluction and slopewash processes. However, the present day Quaternary
geomorphologists tend to exclude nivation process from the periglacial domain.
151
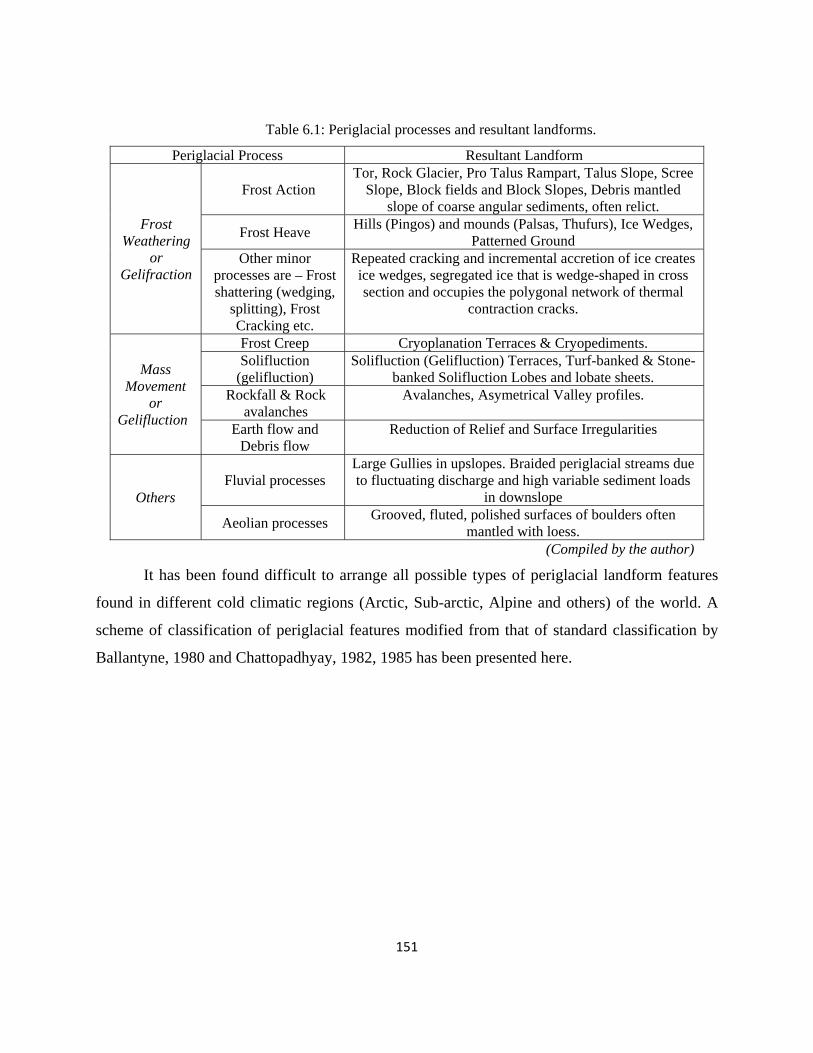
Table 6.1: Periglacial processes and resultant landforms.
Periglacial Process Resultant Landform
Frost Weathering
or Gelifraction
Frost Action Tor, Rock Glacier, Pro Talus Rampart, Talus Slope, Scree
Slope, Block fields and Block Slopes, Debris mantled slope of coarse angular sediments, often relict.
Frost Heave Hills (Pingos) and mounds (Palsas, Thufurs), Ice Wedges, Patterned Ground
Other minor processes are – Frost shattering (wedging,
splitting), Frost Cracking etc.
Repeated cracking and incremental accretion of ice creates ice wedges, segregated ice that is wedge-shaped in cross section and occupies the polygonal network of thermal
contraction cracks.
Mass Movement
or Gelifluction
Frost Creep Cryoplanation Terraces & Cryopediments. Solifluction
(gelifluction) Solifluction (Gelifluction) Terraces, Turf-banked & Stone-
banked Solifluction Lobes and lobate sheets. Rockfall & Rock
avalanches Avalanches, Asymetrical Valley profiles.
Earth flow and Debris flow
Reduction of Relief and Surface Irregularities
Others Fluvial processes
Large Gullies in upslopes. Braided periglacial streams due to fluctuating discharge and high variable sediment loads
in downslope
Aeolian processes Grooved, fluted, polished surfaces of boulders often mantled with loess.
(Compiled by the author)
It has been found difficult to arrange all possible types of periglacial landform features
found in different cold climatic regions (Arctic, Sub-arctic, Alpine and others) of the world. A
scheme of classification of periglacial features modified from that of standard classification by
Ballantyne, 1980 and Chattopadhyay, 1982, 1985 has been presented here.
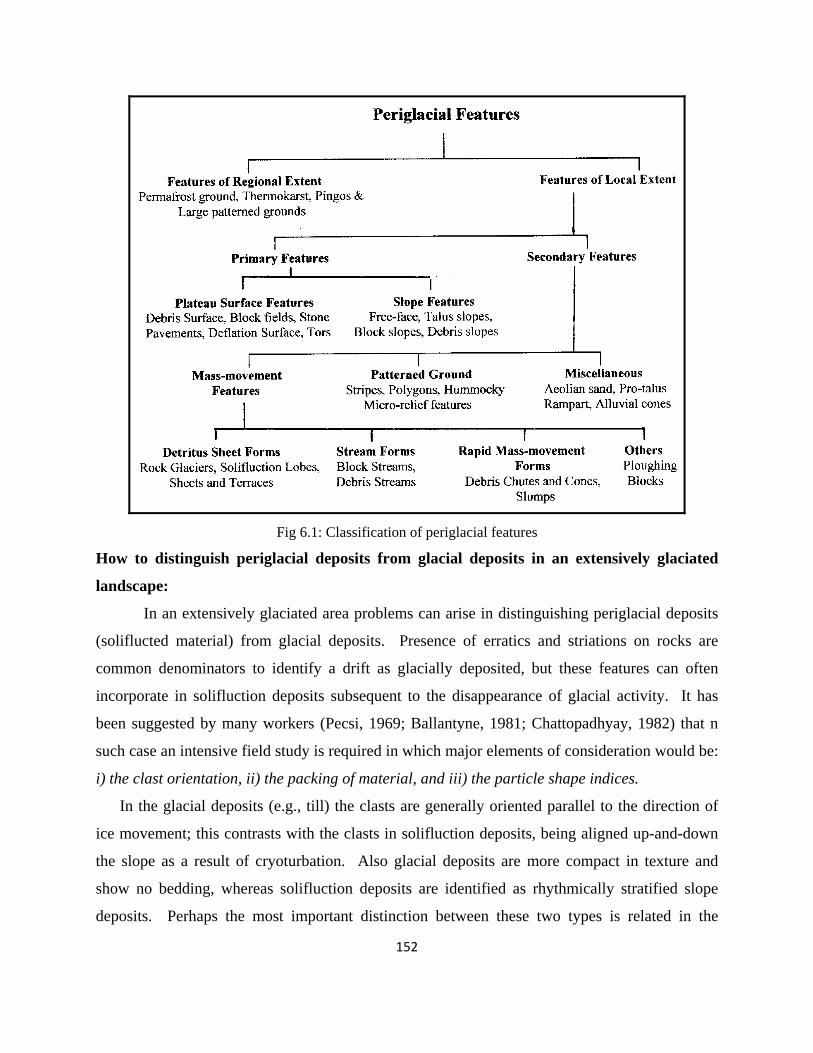
Fig 6.1: Classification of periglacial features
How to distinguish periglacial deposits from glacial deposits in an extensively glaciated
landscape:
In an extensively glaciated area problems can arise in distinguishing periglacial deposits
(soliflucted material) from glacial deposits. Presence of erratics and striations on rocks are
common denominators to identify a drift as glacially deposited, but these features can often
incorporate in solifluction deposits subsequent to the disappearance of glacial activity. It has
been suggested by many workers (Pecsi, 1969; Ballantyne, 1981; Chattopadhyay, 1982) that n
such case an intensive field study is required in which major elements of consideration would be:
i) the clast orientation, ii) the packing of material, and iii) the particle shape indices.
In the glacial deposits (e.g., till) the clasts are generally oriented parallel to the direction of
ice movement; this contrasts with the clasts in solifluction deposits, being aligned up-and-down
the slope as a result of cryoturbation. Also glacial deposits are more compact in texture and
show no bedding, whereas solifluction deposits are identified as rhythmically stratified slope
deposits. Perhaps the most important distinction between these two types is related in the
152

153
particle-shape indices. Under periglacial conditions the particle-shape characteristics of frost-
shattered detritus are dependent upon relative frequency of horizontal and vericlal planes of
weakness. Slabby clasts with low c:a (bredth : length) axis ratios are characteristic of soliflucted
material on many rock types where horizontal planes of weakness are frequent. By contrast,
clasts of glacially deposited material are often pre-dominantly blocky with greater c:a axis ratios.
6.3 Periglacial environment in the Himalaya: An Assessment and Literature
Review The Himalayan periglacial environment is essentially identified as Alpine periglacial
zone. The extent of available literature dealing with periglacial environment and processes in the
Himalaya so far is not only very limited but also have, in most cases, incomplete as well as
confusing owing to the absence of methodical observation and knowledge in this branch of
geomorphology.
Firstly, in many cases glacial drift deposits have mistakably been identified as the product of
periglacial processes;
Secondly, lumps of shattered debris actually resulted under paraglacial processes (a process
which operate to shatter the deglaciated valley walls following rapid retreat of glaciers) often
posed challenge to the Geomorphologists to separate them from the periglacially derived ones
particularly since they normally occur in the same cold environment, and
Thirdly, the presence of shattered blocks in the periglacial environment which have resulted
entirely from activities of tensional and compression forces acting in the seismically sensitive
rock structure in this young fold mountain system also create problems. They often look quite
similar to that produced by frost shattering under periglacial processes.
Geomorphologists like Brozovic, Burbank and Meigs (1997) reported the upper limit of
active periglacial processes in the Karakoram area in the Kashmir Himalaya.
Information on periglacial environments, processes and landforms in the Nepal Himalaya
is relatively adequate. Many Oriental and Oxidental geographers studied periglacial
environmental conditions in Nepal Himalaya. Fuji & Higuchi (1976) studied ground temperature
conditions and its relation to permafrost occurrences in the Khumbu Himal and Hiddin valley in
Nepal. Fort (1987) studied solifluction and deflation processes under periglacial conditions in the

154
dry continental Himalaya in the Mustang district of Nepal. Fukui, Fujii, Ageta & Asahi (2007)
reported the ascent of the lower limit of permafrost in Khumbu Himal area from 5,300 m in 1973
to 5,400 to 5,500 m in 2004 under gradual global warming. Heimsath and McGlym (2008)
measured headwall retreat rate under periglacial weathering processes in the high altitude regions
of parts of the Nepal Himalaya.
The eastern Himalayan region has drawn attention of the periglacial geomorphologists
only recently. Kar (1969) conducted field work in periglacial zones of Sikkim and Darjeeling
Himalayas and made deduction on the mechanism of slope development under periglacial
conditions. He also tried to identify various periglacial landform features but most of the fluvial
and fluvio-glacial features were wrongly identified to be periglacial ones, as mentioned by
critics. Chattopadhyay (1984, 1985, 1998 & 2005) made systematic classification of periglacial
landforms in the Sikkim Himalaya around Kanchenjunga and studied the characteristics features
of these landforms. Starkel (2003) gave an account of solifluction terraces in the uplifting
mountain areas of the Himalaya and attributed them to the periglacial processes. Regmi and
Watanabe (2004) presented a paper on slow mass movement in Kanchenjunga area in 19th
Himalaya–Karakoram-Tibet workshop in NISEKO, Japan. They observed the solifluction
processes operating under periglacial conditions as well as measured and monitored ground
temperature and soil moisture. In the same workshop Iwata, Karma, Ageta, Sakai, Narama, and
Naito (2004) reported periglacial features including rock glaciers in the Lunana area in Bhutan
Himalaya.
6.4 Periglacial processes and landforms identified in the mountains of the
Upper Beas Basin The Upper Beas Basin in the Kullu valley encompasses the Alpine Periglacial
environmental condition. The region is quite conducive for periglacial processes under the
existing Alpine periglacial condition and exhibits a wide variety of typical landforms produced
thereby.. The active periglacial zone in the study area extends from above the timber line
(3,800m) to the perpetual snow line (4,600m). Above the timber line the greater part of the
ground surface is of relatively low slope gradient and is covered in most parts by the patches of
green grassy Alpine meadow, locally known as ‘Thatch’ and exhibits numerous periglacial
155
features. This area is often traversed by old morainic ridges as remnants of past Pleistocene
glaciation. Periglacially derived detritus (in the form of scree slope and associated features)
cover the steeper mountain slopes of the higher altitudes up to the perpetual snow-line.
The major difficulty for a systematic geomorphological study of this part of Himalayas is the
absence and inaccessibility of any detailed geological and geographical report mainly due to
strategic reason. As no systematic investigation and analyses of periglacial landforms have been
done in this part so far, the literature published till now have only passing mention of the
Quaternary environmental condition of the Western Himalaya in general.. Owing to the absence
of methodical observation and knowledge in this branch of geomorphology certain landforms
have often been mistakably identified and have raised confusion as mentioned in previous
chapter 6.3. In spite of the difficulties an attempt has been made to make a detail survey of the
most prominent and accountable landform features in the Upper Beas Basin. The principal
characteristics of periglacial landform features of this area can be interpreted as follows:
The footprints of periglacial phenomena in distinguished forms are distributed above the
timberline.
The past climate of this region was sufficiently cold, with greater temperature range to permit
extensive frost shattering. This view is supported by the presence of frost shattered material
in the form of debris slopes, talus slopes and block slopes with clasts of large volumes
covered with lichens and moss.
The past periglacial climate in this region in the late glacial times was much more intensive
during which landforms comprising massive blocks of rock fragments occurred and with
gradual disappearance of this harsh periglacial condition these features have turned into relict
forms.
All major periglacial landforms occur outside the morainic limits and there are evidences that
in many cases the surface profile of the morainic drifts have been reworked by periglacial
activity
In the past, when the periglacial climate was more intensive (during the later part of the
Pleistocene) the massive features like Block slope, block fields and debris slopes developed
extensively in this region under large scale frost shattering and frost wedging under this harsh
climate that subsequently moved down slope, giving rise to the major slope features. The

present day periglacial activity in this region operates at smaller scale producing rockfall
features from cliffs and the associated talus slopes, along with slow down slope movement of
gelifluction lobes and terraces.
Types of periglacial landform features found in the study area
Owing to steeper slopes and presence of glacial drift deposits along with extensive cliff
walls all possible types of periglacial landforms are not found on the mountains around the
Upper Beas basin. Moreover, the solifluction and associated features at the lower levels that
could have occurred during the harsher periglacial climate in the past now remain under
vegetation cover and it is difficult to identify them. Periglacial landforms were studied in two
selected areas namely Baukar Thatch (near the Beas Kund) and Rohtang Pass. The principal
types of periglacial features occurring in these two areas were found to have preserved in the
form of:
A. Talus Slope: Talus slope is the hill slope covered with a veneer of shattered angular rocks
and fines with a cliff-wall behind, showing the area from where the materials have been
derived under frost riving and frost shattering processes. Talus slopes are usually concave
with the steeper section occurring towards the top of the slope and they have a thickness less
than 5 m that mantles a bedrock surface. Talus slope reflects a balance between accumulation
by rockfall on one hand which is greatest near the foot of the free face and spreading of
material outwards from the base by slush avalanches and debris flow as well as presence or
absence of basal erosion. A photographic evidence of Talus Slope in Kothi near Rohtang
Pass is shown in Plate 6.4
Plate 6.4: Talus Slope in Kothi near Rohtang Pass 156

B. Block Fields or ‘Felsenmeer’: These are extensive fields of angular boulders, rocks, and
coarse debris and rubble accumulations, with a gentle gradient below 10 . They are formed in
areas of exposed rock surfaces, relatively hard and well bedded which are susceptible to
intense frost wedging along major joints and bedding planes. The block fields are usually
conceived as relic features, but as the age and rate of formation of block fields and related
features like block slope (discussed below) cannot be clearly stated, they are of limited use in
Pleistocene periglacial reconstruction. A photographic evidence of Block Fields or
‘Felsenmeer’ near Beas Kund region is shown in Plate 6.5
0
Plate 6.5: Block Fields or ‘Felsenmeer’ near Beas Kund region
C. Block Slope: Block slope is a slope covered with large angular blocks with very little amount
of fines. The blocks are assumed to have developed in situ and have been derived under
intensively cold climate through the process of large scale frost shattering. (discussed in detail
in Chapter 7.5) Block Slope near Beas Kund region is shown in Plate 6.6
Plate 6.6: Block Slope near Beas Kund region 157

D. Debris Slope: Debris slope is a relatively smooth slope profile, with no abrupt break of
slopes, covered with a veneer of debris comprising both stones and fines resulting from frost
shattering and solifluction of rocks. In common with that of Block Slope the debris in this
instance, is produced in situ. They have no free face or bedrock outcrop and depending upon
lithology the slope angle varies from 100 to as high as 25–300. The slope profile is
dominantly convexo-concavo in form. Debris Slope near Beas Kund region is shown in Plate
6.7
Plate 6.7: Debris Slope near Beas Kund region
E. Protalus Rampart: It is a ridge of coarse angular rock debris found near the base of a steep
inland face consisting of frost-shattered debris. They are formed at the base of a large semi
permanent or permanent snow bank which existed below the free face, with the blocks
detaching them from the free face through frost wedging and then sliding down the surface of
the snow bank. Therefore when snow melts these ridge like accumulations are seen to
develop some distance away from the base of the steep slope. Protalus Rampart near Rohtang
Pass region is shown in Plate 6.8
158

Plate 6.8: Protalus Rampart near Rohtang Pass region
F. Solifluction (Gelifluction) Lobes and Lobate Sheets: Solifluction (Gelifluction) Lobes and
Lobate Sheets are the micro features that occur on the slopes of the periglacial environment
in the form Crescentic (lobate) steps facing down slope. This indicates their contemporary
down slope movements. These Lobes and Lobate Sheets are composed of a mixture of coarse
and fine material. Under the process of frost creep and solifluction (gelifluction) these lobes
move slowly down slope. They can be formed of both fines and coarse material (debris lobe)
and mainly fines (soil lobe). Soil lobes and lobate sheet are found to have covered with turf
and thus they are popularly known as turf-coved solifluction (gelifluction) lobes. Solifluction
(Gelifluction) Lobes and Lobate Sheets near Rohtang Pass region is shown in Plate 6.9
Plate 6.9: Solifluction (Gelifluction) Lobes and Lobate Sheets near Rohtang Pass region
159

G. Patterned Ground: The surface of the periglacial regions are often covered by some micro-
relief features composed by a complex variety of patterns and small scale relief
configurations which are commonly termed patterned ground. According to Washburn
(1969) the origin of most forms of patterned ground are uncertain, they are polygenetic and
they may be both active and relict. These features are formed under the process of frost
sorting of the coarse and fine materials. The main geometric forms are – circles, polygons,
stripes, nets and steps, all of which may be sorted and unsorted. In the study area mainly non-
sorted polygons are found. Patterned Ground at Baukar Thatch near Beas Kund region is
shown in Plate 6.10
Plate 6.10: Patterned Ground at Baukar Thatch near Beas Kund region
H. Ploughing Blocks: Ploughing Blocks or Gliding Boulders are mainly found in the
subarctic and alpine environment. According to Chattopadhyay (1983) and Tufnell (1972,
1976) these are individual blocks resting on the solifluction (gelifluction) sheets showing a
furrow at the rear and a mound (bow-wave) in front. The altitudinal distribution of Ploughing
blocks is used for mapping the lower limit of Gelifluction in slopes of periglacial regions.
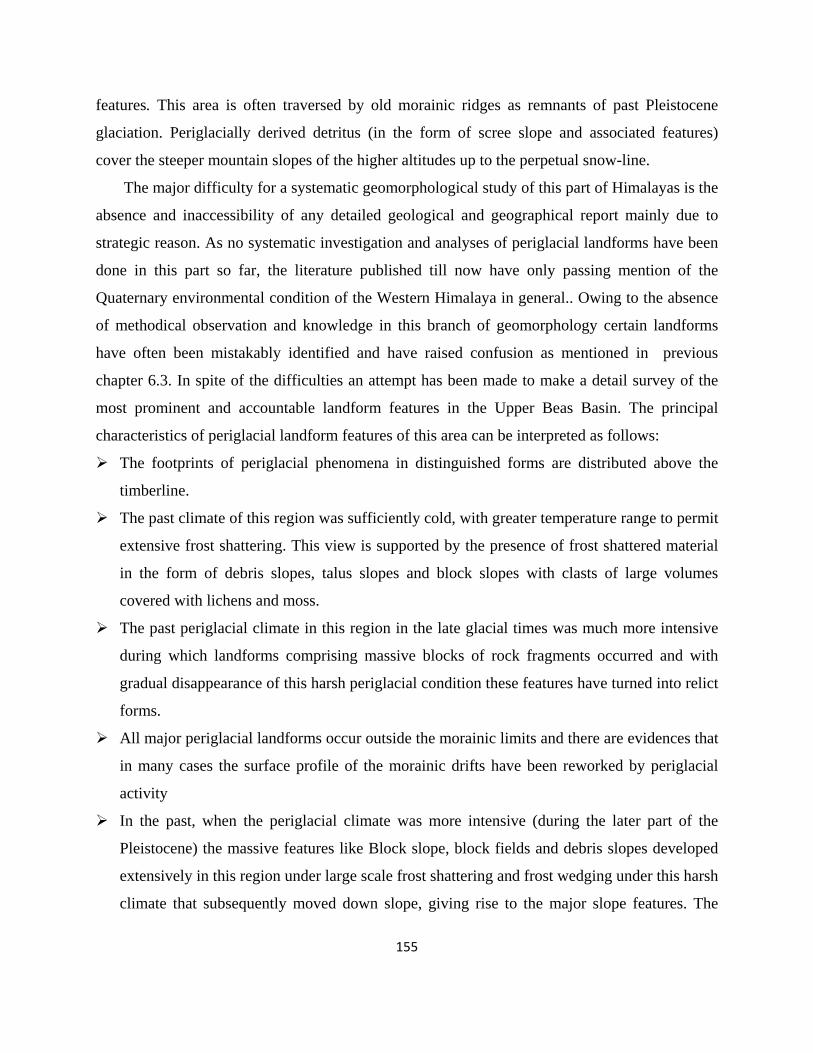
Ploughing Blocks at Baukar Thatch near Beas Kund region is shown in Plate 6.11
160
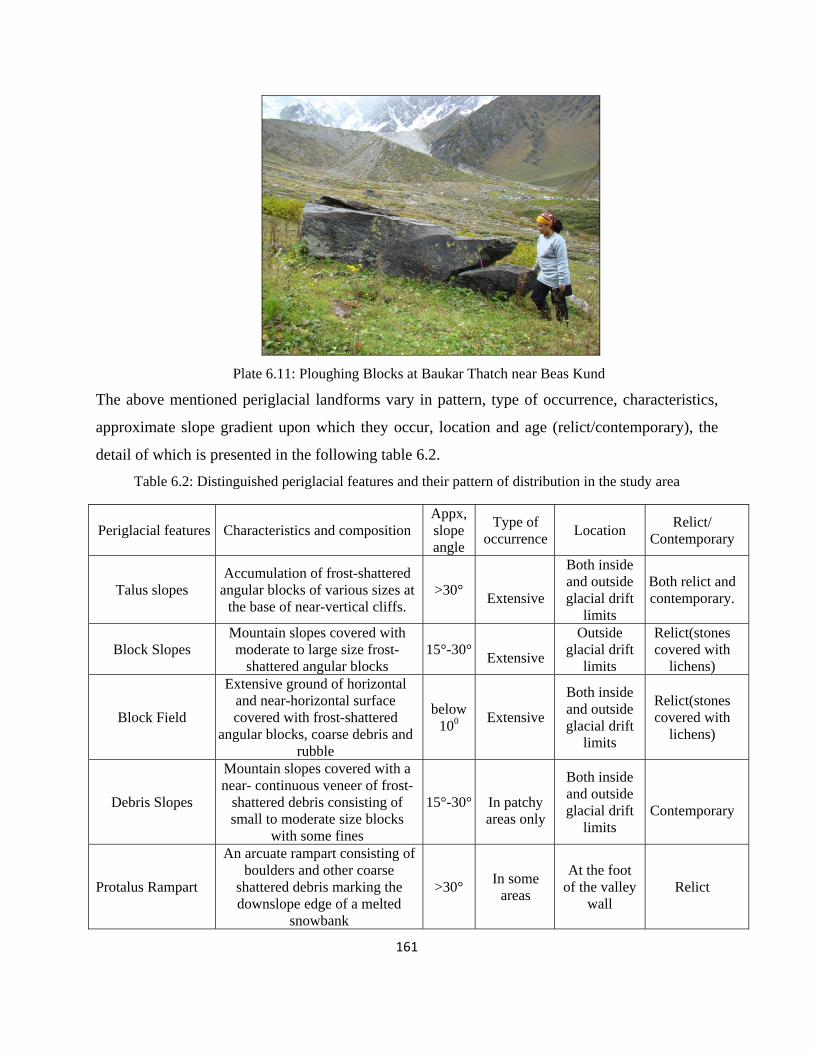
Plate 6.11: Ploughing Blocks at Baukar Thatch near Beas Kund
The above mentioned periglacial landforms vary in pattern, type of occurrence, characteristics,
approximate slope gradient upon which they occur, location and age (relict/contemporary), the
detail of which is presented in the following table 6.2.
Table 6.2: Distinguished periglacial features and their pattern of distribution in the study area
Periglacial features Characteristics and composition Appx, slope angle
Type of occurrence Location Relict/
Contemporary
Talus slopes Accumulation of frost-shattered
angular blocks of various sizes at the base of near-vertical cliffs.
>30° Extensive
Both inside and outside glacial drift
limits
Both relict and contemporary.
Block Slopes Mountain slopes covered with moderate to large size frost-
shattered angular blocks 15°-30°
Extensive
Outside glacial drift
limits
Relict(stones covered with
lichens)
Block Field
Extensive ground of horizontal and near-horizontal surface covered with frost-shattered
angular blocks, coarse debris and rubble
below 100 Extensive
Both inside and outside glacial drift
limits
Relict(stones covered with
lichens)
Debris Slopes
Mountain slopes covered with a near- continuous veneer of frost-
shattered debris consisting of small to moderate size blocks
with some fines
15°-30°
In patchy areas only
Both inside and outside glacial drift
limits
Contemporary
Protalus Rampart
An arcuate rampart consisting of boulders and other coarse
shattered debris marking the downslope edge of a melted
snowbank
>30° In some areas
At the foot of the valley
wall Relict
161
Compiled by the author
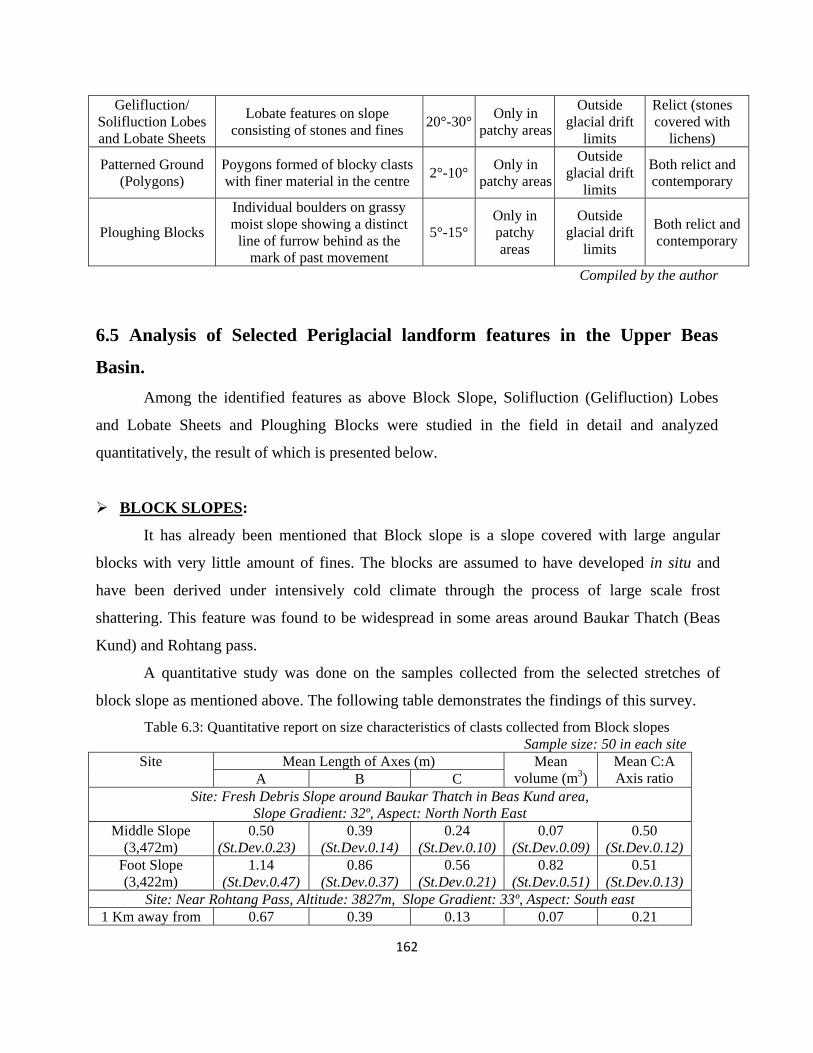
Gelifluction/ Solifluction Lobes and Lobate Sheets
Lobate features on slope consisting of stones and fines 20°-30° Only in
patchy areas
Outside glacial drift
limits
Relict (stones covered with
lichens)
Patterned Ground (Polygons)
Poygons formed of blocky clasts with finer material in the centre 2°-10° Only in
patchy areas
Outside glacial drift
limits
Both relict and contemporary
Ploughing Blocks
Individual boulders on grassy moist slope showing a distinct
line of furrow behind as the mark of past movement
5°-15°Only in patchy areas
Outside glacial drift
limits
Both relict and contemporary
6.5 Analysis of Selected Periglacial landform features in the Upper Beas
Basin. Among the identified features as above Block Slope, Solifluction (Gelifluction) Lobes
and Lobate Sheets and Ploughing Blocks were studied in the field in detail and analyzed
quantitatively, the result of which is presented below.
BLOCK SLOPES:
It has already been mentioned that Block slope is a slope covered with large angular
blocks with very little amount of fines. The blocks are assumed to have developed in situ and
have been derived under intensively cold climate through the process of large scale frost
shattering. This feature was found to be widespread in some areas around Baukar Thatch (Beas
Kund) and Rohtang pass.
A quantitative study was done on the samples collected from the selected stretches of
block slope as mentioned above. The following table demonstrates the findings of this survey.
Table 6.3: Quantitative report on size characteristics of clasts collected from Block slopes Sample size: 50 in each site
Site Mean Length of Axes (m) Mean volume (m3)
Mean C:A Axis ratio A B C
Site: Fresh Debris Slope around Baukar Thatch in Beas Kund area, Slope Gradient: 32º, Aspect: North North East
Middle Slope (3,472m)
0.50 (St.Dev.0.23)
0.39 (St.Dev.0.14)
0.24 (St.Dev.0.10)
0.07 (St.Dev.0.09)
0.50 (St.Dev.0.12)
Foot Slope (3,422m)
1.14 (St.Dev.0.47)
0.86 (St.Dev.0.37)
0.56 (St.Dev.0.21)
0.82 (St.Dev.0.51)
0.51 (St.Dev.0.13)
Site: Near Rohtang Pass, Altitude: 3827m, Slope Gradient: 33º, Aspect: South east 1 Km away from 0.67 0.39 0.13 0.07 0.21
162

163
the zero point at Rohtang Pass
(St.Dev.0.45) (St.Dev.0.26) (St.Dev.0.07) (St.Dev.0.19) (St.Dev.0.08)
Based on Field survey, data vide Table…. in Appendix
Discussion: Characteristics of clasts of two selected Block slope areas, (Beas Kund and Rohtang
Pass), as have been presented in the above table (Table 6.3) can be interpreted in the light of the
existing periglacial environmental condition in these areas. Geological formations of these two
areas are different; the Beas Kund area is formed of gneissic rocks, whereas schists and phyllites
are the basic rocks in the Rohtang Pass area. Both the areas are above 3,400m and the slopes were
found to have developed upon moderately high degree (32º and 33º) convexo-concave
depositional slope. In the Beas Kund area samples were selected from both Middle and Foot
slope and from the Rohtang Pass area they were selected only from Middle slope, as the foot of
the slope in this part descends deep into the Beas gorge covered with dense vegetation.
Some interesting features have emerged from the analyses which can be explained and interpreted
as follows:
a) Although geologically different, the clast samples collected from the Middle slope in these
two areas show almost the same size in terms of their axes and volumes. The clasts samples
collected from the Foot slope in the Beas Kund area are markedly larger in size (Mean A axis
value 1.14m, and Mean Volume 0.82m3) compared to those collected from the Middle slope,
with some amount of fines, (Mean A axis 0.50m and Mean Volume 0.07m3). Higher S.D.
value for the volume of clasts (S.D. 0.51) found for the samples taken from the Foot slope at
the Beas Kund area, gives a certain indication that the volume of blocks vary widely in this
part. Compared to this smaller S.D. value for the volume of clasts (S.D. 0.09) in the Middle
slope of this part is suggestive of their fairly similar size distribution pattern. Again block
volumes of the samples collected from the Middle slope of Rohtang Pass area are very similar
to those found in the case of the Middle slope of the Beas Kund area.
b) It is believed that the materials of smaller clasts existing in the Middle slope of both the areas
are the product of the contemporary periglacial process acting under relatively mild climatic
condition, whereas the blocks of larger size occurring at the foot of the Block slope in the Beas
Kund area with lichen cover, were produced under harsher periglacial climatic condition that
prevailed in the past during the Late-Pleistocene Period. This is well depicted in Plate 6.12.

Plate 6.12: Block slopes with smaller clasts in the Middle slope and larger size at the foot of the Block slope in the Beas Kund area with lichen cover
c) Response of frost wedging and shattering to the clasts also differs significantly according to
geological formations in these two areas. It is known that gneissic rocks usually break down
irregularly under frost shattering but as the frost penetrates in schist and phyllite through the
lines of fissility they break down giving rise to blocks of slabby form. Clasts of the Block
slope in the Beas Kund area, formed predominantly of gneissic rock, are having higher C:A
axis ratio (0.50 to 0.51) compared to those in the Rohtang Pass area (C:A axis ratio of 0.21)
where slabby blocks have been resulted due frost shattering of Schistose and Phyllitic rocks.
Usually in the periglacially derived block assemblage clasts tend to have their A axis oriented
toward the aspect of the slope upon which they occur (Ballantyne, 1981, Chattopadhyay, 1982).
On this assumption selected number of clasts (number 50) from each of the three Block slopes
(two in Bauker Thatch in Beas Kund and one in Rohtang Pass areas) were measured of their A
axis orientation and the results have been presented in the table (Table 6.4, 6.5 and 6.6) and
diagram (Fig. 6.2, 6.3 and 6.4) below.
164

Table 6.4 & Fig. 6.2: A axis orientation of clasts of Block slope near Rohtang Pass area. Altitude: 3827m, Slope Gradient: 33º, Aspect: South east
Orientation Frequency N 0 NNE 0 NE 0 ENE 0 E 5 ESE 5 SE 14 SSE 9 S 11 SSW 3 SW 0 WSW 2 W 2 WNW 0 NW 0 NNW 0 TOTAL 51
Table 6.5 & Fig. 6.3: A axis orientation of clasts of Block slope at its middle slope around Baukar Thatch (Beas Kund area)
Altitude: 3,472m, Slope Gradient: 32º, Aspect: North North East
Orientation Frequency N 5
NNE 10 NE 9
ENE 6 E 6
ESE 0 SE 1
SSE 3 S 1
SSW 0 SW 0
WSW 0 W 0
WNW 3 NW 4
NNW 1
165

Table 6.6 & Fig. 6.4: A axis orientation of clasts of Block slope at its foot slope around Baukar Thatch
(Beas Kund area) Altitude: 3,422m, Slope Gradient: 32º, Aspect: North North East
Orientation Frequency N 5
NNE 4 NE 0
ENE 1 E 3
ESE 5 SE 1
SSE 4 S 3
SSW 4 SW 0
WSW 2 W 2
WNW 4 NW 6
NNW 6
Discussion: It can be seen in Fig. 6.2 and 6.3, that for the clast samples collected from the two
middle slope segments of Block slopes, the A axes in general have orientation in conform with
the aspect. While those collected from the foot slope as in Fig. 6.4, have in general irregular
orientation. Orientation of A axis for the blocks of middle slope quite clearly suggests that they
are periglacially derived and the process is still in operation. The irregular orientation of A axes
for the clasts at the foot slope would have resulted due to their reorganization through down
slope movement under gravity after the cessation of harsh periglacial condition that prevailed in
the past.
SOLIFLUCTION (GELIFLUCTION) LOBES AND LOBATE SHEETS:
It has already been mentioned (Section 7.4) that Solifluction (Gelifluction) Lobes and
Lobate Sheets are the micro features that occur on the slopes of the periglacial environment in
the form Crescentic (lobate) steps facing down slope. This indicates their contemporary down
slope movements. These Lobes and Lobate Sheets are composed of a mixture of coarse and fine
material. Under the process of frost creep and solifluction (gelifluction) these lobes move slowly
down slope. They are formed of both fines and coarse material (debris lobe) and mainly fines
166

(soil lobe). Soil lobes and lobate sheet are found to have covered with turf and thus they are
popularly known as turf-coved solifluction (gelifluction) lobes. A quantitative study was done on
the selected stretches of solifluction (gelifluction) lobes and lobate sheets in Rohtang Pass area.
The following table 6.7 gives details of this study.
Table 6.7: Quantitative report on size characteristics of Solifluction (Gelifluction) Lobes measured around the Rohtang Pass area
Altitude: 3827 mts, Slope Gradient: 33º, Aspect: South east No. of Sample: 12
Mean Length (m) Mean Width (m) Riser Height (m) Surface characteristics 1.76 (Std. Dev 0.35) 1.46 (Std. Dev. 0.22) 0.50 (Std. Dev. 0.13) Moist soil regolith covered with
grass and turf Based on Field survey data vide Table…. in Appendix
Table 6.8 & Fig. 6.5: A axis orientation of Gelifluction Lobate Sheets around the Rohtang Pass Area Altitude: 3827 mts, Slope Gradient: 33º, Aspect: South east
Orientation Frequency N 0
NNE 0 NE 0
ENE 0 E 0
ESE 0 SE 8
SSE 1 S 3
SSW 0 SW 0
WSW 0 W 0
WNW 0 NW 0
NNW 0 TOTAL 12
Discussion: It can be seen from the above Table 6.8 and Fig. 6.6 that the orientation of the
Gelifluction Lobate Sheets in the Rohtang Pass area depicts clearly that the A axes in
general have orientation in conform to the aspect. From the observation of their surface form
with bulging frontal part and composition of mainly finer material it can be assumed that
these lobate features are still moving down the slope gradually under frost creep and
gelifluction process.
167
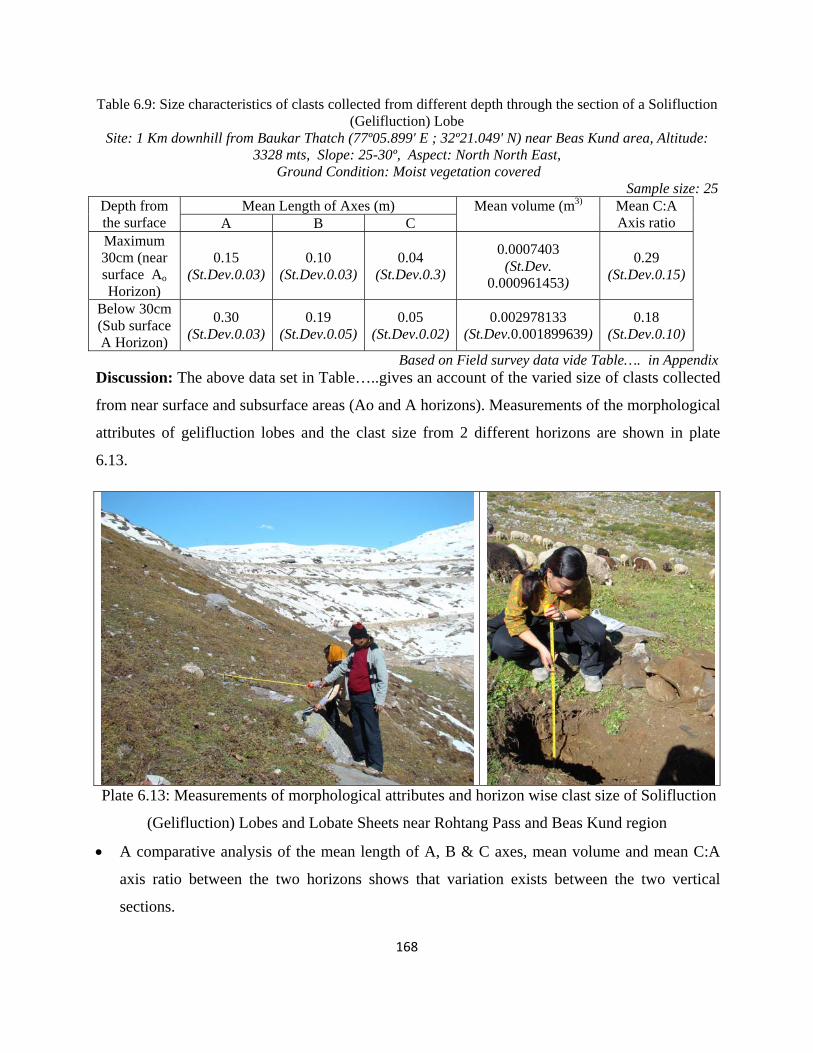
Table 6.9: Size characteristics of clasts collected from different depth through the section of a Solifluction (Gelifluction) Lobe
Site: 1 Km downhill from Baukar Thatch (77º05.899' E ; 32º21.049' N) near Beas Kund area, Altitude: 3328 mts, Slope: 25-30º, Aspect: North North East,
Ground Condition: Moist vegetation covered Sample size: 25
Depth from the surface
Mean Length of Axes (m) Mean volume (m3) Mean C:A Axis ratio A B C
Maximum 30cm (near surface Ao Horizon)
0.15 (St.Dev.0.03)
0.10 (St.Dev.0.03)
0.04 (St.Dev.0.3)
0.0007403 (St.Dev.
0.000961453)
0.29 (St.Dev.0.15)
Below 30cm (Sub surface A Horizon)
0.30 (St.Dev.0.03)
0.19 (St.Dev.0.05)
0.05 (St.Dev.0.02)
0.002978133 (St.Dev.0.001899639)
0.18 (St.Dev.0.10)
Based on Field survey data vide Table…. in Appendix Discussion: The above data set in Table…..gives an account of the varied size of clasts collected
from near surface and subsurface areas (Ao and A horizons). Measurements of the morphological
attributes of gelifluction lobes and the clast size from 2 different horizons are shown in plate
6.13.
Plate 6.13: Measurements of morphological attributes and horizon wise clast size of Solifluction
(Gelifluction) Lobes and Lobate Sheets near Rohtang Pass and Beas Kund region
• A comparative analysis of the mean length of A, B & C axes, mean volume and mean C:A
axis ratio between the two horizons shows that variation exists between the two vertical
sections.
168
169
• The clast samples collected from the Ao horizon are smaller (Mean A axis value 0.15m, and
Mean Volume 0.0007403m3) with some amount of fines compared to those collected from
the A horizon below. They are markedly larger in size (Mean A axis value 0.30m, and Mean
Volume 0.002978133m3). Higher S.D. value for the volume of clasts in A horizon (S.D.
0.001899639) gives a certain indication that the volume of blocks vary widely in this part.
Compared to this smaller S.D. value for the volume of clasts (S.D. 0.0009614) in the Ao
horizon is suggestive of their fairly similar size distribution pattern.
• Clasts of both the horizons in this area are formed predominantly of gneissic rock, having
C:A axis ratio of 0.29 in Ao (upper) horizon and 0.18 in A (lower) horizon. From the
analyses it emerges that the clasts in both the horizons are markedly slabby. The lower
average of C:A axis ratio of the clasts in the lower horizon (Horizon A) is even smaller. Thus
it can be stated that the regolith in the lower horizon was formed under more intense
periglacial climatic condition and these lobes and lobate sheets are now moving down the
slope slowly under the existing milder periglacial condition.
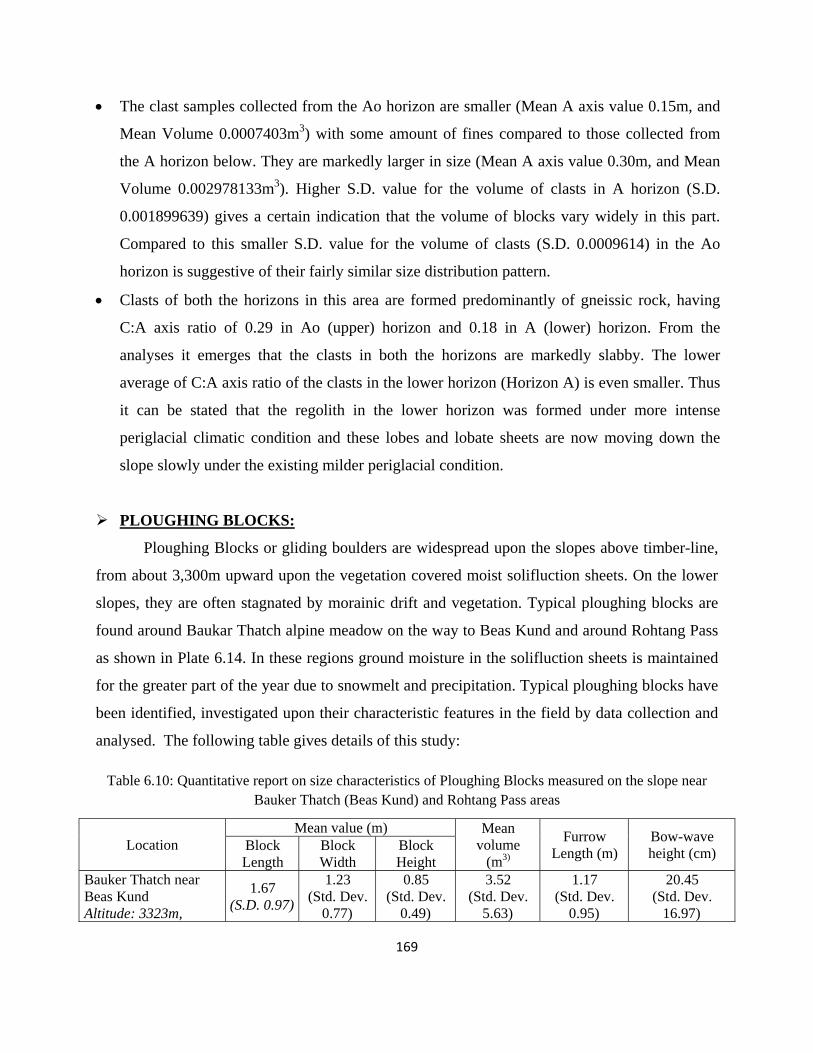
PLOUGHING BLOCKS:
Ploughing Blocks or gliding boulders are widespread upon the slopes above timber-line,
from about 3,300m upward upon the vegetation covered moist solifluction sheets. On the lower
slopes, they are often stagnated by morainic drift and vegetation. Typical ploughing blocks are
found around Baukar Thatch alpine meadow on the way to Beas Kund and around Rohtang Pass
as shown in Plate 6.14. In these regions ground moisture in the solifluction sheets is maintained
for the greater part of the year due to snowmelt and precipitation. Typical ploughing blocks have
been identified, investigated upon their characteristic features in the field by data collection and
analysed. The following table gives details of this study:
Table 6.10: Quantitative report on size characteristics of Ploughing Blocks measured on the slope near Bauker Thatch (Beas Kund) and Rohtang Pass areas
Location Mean value (m) Mean
volume (m3)
Furrow Length (m)
Bow-wave height (cm) Block
Length Block Width
Block Height
Bauker Thatch near Beas Kund Altitude: 3323m,
1.67 (S.D. 0.97)
1.23 (Std. Dev.
0.77)
0.85 (Std. Dev.
0.49)
3.52 (Std. Dev.
5.63)
1.17 (Std. Dev.
0.95)
20.45 (Std. Dev.
16.97)
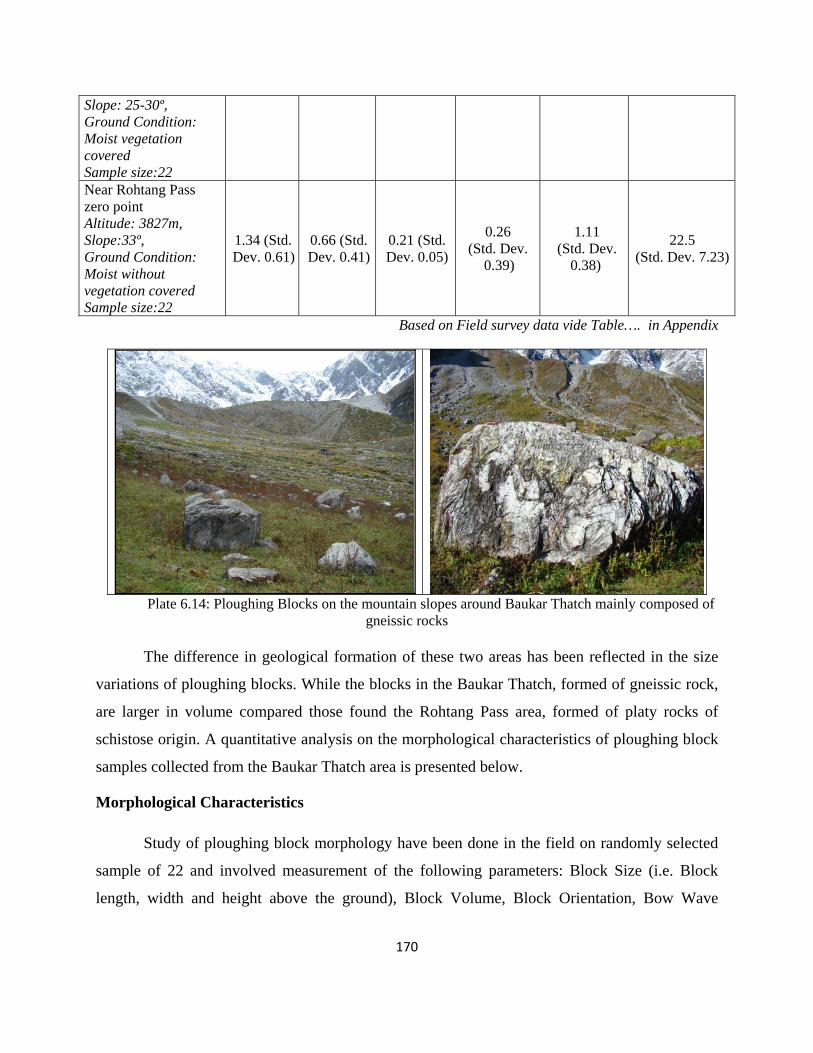
Slope: 25-30º, Ground Condition: Moist vegetation covered Sample size:22 Near Rohtang Pass zero point Altitude: 3827m, Slope:33º, Ground Condition: Moist without vegetation covered Sample size:22
1.34 (Std. Dev. 0.61)
0.66 (Std. Dev. 0.41)
0.21 (Std. Dev. 0.05)
0.26 (Std. Dev.
0.39)
1.11 (Std. Dev.
0.38)
22.5 (Std. Dev. 7.23)
Based on Field survey data vide Table…. in Appendix
Plate 6.14: Ploughing Blocks on the mountain slopes around Baukar Thatch mainly composed of gneissic rocks
The difference in geological formation of these two areas has been reflected in the size
variations of ploughing blocks. While the blocks in the Baukar Thatch, formed of gneissic rock,
are larger in volume compared those found the Rohtang Pass area, formed of platy rocks of
schistose origin. A quantitative analysis on the morphological characteristics of ploughing block
samples collected from the Baukar Thatch area is presented below.
Morphological Characteristics
Study of ploughing block morphology have been done in the field on randomly selected
sample of 22 and involved measurement of the following parameters: Block Size (i.e. Block
length, width and height above the ground), Block Volume, Block Orientation, Bow Wave
170
Height and Length of Furrow. Each morphological feature of the ploughing block is discussed
below in detail:
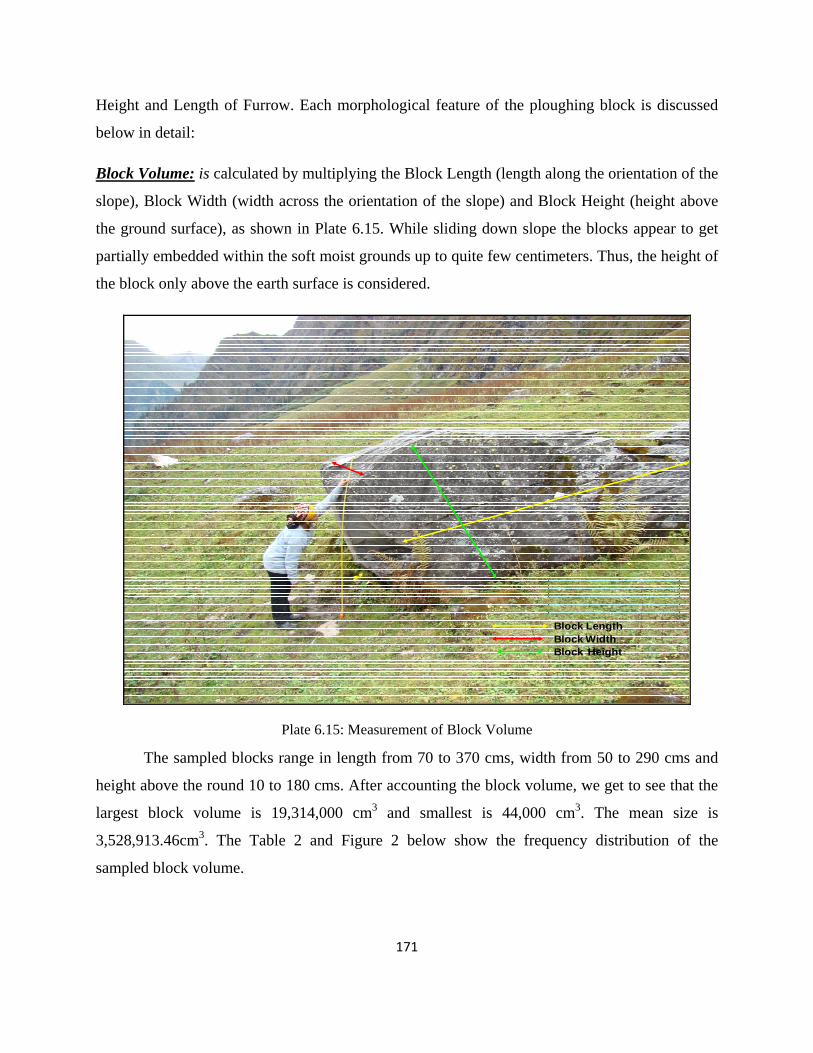
Block Volume: is calculated by multiplying the Block Length (length along the orientation of the
slope), Block Width (width across the orientation of the slope) and Block Height (height above
the ground surface), as shown in Plate 6.15. While sliding down slope the blocks appear to get
partially embedded within the soft moist grounds up to quite few centimeters. Thus, the height of
the block only above the earth surface is considered.
Block LengthBlock WidthBlock Height
Plate 6.15: Measurement of Block Volume
The sampled blocks range in length from 70 to 370 cms, width from 50 to 290 cms and
height above the round 10 to 180 cms. After accounting the block volume, we get to see that the
largest block volume is 19,314,000 cm3 and smallest is 44,000 cm3. The mean size is
3,528,913.46cm3. The Table 2 and Figure 2 below show the frequency distribution of the
sampled block volume.
171

Table 6.11 and Fig. 6.6: Percentage Frequency Distribution of Block Volume of Ploughing Block
Block Volume (In cm3) Frequency %
0 - 4,999,000 18 81.7
50,000,000 - 9,999,000 1 4.6
10,000,000 - 14,999,000 1 4.6
15,000,000 - 19,999,000 2 9.1
The Percentage Frequency Distribution data of Block Volume is categorized into four
classes. Majority (81.7%) of the blocks are of smaller size i.e. up to 150 cm long, 120cm wide
and 115 cm height from the ground. The medium volume and large volume blocks comprise
4.6% each. The largest size blocks are 9.1% of frequency distribution i.e. volume ranging from
15,000,000-19,999,000 cm3. Therefore, in the Beas Kund region ploughing blocks are of smaller
volume dominantly, while huge ones are quite lesser in number.
Block Orientation or Block Aspect: Slope gradient of the surveyed region is 250 to 300 upon
which the ploughing blocks occur in association with gelifluction deposits, as shown in Plate
6.16. The diagrammatic representation of ploughing block orientation in Figure 3 depicts that the
general trend of block orientation is towards North (N), North North East (NNE) and North
North West (NNW). Thus in conformal to the slopes, the orientation too is non-variant. This is
because of the unique climatological, vegetal and geomorphological (Periglacial) nature of the
higher slopes of Upper Beas Basin.
172
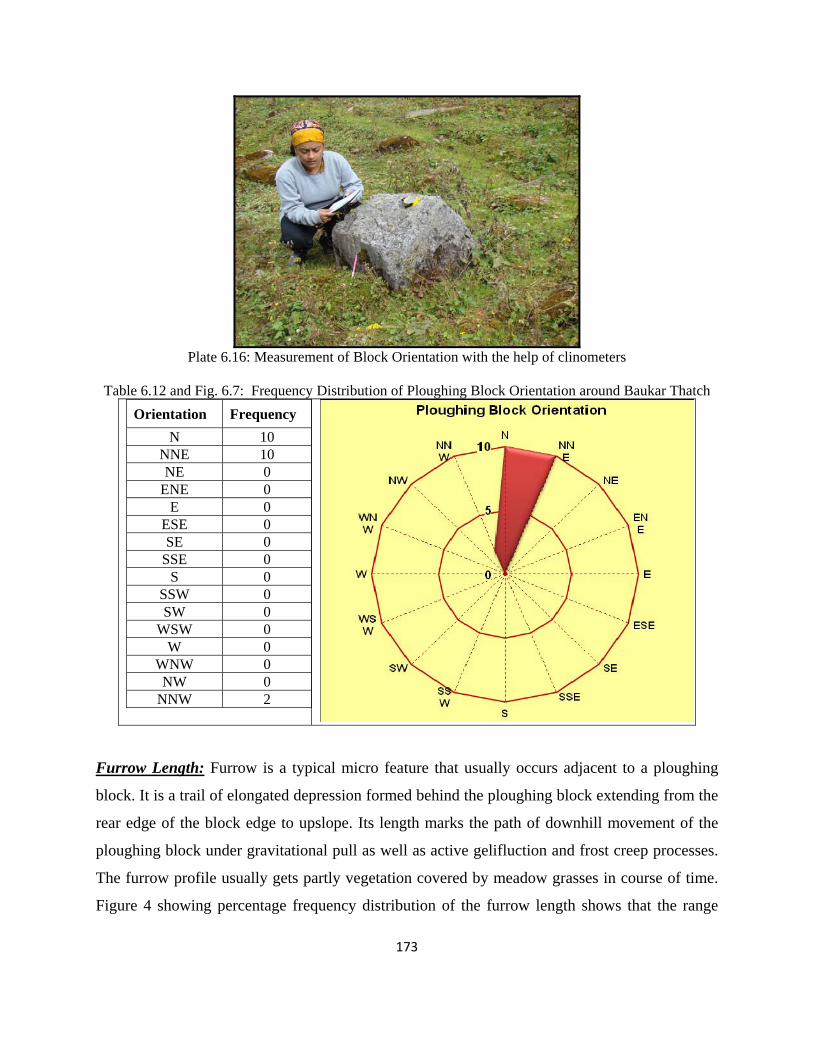
Plate 6.16: Measurement of Block Orientation with the help of clinometers
Table 6.12 and Fig. 6.7: Frequency Distribution of Ploughing Block Orientation around Baukar Thatch
Orientation Frequency N 10
NNE 10 NE 0
ENE 0 E 0
ESE 0 SE 0
SSE 0 S 0
SSW 0 SW 0
WSW 0 W 0
WNW 0 NW 0
NNW 2
Furrow Length: Furrow is a typical micro feature that usually occurs adjacent to a ploughing
block. It is a trail of elongated depression formed behind the ploughing block extending from the
rear edge of the block edge to upslope. Its length marks the path of downhill movement of the
ploughing block under gravitational pull as well as active gelifluction and frost creep processes.
The furrow profile usually gets partly vegetation covered by meadow grasses in course of time.
Figure 4 showing percentage frequency distribution of the furrow length shows that the range
173
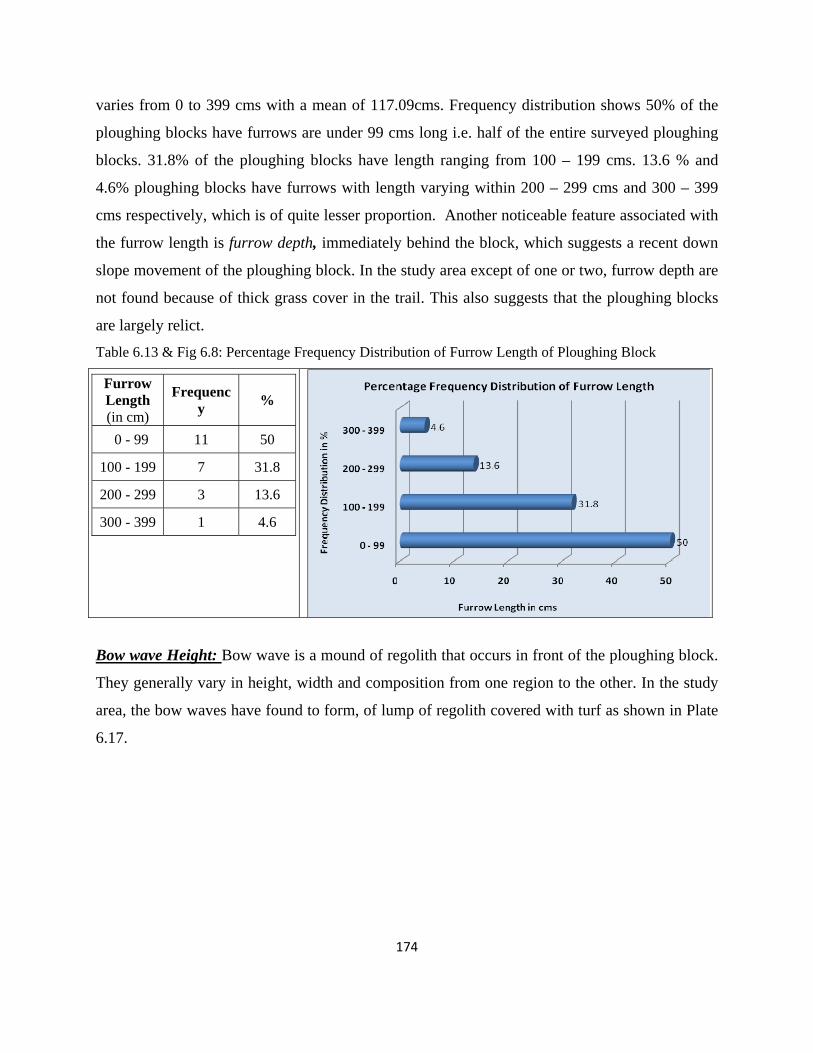
varies from 0 to 399 cms with a mean of 117.09cms. Frequency distribution shows 50% of the
ploughing blocks have furrows are under 99 cms long i.e. half of the entire surveyed ploughing
blocks. 31.8% of the ploughing blocks have length ranging from 100 – 199 cms. 13.6 % and
4.6% ploughing blocks have furrows with length varying within 200 – 299 cms and 300 – 399
cms respectively, which is of quite lesser proportion. Another noticeable feature associated with
the furrow length is furrow depth, immediately behind the block, which suggests a recent down
slope movement of the ploughing block. In the study area except of one or two, furrow depth are
not found because of thick grass cover in the trail. This also suggests that the ploughing blocks
are largely relict.
Table 6.13 & Fig 6.8: Percentage Frequency Distribution of Furrow Length of Ploughing Block
Furrow Length (in cm)
Frequency %
0 - 99 11 50
100 - 199 7 31.8
200 - 299 3 13.6
300 - 399 1 4.6
Bow wave Height: Bow wave is a mound of regolith that occurs in front of the ploughing block.
They generally vary in height, width and composition from one region to the other. In the study
area, the bow waves have found to form, of lump of regolith covered with turf as shown in Plate
6.17.
174

Plate 6.17: Measurement of Bow wave height
Among all samples studied, four had no identifiable bow wave because; these blocks
have followed the furrow of a preceding block. The mean value of the bow wave height is
20.45cm. From the percentage frequency distribution of the bow wave height, it can be deduced
that again 50 % of the bow waves have height below 19 cms which is quite low. The moderate
class of 20 – 39 also forms almost another half of the samples, i.e., 40.8 %. The remaining high
(40 – 59)cm and very high (60 – 79)cm classes are negligible with only 4.6% each. Thus, the
ploughing blocks in the study area have bow waves with low to moderate height. This indicates
that their increased rate of down slope movement have begun in the recent deglaciation period,
when freeze and thaw action became more dominant, resulting in active formation of periglacial
landform features.
Table 6.14 & Fig 6.9: Percentage Frequency Distribution of Bow wave Height of Ploughing Block
Bow - Wave
Height Frequency %
0 - 19 11 50
20 - 39 9 40.8
40 - 59 1 4.6
60 - 79 1 4.6
175
176
In the study area, though only 4.6% of the total studied samples are of very large size, yet they
truly represent that very large block volume along with predominant ploughing activity leads to
progressive sinking of the ploughing blocks and formation of Frontal-Lateral bow wave.
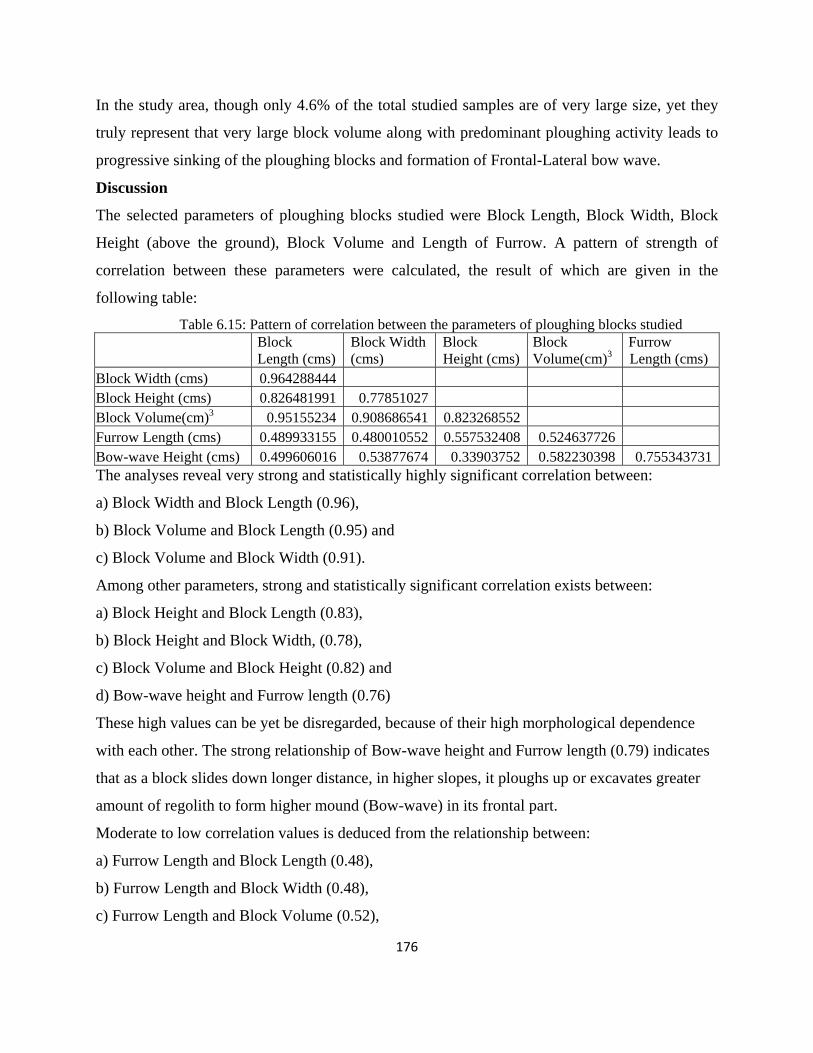
Discussion
The selected parameters of ploughing blocks studied were Block Length, Block Width, Block
Height (above the ground), Block Volume and Length of Furrow. A pattern of strength of
correlation between these parameters were calculated, the result of which are given in the
following table:
Table 6.15: Pattern of correlation between the parameters of ploughing blocks studied
Block Length (cms)
Block Width (cms)
Block Height (cms)
Block Volume(cm)3
Furrow Length (cms)
Block Width (cms) 0.964288444 Block Height (cms) 0.826481991 0.77851027 Block Volume(cm)3 0.95155234 0.908686541 0.823268552 Furrow Length (cms) 0.489933155 0.480010552 0.557532408 0.524637726 Bow-wave Height (cms) 0.499606016 0.53877674 0.33903752 0.582230398 0.755343731The analyses reveal very strong and statistically highly significant correlation between:
a) Block Width and Block Length (0.96),
b) Block Volume and Block Length (0.95) and
c) Block Volume and Block Width (0.91).
Among other parameters, strong and statistically significant correlation exists between:
a) Block Height and Block Length (0.83),
b) Block Height and Block Width, (0.78),
c) Block Volume and Block Height (0.82) and
d) Bow-wave height and Furrow length (0.76)
These high values can be yet be disregarded, because of their high morphological dependence
with each other. The strong relationship of Bow-wave height and Furrow length (0.79) indicates
that as a block slides down longer distance, in higher slopes, it ploughs up or excavates greater
amount of regolith to form higher mound (Bow-wave) in its frontal part.
Moderate to low correlation values is deduced from the relationship between:
a) Furrow Length and Block Length (0.48),
b) Furrow Length and Block Width (0.48),
c) Furrow Length and Block Volume (0.52),

177
d) Bow wave Height and Block Length (0.50),
e) Bow wave Height and Block Width (0.54),
f) Bow wave Height and Block Height (0.34), and
g) Bow wave Height and Block Volume (0.58)
These statistically insignificant relationships suggest that no strong relationship exist between
these parameters. Although Furrow Length and Bow wave Height are directly associated with
the volume and down slope movement of the ploughing block, no significant correlation occurs
among these variables.
Thus, it can be concluded that the quantitative analyses of the nature and characteristics
of ploughing blocks reveal that they have a wide range of variation in their morphology. In
general, the associated micro-features of the ploughing blocks reveal no dominant pattern of
influence upon the movement of the ploughing blocks.
REFERENCES
Ball. D. F. and Goodier. R. (1970) Morphology and distribution of features resulted from frost-action
in Snowdonia. Field Studies 106: PP. 193-217.
Ballantyne, C.K. (1981): Periglacial landforms and environments on mountains in the Northern
Highlands of Scotland. Ph.D. Thesis (unpubl.). University of Edinburgh, U.K.
Brozovic, N., Burbank, D. W. & Meigs , A. J. (1997): Climatic Limits on Landscape Development in
the Northwestern Himalaya. Science VOL. 276 , p 571 – 574.
Chattopadhyay, G.P. (1982): Periglacial Geomorphology of parts of Grampian Highlands of Scotland.
Ph.D. Thesis (unpubl), University of Edinburgh, Edinburgh, U.K.
Chattopadhyay, G. P. (1983) Ploughing blocks on the Drumochter Hills in the Grampian Highlands,
Scotland: A quantitative report. The Geographical Journal, Vol. 149, No. 2, July 1983, pp. 211-15.
Chattopadhyay, G. P. (1985): Nature and extent of periglacial phenomena in the Kanchenjunga area,
Sikkim Himalaya. Göttinger Geographische, (Göttingen, Germany. vol. 81: 145-52.
Chattopadhyay, G. P. (2005): Characteristics and pattern of paraglacial landform features in some
recently deglaciated parts of the inner Himalaya. Indian journal of geology and environment, vol., 10:
p. 8-15.
Chattopadhyay, G. P. (1998): Nomenclature and mapping of glacial and periglacial phenomena in
Arctic and Alpine Environments. Indian Cartographer, 18: p 55-56.
178
Chattopadhyay, G. P. (1984): High altitude slope deposits in the Sikkim Himalayas and their
periglacial significance. Himalayan research and development, 3 (2): p 9-13.
Dylik, (1964): Eléments essentiels de la notion de ‘périlaciairé’. Biuletyn Peryglacjalny. Vol 14, p
111 - 32
Fort, M. (1987): Geomorphic and Hazards Mapping in the Dry, Continental Himalaya: 1:50,000
Maps of Mustang District, Nepal. Mountain Research and Development. Vol. 7, No. 3, pp. 222-238.
French, H.M. (1976): The Periglacial Environment. London, Longman. P 2 - 40
Fuji, Y & Higuchi, K. (1976): Ground temperature and its relation to permafrost occurrences in the
Khumbu Himal and Hidden Valley, Nepal Himalayas. Seppyo, 38 (Specil Issue): 125-28.
Fukui, K., Fujii Y., Ageta Y. & Asahi K. (2007): Changes in the lower limit of mountain permafrost
between 1973 and 2004 in the Khumbu Himal, the Nepal Himalayas. Global and Planetary Change
Volume 55, Issue 4, February, Pages 251-256.
Heimsath, A. M. & McGlynn, R. (2008): Quantifying periglacial erosion in the Nepal high
Himalaya. Geomorphology. Vol 97, Issues 1-2,p 5-23.
Iwata S., Karma, Ageta Y., Sakai A., Narama, C., Naito N. (2004): Glacial Geomorphology in the
Lunana Area in the Bhutan Himalaya: Moraine Stages, Glacial Lakes, And Rock Glaciers.
Himalayan Journal of Sciences. Vol 2 Issue 4. P 164 – 165. (Special Issue - Extended Abstracts: 19th
Himalaya-Karakoram-Tibet Workshop, 2004, Niseko, Japan).
KAR, N. R. (1969): Studies on the geomorphic characteristics and development of slopes in the
periglacial zones of Sikkim and Darjeeling Himalayas. Biuletyn Peryglacjalny, No. 18, p. 43-67.
Løzinski, W. (1912): Die periglaziale Fazies der mechanischen Verwitterung. International
Geological Congress, 11th, Stockholm 1910, Compte rendu, 1039-53.
Marie-Françoise André, M.F. (2009): From climatic to global change geomorphology: contemporary
shifts in periglacial geomorphology. Geological Society, London. Special Publications. Vol 320; p. 5-
28.
Peltier, L. C. (1950): The geographic cycles in periglacial regions as it is related to the climatic
geomorphology. Annals, Association of American Geographers. Vol 40, p 214 – 236.
Pewe, T.L. (1975): Quaternary Geology of Alaska. U.S. Geological Survey Professional Paper 835.
Washington, D.C., U.S. Government Printing Office.
PEWE, T. L. (1969): ed. The periglacial environment, past and present. Montreal, McGill-Queen's
University Press [and] Arctic Institute of North America. ix, 487 p. [Book containing the following
papers: T. L. Pewe, "The periglacial environment", p. 1-9; S. Rudberg, "Distribution of small-scale
periglacial and glacial geomorphological features on Axel Heiberg Island, Northwest Territories,
179
Canada", p. 129-59; J- W. Marr, "Cyclical change in a patterned-ground ecosystem, Thule,
Greenland", p. 177-201; P. Bellair, "Soil stripes and polygonal ground in the subantarctic islands of
Crozet and Kerguelen", p. 217-22; E. B. de Menorval, "Periglacial phenomena recently observed in
the terraces of the Seine southeast of Bonnieres, France", p. 347-50; J. Dylik, "Slope development
affected by frost fissures and thermal erosion", p. 365-86; J- J. Bigarella and others, "Processes and
environments of the Brazilian Quaternary", by J. J. Bigarella, M. R. Mousinho and J. X. da Silva, p.
417-87.
PECSI, M. (1969): Genetic classification of slope sediments. Biuletyn Peryglacjalny, Vol. 18, p. 15-27.
Regmi, D. & Watanabe, T. (2004) Slow Mass Movement in the Kangchenjunga Area, Eastern Nepal
Himalaya. Himalayan Journal of Sciences. Vol 2 Issue 4 P 227 – 228. (Special Issue-Extended
Abstracts: 19th Himalaya-Karakoram-Tibet Workshop, 2004, Niseko, Japan).
Starkel L. (2003): Climatically controlled terraces in uplifting mountain areas. Quaternary Science
Reviews. Volume 22, Issue 20, P 2189-2198.
Troll, C. (1944): Structurboden, solifluktion und frostklimate de erde. Geologiche Rundschau. Vol
34, p 545 – 694.
Tufnell, L. (1972) Ploughing blocks with special reference to north – west England. Biul. Perylac. 21:
pp. 237-70.
Tufnell, L. (1976) Ploughing Block movement on the Moor House Reserve (England), 1965-75 Biul.
Perylac. 26: 311-17.
Washburn, A.L. (1979) Geocryology: A survey of periglacial processes and environments. New
York, John Wiley and Sons, pp. 6, 11, 192-235.
WASHBURN, A. L. (1969): Patterned ground in the Mesters Vig district, northeast Greenland. Biuletyn
Peryglacjalny,Vol. 18, p. 259-330.
Related Documents