259 CHAPTER 6 MEMORY CORRUPTION P ART II— HEAPS In Chapter 5, “Memory Corruption Part I—Stacks,” we discussed how stack-based buffer overflows can cause serious security problems for software and how stack- based buffer overflows have been the primary attack angle for malicious software authors. In recent years, however, another form of buffer overflow attack has gained in popularity. Rather than relying on the stack to exploit buffer overflows, the Windows heap manager is now being targeted. Even though heap-based security attacks are much harder to exploit than their stack-based counterparts, their popu- larity keeps growing at a rapid pace. In addition to potential security vulnerabilities, this chapter discusses a myriad of stability issues that can surface in an application when the heap is used in a nonconventional fashion. Although the stack and the heap are managed very differently in Windows, the process by which we analyze stack- and heap-related problems is the same. As such, throughout this chapter, we employ the same troubleshooting process that we defined in Chapter 5 (refer to Figure 5.1). What Is a Heap? A heap is a form of memory manager that an application can use when it needs to allo- cate and free memory dynamically. Common situations that call for the use of a heap are when the size of the memory needed is not known ahead of time and the size of the memory is too large to neatly fit on the stack (automatic memory). Even though the heap is the most common facility to accommodate dynamic memory allocations, there are a number of other ways for applications to request memory from Windows. Memory can be requested from the C runtime, the virtual memory manager, and even from other forms of private memory managers. Although the different memory managers can be treated as individual entities, internally, they are tightly connected. Figure 6.1 shows a simplified view of Windows-supported memory managers and their dependencies.

Welcome message from author
This document is posted to help you gain knowledge. Please leave a comment to let me know what you think about it! Share it to your friends and learn new things together.
Transcript

259
C H A P T E R 6
MEMORY CORRUPTION PART II—HEAPS
In Chapter 5, “Memory Corruption Part I—Stacks,” we discussed how stack-basedbuffer overflows can cause serious security problems for software and how stack-based buffer overflows have been the primary attack angle for malicious softwareauthors. In recent years, however, another form of buffer overflow attack has gainedin popularity. Rather than relying on the stack to exploit buffer overflows, theWindows heap manager is now being targeted. Even though heap-based securityattacks are much harder to exploit than their stack-based counterparts, their popu-larity keeps growing at a rapid pace. In addition to potential security vulnerabilities,this chapter discusses a myriad of stability issues that can surface in an applicationwhen the heap is used in a nonconventional fashion.
Although the stack and the heap are managed very differently in Windows, theprocess by which we analyze stack- and heap-related problems is the same. As such,throughout this chapter, we employ the same troubleshooting process that we definedin Chapter 5 (refer to Figure 5.1).
What Is a Heap?
A heap is a form of memory manager that an application can use when it needs to allo-cate and free memory dynamically. Common situations that call for the use of a heapare when the size of the memory needed is not known ahead of time and the size ofthe memory is too large to neatly fit on the stack (automatic memory). Even thoughthe heap is the most common facility to accommodate dynamic memory allocations,there are a number of other ways for applications to request memory from Windows.Memory can be requested from the C runtime, the virtual memory manager, andeven from other forms of private memory managers. Although the different memorymanagers can be treated as individual entities, internally, they are tightly connected.Figure 6.1 shows a simplified view of Windows-supported memory managers andtheir dependencies.
08_0321374460_ch06.qxd 10/3/07 10:49 PM Page 259

260 Chapter 6 Memory Corruption Part II—Heaps
Figure 6.1 An overview of Windows memory management architecture
As illustrated in Figure 6.1, most of the high-level memory managers make use of theWindows heap manager, which in turn uses the virtual memory manager. Althoughhigh-level memory managers (and applications for that matter) are not restricted tousing the heap manager, they most typically do, as it provides a solid foundation forother private memory managers to build on. Because of its popularity, the primaryfocal point in this chapter is the Windows heap manager.
When a process starts, the heap manager automatically creates a new heap calledthe default process heap. Although some processes use the default process heap, alarge number rely on the CRT heap (using new/delete and malloc/free family of APIs)for all their memory needs. Some processes, however, create additional heaps (via theHeapCreate API) to isolate different components running in the process. It is notuncommon for even the simplest of applications to have four or more active heaps atany given time.
The Windows heap manager can be further broken down as shown in Figure 6.2.
Application
[NTDLL] Heap Manager
Virtual Memory Manager
C RuntimeHeap
DefaultProcess
Heap
ApplicationSpecificHeaps
08_0321374460_ch06.qxd 10/3/07 10:49 PM Page 260

261What Is a Heap?
Figure 6.2 Windows heap manager
Front End AllocatorThe front end allocator is an abstract optimization layer for the back end allocator. Byallowing different types of front end allocators, applications with different memoryneeds can choose the appropriate allocator. For example, applications that expectsmall bursts of allocations might prefer to use the low fragmentation front end allo-cator to avoid fragmentation. Two different front end allocators are available inWindows:
■ Look aside list (LAL) front end allocator■ Low fragmentation (LF) front end allocator
With the exception of Windows Vista, all Windows versions use a LAL front end allo-cator by default. In Windows Vista, a design decision was made to switch over to theLF front end allocator by default. The look aside list is nothing more than a table of
6.M
EMO
RYCO
RRUPTION
PART
II—H
EAPS
Look Aside Table
0
1
2
3
…
127
unused
16
24
32
…
1024
Front End Allocator
Free Lists
Variable size
unused
16
24
…
1016
Segment List
Segment 1
Segment 2
…
Segment x
0
1
2
3
…
127
Back End Allocator
…
08_0321374460_ch06.qxd 10/3/07 10:49 PM Page 261

262 Chapter 6 Memory Corruption Part II—Heaps
128 singly linked lists. Each singly linked list in the table contains free heap blocks ofa specific size starting at 16 bytes. The size of each heap block includes 8 bytes ofheap block metadata used to manage the block. For example, if an allocation requestof 24 bytes arrived at the front end allocator, the front end allocator would look forfree blocks of size 32 bytes (24 user-requested bytes + 8 bytes of metadata). Becauseall heap blocks require 8 bytes of metadata, the smallest sized block that can bereturned to the caller is 16 bytes; hence, the front end allocator does not use tableindex 1, which corresponds to free blocks of size 8 bytes.
Subsequently, each index represents free heap blocks, where the size of the heapblock is the size of the previous index plus 8. The last index (127) contains free heapblocks of size 1024 bytes. When an application frees a block of memory, the heap man-ager marks the allocation as free and puts the allocation on the front end allocator’s lookaside list (in the appropriate index). The next time a block of memory of that size isrequested, the front end allocator checks to see if a block of memory of the requestedsize is available and if so, returns the heap block to the user. It goes without saying thatsatisfying allocations via the look aside list is by far the fastest way to allocate memory.
Let’s take a look at a hypothetical example. Imagine that the state of the LAL isas depicted in Figure 6.3.
Look Aside Table
0
1
2
3
…
127
16 16
32 32
16
Figure 6.3 Hypothetical state of the look aside list
The LAL in Figure 6.3 indicates that there are 3 heap blocks of size 16 (out of which8 bytes is available to the caller) available at index 1 and two blocks of size 32 (out ofwhich 24 bytes are available to the caller) at index 3. When we try to allocate a blockof size 24, the heap manager knows to look at index 3 by adding 8 to the requestedblock size (accounting for the size of the metadata) and dividing by 8 and subtracting1 (zero-based table). The linked list positioned at index 3 contains two available heapblocks. The heap manager simply removes the first one in the list and returns the allo-cation to the caller.
08_0321374460_ch06.qxd 10/3/07 10:49 PM Page 262
263What Is a Heap?
If we try allocating a block of size 16, the heap manager would notice that theindex corresponding to size 16 (16+8/8–1=2) is an empty list, and hence the allocat-ing cannot be satisfied from the LAL. The allocation request now continues its trav-els and is forwarded to the back end allocator for further processing.
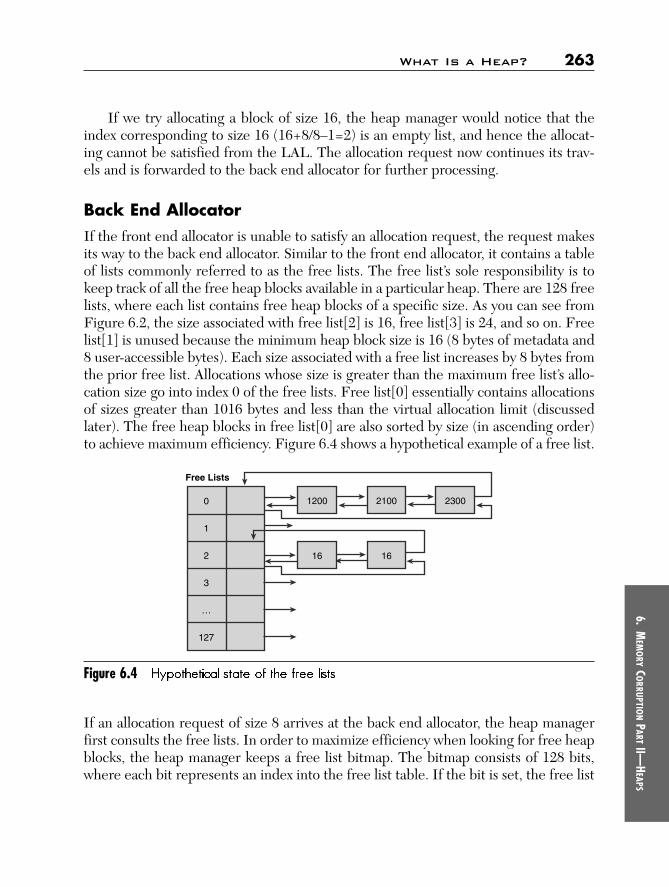
Back End AllocatorIf the front end allocator is unable to satisfy an allocation request, the request makesits way to the back end allocator. Similar to the front end allocator, it contains a tableof lists commonly referred to as the free lists. The free list’s sole responsibility is tokeep track of all the free heap blocks available in a particular heap. There are 128 freelists, where each list contains free heap blocks of a specific size. As you can see fromFigure 6.2, the size associated with free list[2] is 16, free list[3] is 24, and so on. Freelist[1] is unused because the minimum heap block size is 16 (8 bytes of metadata and8 user-accessible bytes). Each size associated with a free list increases by 8 bytes fromthe prior free list. Allocations whose size is greater than the maximum free list’s allo-cation size go into index 0 of the free lists. Free list[0] essentially contains allocationsof sizes greater than 1016 bytes and less than the virtual allocation limit (discussedlater). The free heap blocks in free list[0] are also sorted by size (in ascending order)to achieve maximum efficiency. Figure 6.4 shows a hypothetical example of a free list.
6.M
EMO
RYCO
RRUPTION
PART
II—H
EAPS
Free Lists
0
1
2
3
…
127
1200 2100
16 16
2300
Figure 6.4 Hypothetical state of the free lists
If an allocation request of size 8 arrives at the back end allocator, the heap managerfirst consults the free lists. In order to maximize efficiency when looking for free heapblocks, the heap manager keeps a free list bitmap. The bitmap consists of 128 bits,where each bit represents an index into the free list table. If the bit is set, the free list
08_0321374460_ch06.qxd 10/3/07 10:49 PM Page 263

264 Chapter 6 Memory Corruption Part II—Heaps
corresponding to the index of the free list bitmap contains free heap blocks.Conversely, if the bit is not set, the free list at that index is empty. Figure 6.5 showsthe free list bitmap for the free lists in Figure 6.4.
1 0 1 0 0 0 …
0 1 2 3 4 5 …
Figure 6.5 Free list bitmap
The heap manager maps an allocation request of a given size to a free list bitmapindex by adding 8 bytes to the size (metadata) and dividing by 8. Consider an alloca-tion request of size 8 bytes. The heap manager knows that the free list bitmap indexis 2 [(8+8)/8]. From Figure 6.5, we can see that index 2 of the free list bitmap is set,which indicates that the free list located at index 2 in the free lists table contains freeheap blocks. The free block is then removed from the free list and returned to thecaller. If the removal of a free heap block results in that free list becoming empty, theheap manager also clears the free list bitmap at the specific index. If the heap man-ager is unable to find a free heap block of requested size, it employs a techniqueknown as block splitting. Block splitting refers to the heap manager’s capability totake a larger than requested free heap block and split it in half to satisfy a smaller allo-cation request. For example, if an allocation request arrives for a block of size 8 (totalblock size of 16), the free list bitmap is consulted first. The index representing blocksof size 16 indicates that no free blocks are available. Next, the heap manager findsthat free blocks of size 32 are available. The heap manager now removes a block ofsize 32 and splits it in half, which yields two blocks of size 16 each. One of the blocksis put into a free list representing blocks of size 16, and the other block is returned tothe caller. Additionally, the free list bitmap is updated to indicate that index 2 nowcontains free block entries of size 16. The result of splitting a larger free allocationinto two smaller allocations is shown in Figure 6.6.
As mentioned earlier, the free list at index 0 can contain free heap blocks of sizesranging from 1016 up to 0x7FFF0 (524272) bytes. To maximize free block lookupefficiency, the heap manager stores the free blocks in sorted order (ascending). Allallocations of sizes greater than 0x7FFF0 go on what is known as the virtual alloca-tion list. When a large allocation occurs, the heap manager makes an explicit alloca-tion request from the virtual memory manager and keeps these allocations on thevirtual allocation list.
08_0321374460_ch06.qxd 10/3/07 10:49 PM Page 264

265What Is a Heap?
Figure 6.6 Splitting free blocks
So far, the discussion has revolved around how the heap manager organizesblocks of memory it has at its disposal. One question remains unanswered: Wheredoes the heap manager get the memory from? Fundamentally, the heap manageruses the Windows virtual memory manager to allocate memory in large chunks. Thememory is then massaged into different sized blocks to accommodate the allocationrequests of the application. When the virtual memory chunks are exhausted, the heapmanager allocates yet another large chunk of virtual memory, and the process con-tinues. The chunks that the heap manager requests from the virtual memory manag-er are known as heap segments. When a heap segment is first created, the underlyingvirtual memory is mostly reserved, with only a small portion being committed.Whenever the heap manager runs out of committed space in the heap segment, itexplicitly commits more memory and divides the newly committed space into blocksas more and more allocations are requested. Figure 6.7 illustrates the basic layout ofa heap segment.
6.M
EMO
RYCO
RRUPTION
PART
II—H
EAPS
Free Lists
Free List Bitmap
0
1
2
3
4
…
127
1200 2100
32 32
16
2300
Step 2: One 16 byte blockis added to the free listand one is returned to
caller
Step 3: Free list bitmapupdated to reflect changes
after block splitting
Step 1: First block of size32 is split into two 16 byteblocks and removed from
the free list
1 0 1 0 1 0 …
0 1 2 3 4 5 …
08_0321374460_ch06.qxd 10/3/07 10:49 PM Page 265

266 Chapter 6 Memory Corruption Part II—Heaps
Figure 6.7 Basic layout of a heap segment
The segment illustrated in Figure 6.7 contains two allocations (and associated meta-data) followed by a range of uncommitted memory. If another allocation requestarrives, and no available free block is present in the free lists, the heap manager wouldcommit additional memory from the uncommitted range, create a new heap blockwithin the committed memory range, and return the block to the user. Once a seg-ment runs out of uncommitted space, the heap manager creates a new segment. Thesize of the new segment is determined by doubling the size of the previous segment.If memory is scarce and cannot accommodate the new segment, the heap managertries to reduce the size by half. If that fails, the size is halved again until it either suc-ceeds or reaches a minimum segment size threshold—in which case, an error isreturned to the caller. The maximum number of segments that can be active within aheap is 64. Once the new segment is created, the heap manager adds it to a list thatkeeps track of all segments being used in the heap. Does the heap manager ever freememory associated with a segment? The answer is that the heap manager decommitsmemory on a per-needed basis, but it never releases it. (That is, the memory staysreserved.)
As Figure 6.7 depicts, each heap block in a given segment has metadata associat-ed with it. The metadata is used by the heap manager to effectively manage the heapblocks within a segment. The content of the metadata is dependent on the status ofthe heap block. For example, if the heap block is used by the application, the statusof the block is considered busy. Conversely, if the heap block is not in use (that is, hasbeen freed by the application), the status of the block is considered free. Figure 6.8shows how the metadata is structured in both situations.
PreAllocationMetadata
Useraccessible
part
PostAllocationMetadata
PreAllocationMetadata
Committed memory range
End of allocation End of allocation
Uncommitted memoryrange
PostAllocationMetadata
User accessiblepart
08_0321374460_ch06.qxd 10/3/07 10:49 PM Page 266

267What Is a Heap?
Figure 6.8 Structure of pre- and post-allocation metadata
It is important to note that a heap block might be considered busy in the eyes of theback end allocator but still not being used by the application. The reason behind thisis that any heap blocks that go on the front end allocator’s look aside list still have theirstatus set as busy.
The two size fields represent the size of the current block and the size of the pre-vious block (metadata inclusive). Given a pointer to a heap block, you can very easilyuse the two size fields to walk the heap segment forward and backward. Additionally,for free blocks, having the block size as part of the metadata enables the heap man-ager to very quickly index the correct free list to add the block to. The post-allocationmetadata is optional and is typically used by the debug heap for additional book-keeping information (see “Attaching Versus Running” under the debugger sidebar).
The flags field indicates the status of the heap block. The most important valuesof the flags field are shown in Table 6.1.
Table 6.1 Possible Block Status as Indicated by the Heap Flag
Value Description
0x01 Indicates that the allocation is being used by the application or the heap manager0x04 Indicates whether the heap block has a fill pattern associated with it0x08 Indicates that the heap block was allocated directly from the virtual memory
manager0x10 Indicates that this is the last heap block prior to an uncommitted range
6.M
EMO
RYCO
RRUPTION
PART
II—H
EAPS
CurrentBlockSize
PreviousBlockSize
SegmentIndex Flags
Preallocation metadata
Size (in bytes)
Busy Block: Allocation Metadata
Postallocation metadata
TagIndex
User accessiblepartUnused
2 2 1 1 1 16 81
SuffixBytes
Heap Extra
Fill area(debug mode)
CurrentBlockSize
PreviousBlockSize
SegmentIndex Flags
Preallocation metadata
Size (in bytes)
Free Block: Allocation Metadata
Postallocation metadata
TagIndex
User accessiblepartUnused
2 2 1 1 1 16 81
SuffixBytes
Heap Extra
Fill area(debug mode)
08_0321374460_ch06.qxd 10/3/07 10:49 PM Page 267

268 Chapter 6 Memory Corruption Part II—Heaps
You have already seen what happens when a heap block transitions from being busy tofree. However, one more technique that the heap manager employs needs to be dis-cussed. The technique is referred to as heap coalescing. Fundamentally, heap coalesc-ing is a mechanism that merges adjacent free blocks into one single large block to avoidmemory fragmentation problems. Figure 6.9 illustrates how a heap coalesce functions.
Prior to freeing the allocation of size 32
AllocationSize: 32
AllocationSize: 16
AllocationSize: 16
After freeing the allocation of size 32
AllocationSize: 64
Figure 6.9 Example of heap coalescing
When the heap manager is requested to free the heap block of size 32, it first checksto see if any adjacent blocks are also free. In Figure 6.9, two blocks of size 16 sur-round the block being freed. Rather than handing the block of size 32 to the free lists,the heap manager merges all three blocks into one (of size 64) and updates the freelists to indicate that a new block of size 64 is now available. Care is also taken by theheap manager to remove the prior two blocks (of size 16) from the free lists since theyare no longer available. It should go without saying that the act of coalescing freeblocks is an expensive operation. So why does the heap manager even bother? Theprimary reason behind coalescing heap blocks is to avoid what is known as heap frag-mentation. Imagine that your application just had a burst of allocations all with a verysmall size (16 bytes). Furthermore, let’s say that there were enough of these smallallocations to fill up an entire segment. After the allocation burst is completed, theapplication frees all the allocations. The net result is that you have one heap segmentfull of available allocations of size 16 bytes. Next, your application attempts to allo-cate a block of memory of size 48 bytes. The heap manager now tries to satisfy theallocation request from the segment, fails because the free block sizes are too small,and is forced to create a new heap segment. Needless to say, this is extremely pooruse of memory. Even though we had an entire segment of free memory, the heapmanager was forced to create a new segment to satisfy our slightly larger allocationrequest. Heap coalescing makes a best attempt at ensuring that situations such as thisare kept at a minimum by combining small free blocks into larger blocks.
08_0321374460_ch06.qxd 10/3/07 10:49 PM Page 268

269What Is a Heap?
This concludes our discussion of the internal workings of the heap manager.Before we move on and take a practical look the heap, let’s summarize what you havelearned.
When allocating a block of memory
1. The heap manager first consults the front end allocator’s LAL to see if a freeblock of memory is available; if it is, the heap manager returns it to the caller.Otherwise, step 2 is necessary.
2. The back end allocator’s free lists are consulted:a. If an exact size match is found, the flags are updated to indicate that
the block is busy; the block is then removed from the free list andreturned to the caller.
b. If an exact size match cannot be found, the heap manager checks tosee if a larger block can be split into two smaller blocks that satisfythe requested allocation size. If it can, the block is split. One blockhas the flags updated to a busy state and is returned to the caller.The other block has its flags set to a free state and is added to thefree lists. The original block is also removed from the free list.
3. If the free lists cannot satisfy the allocation request, the heap manager com-mits more memory from the heap segment, creates a new block in the com-mitted range (flags set to busy state), and returns the block to the caller.
When freeing a block of memory
1. The front end allocator is consulted first to see if it can handle the free block.If the free block is not handled by the front end allocator step 2 is necessary.
2. The heap manager checks if there are any adjacent free blocks; if so, it coa-lesces the blocks into one large block by doing the following:
a. The two adjacent free blocks are removed from the free lists.b. The new large block is added to the free list or look aside list.c. The flags field for the new large block is updated to indicate that it
is free.3. If no coalescing can be performed, the block is moved into the free list or look
aside list, and the flags are updated to a free state.
Now it’s time to complement our theoretical discussion of the heap manager withpractice. Listing 6.1 shows a simple application that, using the default process heap,allocates and frees some memory.
6.M
EMO
RYCO
RRUPTION
PART
II—H
EAPS
08_0321374460_ch06.qxd 10/3/07 10:49 PM Page 269

270 Chapter 6 Memory Corruption Part II—Heaps
Listing 6.1 Simple application that performs heap allocations
#include <windows.h>
#include <stdio.h>
#include <conio.h>
int __cdecl wmain (int argc, wchar_t* pArgs[])
{
BYTE* pAlloc1=NULL;
BYTE* pAlloc2=NULL;
HANDLE hProcessHeap=GetProcessHeap();
pAlloc1=(BYTE*)HeapAlloc(hProcessHeap, 0, 16);
pAlloc2=(BYTE*)HeapAlloc(hProcessHeap, 0, 1500);
//
// Use allocated memory
//
HeapFree(hProcessHeap, 0, pAlloc1);
HeapFree(hProcessHeap, 0, pAlloc2);
}
The source code and binary for Listing 6.1 can be found in the following folders:
Source code: C:\AWD\Chapter6\BasicAllocBinary: C:\AWDBIN\WinXP.x86.chk\06BasicAlloc.exe
Run this application under the debugger and break on the wmain function. Because we are interested in finding out more about the heap state, we must start
by finding out what heaps are active in the process. Each running process keeps a listof active heaps. The list of heaps is stored in the PEB (process environment block),which is simply a data structure that contains a plethora of information about theprocess. To dump out the contents of the PEB, we use the dt command, as illustrat-ed in Listing 6.2.
Listing 6.2 Finding the PEB for a process
0:000> dt _PEB @$peb
+0x000 InheritedAddressSpace : 0 ‘’
+0x001 ReadImageFileExecOptions : 0 ‘’
+0x002 BeingDebugged : 0x1 ‘’
08_0321374460_ch06.qxd 10/3/07 10:49 PM Page 270

271What Is a Heap?
+0x003 SpareBool : 0 ‘’
+0x004 Mutant : 0xffffffff
+0x008 ImageBaseAddress : 0x01000000
+0x00c Ldr : 0x00191e90 _PEB_LDR_DATA
+0x010 ProcessParameters: 0x00020000 _RTL_USER_PROCESS_PARAMETERS
+0x014 SubSystemData : (null)
+0x018 ProcessHeap : 0x00080000
+0x01c FastPebLock : 0x7c97e4c0 _RTL_CRITICAL_SECTION
+0x020 FastPebLockRoutine : 0x7c901005
+0x024 FastPebUnlockRoutine : 0x7c9010ed
+0x028 EnvironmentUpdateCount : 1
+0x02c KernelCallbackTable : (null)
+0x030 SystemReserved : [1] 0
+0x034 AtlThunkSListPtr32 : 0
+0x038 FreeList : (null)
+0x03c TlsExpansionCounter : 0
+0x040 TlsBitmap : 0x7c97e480
+0x044 TlsBitmapBits : [2] 1
+0x04c ReadOnlySharedMemoryBase : 0x7f6f0000
+0x050 ReadOnlySharedMemoryHeap : 0x7f6f0000
+0x054 ReadOnlyStaticServerData : 0x7f6f0688 -> (null)
+0x058 AnsiCodePageData : 0x7ffb0000
+0x05c OemCodePageData : 0x7ffc1000
+0x060 UnicodeCaseTableData : 0x7ffd2000
+0x064 NumberOfProcessors : 1
+0x068 NtGlobalFlag : 0
+0x070 CriticalSectionTimeout : _LARGE_INTEGER 0xffffffff`dc3cba00
+0x078 HeapSegmentReserve : 0x100000
+0x07c HeapSegmentCommit : 0x2000
+0x080 HeapDeCommitTotalFreeThreshold : 0x10000
+0x084 HeapDeCommitFreeBlockThreshold : 0x1000
+0x088 NumberOfHeaps : 3
+0x08c MaximumNumberOfHeaps : 0x10
+0x090 ProcessHeaps : 0x7c97de80 -> 0x00080000
+0x094 GdiSharedHandleTable : (null)
+0x098 ProcessStarterHelper : (null)
+0x09c GdiDCAttributeList : 0
+0x0a0 LoaderLock : 0x7c97c0d8
+0x0a4 OSMajorVersion : 5
+0x0a8 OSMinorVersion : 1
+0x0ac OSBuildNumber : 0xa28
+0x0ae OSCSDVersion : 0x200
+0x0b0 OSPlatformId : 2
+0x0b4 ImageSubsystem : 3
+0x0b8 ImageSubsystemMajorVersion : 4
+0x0bc ImageSubsystemMinorVersion : 0
6.M
EMO
RYCO
RRUPTION
PART
II—H
EAPS
(continues)
08_0321374460_ch06.qxd 10/3/07 10:49 PM Page 271

272 Chapter 6 Memory Corruption Part II—Heaps
+0x0c0 ImageProcessAffinityMask : 0
+0x0c4 GdiHandleBuffer : [34] 0
+0x14c PostProcessInitRoutine : (null)
+0x150 TlsExpansionBitmap : 0x7c97e478
+0x154 TlsExpansionBitmapBits : [32] 0
+0x1d4 SessionId : 0
+0x1d8 AppCompatFlags : _ULARGE_INTEGER 0x0
+0x1e0 AppCompatFlagsUser : _ULARGE_INTEGER 0x0
+0x1e8 pShimData : (null)
+0x1ec AppCompatInfo : (null)
+0x1f0 CSDVersion : _UNICODE_STRING “Service Pack 2”
+0x1f8 ActivationContextData : (null)
+0x1fc ProcessAssemblyStorageMap : (null)
+0x200 SystemDefaultActivationContextData : 0x00080000
+0x204 SystemAssemblyStorageMap : (null)
+0x208 MinimumStackCommit : 0
As you can see, PEB contains quite a lot of information, and you can learn a lot bydigging around in this data structure to familiarize yourself with the various compo-nents. In this particular exercise, we are specifically interested in the list of processheaps located at offset 0x90. The heap list member of PEB is simply an array of point-ers, where each pointer points to a data structure of type _HEAP. Let’s dump out thearray of heap pointers and see what it contains:
0:000> dd 0x7c97de80
7c97de80 00080000 00180000 00190000 00000000
7c97de90 00000000 00000000 00000000 00000000
7c97dea0 00000000 00000000 00000000 00000000
7c97deb0 00000000 00000000 00000000 00000000
7c97dec0 01a801a6 00020498 00000001 7c9b0000
7c97ded0 7ffd2de6 00000000 00000005 00000001
7c97dee0 ffff7e77 00000000 003a0044 0057005c
7c97def0 004e0049 004f0044 00530057 0073005c
The dump shows that three heaps are active in our process, and the default processheap pointer is always the first one in the list. Why do we have more than one heapin our process? Even the simplest of applications typically contains more than oneheap. Most applications implicitly use components that create their own heaps. Agreat example is the C runtime, which creates its own heap during initialization.
Listing 6.2 Finding the PEB for a process (continued)
08_0321374460_ch06.qxd 10/3/07 10:49 PM Page 272

273What Is a Heap?
Because our application works with the default process heap, we will focus our inves-tigation on that heap. Each of the process heap pointers points to a data structure oftype _HEAP. Using the dt command, we can very easily dump out the informationabout the process heap, as shown in Listing 6.3.
Listing 6.3 Detailed view of the default process heap
0:000> dt _HEAP 00080000
+0x000 Entry : _HEAP_ENTRY
+0x008 Signature : 0xeeffeeff
+0x00c Flags : 0x50000062
+0x010 ForceFlags : 0x40000060
+0x014 VirtualMemoryThreshold : 0xfe00
+0x018 SegmentReserve : 0x100000
+0x01c SegmentCommit : 0x2000
+0x020 DeCommitFreeBlockThreshold : 0x200
+0x024 DeCommitTotalFreeThreshold : 0x2000
+0x028 TotalFreeSize : 0xcb
+0x02c MaximumAllocationSize : 0x7ffdefff
+0x030 ProcessHeapsListIndex : 1
+0x032 HeaderValidateLength : 0x608
+0x034 HeaderValidateCopy : (null)
+0x038 NextAvailableTagIndex : 0
+0x03a MaximumTagIndex : 0
+0x03c TagEntries : (null)
+0x040 UCRSegments : (null)
+0x044 UnusedUnCommittedRanges : 0x00080598 _HEAP_UNCOMMMTTED_RANGE
+0x048 AlignRound : 0x17
+0x04c AlignMask : 0xfffffff8
+0x050 VirtualAllocdBlocks : _LIST_ENTRY [ 0x80050 - 0x80050 ]
+0x058 Segments : [64] 0x00080640 _HEAP_SEGMENT
+0x158 u : __unnamed
+0x168 u2 : __unnamed
+0x16a AllocatorBackTraceIndex : 0
+0x16c NonDedicatedListLength : 1
+0x170 LargeBlocksIndex : (null)
+0x174 PseudoTagEntries : (null)
+0x178 FreeLists : [128] _LIST_ENTRY [ 0x829b0 - 0x829b0 ]
+0x578 LockVariable : 0x00080608 _HEAP_LOCK
+0x57c CommitRoutine : (null)
+0x580 FrontEndHeap : 0x00080688
+0x584 FrontHeapLockCount : 0
+0x586 FrontEndHeapType : 0x1 ‘’
+0x587 LastSegmentIndex : 0 ‘’
6.M
EMO
RYCO
RRUPTION
PART
II—H
EAPS
08_0321374460_ch06.qxd 10/3/07 10:49 PM Page 273

274 Chapter 6 Memory Corruption Part II—Heaps
Once again, you can see that the _HEAP structure is fairly large with a lot of infor-mation about the heap. For this exercise, the most important members of the _HEAPstructure are located at the following offsets:
+0x050 VirtualAllocdBlocks : _LIST_ENTRY
Allocations that are greater than the virtual allocation size threshold are not managedas part of the segments and free lists. Rather, these allocations are allocated directlyfrom the virtual memory manager. You track these allocations by keeping a list as partof the _HEAP structure that contains all virtual allocations.
+0x058 Segments : [64]
The Segments field is an array of data structures of type _HEAP_SEGMENT. Eachheap segment contains a list of heap entries active within that segment. Later on, youwill see how we can use this information to walk the entire heap segment and locateallocations of interest.
+0x16c NonDedicatedListLength
As mentioned earlier, free list[0] contains allocations of size greater than 1016KB andless than the virtual allocation threshold. To efficiently manage this free list, the heapstores the number of allocations in the nondedicates list in this field. This informationcan come in useful when you want to analyze heap usage and quickly see how manyof your allocations fall into the variable sized free list[0] category.
+0x178 FreeLists : [128] _LIST_ENTRY
The free lists are stored at offset 0x178 and contain doubly linked lists. Each list con-tains free heap blocks of a specific size. We will take a closer look at the free lists in alittle bit.
+0x580 FrontEndHeap
The pointer located at offset 0x580 points to the front end allocator. We know theoverall architecture and strategy behind the front end allocator, but unfortunately, thepublic symbol package does not contain definitions for it, making an in-depth inves-tigation impossible. It is also worth noting that Microsoft reserves the right to changethe offsets previously described between Windows versions.
08_0321374460_ch06.qxd 10/3/07 10:49 PM Page 274

275What Is a Heap?
Back to our sample application—let’s continue stepping through the code in thedebugger. The first call of interest is to the GetProcessHeap API, which returns ahandle to the default process heap. Because we already found this handle/pointerourselves, we can verify that the explicit call to GetProcessHeap returns what weexpect. After the call, the eax register contains 0x00080000, which matches ourexpectations. Next are two calls to the kernel32!HeapAlloc API that attempt allo-cations of sizes 16 and 1500. Will these allocations be satisfied by committing moresegment memory or from the free lists? Before stepping over the first HeapAlloccall, let’s try to find out where the heap manager will find a free heap block to satisfythis allocation. The first step in our investigation is to see if any free blocks of size 16are available in the free lists. To check the availability of free blocks, we use the fol-lowing command:
dt _LIST_ENTRY 0x00080000+0x178+8
This command dumps out the first node in the free list that corresponds to allocationsof size 16. The 0x00080000 is the address of our heap. We add an offset of 0x178 toget the start of the free list table. The first entry in the free list table points to freelist[0]. Because our allocation is much smaller than the free list[0] size threshold, wesimply skip this free list by adding an additional 8 bytes (the size of the _LIST_ENTRYstructure), which puts us at free list[1] representing free blocks of size 16.
0:000> dt _LIST_ENTRY 0x00080000+0x178+8
[ 0x80180 - 0x80180 ]
+0x000 Flink : 0x00080180 _LIST_ENTRY [ 0x80180 - 0x80180 ]
+0x004 Blink : 0x00080180 _LIST_ENTRY [ 0x80180 - 0x80180 ]
Remember that the free lists are doubly linked lists; hence the Flink and Blinkfields of the _LIST_ENTRY structure are simply pointers to the next and previousallocations. It is critical to note that the pointer listed in the free lists actually pointsto the user-accessible part of the heap block and not to the start of the heap blockitself. As such, if you want to look at the allocation metadata, you need to first sub-tract 8 bytes from the pointer. Both of these pointers seem to point to 0x00080180,which in actuality is the address of the list node we were just dumping out(0x00080000+0x178+8=0x00080180). This implies that the free list corresponding toallocations of size 16 is empty. Before we assume that the heap manager must com-mit more memory in the segment, remember that it will only do so as the absolutelast resort. Hence, the heap manager first tries to see if there are any other free blocksof sizes greater than 16 that it could split to satisfy the allocation. In our particularcase, free list[0] contains a free heap block:
6.M
EMO
RYCO
RRUPTION
PART
II—H
EAPS
08_0321374460_ch06.qxd 10/3/07 10:49 PM Page 275

276 Chapter 6 Memory Corruption Part II—Heaps
0:000> dt _LIST_ENTRY 0x00080000+0x178
[ 0x82ab0 - 0x82ab0 ]
+0x000 Flink : 0x00082ab0 _LIST_ENTRY [ 0x80178 - 0x80178 ]
+0x004 Blink : 0x00082ab0 _LIST_ENTRY [ 0x80178 - 0x80178 ]
The Flink member points to the location in the heap block available to the caller. Inorder to see the full heap block (including metadata), we must first subtract 8 bytesfrom the pointer (refer to Figure 6.8).
0:000> dt _HEAP_ENTRY 0x00082ab0-0x8
+0x000 Size : 0xab
+0x002 PreviousSize : 0xb
+0x000 SubSegmentCode : 0x000b00ab
+0x004 SmallTagIndex : 0xee ‘’
+0x005 Flags : 0x14 ‘’
+0x006 UnusedBytes : 0xee ‘’
+0x007 SegmentIndex : 0 ‘’
It is important to note that the size reported is the true size of the heap block divid-ed by the heap granularity. The heap granularity is easily found by taking the size ofthe _HEAP_ENTY_STRUCTURE. A heap block, the size of which is reported to be 0xab,is in reality 0xb8*8 = 0x558 (1368) bytes.
The free heap block we are looking at definitely seems to be big enough to fit ourallocation request of size 16. In the debug session, step over the first instruction thatcalls HeapAlloc. If successful, we can then check free list[0] again and see if the allo-cation we looked at prior to the call has changed:
0:000> dt _LIST_ENTRY 0x00080000+0x178
[ 0x82ad8 - 0x82ad8 ]
+0x000 Flink : 0x00082ad8 _LIST_ENTRY [ 0x80178 - 0x80178 ]
+0x004 Blink : 0x00082ad8 _LIST_ENTRY [ 0x80178 - 0x80178 ]
0:000> dt _HEAP_ENTRY 0x00082ad8-0x8
+0x000 Size : 0xa6
+0x002 PreviousSize : 5
+0x000 SubSegmentCode : 0x000500a6
+0x004 SmallTagIndex : 0xee ‘’
+0x005 Flags : 0x14 ‘’
+0x006 UnusedBytes : 0xee ‘’
+0x007 SegmentIndex : 0 ‘’
Sure enough, what used to be the first entry in free list[0] has now changed. Insteadof a free block of size 0xab, we now have a free block of size 0xa6. The difference insize (0x5) is due to our allocation request breaking up the larger free block we saw
08_0321374460_ch06.qxd 10/3/07 10:49 PM Page 276
277What Is a Heap?
previously. If we are allocating 16 bytes (0x10), why is the difference in size of the freeblock before splitting and after only 0x5 bytes? The key is to remember that the sizereported must first be multiplied by the heap granularity factor of 0x8. The true sizeof the new free allocation is then 0x00000530 (0xa6*8), with the true size differencebeing 0x28. 0x10 of those 0x28 bytes are our allocation size, and the remaining 0x18bytes are all metadata associated with our heap block.
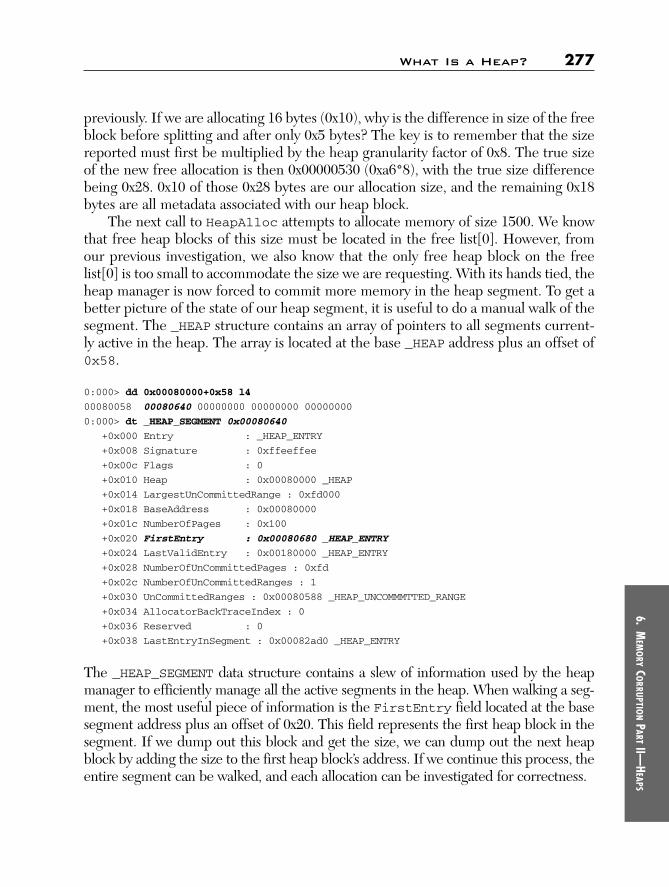
The next call to HeapAlloc attempts to allocate memory of size 1500. We knowthat free heap blocks of this size must be located in the free list[0]. However, fromour previous investigation, we also know that the only free heap block on the freelist[0] is too small to accommodate the size we are requesting. With its hands tied, theheap manager is now forced to commit more memory in the heap segment. To get abetter picture of the state of our heap segment, it is useful to do a manual walk of thesegment. The _HEAP structure contains an array of pointers to all segments current-ly active in the heap. The array is located at the base _HEAP address plus an offset of0x58.
0:000> dd 0x00080000+0x58 l4
00080058 00080640 00000000 00000000 00000000
0:000> dt _HEAP_SEGMENT 0x00080640
+0x000 Entry : _HEAP_ENTRY
+0x008 Signature : 0xffeeffee
+0x00c Flags : 0
+0x010 Heap : 0x00080000 _HEAP
+0x014 LargestUnCommittedRange : 0xfd000
+0x018 BaseAddress : 0x00080000
+0x01c NumberOfPages : 0x100
+0x020 FirstEntry : 0x00080680 _HEAP_ENTRY
+0x024 LastValidEntry : 0x00180000 _HEAP_ENTRY
+0x028 NumberOfUnCommittedPages : 0xfd
+0x02c NumberOfUnCommittedRanges : 1
+0x030 UnCommittedRanges : 0x00080588 _HEAP_UNCOMMMTTED_RANGE
+0x034 AllocatorBackTraceIndex : 0
+0x036 Reserved : 0
+0x038 LastEntryInSegment : 0x00082ad0 _HEAP_ENTRY
The _HEAP_SEGMENT data structure contains a slew of information used by the heapmanager to efficiently manage all the active segments in the heap. When walking a seg-ment, the most useful piece of information is the FirstEntry field located at the basesegment address plus an offset of 0x20. This field represents the first heap block in thesegment. If we dump out this block and get the size, we can dump out the next heapblock by adding the size to the first heap block’s address. If we continue this process, theentire segment can be walked, and each allocation can be investigated for correctness.
6.M
EMO
RYCO
RRUPTION
PART
II—H
EAPS
08_0321374460_ch06.qxd 10/3/07 10:49 PM Page 277

278 Chapter 6 Memory Corruption Part II—Heaps
0:000> dt _HEAP_ENTRY 0x00080680
+0x000 Size : 0x303
+0x002 PreviousSize : 8
+0x000 SubSegmentCode : 0x00080303
+0x004 SmallTagIndex : 0x9a ‘’
+0x005 Flags : 0x7 ‘’
+0x006 UnusedBytes : 0x18 ‘’
+0x007 SegmentIndex : 0 ‘’
0:000> dt _HEAP_ENTRY 0x00080680+(0x303*8)
+0x000 Size : 8
+0x002 PreviousSize : 0x303
+0x000 SubSegmentCode : 0x03030008
+0x004 SmallTagIndex : 0x99 ‘’
+0x005 Flags : 0x7 ‘’
+0x006 UnusedBytes : 0x1e ‘’
+0x007 SegmentIndex : 0 ‘’
0:000> dt _HEAP_ENTRY 0x00080680+(0x303*8)+(8*8)
+0x000 Size : 5
+0x002 PreviousSize : 8
+0x000 SubSegmentCode : 0x00080005
+0x004 SmallTagIndex : 0x91 ‘’
+0x005 Flags : 0x7 ‘’
+0x006 UnusedBytes : 0x1a ‘’
+0x007 SegmentIndex : 0 ‘’
…
…
…
+0x000 Size : 0xa6
+0x002 PreviousSize : 5
+0x000 SubSegmentCode : 0x000500a6
+0x004 SmallTagIndex : 0xee ‘’
+0x005 Flags : 0x14 ‘’
+0x006 UnusedBytes : 0xee ‘’
+0x007 SegmentIndex : 0 ‘’
Let’s see what the heap manager does to the segment (if anything) to try to satisfy theallocation request of size 1500 bytes. Step over the HeapAlloc call and walk the seg-ment again. The heap block of interest is shown next.
+0x000 Size : 0xbf
+0x002 PreviousSize : 5
+0x000 SubSegmentCode : 0x000500bf
+0x004 SmallTagIndex : 0x10 ‘’
+0x005 Flags : 0x7 ‘’
+0x006 UnusedBytes : 0x1c ‘’
+0x007 SegmentIndex : 0 ‘’
08_0321374460_ch06.qxd 10/3/07 10:49 PM Page 278

279What Is a Heap?
Before we stepped over the call to HeapAlloc, the last heap block was marked asfree and with a size of 0xa6. After the call, the block status changed to busy with a sizeof 0xbf (0xbf*8= 0x5f8), indicating that this block is now used to hold our new alloca-tion. Since our allocation was too big to fit into the previous size of 0xa6, the heapmanager committed more memory to the segment. Did it commit just enough to holdour allocation? Actually, it committed much more and put the remaining free mem-ory into a new block at address 0x000830c8. The heap manager is only capable ofasking for page sized allocations (4KB on x86 systems) from the virtual memory man-ager and returns the remainder of that allocation to the free lists.
The next couple of lines in our application simply free the allocations we justmade. What do we anticipate the heap manager to do when it executes the firstHeapFree call? In addition to updating the status of the heap block to free andadding it to the free lists, we expect it to try and coalesce the heap block with othersurrounding free blocks. Before we step over the first HeapFree call, let’s take a lookat the heap block associated with that call.
0:000> dt _HEAP_ENTRY 0x000830c8-(0xbf*8)-(0x5*8)
+0x000 Size : 5
+0x002 PreviousSize : 0xb
+0x000 SubSegmentCode : 0x000b0005
+0x004 SmallTagIndex : 0x1f ‘’
+0x005 Flags : 0x7 ‘’
+0x006 UnusedBytes : 0x18 ‘’
+0x007 SegmentIndex : 0 ‘’
0:000> dt _HEAP_ENTRY 0x000830c8-(0xbf*8)-(0x5*8)-(0xb*8)
+0x000 Size : 0xb
+0x002 PreviousSize : 5
+0x000 SubSegmentCode : 0x0005000b
+0x004 SmallTagIndex : 0 ‘’
+0x005 Flags : 0x7 ‘’
+0x006 UnusedBytes : 0x1c ‘’
+0x007 SegmentIndex : 0 ‘’
0:000> dt _HEAP_ENTRY 0x000830c8-(0xbf*8)
+0x000 Size : 0xbf
+0x002 PreviousSize : 5
+0x000 SubSegmentCode : 0x000500bf
+0x004 SmallTagIndex : 0x10 ‘’
+0x005 Flags : 0x7 ‘’
+0x006 UnusedBytes : 0x1c ‘’
+0x007 SegmentIndex : 0 ‘’
The status of the previous and next heap blocks are both busy (Flags=0x7), whichmeans that the heap manager is not capable of coalescing the memory, and the heap
6.M
EMO
RYCO
RRUPTION
PART
II—H
EAPS
08_0321374460_ch06.qxd 10/3/07 10:49 PM Page 279

280 Chapter 6 Memory Corruption Part II—Heaps
block is simply put on the free lists. More specifically, the heap block will go into freelist[1] because the size is 16 bytes. Let’s verify our theory—step over the HeapFreecall and use the same mechanism as previously used to see what happened to theheap block.
0:000> dt _HEAP_ENTRY 0x000830c8-(0xbf*8)-(0x5*8)
+0x000 Size : 5
+0x002 PreviousSize : 0xb
+0x000 SubSegmentCode : 0x000b0005
+0x004 SmallTagIndex : 0x1f ‘’
+0x005 Flags : 0x4 ‘’
+0x006 UnusedBytes : 0x18 ‘’
+0x007 SegmentIndex : 0 ‘’
As you can see, the heap block status is indeed set to be free, and the size remains thesame. Since the size remains the same, it serves as an indicator that the heap manag-er did not coalesce the heap block with adjacent blocks. Last, we verify that the blockmade it into the free list[1].
I will leave it as an exercise for the reader to figure out what happens to the seg-ment and heap blocks during the next call to HeapFree. Here’s a hint: Rememberthat the size of the heap block being freed is 1500 bytes and that the state of one ofthe adjacent blocks is set to free.
This concludes our overview of the internal workings of the heap manager.Although it might seem like a daunting task to understand and be able to walk the var-ious heap structures, after a little practice, it all becomes easier. Before we move onto the heap corruption scenarios, one important debugger command can help us bemore efficient when debugging heap corruption scenarios. The extension commandis called !heap and is part of the exts.dll debugger extension. Using this command,you can very easily display all the heap information you could possibly want. Actually,all the information we just manually gathered is outputted by the !heap extensioncommand in a split second. But wait—we just spent a lot of time figuring out how toanalyze the heap by hand, walk the segments, and verify the heap blocks. Why evenbother if we have this beautiful command that does all the work for us? As always, theanswer lies in how the debugger arrives at the information it presents. If the state ofthe heap is intact, the !heap extension command shows the heap state in a nice anddigestible form. If, however, the state of the heap has been corrupted, it is no longersufficient to rely on the command to tell us what and how it became corrupted. Weneed to know how to analyze the various parts of the heap to arrive at sound conclu-sions and possible culprits.
08_0321374460_ch06.qxd 10/3/07 10:49 PM Page 280

281Heap Corruptions
Attaching Versus Starting the Process Under the Debugger
The debug session you have seen so far has involved running a process under the debuggerfrom start to finish. Another option when debugging processes is attaching the debugger toan already-running process. Typically, using either approach will not dramatically changethe way you debug the process. The exception to the rule is when debugging heap-relatedissues. When starting the process under the debugger, the heap manager modifies allrequests to create new heaps and change the heap creation flags to enable debug-friendlyheaps (unless the _NO_DEBUG_HEAP environment variable is set to 1). In comparison,attaching to an already-running process, the heaps in the process have already been creat-ed using default heap creation flags and will not have the debug-friendly flags set (unlessexplicitly set by the application). The heap modification flags apply across all heaps in theprocess, including the default process heap. The biggest difference when starting a processunder the debugger is that the heap blocks contain an additional fill pattern field after theuser-accessible part (see Figure 6.8). The fill pattern is used by the heap manager to vali-date the integrity of the heap block during heap operations. When an allocation is success-ful, the heap manager fills this area of the block with a specific fill pattern. If an applicationmistakenly writes past the end of the user-accessible part, it overwrites all or portions of thisfill pattern field. The next time the application uses that allocation in any calls to the heapmanager, the heap manager takes a close look at the fill pattern field to make sure that ithasn’t changed. If the fill pattern field was overwritten by the application, the heap manag-er immediately breaks into the debugger, giving you the opportunity to look at the heapblock and try to infer why it was overwritten. Writing to any area of a heap block outsidethe bounds of the actual user-accessible part is a serious error that can be devastating to thestability of an application.
Heap Corruptions
Heap corruptions are arguably some of the trickiest problems to figure out. A processcan corrupt any given heap in nearly infinite ways. Armed with the knowledge of howthe heap manager functions, we now take a look at some of the most common rea-sons behind heap corruptions. Each scenario is accompanied by sample source codeillustrating the type of heap corruption being examined. A detailed debug session isthen presented, which takes you from the initial fault to the source of the heap cor-ruption. Along the way, we also introduce invaluable tools that can be used to moreeasily get to the root cause of the corruption.
6.M
EMO
RYCO
RRUPTION
PART
II—H
EAPS
08_0321374460_ch06.qxd 10/3/07 10:49 PM Page 281

282 Chapter 6 Memory Corruption Part II—Heaps
Using Uninitialied StateUninitialized state is a common programming mistake that can lead to numeroushours of debugging to track down. Fundamentally, uninitialized state refers to a blockof memory that has been successfully allocated but not yet initialized to a state inwhich it is considered valid for use. The memory block can range from simple nativedata types, such as integers, to complex data blobs. Using an uninitialized memoryblock results in unpredictable behavior. Listing 6.4 shows a small application that suf-fers from using uninitialized memory.
Listing 6.4 Simple application that uses uninitialized memory
#include <windows.h>
#include <stdio.h>
#include <conio.h>
#define ARRAY_SIZE 10
BOOL InitArray(int** pPtrArray);
int __cdecl wmain (int argc, wchar_t* pArgs[])
{
int iRes=1;
wprintf(L”Press any key to start...”);
_getch();
int** pPtrArray=(int**)HeapAlloc(GetProcessHeap(),
0,
sizeof(int*[ARRAY_SIZE]));
if(pPtrArray!=NULL)
{
InitArray(pPtrArray);
*(pPtrArray[0])=10;
iRes=0;
HeapFree(GetProcessHeap(), 0, pPtrArray);
}
return iRes;
}
BOOL InitArray(int** pPtrArray)
{
return FALSE ;
}
08_0321374460_ch06.qxd 10/3/07 10:49 PM Page 282

283Heap Corruptions
The source code and binary for Listing 6.4 can be found in the following folders:
Source code: C:\AWD\Chapter6\UninitBinary: C:\AWDBIN\WinXP.x86.chk\06Uninit.exe
The code in Listing 6.4 simply allocates an array of integer pointers. It then callsan InitArray function that initializes all elements in the array with valid integerpointers. After the call, the application tries to dereference the first pointer and setsthe value to 10. Can this code fail? Absolutely! Because we are not checking thereturn value of the call to InitArray, the function might fail to initialize the array.Subsequently, when we try to dereference the first element, we might incorrectlypick up a random address. The application might experience an access violation if theaddress is invalid (in the sense that it is not accessible memory), or it might succeed.What happens next depends largely on the random pointer itself. If the pointer ispointing to a valid address used elsewhere, the application continues execution. If,however, the pointer points to inaccessible memory, the application might crashimmediately. Suffice it to say that even if the application does not crash immediately,memory is being incorrectly used, and the application will eventually fail.
When the application is executed, we can easily see that a failure does occur. Toget a better picture of what is failing, run the application under the debugger, asshown in Listing 6.5.
Listing 6.5 Application crash seen under the debugger
…
…
…
0:000> g
Press any key to start...(740.5b0): Access violation - code c0000005 (first chance)
First chance exceptions are reported before any exception handling.
This exception may be expected and handled.
eax=00000000 ebx=7ffdb000 ecx=00082ab0 edx=baadf00d esi=7c9118f1 edi=00011970
eip=010011c9 esp=0006ff3c ebp=0006ff44 iopl=0 nv up ei pl zr na pe nc
cs=001b ss=0023 ds=0023 es=0023 fs=003b gs=0000 efl=00010246
06uninit!wmain+0x49:
010011c9 c7020a000000 mov dword ptr [edx],0Ah ds:0023:baadf00d=????????
0:000> kb
ChildEBP RetAddr Args to Child
0007ff7c 01001413 00000001 00034ed8 00037118 06uninit!wmain+0x4b
0007ffc0 7c816fd7 00011970 7c9118f1 7ffd4000 06uninit!__wmainCRTStartup+0x102
0007fff0 00000000 01001551 00000000 78746341 kernel32!BaseProcessStart+0x23
6.M
EMO
RYCO
RRUPTION
PART
II—H
EAPS
08_0321374460_ch06.qxd 10/3/07 10:49 PM Page 283

284 Chapter 6 Memory Corruption Part II—Heaps
The instruction that causes the crash corresponds to the line of code in our applica-tion that sets the first element in the array to the value 10:
mov dword ptr [edx],0xAh ; *(pPtrArray[0])=10;
The next logical step is to understand why the access violation occurred. Because weare trying to write to a memory location that equates to the first element in our array,the access violation might be because the memory being written to is inaccessible.Dumping out the contents of the memory in question yields
0:000> dd edx
baadf00d ???????? ???????? ???????? ????????
baadf01d ???????? ???????? ???????? ????????
baadf02d ???????? ???????? ???????? ????????
baadf03d ???????? ???????? ???????? ????????
baadf04d ???????? ???????? ???????? ????????
baadf05d ???????? ???????? ???????? ????????
baadf06d ???????? ???????? ???????? ????????
baadf07d ???????? ???????? ???????? ????????
The pointer located in the edx register has a really strange value (baadf00d) thatpoints to inaccessible memory. Trying to dereference this pointer is what ultimatelycaused the access violation. Where does this interesting pointer value (baadf00d)come from? Surely, the pointer value is incorrect enough that it wasn’t left there bysome prior allocation. The bad pointer we are seeing was explicitly placed there by theheap manager. Whenever you start a process under the debugger, the heap managerautomatically initializes all memory with a fill pattern. The specifics of the fill patterndepend on the status of the heap block. When a heap block is first returned to thecaller, the heap manager fills the user-accessible part of the heap block with a fill pat-tern consisting of the values baadf00d. This indicates that the heap block is allocatedbut has not yet been initialized. Should an application (such as ours) dereference thismemory block without initializing it first, it will fail. On the other hand, if the applica-tion properly initializes the memory block, execution continues. After the heap blockis freed, the heap manager once again initializes the user-accessible part of the heapblock, this time with the values feeefeee. Again, the free-fill pattern is added by theheap manager to trap any memory accesses to the block after it has been freed. Thememory not being initialized prior to use is the reason for our particular failure.
Let’s see how the allocated memory differs when the application is not startedunder the debugger but rather attached to the process. Start the application, andwhen the Press any key to start prompt appears, attach the debugger. Onceattached, set a breakpoint on the instruction that caused the crash and dump out thecontents of the edx register.
08_0321374460_ch06.qxd 10/3/07 10:49 PM Page 284

285Heap Corruptions
0:000> dd edx
00080178 000830f0 000830f0 00080180 00080180
00080188 00080188 00080188 00080190 00080190
00080198 00080198 00080198 000801a0 000801a0
000801a8 000801a8 000801a8 000801b0 000801b0
000801b8 000801b8 000801b8 000801c0 000801c0
000801c8 000801c8 000801c8 000801d0 000801d0
000801d8 000801d8 000801d8 000801e0 000801e0
000801e8 000801e8 000801e8 000801f0 000801f0
This time around, you can see that the edx register contains a pointer value that ispointing to accessible, albeit incorrect, memory. No longer is the array initialized topointer values that cause an immediate access violation (baadf00d) when derefer-enced. As a matter of fact, stepping over the faulting instruction this time around suc-ceeds. Do we know the origins of the pointer value we just used? Not at all. It couldbe any memory location in the process. The incorrect usage of the pointer valuemight end up causing serious problems somewhere else in the application in pathsthat rely on the state of that memory to be intact. If we resume execution of the appli-cation, we will notice that an access violation does in fact occur, albeit much later inthe execution.
0:000> g
(1a8.75c): Access violation - code c0000005 (first chance)
First chance exceptions are reported before any exception handling.
This exception may be expected and handled.
eax=0000000a ebx=00080000 ecx=00080178 edx=00000000 esi=00000002 edi=0000000f
eip=7c911404 esp=0006f77c ebp=0006f99c iopl=0 nv up ei pl nz ac po nc
cs=001b ss=0023 ds=0023 es=0023 fs=003b gs=0000 efl=00010212
ntdll!RtlAllocateHeap+0x6c9:
7c911404 0fb70e movzx ecx,word ptr [esi] ds:0023:00000002=????
0:000> g
(1a8.75c): Access violation - code c0000005 (!!! second chance !!!)
eax=0000000a ebx=00080000 ecx=00080178 edx=00000000 esi=00000002 edi=0000000f
eip=7c911404 esp=0006f77c ebp=0006f99c iopl=0 nv up ei pl nz ac po nc
cs=001b ss=0023 ds=0023 es=0023 fs=003b gs=0000 efl=00000212
ntdll!RtlAllocateHeap+0x6c9:
7c911404 0fb70e movzx ecx,word ptr [esi] ds:0023:00000002=????
0:000> k
ChildEBP RetAddr
0007f9b0 7c80e323 ntdll!RtlAllocateHeap+0x6c9
0007fa24 7c80e00d kernel32!BasepComputeProcessPath+0xb3
0007fa64 7c80e655 kernel32!BaseComputeProcessDllPath+0xe3
0007faac 7c80e5ab kernel32!GetModuleHandleForUnicodeString+0x28
0007ff30 7c80e45c kernel32!BasepGetModuleHandleExW+0x18e
6.M
EMO
RYCO
RRUPTION
PART
II—H
EAPS
08_0321374460_ch06.qxd 10/3/07 10:49 PM Page 285

286 Chapter 6 Memory Corruption Part II—Heaps
0007ff48 7c80b6c0 kernel32!GetModuleHandleW+0x29
0007ff54 77c39d23 kernel32!GetModuleHandleA+0x2d
0007ff60 77c39e78 msvcrt!__crtExitProcess+0x10
0007ff70 77c39e90 msvcrt!_cinit+0xee
0007ff84 01001429 msvcrt!exit+0x12
0007ffc0 7c816fd7 06uninit!__wmainCRTStartup+0x118
0007fff0 00000000 kernel32!BaseProcessStart+0x23
As you can see, the stack reporting the access violation has nothing to do with any ofour own code. All we really know is that when the process is about to exit, as you cansee from the bottommost frame (msvcrt!__crtExitProcess+0x10), it tries toallocate memory and fails in the memory manager. Typically, access violations occur-ring in the heap manager are good indicators that a heap corruption has occurred.Backtracking the source of the corruption from this location can be an excruciatinglydifficult process that should be avoided at all costs. From the two previous sampleruns, it should be evident that trapping a heap corruption at the point of occurrenceis much more desirable than sporadic failures in code paths that we do not directlyown. One of the ways we can achieve this is by starting the process under the debug-ger and letting the heap manager use fill patterns to provide some level of protection.Although the heap manager does provide this mechanism, it is not necessarily thestrongest level of protection. The usage of fill patterns requires that a call be made tothe heap manager so that it can validate that the fill pattern is still valid. Most of thetime, the damage has already been done at the point of validation, and the faultcaused by the heap manager still requires us to work backward and figure out whatcaused the fault to begin with.
In addition to uninitialized state, another very common scenario that results inheap corruptions is a heap overrun.
Heap Overruns and UnderrunsIn the introduction to this chapter, we looked at the internal workings of the heapmanager and how all heap blocks are laid out. Figure 6.8 illustrated how a heap blockis broken down and what auxiliary metadata is kept on a per-block basis for the heapmanager to be capable of managing the block. If a faulty piece of code overwrites anyof the metadata, the integrity of the heap is compromised and the application willfault. The most common form of metadata overwriting is when the owner of the heapblock does not respect the boundaries of the block. This phenomenon is known as aheap overrun or, reciprocally, a heap underrun.
Let’s take a look at an example. The application shown in Listing 6.6 simply makesa copy of the string passed in on the command line and prints out the copy.
08_0321374460_ch06.qxd 10/3/07 10:49 PM Page 286

287Heap Corruptions
Listing 6.6 Heap-based string copy application
#include <windows.h>
#include <stdio.h>
#include <conio.h>
#define SZ_MAX_LEN 10
WCHAR* pszCopy = NULL ;
BOOL DupString(WCHAR* psz);
int __cdecl wmain (int argc, wchar_t* pArgs[])
{
int iRet=0;
if(argc==2)
{
printf(“Press any key to start\n”);
_getch();
DupString(pArgs[1]);
}
else
{
iRet=1;
}
return iRet;
}
BOOL DupString(WCHAR* psz)
{
BOOL bRet=FALSE;
if(psz!=NULL)
{
pszCopy=(WCHAR*) HeapAlloc(GetProcessHeap(),
0,
SZ_MAX_LEN*sizeof(WCHAR));
if(pszCopy)
{
wcscpy(pszCopy, psz);
wprintf(L”Copy of string: %s”, pszCopy);
HeapFree(GetProcessHeap(), 0, pszCopy);
bRet=TRUE;
}
}
return bRet;
}
6.M
EMO
RYCO
RRUPTION
PART
II—H
EAPS
08_0321374460_ch06.qxd 10/3/07 10:49 PM Page 287
288 Chapter 6 Memory Corruption Part II—Heaps
The source code and binary for Listing 6.6 can be found in the following folders:
Source code: C:\AWD\Chapter6\OverrunBinary: C:\AWDBIN\WinXP.x86.chk\06Overrun.exe
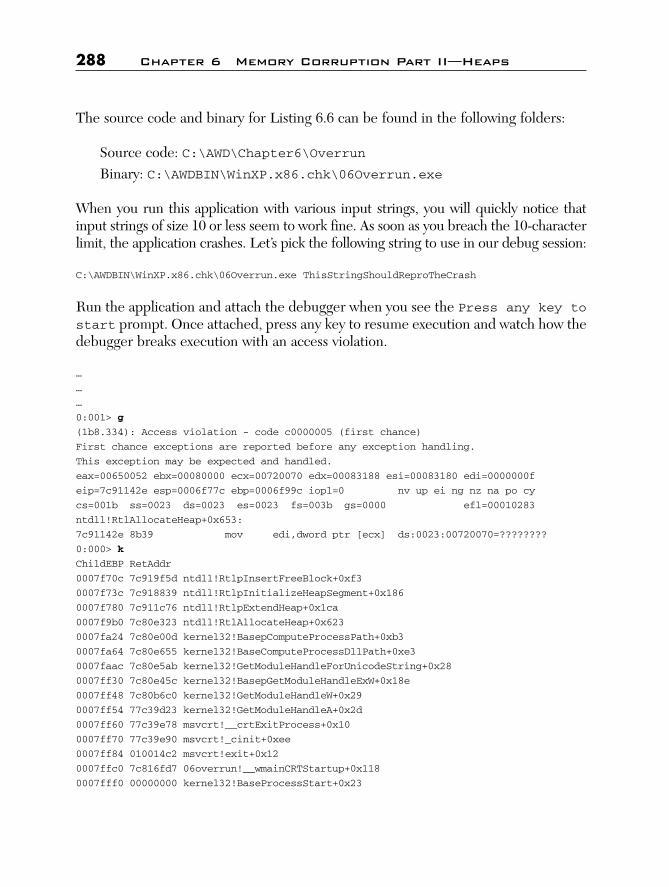
When you run this application with various input strings, you will quickly notice thatinput strings of size 10 or less seem to work fine. As soon as you breach the 10-characterlimit, the application crashes. Let’s pick the following string to use in our debug session:
C:\AWDBIN\WinXP.x86.chk\06Overrun.exe ThisStringShouldReproTheCrash
Run the application and attach the debugger when you see the Press any key tostart prompt. Once attached, press any key to resume execution and watch how thedebugger breaks execution with an access violation.
…
…
…
0:001> g
(1b8.334): Access violation - code c0000005 (first chance)
First chance exceptions are reported before any exception handling.
This exception may be expected and handled.
eax=00650052 ebx=00080000 ecx=00720070 edx=00083188 esi=00083180 edi=0000000f
eip=7c91142e esp=0006f77c ebp=0006f99c iopl=0 nv up ei ng nz na po cy
cs=001b ss=0023 ds=0023 es=0023 fs=003b gs=0000 efl=00010283
ntdll!RtlAllocateHeap+0x653:
7c91142e 8b39 mov edi,dword ptr [ecx] ds:0023:00720070=????????
0:000> k
ChildEBP RetAddr
0007f70c 7c919f5d ntdll!RtlpInsertFreeBlock+0xf3
0007f73c 7c918839 ntdll!RtlpInitializeHeapSegment+0x186
0007f780 7c911c76 ntdll!RtlpExtendHeap+0x1ca
0007f9b0 7c80e323 ntdll!RtlAllocateHeap+0x623
0007fa24 7c80e00d kernel32!BasepComputeProcessPath+0xb3
0007fa64 7c80e655 kernel32!BaseComputeProcessDllPath+0xe3
0007faac 7c80e5ab kernel32!GetModuleHandleForUnicodeString+0x28
0007ff30 7c80e45c kernel32!BasepGetModuleHandleExW+0x18e
0007ff48 7c80b6c0 kernel32!GetModuleHandleW+0x29
0007ff54 77c39d23 kernel32!GetModuleHandleA+0x2d
0007ff60 77c39e78 msvcrt!__crtExitProcess+0x10
0007ff70 77c39e90 msvcrt!_cinit+0xee
0007ff84 010014c2 msvcrt!exit+0x12
0007ffc0 7c816fd7 06overrun!__wmainCRTStartup+0x118
0007fff0 00000000 kernel32!BaseProcessStart+0x23
08_0321374460_ch06.qxd 10/3/07 10:49 PM Page 288

289Heap Corruptions
Glancing at the stack, it looks like the application was in the process of shutting downwhen the access violation occurred. As per our previous discussion, whenever youencounter an access violation in the heap manager code, chances are you are experi-encing a heap corruption. The only problem is that our code is nowhere on the stack.Once again, the biggest problem with heap corruptions is that the faulting code is noteasily trapped at the point of corruption; rather, the corruption typically shows uplater on in the execution. This behavior alone makes it really hard to track down thesource of heap corruption. However, with an understanding of how the heap manag-er works, we can do some preliminary investigation of the heap and see if we can findsome clues as to some potential culprits. Without knowing which part of the heap iscorrupted, a good starting point is to see if the segments are intact. Instead of manu-ally walking the segments, we use the !heap extension command, which saves us aton of grueling manual heap work. A shortened version of the output for the defaultprocess heap is shown in Listing 6.7.
Listing 6.7 Heap corruption analysis using the heap debugger command
0:000> !heap -s
Heap Flags Reserv Commit Virt Free List UCR Virt Lock Fast
(k) (k) (k) (k) length blocks cont. heap
---------------------------------------
00080000 00000002 1024 16 16 3 1 1 0 0 L
00180000 00001002 64 24 24 15 1 1 0 0 L
00190000 00008000 64 12 12 10 1 1 0 0
00260000 00001002 64 28 28 7 1 1 0 0 L
---------------------------------------
0:000> !heap -a 00080000
Index Address Name Debugging options enabled
1: 00080000
Segment at 00080000 to 00180000 (00004000 bytes committed)
Flags: 00000002
ForceFlags: 00000000
Granularity: 8 bytes
Segment Reserve: 00100000
Segment Commit: 00002000
DeCommit Block Thres: 00000200
DeCommit Total Thres: 00002000
Total Free Size: 000001d0
Max. Allocation Size: 7ffdefff
Lock Variable at: 00080608
Next TagIndex: 0000
Maximum TagIndex: 0000
Tag Entries: 00000000
6.M
EMO
RYCO
RRUPTION
PART
II—H
EAPS
(continues)
08_0321374460_ch06.qxd 10/3/07 10:49 PM Page 289

290 Chapter 6 Memory Corruption Part II—Heaps
PsuedoTag Entries: 00000000
Virtual Alloc List: 00080050
UCR FreeList: 00080598
FreeList Usage: 00000000 00000000 00000000 00000000
FreeList[ 00 ] at 00080178: 00083188 . 00083188
00083180: 003a8 . 00378 [00] - free
Unable to read nt!_HEAP_FREE_ENTRY structure at 0065004a
Segment00 at 00080640:
Flags: 00000000
Base: 00080000
First Entry: 00080680
Last Entry: 00180000
Total Pages: 00000100
Total UnCommit: 000000fc
Largest UnCommit:000fc000
UnCommitted Ranges: (1)
00084000: 000fc000
Heap entries for Segment00 in Heap 00080000
00080000: 00000 . 00640 [01] - busy (640)
00080640: 00640 . 00040 [01] - busy (40)
00080680: 00040 . 01808 [01] - busy (1800)
00081e88: 01808 . 00210 [01] - busy (208)
00082098: 00210 . 00228 [01] - busy (21a)
000822c0: 00228 . 00090 [01] - busy (84)
00082350: 00090 . 00030 [01] - busy (22)
00082380: 00030 . 00018 [01] - busy (10)
00082398: 00018 . 00068 [01] - busy (5b)
00082400: 00068 . 00230 [01] - busy (224)
00082630: 00230 . 002e0 [01] - busy (2d8)
00082910: 002e0 . 00320 [01] - busy (314)
00082c30: 00320 . 00320 [01] - busy (314)
00082f50: 00320 . 00030 [01] - busy (24)
00082f80: 00030 . 00030 [01] - busy (24)
00082fb0: 00030 . 00050 [01] - busy (40)
00083000: 00050 . 00048 [01] - busy (40)
00083048: 00048 . 00038 [01] - busy (2a)
00083080: 00038 . 00010 [01] - busy (1)
00083090: 00010 . 00050 [01] - busy (44)
000830e0: 00050 . 00018 [01] - busy (10)
000830f8: 00018 . 00068 [01] - busy (5b)
00083160: 00068 . 00020 [01] - busy (14)
00083180: 003a8 . 00378 [00]
000834f8: 00000 . 00000 [00]
Listing 6.7 Heap corruption analysis using the heap debugger command (continued)
0
08_0321374460_ch06.qxd 10/3/07 10:49 PM Page 290

291Heap Corruptions
The last heap entry in a segment is typically a free block. In Listing 6.7, however, wehave a couple of odd entries at the end. The status of the heap blocks (0) seems toindicate that both blocks are free; however, the size of the blocks does not seem tomatch up. Let’s look at the first free block:
00083180: 003a8 . 00378 [00]
The heap block states that the size of the previous block is 003a8 and the size of the cur-rent block is 00378. Interestingly enough, the prior block is reporting its own size to be0x20 bytes, which does not match up well. Even worse, the last free block in the seg-ment states that both the previous and current sizes are 0. If we go even further back inthe heap segment, we can see that all the heap entries prior to 00083160 make sense (atleast in the sense that the heap entry metadata seems intact). One of the potential theo-ries should now start to take shape. The usage of the heap block at location 00083160seems suspect, and it’s possible that the usage of that heap block caused the metadata ofthe following block to become corrupt. Who allocated the heap block at 00083160? Ifwe take a closer look at the block, we can see if we can recognize the content:
0:000> dd 00083160
00083160 000d0004 000c0199 00000000 00730069
00083170 00740053 00690072 0067006e 00680053
00083180 0075006f 0064006c 00650052 00720070
00083190 0054006f 00650068 00720043 00730061
000831a0 00000068 00000000 00000000 00000000
000831b0 00000000 00000000 00000000 00000000
000831c0 00000000 00000000 00000000 00000000
000831d0 00000000 00000000 00000000 00000000
Parts of the block seem to resemble a string. If we use the du command on the blockstarting at address 000830f8+0xc, we see the following:
0:000> du 00083160+c
0008316c “isStringShouldReproTheCrash”
The string definitely looks familiar. It is the same string (or part of it) that we passedin on the command line. Furthermore, the string seems to stretch all the way toaddress 000831a0, which crosses the boundary to the next reported free block ataddress 00083180. If we dump out the heap entry at address 00083180, we can seethe following:
0:000> dt _HEAP_ENTRY 00083180
+0x000 Size : 0x6f
6.M
EMO
RYCO
RRUPTION
PART
II—H
EAPS
08_0321374460_ch06.qxd 10/3/07 10:49 PM Page 291

292 Chapter 6 Memory Corruption Part II—Heaps
+0x002 PreviousSize : 0x75
+0x000 SubSegmentCode : 0x0075006
+0x004 SmallTagIndex : 0x6c ‘l’
+0x005 Flags : 0 ‘’
+0x006 UnusedBytes : 0x64 ‘d’
+0x007 SegmentIndex : 0 ‘’
The current and previous size fields correspond to part of the string that crossed theboundary of the previous block. Armed with the knowledge of which string seemed tohave caused the heap block overwrite, we can turn to code reviewing and figure outrelatively easily that the string copy function wrote more than the maximum numberof characters allowed in the destination string, causing an overwrite of the next heapblock. While the heap manager was unable to detect the overwrite at the exact pointit occurred, it definitely detected the heap block overwrite later on in the execution,which resulted in an access violation because the heap was in an inconsistent state.
In the previous simplistic application, analyzing the heap at the point of theaccess violation yielded a very clear picture of what overwrote the heap block andsubsequently, via code reviewing, who the culprit was. Needless to say, it is not alwayspossible to arrive at these conclusions merely by inspecting the contents of the heapblocks. The complexity of the system can dramatically reduce your success whenusing this approach. Furthermore, even if you do get some clues to what is overwrit-ing the heap blocks, it might be really difficult to find the culprit by merely review-ing code. Ultimately, the easiest way to figure out a heap corruption would be if wecould break execution when the memory is being overwritten rather than after.Fortunately, the Application Verifier tool provides a powerful facility that enables thisbehavior. The application verifier test setting commonly used when tracking downheap corruptions is called the Heaps test setting (also referred to as pageheap).Pageheap works on the basis of surrounding the heap blocks with a protection layerthat serves to isolate the heap blocks from one another. If a heap block is overwritten,the protection layer detects the overwrite as close to the source as possible and breaksexecution, giving the developer the ability to investigate why the overwrite occurred.Pageheap runs in two different modes: normal pageheap and full pageheap. The pri-mary difference between the two modes is the strength of the protection layer.Normal pageheap uses fill patterns in an attempt to detect heap block corruptions.The utilization of fill patterns requires that another call be made to the heap manag-er post corruption so that the heap manager has the chance to validate the integrity(check fill patterns) of the heap block and report any inconsistencies. Additionally,normal page heap keeps the stack trace for all allocations, making it easier to under-stand who allocated the memory. Figure 6.10 illustrates what a heap block looks likewhen normal page heap is turned on.
08_0321374460_ch06.qxd 10/3/07 10:49 PM Page 292

293Heap Corruptions
Figure 6.10 Normal page heap block layout
The primary difference between a regular heap block and a normal page heap blockis the addition of pageheap metadata. The pageheap metadata contains information,such as the block requested and actual sizes, but perhaps the most useful member ofthe metadata is the stack trace. The stack trace member allows the developer to getthe full stack trace of the origins of the allocation (that is, where it was allocated). Thisaids greatly when looking at a corrupt heap block, as it gives you clues to who theowner of the heap block is and affords you the luxury of narrowing down the scope ofthe code review. Imagine that the HeapAlloc call in Listing 6.6 resulted in the fol-lowing pointer: 0019e260. To dump out the contents of the pageheap metadata, wemust first subtract 32 (0x20) bytes from the pointer.
0:000> dd 0019e4b8-0x20
0019e498 abcdaaaa 80081000 00000014 0000003c
0019e4a8 00000018 00000000 0028697c dcbaaaaa
0019e4b8 e0e0e0e0 e0e0e0e0 e0e0e0e0 e0e0e0e0
0019e4c8 e0e0e0e0 a0a0a0a0 a0a0a0a0 00000000
0019e4d8 00000000 00000000 000a0164 00001000
0019e4e8 00180178 00180178 00000000 00000000
0019e4f8 00000000 00000000 00000000 00000000
0019e508 00000000 00000000 00000000 00000000
6.M
EMO
RYCO
RRUPTION
PART
II—H
EAPS
Regular HeapEntry Metadata
8 bytes 32 bytes
Allocated Heap Block
Fill pattern:ABCDAAAA
PageheapMetadata
Fill pattern:DCBAAAAA
User accessiblepart fill pattern:
E0
Suffix fillpattern:
A0A0A0A0
HeapExtra
Regular HeapEntry Metadata
8 bytes 32 bytes
Free Heap Block
Fill pattern:ABCDAAA9
PageheapMetadata
Fill pattern:DCBAAAA9
User accessiblepart fill pattern:
F0
Suffix fillpattern:
A0A0A0A0
HeapExtra
Heap
Pageheap Metadata
Requestedsize
Actualsize
FreeQueue Trace Index StackTrace
08_0321374460_ch06.qxd 10/3/07 10:49 PM Page 293

294 Chapter 6 Memory Corruption Part II—Heaps
Here, we can clearly see the starting (abcdaaaa) and ending (dcbaaaaa) fill patternsthat enclose the metadata. To see the pageheap metadata in a more digestible form,we can use the _DPH_BLOCK_INFORMATION data type:
0:000> dt _DPH_BLOCK_INFORMATION 0019e4b8-0x20
+0x000 StartStamp :
+0x004 Heap : 0x80081000
+0x008 RequestedSize :
+0x00c ActualSize :
+0x010 FreeQueue : _LIST_ENTRY 18-0
+0x010 TraceIndex : 0x18
+0x018 StackTrace : 0x0028697c
+0x01c EndStamp :
The stack trace member contains the stack trace of the allocation. To see the stacktrace, we have to use the dds command, which displays the contents of a range ofmemory under the assumption that the contents in the range are a series of address-es in the symbol table.
0:000> dds 0x0028697c
0028697c abcdaaaa
00286980 00000001
00286984 00000006
…
…
…
0028699c 7c949d18 ntdll!RtlAllocateHeapSlowly+0x44
002869a0 7c91b298 ntdll!RtlAllocateHeap+0xe64
002869a4 01001224 06overrun!DupString+0x24
002869a8 010011eb 06overrun!wmain+0x2b
002869ac 010013a9 06overrun!wmainCRTStartup+0x12b
002869b0 7c816d4f kernel32!BaseProcessStart+0x23
002869b4 00000000
002869b8 00000000
…
…
…
The shortened version of the output of the dds command shows us the stack trace ofthe allocating code. I cannot stress the usefulness of the recorded stack trace databaseenough. Whether you are looking at heap corruptions or memory leaks, given anypageheap block, you can very easily get to the stack trace of the allocating code, whichin turn allows you to focus your efforts on that area of the code.
08_0321374460_ch06.qxd 10/3/07 10:49 PM Page 294

295Heap Corruptions
Now let’s see how the normal pageheap facility can be used to track down thememory corruption shown earlier in Listing 6.6. Enable normal pageheap on theapplication (see Appendix A, “Application Verifier Test Settings”), and start the processunder the debugger using ThisStringShouldReproTheCrash as input. Listing 6.8shows how Application Verifier breaks execution because of a corrupted heap block.
Listing 6.8 Application verifier reported heap block corruption
…
…
…
0:000> g
Press any key to start
Copy of string: ThisStringShouldReproTheCrash
=======================================
VERIFIER STOP 00000008 : pid 0x640: Corrupted heap block.
00081000 : Heap handle used in the call.
001A04D0 : Heap block involved in the operation.
00000014 : Size of the heap block.
00000000 : Reserved
=======================================
This verifier stop is not continuable. Process will be terminated
when you use the `go’ debugger command.
=======================================
(640.6a8): Break instruction exception - code 80000003 (first chance)
eax=000001ff ebx=0040acac ecx=7c91eb05 edx=0006f949 esi=00000000 edi=000001ff
eip=7c901230 esp=0006f9dc ebp=0006fbdc iopl=0 nv up ei pl nz na po nc
cs=001b ss=0023 ds=0023 es=0023 fs=003b gs=0000 efl=00000202
ntdll!DbgBreakPoint:
7c901230 cc int 3
The information presented by Application Verifier gives us the pointer to the heap blockthat was corrupted. From here, getting the stack trace of the allocating code is trivial.
0:000> dt _DPH_BLOCK_INFORMATION 001A04D0-0x20
+0x000 StartStamp : 0xabcdaaaa
6.M
EMO
RYCO
RRUPTION
PART
II—H
EAPS
08_0321374460_ch06.qxd 10/3/07 10:49 PM Page 295
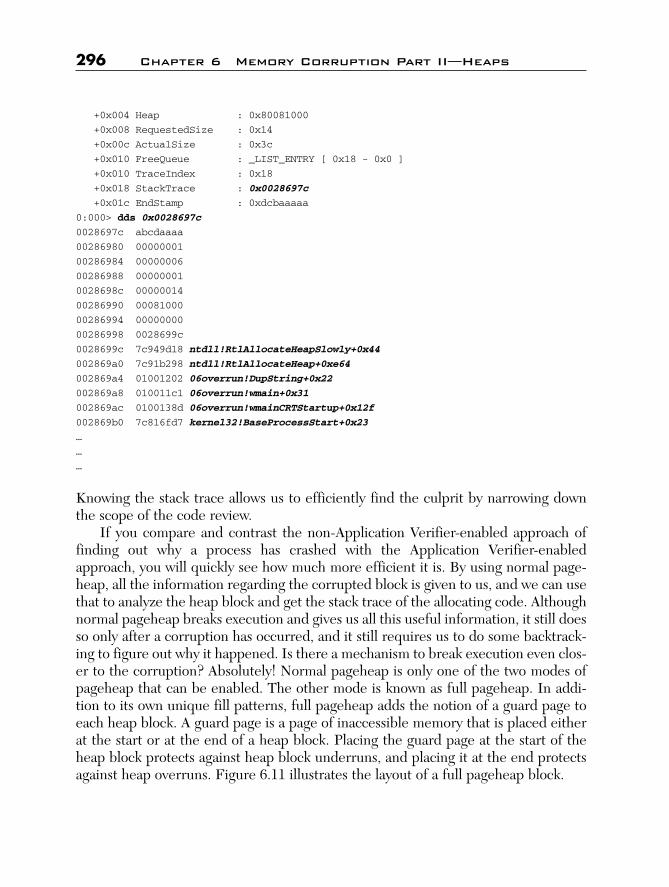
296 Chapter 6 Memory Corruption Part II—Heaps
+0x004 Heap : 0x80081000
+0x008 RequestedSize : 0x14
+0x00c ActualSize : 0x3c
+0x010 FreeQueue : _LIST_ENTRY [ 0x18 - 0x0 ]
+0x010 TraceIndex : 0x18
+0x018 StackTrace : 0x0028697c
+0x01c EndStamp : 0xdcbaaaaa
0:000> dds 0x0028697c
0028697c abcdaaaa
00286980 00000001
00286984 00000006
00286988 00000001
0028698c 00000014
00286990 00081000
00286994 00000000
00286998 0028699c
0028699c 7c949d18 ntdll!RtlAllocateHeapSlowly+0x44
002869a0 7c91b298 ntdll!RtlAllocateHeap+0xe64
002869a4 01001202 06overrun!DupString+0x22
002869a8 010011c1 06overrun!wmain+0x31
002869ac 0100138d 06overrun!wmainCRTStartup+0x12f
002869b0 7c816fd7 kernel32!BaseProcessStart+0x23
…
…
…
Knowing the stack trace allows us to efficiently find the culprit by narrowing downthe scope of the code review.
If you compare and contrast the non-Application Verifier-enabled approach offinding out why a process has crashed with the Application Verifier-enabledapproach, you will quickly see how much more efficient it is. By using normal page-heap, all the information regarding the corrupted block is given to us, and we can usethat to analyze the heap block and get the stack trace of the allocating code. Althoughnormal pageheap breaks execution and gives us all this useful information, it still doesso only after a corruption has occurred, and it still requires us to do some backtrack-ing to figure out why it happened. Is there a mechanism to break execution even clos-er to the corruption? Absolutely! Normal pageheap is only one of the two modes ofpageheap that can be enabled. The other mode is known as full pageheap. In addi-tion to its own unique fill patterns, full pageheap adds the notion of a guard page toeach heap block. A guard page is a page of inaccessible memory that is placed eitherat the start or at the end of a heap block. Placing the guard page at the start of theheap block protects against heap block underruns, and placing it at the end protectsagainst heap overruns. Figure 6.11 illustrates the layout of a full pageheap block.
08_0321374460_ch06.qxd 10/3/07 10:49 PM Page 296

297Heap Corruptions
Figure 6.11 Full page heap block layout
The inaccessible page is added to protect against heap block overruns or underruns.If a faulty piece of code writes to the inaccessible page, it causes an access violation,and execution breaks on the spot. This allows us to avoid any type of backtrackingstrategy to figure out the origins of the corruption.
Now we can once again run our sample application, this time with full pageheapenabled (see Appendix A), and see where the debugger breaks execution.
…
…
…
0:000> g
Press any key to start
(414.494): Access violation - code c0000005 (first chance)
First chance exceptions are reported before any exception handling.
6.M
EMO
RYCO
RRUPTION
PART
II—H
EAPS
Fillpattern:ABCDBBBB
32 bytes
Forward Overrun: Allocated Heap Block
PageheapMetadata
Fill pattern:DCBABBBB
User accessiblepart fill pattern:
C0
Suffix fillpattern:
D0D0D0D0
InaccessiblePage
Fillpattern:ABCDBBBA
32 bytes
Forward Overrun: Free Heap Block
PageheapMetadata
User accessiblepart fill pattern:
F0
User accessiblepart fill pattern:
F0
Suffix fillpattern:
D0D0D0D0
InaccessiblePage
Backward Overun
User accessiblepart fill pattern:
F0
Heap
Pageheap Metadata
Requestedsize
Actualsize
FreeQueue Trace Index StackTrace
InaccessiblePage
08_0321374460_ch06.qxd 10/3/07 10:49 PM Page 297
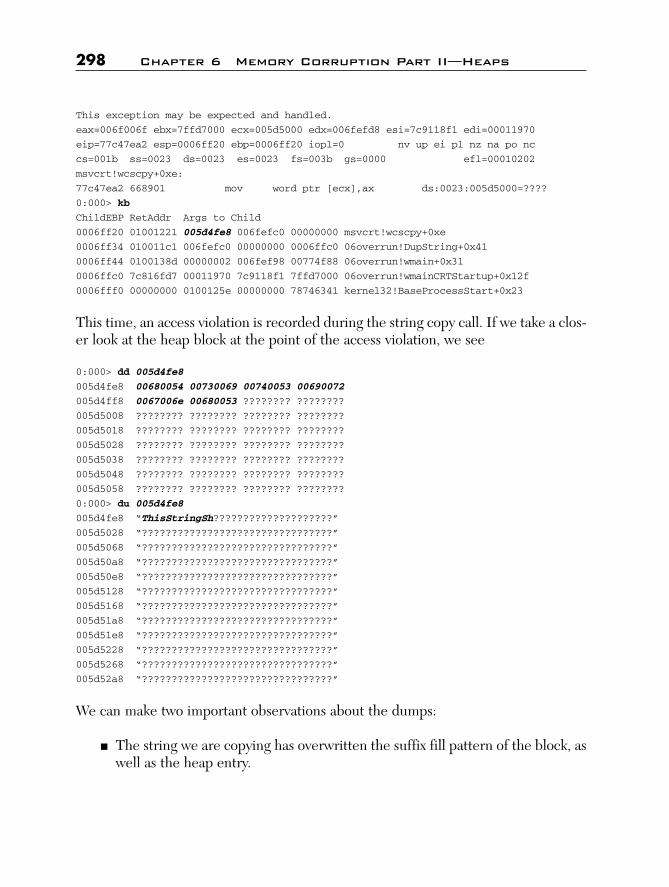
298 Chapter 6 Memory Corruption Part II—Heaps
This exception may be expected and handled.
eax=006f006f ebx=7ffd7000 ecx=005d5000 edx=006fefd8 esi=7c9118f1 edi=00011970
eip=77c47ea2 esp=0006ff20 ebp=0006ff20 iopl=0 nv up ei pl nz na po nc
cs=001b ss=0023 ds=0023 es=0023 fs=003b gs=0000 efl=00010202
msvcrt!wcscpy+0xe:
77c47ea2 668901 mov word ptr [ecx],ax ds:0023:005d5000=????
0:000> kb
ChildEBP RetAddr Args to Child
0006ff20 01001221 005d4fe8 006fefc0 00000000 msvcrt!wcscpy+0xe
0006ff34 010011c1 006fefc0 00000000 0006ffc0 06overrun!DupString+0x41
0006ff44 0100138d 00000002 006fef98 00774f88 06overrun!wmain+0x31
0006ffc0 7c816fd7 00011970 7c9118f1 7ffd7000 06overrun!wmainCRTStartup+0x12f
0006fff0 00000000 0100125e 00000000 78746341 kernel32!BaseProcessStart+0x23
This time, an access violation is recorded during the string copy call. If we take a clos-er look at the heap block at the point of the access violation, we see
0:000> dd 005d4fe8
005d4fe8 00680054 00730069 00740053 00690072
005d4ff8 0067006e 00680053 ???????? ????????
005d5008 ???????? ???????? ???????? ????????
005d5018 ???????? ???????? ???????? ????????
005d5028 ???????? ???????? ???????? ????????
005d5038 ???????? ???????? ???????? ????????
005d5048 ???????? ???????? ???????? ????????
005d5058 ???????? ???????? ???????? ????????
0:000> du 005d4fe8
005d4fe8 “ThisStringSh????????????????????”
005d5028 “????????????????????????????????”
005d5068 “????????????????????????????????”
005d50a8 “????????????????????????????????”
005d50e8 “????????????????????????????????”
005d5128 “????????????????????????????????”
005d5168 “????????????????????????????????”
005d51a8 “????????????????????????????????”
005d51e8 “????????????????????????????????”
005d5228 “????????????????????????????????”
005d5268 “????????????????????????????????”
005d52a8 “????????????????????????????????”
We can make two important observations about the dumps:
■ The string we are copying has overwritten the suffix fill pattern of the block, aswell as the heap entry.
08_0321374460_ch06.qxd 10/3/07 10:49 PM Page 298

299Heap Corruptions
■ At the point of the access violation, the string copied so far is ThisStringSh,which indicates that the string copy function is not yet done and is about towrite to the inaccessible page placed at the end of the heap block by ApplicationVerifier.
By enabling full pageheap, we were able to break execution when the corruptionoccurred rather than after. This can be a huge time-saver, as you have the offendingcode right in front of you when the corruption occurs, and finding out why the cor-ruption occurred just got a lot easier. One of the questions that might be goingthrough your mind is, “Why not always run with full pageheap enabled?” Well, fullpageheap is very resource intensive. Remember that full pageheap places one pageof inaccessible memory at the end (or beginning) of each allocation. If the process youare debugging is memory hungry, the usage of pageheap might increase the overallmemory consumption by an order of magnitude.
In addition to heap block overruns, we can experience the reciprocal: heapunderruns. Although not as common, heap underruns overwrite the part of the heapblock prior to the user-accessible part. This can be because of bad pointer arithmeticcausing a premature write to the heap block. Because normal pageheap protects thepageheap metadata by using fill patterns, it can trap heap underrun scenarios as well.Full pageheap, by default, places a guard page at the end of the heap block and willnot break on heap underruns. Fortunately, using the backward overrun option of fullpageheap (see Appendix A), we can tell it to place a guard page at the front of theallocation rather than at the end and trap the underrun class of problems as well.
The !heap extension command previously used to analyze heap state can also beused when the process is running under pageheap. By using the –p flag, we can tellthe !heap extension command that the heap in question is pageheap enabled. Theoptions available for the –p flag are
heap -p Dump all page heaps.
heap -p -h ADDR Detailed dump of page heap at ADDR.
heap -p -a ADDR Figure out what heap block is at ADDR.
heap -p -t [N] Dump N collected traces with heavy heap users.
heap -p -tc [N] Dump N traces sorted by count usage (eqv. with -t).
heap -p -ts [N] Dump N traces sorted by size.
heap -p -fi [N] Dump last N fault injection traces.
For example, the heap block returned from the HeapAlloc call in our sample appli-cation resembles the following when used with the –p and –a flags:
0:000> !heap -p -a 005d4fe8
address 005d4fe8 found in
6.M
EMO
RYCO
RRUPTION
PART
II—H
EAPS
08_0321374460_ch06.qxd 10/3/07 10:49 PM Page 299

300 Chapter 6 Memory Corruption Part II—Heaps
_DPH_HEAP_ROOT @ 81000
in busy allocation ( DPH_HEAP_BLOCK: UserAddr UserSize -
VirtAddr VirtSize)
8430c: 5d4fe8 14 -
5d4000 2000
7c91b298 ntdll!RtlAllocateHeap+0x00000e64
01001202 06overrun!DupString+0x00000022
010011c1 06overrun!wmain+0x00000031
0100138d 06overrun!wmainCRTStartup+0x0000012f
7c816fd7 kernel32!BaseProcessStart+0x00000023
The output shows us the recorded stack trace as well as other auxiliary information,such as which fill pattern is in use. The fill patterns can give us clues to the status ofthe heap block (allocated or freed). Another useful switch is the –t switch. The –tswitch allows us to dump out part of the stack trace database to get more informationabout all the stacks that have allocated memory. If you are debugging a process thatis using up a ton of memory and want to know which part of the process is responsi-ble for the biggest allocations, the heap –p –t command can be used.
Heap Handle MismatchesThe heap manager keeps a list of active heaps in a process. The heaps are consideredseparate entities in the sense that the internal per-heap state is only valid within thecontext of that particular heap. Developers working with the heap manager must takegreat care to respect this separation by ensuring that the correct heaps are used whenallocating and freeing heap memory. The separation is exposed to the developer byusing heap handles in the heap API calls. Each heap handle uniquely represents aparticular heap in the list of heaps for the process. An example of this is calling theGetProcessHeap API, which returns a unique handle to the default process.Another example is calling the HeapCreate API, which returns a unique handle tothe newly created heap.
If the uniqueness is broken, heap corruption will ensue. Listing 6.9 illustrates anapplication that breaks the uniqueness of heaps.
Listing 6.9 Example of heap handle mismatch
#include <windows.h>
#include <stdio.h>
#include <conio.h>
#define MAX_SMALL_BLOCK_SIZE 20000
HANDLE hSmallHeap=0;
08_0321374460_ch06.qxd 10/3/07 10:49 PM Page 300

301Heap Corruptions
HANDLE hLargeHeap=0;
VOID* AllocMem(ULONG ulSize);
VOID FreeMem(VOID* pMem, ULONG ulSize);
BOOL InitHeaps();
VOID FreeHeaps();
int __cdecl wmain (int argc, wchar_t* pArgs[])
{
printf(“Press any key to start\n”);
_getch();
if(InitHeaps())
{
BYTE* pBuffer1=(BYTE*) AllocMem(20);
BYTE* pBuffer2=(BYTE*) AllocMem(20000);
//
// Use allocated memory
//
FreeMem(pBuffer1, 20);
FreeMem(pBuffer2, 20000);
FreeHeaps();
}
printf(“Done...exiting application\n”);
return 0;
}
BOOL InitHeaps()
{
BOOL bRet=TRUE ;
hSmallHeap = GetProcessHeap();
hLargeHeap = HeapCreate(0, 0, 0);
if(!hLargeHeap)
{
bRet=FALSE;
}
return bRet;
}
VOID FreeHeaps()
{
6.M
EMO
RYCO
RRUPTION
PART
II—H
EAPS
(continues)
08_0321374460_ch06.qxd 10/3/07 10:49 PM Page 301

302 Chapter 6 Memory Corruption Part II—Heaps
if(hLargeHeap)
{
HeapDestroy(hLargeHeap);
hLargeHeap=NULL;
}
}
VOID* AllocMem(ULONG ulSize)
{
VOID* pAlloc = NULL ;
if(ulSize<MAX_SMALL_BLOCK_SIZE)
{
pAlloc=HeapAlloc(hSmallHeap, 0, ulSize);
}
else
{
pAlloc=HeapAlloc(hLargeHeap, 0, ulSize);
}
return pAlloc;
}
VOID FreeMem(VOID* pAlloc, ULONG ulSize)
{
if(ulSize<=MAX_SMALL_BLOCK_SIZE)
{
HeapFree(hSmallHeap, 0, pAlloc);
}
else
{
HeapFree(hLargeHeap, 0, pAlloc);
}
}
The source code and binary for Listing 6.9 can be found in the following folders:Source code: C:\AWD\Chapter6\MismatchBinary: C:\AWDBIN\WinXP.x86.chk\06Mismatch.exe
The application in Listing 6.9 seems pretty straightforward. The main functionrequests a couple of allocations using the AllocMem helper function. Once done withthe allocations, it calls the FreeMem helper API to free the memory. The allocation
Listing 6.9 Example of heap handle mismatch (continued)
08_0321374460_ch06.qxd 10/3/07 10:49 PM Page 302

303Heap Corruptions
helper APIs work with the memory from either the default process heap (if the allo-cation is below a certain size) or a private heap (created in the InitHeaps API) if thesize is larger than the threshold. If we run the application, we see that it successfullyfinishes execution:
C:\AWDBIN\WinXP.x86.chk\06Mismatch.exe
Press any key to start
Done...exiting application
We might be tempted to conclude that the application works as expected and sign offon it. However, before we do so, let’s use Application Verifier and enable full page-heap on the application and rerun it. This time, the application never finished. As amatter of fact, judging from the crash dialog that appears, it looks like we have acrash. In order to get some more information on the crash, we run the applicationunder the debugger:
…
…
…
0:000> g
Press any key to start
(118.3c8): Access violation - code c0000005 (first chance)
First chance exceptions are reported before any exception handling.
This exception may be expected and handled.
eax=0006fc54 ebx=00000000 ecx=0211b000 edx=0211b008 esi=021161e0 edi=021161e0
eip=7c96893a esp=0006fbec ebp=0006fc20 iopl=0 nv up ei ng nz ac po cy
cs=001b ss=0023 ds=0023 es=0023 fs=003b gs=0000 efl=00010293
ntdll!RtlpDphIsNormalHeapBlock+0x81:
7c96893a 8039a0 cmp byte ptr [ecx],0A0h ds:0023:0211b000=??
0:000> kb
ChildEBP RetAddr Args to Child
0006fc20 7c96ac47 00081000 021161e0 0006fc54 ntdll!RtlpDphIsNormalHeapBlock+0x81
0006fc44 7c96ae5a 00081000 01000002 00000007 ntdll!RtlpDphNormalHeapFree+0x1e
0006fc94 7c96defb 00080000 01000002 021161e0 ntdll!RtlpDebugPageHeapFree+0x79
0006fd08 7c94a5d0 00080000 01000002 021161e0 ntdll!RtlDebugFreeHeap+0x2c
0006fdf0 7c9268ad 00080000 01000002 021161e0 ntdll!RtlFreeHeapSlowly+0x37
0006fec0 003ab9eb 00080000 00000000 021161e0 ntdll!RtlFreeHeap+0xf9
0006ff18 010012cf 00080000 00000000 021161e0 vfbasics!AVrfpRtlFreeHeap+0x16b
0006ff2c 010011d3 021161e0 00004e20 021161e0 06mismatch!FreeMem+0x1f
0006ff44 01001416 00000001 02060fd8 020daf80 06mismatch!wmain+0x53
0006ffc0 7c816fd7 00011970 7c9118f1 7ffdc000 06mismatch!wmainCRTStartup+0x12f
0006fff0 00000000 010012e7 00000000 78746341 kernel32!BaseProcessStart+0x23
6.M
EMO
RYCO
RRUPTION
PART
II—H
EAPS
08_0321374460_ch06.qxd 10/3/07 10:49 PM Page 303

304 Chapter 6 Memory Corruption Part II—Heaps
From the stack trace, we can see that our application was trying to free a block ofmemory when the heap manager access violated. To find out which of the two mem-ory allocations we were freeing, we unassemble the 06mismatch!wmain functionand see which of the calls correlate to the address located at06mismatch!wmain+0x55.
0:000> u 06mismatch!wmain+0x53-10
06mismatch!wmain+0x43:
010011c3 0000 add byte ptr [eax],al
010011c5 68204e0000 push 4E20h
010011ca 8b4df8 mov ecx,dword ptr [ebp-8]
010011cd 51 push ecx
010011ce e8dd000000 call 06mismatch!FreeMem (010012b0)
010011d3 e858000000 call 06mismatch!FreeHeaps (01001230)
010011d8 688c100001 push offset 06mismatch!`string’ (0100108c)
010011dd ff1550100001 call dword ptr [06mismatch!_imp__printf (01001050)]
Since the call prior to 06mismatch!FreeHeaps is a FreeMem, we know that the lastFreeMem call in our code is causing the problem. We can now employ code review-ing to see if anything is wrong. From Listing 6.9, the FreeMem function frees memo-ry either on the default process heap or on a private heap. Furthermore, it looks likethe decision is dependent on the size of the block. If the block size is less than orequal to 20Kb, it uses the default process heap. Otherwise, the private heap is used.Our allocation was exactly 20Kb, which means that the FreeMem function attemptedto free the memory from the default process heap. Is this correct? One way to easilyfind out is dumping out the pageheap block metadata, which has a handle to the own-ing heap contained inside:
0:000> dt _DPH_BLOCK_INFORMATION 021161e0-0x20
+0x000 StartStamp : 0xabcdbbbb
+0x004 Heap : 0x02111000
+0x008 RequestedSize : 0x4e20
+0x00c ActualSize : 0x5000
+0x010 FreeQueue : _LIST_ENTRY [ 0x21 - 0x0 ]
+0x010 TraceIndex : 0x21
+0x018 StackTrace : 0x00287510
+0x01c EndStamp : 0xdcbabbbb
The owning heap for this heap block is 0x02111000. Next, we find out what thedefault process heap is:
0:000> x 06mismatch!hSmallHeap
01002008 06mismatch!hSmallHeap = 0x00080000
08_0321374460_ch06.qxd 10/3/07 10:49 PM Page 304
305Heap Corruptions
The two heaps do not match up, and we are faced with essentially freeing a block ofmemory owned by heap 0x02111000 on heap 0x00080000. This is also the reasonApplication Verifier broke execution, because a mismatch in heaps causes serious sta-bility issues. Armed with the knowledge of the reason for the stop, it should now bepretty straightforward to figure out why our application mismatched the two heaps.Because we are relying on size to determine which heaps to allocate and free the mem-ory on, we can quickly see that the AllocMem function uses the following conditional:
if(ulSize<MAX_SMALL_BLOCK_SIZE)
{
pAlloc=HeapAlloc(hSmallHeap, 0, ulSize);
}
while the FreeMem function uses:
if(ulSize<=MAX_SMALL_BLOCK_SIZE)
{
HeapFree(hSmallHeap, 0, pAlloc);
}
The allocating conditional checks that the allocation size is less than the threshold,whereas the freeing conditional checks that it is less than or equal. Hence, when free-ing an allocation of size 20Kb, incorrectly uses the default process heap.
In addition to being able to analyze and get to the bottom of heap mismatch prob-lems, another very important lesson can be learned from our exercise: Never assumethat the application works correctly just because no errors are reported during a nor-mal noninstrumented run. As you have already seen, heap corruption problems donot always surface during tests that are run without any type of debugging help. Onlywhen a debugger is attached and the application verifier is enabled do the problemssurface. The reason is simple. In a nondebugger, non–Application Verifier run, theheap corruption still occurs but might not have enough time to surface in the form ofan access violation. Say that the test runs through scenarios A, B, and C, and the heapcorruption occurs in scenario C. After the heap has been corrupted, the applicationexits without any sign of the heap corruption, and you are led to believe that every-thing is working correctly. Once the application ships and gets in the hands of the cus-tomer, they run the same scenarios, albeit in a different order: C, B, and A. The firstscenario ran C, immediately causing the heap corruption, but the application does notexit; rather, it continues running with scenario B and A, providing for a much largerwindow for the heap corruption to actually affect the application.
6.M
EMO
RYCO
RRUPTION
PART
II—H
EAPS
08_0321374460_ch06.qxd 10/3/07 10:49 PM Page 305

306 Chapter 6 Memory Corruption Part II—Heaps
Heap Reuse After DeletionNext to heap overruns, heap reuse after deletion is the second most common sourceof heap corruptions. As you have already seen, after a heap block has been freed, it isput on the free lists (or look aside list) by the heap manager. From there on, it is con-sidered invalid for use by the application. If an application uses the free block in anyway, shape, or form, the state of the block on the free list will most likely be corrupt-ed and the application will crash.
Before we take a look at some practical examples of heap reuse after free, let’s reviewthe deletion process. Figure 6.12 shows a hypothetical example of a heap segment.
Free Lists
Segment
0
1
2
3
…
127
Bx
Metadata Metadata B2User accessible part
B1User accessible
partRest of segmentMetadata Metadata
Figure 6.12 Hypothetical example of a heap segment
The segment consists of two busy blocks (B1 and B2) whose user-accessible part issurrounded by their associated metadata. Additionally, the free list contains one freeblock (Bx) of size 16. If the application frees block B1, the heap manager, first andforemost, checks to see if the block can be coalesced with any adjacent free blocks.Because there are no adjacent free blocks, the heap manager simply updates the sta-tus of the block (flags field of the metadata) to free and updates the correspondingfree list to include B1. It is critical to note that the free list consists of a forward link(FLINK) and a backward link (BLINK) that each points to the next and previous freeblock in the list. Are the FLINK and BLINK pointers part of a separately allocatedfree list node? Not quite—for efficiency reasons, when a block is freed, the structure
08_0321374460_ch06.qxd 10/3/07 10:49 PM Page 306

307Heap Corruptions
of the existing free block changes. More specifically, the user-accessible portion of theheap block is overwritten by the heap manager with the FLINK and BLINK point-ers, each pointing to the next and previous free block on the free list. In our hypo-thetical example in Figure 6.12, B1 is inserted at the beginning of the free listcorresponding to size 16. The user-accessible portion of B1 is replaced with a FLINKthat points to Bx and a BLINK that points to the start of the list (itself). The existingfree block Bx is also updated by the BLINK pointing to B1. Figure 6.13 illustrates theresulting layout after freeing block B1.
6.M
EMO
RYCO
RRUPTION
PART
II—H
EAPS
Free Lists
Segment
0
1
2
3
…
127
B1 Bx
B2User accessible part
FLINK=BxBLINK=B1
Rest of segmentMetadata Metadata Metadata Metadata
Figure 6.13 Heap segment and free lists after freeing B1
Next, when the application frees block B2, the heap manager finds an adjacent freeblock (B1) and coalesces both blocks into one large free block. As part of the coa-lescing process, the heap manager must remove block B1 from the free list since itno longer exists and add the new larger block to its corresponding free list. The result-ing large block’s user-accessible part now contains FLINK and BLINK pointers thatare updated according to the state of the free list.
So far, we have assumed that all heap blocks freed make their way to the back endallocator’s free lists. Although it’s true that some free blocks go directly to the free lists,some of the allocations may end up going to the front end allocator’s look aside list. Whena heap block goes into the look aside list, the primary differences can be seen in the heapblock metadata:
08_0321374460_ch06.qxd 10/3/07 10:49 PM Page 307
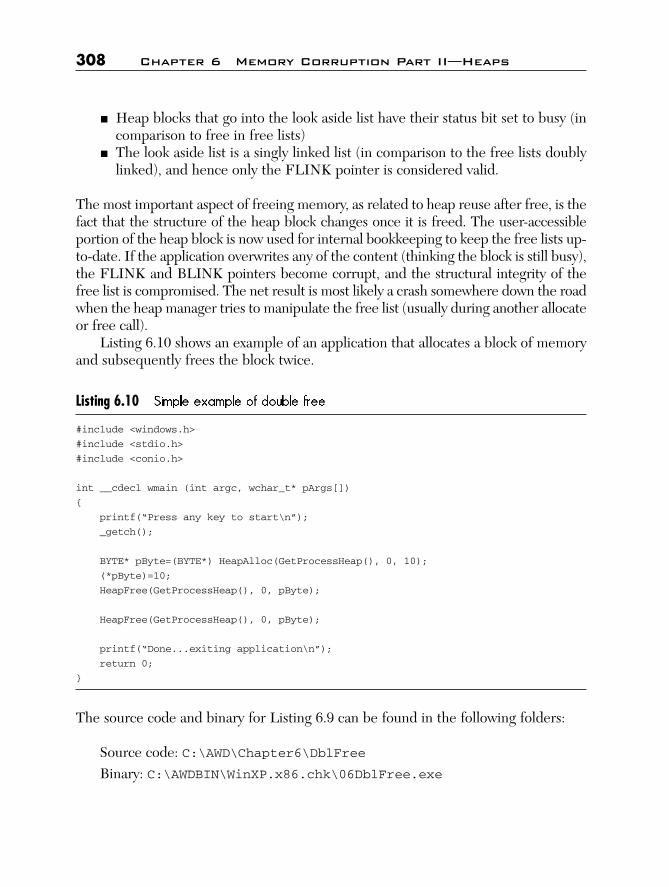
308 Chapter 6 Memory Corruption Part II—Heaps
■ Heap blocks that go into the look aside list have their status bit set to busy (incomparison to free in free lists)
■ The look aside list is a singly linked list (in comparison to the free lists doublylinked), and hence only the FLINK pointer is considered valid.
The most important aspect of freeing memory, as related to heap reuse after free, is thefact that the structure of the heap block changes once it is freed. The user-accessibleportion of the heap block is now used for internal bookkeeping to keep the free lists up-to-date. If the application overwrites any of the content (thinking the block is still busy),the FLINK and BLINK pointers become corrupt, and the structural integrity of thefree list is compromised. The net result is most likely a crash somewhere down the roadwhen the heap manager tries to manipulate the free list (usually during another allocateor free call).
Listing 6.10 shows an example of an application that allocates a block of memoryand subsequently frees the block twice.
Listing 6.10 Simple example of double free
#include <windows.h>
#include <stdio.h>
#include <conio.h>
int __cdecl wmain (int argc, wchar_t* pArgs[])
{
printf(“Press any key to start\n”);
_getch();
BYTE* pByte=(BYTE*) HeapAlloc(GetProcessHeap(), 0, 10);
(*pByte)=10;
HeapFree(GetProcessHeap(), 0, pByte);
HeapFree(GetProcessHeap(), 0, pByte);
printf(“Done...exiting application\n”);
return 0;
}
The source code and binary for Listing 6.9 can be found in the following folders:
Source code: C:\AWD\Chapter6\DblFreeBinary: C:\AWDBIN\WinXP.x86.chk\06DblFree.exe
08_0321374460_ch06.qxd 10/3/07 10:49 PM Page 308

309Heap Corruptions
Running the application yields no errors:
C:\AWDBIN\WinXP.x86.chk\06DblFree.exe
To make sure that nothing out of the ordinary is happening, let’s start the applicationunder the debugger and make our way to the first heap allocation.
…
…
…
0:001> u wmain
06dblfree!wmain:
01001180 55 push ebp
01001181 8bec mov ebp,esp
01001183 51 push ecx
01001184 68a8100001 push offset 06dblfree!`string’ (010010a8)
01001189 ff1548100001 call dword ptr [06dblfree!_imp__printf (01001048)]
0100118f 83c404 add esp,4
01001192 ff1550100001 call dword ptr [06dblfree!_imp___getch (01001050)]
01001198 6a0a push 0Ah
0:001> u
06dblfree!wmain+0x1a:
0100119a 6a00 push 0
0100119c ff1508100001 call dword ptr [06dblfree!_imp__GetProcessHeap
(01001008)]
010011a2 50 push eax
010011a3 ff1500100001 call dword ptr [06dblfree!_imp__HeapAlloc (01001000)]
010011a9 8945fc mov dword ptr [ebp-4],eax
010011ac 8b45fc mov eax,dword ptr [ebp-4]
010011af c6000a mov byte ptr [eax],0Ah
010011b2 8b4dfc mov ecx,dword ptr [ebp-4]
0:001> g 010011a9
eax=000830c0 ebx=7ffde000 ecx=7c9106eb edx=00080608 esi=01c7078e edi=83485b7a
eip=010011a9 esp=0006ff40 ebp=0006ff44 iopl=0 nv up ei pl zr na pe nc
cs=001b ss=0023 ds=0023 es=0023 fs=003b gs=0000 efl=00000246
06dblfree!wmain+0x29:
010011a9 8945fc mov dword ptr [ebp-4],eax
ss:0023:0006ff40={msvcrt!__winitenv (77c61a40)}
Register eax now contains the pointer to the newly allocated block of memory:
0:000> dt _HEAP_ENTRY 000830c0-0x8
+0x000 Size : 3
+0x002 PreviousSize : 3
+0x000 SubSegmentCode : 0x00030003
6.M
EMO
RYCO
RRUPTION
PART
II—H
EAPS
08_0321374460_ch06.qxd 10/3/07 10:49 PM Page 309

310 Chapter 6 Memory Corruption Part II—Heaps
+0x004 SmallTagIndex : 0x21 ‘!’
+0x005 Flags : 0x1 ‘’
+0x006 UnusedBytes : 0xe ‘’
+0x007 SegmentIndex : 0 ‘’
Nothing seems to be out of the ordinary—the size fields all seem reasonable, and theflags field indicates that the block is busy. Now, continue execution past the first callto HeapFree and dump out the same heap block.
0:000> dt _HEAP_ENTRY 000830c0-0x8
+0x000 Size : 3
+0x002 PreviousSize : 3
+0x000 SubSegmentCode : 0x00030003
+0x004 SmallTagIndex : 0x21 ‘!’
+0x005 Flags : 0x1 ‘’
+0x006 UnusedBytes : 0xe ‘’
+0x007 SegmentIndex : 0 ‘’
Even after freeing the block, the metadata looks identical. The flags field even has itsbusy bit still set, indicating that the block is not freed. The key here is to rememberthat when a heap block is freed, it can go to one of two places: look aside list or freelists. When a heap block goes on the look aside list, the heap block status is kept asbusy. On the free lists, however, the status is set to free.
In our particular free operation, the block seems to have gone on the look asidelist. When a block goes onto the look aside list, the first part of the user-accessible por-tion of the block gets overwritten with the FLINK pointer that points to the next avail-able block on the look aside list. The user-accessible portion of our block resembles
0:000> dd 000830c0
000830c0 00000000 00080178 00000000 00000000
000830d0 000301e6 00001000 00080178 00080178
000830e0 00000000 00000000 00000000 00000000
000830f0 00000000 00000000 00000000 00000000
00083100 00000000 00000000 00000000 00000000
00083110 00000000 00000000 00000000 00000000
00083120 00000000 00000000 00000000 00000000
00083130 00000000 00000000 00000000 00000000
As you can see, the FLINK pointer in our case is NULL, which means that this is thefirst free heap block. Next, continue execution until right after the second call toHeapFree (of the same block). Once again, we take a look at the state of the heapblock:
08_0321374460_ch06.qxd 10/3/07 10:49 PM Page 310

311Heap Corruptions
0:000> dt _HEAP_ENTRY 000830c0-0x8
+0x000 Size : 3
+0x002 PreviousSize : 3
+0x000 SubSegmentCode : 0x00030003
+0x004 SmallTagIndex : 0x21 ‘!’
+0x005 Flags : 0x1 ‘’
+0x006 UnusedBytes : 0xe ‘’
+0x007 SegmentIndex : 0 ‘’
Nothing in the metadata seems to have changed. Block is still busy, and the size fieldsseem to be unchanged. Let’s dump out the user-accessible portion and take a look atthe FLINK pointer:
0:000> dd 000830c0
000830c0 000830c0 00080178 00000000 00000000
000830d0 000301e6 00001000 00080178 00080178
000830e0 00000000 00000000 00000000 00000000
000830f0 00000000 00000000 00000000 00000000
00083100 00000000 00000000 00000000 00000000
00083110 00000000 00000000 00000000 00000000
00083120 00000000 00000000 00000000 00000000
00083130 00000000 00000000 00000000 00000000
This time, FLINK points to another free heap block, with the user-accessible portionstarting at location 000830c0. The block corresponding to location 000830c0 is thesame block that we freed the first time. By double freeing, we have essentially man-aged to put the look aside list into a circular reference. The consequence of doing socan cause the heap manager to go into an infinite loop when subsequent heap oper-ations force the heap manager to walk the free list with the circular reference.
At this point, if we resume execution, we notice that the application finishes exe-cution. Why did it finish without failing in the heap code? For the look aside list cir-cular reference to be exposed, another call has to be made to the heap manager thatwould cause it to walk the list and hit the circular link. Our application was finishedafter the second HeapFree call, and the heap manager never got a chance to fail.Even though the failure did not surface in the few runs we did, it is still a heap cor-ruption, and it should be fixed. Corruption of a heap block on the look aside list (orthe free lists) can cause serious problems for an application. Much like the previoustypes of heap corruptions, double freeing problems typically surface in the form ofpost corruption crashes when the heap manager needs to walk the look aside list (orfree list). Is there a way to use Application Verifier in this case, as well to trap theproblem as it is occurring? The same heaps test setting used throughout the chapteralso makes a best attempt at catching double free problems. By tagging the heap
6.M
EMO
RYCO
RRUPTION
PART
II—H
EAPS
08_0321374460_ch06.qxd 10/3/07 10:49 PM Page 311

312 Chapter 6 Memory Corruption Part II—Heaps
blocks in a specific way, Application Verifier is able to catch double freeing problemsas they occur and break execution, allowing the developer to take a closer look at thecode that is trying to free the block the second time. Let’s enable full pageheap onour application and rerun it under the debugger. Right away, you will see a firstchance access violation occur with the following stack trace:
0:000> kb
ChildEBP RetAddr Args to Child
0007fcc4 7c96ac47 00091000 005e4ff0 0007fcf8 ntdll!RtlpDphIsNormalHeapBlock+0x1c
0007fce8 7c96ae5a 00091000 01000002 00000000 ntdll!RtlpDphNormalHeapFree+0x1e
0007fd38 7c96defb 00090000 01000002 005e4ff0 ntdll!RtlpDebugPageHeapFree+0x79
0007fdac 7c94a5d0 00090000 01000002 005e4ff0 ntdll!RtlDebugFreeHeap+0x2c
0007fe94 7c9268ad 00090000 01000002 005e4ff0 ntdll!RtlFreeHeapSlowly+0x37
0007ff64 0100128a 00090000 00000000 005e4ff0 ntdll!RtlFreeHeap+0xf9
0007ff7c 01001406 00000001 0070cfd8 0079ef68 06DblFree!wmain+0x5a
0007ffc0 7c816fd7 00011970 7c9118f1 7ffd7000 06DblFree!__wmainCRTStartup+0x102
0007fff0 00000000 01001544 00000000 78746341 kernel32!BaseProcessStart+0x23
Judging from the stack, we can see that our wmain function is making its second callto HeapFree, which ends up access violating deep down in the heap manager code.Anytime you have this test setting turned on and experience a crash during aHeapFree call, the first thing you should check is whether a heap block is being freedtwice. Because a heap block can go on the look aside list when freed (its state mightstill be set to busy even though it’s considered free from a heap manager’s perspec-tive), the best way to figure out if it’s really free is to use the !heap –p –a <heapblock> command. Remember that this command dumps out detailed informationabout a page heap block, including the stack trace of the allocating or freeing code.Find the address of the heap block that we are freeing twice (as per preceding stacktrace), and run the !heap extension command on it:
0:000> !heap -p -a 005d4ff0
address 005d4ff0 found in
_DPH_HEAP_ROOT @ 81000
in free-ed allocation ( DPH_HEAP_BLOCK: VirtAddr VirtSize)
8430c: 5d4000 2000
7c9268ad ntdll!RtlFreeHeap+0x000000f9
010011c5 06dblfree!wmain+0x00000045
0100131b 06dblfree!wmainCRTStartup+0x0000012f
7c816fd7 kernel32!BaseProcessStart+0x00000023
As you can see from the output, the heap block status is free. Additionally, the stackshows us the last operation performed on the heap block, which is the first free callmade. The stack trace shown corresponds nicely to our first call to HeapFree in the
08_0321374460_ch06.qxd 10/3/07 10:49 PM Page 312
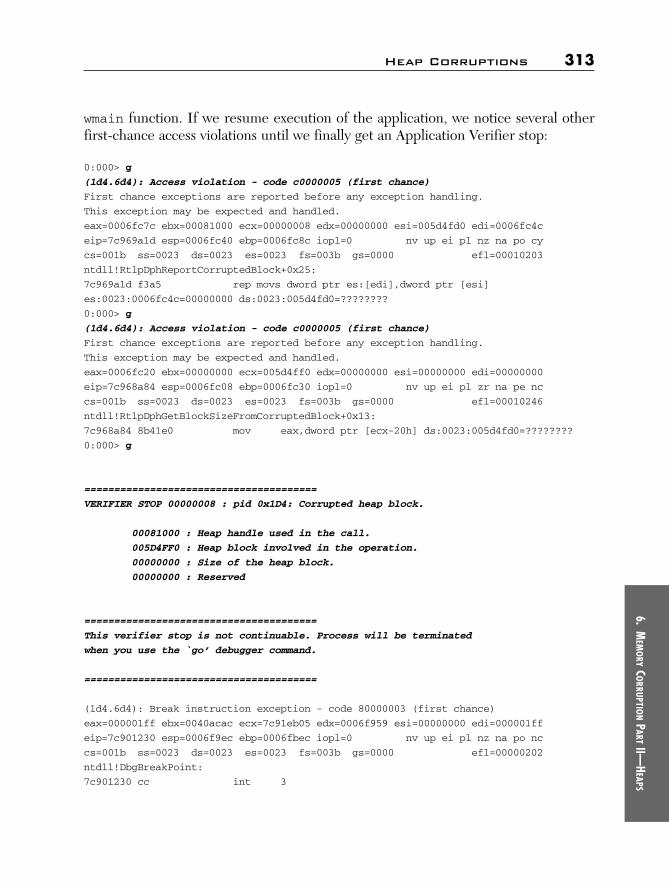
313Heap Corruptions
wmain function. If we resume execution of the application, we notice several otherfirst-chance access violations until we finally get an Application Verifier stop:
0:000> g
(1d4.6d4): Access violation - code c0000005 (first chance)
First chance exceptions are reported before any exception handling.
This exception may be expected and handled.
eax=0006fc7c ebx=00081000 ecx=00000008 edx=00000000 esi=005d4fd0 edi=0006fc4c
eip=7c969a1d esp=0006fc40 ebp=0006fc8c iopl=0 nv up ei pl nz na po cy
cs=001b ss=0023 ds=0023 es=0023 fs=003b gs=0000 efl=00010203
ntdll!RtlpDphReportCorruptedBlock+0x25:
7c969a1d f3a5 rep movs dword ptr es:[edi],dword ptr [esi]
es:0023:0006fc4c=00000000 ds:0023:005d4fd0=????????
0:000> g
(1d4.6d4): Access violation - code c0000005 (first chance)
First chance exceptions are reported before any exception handling.
This exception may be expected and handled.
eax=0006fc20 ebx=00000000 ecx=005d4ff0 edx=00000000 esi=00000000 edi=00000000
eip=7c968a84 esp=0006fc08 ebp=0006fc30 iopl=0 nv up ei pl zr na pe nc
cs=001b ss=0023 ds=0023 es=0023 fs=003b gs=0000 efl=00010246
ntdll!RtlpDphGetBlockSizeFromCorruptedBlock+0x13:
7c968a84 8b41e0 mov eax,dword ptr [ecx-20h] ds:0023:005d4fd0=????????
0:000> g
=======================================
VERIFIER STOP 00000008 : pid 0x1D4: Corrupted heap block.
00081000 : Heap handle used in the call.
005D4FF0 : Heap block involved in the operation.
00000000 : Size of the heap block.
00000000 : Reserved
=======================================
This verifier stop is not continuable. Process will be terminated
when you use the `go’ debugger command.
=======================================
(1d4.6d4): Break instruction exception - code 80000003 (first chance)
eax=000001ff ebx=0040acac ecx=7c91eb05 edx=0006f959 esi=00000000 edi=000001ff
eip=7c901230 esp=0006f9ec ebp=0006fbec iopl=0 nv up ei pl nz na po nc
cs=001b ss=0023 ds=0023 es=0023 fs=003b gs=0000 efl=00000202
ntdll!DbgBreakPoint:
7c901230 cc int 3
6.M
EMO
RYCO
RRUPTION
PART
II—H
EAPS
08_0321374460_ch06.qxd 10/3/07 10:49 PM Page 313
314 Chapter 6 Memory Corruption Part II—Heaps
The last-chance Application Verifier stop shown gives some basic information aboutthe corrupted heap block. If you resume execution at this point, the application willsimply terminate because this is a nonrecoverable stop.
This concludes our discussion of the problems associated with double freeingmemory. As you have seen, the best tool for catching double freeing problems is touse the heaps test setting (full pageheap) available in Application Verifier. Not onlydoes it report the problem at hand, but it also manages to break execution at the pointwhere the problem really occurred rather than at a post corruption stage, making itmuch easier to figure out why the heap block was being corrupted. Using full page-heap gives you the strongest possible protection level available for memory-relatedproblems in general. The means by which full pageheap is capable of giving you thisprotection is by separating the heap block metadata from the heap block itself. In anonfull pageheap scenario, the metadata associated with a heap block is part of theheap block itself. If an application is off by a few bytes, it can very easily overwrite themetadata, corrupting the heap block and making it difficult for the heap manager toimmediately report the problem. In contrast, using full pageheap, the metadata iskept in a secondary data structure with a one-way link to the real heap block. By usinga one-way link, it is nearly impossible for faulty code to corrupt the heap block meta-data, and, as such, full pageheap can almost always be trusted to contain intact infor-mation. The separation of metadata from the actual heap block is what gives fullpageheap the capability to provide strong heap corruption detection.
Summary
Heap corruption is a serious error that can wreak havoc on your application. A single,off-by-one byte corruption can cause your application to exhibit all sorts of oddbehaviors. The application might crash, it might have unpredictable behavior, or itmight even go into infinite loops. To make things worse, the net result of a heap cor-ruption typically does not surface until after the corruption has occurred, making itextremely difficult to figure out the source of the heap corruption. To efficiently trackdown heap corruptions, you need a solid understanding of the internals of the heapmanager. The first part of the chapter discussed the low-level details of how the heapmanager works. We took a look at how a heap block travels through the various lay-ers of the heap manager and how the status and block structure changes as it goesfrom being allocated to freed. We also took a look at some of the most common formsof heap corruptions (unitialized state, heap over- and underruns, mismatched heaphandles, and heap reuse after deletion) and how to manually analyze the heap at thepoint of a crash to figure out the source of the corruption. Additionally, we discussed
08_0321374460_ch06.qxd 10/3/07 10:49 PM Page 314

315Summary
how Application Verifier (pageheap) can be used to break execution closer to thesource of the corruption, making it much easier to figure out the culprit. As some ofthe examples in this chapter show, heap corruptions might go undetected while soft-ware is being tested, only to surface on the customer’s computer when run in a dif-ferent environment and under different conditions. Making use of ApplicationVerifier (pageheap) at all times is a prerequisite to ensuring that heap corruptions aredetected before shipping software and avoiding costly problems on the customer site.
6.M
EMO
RYCO
RRUPTION
PART
II—H
EAPS
08_0321374460_ch06.qxd 10/3/07 10:49 PM Page 315

08_0321374460_ch06.qxd 10/3/07 10:49 PM Page 316
Related Documents