CHAPTER 6 INTERFACE FRICTION CHARACTERISTICS OF COIR GEOTEXTILES 6.1 INTRODUCTION Reinforcement is one of the most important functions of geotextiles in mechanically improving the soil properties, whether it is used in slopes, embankmcnts, retaining walls, or pavements. Reinforcement achieves this mechanii,:al improvement by withstanding tensile axial force and thereby enhancing the shearing resistance of the soil. The reinforcement acts efficiently when it is Oliented in the direction in which tensile strain develops in the deforming soil. The benefit of reinforcement is derived from the tangential and normal components of the tensile reinforcement force acting on the shear surface. When reinforcement is placed in soil it can develop bond through frictional contact between the soil particles and the planar surface areas of the reinforcement, and from bearing stresses and transverse stresses, which exist in grids or ribbed strips. Defonnation in the soil mobilises tensile OT comprcssive force in the reinforcement depending on the inclination of the latter and is ultimately limited by the available bond between soil and reinforcement. The stiffness properties of the reinforcement also influence the soil shear deformation of the composite material, which is required to mobilise the reinforcement force. Hence the shear frictional behaviour of soil - geotextile interfaces plays a pivotal role in the overall perfOlmance of geotextile reinforced constructions.

Welcome message from author
This document is posted to help you gain knowledge. Please leave a comment to let me know what you think about it! Share it to your friends and learn new things together.
Transcript

CHAPTER 6
INTERFACE FRICTION CHARACTERISTICS OF COIR GEOTEXTILES
6.1 INTRODUCTION
Reinforcement is one of the most important functions of geotextiles in mechanically
improving the soil properties, whether it is used in slopes, embankmcnts, retaining
walls, or pavements. Reinforcement achieves this mechanii,:al improvement by
withstanding tensile axial force and thereby enhancing the shearing resistance of the
soil. The reinforcement acts efficiently when it is Oliented in the direction in which
tensile strain develops in the deforming soil. The benefit of reinforcement is derived
from the tangential and normal components of the tensile reinforcement force acting
on the shear surface.
When reinforcement is placed in soil it can develop bond through frictional contact
between the soil particles and the planar surface areas of the reinforcement, and from
bearing stresses and transverse stresses, which exist in grids or ribbed strips.
Defonnation in the soil mobilises tensile OT comprcssive force in the reinforcement
depending on the inclination of the latter and is ultimately limited by the available
bond between soil and reinforcement. The stiffness properties of the reinforcement
also influence the soil shear deformation of the composite material, which is required
to mobilise the reinforcement force. Hence the shear frictional behaviour of soil -
geotextile interfaces plays a pivotal role in the overall perfOlmance of geotextile
reinforced constructions.

The interfacial friction depends upon a large number of parameters such as pressure,
grain size and shape, surface roughness of gcotextilc, etc .. The frictional resistance
mobilised between the soil and the reinforcement has a significant role while
analysing the internal and an external stability of the mechanically stabilised earth
structures. Hence the properties of the interaction between soil and reinforcement
such as coefficient of friction must be detennined as an indispensable factor along
with the individual properties of the soil and reinforcement, in order to arrive at the
load conditions on the geotextile and for the detennination of design factors such as
spacing and extent of reinforcement.
There are two limiting modes of interaction viz., direct sliding, in which a block of
soil slides over a layer of reinforcement, and pull 0111, in which a layer of
reinforcement pulls out from the soil once its maximum available bond stress is
overcome. Modified direct shear tests are suitable ft)r measuring the coefficient of
direct sliding between soil and any type of reinforcement materials and pull out tests
to model the development of bond stresses. It is reported that the results of the pull
out test are difficult to interpret and can be greatly intluenced by the conditions in the
test, even though special apparatus is used for modeling (Palmeira and Milligan,
1989). For design, it is usually sufficient to calculate the bond coefficient from the
theoretical analysis (Jewell, 1996). Hence in this present study it is limited only to
direct sliding tests.
Five series of modified direct shear tests on the soil - coir gcotextile interfaces were
conducted under monotonic loading. The purposes of the tests were to examine the
behaviour of interfaces between the four types of soil and three types of coir
geotextiles under different test conditions. The results would provide a better
61

understanding of the shear frictional mechanism of soil coir geotextile interface to use
in the design of unpaved roads and embankments utilising coir geotextiles. Details of
the testing programme, test results and discussions of the test results are presented in
this chapter.
6.2 TEST DESCRIPTION
The direct shear test apparatus consisted of 60mm x 60mm x 40mm deep box which
can be split horizontally at mid height with displacement controlled loading system.
The rate of shear displacement was 0.02mm Isecond. The constant normal stress was
applied by dead load.
The size of the direct shear box in this study was relatively small. The boundary
effects could affect the test results to some degree. However test results with the
60mm square direct shear box were expected to have insignificant boundary effects
for two reasons. First, the dimensions of the direct shear box were approximately
hundred times the mean grain size of the soil specimen. This was in the range
recommended by ASTM 03080 and by other researchers (Jcwell and Wroth, 1987;
Palmeira, 1988). Second, it was confirmed by O'Rourke et a1. (1990) that when the
60mm square direct shear apparatus was used for Ottawa sand and High Density Poly
Ethylene (HDPE) to find the interface friction, it gave results similar to those obtained
from large size direct shear apparatus.
In order to determine the interfacial friction, several modifications have been made by
different researchers (Subba Rao et aI., 1996). Basically two types of arrangements
have been tried. The solid material can be placed over prepared soil bed (type A mode
of shear) or the soil can be prepared over the solid material (type B mode of shear).
62

Schematic diagram of type A and type B modes of shear is shown in Fig 6.1 . It is
reported that type B apparatus has the advantage of yielding fiiction angle values
applicable to both type A and type B situations (Subba Rao et aI., 1998). In the
present investigation type B apparatus was used. Fig 6.2 shows the schematic diagram
for the test set - up for the present study. The range of nonnal stress applied was 25
kN/m'to 125 kN/m'.
Load
(a) Type A (b) Type B
Fig. 6.1 Type A and Type B modes or shear
Nomlal lo.1d
Sleel Ball
SecdODal view
/ Loading pad
Shear Pin
Up"" """ 01 shear box --
U - ann
Grid plale
Lifting lUll
Front view
Fig. 6.2 Schematic diagram for test set - up
63
Shear force

6.3 SPECIMEN PREPARATION AND TEST PROCEDURE
Wooden blocks were cut to size so as to fit into (he bottom half of the direct shear
box. eair geotextiles cut into 60mmx 60nun sizes were glued in the lOp surface of the
rigid wooden block (Fig. 6.3). The rigid wooden block with ecir geotextile was fitted
inside the lower half of the direct shear box. The upper part of the shear box was
placed over the lower pan and pins were placed at the corners to keep the two pans
intact. Calculated quantity of soil was placed in the upper pan of the shear box and
tampings were given to get the required density. The test procedure laid in IS: SP: 36
- Pan 1(1987) was adopted for the entire series of experiments. Great care was taken
to maintain the density . Fresh soil samples and geotextiles were used for each test.
Normal stresses of 25 kPa. 50 kPa 75 kPa. 100 kPa and 125kPa were applied and the
corresponding shear load at failure was noted from which peak shear stresses were
obtained. Shear stress versus normal stress graphs were plotted to get the peak angle
of internal friction.
Fig 6.3 Coir geotextile test specimens for interfacial friction measurement
6.4 TEST PROGRAMMES
Five series of ex.periments were done using three types of soil (sand. rock dust. and
red earth) and three types of eoir geotextiles (woven - H2M6 and H2M8 and Non -
woven). 68 sets of experiments were done in different combinations 10 get frictional
64

characteristics of different interfaces. Interface friction characteristics of sand and
rock dust in natural and in different graded states were studied in addition to the red
soil. The effect of water content was studied in red soil and in all other cases the
material was kept in dry state. Test programmes for th~ direct shear test are presented
in Table 6.1.
Table 6.1 Details of test series
Series Type of Subgrade soil Type of GeotextiIe Unit weight!
Water content
I Sand (Soil - 4) Nil, H2M6, H2M8 15kN/m3
and Non - woven 16kN/m3
. 1 7kN/ffi"~
i-n Graded sand (2mm to 4.75mm) I
Graded sand (1 mm to 2mm) Nil, H2M6, H2M8 16kN/m3
and Non - woven
Graded sand (lmm to 425 microns)
IIJ Rock dust (Soil - 5) Nil, H2M6, H2M8 15.1kN/m3
and Non - woven 16.5kN/m3
17.6kN/m3
IV Graded rock dust (2mm to 4.75mm)
Nil, H2M6, H2M8
Graded rock dust (1 mm to 2mm) and Non - woven 16.5kN/m3
I Graded rock dust I (lmm to 425 microns) I
V Red soil (Soil - 1) I Nil, H2M6, H2M8 '~5.() k;-~-1 and Non - woven I 10%, 15% and
20%
65

6.5 RESULTS AND DISCUSSION
The results of the direct shear tests conducted are presented and discussed in the
following sessions. The relationship between peak shear stress and nonnal stress was
plotted for different soil and coir geotextile interfaces. Failure state was defined as the
peak shear stress. Values of direct sliding coefficient (C,J were calculated as:
--------------------(6.1)
where, Rds = Maximum shear resistance in kN/m,
L := Stationary length of geosynthetic in m,
(j N = Effective nonnal stress in kN/m2, and
t/J := Effective soil friction angle in degrees.
The values of interface friction angles (8) obtained for different series of experiments
are summarised in Table 6.2 in order to have a quantitativ~ analysis.
6.5.1 Shear Stress - Normal Stress Relationship
The shearing characteristics of different materials used in unpaved roads and
embankments show vast variations. Hence it is required to understand the shear
behaviour when coir geotextiles have to perfonn in conjunction with different
materials during and after the construction. Fig.6.4 shows the failure envelopes
obtained by plotting peak shear stresses and normal stresses for typical cases.
Analysing the similar plots it can be observed that the introduction of geotextile
increases the shear resistance invariably in all cases studied. [t could also be seen that
66

the maximum shear strength by way of interfacial frictilln is developed with soil
having larger particle size at high density, even though the normal stress - shear stress
relation was identical for all the cases of soil - coir geotextilc interfaces studied.
Table 6.2 Summary of interface friction angles
Test Angle of Interface Friction angle (li)
Series Description internal (degrees)
friction (<D) No.
(degrees) H2M6 H2M8 NW
1 Sand @15.0 kN/m3 36.98 38.79 41.26 43.35 "
2 Sand @16.0 kN/m3 41.00 43.63 44.65 47.12
3 Sand @17.0 kN/m 3 44.94 I 46.88 I 50.02 52.32 -,
I I 4 Graded sand 4.75 -2mm
45.19 47.46 49.50 52.45 @16.0kN/m3
5 Graded sand 2mm - 1 mm,
44.97 46.85 48.47 49.43 @ 16.0kN/m3
6 Graded sand 1 mm -0.425mm,
39.63 44.90 46.33 46.97 @ 16.0kN/m3
7 Rock dust @15.1kN/m3 39.63 40.56 41.48 44.17
8 Rock dust @ 16.5kN/m3 43.69 43.80 46.33 50.00
9 Rock dust @ 17.5kN/m3 46.72 47.77 50.39 52.98
10 Graded rock dust >4.75mm,
57.28 57.92 59.26 59.48 @16.5kN/m3
11 Graded rock dust, 4.75 - 2mm,
54.90 55.98 56.86 57.23 @16.5kN/m3
12 Graded rock dust, 2mm - Imm,
50.02 51.23 52.07 53.08 @16.5kN/m3
i i 13
Graded rock dust, 1 - 0.425mm, 46.82 ! 47.68
I 50.18 50.05
@16.5kN/m3 I I
Graded rock dust, <0.425mm, ,
I 14 @16.5kNim3 42.52 42.63 43.84 45.00
15 Red soil @15.0kN/mJ
42.49 44.31 47.91 49.21 w/c =10%
16 Red soil @15.0kN/m
j
41.98 42.36 39.05 43.48 wlc = 15%
17 Red soil @15.0kN/m .l
30.95 34.47 38.18 38.77 w/c= 20%
67

180 r--===-c-, o sand only I
160 c with H2~
- 140 6 with H2M6 : ;1 20 ~ o withNW
• ! 100 ;;;
I 80
i 60
: 40
20
o o 50 100
Normal stre ss (kPa)
(a) Sand at 16.0 kN/ mJ
180 c:C'::::=. i 0 rock dus-t only 160 ~ 0 With H2t.e
to with H2M6 . 140 - o withNW
~ -; 120 1 ! 100 1/)
- 80 j
L0 1 " I 40
20
o o 50 100
Normalltre_(kPa)
150
150
(c) Rock dust at 16.5 kN/mJ
180
160 o graded sand Of"Ity 0
o withH2MJ
~ 140 t::. with H2rv'6 .... o with NW -; 120 e
~ ': 1 2 e 60 " i 40
20
o o 50 100
Normal stress (kPa)
150
(b) Graded sand (4.7Smm to 2mm size)
at 16.0kN/mJ
180 . 160 ~ 0 red soi 0fVj
C with H2~
ca 140 0. to wiltl H2M3
" ~120 e ~ 100 VI -80 m .c w 60 ' " e 40 , ~ 0.
20
0 0 50 100 150
Normal Sire. (kPa)
(d) Red soil at 10% water content
at lS.OkN/mJ
Fig. 6.4 Variation of peak shear stress with normal stress Cor eoir geotextile interface
68
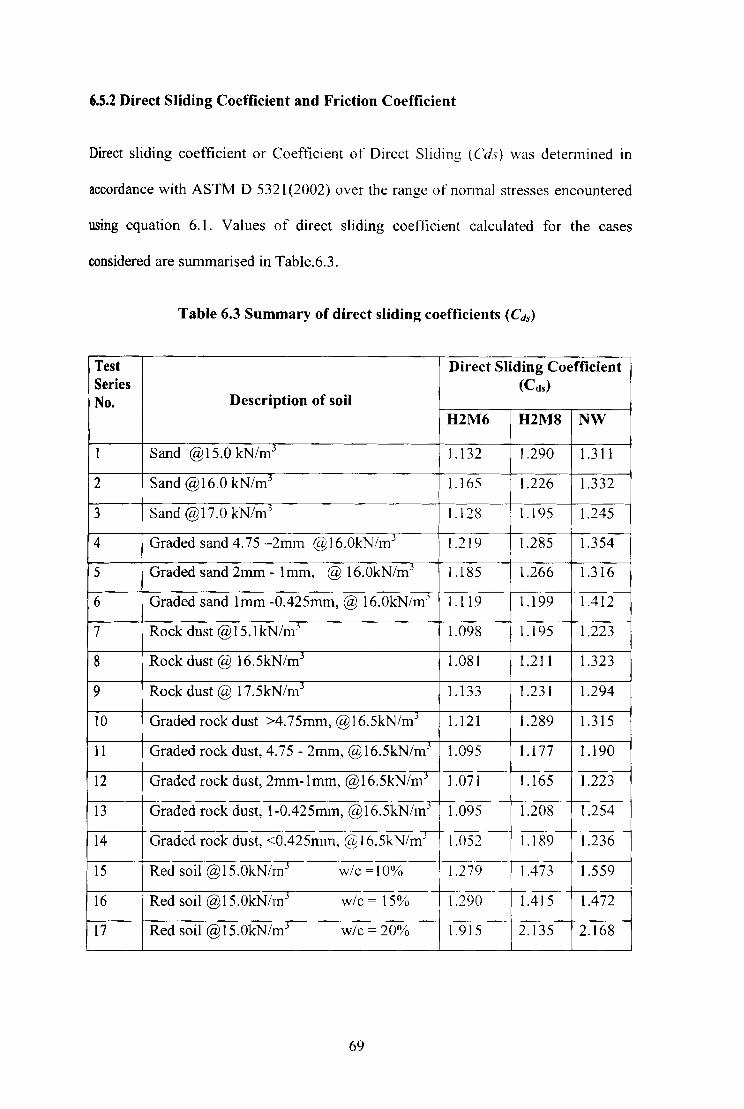
6.5.2 Direct Sliding Coefficient and Friction Coefficient
Direct sliding coefficient or Coefficient of Direct Sliding (Cds) was detcnnined in
accordance with ASTM D 5321 (2002) over the range of nonnal stresses encountered
using equation 6.1. Values of direct sliding coefficient calculated for the cases
considered are summarised in Table.6.3.
Table 6.3 Summary of direct sliding coefficients (Cds)
Test Direct Sliding Coefficient Series (Cds)
No. Description of soil H2M6 H2M8 NW
I Sand @15.0 kN/mj 1.132 1.290 1.311
2 Sand @16.0 kN/mJ 1.165 1.226 1.332
3 Sand @17.0kN/m-' 11.128 -- 1.195 1.245
4 Graded sand 4.75 -2mm @16.0kN/mj 1.219 1.285 1.354
5 Graded sand 2mm - 1 mm, @ 16.0kN/mJ 1.185 1.266 1.316
6 Graded sand 1 mm -0.425mm, @ 16.0kN/m-' 1.119 1.199 lA12
7 Rock dust @15.1kN/mj 1.098 1.195 1.223
8 Rock dust @ 16.5kN/mJ 1.081 1.211 1.323
9 Rock dust @ 17.5kN/mJ 1.133 1.231 1.294
to Graded rock dust >4.75mm, @16.5kN/mJ 1.121 1.289 1.315
11 Graded rock dust, 4.75 - 2mm, @16.5kN/mj 1.095 1.177 1.190
12 Graded rock dust, 2mm-lmm, @16.5kN/mJ 1.071 1.165 1.223
13 Graded rock dust, 1-OA25mm, @ 16.5kN/m3 1.095 1.208 1.254
14 Graded rock dust, <OA25mm, @16.5kN/m-' , I.OS2 1.189 1.236 I
15 Red soil @15.0kN/m3 w/e =10% h279 I . /IA73 1.559
16 Red soil @15.0kN/m J w/e = 15% ! 1:290 IA15 1.472 I
17 Red soil @15.0kN/m3 w/e = 20% 1.915 2.135 2.168
69

Based on the specification for geosynthetic used as soil reinforcemcnt in mechanically
stabilised earth-retaining structures, the minimum direct sliding coefficicnt values
shall not be less than 0.8.
The interface friction coefficient was calculated as the tangent of the interfacial
friction angle between soil and coir geotextiles. A tenn Friction Enhancement Factor
(FEF) is considered herein, to quantify the effect of the coir geotextile in increasing
the coefficient of friction, and is defined as the ratio of the slope of the failure
envelope with geotextile to that ofunreinforced case [FEF = (tan 8/ tan $)]. Table 6.4
gives the values of friction enhancement factor for different cases.
Test Series No.
2
3
4
5
6
7
8
9
10
11
12
13
14
15
16
17
Table 6.4 Friction Enhancement Factor
i -~~n () I tan <I>
Description of soil . H2M6 H2M8 NW
Sand @15.0kN/m) 1.067
Sand @16.0 kN/mJ 1.136
Sand @17.0 kN/mJ 1.146
Graded sand 4.75 -2mm @16.0kN/m3 1.089
Graded sand 2mm - 1 mm, @ 16.0kN/mj
1.077
Graded sand 1 mm -0.425mm, @ 16.0kN/mj
1.120
Rock dust @15.1kN/m3 1.033
Rock dust @ 16.5kN/mj
1.004
Rock dust @ 17.5kN/mj
1.038
Graded rock dust >4.75mm, @16.5kN/mj -----rlm,5 , i
Graded rock dust, 4.75 - 2mm, (£~'16.5kN/mj 1.029
Graded rock dust, 2mm - 1 mm, @16.5kNilnJ I 1.044
Graded rock dust, 1 - 0.425mm, @16.5kN/m .l 1.021
Graded rock dust, <0.425mm, @16.5kN/ml 1.004
Red soil @15.0kN/mJ, w/c =10% 1.065
Red soil @15.0kN/m" w/c = 15% 1.013
Red soil @15.0kN/m3. w/c = 20% 1.144
70
1.165
1.178
1.195
1.170
1.140
1.126
1.068
1.097
1.138
I 1.124
I 1.076
'11.076
1.125
1.047
1.208
0.918
1.320
1.253
1.283
1.298
1.300
1.180
1.129
1.173
1.247
1.249
1.137
1.092
1.116
1.120
1.090
1.265
1.054
1.339

The variations of direct sliding coefficient (Cd.,) and interface friction coefficient
(tanS) are shown in Fig. 6.5 and Fig.6.6 respectively. It could be observed in all cases
Ihar. the values of direct sliding coefficient was greater than the minimum
recommended value of 0 .8 for all soil coir geote:<tile interfaces. Here the values
obtained were in between 1.0 to 1.5. The values were minimum for H2M6 interfaces
and maximum for Non-woven interfaces. Also. it was observed that graded soil with
higher particle size fetch high values of direct sliding coefficient and interface friction
coefficient.
1.7 ~
1.6 .!!
i 1.5 j
u 1.4 .j .. < ~ Ul 1.2
~ 1.1 is 1
. H2M6
. H2MB
. NW
2 3 4 5 6 7 8 9 10 11 12 13 14 15 16 17
Tell: Series No.
Fig. 6.S Variation of direct sliding coefficient
6.5.3 Eltect of Types of Coir Geotextile
The behaviour of interface depends on the characteristics of reinforcing material. the
coir geotextiles. and the soil propenies. It could be seen that the interfacial friction is
more with Non-woven coir geotextiles irrespect ive of the type of soil and its density,
which can be observed from Table 6.2 and Fig. 6.4. This may be due to the larger
7 1

2 ~
1.B
16 j < .! ~ 1.4 J 8 " < .g .~ "-
O.B
0.6
I . H2M6
.H2MJ c!NW
, 2 3 4 5 6 7 8 9 10 11 12 13 14 15 16 17
Tell Series No.
Fig. 6.6 Variation of interface friction coefficient
thickness of the shear band contributed by the greater roughness of the Non-woven
coir geotexti les. Since the Non-woven coir geolextiles are the roughest among the coir
geotextiles used. and the interlocking effect is most significant. shear band is the
thickest and hence. more shearing resistance. Funher. the Non-woven cci r geote)(tiles
are in full contact with the soil. and hence more soil grains are mobilised in the
shearing process. Comparing the perfonnance of H2M8 with Non-woven. it could be
seen that the developed interface friction angle is more or less the same in the case of
graded rock dust.
From Fig. 6.5 it can be sec::n that the direct sliding coefficient for Non-woven coir
geotexti le is consistently higher than other geotextilcs in all cases followed by H2M8
type. Among woven coir geotextiies. H2M6 and H2M8. it could be seen that H2M8
coir geOlextile perfonns far better than H2M6 coir geotcxtiie in all soils tested as can
be seen from the Table! 6.2. This may be due to the lesser contact area of H2M6 coir
geotext ile which in turn depends on the grid surface area availab le for sliding and
72

hence the mesh size opening. The effective grid surface area available for sliding is
42% for H2M6 coir geotextile, whereas, it is as high as 75% for H2M8 coir
geotextile, which leads to better frictional characteristics for the latter. Small mesh
sizes will allow more particles to be interlocked on its surface and hence higher value
of friction coefficient.
6.5.4 Effect of Type of Soil
The test results indicate that the particle size, shape and gradation atfect the interfacial
shear at a given stress level. With a particular coir geotextile, soil with larger particle
size gave higher friction. For example, for sand at a unit weight of 15 kN/m3, the Cds
with H2M6, H2M8 and NW coir geotextiles were respectively 1.132, 1.290 and 1.311
whereas, for rock dust with lesser effective size than sand at a unit weight of
15.lkN/m3, the values were respectively 1.098, 1.195 and 1.223. This could be due to
the fact that the width of the shear band was atfected by particle size. The area of
shear zone increases as the particle size increases. Larger amount of energy is needed
to transfonn the larger area. The frictional resistance was more in the same order of
area of sheared zone, that is, in the same tone of the grain size.
The interfacial friction coefficients for sand at a unit weight of 15.0 kN/m3 were
0.804, 0.879 and 0.944 for H2M6, H2M8 and Non-woven respectively, whereas the
corresponding values for rock dust at a comparable unit weight were 0.856, 0.884 and
0.972 respectively. This shows that the interface friction coeflicient of rock dust is
higher than that of sand.
73

6.S.S Effect of Density
Fig.6.7 shows the variation of friction coefficient with density for sand and rock
crushing. It is clear from the graphs that the coefficient of interface friction increases
with density. For sand alone, the coefficient of tnction increased from 0.753 to 0.998
when its unit weight was increased from 15kNim3 to I 7kN/m3• With NW coir
geotextile, this increase was from 0.944 to 1.295. For rock dust, at a unit weight of
15.lkN/m3 the friction coefficient was 0.83, which was increased to 1.062 at a unit
weight of 17.5 kN/m 3. With NW coir geotextile, this increase was from 0.972 to 1.33.
The percentage increase in interface friction coefficient for sand-NW interface with
respect to sand-sand interface varies from 25.3% to 29.3% as unit weight of sand
changes from 15kN/m3 to 1 7kN/m3• In the case of rock dust similar variation was
from 17.4% to 24.9%. For rock dust the friction coefficient was increased by 28% as
unit weight increased from 15.1kN/m3 to 17.5kN/m3 whereas the increase was 37%
for rock dust- NW coir geotextile interface.
1.4 -r-
1.3 -.... I:: Cl) '0 1.2 :E 8 1.1 U I:: o ~ i ID 0.9 u ~ .! 0.8
.5 0.7
14.5
-t:r- Soil only
--.- with H2M6
-0-- with H2M8
___ with NW
15 15.5 16
Unit weight (kN/m 3)
16.5 17
Fig.6.7 (a) Variation of friction coefficient with density for sand
74
17.5

1.4
1.3 -c G) 1.2 'ij
~ 1.1 0 (.)
c 0 1 ;: u .;: .... 0.9 G) u ~ QI 0.8 .. .5
0.7
0.6 14.5 15 15.5 16 16.5
Unit weight ( kN/m 3 )
-fr- Rock dust only
--....- with H2M6
--0-- with H2M8
____ with NW
17 17.5
Fig. 6.7(b) Variation of friction coefficient with densit~· for rock dust
6.5.6 Effect of Water Content
18
Fig.6.8 shows the variation of interface friction coefficient with water content in the
case of red soil. Experiments were done keeping unit weight constant at 15.0 kN/m3
(corresponding to 90% of OMC) with varying water content. It was observed that the
coefficient of friction was reduced when water content was increased. The behaviour
was identical for all types of coir geotextiles. For soil without geotextile the
coefficient of friction was 0.92 at 10% water content, which was reduced to 0.89 at
15% and then to 0.6 at 20% water content. With NW coir gcotexti1cs the interface
friction coefficient was reduced to 0.8 from 1.16 when water content \vas changed
from 10% to 20%. The variation in C,fs was only marginal when water content was in
the range of 15% to 20% with average value of Cds as 1.0 for H2M6, 1.06 for H2M8
and 1.16 for Non-woven.
75

1.4 -
1.2 .. c ~
'u :;: ~ 0
(,) 0.8 c 0 ;; u 0.6 ;S I
~
----fr- red soil only
---.- with H2M6 U
~ 0.4 ----er- with H2M8 ~ .. c
0.2 _____ with NW
0- T
9 11 13 15 17 19 21 Water content ( %)
Fig 6.8 Variation of friction coefficient with water conte" t
6.6 THEORETICAL ANALYSIS
As can be observed from the previous discussion, the frictional characteristics of soil
geotextile interface depends on many factors such as type of geotextile, type of soil,
density of soil, etc. While designing the geotextile-reinforced structures, the overall
direct sliding resistance is an important characteristic and is measured in terms of
direct sliding coefficient. Theoretical expression for direct sliding coefficient is
available for polymer or synthetic type of materials (Jewel!, 1996) as
ads::: as ( tan 0
) + (1 - a J tan~
where, ads = direct sliding coefficient,
as = fraction of !,rrid surface area,
o = interface friction angle, and rjJ = friction angle for soil.
76
----------------------------(6.2)

Here an attempt is made to compare the values obtained theoretically using the above
equation with the actual direct sliding coefficient values obtained from the experiment
for different cases as shown in Fig. 6.9. It can be observed that both the experimental
and theoretical values compare well within marginal variation. and hence it can be
safely state that the fonnula holds good in the case of coi r geotextlle also.
1.35
1.3
125 -~ c • 12 E ." S.
1.15 • .!.
J 1.1
1.05
9 .' •
• • •
1.05 1.1 1.15 12 125 1.3 1.35
C. (theoreticaQ
Fig. 6.9 Comparison of theoretical and experimental values of direct sliding coefficient
6.7 SUMMARY
The experimental studies revealed that the interfacial friction characteristics of coir
geotexti les are sufficient to fulfil! its functions such as reinforcement. separation. etc ..
The values of interface friction characteristics of coir geotexti les obtained were much
more than the val ues specified by the International Geosynthctic Society for use in
different applications. Due to the provision of coir geotextiles. the friction coefficient
was found to increase by as much as 30% to 40%.
77
Related Documents