CHAPTER 6 IN-VITRO AND EX-VIVO RELEASE STUDIES

Welcome message from author
This document is posted to help you gain knowledge. Please leave a comment to let me know what you think about it! Share it to your friends and learn new things together.
Transcript
CHAPTER 6
IN-VITRO AND EX-VIVO RELEASE STUDIES

In vitro and Ex vivo Release studies Chapter 6
147
6.1 In vitro Release Studies
In vitro release studies are quality control tool to assess batch to batch product release
performance. The in vitro release test also used to approve minor changes in
formulation. Because of the labour and expense involved with assessing in vivo drug
release, in vitro drug release studies at 37◦C (physiological temperature) have gained
increasing importance. In vitro drug release test may be used as an alternative for in
vivo bioequivalence tests in order to minimize unnecessary tests with humans (Donato
et al; 2008).
An in vitro release profile reveals fundamental information on the structure (e.g.,
porosity) and behaviour of the formulation on a molecular level, possible interactions
between drug and polymer, and their influence on the rate and mechanism of drug
release and model release data (Costa and Sousa Lobo; 2001, D'Souza and DeLuca;
2006). Such information facilitates a scientific and predictive approach to the design
and development of sustained delivery systems with desirable properties.
6.2 Ex vivo Diffusion Studies
Compared to in vivo absorption studies, in vitro studies using tissue segments can be
used to study the permeability of the compounds. As it is relatively easier, more rapid
and, in the case of segmental absorption studies, avoids complicated surgery and
maintenance of surgically prepared animals; it has the potential to reduce animal usage
since a number of variables can be examined in each experiment. Also, it Provides
insights into mechanism (e.g., carrier-mediated vs. passive), routes (e.g., transcellular
vs. paracellular), and segmental differences (e.g., small vs. large intestine) involved in
transepithelial transport. These studies are analytically simpler because compounds are
being analyzed in an aqueous buffer solution as opposed to whole blood or plasma
(Ronald et al; 1996).
6.3 Kinetics of Drug Release
In order to examine the release mechanism of drug from the prepared nanoparticles,
the results of the in vitro release study was examined according to following equations
as described by Costa and Sousa Lobo (2001).
In vitro and Ex vivo Release studies Chapter 6
148
A) ZERO ORDER RELEASE
Q = K0t
Where, Q = amount of drug release at time t
K0=Zero order release constant
t = time
Regression value of plot of amount of drug release versus time t gives the idea of release
mechanism. R2 value nearer to 1 indicating zero order release (Costa et al; 2001 and
(Kikkinides et al; 1998)
B) FIRST ORDER RELEASE EQUATION
In (100-Q) = InQ0-K1t
Where, Q = amount of drug release at time t
K1= First order release constant
The regression coefficient (R2) value obtained from the log % ARR (Amount Remaining
to Release) versus time, nearer to 1 indicates first order release. (Costa et al; 2001)
The dosage forms containing water soluble drugs in porous matrices follow this model
(Mulye and Turco; 1995).
C) HIGUCHI SQUARE ROOT OF TIME EQUATION:
Q= Kht1/2
Where, Q= Amount of drug release at time t
Kh=Higuchi square root of time release constant
The regression co-efficient of percentage drug release versus square root of time nearer
to one indicates anomalous release (Higuchi; 1961, Higuchi; 1963). This relation can be
used to describe the drug dissolution from several types of modified release
pharmaceutical dosage forms, as in the case of some transdermal systems (Costa et al;
1996) and matrix tablets with water soluble drugs.

In vitro and Ex vivo Release studies Chapter 6
149
D. KORSMEYER-PEPPAS EQUATION
Log (Mt/Mα) = Log K + n Log t
Where, Mα = total drug release after infinite time.
Mt/Mα = fractional drug release at time t.
K = kinetic constant incorporating structural and geometrical characteristic
of the drug/polymer system (devices).
n = diffusion exponents that characterizes the mechanism of drug release
t = time
Graph of log % drug release versus log time was plotted, n value was obtained and
release kinetic was determined using following specifications. This type of drug release
is controlled by combination of polymer swelling, erosion and diffusion through the
hydrated matrix (Diffusion and chain relaxation).
The value of n<0.5 or n=0.5 indicating fickian diffusion
The value of n between 0.5 to 1 (0.5 < n <1) indicating non-fickian release
The value of n = 1, indicating the Zero order release or case 2 transport
The value of n >1, indicating the Super case 2 transport
This model is generally used to analyze the release of pharmaceutical polymeric dosage
forms, when the release mechanism is not well known or when more than one type of
release phenomena could be involved (Korsmeyer et al;1983, Peppas;1985).
E) HIXON-CROWELL CUBE ROOT MODEL
Kinetic equation: 3√ Q0 - 3√ Qt = KHC.t
Plot: 3√ Q0 - 3√ Qt vs. t
Where, Q0 = initial concentration of drug present
Qt = amount of drug release at time t
KH is the kinetic constant for distribution from constantly changing surface area
observed in slow dissolving tablets (Receding geometry) (Hixon and Crowell; 1931,
Niebergall et al; 1963).
In vitro and Ex vivo Release studies Chapter 6
150
6.4 Gemcitabine HCl loaded NPs
6.4.1 In vitro release studies through dialysis membrane
In vitro release of Gemcitabine HCl from PLGA NPs was evaluated by the dialysis bag
diffusion technique reported by Yang et al (1999). Dialysis membrane (LA-401,
molecular weight cut off: 12000 Dalton; Himedia, India), 150μm in thickness was used
as an artificial membrane for preliminary in vitro studies because of simplicity,
homogeneity and uniformity. The membrane was activated by washing it in running tap
water for 3-4 h, followed by treatment with 0.3%w/v of sodium sulphide solution at 80
C for 1 min. Then, it is washed with hot water at 60° C for 2 min followed by
acidification with 0.2% sulphuric acid for 2-3 min. Finally it was rinsed with hot water
at 60° C for 2-3 min.
The diffusion medium consisted of pH-7.4 Phosphate buffer. The diffusion membrane
was soaked in PBS of pH-7.4 over night. The nanoparticulate dispersion equivalent to 5
mg of Gemcitabine HCl was placed in the dialysis bag, which was sealed at both ends.
The dialysis bag was immersed in 25 ml of the receptor phase, which was stirred at 100
rpm and maintained at 37 ± 2°C. The receptor compartment was covered to prevent the
evaporation of release medium. Samples were withdrawn at regular time intervals (0, 2,
4, 6, 12, 24, 48, 72, 96,120 h), and the same volume was replaced by fresh release
medium. The acceptor phase was changed every day to maintain sink condition. The
samples were analyzed by HPLC (Shimadzu, Kyoto, Japan) at 269 nm as per method
reported earlier for EE determination. All the experiments were performed in triplicate,
and the average values were taken. The Kinetic analysis of the release data was done by
fitting to different exponential equations such as zero order, first order, higuchi, and
Peppas- Korsmeyer to characterize the release.
6.4.2 Ex vivo diffusion studies through stomach and intestinal segment
Ex vivo studies using stomach and intestinal segment was performed to study the
permeability and absorption of formulation. All animal experiments were approved by
Committee for the Purpose of Control and Supervision of Experiments on Animals
(CPCSEA), Ministry of Social Justice and Empowerment, Government of India, New
Delhi, India. Male wistar rats (250-300g) were sacrificed by euthanasia. Stomach and a

In vitro and Ex vivo Release studies Chapter 6
151
part of intestine were isolated and washed with HBSS. The isolated organs were washed
and cleansed with their respective solutions. 2ml of the nanoparticulate suspension
(4mg/ml) was filled into the stomach which was tied at both the ends. The tissue was
placed in an organ bath with continuous aeration at 37oC. The receptor compartment
(organ tube) was filled with 30 ml of 0.1N HCl. At predetermined intervals of time (15,
30, 60, 90 and 120 min), aliquots were withdrawn from the receptor compartment.
Fresh buffer was used to replenish the receptor compartment. The samples were
analysed by HPLC at 269nm. The percent diffusion of drug was calculated and plotted
graphically. After 2h, to mimic the in vivo gastric emptying, the solution from the
stomach was transferred to the intestine which was then tied at both ends. The receptor
compartment was replaced with PBS pH 6.8 and the tissue was mounted in the organ
tube. At predetermined time intervals (30, 60, 120, 180, 240 min), aliquots were
withdrawn from the receptor compartment. Fresh buffer was used to replenish the
receptor compartment. The percent diffusion of drug was calculated and plotted
graphically. The similar study was also performed using plain drug solution. The
diffusion studies across the tissues were performed in triplicate. (Modi et al; 2013)
6.5 Lopinavir loaded NPs
6.5.1 In vitro drug release studies
In vitro release of Lopinavir from PLGA Nanoparticles was evaluated by the dialysis bag
diffusion technique.The diffusion medium consists of pH 6.8 phosphate buffer
containing Brij 35 (0.785 gm in 50 ml) (Indian Pharmacopoeia; 2007). The
nanoparticulate dispersion equivalent to 1 mg of Lopinavir was placed in the dialysis
bag, which was sealed at both ends. The dialysis bag was immersed in 70 ml of the
receptor compartment, which was stirred at 50 rpm and maintained at 37 ± 2°C. The
receptor compartment was covered to prevent the evaporation of release medium.
Samples were withdrawn at regular time intervals (0, 1, 2, 4, 6, 12, 24, 30, 48, 60, 72, 96
and 120 h), and the same volume was replaced by fresh release medium. The acceptor
phase was changed everyday to maintain sink condition. The samples were analyzed by
HPLC using C18 column (250 X 4.0 mm, 5 μ) at 210 nm using Acetonitrile: water (60:40)
as mobile phase. Similar procedure was followed for Plain drug suspension.

In vitro and Ex vivo Release studies Chapter 6
152
6.5.2 Ex vivo drug release studies
Ex vivo drug release studies were performed on stomach and intestine segments. All
animal experiments were approved by Committee for the Purpose of Control and
Supervision of Experiments on Animals (CPCSEA), Ministry of Social Justice and
Empowerment, Government of India, New Delhi, India. Male wistar rats (250-300g)
were sacrificed by euthanatia. Stomach and a part of intestine were isolated.The
isolated organs were washed and cleansed with their respective solutions. The study
was conducted for 6h to simulate gastric emptying time. 2ml of the nanoparticulate
suspension was filled into the stomach which was tied at both the ends. The tissue was
placed in an organ bath with continuous aeration at 37oC. The receptor compartment
(organ tube) was filled with 30 ml of 0.1N HCl containing Brij 35. At predetermined
intervals (15, 30, 60, 90 and 120 min.) of time, aliquots were withdrawn from the
receptor compartment. Fresh buffer was used to replenish the receptor compartment.
The 10 microlitre of sample was injected and analyzed by HPLC (Shimadzu, Japan)
using C18 column (250 X 4.0 mm, 5 μ) at 210 nm using Acetonitrile : Buffer (KH2PO4) (
60:40) as mobile phase. The percent diffusion of drug was calculated against time and
plotted graphically. After 2h, to mimic the in vivo gastric emptying, the solution from
the stomach was transferred to the intestine which was then tied at both ends [4]. The
receptor compartment was replaced with PBS pH 6.8 containing Brij 35 and the tissue
was mounted on the organ tube. At predetermined intervals (30, 60, 120, 180, 240, 300
and 360 min.) of time, aliquots were withdrawn from the receptor compartment. Fresh
buffer was used to replenish the receptor compartment. The samples were analyzed by
HPLC using C18 column (250 X 4.0 mm, 5 μ) at 210 nm using Acetonitrile:Buffer
(KH2PO4) ( 60:40) as mobile phase. The percent diffusion of drug was calculated and
plotted graphically. The study was also performed using plain drug suspension
following the above mentioned procedure(Alex et al; 2011).
In vitro and Ex vivo Release studies Chapter 6
153
6.6 Results and discussion
6.6.1 In vitro drug release studies of Gemcitabine HCl loaded NPs
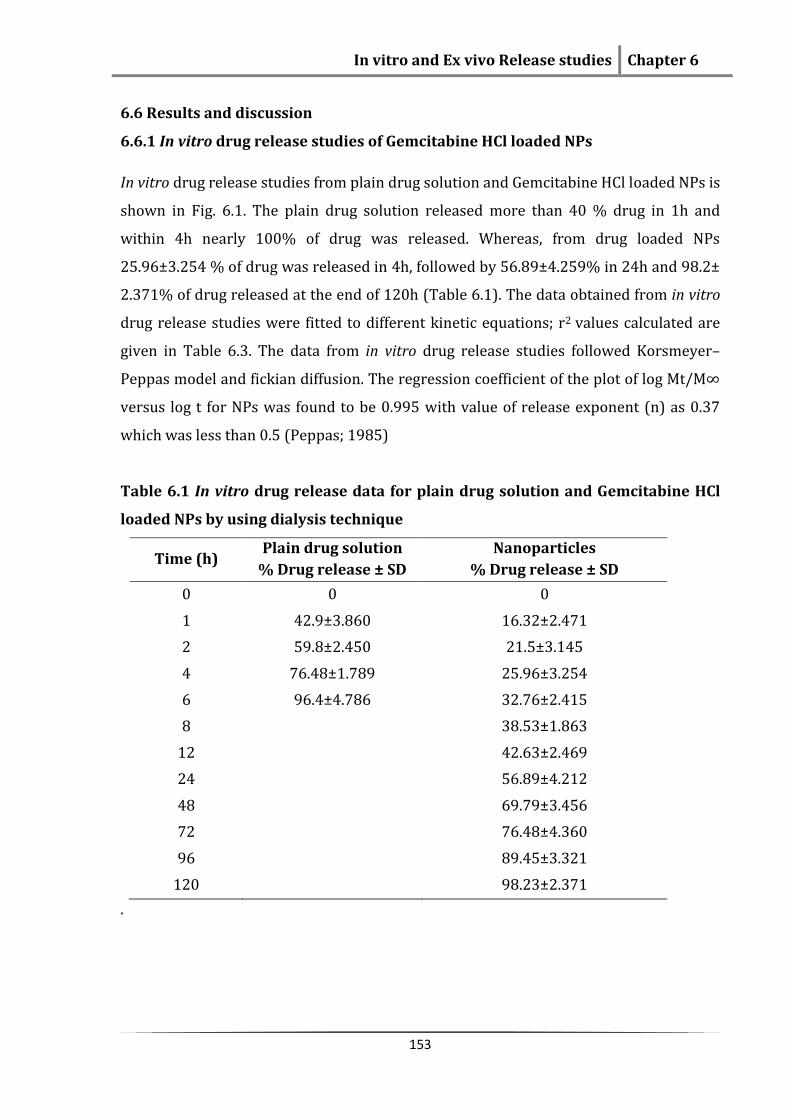
In vitro drug release studies from plain drug solution and Gemcitabine HCl loaded NPs is
shown in Fig. 6.1. The plain drug solution released more than 40 % drug in 1h and
within 4h nearly 100% of drug was released. Whereas, from drug loaded NPs
25.96±3.254 % of drug was released in 4h, followed by 56.89±4.259% in 24h and 98.2±
2.371% of drug released at the end of 120h (Table 6.1). The data obtained from in vitro
drug release studies were fitted to different kinetic equations; r2 values calculated are
given in Table 6.3. The data from in vitro drug release studies followed Korsmeyer–
Peppas model and fickian diffusion. The regression coefficient of the plot of log Mt/M∞
versus log t for NPs was found to be 0.995 with value of release exponent (n) as 0.37
which was less than 0.5 (Peppas; 1985)
Table 6.1 In vitro drug release data for plain drug solution and Gemcitabine HCl
loaded NPs by using dialysis technique
Time (h) Plain drug solution
% Drug release ± SD
Nanoparticles
% Drug release ± SD
0 0 0
1 42.9±3.860 16.32±2.471
2 59.8±2.450 21.5±3.145
4 76.48±1.789 25.96±3.254
6 96.4±4.786 32.76±2.415
8
38.53±1.863
12
42.63±2.469
24
56.89±4.212
48
69.79±3.456
72
76.48±4.360
96
89.45±3.321
120
98.23±2.371
.

In vitro and Ex vivo Release studies Chapter 6
154
0 20 40 60 80 100 120 1400
50
100
150Plain Drug solution
Nanoparticle suspension
Time (h)
% c
um
ula
tive d
rug
rele
ase
Fig. 6.1 In vitro release profile of Gemcitabine HCl loaded NPs and plain drug
solution in PBS 7.4 through dialysis membrane
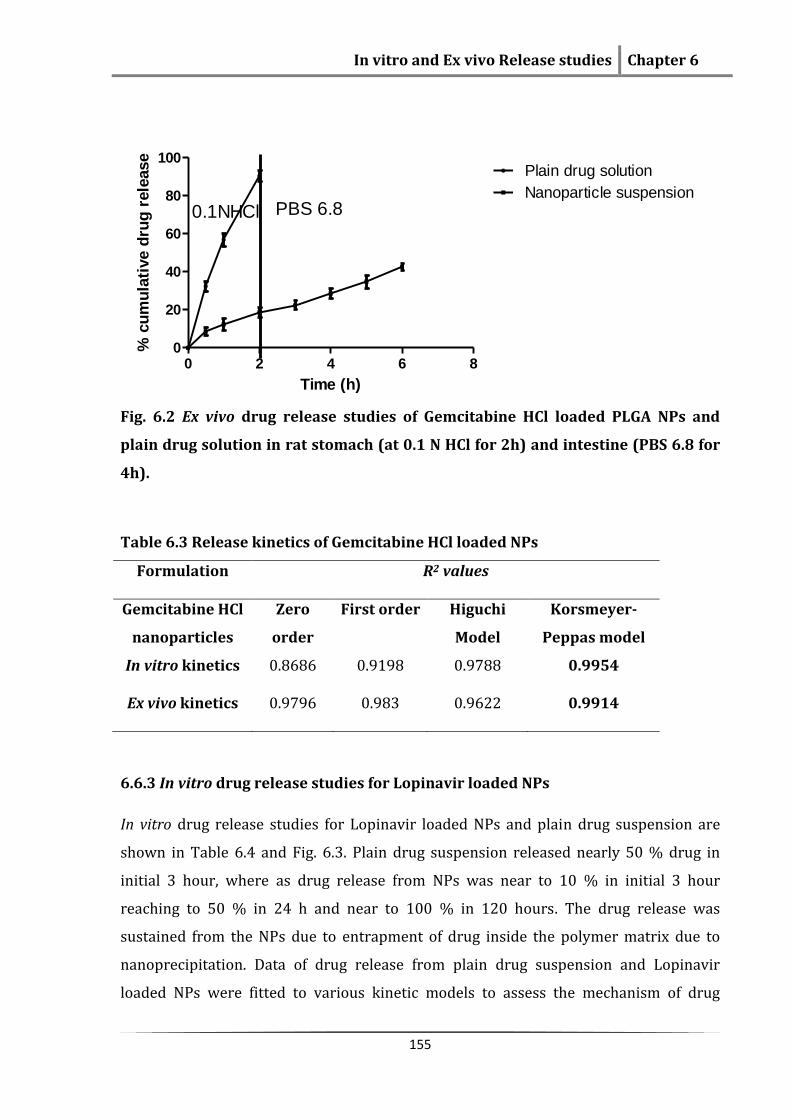
6.6.2 Ex vivo drug release studies of Gemcitabine HCl loaded NPs
The ex vivo drug release from plain drug solution showed (Table 6.2, Fig. 6.2) that
nearly complete drug was released in the stomach, whereas from NPs only 10% of drug
was released in the stomach and most of the drug was released in the intestinal
segment. This indicates that the NPs will be reaching to the Peyer’s patches. At the end
of 6h study nearly 40 % of drug was released. Because of entrapment of drug inside
NPs, release from NPs was sustained. The drug release from NPs in stomach and
intestine followed Korsmeyer-Peppas model and fickian diffusion (0.985 and n=0.486)
(Table 6.3).
Table 6.2 Ex vivo drug release data for plain drug solution and Gemcitabine HCl
loaded NPs in rat stomach and intestine segment
Time (h) Plain drug solution % Drug release ± SD
Nanoparticle suspension % Drug release ± SD
0.0 0.00 0.00 0.5 32.45±2.54 8.56±1.963 1.0 56.89±3.25 12.46±3.123 2.0 90.56±2.86 18.69±2.543 3.0 22.36±2.348 4.0 28.63±2.786 5.0 34.83±3.412 6.0 41.86±1.967
In vitro and Ex vivo Release studies Chapter 6
155
0 2 4 6 80
20
40
60
80
100Plain drug solution
Nanoparticle suspension
0.1NHCl PBS 6.8
Time (h)
% c
um
ula
tive d
rug
rele
ase
Fig. 6.2 Ex vivo drug release studies of Gemcitabine HCl loaded PLGA NPs and
plain drug solution in rat stomach (at 0.1 N HCl for 2h) and intestine (PBS 6.8 for
4h).
Table 6.3 Release kinetics of Gemcitabine HCl loaded NPs
Formulation R2 values
Gemcitabine HCl
nanoparticles
Zero
order
First order Higuchi
Model
Korsmeyer-
Peppas model
In vitro kinetics 0.8686 0.9198 0.9788 0.9954
Ex vivo kinetics 0.9796 0.983 0.9622 0.9914
6.6.3 In vitro drug release studies for Lopinavir loaded NPs
In vitro drug release studies for Lopinavir loaded NPs and plain drug suspension are
shown in Table 6.4 and Fig. 6.3. Plain drug suspension released nearly 50 % drug in
initial 3 hour, where as drug release from NPs was near to 10 % in initial 3 hour
reaching to 50 % in 24 h and near to 100 % in 120 hours. The drug release was
sustained from the NPs due to entrapment of drug inside the polymer matrix due to
nanoprecipitation. Data of drug release from plain drug suspension and Lopinavir
loaded NPs were fitted to various kinetic models to assess the mechanism of drug

In vitro and Ex vivo Release studies Chapter 6
156
release. Drug release from Lopinavir loaded PLGA NPs followed the Korsmeyer peppas
model and non fickian diffusion with r2 value of .9969 and n =0.647 (Table 6.6).
Table 6.4 In vitro drug release profile of Lopinavir loaded NPs and plain drug
suspension in PBS 7.4 by dialysis technique
Time (h) Plain drug suspension % Drug release ± SD
Nanoparticle suspension % Drug release ± SD
0. 0.000 0.00
1. 15.13±1.997 5.21±2.096
2. 26.43±1.698 7.34±1.032
3. 48.83±2.352 8.56±2.127
4. 68.56±3.698 15.23±1.752
6. 78.06±1.736 24.75±2.056
8. 90.29±2.141 27.69±2.568
12. 97.23±2.687 34.86±2.048
24.
50.43±3.588
36.
62.35±2.021
48.
73.65±3.567
60.
81.78±2.986
72.
86.96±3.184
96.
93.24±3.124
120
98.52±2.980
0 50 100 1500
50
100
150Plain drug suspension
Nanoparticle suspension
Time (h)
Cu
mu
lati
ve %
dru
g r
ele
ase
Fig. 6.3 In vitro drug release profile of Lopinavir loaded NPs and plain drug
solution in PBS 7.4 by dialysis technique

In vitro and Ex vivo Release studies Chapter 6
157
6.6.4 Ex vivo drug release studies for Lopinavir loaded NPs
The ex vivo drug release studies from plain drug solution and Lopinavir loaded
nanoparticulate formulation was studies in rat stomach and intestine for eight hours to
simulate gastric emptying. Initially, the drug release was checked in stomach segment
for 2 hours. From plain drug solution, more than 60% of drug was released in stomach,
whereas drug release from NPs was slow and sustained; nearly 13% of drug was
released in stomach in initial hours (Table 6.5, Fig. 6.4). Only small fraction of drug was
released before the NPs could reach to the Peyer’s patches in intestine, indicating the
protection of drug inside NPs in stomach and availability of more drug at M cells. Low
aqueous solubility of drug entrapped in polymeric system was the reason for slow
release. When data of drug release from NPs were fitted to various kinetic equations,
the drug release from NPs was found to be diffusion controlled as it follows Korsmeyer
peppas model with r2 value of 0.9652 and mechanism of drug release was non fickian
diffusion (n=0.879 ) (Table 6.6).
Table 6.5 Ex vivo drug release studies of Lopinavir loaded NPs in rat stomach
(0.1N HCl for 2 h) and intestinal segment (PBS 6.8 for 6h)
Time (h) Plain drug solution
% Drug release ± SD
Nanoparticle suspension
% Drug release ± SD
0.00 0.000 0.00
0.25 16.930±2.265 3.51±2.698
0.50 36.930±3.200 4.73±1.956
1.00 49.750±2.563 7.45±2.753
1.50 59.860±4.623 9.97±3.456
2.00 71.560±3.412 12.56±2.063
2.50 78.940±2.573 18.56±3.563
3.00 86.940±2.212 24.63±3.214
4.00 91.630±3.430 36.12±2.269
5.00
45.86±1.897
6.00
48.63±2.321
7.00
49.56±2.256
8.00
51.45±2.053

In vitro and Ex vivo Release studies Chapter 6
158
0 2 4 6 8 100
20
40
60
80
100Plain drug suspension
Nanoparticle suspension0.1 NHCl PBS 6.8
Time (h)
% c
um
ula
tive d
rug
rele
ase
Fig. 6.4 Ex vivo drug release studies of Lopinavir loaded NPs in rat stomach (0.1N
HCl for 2 h) and intestinal segment (PBS 6.8 for 6h)
Table 6.6 Release Kinetics of Lopinavir loaded PLGA NPs
Formulation R2 values
Lopinavir
Nanoparticles
Zero order First order Higuchi
Model
Korsmeyer-
Peppas model
In vitro 0.8761 0.9781 0.982 0.9969
Ex vivo 0.9521 0.9629 0.9197 0.9652
In vitro and Ex vivo Release studies Chapter 6
159
6.7 References
Alex A, Paul W, Chacko AJ and Sharma CP. Enhanced delivery of lopinavir to the
CNS using Compritol-based solid lipid nanoparticles. Ther Deliv, 2, 2011, 25-35.
Costa P and Sousa Lobo JM. Modeling and comparison of dissolution profiles. Eur
J Pharm Sci, 13, 2001, 123-133.
D'Souza SS and DeLuca PP. Methods to assess in vitro drug release from
injectable polymeric particulate systems. Pharm Res, 23, 2006,460-474.
Donato EM, Martins LA, Froehlich PE and Bergold AM. Development and
validation of dissolution test for lopinavir, a poorly water-soluble drug, in soft gel
capsules, based on in vivo data. J Pharm Biomed Anal, 47,2008, 547-552.
Higuchi T. Rate of release of medicaments from ointment bases containing drugs
in suspension. J Pharm Sci, 50, 1961, 874–875.
Higuchi T. Mechanism of sustained-action medication. Theoretical analysis of
rate of release of solid drugs dispersed in solid matrices. J Pharm Sci, 52, 1963,
1145–1149.
Hixson AW, Crowell JH. Dependence of reaction velocity upon surface and
agitation. Ind Eng Chem, 23, 1931, 923–931.
Indian Pharmacopoeia. Indian Pharmacopoeial Commission; Ghaziabad, INDIA,
2, 2007, 697-700.
Kikkinides ES, Charalambopoulou GC, Stubos AK, Kanellopoulos NK, Varelas CG,
and Steiner CA. A two-phase model for controlled drug release from biphasic
polymer hydrogels. J Control Release, 51,1998, 313-325.
Korsmeyer RW, Gurny R, Doelker E, Buri P, and Peppas NA. Mechanisms of
potassium chloride release from compressed, hydrophilic, polymeric matrices:
effect of entrapped air. J Pharm Sci, 72, 1983, 1189-1191.
Modi J, Joshi G, Sawant KK. Chitosan based mucoadhesive nanoparticles of
ketoconazole for bioavailability enhancement: formulation, optimization, in vitro
and ex vivo evaluation. Drug Dev Ind Pharm, 39, 2013, 540-547.
Mulye NV, Turco SJ. A simple model based on first order kinetics to explain
release of highly water soluble drugs from porous dicalcium phosphate
dihydrate matrices. Drug Dev Ind Pharm, 21, 1995, 943–953.

In vitro and Ex vivo Release studies Chapter 6
160
Niebergall P, Milosovich G, Goyan JE. Dissolution rate studies. II. Dissolution of
particles under conditions of rapid agitation. J Pharm Sci, 52, 1963, 236–241.
Peppas NA. Analysis of Fickian and non-Fickian drug release from polymers.
Pharm Acta Helv, 60, 1985,110-111.
Ronald TB, Philip LS, Wilson G. Models for Assessing Drug Absorption and
Metabolism, Methods for Evaluating Intestinal Permeability and Metabolism in
vitro, Pharmaceutical Biotechnology, 8, 1996, 13-34.
Yang SC, Lu LF, Cai Y, Zhu JB, Liang BW, and Yang CZ. Body distribution in mice of
intravenously injected camptothecin solid lipid nanoparticles and targeting
effect on brain. J Control Release, 59,1999, 299-307.
Related Documents