© 2012 Pearson Education, Inc. Chapter 6: Human Population • Human population growth • Population, affluence, and technology’s effects • Demography • Demographic transition • Factors affecting population growth © 2012 Pearson Education, Inc. Central Case Study: China’s One-Child Policy • In 1970, China’s 790 million people faced starvation • The government instituted a one-child policy – The growth rate plummeted • The policy is now less strict but has unwanted consequences: – Killing of female infants – Black-market trade in teenaged girls © 2012 Pearson Education, Inc. Our world at seven billion • Populations continue to rise in most countries – Particularly in poverty-stricken developing nations • Although the rate of growth is slowing, we are still increasing in numbers Counting to 1 billion (1/second) would take 31 years—it would take 221 years to count to 7 billion! © 2012 Pearson Education, Inc. The human population is growing rapidly • Our population grows by over 80 million each year • It took until 1800 to reach 1 billion • We added 6 more billion in 130 years • We added the most recent billion in 12 years Because of exponential growth (increase by a fixed %), even if the growth rate remains steady, population will continue to grow

Welcome message from author
This document is posted to help you gain knowledge. Please leave a comment to let me know what you think about it! Share it to your friends and learn new things together.
Transcript
© 2012 Pearson Education, Inc.
Chapter 6: Human Population
• Human population growth• Population, affluence, and technology’s effects• Demography• Demographic
transition• Factors affecting
population growth
© 2012 Pearson Education, Inc.
Central Case Study: China’s One-ChildPolicy
• In 1970, China’s 790 millionpeople faced starvation
• The government instituted aone-child policy– The growth rate plummeted
• The policy is now less strictbut has unwanted consequences:– Killing of female infants– Black-market trade in teenaged
girls
© 2012 Pearson Education, Inc.
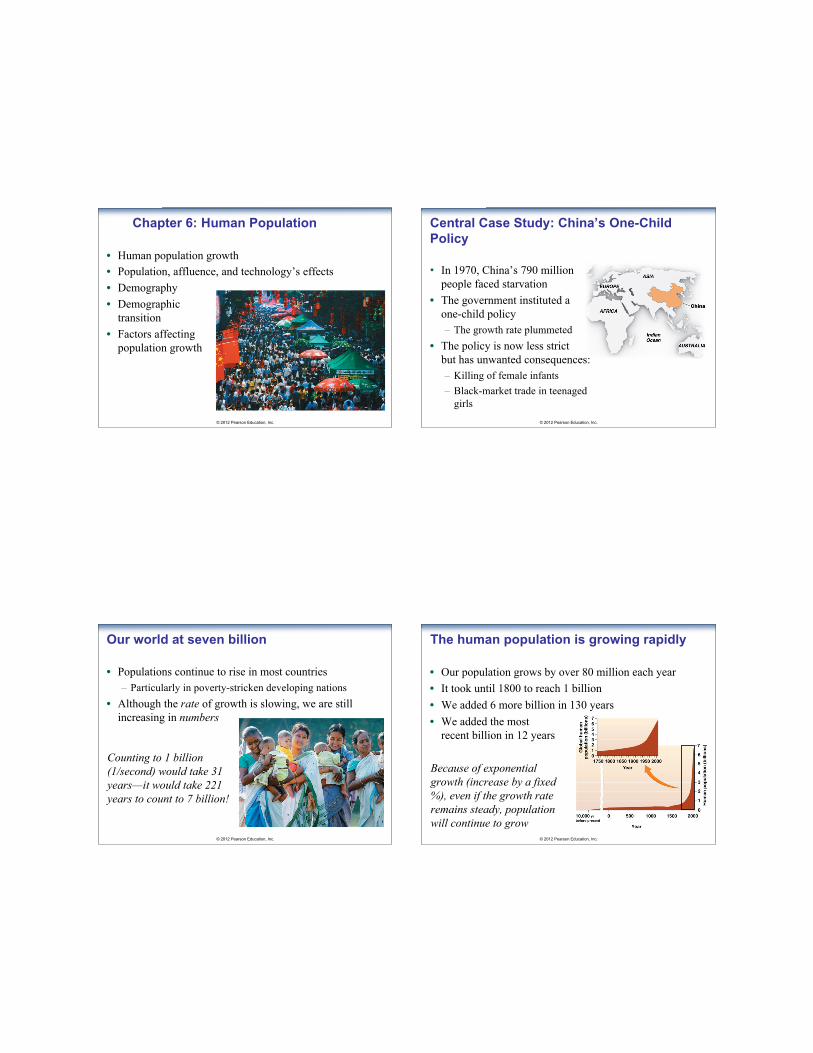
Our world at seven billion
• Populations continue to rise in most countries– Particularly in poverty-stricken developing nations
• Although the rate of growth is slowing, we are stillincreasing in numbers
Counting to 1 billion(1/second) would take 31years—it would take 221years to count to 7 billion!
© 2012 Pearson Education, Inc.
The human population is growing rapidly
• Our population grows by over 80 million each year• It took until 1800 to reach 1 billion• We added 6 more billion in 130 years• We added the most
recent billion in 12 years
Because of exponentialgrowth (increase by a fixed%), even if the growth rateremains steady, populationwill continue to grow
© 2012 Pearson Education, Inc.
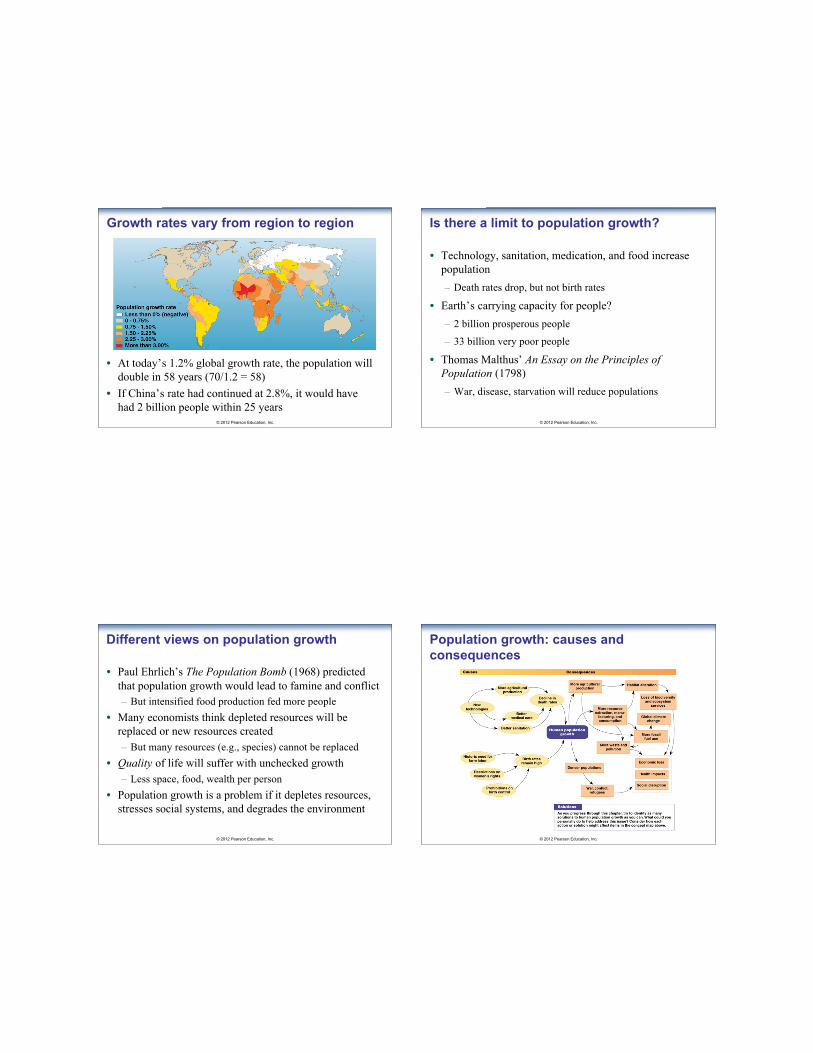
Growth rates vary from region to region
• At today’s 1.2% global growth rate, the population willdouble in 58 years (70/1.2 = 58)
• If China’s rate had continued at 2.8%, it would havehad 2 billion people within 25 years
© 2012 Pearson Education, Inc.
Is there a limit to population growth?
• Technology, sanitation, medication, and food increasepopulation– Death rates drop, but not birth rates
• Earth’s carrying capacity for people?– 2 billion prosperous people
– 33 billion very poor people
• Thomas Malthus’ An Essay on the Principles ofPopulation (1798)– War, disease, starvation will reduce populations
© 2012 Pearson Education, Inc.
Different views on population growth
• Paul Ehrlich’s The Population Bomb (1968) predictedthat population growth would lead to famine and conflict– But intensified food production fed more people
• Many economists think depleted resources will bereplaced or new resources created– But many resources (e.g., species) cannot be replaced
• Quality of life will suffer with unchecked growth– Less space, food, wealth per person
• Population growth is a problem if it depletes resources,stresses social systems, and degrades the environment
© 2012 Pearson Education, Inc.
Population growth: causes andconsequences
© 2012 Pearson Education, Inc.
Several factors affect the environment
• The IPAT model: I = P × A × T• Our total impact (I) on the environment results from:
– Population (P): individuals need space and resources– Affluence (A): per capita resource use– Technology (T): increases use of, or protects, resources
• Sensitivity (S): a fourth factor showing how sensitive anarea is to human pressure
• Further model refinements include the effects ofeducation, laws, and ethics on the formula
© 2012 Pearson Education, Inc.
China is an example of the IPAT formula
• Elements of the IPAT equation can combine– Causing tremendous impact in a very short time
• Modern China’s rapid development is causingunprecedented environmental challenges– Intensive agriculture is eroding farmland
– Overuse has dried up the mighty Yellow River
– Increasing vehicles are causing urban pollution andmassive traffic jams
© 2012 Pearson Education, Inc.
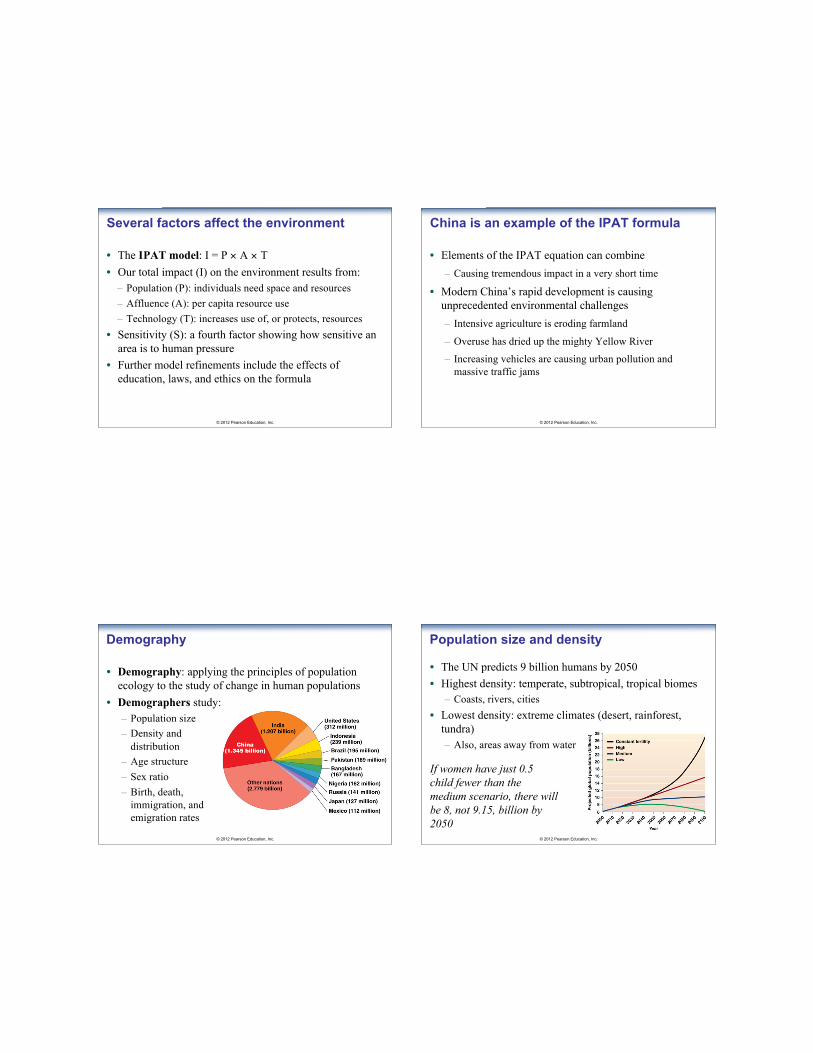
Demography
• Demographers study:– Population size– Density and
distribution– Age structure– Sex ratio– Birth, death,
immigration, andemigration rates
• Demography: applying the principles of populationecology to the study of change in human populations
© 2012 Pearson Education, Inc.
Population size and density
• The UN predicts 9 billion humans by 2050• Highest density: temperate, subtropical, tropical biomes
– Coasts, rivers, cities• Lowest density: extreme climates (desert, rainforest,
tundra)– Also, areas away from water
If women have just 0.5child fewer than themedium scenario, there willbe 8, not 9.15, billion by2050
© 2012 Pearson Education, Inc.
Population distribution
• Humans are unevenly distributed around the globe• Many unpopulated areas (e.g., deserts, arid grasslands) are
environmentally sensitive– High S value in the modified IPAT equation– Vulnerable to humans (agriculture, ranching, etc.)
© 2012 Pearson Education, Inc.
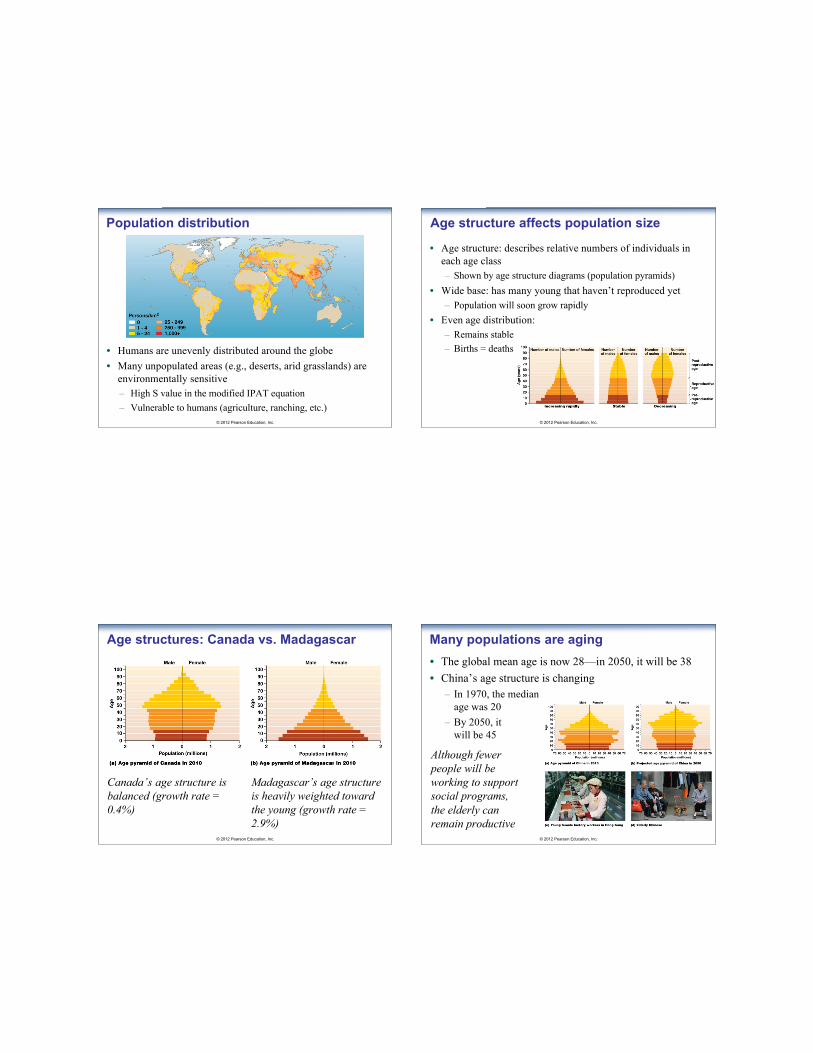
Age structure affects population size
• Age structure: describes relative numbers of individuals ineach age class– Shown by age structure diagrams (population pyramids)
• Wide base: has many young that haven’t reproduced yet– Population will soon grow rapidly
• Even age distribution:– Remains stable– Births = deaths
© 2012 Pearson Education, Inc.
Canada’s age structure isbalanced (growth rate =0.4%)
Madagascar’s age structureis heavily weighted towardthe young (growth rate =2.9%)
Age structures: Canada vs. Madagascar
© 2012 Pearson Education, Inc.
Many populations are aging• The global mean age is now 28—in 2050, it will be 38• China’s age structure is changing
– In 1970, the medianage was 20
– By 2050, itwill be 45
Although fewerpeople will beworking to supportsocial programs,the elderly canremain productive
© 2012 Pearson Education, Inc.
Factors in population change
• Rates of birth, death, and migration determine whethera population grows, shrinks, or remains stable– Birth and immigration add individuals– Death and emigration remove individuals
• Technological advances cause decreased deaths– The increased gap between birth and death rates resulted
in population expansion• Natural rate of population change: change due to
birth and death rates alone, excluding migration
© 2012 Pearson Education, Inc.
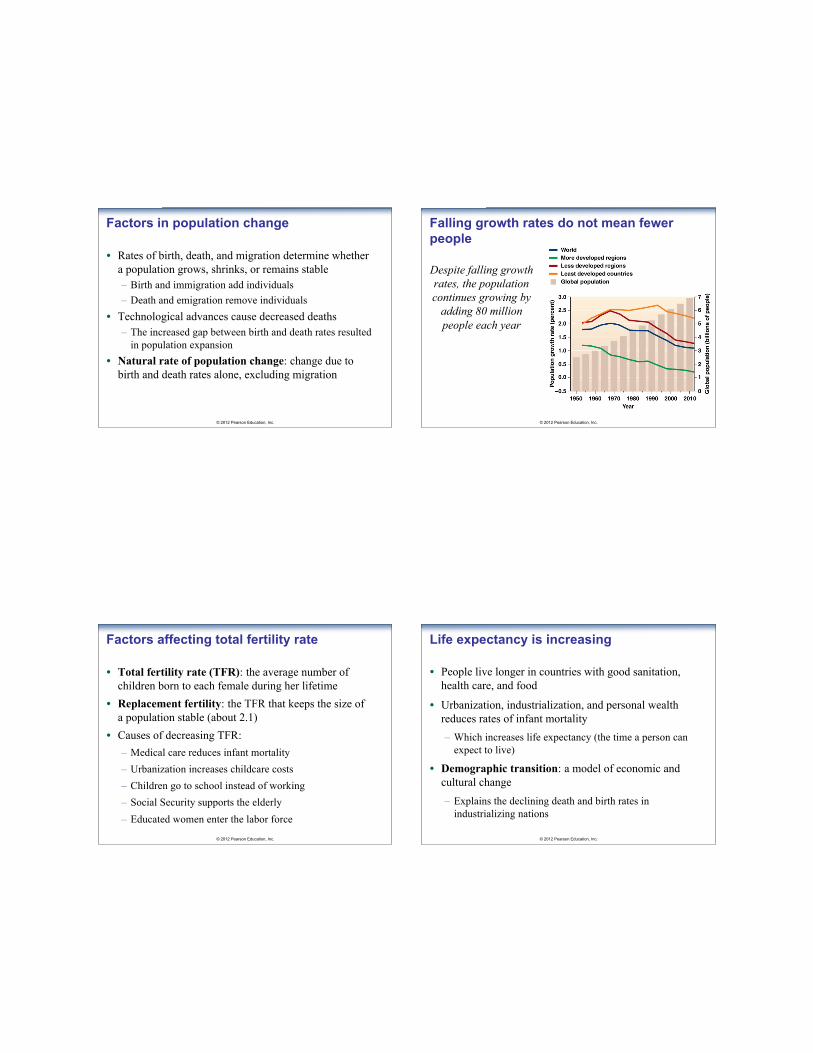
Falling growth rates do not mean fewerpeople
Despite falling growthrates, the populationcontinues growing by
adding 80 millionpeople each year
© 2012 Pearson Education, Inc.
Factors affecting total fertility rate
• Total fertility rate (TFR): the average number ofchildren born to each female during her lifetime
• Replacement fertility: the TFR that keeps the size ofa population stable (about 2.1)
• Causes of decreasing TFR:– Medical care reduces infant mortality– Urbanization increases childcare costs– Children go to school instead of working– Social Security supports the elderly– Educated women enter the labor force
© 2012 Pearson Education, Inc.
Life expectancy is increasing
• People live longer in countries with good sanitation,health care, and food
• Urbanization, industrialization, and personal wealthreduces rates of infant mortality– Which increases life expectancy (the time a person can
expect to live)
• Demographic transition: a model of economic andcultural change– Explains the declining death and birth rates in
industrializing nations
© 2012 Pearson Education, Inc.
The demographic transition
• As they industrialize, nations move from a stable pre-industrial state of high birth and death rates– To a stable post-industrial state of low birth and death
rates
• Industrialization decreases mortality rates– So there is less need for large families
– Parents invest in quality of life, not quantity of kids
• Death rates fall before birth rates– Resulting in temporary population growth
© 2012 Pearson Education, Inc.
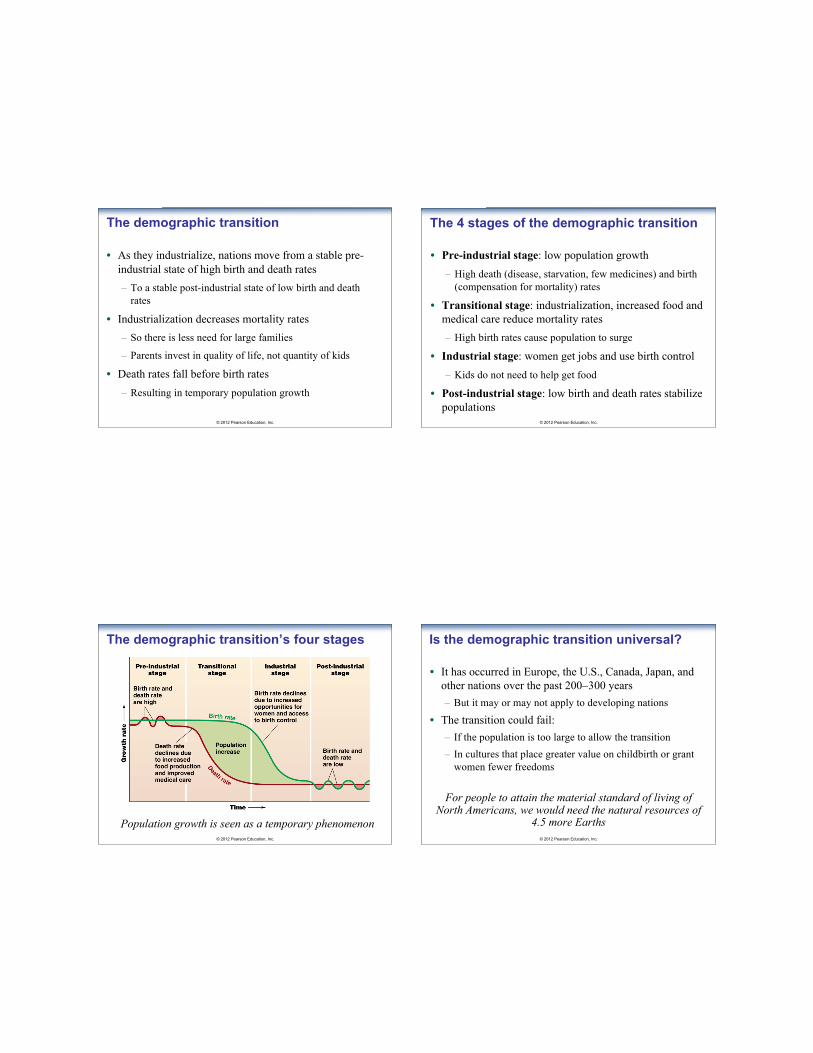
The 4 stages of the demographic transition
• Pre-industrial stage: low population growth– High death (disease, starvation, few medicines) and birth
(compensation for mortality) rates
• Transitional stage: industrialization, increased food andmedical care reduce mortality rates– High birth rates cause population to surge
• Industrial stage: women get jobs and use birth control– Kids do not need to help get food
• Post-industrial stage: low birth and death rates stabilizepopulations
© 2012 Pearson Education, Inc.
The demographic transition’s four stages
Population growth is seen as a temporary phenomenon© 2012 Pearson Education, Inc.
Is the demographic transition universal?
• It has occurred in Europe, the U.S., Canada, Japan, andother nations over the past 200–300 years– But it may or may not apply to developing nations
• The transition could fail:– If the population is too large to allow the transition– In cultures that place greater value on childbirth or grant
women fewer freedoms
For people to attain the material standard of living ofNorth Americans, we would need the natural resources of
4.5 more Earths
© 2012 Pearson Education, Inc.
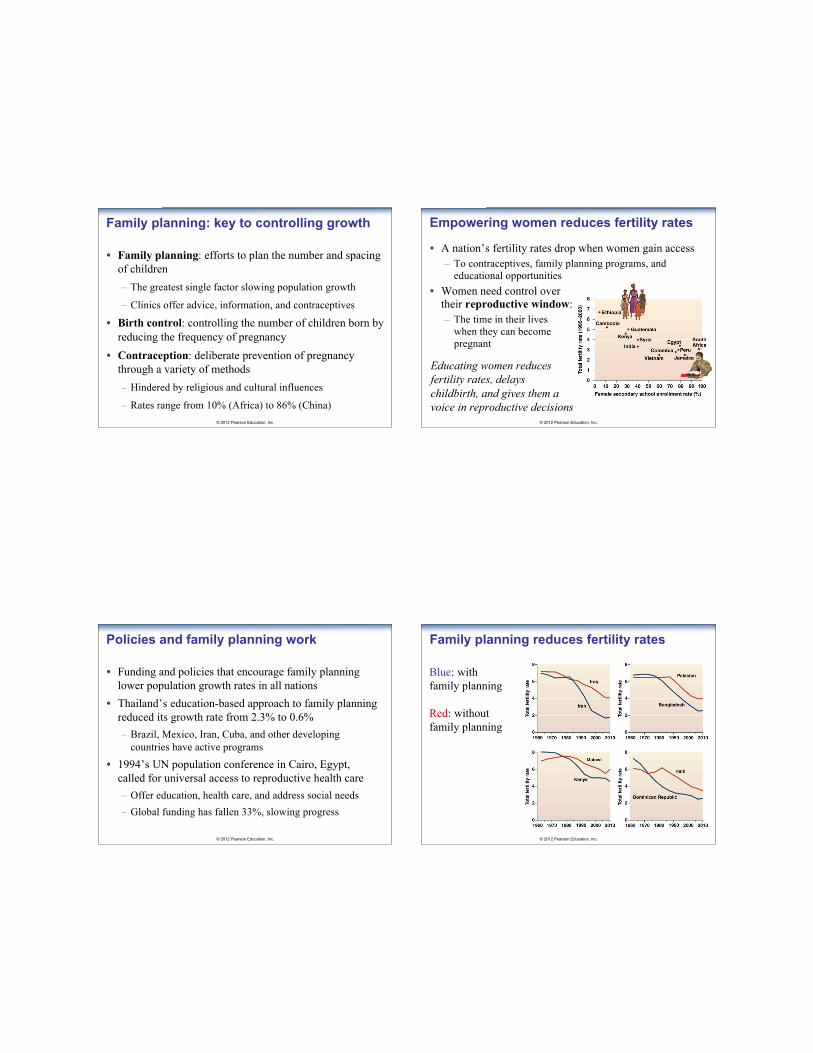
Family planning: key to controlling growth
• Family planning: efforts to plan the number and spacingof children– The greatest single factor slowing population growth
– Clinics offer advice, information, and contraceptives
• Birth control: controlling the number of children born byreducing the frequency of pregnancy
• Contraception: deliberate prevention of pregnancythrough a variety of methods– Hindered by religious and cultural influences
– Rates range from 10% (Africa) to 86% (China)© 2012 Pearson Education, Inc.
Empowering women reduces fertility rates
• A nation’s fertility rates drop when women gain access– To contraceptives, family planning programs, and
educational opportunities• Women need control over
their reproductive window:– The time in their lives
when they can becomepregnant
Educating women reducesfertility rates, delayschildbirth, and gives them avoice in reproductive decisions
© 2012 Pearson Education, Inc.
Policies and family planning work
• Funding and policies that encourage family planninglower population growth rates in all nations
• Thailand’s education-based approach to family planningreduced its growth rate from 2.3% to 0.6%– Brazil, Mexico, Iran, Cuba, and other developing
countries have active programs
• 1994’s UN population conference in Cairo, Egypt,called for universal access to reproductive health care– Offer education, health care, and address social needs– Global funding has fallen 33%, slowing progress
© 2012 Pearson Education, Inc.
Family planning reduces fertility rates
Blue: withfamily planning
Red: withoutfamily planning
© 2012 Pearson Education, Inc.
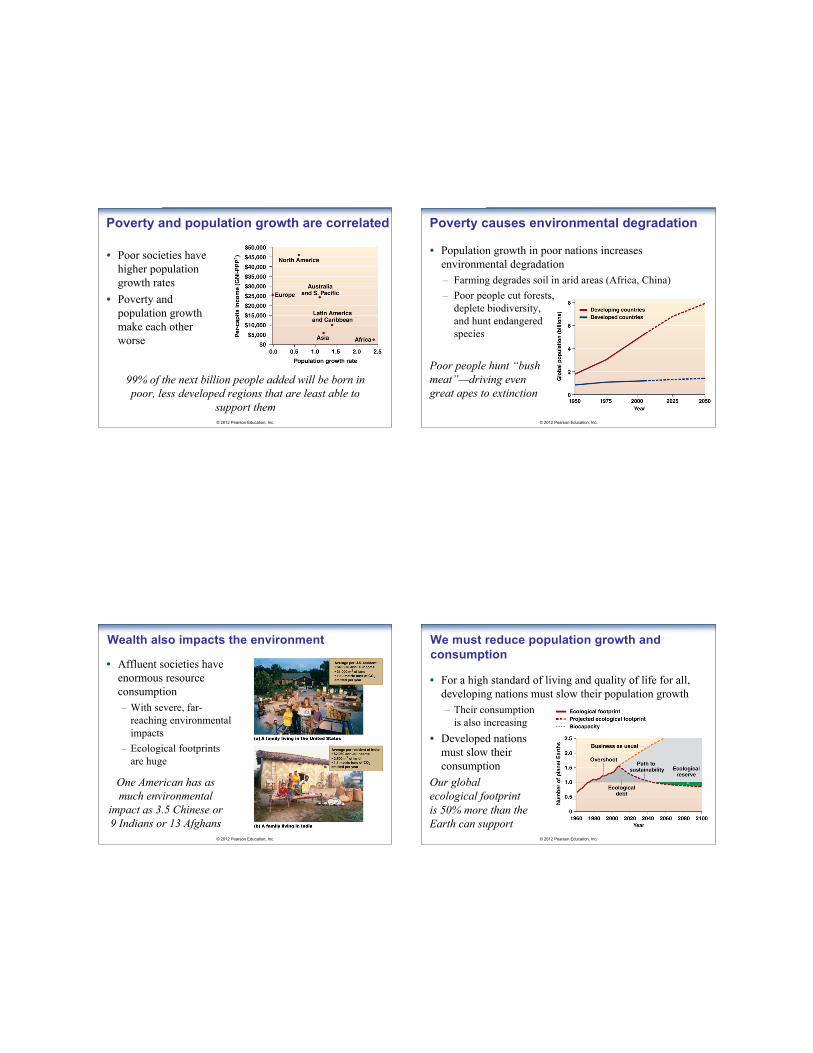
Poverty and population growth are correlated
• Poor societies havehigher populationgrowth rates
• Poverty andpopulation growthmake each otherworse
99% of the next billion people added will be born inpoor, less developed regions that are least able to
support them© 2012 Pearson Education, Inc.
Poverty causes environmental degradation
• Population growth in poor nations increasesenvironmental degradation– Farming degrades soil in arid areas (Africa, China)– Poor people cut forests,
deplete biodiversity,and hunt endangeredspecies
Poor people hunt “bushmeat”—driving evengreat apes to extinction
© 2012 Pearson Education, Inc.
Wealth also impacts the environment
• Affluent societies haveenormous resourceconsumption– With severe, far-
reaching environmentalimpacts
– Ecological footprintsare huge
One American has asmuch environmental
impact as 3.5 Chinese or9 Indians or 13 Afghans
© 2012 Pearson Education, Inc.
We must reduce population growth andconsumption
Our globalecological footprintis 50% more than theEarth can support
• For a high standard of living and quality of life for all,developing nations must slow their population growth– Their consumption
is also increasing• Developed nations
must slow theirconsumption

© 2012 Pearson Education, Inc.
Conclusion
• The human population is larger than it has ever been• Rates are decreasing but populations are still rising• Most developed nations have passed through the
demographic transition• Expanding women’s rights slows population growth• How will the population stop rising?
– The demographic transition, governmental intervention,or disease and social conflict?
• Sustainability requires a stabilized population to avoiddestroying natural systems
Related Documents


![Chapter 7[1]. Human Population and the Environment](https://static.cupdf.com/doc/110x72/577d27291a28ab4e1ea32a62/chapter-71-human-population-and-the-environment.jpg)