CHAPTER 6: FREE MOVEMENT OF SCIENCE AND TECHNOLOGY ACROSS EUROPE AND BEYOND 284 CHAPTER 6 Free movement of science and technology across Europe and beyond HIGHLIGHTS An effective European Research Area will contribute to a single market for knowledge in Europe. To this end, it is not sufficient to enhance the system – research performers and users also need to be stimulated to take up the opportunities offered to them and use the system for collaborative knowledge production. Knowledge circulates between the public and private sector (see chapter II.2), across Europe and between Europe and other parts of the world. Knowledge flows can take different forms: exchange of informal knowledge and information, knowledge embodied in persons (see chapter II.4), concrete cooperation in producing science, and cooperation in the development and ownership of technologies. Evidence shows an increasing integration of science and technology production in Europe. However, this knowledge circulates predominantly within Western Europe, leaving countries in Eastern Europe, and some of the Southern European countries, outside the dominant knowledge flows. Evidence of electronic infrastructures indicates an increasing flow of informal scientific knowledge. The strong increase in Open Access repositories, journals and articles testifies similar trends towards knowledge sharing driven by mutual benefit. However, much progress remains to be made. Only 20 % of the total number of peer-reviewed journals worldwide offer open access to the reader. Scientific integration and cooperation can also be measured by the number of co-publications. In absolute numbers, European researchers co-publish mainly with colleagues from other European countries, and this intra- European co-publication increased by almost 10% between 2003 and 2008. However, a divide appears between an increasingly integrated Western Europe and an Eastern Europe suffering from a lower level of trans-European scientific cooperation – a picture also emerging from data on the mobility of researchers. At the same time, European scientists increasingly co-publish with colleagues from non-European countries : a growth of 8 % over the period 2000–2008. The largest growth has taken place in the co-publications with researchers from the most research-intensive Asian countries. However, the EU still lags behind the United States in scientific cooperation with these Asian countries. Contrary to scientific cooperation, technological cooperation is closely linked to market exploitation and application of knowledge. Worldwide, co-patenting has more than tripled since the early 1990s, with a major role played by the United States. At EU level, the four strongest countries in terms of patent applications (France, the United Kingdom, Germany and Italy) account for 75 % of all EU patent applications. However, all Member States increased their co-patenting both within the country and with European or third-country partners. Co-patents with third countries increased more than those within the EU, showing the international and open character of innovation systems but also the need to consolidate the internal market for knowledge. Networks organised around co-patenting collaborations have been growing, usually around a core of key linkages, reinforcing the regions with higher degrees of patenting, which become the regions with stronger co-patenting activities. Germany has been playing a bridge role in this networking. Smaller countries show less integration in the networks. Europe’s scientific cooperation divide seems to be visible also in technological collaboration, with an additional peripheral role for some Southern European countries as Portugal, Greece, and to a certain extent, Spain.

Welcome message from author
This document is posted to help you gain knowledge. Please leave a comment to let me know what you think about it! Share it to your friends and learn new things together.
Transcript

chaptEr 6: frEE movEmEnt of sciEncE and tEchnology across EuropE and bEyond 284
chaptEr 6
Free movement of science and technology across Europe and beyondHIGHlIGHTSAn effective European Research Area will contribute to a single market for knowledge in Europe. To this end, it is not sufficient to enhance the system – research performers and users also need to be stimulated to take up the opportunities offered to them and use the system for collaborative knowledge production. Knowledge circulates between the public and private sector (see chapter II.2), across Europe and between Europe and other parts of the world. Knowledge flows can take different forms : exchange of informal knowledge and information, knowledge embodied in persons (see chapter II.4), concrete cooperation in producing science, and cooperation in the development and ownership of technologies. Evidence shows an increasing integration of science and technology production in Europe. However, this knowledge circulates predominantly within Western Europe, leaving countries in Eastern Europe, and some of the Southern European countries, outside the dominant knowledge flows.
Evidence of electronic infrastructures indicates an increasing flow of informal scientific knowledge. The strong increase in Open Access repositories, journals and articles testifies similar trends towards knowledge sharing driven by mutual benefit. However, much progress remains to be made. Only 20 % of the total number of peer-reviewed journals worldwide offer open access to the reader. Scientific integration and cooperation can also be measured by the number of co-publications. In absolute numbers, European researchers co-publish mainly with colleagues from other European countries, and this intra-European co-publication increased by almost 10 % between 2003 and 2008. However, a divide appears between an increasingly integrated Western Europe and an Eastern Europe suffering from a lower level of trans-European scientific cooperation – a
picture also emerging from data on the mobility of researchers. At the same time, European scientists increasingly co-publish with colleagues from non-European countries : a growth of 8 % over the period 2000–2008. The largest growth has taken place in the co-publications with researchers from the most research-intensive Asian countries. However, the EU still lags behind the United States in scientific cooperation with these Asian countries.
Contrary to scientific cooperation, technological cooperation is closely linked to market exploitation and application of knowledge. Worldwide, co-patenting has more than tripled since the early 1990s, with a major role played by the United States. At EU level, the four strongest countries in terms of patent applications (France, the United Kingdom, Germany and Italy) account for 75 % of all EU patent applications. However, all Member States increased their co-patenting both within the country and with European or third-country partners. Co-patents with third countries increased more than those within the EU, showing the international and open character of innovation systems but also the need to consolidate the internal market for knowledge. Networks organised around co-patenting collaborations have been growing, usually around a core of key linkages, reinforcing the regions with higher degrees of patenting, which become the regions with stronger co-patenting activities. Germany has been playing a bridge role in this networking. Smaller countries show less integration in the networks. Europe’s scientific cooperation divide seems to be visible also in technological collaboration, with an additional peripheral role for some Southern European countries as Portugal, Greece, and to a certain extent, Spain.

285 analysis | part ii : a European research area open to the world - towards a more efficient research and innovation system
A higher integration of EU Member States’ research systems is an essential prerequisite of the realisation of the ERA, with the view of avoiding duplication of research results obtained in various Member States, and maximising knowledge spillover. The Innovation Union Initiative emphasises the need to remove obstacles to flows of knowledge and a single market for knowledge. Knowledge flows in transnational collaboration which are disseminated through open access to scientific products also contribute to raising the quality of European science and technology.
This chapter presents cooperation and knowledge flows for the production of science and technology, spanning from information- and knowledge-sharing using information and communication technologies (measured by Webometrics, e-infrastructures and open access to scientific articles), transnational cooperation in the production of knowledge (measured by collaborative links and international cooperation funded through the EU framework programme), cooperation in producing scientific knowledge (co-publications), and cooperation in technology development (co-patenting).
6.1. is there an expansion in electronic infrastructures and open access to scientific articles?
The capacity of European e-infrastructures has largely expanded over the last five years
Normalised networks, the Central Processing Unit (CPU)293 and computing capacities used in European e-infrastructures and accessible from any country294 were multiplied by more than 17 times between 2005 and 2010. This network capacity is mainly provided by GEANT, DANTE, CPU and computing capacity by EGI and PRACE. These infrastructures are essential in supporting the exchange of data and information between researchers, universities and research organisations throughout Europe.
293 Central Processing Unit.294 Purely national resources are excluded.
TABLE II.6.1
TABLE II.6.2
2005 1002006 1582007 3632008 4822009 9082010 1 751
2005 1002006 1612007 2222008 2742009 327
Normalised network, CPU and computing capacities(1), 2005-2010 (reference : 100 in 2005)
Cross-country network traffic(1), 2005-2009 (reference : 100 in 2005)
Source : DG Research and InnovationData : DG Information SocietyNote : (1) 1/3 (netcap) + 1/3 (cpucap) + 1/3 (compcap)
Source : DG Research and InnovationData : DG Information SocietyNote : (1) 1/2 (traffic EU) + 1/2 (traffic beyond EU)
Innovation union Competitiveness report 2011
Innovation union Competitiveness report 2011
The use of European e-infrastructures has increased by over three times over the last five years
Cross-country network traffic represents actual knowledge circulation between researchers, universities and research organisations within the EU and between the EU and the rest of the world. This cross-country traffic was multiplied by more than three between 2005 and 2010.

Innovation Union Competitiveness Report 2011
31
570
1134
1723
2235
2792
3656
4432
5920
6269
0
1 000
2 000
3 000
4 000
5 000
6 000
7 000
2002 2003 2004 2005 2006 2007 2008 2009 2010 2011
Source: DG Research and Innovation Data: Directory of Open Access Journals
chaptEr 6: frEE movEmEnt of sciEncE and tEchnology across EuropE and bEyond 286
This considerable expansion of the capacity and actual use of e-infrastructure is partly due to EU funding, but mostly to national funding. In fact, 1.13 % of EU FP-7 budget is devoted to e-infrastructures. EU funding to European e-infrastructures represents 5 % to 10 % of total funding to these infrastructures. The rest is financed by national investments.
Dissemination of science through Open Access
In recent years Open Access (OA) has become an increasingly important tool for the dissemination of knowledge from research to society as shown by the growing number of OA Journals and repositories. OA journals do not differ from the traditional journals in their commitment to peer review or their way of conducting it, but only in their cost-recovery model. The funding model used by OA journals does not charge readers or their institutions for access.
The number of Open Access journals and open-access repositories has increased substantially since 2002, with the highest numbers being recorded in European countries
According to the Directory of Open Access Journals, which covers free, full-text, quality-controlled scientific and scholarly journals, there were 6269 OA journals in March 2011 (Figure II.6.1.). The highest number of Open Access journals can be found in the EU, followed by the United States, Brazil, India, Japan and China.
The increase of OA practice can also be noticed by the growth of the number of repositories (Figure II.6.2.) – the online locus for collecting, preserving, and disseminating the publications in digital form – used for Open Access Self-Archiving.
Yet again the highest number of Open Access repositories can be found in the EU, followed by North America and Asian countries.
FIGURE II.6.1 Number of Open Access journals, 2002-2011

287 analysis | part ii : a European research area open to the world - towards a more efficient research and innovation system
FIGURE II.6.2 Growth of the OpenDOAR Database
Source : DG Research and Innovationhttp://www.opendoar.org
In 2008, about 20 % of peer-reviewed journals worldwide offered Open Access to the reader, a slight increase compared to 2006
Although these indicators show the important growth of OA over last years, they cannot individually make a comprehensive estimation of the penetration ratio of both OA publishing and Self-Archiving practices. To this end, a more significant indicator of the overall growth of the phenomenon could be the proportion of research literature (articles) available in OA form in OA journals and repositories.
Estimations295 show a share of OA in the total number of articles published in peer-reviewed scientific journal articles published worldwide in 2006 (approximately 1 350 000) of 19.4 %, subdivided as follows : 4.6 % immediately openly available, 3.5 % available after a one-year embargo period, and 11.3 % available in subject-specific or institutional repositories or on authors’ home pages.
295 Bo-Christer Bjork et al, Information Research vol. 14 no. 1, March, 2009, ‘Scientific journal publishing : yearly volume and open access availability’. http://informationr.net/ir/14-1/paper391.html

Africa (47) 2%
Australasia (80) 4%
Caribbean (12) 1%
Central America (8)0.4%
South America(106) 6%
Asia (315) 17%
North America (458)24%
Europe (871)46%
Innovation Union Competitiveness Report 2011Source: DG Research and Innovation Data: www.opendoar.org
chaptEr 6: frEE movEmEnt of sciEncE and tEchnology across EuropE and bEyond 288
FIGURE II.6.3 Repositories by world region (total = 1897)
In 2008296, the overall share of OA literature was 20.4 %, of which :
� 8.5 % free at the publishers’ sites (62 % in full
OA journals, 14 % in subscription journals which
make their electronic versions free after a delay,
and 24 % as individually open articles against
payment in otherwise subscription journals).
� 11.9 % free in either subject-based repositories
(43 %), institutional repositories (24 %) or
on the home pages of the authors or their
departments (33 %).
296 Bo-Christer Bjork, Patrik Welling, Peter Majlender, Turid Hedlund, Mikael Laakso, and Gudni Gudnasson, Open Access to the Scientific Journal Literature : Situation 2009.
6.2. is transnational scientific cooperation growing both within Europe and beyond?
In 2008, almost half of world publications were made in transnational cooperation. Intra-EU co-publications increased by almost 10 % between 2003 and 2008.
Figure II.6.4. shows the total number of scientific peer-reviewed publications in the EU, the number of scientific publications in each country (single author and domestic co-publications), the number of scientific publications involving authors in at least two EU Member States, and the number of scientific publications in the EU where at least one author is based outside the EU.
Researchers based in the EU are increasingly integrated in transnational networks, as reflected by the higher growth of the number of transnational co-publications (within EU and with non-EU countries) compared to the growth of scientific publications within single Member States over the period 2003–2008 : in total,

Total EU scientific publications (6%)
Single Member State (5%)
Co-author(s) in at least one non-EU country (8%)(1)
Co-authors in at least two Member States (9%)(1)
Innovation Union Competitiveness Report 2011
0
100 000
200 000
300 000
400 000
500 000
600 000
2003 2004 2005 2006 2007 2008
Num
ber
of
EU
sci
enti
fic
pub
licat
ions
Source: DG Research and Innovation Data: Science Metrix / Scopus (Elsevier)Note: (1) 'EU scientifc publications with co-authors in several Member States and in at least one non-EU country' are included in both of these categories.
289 analysis | part ii : a European research area open to the world - towards a more efficient research and innovation system
FIGURE II.6.4EU collaboration in scientific publications, 2003-2008 ; in brackets : average annual growth rate 2003-2008
EU transnational co-publications represented 33.5 % of all EU publications in 2008, against 30.5 % in 2003, which represents a growth of 9.8 %. A similar trend is visible in the opening up of the EU, with an 8 % increase of co-publications including authors from at least one non-EU Member State. The figures show, therefore, both a greater EU integration in recent years and an increasing openness of EU research towards the rest of the world.
However, with an average annual growth rate of 8 % since 2003, collaboration with non-EU countries has progressed less rapidly than intra-EU cross-border collaboration (average annual growth rate of 9.8 %), a sign of a slightly faster integration of scientific activities within the EU than with the rest of the world. Additionally, extra-EU collaboration also involves some intra-European collaboration, namely collaboration with European non-EU countries.

chaptEr 6: frEE movEmEnt of sciEncE and tEchnology across EuropE and bEyond 290
Major world scientific cooperation still takes place between the EU and the United States. However, the United States has developed a larger scientific cooperation than the EU with all major Asian research-intensive countries. The EU is catching up
Figure II.6.5. shows that transnational activity is increasing between all world regions. In absolute terms, the highest level of scientific collaboration by far takes place between the EU and the United States, with over 435 000 joint publications between 2000 and 2009. Far behind, but growing three times faster, the second strongest collaboration links take place between the United States and China (about 95 000 between 2000 and 2009). US scientific collaborations with Japan and South Korea are also more extensive than those of the EU Member States.
Since 2000, China has increased its scientific collaboration with every country at a very rapid pace. China is, therefore, becoming an international partner of primary importance for scientific collaboration. Although counting 17 % fewer scientific publications than the EU in total in 2000–2009, the United States has had about 46 % more co-publications with China (95 000) than the EU has with China (75 000) since 2000. China is, therefore, a more important partner for the United States than for the EU. However, the collaboration of the EU and the United States with China has progressed at a similar pace (respectively 18.4 % and 19.3 % per year on average). In addition, European countries are rapidly reinforcing their collaboration also with other countries in the world, such as Japan, South Korea and Brazil. Over the period 2000–2009, the EU has increased its scientific cooperation with the research-intensive Asian countries (Japan, South Korea and China) at, on average, 12.8 %, while the United States expanded its scientific cooperation with the same countries by 10.6 % over the same period.
EU Scientific collaboration seems to be centred among Western European countries, both in scale and scope, with a divide between Eastern and Western Europe
Within Europe the highest number of cross-border co-publications is registered, as expected, between countries with the highest number of overall publications, namely the United Kingdom, France, Germany and Italy.
The collaboration is also generally more intense among Western European countries, where yet again both the number of publications and co-publications is highest. In terms of volume of scientific co-publications, the map below shows a relatively weak link between EU-15 and EU-12297 (Figure II.6.6).
As expected, the largest countries have the highest number of cross-border scientific co-publications : the United Kingdom, Germany, France, Italy and Spain. In terms of annual average growth rate between 2000 and 2008, beside small countries (Luxembourg, Malta and Cyprus), the highest growth rates are recorded for Portugal (16.3 %), Ireland (16.2 %), Spain and Slovenia (13.4 % each), Greece (12.8 %), Romania (12.5 %) and Austria (12.1 %) (Table II.6.3).
Researchers from European countries cooperate most frequently with colleagues from large countries, i.e. the United Kingdom, Germany, France, Italy, Spain, and from countries in geographical proximity
Within Europe, researchers from most EU and Associated Countries collaborate intensively with colleagues from large countries, i.e. the United Kingdom (Figure II.6.7), Germany and France, followed by Italy and Spain. The large countries collaborate in absolute terms mostly among themselves, but also with Switzerland (consistently the preferred partner for Germany, France and Italy) and the Netherlands (for Germany, the United Kingdom and Italy). Geographical proximity plays a significant role : for instance there is a preferential collaboration between Belgium and the Netherlands, the Czech Republic and Slovakia. Some countries prefer co-publications with colleagues from bigger-performing (or larger) neighbours : Lithuania is a preferred partner of Latvia, whereas Poland is a preferred partner for Lithuania and Slovakia.
297 These findings from co-publication data are confirmed by the analysis of intra-European mobility flows of researchers and of skilled human resources (see chapter II.4).

291 analysis | part ii : a European research area open to the world - towards a more efficient research and innovation system
FIGURE II.6.5
Scientific co-publications between the EU, the United States, Japan, South Korea, China and Brazil, 2000–2009 (in brackets : average annual growth rates ( %), 2000–2009)
Source : DG Research and InnovationData : Science Matrix / Scopus (Elsevier)Note : The thickness of a link between two countries is proportional to the number of co-publications between these two countries between 2000 and 2009.
13.649(6.3%)
678(24.0%)
9.107(24.0%)
41.694(10.3%)
435.346(6.1%)
13.987(15.0%)
64.516(18.4%)64.604
(4.9%)
2.094(4.0%)
31.20212.7%
95.487(19.3%)
23.136 (10.7%)
190 (14.3%)
74.973 (2.1%)
30885 (13.6%)
(11.4%)
South Korea
Japan
EU United StatesBrazil
China

chaptEr 6: frEE movEmEnt of sciEncE and tEchnology across EuropE and bEyond 292
FIGURE II.6.6 Co-publications(1) between European countries, 2000–2009
Notes : (1) Threshold for a link between two countries : 6 000 co-publications over 2000–2009. The colour of the country indicates its total number of publications over 2000–2009

293 analysis | part ii : a European research area open to the world - towards a more efficient research and innovation system
TABLE II.6.3
2000 2008Average annual growth
( %) 2000-2008
Belgium 4 784 11 071 11.1Bulgaria 734 1 452 8.9Czech Republic 1 928 4 440 11.0Denmark 3 573 7 126 9.0Germany 24 477 48 290 8.9Estonia 268 659 11.9Ireland 1 183 3 937 16.2Greece 1 881 4 924 12.8Spain 7 303 19 927 13.4France 18 622 36 857 8.9Italy 10 889 24 692 10.8Cyprus 96 533 23.9Latvia 175 299 6.9Lithuania 274 669 11.8Luxembourg 52 366 27.6Hungary 2 148 3 298 5.5Malta 21 99 21.4Netherlands 8 020 17 372 10.1Austria 3 123 7 787 12.1Poland 3 970 7 075 7.5Portugal 1 539 5 153 16.3Romania 987 2 540 12.5Slovenia 550 1 507 13.4Slovakia 856 1 798 9.7Finland 2 888 5 902 9.3Sweden 6 434 11 993 8.1United Kingdom 24 188 51 458 9.9
International scientific co-publications
Source : DG Research and InnovationData : Science Metrix / Scopus (Elsevier)
Innovation union Competitiveness report 2011

Innovation Union Competitiveness Report 2011
DE
DE
UK
SE
UK
DE
DE
UK
UK
CZ
DE
FR
UK
DE
DE
FR
DE
DE
FR
DE
UK
UK
FI
UK
UK
UK
DE
UK
EL
DE
UK
DE
DE
UK
FR
SE
UK
DE
SI
FR
DE
SE
DE
IT
DE
ES
FR
UK
DE
SE
FR
UK
FR
DE
FR
SE
DE
DE
FR
UK
FR
UK
SE
IT
UK
UK
FR
UK
DE
DK
FR
IT
IT
FR
DE
UK
UK
IT
FR
UK
FR
BE
FR
IT
NL
UK
SE
CH
DE
FR
FR
DE
IT
DE
DE
FR
DE
FR
IT
IT
IT
FR
NO
IT
UK
NL
DK
FR
FR
AT
UK
DE
IT
IT
UK
UK
UK
DE
SK
FR
IT
UK
IT
IT
IT
ES
ES
IT
UK
NL
BE
FR
NL
NL
DK
DE
NL
FR
ES
IT
IT
PL
FR
ES
IT
ES
AT
IT
PL
ES
IT
IT
NL
NL
FR
NL
ES
NL
CH
CH
FR
LT
ES
IT
CH
Other EU
Other EU
Other EU
Other EU
Other EU
Other EU
Other EU
Other EU
Other EU
Other EU
Other EU
Other EU
Other EU
Other EU
Other EU
Other EU
Other EU
Other EU
Other EU
Other EU
Other EU
Other EU
Other EU
Other EU
Other EU
Other EU
Other EU
Other EU
Other EU
Other EU
Other EU
Other EU
Other EU Other
Other
Other
Other
Other
Other
Other
Other
Other
Other
Other
Other
Other
Other
Other
Other
Other
Other
Other
Other
Other
Other
Other
Other
Other
Other
Other
Other
Other
Other
Other
Other
Other
0 20 40 60 80 100
Israel
Switzerland
Norway
Iceland
Turkey
Croatia
United Kingdom
Sweden
Finland
Slovakia
Slovenia
Romania
Portugal
Poland
Austria
Netherlands
Malta
Hungary
Luxembourg
Lithuania
Latvia
Cyprus
Italy
France
Spain
Greece
Ireland
Estonia
Germany
Denmark
Czech Republic
Bulgaria
Belgium
Source: DG Research and Innovation Data: Science Metrix / Scopus (Elsevier) Note: (1) All EU Member States and IS, NO, CH, HR, TR, IL are covered.
%
chaptEr 6: frEE movEmEnt of sciEncE and tEchnology across EuropE and bEyond 294
FIGURE II.6.7The five main co-publication partners of EU Member States and associated countries(1), 2000-2009

295 analysis | part ii : a European research area open to the world - towards a more efficient research and innovation system
TABLE II.6.4Number of EPO patent applications with at least one inventor residing in the EU, 1995-2006
Source : DG Research and InnovationData : EurostatNote : (1) Values in italics are provisional
1995 1996 1997 1998 1999 2000 2001 2002 2003 2004 2005 2006
Total 31 123 36 142 40 746 44 712 48 822 51 371 50 905 50 648 51 817 54 095 55 287 56 196Single inventor 13 145 15 194 17 166 18 354 20 019 20 245 19 568 19 012 19 475 20 143 20 389 20 356Domestic co-inventors 16 050 18 607 20 855 23 128 25 157 26 889 27 110 27 278 27 871 29 072 29 826 30 661Co-inventors in at least two Member States 961 1 164 1 314 1 617 1 770 2 106 2 144 2 166 2 319 2 378 2 461 2 569Co-inventor(s) in at least one non-EU country 967 1 177 1 411 1 613 1 876 2 131 2 083 2 192 2 152 2 502 2 611 2 610
6.3. is technological cooperation increasing both within Europe and beyond?
International co-patents are increasing – but remain at a very low level
Contrary to the scientific cooperation analysed above, technological cooperation is more closely linked to market exploitation and application of knowledge. During the past two decades, economic globalisation and technological internationalisation have strongly increased, backed up by the possibilities offered by information and telecommunication technologies. Both R&D and technology production are considered key elements in the movement towards opening up and collaborating externally. Collaboration patterns in patenting provide information on how and with whom the technology development process took place, on partnerships, actors and networking. Traditionally, patents are good indicators of the inventiveness of countries or regions, and can provide evidence on technological changes, degrees of specialisation and trends, as well as the role they play in the protection of intellectual assets. More recently, co-patents are being increasingly used either in the context of quantifying university–industry partnerships, or in econometric studies, to measure research and collaboration in the frame of regional innovation systems.
Different studies298 suggest that co-patenting at country level is still dominated by multinational companies. However, many other factors also intervene. Smaller or less-developed countries appear more engaged in developing co-inventive activity than large industrialised countries. Cultural and geographical proximity are important factors for international collaboration in patenting, and countries appear to collaborate more in the technology areas in which they are less specialised.
The incidence of co-patenting is determined by a number of factors such as the environment of the researcher/inventor, the composition of his or her research team, the contractual context in which the research is being performed, the degree of internationalisation of the research institution, the region and country as well as the technological field. Patenting is considered to be associated more with certain sectors than others : the propensity of patenting is generally greater in science-based or high-tech areas.
Table II.6.10 and Figure II.6.8 show that over the period 1995–2006 the number of EPO patent applications in which EU inventors were involved was increasing. Transnationally co-invented patents (covering both EU patents with co-inventors from at least two Member States and EU patents with co-inventors in at least one non-EU country) have been growing at a higher rate (average annual growth rate of 9.35 % and 9.45 %
298 Study prepared for DG RTD by RINDICATE ‘The Impact of Collaboration on Europe’s Scientific and Technological Performance’, Final Report, March 2009 http://ec.europa.eu/invest-in-research/pdf/download_en/final_report_spa2.pdf

Innovation Union Competitiveness Report 2011
0
10 000
20 000
30 000
40 000
50 000
60 000
1995 1996 1997 1998 1999 2000 2001 2002 2003 2004 2005 2006
Single inventor Domestic co-inventors Co-inventors in at least two Member States Co-inventor(s) in at least one non-EU countrySource: DG Research and Innovation
Data: Eurostat
EP
O p
aten
t ap
plic
atio
ns
chaptEr 6: frEE movEmEnt of sciEncE and tEchnology across EuropE and bEyond 296
FIGURE II.6.8Number of EPO patent applications with at least one inventor residing in the EU, 1995-2006
Innovation union Competitiveness report 2011
1995 1996 1997 1998 1999 2000 2001 2002 2003 2004 2005 2006
Total 31 123 36 142 40 746 44 712 48 822 51 371 50 905 50 648 51 817 54 095 55 287 56 196Single inventor 13 145 15 194 17 166 18 354 20 019 20 245 19 568 19 012 19 475 20 143 20 389 20 356Domestic co-inventors 16 050 18 607 20 855 23 128 25 157 26 889 27 110 27 278 27 871 29 072 29 826 30 661Co-inventors in at least two Member States 961 1 164 1 314 1 617 1 770 2 106 2 144 2 166 2 319 2 378 2 461 2 569Co-inventor(s) in at least one non-EU country 967 1 177 1 411 1 613 1 876 2 131 2 083 2 192 2 152 2 502 2 611 2 610

297 analysis | part ii : a European research area open to the world - towards a more efficient research and innovation system
FIGURE II.6.9 PCT patent applications(1) co-inventor abroad, 2007
Note : (1) Patent applications filed under the Patent Cooperation Treaty (PCT), by priority year and inventor’s country of residence.
chaptEr 6: frEE movEmEnt of sciEncE and tEchnology across EuropE and bEyond 298
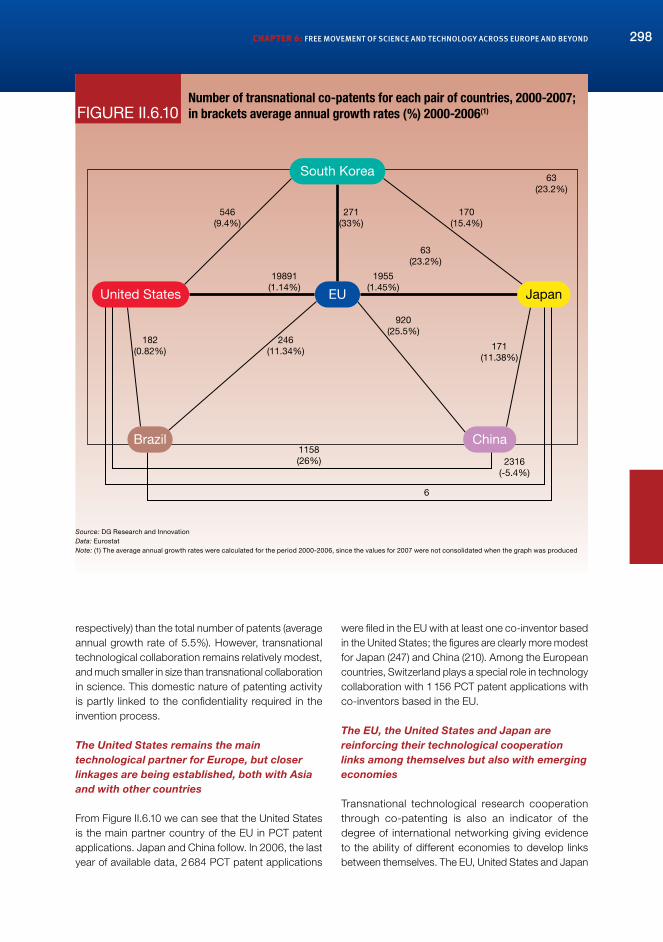
FIGURE II.6.10Number of transnational co-patents for each pair of countries, 2000-2007 ; in brackets average annual growth rates ( %) 2000-2006(1)
Source : DG Research and InnovationData : EurostatNote : (1) The average annual growth rates were calculated for the period 2000-2006, since the values for 2007 were not consolidated when the graph was produced
546(9.4%)
19891(1.14%)
182(0.82%)
246(11.34%)
920(25.5%)
63(23.2%)
171(11.38%)
1158(26%) 2316
(-5.4%)
6
1955(1.45%)
271(33%)
170(15.4%)
63(23.2%)
South Korea
Brazil
EU JapanUnited States
China
respectively) than the total number of patents (average annual growth rate of 5.5 %). However, transnational technological collaboration remains relatively modest, and much smaller in size than transnational collaboration in science. This domestic nature of patenting activity is partly linked to the confidentiality required in the invention process.
The United States remains the main technological partner for Europe, but closer linkages are being established, both with Asia and with other countries
From Figure II.6.10 we can see that the United States is the main partner country of the EU in PCT patent applications. Japan and China follow. In 2006, the last year of available data, 2 684 PCT patent applications
were filed in the EU with at least one co-inventor based in the United States ; the figures are clearly more modest for Japan (247) and China (210). Among the European countries, Switzerland plays a special role in technology collaboration with 1 156 PCT patent applications with co-inventors based in the EU.
The EU, the United States and Japan are reinforcing their technological cooperation links among themselves but also with emerging economies
Transnational technological research cooperation through co-patenting is also an indicator of the degree of international networking giving evidence to the ability of different economies to develop links between themselves. The EU, United States and Japan

299 analysis | part ii : a European research area open to the world - towards a more efficient research and innovation system
are competing to increase their links with emerging economies, such as the case of China and Brazil. Figure II.6.10 illustrates that even if the United States is the main partner for the EU, with a total near 20 000 co-patents, collaboration with South Korea, Brazil and China has been increasing over the years.
In most European countries, the majority of patents come from either domestic or international collaboration
Figure II.6.11 illustrates that for most European countries, with the exception of Cyprus and Malta299, the majority of patents come about via collaboration, either inside the own country or with foreign partners. In most countries, domestic collaboration largely prevails over cross-border collaboration, which remains relatively limited on average in the EU (9.2 % of EPO patent applications were invented in the EU). As expected, cross-border collaboration is much more important in smaller countries and more generally in countries with lower levels of patent inventions in absolute terms. This aspect will be discussed further in this part when showing how these collaborations are translated in networks and specific collaboration patterns.
Of the four larger countries, Germany, France, Italy and the United Kingdom, which together account for more than 75 % of all the EPO patent applications filed in the EU in 2006, the United Kingdom is the most internationalised (12.6 % of the UK inventions submitted to the EPO have a co-inventor abroad), followed by France (9.3 %) and Germany (7.5 %).
The analysis of data on co-patents can improve the understanding of transnational knowledge flows, especially if we consider the overall specialisation of the different countries in some sectors and technology areas. Despite the relatively small size of Switzerland, this country appears as the first partner in absolute terms for Germany and France, ahead of larger countries like the United Kingdom or Italy (Figure II.6.12). This may be due to the intensive cross-border patenting activity of Swiss multi-national enterprises but also of Swiss higher education institutions. The map also shows that two dimensions have a strong influence on the level of inter-country technology collaboration : the size of the country and its technology development.
299 These exceptions are due to the dimension of the research systems and the lack of critical mass in these countries.
However, innovation leadership is not particularly related to its propensity to collaborate. Smaller or less-developed countries appear to cooperate relatively more in technology development than large research-intensive countries.
For the majority of EU Member States, the transnational co-patenting takes place predominantly with other EU partners
Figure II.6.13. shows the predominance of EU co-inventors for the majority of the EU Member States, in particular smaller countries. Only Ireland and the United Kingdom (as well as Iceland and Israel) show an opposite pattern, giving preference to technology collaboration with partners located in countries outside of the EU. It is worth noting that among the non-EU partners for EU Member States, Switzerland is one of the prominent partners for joint technology development besides the United States. It is also worth mentioning that, according to different studies300, collaboration in the co-patenting is based on intensive, consolidated, face-to-face and long-lasting relationships.
A high relevance of intra-EU co-patenting is only observed in a few Member States, occurring more frequently in border areas. Extra-EU co-patenting is not a dominant feature in most countries, with the exception of the United Kingdom and Ireland, due to their links with the United States, and Latvia and Poland for the same reason in relation with Russia.
300 See for example ‘The Impact of Collaboration on Europe’s Scientific and Technological Performance’, Final Report, March 2009 http://ec.europa.eu/invest-in-research/pdf/download_en/final_report_spa2.pdf

Innovation Union Competitiveness Report 2011
5.0
5.1
6.9
7.4
7.5
8.2
8.5
9.1
9.2
9.3
9.3
10.0
10.3
11.0
12.0
12.6
13.2
14,0
14.3
15.2
16.5
18.1
18.8
18.8
19.9
20.6
20.7
21.3
24.7
25.8
31.7
32.7
33.5
35.5
48.4
50.4
45.3
72.4
27.0
58.9
62.4
58.2
54.6
54.6
57.9
50.3
46.8
50.0
46.9
48.9
40.5
67.4
34.3
40.5
52.3
46.6
55.0
49.8
41.8
52.0
42.2
49.2
59.3
45.5
20.7
42.3
44.5
49.6
20.7
65.6
33.6
29.4
91.5
32.7
36.2
36.1
32.8
39.7
42.9
39.0
41.1
38.5
46.3
18.7
51.4
44.2
31.2
81.9
34.6
26.2
30.3
37.7
27.3
36.5
26.1
.
14.8
22.8
46.6
.
24,2
43.3
44.76.9
21.2
Turkey
Italy
Lithuania
Greece
Germany
Israel
Malta
Netherlands
EU
Finland
France
Sweden
Denmark
Spain
Norway
United Kingdom
Austria
Slovenia
Iceland
Bulgaria
Poland
Cyprus
Czech Republic
Ireland
Belgium
Switzerland
Hungary
Portugal
Croatia
Estonia
Slovakia
Romania
Latvia
Luxembourg
Liechtenstein
% of patents in the declaring country
International co-patents (2) Domestic co-patents (3) Single inventor patents
Source: DG Research and Innovation Data: Eurostat Notes: (1) EPO patent applications by country of residence of the inventor(s). (2) International co-patents are co-patents with at least one inventor based in another country. (3) Domestic co-patents are co-patents only involving inventor(s) based in the declaring country.
0 20 40 60 80 100
chaptEr 6: frEE movEmEnt of sciEncE and tEchnology across EuropE and bEyond 300
FIGURE II.6.11 International and domestic co-patents(1), 2006

301 analysis | part ii : a European research area open to the world - towards a more efficient research and innovation system
FIGURE II.6.12EPO patent applications with co-inventor(s) in other European countries, 2007

Source: DG Research and Innovation Data: Eurostat Notes: (1) EPO patent applications by country of residence of the inventor(s). (2) International co-patents are co-patents with at least one inventor based in another country. (3) Domestic co-patents are co-patents only involving inventor(s) based in the declaring country.
Innovation Union Competitiveness Report 2011
0
5
10
15
20
25
30
35
40
45
Co-patents involving inventor(s)from the declaring country and
from at least one EU Member State (3)
Co-patents involving inventor(s) fromthe declaring country and from atleast one non-EU country (3)
Liec
hten
stei
n
Luxe
mb
our
g
Slo
vaki
a
Ro
man
ia
Lith
uani
a (1
)
Est
oni
a
Cro
atia
Latv
ia
Po
rtug
al
Sw
itze
rlan
d
Hun
gar
y
Bel
giu
m
Cze
ch R
epub
lic
Bul
gar
ia
Slo
veni
a
Po
land
Aus
tria
Cyp
rus
No
rway
Irel
and
Mal
ta
Sp
ain
Den
mar
k
Icel
and
Finl
and
Sw
eden
Net
herl
and
s
Uni
ted
Kin
gd
om
Fran
ce EU
Gre
ece
Ger
man
y
Ital
y
Tur
key
Isra
el
Source: DG Research and Innovation Data: Eurostat Notes: (1) EPO patent applications by country of residence of the inventor(s). (2) LT: 2005. (3) The two categories are not mutually exclusive.
% o
f to
tal p
aten
ts in
the
dec
lari
ng c
oun
try
chaptEr 6: frEE movEmEnt of sciEncE and tEchnology across EuropE and bEyond 302
FIGURE II.6.13 Co-patents(1) involving EU and non-EU countries, 2006(2)

LithuaniaSlovakia EstoniaSlovenia Hungary
Czech Republic
BulgariaPortugalRomaniaGreeceCyprus FinlandGermany
United Kingdom
AustriaSweden BelgiumLuxembourg
DenmarkNetherlandsInnovation Union Competitiveness Report 2011
EU
(2)
Uni
ted
Sta
tes
Jap
an
Chi
na
So
uth
Ko
rea
Aus
tral
ia
Can
ada
Ind
ia
Bra
zil
Rus
sian
Fed
erat
ion
Sin
gap
ore
Chi
nese
Tai
pei
0
10
20
30
40
50
60
70
2007 2000Source: DG Research and Innovation Data: OECD Notes: (1) The share of domestic EPO patent applications owned by foreign residents. The patents count is based on the priority date and the inventor's country of residence. (2) The EU is treated as one entity.
%
303 analysis | part ii : a European research area open to the world - towards a more efficient research and innovation system
6.4. are European countries absorbing technologies produced abroad?
As knowledge production becomes more distributed in the growing multi-polar world of science and technology, international trade in technologies expands. Knowledge produced in one country is increasingly used and commercialised in another country. Given Europe’s shrinking share of world science and technology production, transnational spillover and absorption of knowledge produced outside Europe becomes more important. This is also an important dimension of a European single market for knowledge.
Cross border ownership of patents is increasing
Another indicator on international flows of patents and technologies is based on the distinction between the inventor of a patent and the owner/applicant of a patent.
The globalisation of the production of knowledge is reflected in an increasing share of patent applications owned or co-owned by applicants whose country of residence is different from the country of residence of the inventors301. Cross-border ownership is often not linked to international cooperation between firms situated in different countries. It is mainly the result of the activities of multinationals : the applicant is a conglomerate and the inventors are employees of a foreign subsidiary. Nevertheless, patent data provides a proxy to track the international flow from ‘inventor’ countries to ‘applicant’ countries. This analysis concerns patent applications to the EPO. In 2006, on average 17.6 % of all inventions filed at the EPO were owned or co-owned by a foreign resident, compared to 16.3 % in 2000 and 10 % in 1990.
301 Patent documents specify the inventor(s) and the applicant(s) – the owner of the patent at the time of application – together with their country (or countries) of residence. In most cases the applicant is an institution (either a firm, university, public laboratory) but can also be an individual.
FIGURE II.6.14 Foreign ownership ( %) of domestic inventions(1), 2007

Source: DG Research and Innovation Data: OECD Notes: (1) The share of domestic EPO patent applications owned by foreign residents. The patents count is based on the priority date and the inventor's country of residence. (2) The EU is treated as one entity. Innovation Union Competitiveness Report 2011
EU
(2)
Uni
ted
Sta
tes
Jap
an
Chi
na
So
uth
Ko
rea
Aus
tral
ia
Can
ada
Ind
ia
Bra
zil
Rus
sian
Fed
erat
ion
Sin
gap
ore
Chi
nese
Tai
pei
2007 2000
0
10
20
30
40
50
60
%
Source: DG Research and Innovation Data: OECDNotes: (1) The number of EPO patent applications owned by country residents but invented abroad as % of total EPO patent applications owned by country residents. The patents count is based on the priority date and the inventor's country of residence. (2) The EU is treated as one entity.
chaptEr 6: frEE movEmEnt of sciEncE and tEchnology across EuropE and bEyond 304
FIGURE II.6.15 Domestic ownership ( %) of foreign inventions(1), 2007
Patents originating in the EU are increasingly owned by non-EU firms
Given that the share of world patents coming from the EU has been decreasing over the years, it is important for EU companies to be able to absorb inventions made abroad and to take part in the expanding transnational knowledge-development chains. However, evidence shows the reverse trend. EU ownership of non-EU inventions is less frequent than the ownership of EU inventions by non-residents, and the gap is growing.
Comparing Figure II.6.14 and II.6.15 below, we see that of all the patents from the EU, the share of patents owned outside the EU (12.4 % in 2007, compared with 12.3 % in 2000), is higher than the share of non-EU patents which are owned in the EU (9.5 % in 2007 compared with 8.7 % in 2000). The same situation can be observed in countries like Australia, Canada, India
and the Russian Federation. On the contrary, foreign inventions represent a bigger share of the total number of US-owned patents than in EU-owned patents. In 2007, 18.6 % of all US-owned patents were inventions made abroad (a slight increase compared to 2000), which is more than the share of US inventions owned outside the United States. Japan and South Korea are good examples of the opposite situation : both are countries in which residents rarely own foreign inventions. The situation in China is particular but interesting, illustrating its economic consolidation. China changes from having a large share of patents invented abroad to having a growing capacity of domestic inventions : in 2000, 29.1 % of all domestically owned patents were invented abroad, changing to only 11.8 % in 2007. China also seems able to absorb a larger part of its domestic inventions, shifting over the six-year period from over 50 % to less than 35 % of domestic inventions being owned by foreign firms.

Innovation Union Competitiveness Report 2011
0 20 40 60 80 100
Turkey (9.8)
Finland (15.8)
Germany (17.4)
Italy (21.1)
Israel (21.9)
Sweden (22.0)
Denmark (22.1)
France (23.2)
Slovenia (25.2)
Netherlands (26.8)
Switzerland (29.3)
Spain (30.1)
Norway (38.5)
Greece (38.8)
Ireland (39.0)
United Kingdom (39.5)
Austria (40.3)
Belgium (44.2)
Portugal (44.2)
Poland (45.7)
Luxembourg (46.2)
Czech Republic (48.7)
Hungary (56.7)
EU United States Japan Other countries
Source: DG Research and Innovation Data: OECDNotes: (1) Domestic EPO patent applications owned by foreign residents. The patents count is based on the priority date and the inventor's country of residence. (2) In the cases of EU Member States, EU refers to all Member States except the Member State under consideration.
%
305 analysis | part ii : a European research area open to the world - towards a more efficient research and innovation system
FIGURE II.6.16Foreign ownership of domestic inventions(1), 2007 ; in brackets : the share ( %) of domestic patent applications owned by foreign residents

Innovation Union Competitiveness Report 2011
EU United States Japan Other countries
0 20 40 60 80 100
Turkey (4.8)
Italy (5.8)
Poland (7.7)
Israel (11.3)
Spain (11.8)
Slovenia (12.6)
Germany (15.5)
Hungary (16.1)
Czech Republic (17.2)
United Kingdom (18.6)
Austria (20.1)
France (21.0)
Denmark (21.5)
Norway (25.4))
Sweden (33.0)
Netherlands (38.5)
Belgium (39.2)
Finland (40.1)
Ireland (50.4)
Switzerland (56.5)
Luxembourg (92.6)
Liechtenstein (97.6)
Source: DG Research and Innovation Data: OECDNotes: (1) The number of EPO patent applications owned by country residents but originating abroad as % of total EPO patent applications owned by country residents. The patents count is based on the priority date and the inventor's country of residence. (2) In the cases of EU Member States, EU refers to all Member States except the Member State under consideration.
%
chaptEr 6: frEE movEmEnt of sciEncE and tEchnology across EuropE and bEyond 306
FIGURE II.6.17Domestic ownership of foreign inventions(1), 2007 ; in brackets : the share ( %) of domestic patent applications originating abroad

Total number of EU co-patents with Japanese Inventors in the EU
Source: DG Research and InnovationData: Regional Key Figures
0 - < 1
1 - < 5
5 - < 10
10 - 16
307 analysis | part ii : a European research area open to the world - towards a more efficient research and innovation system
FIGURE II.6.18 Total number of EU co-patents with Japanese Inventors
Note : ‘Co-patents’ refers to Patent Applications at the EPO, localised by residence of inventor Source : Regional Key Figures, based on EPO Worldwide Patent Statistical Database (PATSTAT) ; regionalisation by means of OECD REGPAT ; Map Basis Eurostat

Total number of EU co-patents with US-American Inventors in the EU
Source: DG Research and Innovation
0 - < 5
5 - < 10
10 - < 20
20 - 48
Data: Regional Key Figures
chaptEr 6: frEE movEmEnt of sciEncE and tEchnology across EuropE and bEyond 308
FIGURE II.6.19 Total number of EU co-patents with US inventors
Note : ‘Co-patents’ refers to Patent Applications at the EPO, localised by residence of inventorSource : Regional Key Figures, based on EPO Worldwide Patent Statistical Database (PATSTAT) ; regionalisation by means of OECD REGPAT ; Map Basis Eurostat

309 analysis | part ii : a European research area open to the world - towards a more efficient research and innovation system
FIGURE II.6.20 Perceived Firm-level Technology Absorption, 2009
Note : Averages ; Question : Companies in your country are (1= not able to absorb new technologies ; 7 = aggressive in absorbing new technologies)

chaptEr 6: frEE movEmEnt of sciEncE and tEchnology across EuropE and bEyond 310
The flow of patents and inventions is more intense within Europe, indicating the existence of a European area for technology development
Figures II.6.16 and II.6.17 confirm the trend already observed for the period 1998–2003302: European inventions and patents flow predominantly within Europe. Foreign ownership of inventions in EU countries is largely intra-European and more evident in smaller countries, like Hungary, Portugal, Austria, Finland or Slovenia ; ownership of US inventions is more frequent for Luxembourg, Ireland, Turkey and Israel, and in a lesser degree, also for the United Kingdom.
Similar findings can be seen for the domestic ownership of foreign inventions. For a majority of the European countries, foreign inventions originated in another EU country are registered in over 60 % of cases.
The capacity to absorb technologies produced outside the EU is concentrated in a few regions
Co-patenting with third countries can also be a measured at the regional level as an indicator of the technology absorption capacity of a region. The following two maps (Figure II.6.18 and Figure II.6.19) show the total number of co-patents among EU regions with inventors from the United States or Japan. The maps illustrate that it is broadly the same regions that absorb technologies from the United States and from Japan, even though the total number of co-patents with US inventors is higher. Patterns of regional knowledge-absorption coincide mainly with the capacity of the regions to produce knowledge, with the exception of some regions in Sweden, Finland and Italy. Regions in the United Kingdom, Belgium, the Netherlands and western Germany are the largest technology absorbers in technology collaboration with co-inventors from the United States and Japan.
302 See European Science, Technology and Competitiveness report 2008/2009.
The perception of firm-level technology absorption is highest among firms in the Nordic countries, Austria and Germany
The indicator on the perception of technology absorption by firms gives an estimation of the ease with which companies in a given country incorporate new technologies. Evidence shows that firms perceive highest technology absorption in strong technology producers.
Related Documents