CHAPTER 6 BIRD DISTRIBUTION, ABUNDANCE AND HABITAT USE by Klaus O. Richter and Amanda L. Azous INTRODUCTION Values and natural functions of wetlands gained growing recognition in the 1970s (Good et al. 1978, Greeson et al. 1979). Consequently, wetlands and are now considered sensitive habitats with diverse functions that are protected at federal, state and local levels. Of the many functions wetlands exhibit, their ability to provide resting, feeding and breeding habitat for a wide diversity of birds is among the most noticeable and appreciated. Abundant, often highly visible and unique avifauna are an important component of open space values, enriching quality of life. Despite these attributes, many hectares of marshes, swamps and other bird habitats are lost or impacted each year, in part due to our inadequate knowledge of how to protect the biologic function of wetlands. Birds have been intensively studied in deciduous forests of east-central states (Blake and Karr 1984, Blake 1986), west coast coniferous forests (Artman 1990, Stofel 1993) and in other upland environments. Birds of coastal wetlands have also been widely studied (Craig and Beal 1992, Weller 1994). Fresh water wetland investigations, however, have been carried out by a relatively few biologists, who primarily documented the distribution and abundance of waterfowl and other marsh birds within pothole lakes and other wetlands in open landscapes of the Central Flyway (Weller and Spatcher 1965, Weller and Fredrickson 1974, Weller 1979). Although the importance of riparian corridors to avifauna, particularly passerines, woodpeckers and other non-game species has more recently been recognized (Brown and Dinsmore 1986, Knopf and Samson 1994), the avifauna of freshwater wetlands, specifically smaller palustrine wetlands distributed through forested landscapes, has not been well documented. The purpose of this paper is to comprehensively describe palustrine wetland bird communities in the Lower Puget Sound Basin. The avifaunal literature is briefly reviewed to determine the uniqueness of palustrine wetland avifauna in a regional and landscape context. Then, we assess whether generalized landscape characteristics that account for bird distributions and abundances in upland ecosystems apply to predicting bird distributions within palustrine wetlands of the Northwest. We examined the diversity and proportional abundance of birds within the regional context of differing land use and the site-specific wetland attributes of size and vegetation structure, thereby building on the preliminary findings of Azous (1991) and Martin-Yanny (1992). The location, physical, chemical and vegetative description of the wetlands in this study are presented in Section 1 and Chapters 1, 2, and 3 of Section 2. METHODS The distribution and relative abundance of birds was determined based on surveys completed during the breeding period from late May to mid-June in 1988, 1989, 1991, 1992 and 1995. Birds were identified by non-territorial calls, territorial song, pecking and drumming, visual sightings and flyovers during 15-minute point counts (Johnston 1990, Verner 1985) at permanent census stations. Usually, four ornithologists surveyed each 0BCHAPTER 6 BIRD DISTRIBUTION, ABUNDANCE AND HABITAT USE 111

Welcome message from author
This document is posted to help you gain knowledge. Please leave a comment to let me know what you think about it! Share it to your friends and learn new things together.
Transcript
CHAPTER 6 BIRD DISTRIBUTION, ABUNDANCE AND HABITAT USE
by Klaus O. Richter and Amanda L. Azous
INTRODUCTION Values and natural functions of wetlands gained growing recognition in the 1970s (Good et al. 1978, Greeson et al. 1979). Consequently, wetlands and are now considered sensitive habitats with diverse functions that are protected at federal, state and local levels. Of the many functions wetlands exhibit, their ability to provide resting, feeding and breeding habitat for a wide diversity of birds is among the most noticeable and appreciated. Abundant, often highly visible and unique avifauna are an important component of open space values, enriching quality of life. Despite these attributes, many hectares of marshes, swamps and other bird habitats are lost or impacted each year, in part due to our inadequate knowledge of how to protect the biologic function of wetlands.
Birds have been intensively studied in deciduous forests of east-central states (Blake and Karr 1984, Blake 1986), west coast coniferous forests (Artman 1990, Stofel 1993) and in other upland environments. Birds of coastal wetlands have also been widely studied (Craig and Beal 1992, Weller 1994). Fresh water wetland investigations, however, have been carried out by a relatively few biologists, who primarily documented the distribution and abundance of waterfowl and other marsh birds within pothole lakes and other wetlands in open landscapes of the Central Flyway (Weller and Spatcher 1965, Weller and Fredrickson 1974, Weller 1979). Although the importance of riparian corridors to avifauna, particularly passerines, woodpeckers and other non-game species has more recently been recognized (Brown and Dinsmore 1986, Knopf and Samson 1994), the avifauna of freshwater wetlands, specifically smaller palustrine wetlands distributed through forested landscapes, has not been well documented.
The purpose of this paper is to comprehensively describe palustrine wetland bird communities in the Lower Puget Sound Basin. The avifaunal literature is briefly reviewed to determine the uniqueness of palustrine wetland avifauna in a regional and landscape context. Then, we assess whether generalized landscape characteristics that account for bird distributions and abundances in upland ecosystems apply to predicting bird distributions within palustrine wetlands of the Northwest. We examined the diversity and proportional abundance of birds within the regional context of differing land use and the site-specific wetland attributes of size and vegetation structure, thereby building on the preliminary findings of Azous (1991) and Martin-Yanny (1992). The location, physical, chemical and vegetative description of the wetlands in this study are presented in Section 1 and Chapters 1, 2, and 3 of Section 2.
METHODS The distribution and relative abundance of birds was determined based on surveys completed during the breeding period from late May to mid-June in 1988, 1989, 1991, 1992 and 1995. Birds were identified by non-territorial calls, territorial song, pecking and drumming, visual sightings and flyovers during 15-minute point counts (Johnston 1990, Verner 1985) at permanent census stations. Usually, four ornithologists surveyed each
0BCHAPTER 6 BIRD DISTRIBUTION, ABUNDANCE AND HABITAT USE 111
wetland totaling one hour per station. Surveys commenced one half-hour after sunup to approximately 9:00 am and stations were surveyed in alternating order to minimize time biases.
We calculated the gamma diversity, the collective species identified across all wetlands (a landscape metric) and alpha diversity, the species identified at a single wetland (a site metric) (Whittaker 1975) by summing the number of species. We calculated all diversity measures only including species observed two or more times. Because alpha diversity measures are insensitive to bird species composition, we calculated diversity indices for birds with specific breeding habitats, versatility ratings, residency traits, and urbanization affinities. This paper reports on some of the more general overall diversity metrics analyzed to date.
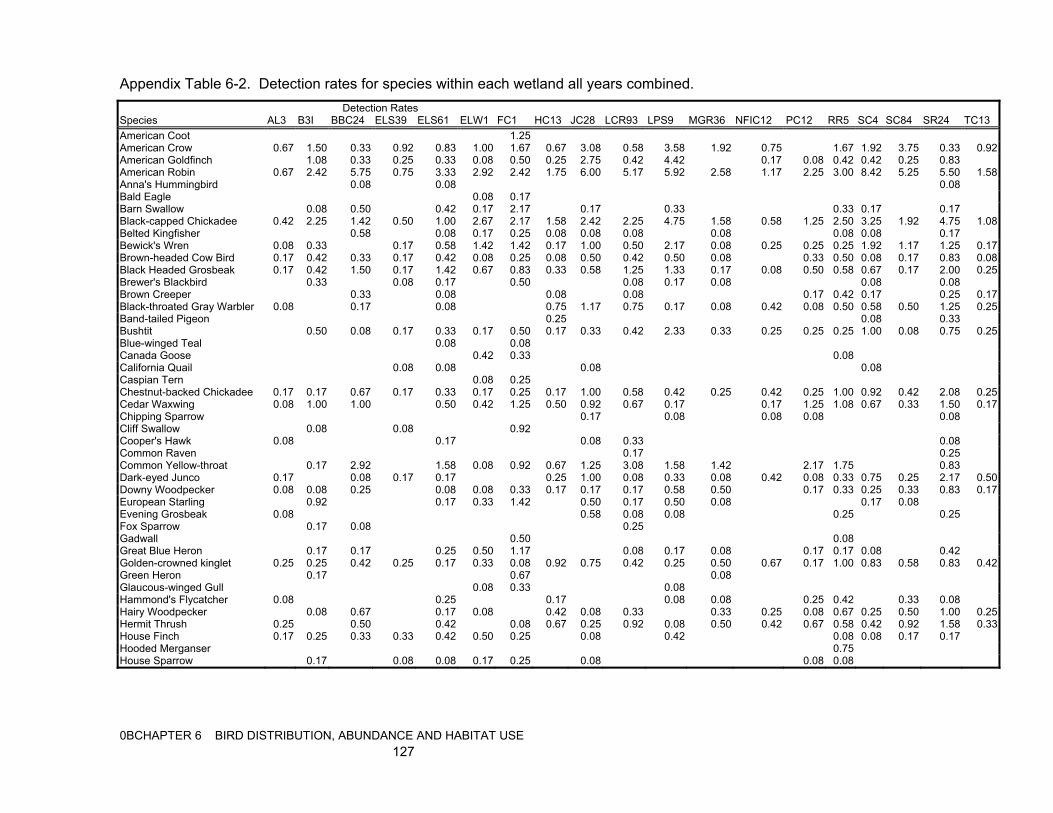
We estimated relative abundances for each species at a wetland using average detection values calculated by dividing the total number of a species sighted at a wetland (derived by combining 15-minute station totals into a 1-hour station total and then combining station totals) by the total number of 15-minute observation periods at a wetland. Using this detection value we standardized the data among wetlands with unequal sampling effort (e.g., more stations and hence more time at large wetlands).
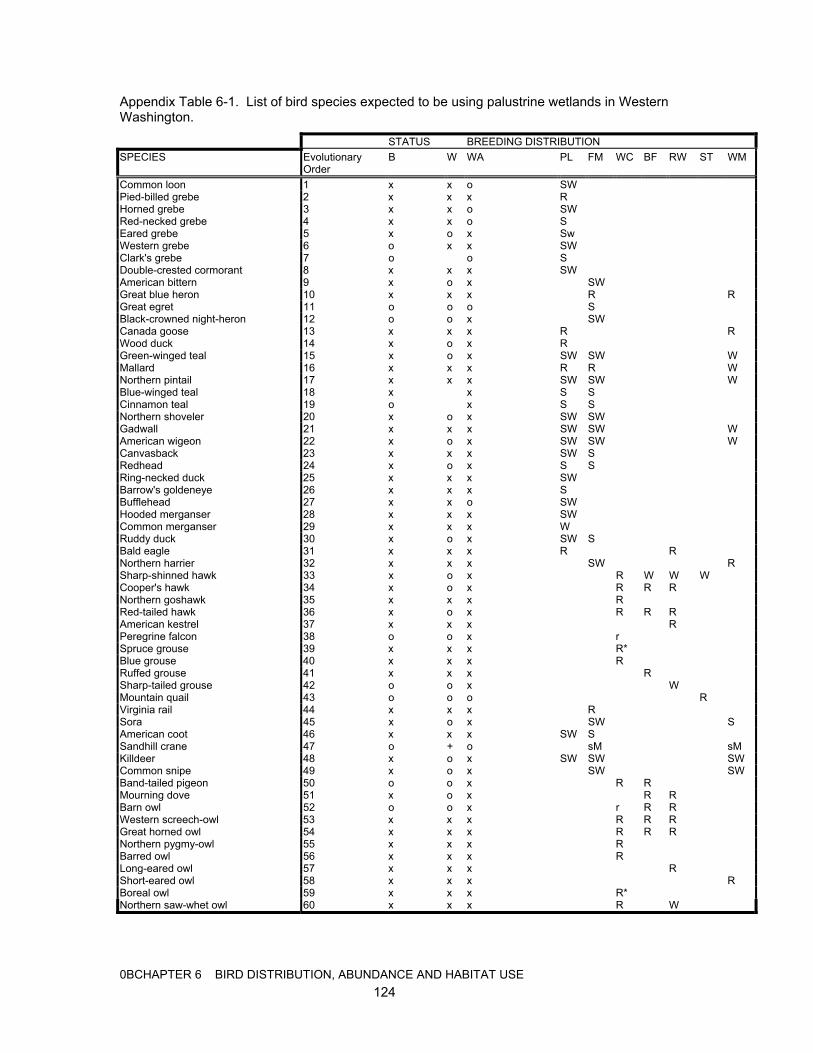
We relied on Paulson (1992) to identify total species potentially occurring in palustrine wetlands habitats (Appendix Table 6-1) of the Puget Sound Basin. Species were classified as common residents, rare residents, or migrants according to abundance ratings provided in Hunn (1982). Habitat versatility ratings for bird species were obtained from Brown (1985) and represent the sum total of the number of plant communities and stand conditions used for breeding plus the number of plant communities and stand conditions used for feeding by a species.
Bird preferences for National Wetlands Inventory (NWI) wetland habitat classes (Cowardin et al. 1979) identified at each wetland were converted to habitat preferences identified in Paulson (1992) as follows: open water/unconsolidated bottom = ponds and lakes; emergent wetland, persistent = fresh [water] marsh; forested wetland, needle-leaved evergreen = wet coniferous forest; forested wetland, broad-leaved deciduous = riparian woodland; emergent wetland, nonresistant = wet lowland meadow; scrub-shrub =shrub thickets, and unconsolidated shore. Alpha and gamma diversities within the study wetlands were compared against the potential species richness documented in the Lower Puget Sound Basin that were known to occur in these respective habitats. Habitat land cover and fragmentation was determined by quantifying land cover within 1000 m using remote sensing methods and a geographic information system.
Statistical analysis of correlations and hypothesis testing utilized parametric statistics when assumptions of normality were met and non-parametric statistics when assumptions were violated. We chose P < 0.05, and P >0.05 and ≤ 0.10 with r ≥ 0.4 as significant and weakly significant, respectively. Nevertheless, significance should be interpreted cautiously because of the high variability of the data and concomitantly unacceptably wide confidence intervals for predictive level of significance. This is due to the low number of replicates (e.g., wetlands undergoing significant impacts) and discontinuities in habitat characteristics (e.g., unequal representation of all wetland size classes, etc.).
0BCHAPTER 6 BIRD DISTRIBUTION, ABUNDANCE AND HABITAT USE 112
RESULTS
Regional Species Richness (Beta Diversity) A total of 94 species were identified and sighted on at least two or more occasions among all the wetlands (Table 6-1). This total wetland diversity of 94 species represents only 59% of the 158 species that could be expected to use habitats found at wetlands in the Lower Puget Sound Basin (Paulson 1992) (Appendix Table 6-1). This diversity, however, is significantly higher than the 56 species found by Stofel (1993), the 23 species identified by Artman (1990) in rural upland second-growth forest, and the 48 species by Gavareski (1976) in urban park environments. All the species identified in these studies were identified at our surveyed wetlands, with the exception of great horned owl, Northern harrier, Northern rough-winged swallow, luzuli bunting, and turkey vulture as well as a few high elevation species such as gray jay, blue grouse, golden-crowned sparrow.
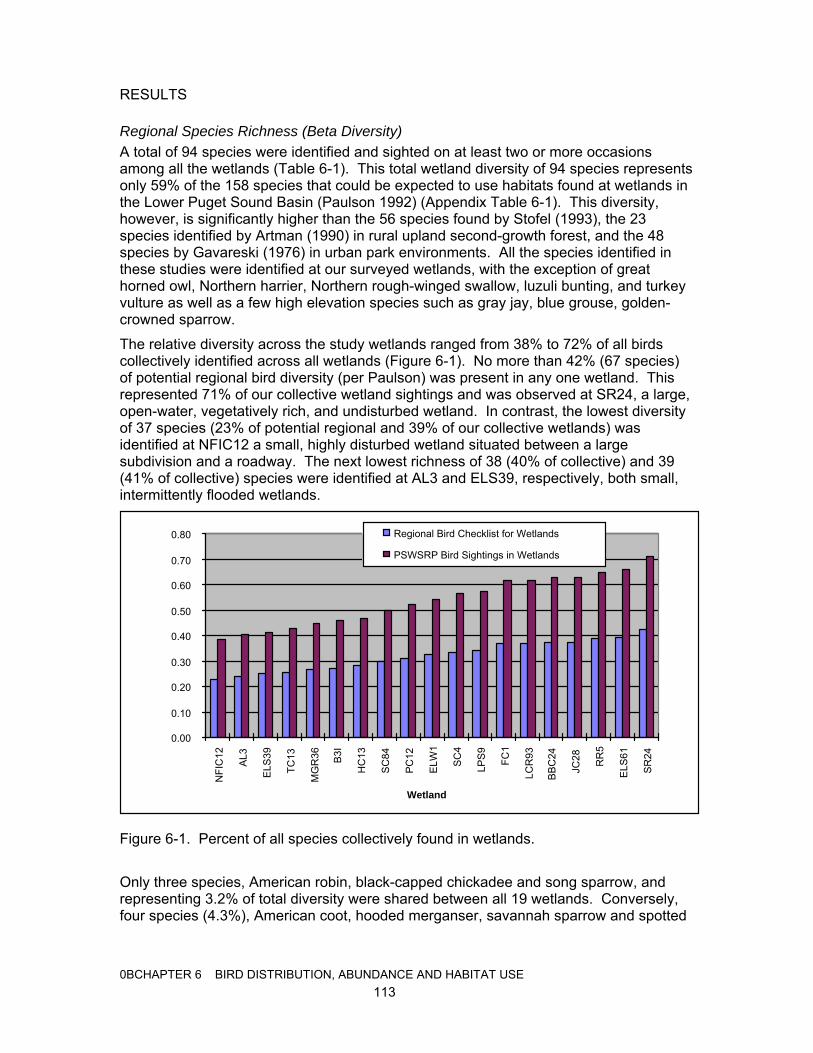
The relative diversity across the study wetlands ranged from 38% to 72% of all birds collectively identified across all wetlands (Figure 6-1). No more than 42% (67 species) of potential regional bird diversity (per Paulson) was present in any one wetland. This represented 71% of our collective wetland sightings and was observed at SR24, a large, open-water, vegetatively rich, and undisturbed wetland. In contrast, the lowest diversity of 37 species (23% of potential regional and 39% of our collective wetlands) was identified at NFIC12 a small, highly disturbed wetland situated between a large subdivision and a roadway. The next lowest richness of 38 (40% of collective) and 39 (41% of collective) species were identified at AL3 and ELS39, respectively, both small, intermittently flooded wetlands.
0.00
0.10
0.20
0.30
0.40
0.50
0.60
0.70
0.80
NFI
C12
AL3
ELS
39
TC13
MG
R36 B3I
HC
13
SC
84
PC
12
ELW
1
SC
4
LPS
9
FC1
LCR
93
BB
C24
JC28 RR
5
ELS
61
SR
24
Wetland
Regional Bird Checklist for Wetlands
PSWSRP Bird Sightings in Wetlands
Figure 6-1. Percent of all species collectively found in wetlands.
Only three species, American robin, black-capped chickadee and song sparrow, and representing 3.2% of total diversity were shared between all 19 wetlands. Conversely, four species (4.3%), American coot, hooded merganser, savannah sparrow and spotted
0BCHAPTER 6 BIRD DISTRIBUTION, ABUNDANCE AND HABITAT USE 113

sandpiper were found in only one wetland. Interestingly, 47 species (50% of total) were found in 53% or more of the wetlands.
Migrants accounted for 37% of species (35). Common and rare residents respectively numbered 17 and 42 species and comprised 18% and 45% of sightings thus significantly enhancing the diversity of wetland avifauna. Many residents were species of adjacent terrestrial habitats using wetlands to drink, augment diet, and support their young.
During the study period the observations of thirteen species declined including two rare residents, orange-crowned warbler and red crossbill. Nine other rare resident species showed no change and six weren’t observed in sufficient numbers to determine. Forty-nine percent of species showed no change in population and ten species increased. We did not have enough observations of 25 species to determine changes in population status.
The observations of birds known to avoid suburban and urban development both declined and increased depending on species. Three avoiders declined including orange-crowned warbler, varied thrush and willow flycatcher while two increased, black-throated gray warbler and Swainson’s thrush. Seven species known to be adaptable to urbanization increased while nine declined.
Species Richness by Wetland (Alpha Diversity) Species richness varied widely within wetlands over the study period (Figure 6-2). Species richness for all years was higher because different species were observed in different years. We saw the highest richness in 1989 in virtually all wetlands and the lowest in the last year of our research, 1995.
0BCHAPTER 6 BIRD DISTRIBUTION, ABUNDANCE AND HABITAT USE 114
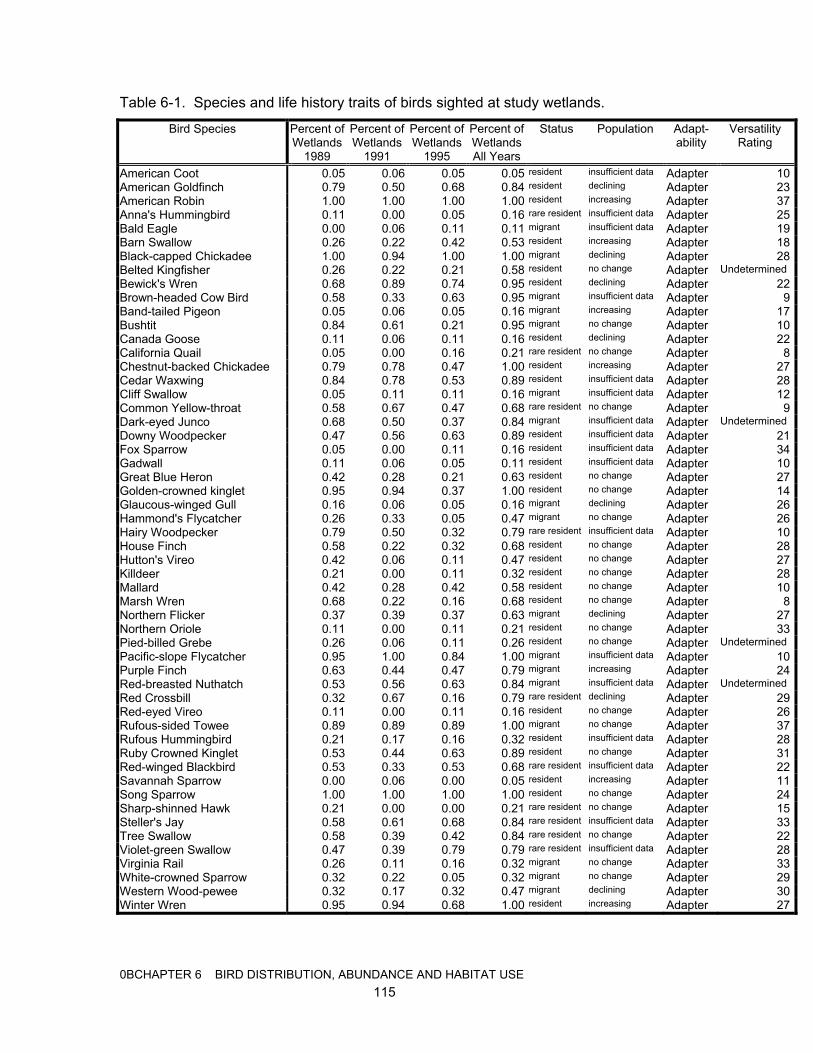
Table 6-1. Species and life history traits of birds sighted at study wetlands.
Bird Species Percent of Wetlands
1989
Percent of Wetlands
1991
Percent of Wetlands
1995
Percent of Wetlands All Years
Status Population Adapt-ability
Versatility Rating
American Coot 0.05 0.06 0.05 0.05 resident insufficient data Adapter 10American Goldfinch 0.79 0.50 0.68 0.84 resident declining Adapter 23American Robin 1.00 1.00 1.00 1.00 resident increasing Adapter 37Anna's Hummingbird 0.11 0.00 0.05 0.16 rare resident insufficient data Adapter 25Bald Eagle 0.00 0.06 0.11 0.11 migrant insufficient data Adapter 19Barn Swallow 0.26 0.22 0.42 0.53 resident increasing Adapter 18Black-capped Chickadee 1.00 0.94 1.00 1.00 migrant declining Adapter 28Belted Kingfisher 0.26 0.22 0.21 0.58 resident no change Adapter Undetermined Bewick's Wren 0.68 0.89 0.74 0.95 resident declining Adapter 22Brown-headed Cow Bird 0.58 0.33 0.63 0.95 migrant insufficient data Adapter 9Band-tailed Pigeon 0.05 0.06 0.05 0.16 migrant increasing Adapter 17Bushtit 0.84 0.61 0.21 0.95 migrant no change Adapter 10Canada Goose 0.11 0.06 0.11 0.16 resident declining Adapter 22California Quail 0.05 0.00 0.16 0.21 rare resident no change Adapter 8Chestnut-backed Chickadee 0.79 0.78 0.47 1.00 resident increasing Adapter 27Cedar Waxwing 0.84 0.78 0.53 0.89 resident insufficient data Adapter 28Cliff Swallow 0.05 0.11 0.11 0.16 migrant insufficient data Adapter 12Common Yellow-throat 0.58 0.67 0.47 0.68 rare resident no change Adapter 9Dark-eyed Junco 0.68 0.50 0.37 0.84 migrant insufficient data Adapter Undetermined Downy Woodpecker 0.47 0.56 0.63 0.89 resident insufficient data Adapter 21Fox Sparrow 0.05 0.00 0.11 0.16 resident insufficient data Adapter 34Gadwall 0.11 0.06 0.05 0.11 resident insufficient data Adapter 10Great Blue Heron 0.42 0.28 0.21 0.63 resident no change Adapter 27Golden-crowned kinglet 0.95 0.94 0.37 1.00 resident no change Adapter 14Glaucous-winged Gull 0.16 0.06 0.05 0.16 migrant declining Adapter 26Hammond's Flycatcher 0.26 0.33 0.05 0.47 migrant no change Adapter 26Hairy Woodpecker 0.79 0.50 0.32 0.79 rare resident insufficient data Adapter 10House Finch 0.58 0.22 0.32 0.68 resident no change Adapter 28Hutton's Vireo 0.42 0.06 0.11 0.47 resident no change Adapter 27Killdeer 0.21 0.00 0.11 0.32 resident no change Adapter 28Mallard 0.42 0.28 0.42 0.58 resident no change Adapter 10Marsh Wren 0.68 0.22 0.16 0.68 resident no change Adapter 8Northern Flicker 0.37 0.39 0.37 0.63 migrant declining Adapter 27Northern Oriole 0.11 0.00 0.11 0.21 resident no change Adapter 33Pied-billed Grebe 0.26 0.06 0.11 0.26 resident no change Adapter Undetermined Pacific-slope Flycatcher 0.95 1.00 0.84 1.00 migrant insufficient data Adapter 10Purple Finch 0.63 0.44 0.47 0.79 migrant increasing Adapter 24Red-breasted Nuthatch 0.53 0.56 0.63 0.84 migrant insufficient data Adapter Undetermined Red Crossbill 0.32 0.67 0.16 0.79 rare resident declining Adapter 29Red-eyed Vireo 0.11 0.00 0.11 0.16 resident no change Adapter 26Rufous-sided Towee 0.89 0.89 0.89 1.00 migrant no change Adapter 37Rufous Hummingbird 0.21 0.17 0.16 0.32 resident insufficient data Adapter 28Ruby Crowned Kinglet 0.53 0.44 0.63 0.89 resident no change Adapter 31Red-winged Blackbird 0.53 0.33 0.53 0.68 rare resident insufficient data Adapter 22Savannah Sparrow 0.00 0.06 0.00 0.05 resident increasing Adapter 11Song Sparrow 1.00 1.00 1.00 1.00 resident no change Adapter 24Sharp-shinned Hawk 0.21 0.00 0.00 0.21 rare resident no change Adapter 15Steller's Jay 0.58 0.61 0.68 0.84 rare resident insufficient data Adapter 33Tree Swallow 0.58 0.39 0.42 0.84 rare resident no change Adapter 22Violet-green Swallow 0.47 0.39 0.79 0.79 rare resident insufficient data Adapter 28Virginia Rail 0.26 0.11 0.16 0.32 migrant no change Adapter 33White-crowned Sparrow 0.32 0.22 0.05 0.32 migrant no change Adapter 29Western Wood-pewee 0.32 0.17 0.32 0.47 migrant declining Adapter 30Winter Wren 0.95 0.94 0.68 1.00 resident increasing Adapter 27
0BCHAPTER 6 BIRD DISTRIBUTION, ABUNDANCE AND HABITAT USE 115
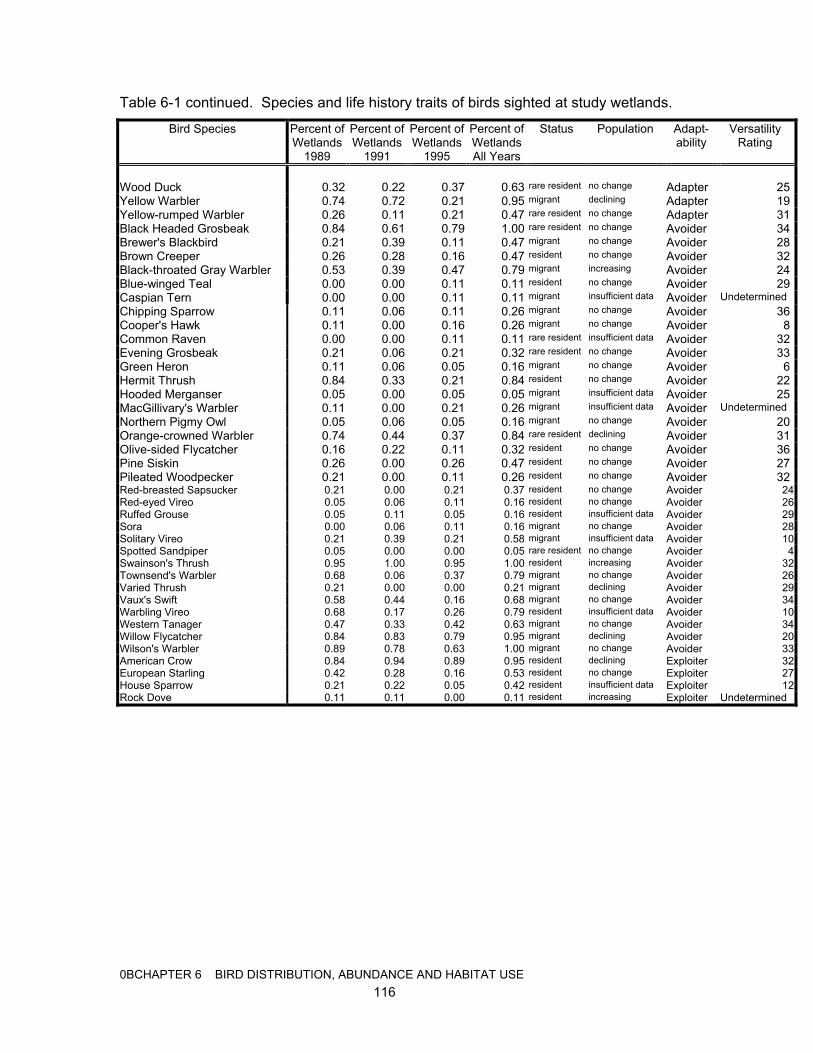
Table 6-1 continued. Species and life history traits of birds sighted at study wetlands.
Bird Species Percent of Wetlands
1989
Percent of Wetlands
1991
Percent of Wetlands
1995
Percent of Wetlands All Years
Status Population Adapt-ability
Versatility Rating
Wood Duck 0.32 0.22 0.37 0.63 rare resident no change Adapter 25Yellow Warbler 0.74 0.72 0.21 0.95 migrant declining Adapter 19Yellow-rumped Warbler 0.26 0.11 0.21 0.47 rare resident no change Adapter 31Black Headed Grosbeak 0.84 0.61 0.79 1.00 rare resident no change Avoider 34Brewer's Blackbird 0.21 0.39 0.11 0.47 migrant no change Avoider 28Brown Creeper 0.26 0.28 0.16 0.47 resident no change Avoider 32Black-throated Gray Warbler 0.53 0.39 0.47 0.79 migrant increasing Avoider 24Blue-winged Teal 0.00 0.00 0.11 0.11 resident no change Avoider 29Caspian Tern 0.00 0.00 0.11 0.11 migrant insufficient data Avoider Undetermined Chipping Sparrow 0.11 0.06 0.11 0.26 migrant no change Avoider 36Cooper's Hawk 0.11 0.00 0.16 0.26 migrant no change Avoider 8Common Raven 0.00 0.00 0.11 0.11 rare resident insufficient data Avoider 32Evening Grosbeak 0.21 0.06 0.21 0.32 rare resident no change Avoider 33Green Heron 0.11 0.06 0.05 0.16 migrant no change Avoider 6Hermit Thrush 0.84 0.33 0.21 0.84 resident no change Avoider 22Hooded Merganser 0.05 0.00 0.05 0.05 migrant insufficient data Avoider 25MacGillivary's Warbler 0.11 0.00 0.21 0.26 migrant insufficient data Avoider Undetermined Northern Pigmy Owl 0.05 0.06 0.05 0.16 migrant no change Avoider 20Orange-crowned Warbler 0.74 0.44 0.37 0.84 rare resident declining Avoider 31Olive-sided Flycatcher 0.16 0.22 0.11 0.32 resident no change Avoider 36Pine Siskin 0.26 0.00 0.26 0.47 resident no change Avoider 27Pileated Woodpecker 0.21 0.00 0.11 0.26 resident no change Avoider 32Red-breasted Sapsucker 0.21 0.00 0.21 0.37 resident no change Avoider 24Red-eyed Vireo 0.05 0.06 0.11 0.16 resident no change Avoider 26Ruffed Grouse 0.05 0.11 0.05 0.16 resident insufficient data Avoider 29Sora 0.00 0.06 0.11 0.16 migrant no change Avoider 28Solitary Vireo 0.21 0.39 0.21 0.58 migrant insufficient data Avoider 10Spotted Sandpiper 0.05 0.00 0.00 0.05 rare resident no change Avoider 4Swainson's Thrush 0.95 1.00 0.95 1.00 resident increasing Avoider 32Townsend's Warbler 0.68 0.06 0.37 0.79 migrant no change Avoider 26Varied Thrush 0.21 0.00 0.00 0.21 migrant declining Avoider 29Vaux's Swift 0.58 0.44 0.16 0.68 migrant no change Avoider 34Warbling Vireo 0.68 0.17 0.26 0.79 resident insufficient data Avoider 10Western Tanager 0.47 0.33 0.42 0.63 migrant no change Avoider 34Willow Flycatcher 0.84 0.83 0.79 0.95 migrant declining Avoider 20Wilson's Warbler 0.89 0.78 0.63 1.00 migrant no change Avoider 33American Crow 0.84 0.94 0.89 0.95 resident declining Exploiter 32European Starling 0.42 0.28 0.16 0.53 resident no change Exploiter 27House Sparrow 0.21 0.22 0.05 0.42 resident insufficient data Exploiter 12Rock Dove 0.11 0.11 0.00 0.11 resident increasing Exploiter Undetermined
0BCHAPTER 6 BIRD DISTRIBUTION, ABUNDANCE AND HABITAT USE 116
0
10
20
30
40
50
60
70
NFI
C12
AL3
ELS3
9
TC13
MG
R36 B3
I
HC
13
SC84
PC12
ELW
1
SC
4
LPS
9
FC1
LCR
93
BBC
24
JC28 RR
5
ELS6
1
SR24
Wetland
198919911995All Years
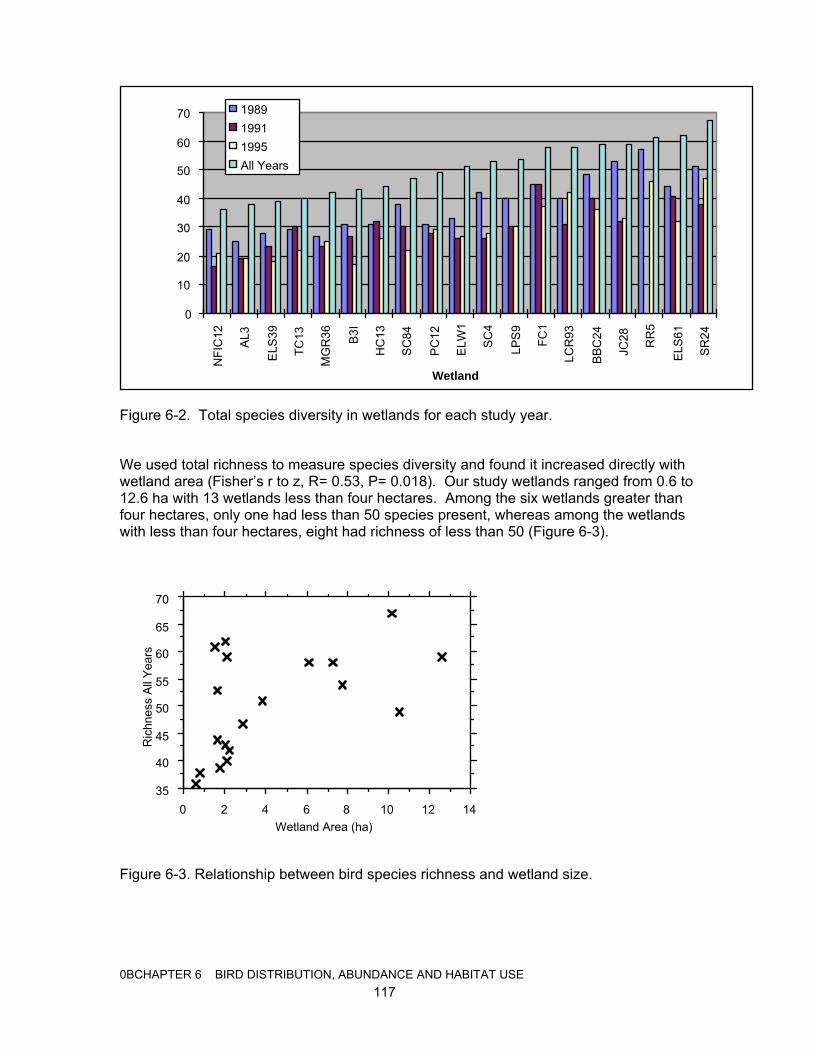
Figure 6-2. Total species diversity in wetlands for each study year.
We used total richness to measure species diversity and found it increased directly with wetland area (Fisher’s r to z, R= 0.53, P= 0.018). Our study wetlands ranged from 0.6 to 12.6 ha with 13 wetlands less than four hectares. Among the six wetlands greater than four hectares, only one had less than 50 species present, whereas among the wetlands with less than four hectares, eight had richness of less than 50 (Figure 6-3).
35
40
45
50
55
60
65
70
Ric
hnes
s A
ll Y
ears
0 2 4 6 8 10 12 14Wetland Area (ha)
Figure 6-3. Relationship between bird species richness and wetland size.
0BCHAPTER 6 BIRD DISTRIBUTION, ABUNDANCE AND HABITAT USE 117
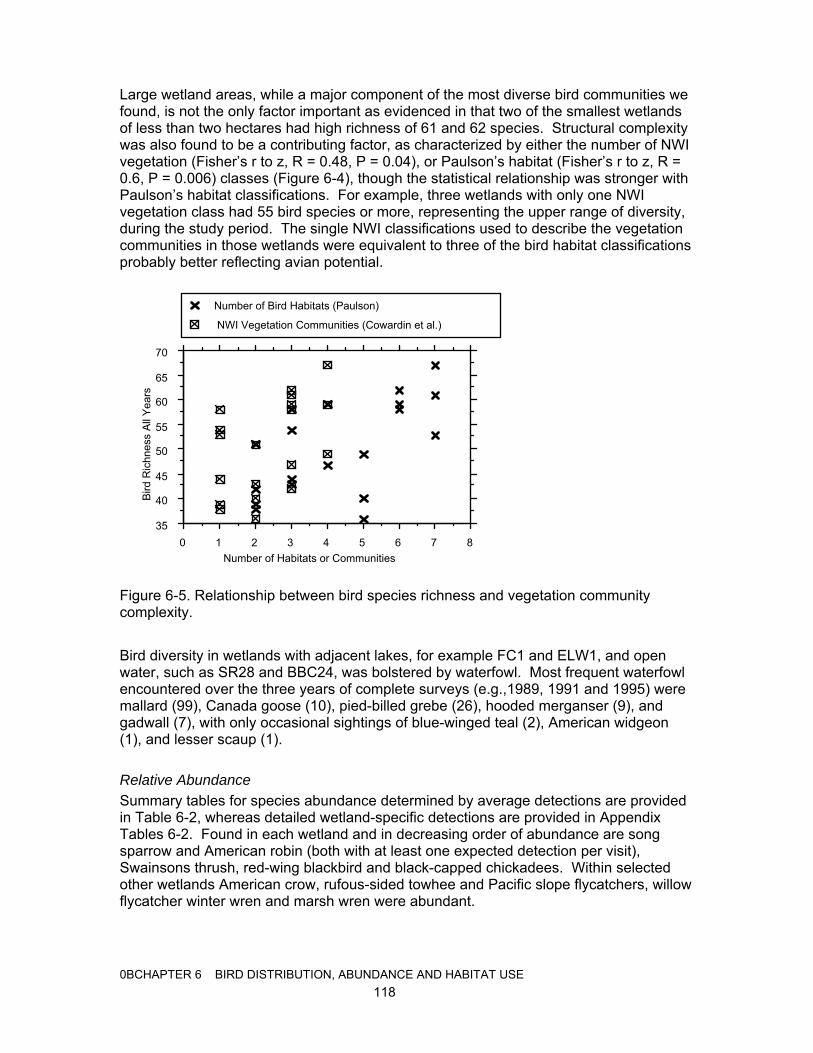
Large wetland areas, while a major component of the most diverse bird communities we found, is not the only factor important as evidenced in that two of the smallest wetlands of less than two hectares had high richness of 61 and 62 species. Structural complexity was also found to be a contributing factor, as characterized by either the number of NWI vegetation (Fisher’s r to z, R = 0.48, P = 0.04), or Paulson’s habitat (Fisher’s r to z, R = 0.6, P = 0.006) classes (Figure 6-4), though the statistical relationship was stronger with Paulson’s habitat classifications. For example, three wetlands with only one NWI vegetation class had 55 bird species or more, representing the upper range of diversity, during the study period. The single NWI classifications used to describe the vegetation communities in those wetlands were equivalent to three of the bird habitat classifications probably better reflecting avian potential.
35
40
45
50
55
60
65
70
Bird
Ric
hnes
s A
ll Y
ears
0 1 2 3 4 5 6 7 8Number of Habitats or Communities
NWI Vegetation Communities (Cowardin et al.)
Number of Bird Habitats (Paulson)
Figure 6-5. Relationship between bird species richness and vegetation community complexity.
Bird diversity in wetlands with adjacent lakes, for example FC1 and ELW1, and open water, such as SR28 and BBC24, was bolstered by waterfowl. Most frequent waterfowl encountered over the three years of complete surveys (e.g.,1989, 1991 and 1995) were mallard (99), Canada goose (10), pied-billed grebe (26), hooded merganser (9), and gadwall (7), with only occasional sightings of blue-winged teal (2), American widgeon (1), and lesser scaup (1).
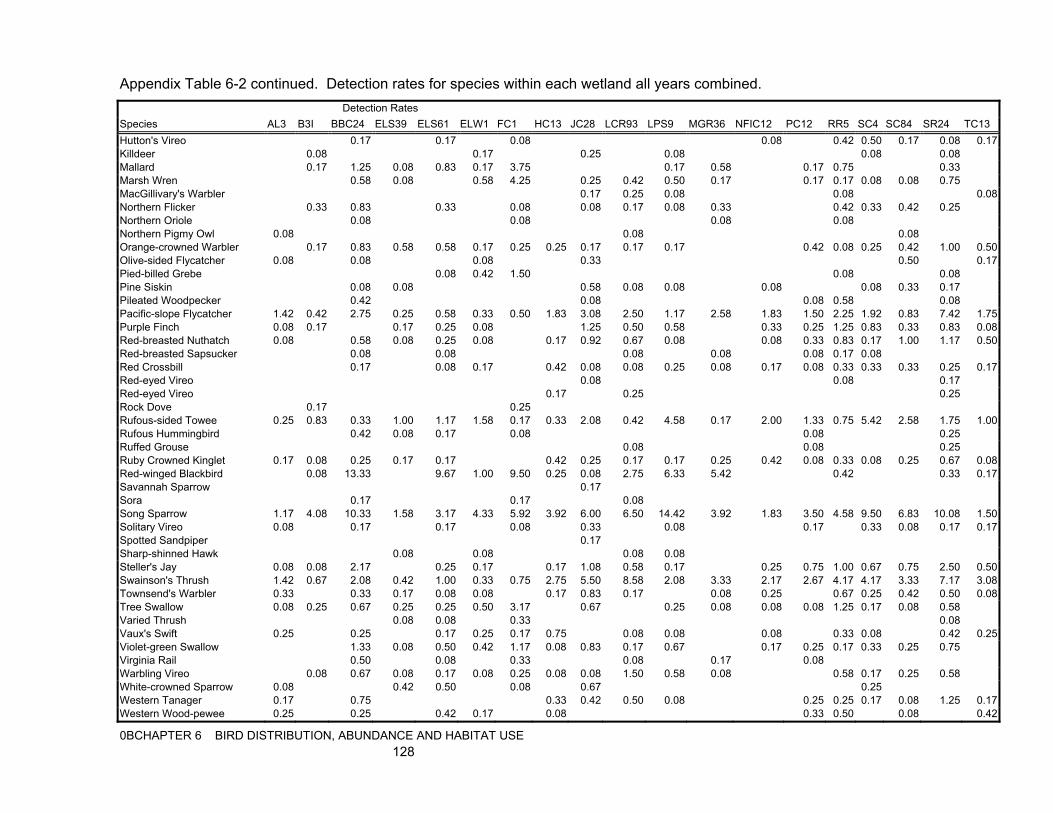
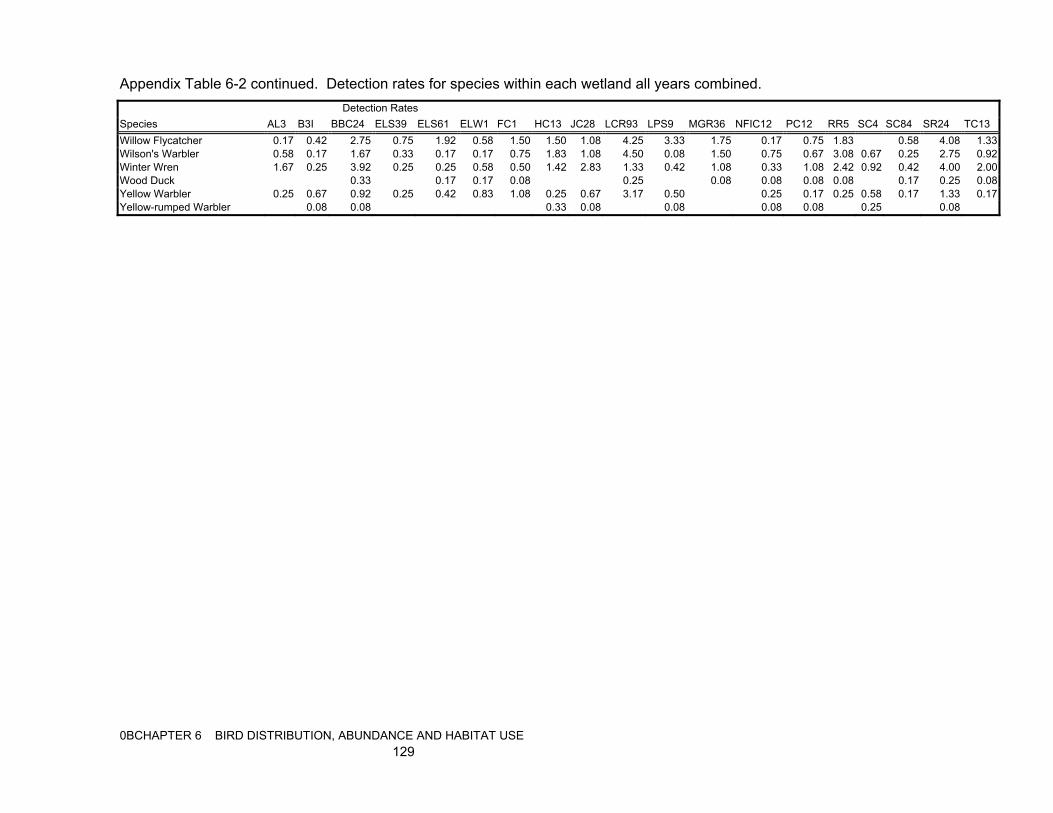
Relative Abundance Summary tables for species abundance determined by average detections are provided in Table 6-2, whereas detailed wetland-specific detections are provided in Appendix Tables 6-2. Found in each wetland and in decreasing order of abundance are song sparrow and American robin (both with at least one expected detection per visit), Swainsons thrush, red-wing blackbird and black-capped chickadees. Within selected other wetlands American crow, rufous-sided towhee and Pacific slope flycatchers, willow flycatcher winter wren and marsh wren were abundant.
0BCHAPTER 6 BIRD DISTRIBUTION, ABUNDANCE AND HABITAT USE 118
DISCUSSION Our bird diversities when compared with diversities observed in terrestrial habitats by others, indicate that wetlands are disproportionately used by birds and are probably the single most productive habitat for this vertebrate class in the Puget Sound Basin. Of all the species identified in Western Washington 82% are found in wetlands. Artman (1990) found only 23 species in 45-50 year old stands dominated by western hemlock but also containing Douglas-fir (Pseudotsuga menziesii), Pacific silver fir (Abies amabilis), and western red-cedar (Thuja plicata). Of the 48 species identified by Gavareski (1976) in 4-400 ha2 diversely vegetated urban parks of Seattle only two (great horned owl and golden-crowned sparrow) were undetected at wetlands.
We also found significantly more species than identified by Milligan (1985) in a survey of wetlands of less than 4 ha2 in urbanized areas of the Puget Sound Basin. From censuses in April, May and June of 1984, 60 species were found in combined wetland, and wetland and upland habitats, of 23 widely diverse sites characterized by varying density of development. Mulligan also found both total and average avifaunal diversity to be correlated to wetland habitat complexity measured by the number of NWI vegetation classes. Bird diversity was also found to correlate with the percentage of wetland buffered by shrubland or forest vegetation, although interestingly, there was only a minor predicted increase in diversity with increasing buffer width classes of 50, 100 and 200 feet from the wetland edge.
During the baseline surveys of wetlands for this study, Martin-Yanny (1992) listed 88 species. During subsequent surveys our study identified an additional six species, and presumably with continued surveys a few additional species may be expected at decreasing rates. Nevertheless it seems unlikely we would find the entire list of species identified by Paulson as potentially occurring in palustrine wetland habitats because of the limited geographic location of our wetlands within disturbed watersheds.
Paulson (1992) found that most resident species are maintaining their populations despite increasing urbanization. Our study results generally corroborate this finding though we did not have sufficient data to assess all species we observed. Declines were observed among some migrating species and some adapters.
Wetland area and habitat diversity were found to be critical factors in maintaining high biodiversity in wetland bird communities. When wetlands are assessed for function and value related to avian potential, methods based on bird preferences, such as the habitat classification by Paulson, would be more appropriate than the NWI classification system.
0BCHAPTER 6 BIRD DISTRIBUTION, ABUNDANCE AND HABITAT USE 119
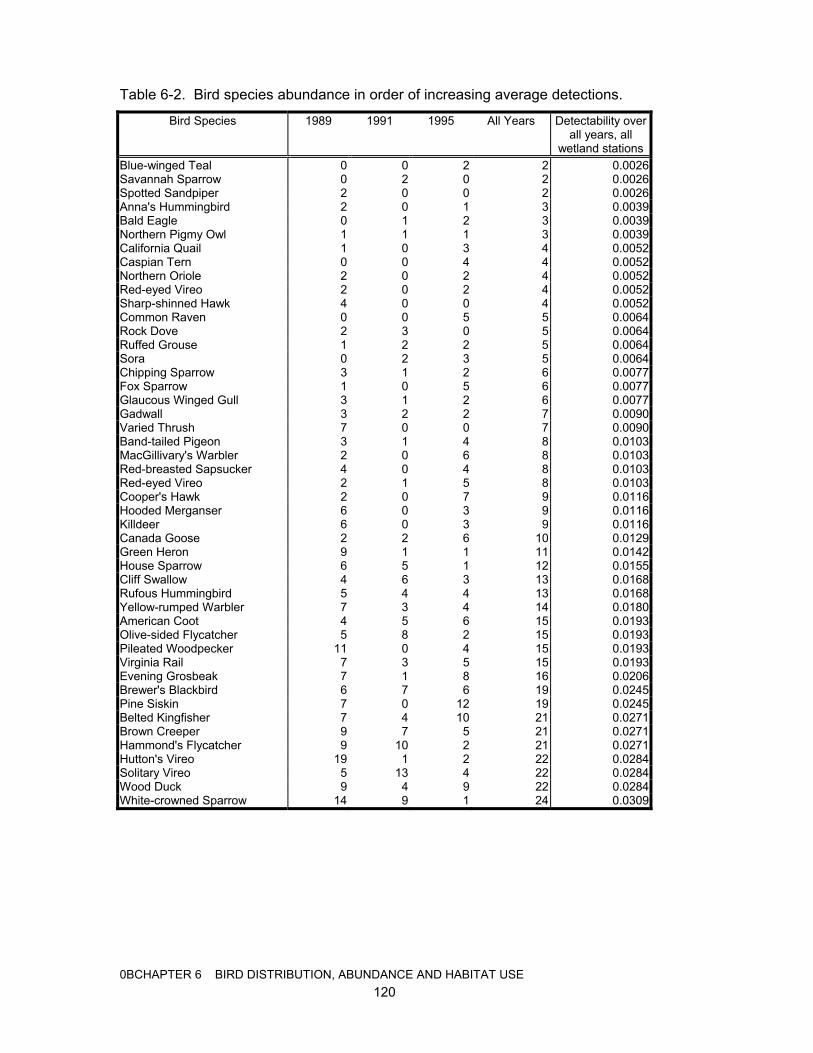
Table 6-2. Bird species abundance in order of increasing average detections.
Bird Species 1989 1991 1995 All Years Detectability over all years, all
wetland stations Blue-winged Teal 0 0 2 2 0.0026 Savannah Sparrow 0 2 0 2 0.0026 Spotted Sandpiper 2 0 0 2 0.0026 Anna's Hummingbird 2 0 1 3 0.0039 Bald Eagle 0 1 2 3 0.0039 Northern Pigmy Owl 1 1 1 3 0.0039 California Quail 1 0 3 4 0.0052 Caspian Tern 0 0 4 4 0.0052 Northern Oriole 2 0 2 4 0.0052 Red-eyed Vireo 2 0 2 4 0.0052 Sharp-shinned Hawk 4 0 0 4 0.0052 Common Raven 0 0 5 5 0.0064 Rock Dove 2 3 0 5 0.0064 Ruffed Grouse 1 2 2 5 0.0064 Sora 0 2 3 5 0.0064 Chipping Sparrow 3 1 2 6 0.0077 Fox Sparrow 1 0 5 6 0.0077 Glaucous Winged Gull 3 1 2 6 0.0077 Gadwall 3 2 2 7 0.0090 Varied Thrush 7 0 0 7 0.0090 Band-tailed Pigeon 3 1 4 8 0.0103 MacGillivary's Warbler 2 0 6 8 0.0103 Red-breasted Sapsucker 4 0 4 8 0.0103 Red-eyed Vireo 2 1 5 8 0.0103 Cooper's Hawk 2 0 7 9 0.0116 Hooded Merganser 6 0 3 9 0.0116 Killdeer 6 0 3 9 0.0116 Canada Goose 2 2 6 10 0.0129 Green Heron 9 1 1 11 0.0142 House Sparrow 6 5 1 12 0.0155 Cliff Swallow 4 6 3 13 0.0168 Rufous Hummingbird 5 4 4 13 0.0168 Yellow-rumped Warbler 7 3 4 14 0.0180 American Coot 4 5 6 15 0.0193 Olive-sided Flycatcher 5 8 2 15 0.0193 Pileated Woodpecker 11 0 4 15 0.0193 Virginia Rail 7 3 5 15 0.0193 Evening Grosbeak 7 1 8 16 0.0206 Brewer's Blackbird 6 7 6 19 0.0245 Pine Siskin 7 0 12 19 0.0245 Belted Kingfisher 7 4 10 21 0.0271 Brown Creeper 9 7 5 21 0.0271 Hammond's Flycatcher 9 10 2 21 0.0271 Hutton's Vireo 19 1 2 22 0.0284 Solitary Vireo 5 13 4 22 0.0284 Wood Duck 9 4 9 22 0.0284 White-crowned Sparrow 14 9 1 24 0.0309
0BCHAPTER 6 BIRD DISTRIBUTION, ABUNDANCE AND HABITAT USE 120
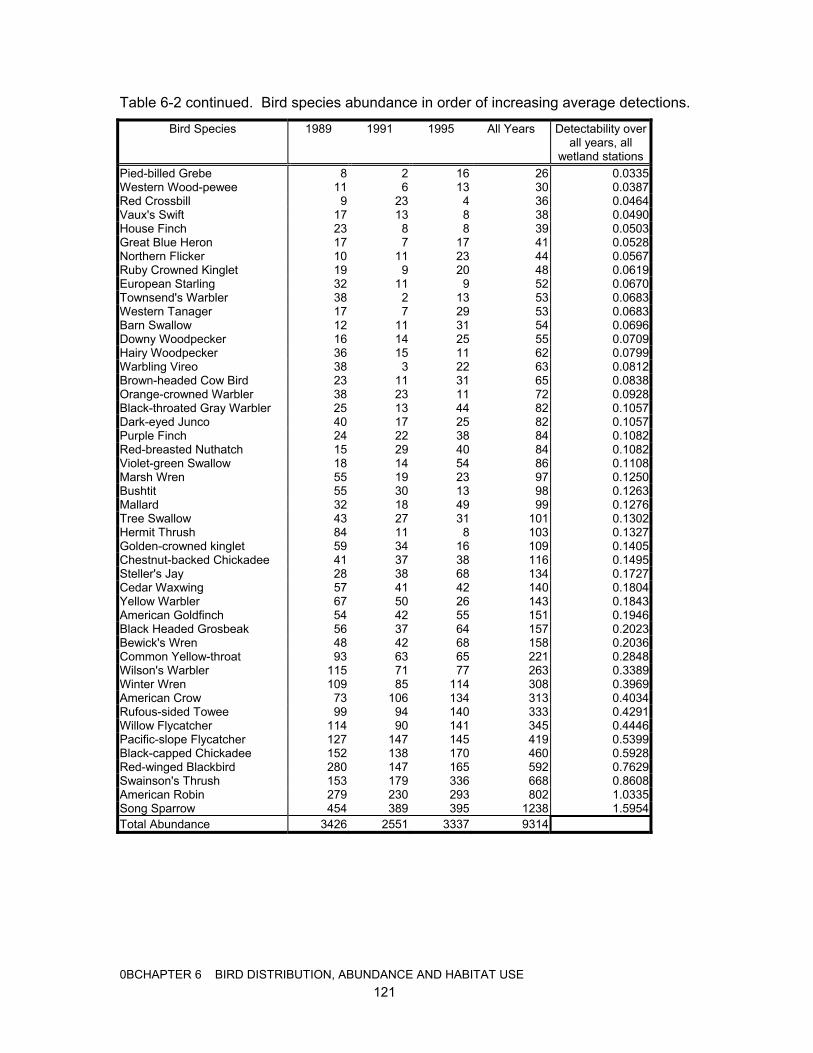
Table 6-2 continued. Bird species abundance in order of increasing average detections.
Bird Species 1989 1991 1995 All Years Detectability over all years, all
wetland stations Pied-billed Grebe 8 2 16 26 0.0335 Western Wood-pewee 11 6 13 30 0.0387 Red Crossbill 9 23 4 36 0.0464 Vaux's Swift 17 13 8 38 0.0490 House Finch 23 8 8 39 0.0503 Great Blue Heron 17 7 17 41 0.0528 Northern Flicker 10 11 23 44 0.0567 Ruby Crowned Kinglet 19 9 20 48 0.0619 European Starling 32 11 9 52 0.0670 Townsend's Warbler 38 2 13 53 0.0683 Western Tanager 17 7 29 53 0.0683 Barn Swallow 12 11 31 54 0.0696 Downy Woodpecker 16 14 25 55 0.0709 Hairy Woodpecker 36 15 11 62 0.0799 Warbling Vireo 38 3 22 63 0.0812 Brown-headed Cow Bird 23 11 31 65 0.0838 Orange-crowned Warbler 38 23 11 72 0.0928 Black-throated Gray Warbler 25 13 44 82 0.1057 Dark-eyed Junco 40 17 25 82 0.1057 Purple Finch 24 22 38 84 0.1082 Red-breasted Nuthatch 15 29 40 84 0.1082 Violet-green Swallow 18 14 54 86 0.1108 Marsh Wren 55 19 23 97 0.1250 Bushtit 55 30 13 98 0.1263 Mallard 32 18 49 99 0.1276 Tree Swallow 43 27 31 101 0.1302 Hermit Thrush 84 11 8 103 0.1327 Golden-crowned kinglet 59 34 16 109 0.1405 Chestnut-backed Chickadee 41 37 38 116 0.1495 Steller's Jay 28 38 68 134 0.1727 Cedar Waxwing 57 41 42 140 0.1804 Yellow Warbler 67 50 26 143 0.1843 American Goldfinch 54 42 55 151 0.1946 Black Headed Grosbeak 56 37 64 157 0.2023 Bewick's Wren 48 42 68 158 0.2036 Common Yellow-throat 93 63 65 221 0.2848 Wilson's Warbler 115 71 77 263 0.3389 Winter Wren 109 85 114 308 0.3969 American Crow 73 106 134 313 0.4034 Rufous-sided Towee 99 94 140 333 0.4291 Willow Flycatcher 114 90 141 345 0.4446 Pacific-slope Flycatcher 127 147 145 419 0.5399 Black-capped Chickadee 152 138 170 460 0.5928 Red-winged Blackbird 280 147 165 592 0.7629 Swainson's Thrush 153 179 336 668 0.8608 American Robin 279 230 293 802 1.0335 Song Sparrow 454 389 395 1238 1.5954 Total Abundance 3426 2551 3337 9314
0BCHAPTER 6 BIRD DISTRIBUTION, ABUNDANCE AND HABITAT USE 121
References
Artman, V. L. 1990. Breeding bird population and vegetation characteristics in commercially thinned and unthinned Western Hemlock Forests of Washington. Pages 55. University of Washington, Seattle, WA, USA.
Azous, A. L. 1991. An analysis of urbanization effects on wetland biological communities. University of Washington, Seattle, WA, USA.
Blake, J. G. 1986. Species-area relationship of migrants in isolated woodlots in east-central Illinois. The Wilson Bulletin 98:291-296.
Blake, J. G., and J. R. Karr. 1984. Species composition of bird communities and the conservation benefit of large versus small forests. Biological Conservation 30:173-187.
Brown, M., and J. J. Dinsmore. 1986. Implications of marsh size and isolation for marsh bird management. J. Wildl. Manage. 50:392-397.
Brown, R. E. 1985. Management of Wildlife and Fish Habitats in the Forests of Western Oregon and Washington. U. S. Forest Service, Pacific Northwest Region, Portland, OR, USA.
Cowardin, L. M., V. Carter, F. C. Goulet, and E. T. LaRoe. 1979. Classification of wetlands and deepwater habitat of the United States. U. S. Fish and Wildlife Service, Washington D.C., USA.
Craig, R. J., and K. G. Beal. 1992. The influence of habitat variables on marsh bird communities of the Connecticut River Estuary. Wilson Bulletin 104:295-311.
Gavareski, C. A. 1976. Relation of park size and vegetation to urban bird populations in Seattle, Washington. Condor 78:375-382.
Good, R. E., D. F. Whigham, R. L. Simpson, and J. Jackson Crawford G , eds. 1978. Freshwater Wetlands: Ecological Processes and Management Potential. Academic Press, Inc., San Diego, CA, USA.
Greeson, P. E., J. R. Clark, and J. E. Clark, eds. 1979. Wetland Functions and Values: The State of Our Understanding. American Water Resources Association, Minneapolis, MN, USA.
Hunn, E. S. 1982. Birding in Seattle and King County. Seattle Audubon Society, Seattle, Washington, USA.
Knopf, F. L., and F. B. Samson. 1994. Scale perspectives on avian diversity in western riparian ecosystems. Conservation Biology 8:669-676.
Martin-Yanny, E. 1992. The impacts of urbanization on wetland bird communities. Pages 109. University of Washington, Seattle, WA, USA.
Milligan, D. A. 1985. The ecology of avian use of urban freshwater wetlands in King County, Washington. Pages 145. University of Washington, Seattle, WA.
Paulson, D. R. 1992. Northwest bird diversity: From extravagant past and changing present to precarious future. The Northwest Environmental Journal 8:71-118.
Stofel, J. L. 1993. Evaluating wildlife responses to alternative silvicultural practices. Pages 126. University of Washington, Seattle, Washington, USA.
Weller, M. W. 1979. Birds of some Iowa wetlands in relation to concepts of faunal preservation. Proc. Iowa Acad. Sci. 86:81-88.
0BCHAPTER 6 BIRD DISTRIBUTION, ABUNDANCE AND HABITAT USE 122
Weller, M. W. 1994. Bird-habitat relationships in a Texas estuarine marsh during summer. Wetlands 14:293-300.
Weller, M. W., and L. H. Fredrickson. 1974. Avian ecology of a managed glacial marsh. The Living Bird 12:269-291.
Weller, M. W., and C. S. Spatcher. 1965. Role of habitat in the distribution and abundance of marsh birds. Pages 1-31. Iowa State University of Science and Technology, Ames, Iowa, USA.
Whittaker, R. H. 1975. Communities and Ecosystems. MacMillan, New York, New York, USA.
0BCHAPTER 6 BIRD DISTRIBUTION, ABUNDANCE AND HABITAT USE 123
0BCHAPTER 6 BIRD DISTRIBUTION, ABUNDANCE AND HABITAT USE 124
Appendix Table 6-1. List of bird species expected to be using palustrine wetlands in Western Washington. STATUS BREEDING DISTRIBUTION SPECIES Evolutionary
Order B W WA PL FM WC BF RW ST WM
Common loon 1 x x o SW Pied-billed grebe 2 x x x R Horned grebe 3 x x o SW Red-necked grebe 4 x x o S Eared grebe 5 x o x Sw Western grebe 6 o x x SW Clark's grebe 7 o o S Double-crested cormorant 8 x x x SW American bittern 9 x o x SW Great blue heron 10 x x x R R Great egret 11 o o o S Black-crowned night-heron 12 o o x SW Canada goose 13 x x x R R Wood duck 14 x o x R Green-winged teal 15 x o x SW SW W Mallard 16 x x x R R W Northern pintail 17 x x x SW SW W Blue-winged teal 18 x x S S Cinnamon teal 19 o x S S Northern shoveler 20 x o x SW SW Gadwall 21 x x x SW SW W American wigeon 22 x o x SW SW W Canvasback 23 x x x SW S Redhead 24 x o x S S Ring-necked duck 25 x x x SW Barrow's goldeneye 26 x x x S Bufflehead 27 x x o SW Hooded merganser 28 x x x SW Common merganser 29 x x x W Ruddy duck 30 x o x SW S Bald eagle 31 x x x R R Northern harrier 32 x x x SW R Sharp-shinned hawk 33 x o x R W W W Cooper's hawk 34 x o x R R R Northern goshawk 35 x x x R Red-tailed hawk 36 x o x R R R American kestrel 37 x x x R Peregrine falcon 38 o o x r Spruce grouse 39 x x x R* Blue grouse 40 x x x R Ruffed grouse 41 x x x R Sharp-tailed grouse 42 o o x W Mountain quail 43 o o o R Virginia rail 44 x x x R Sora 45 x o x SW S American coot 46 x x x SW S Sandhill crane 47 o + o sM sM Killdeer 48 x o x SW SW SW Common snipe 49 x o x SW SW Band-tailed pigeon 50 o o x R R Mourning dove 51 x o x R R Barn owl 52 o o x r R R Western screech-owl 53 x x x R R R Great horned owl 54 x x x R R R Northern pygmy-owl 55 x x x R Barred owl 56 x x x R Long-eared owl 57 x x x R Short-eared owl 58 x x x R Boreal owl 59 x x x R* Northern saw-whet owl 60 x x x R W
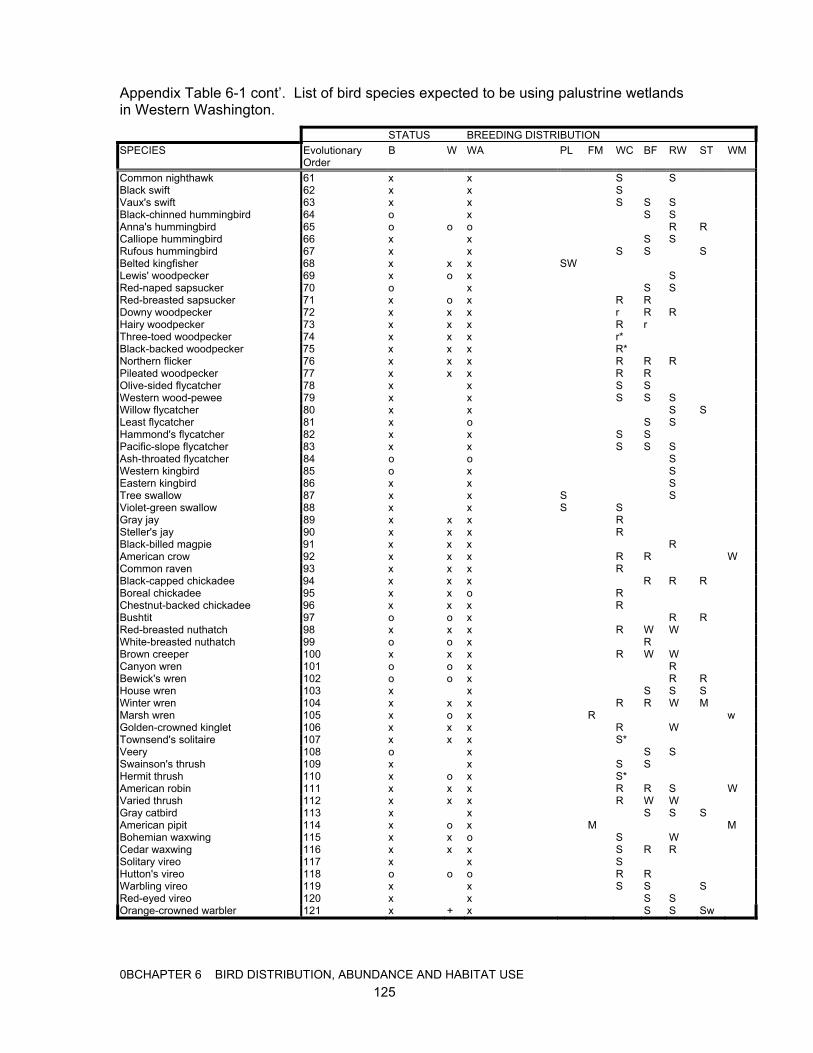
Appendix Table 6-1 cont’. List of bird species expected to be using palustrine wetlands in Western Washington. STATUS BREEDING DISTRIBUTION SPECIES Evolutionary
Order B W WA PL FM WC BF RW ST WM
Common nighthawk 61 x x S S Black swift 62 x x S Vaux's swift 63 x x S S S Black-chinned hummingbird 64 o x S S Anna's hummingbird 65 o o o R R Calliope hummingbird 66 x x S S Rufous hummingbird 67 x x S S S Belted kingfisher 68 x x x SW Lewis' woodpecker 69 x o x S Red-naped sapsucker 70 o x S S Red-breasted sapsucker 71 x o x R R Downy woodpecker 72 x x x r R R Hairy woodpecker 73 x x x R r Three-toed woodpecker 74 x x x r* Black-backed woodpecker 75 x x x R* Northern flicker 76 x x x R R R Pileated woodpecker 77 x x x R R Olive-sided flycatcher 78 x x S S Western wood-pewee 79 x x S S S Willow flycatcher 80 x x S S Least flycatcher 81 x o S S Hammond's flycatcher 82 x x S S Pacific-slope flycatcher 83 x x S S S Ash-throated flycatcher 84 o o S Western kingbird 85 o x S Eastern kingbird 86 x x S Tree swallow 87 x x S S Violet-green swallow 88 x x S S Gray jay 89 x x x R Steller's jay 90 x x x R Black-billed magpie 91 x x x R American crow 92 x x x R R W Common raven 93 x x x R Black-capped chickadee 94 x x x R R R Boreal chickadee 95 x x o R Chestnut-backed chickadee 96 x x x R Bushtit 97 o o x R R Red-breasted nuthatch 98 x x x R W W White-breasted nuthatch 99 o o x R Brown creeper 100 x x x R W W Canyon wren 101 o o x R Bewick's wren 102 o o x R R House wren 103 x x S S S Winter wren 104 x x x R R W M Marsh wren 105 x o x R w Golden-crowned kinglet 106 x x x R W Townsend's solitaire 107 x x x S* Veery 108 o x S S Swainson's thrush 109 x x S S Hermit thrush 110 x o x S* American robin 111 x x x R R S W Varied thrush 112 x x x R W W Gray catbird 113 x x S S S American pipit 114 x o x M M Bohemian waxwing 115 x x o S W Cedar waxwing 116 x x x S R R Solitary vireo 117 x x S Hutton's vireo 118 o o o R R Warbling vireo 119 x x S S S Red-eyed vireo 120 x x S S Orange-crowned warbler 121 x + x S S Sw
0BCHAPTER 6 BIRD DISTRIBUTION, ABUNDANCE AND HABITAT USE 125
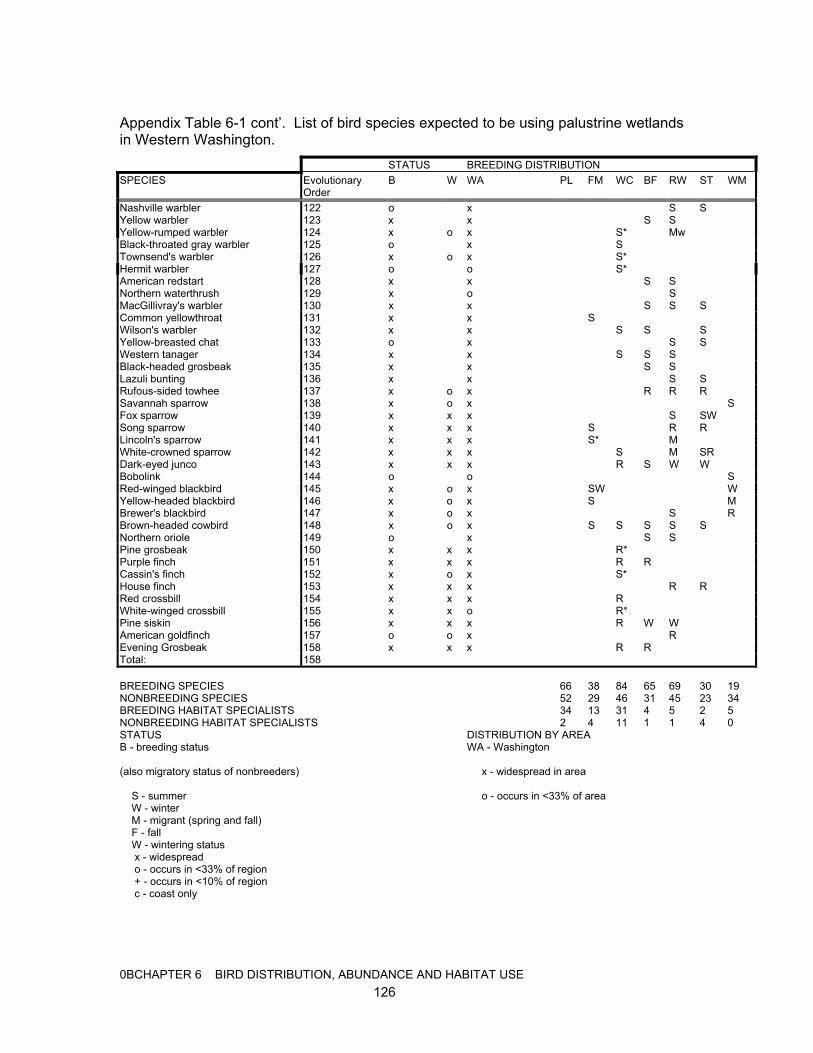
Appendix Table 6-1 cont’. List of bird species expected to be using palustrine wetlands in Western Washington. STATUS BREEDING DISTRIBUTION SPECIES Evolutionary
Order B W WA PL FM WC BF RW ST WM
Nashville warbler 122 o x S S Yellow warbler 123 x x S S Yellow-rumped warbler 124 x o x S* Mw Black-throated gray warbler 125 o x S Townsend's warbler 126 x o x S* Hermit warbler 127 o o S* American redstart 128 x x S S Northern waterthrush 129 x o S MacGillivray's warbler 130 x x S S S Common yellowthroat 131 x x S Wilson's warbler 132 x x S S S Yellow-breasted chat 133 o x S S Western tanager 134 x x S S S Black-headed grosbeak 135 x x S S Lazuli bunting 136 x x S S Rufous-sided towhee 137 x o x R R R Savannah sparrow 138 x o x S Fox sparrow 139 x x x S SW Song sparrow 140 x x x S R R Lincoln's sparrow 141 x x x S* M White-crowned sparrow 142 x x x S M SR Dark-eyed junco 143 x x x R S W W Bobolink 144 o o S Red-winged blackbird 145 x o x SW W Yellow-headed blackbird 146 x o x S M Brewer's blackbird 147 x o x S R Brown-headed cowbird 148 x o x S S S S S Northern oriole 149 o x S S Pine grosbeak 150 x x x R* Purple finch 151 x x x R R Cassin's finch 152 x o x S* House finch 153 x x x R R Red crossbill 154 x x x R White-winged crossbill 155 x x o R* Pine siskin 156 x x x R W W American goldfinch 157 o o x R Evening Grosbeak 158 x x x R R Total: 158 BREEDING SPECIES 66 38 84 65 69 30 19 NONBREEDING SPECIES 52 29 46 31 45 23 34 BREEDING HABITAT SPECIALISTS 34 13 31 4 5 2 5 NONBREEDING HABITAT SPECIALISTS 2 4 11 1 1 4 0 STATUS DISTRIBUTION BY AREA B - breeding status WA - Washington
(also migratory status of nonbreeders)
x - widespread in area
S - summer o - occurs in <33% of area W - winter M - migrant (spring and fall) F - fall W - wintering status x - widespread o - occurs in <33% of region + - occurs in <10% of region c - coast only
0BCHAPTER 6 BIRD DISTRIBUTION, ABUNDANCE AND HABITAT USE 126
0BCHAPTER 6 BIRD DISTRIBUTION, ABUNDANCE AND HABITAT USE 127
Appendix Table 6-2. Detection rates for species within each wetland all years combined. Detection Rates
Species AL3 B3I BBC24 ELS39 ELS61 ELW1 FC1 HC13 JC28 LCR93 LPS9 MGR36 NFIC12 PC12 RR5 SC4 SC84 SR24 TC13 American Coot 1.25 American Crow 0.67 1.50 0.33 0.92 0.83 1.00 1.67 0.67 3.08 0.58 3.58 1.92 0.75 1.67 1.92 3.75 0.33 0.92 American Goldfinch 1.08 0.33 0.25 0.33 0.08 0.50 0.25 2.75 0.42 4.42 0.17 0.08 0.42 0.42 0.25 0.83 American Robin 0.67 2.42 5.75 0.75 3.33 2.92 2.42 1.75 6.00 5.17 5.92 2.58 1.17 2.25 3.00 8.42 5.25 5.50 1.58 Anna's Hummingbird 0.08 0.08 0.08 Bald Eagle 0.08 0.17 Barn Swallow 0.08 0.50 0.42 0.17 2.17 0.17 0.33 0.33 0.17 0.17 Black-capped Chickadee 0.42 2.25 1.42 0.50 1.00 2.67 2.17 1.58 2.42 2.25 4.75 1.58 0.58 1.25 2.50 3.25 1.92 4.75 1.08 Belted Kingfisher 0.58 0.08 0.17 0.25 0.08 0.08 0.08 0.08 0.08 0.08 0.17 Bewick's Wren 0.08 0.33 0.17 0.58 1.42 1.42 0.17 1.00 0.50 2.17 0.08 0.25 0.25 0.25 1.92 1.17 1.25 0.17 Brown-headed Cow Bird 0.17 0.42 0.33 0.17 0.42 0.08 0.25 0.08 0.50 0.42 0.50 0.08 0.33 0.50 0.08 0.17 0.83 0.08 Black Headed Grosbeak 0.17 0.42 1.50 0.17 1.42 0.67 0.83 0.33 0.58 1.25 1.33 0.17 0.08 0.50 0.58 0.67 0.17 2.00 0.25 Brewer's Blackbird 0.33 0.08 0.17 0.50 0.08 0.17 0.08 0.08 0.08 Brown Creeper 0.33 0.08 0.08 0.08 0.17 0.42 0.17 0.25 0.17 Black-throated Gray Warbler 0.08 0.17 0.08 0.75 1.17 0.75 0.17 0.08 0.42 0.08 0.50 0.58 0.50 1.25 0.25 Band-tailed Pigeon 0.25 0.08 0.33 Bushtit 0.50 0.08 0.17 0.33 0.17 0.50 0.17 0.33 0.42 2.33 0.33 0.25 0.25 0.25 1.00 0.08 0.75 0.25 Blue-winged Teal 0.08 0.08 Canada Goose 0.42 0.33 0.08 California Quail 0.08 0.08 0.08 0.08 Caspian Tern 0.08 0.25 Chestnut-backed Chickadee 0.17 0.17 0.67 0.17 0.33 0.17 0.25 0.17 1.00 0.58 0.42 0.25 0.42 0.25 1.00 0.92 0.42 2.08 0.25 Cedar Waxwing 0.08 1.00 1.00 0.50 0.42 1.25 0.50 0.92 0.67 0.17 0.17 1.25 1.08 0.67 0.33 1.50 0.17 Chipping Sparrow 0.17 0.08 0.08 0.08 0.08 Cliff Swallow 0.08 0.08 0.92 Cooper's Hawk 0.08 0.17 0.08 0.33 0.08 Common Raven 0.17 0.25 Common Yellow-throat 0.17 2.92 1.58 0.08 0.92 0.67 1.25 3.08 1.58 1.42 2.17 1.75 0.83 Dark-eyed Junco 0.17 0.08 0.17 0.17 0.25 1.00 0.08 0.33 0.08 0.42 0.08 0.33 0.75 0.25 2.17 0.50 Downy Woodpecker 0.08 0.08 0.25 0.08 0.08 0.33 0.17 0.17 0.17 0.58 0.50 0.17 0.33 0.25 0.33 0.83 0.17 European Starling 0.92 0.17 0.33 1.42 0.50 0.17 0.50 0.08 0.17 0.08 Evening Grosbeak 0.08 0.58 0.08 0.08 0.25 0.25 Fox Sparrow 0.17 0.08 0.25 Gadwall 0.50 0.08 Great Blue Heron 0.17 0.17 0.25 0.50 1.17 0.08 0.17 0.08 0.17 0.17 0.08 0.42 Golden-crowned kinglet 0.25 0.25 0.42 0.25 0.17 0.33 0.08 0.92 0.75 0.42 0.25 0.50 0.67 0.17 1.00 0.83 0.58 0.83 0.42 Green Heron 0.17 0.67 0.08 Glaucous-winged Gull 0.08 0.33 0.08 Hammond's Flycatcher 0.08 0.25 0.17 0.08 0.08 0.25 0.42 0.33 0.08 Hairy Woodpecker 0.08 0.67 0.17 0.08 0.42 0.08 0.33 0.33 0.25 0.08 0.67 0.25 0.50 1.00 0.25 Hermit Thrush 0.25 0.50 0.42 0.08 0.67 0.25 0.92 0.08 0.50 0.42 0.67 0.58 0.42 0.92 1.58 0.33 House Finch 0.17 0.25 0.33 0.33 0.42 0.50 0.25 0.08 0.42 0.08 0.08 0.17 0.17 Hooded Merganser 0.75 House Sparrow 0.17 0.08 0.08 0.17 0.25 0.08 0.08 0.08
0BCHAPTER 6 BIRD DISTRIBUTION, ABUNDANCE AND HABITAT USE 128
Appendix Table 6-2 continued. Detection rates for species within each wetland all years combined. Detection Rates
Species AL3 B3I BBC24 ELS39 ELS61 ELW1 FC1 HC13 JC28 LCR93 LPS9 MGR36 NFIC12 PC12 RR5 SC4 SC84 SR24 TC13 Hutton's Vireo 0.17 0.17 0.08 0.08 0.42 0.50 0.17 0.08 0.17 Killdeer 0.08 0.17 0.25 0.08 0.08 0.08 Mallard 0.17 1.25 0.08 0.83 0.17 3.75 0.17 0.58 0.17 0.75 0.33 Marsh Wren 0.58 0.08 0.58 4.25 0.25 0.42 0.50 0.17 0.17 0.17 0.08 0.08 0.75 MacGillivary's Warbler 0.17 0.25 0.08 0.08 0.08 Northern Flicker 0.33 0.83 0.33 0.08 0.08 0.17 0.08 0.33 0.42 0.33 0.42 0.25 Northern Oriole 0.08 0.08 0.08 0.08 Northern Pigmy Owl 0.08 0.08 0.08 Orange-crowned Warbler 0.17 0.83 0.58 0.58 0.17 0.25 0.25 0.17 0.17 0.17 0.42 0.08 0.25 0.42 1.00 0.50 Olive-sided Flycatcher 0.08 0.08 0.08 0.33 0.50 0.17 Pied-billed Grebe 0.08 0.42 1.50 0.08 0.08 Pine Siskin 0.08 0.08 0.58 0.08 0.08 0.08 0.08 0.33 0.17 Pileated Woodpecker 0.42 0.08 0.08 0.58 0.08 Pacific-slope Flycatcher 1.42 0.42 2.75 0.25 0.58 0.33 0.50 1.83 3.08 2.50 1.17 2.58 1.83 1.50 2.25 1.92 0.83 7.42 1.75 Purple Finch 0.08 0.17 0.17 0.25 0.08 1.25 0.50 0.58 0.33 0.25 1.25 0.83 0.33 0.83 0.08 Red-breasted Nuthatch 0.08 0.58 0.08 0.25 0.08 0.17 0.92 0.67 0.08 0.08 0.33 0.83 0.17 1.00 1.17 0.50 Red-breasted Sapsucker 0.08 0.08 0.08 0.08 0.08 0.17 0.08 Red Crossbill 0.17 0.08 0.17 0.42 0.08 0.08 0.25 0.08 0.17 0.08 0.33 0.33 0.33 0.25 0.17 Red-eyed Vireo 0.08 0.08 0.17 Red-eyed Vireo 0.17 0.25 0.25 Rock Dove 0.17 0.25 Rufous-sided Towee 0.25 0.83 0.33 1.00 1.17 1.58 0.17 0.33 2.08 0.42 4.58 0.17 2.00 1.33 0.75 5.42 2.58 1.75 1.00 Rufous Hummingbird 0.42 0.08 0.17 0.08 0.08 0.25 Ruffed Grouse 0.08 0.08 0.25 Ruby Crowned Kinglet 0.17 0.08 0.25 0.17 0.17 0.42 0.25 0.17 0.17 0.25 0.42 0.08 0.33 0.08 0.25 0.67 0.08 Red-winged Blackbird 0.08 13.33 9.67 1.00 9.50 0.25 0.08 2.75 6.33 5.42 0.42 0.33 0.17 Savannah Sparrow 0.17 Sora 0.17 0.17 0.08 Song Sparrow 1.17 4.08 10.33 1.58 3.17 4.33 5.92 3.92 6.00 6.50 14.42 3.92 1.83 3.50 4.58 9.50 6.83 10.08 1.50 Solitary Vireo 0.08 0.17 0.17 0.08 0.33 0.08 0.17 0.33 0.08 0.17 0.17 Spotted Sandpiper 0.17 Sharp-shinned Hawk 0.08 0.08 0.08 0.08 Steller's Jay 0.08 0.08 2.17 0.25 0.17 0.17 1.08 0.58 0.17 0.25 0.75 1.00 0.67 0.75 2.50 0.50 Swainson's Thrush 1.42 0.67 2.08 0.42 1.00 0.33 0.75 2.75 5.50 8.58 2.08 3.33 2.17 2.67 4.17 4.17 3.33 7.17 3.08 Townsend's Warbler 0.33 0.33 0.17 0.08 0.08 0.17 0.83 0.17 0.08 0.25 0.67 0.25 0.42 0.50 0.08 Tree Swallow 0.08 0.25 0.67 0.25 0.25 0.50 3.17 0.67 0.25 0.08 0.08 0.08 1.25 0.17 0.08 0.58 Varied Thrush 0.08 0.08 0.33 0.08 Vaux's Swift 0.25 0.25 0.17 0.25 0.17 0.75 0.08 0.08 0.08 0.33 0.08 0.42 0.25 Violet-green Swallow 1.33 0.08 0.50 0.42 1.17 0.08 0.83 0.17 0.67 0.17 0.25 0.17 0.33 0.25 0.75 Virginia Rail 0.50 0.08 0.33 0.08 0.17 0.08 Warbling Vireo 0.08 0.67 0.08 0.17 0.08 0.25 0.08 0.08 1.50 0.58 0.08 0.58 0.17 0.25 0.58 White-crowned Sparrow 0.08 0.42 0.50 0.08 0.67 0.25 Western Tanager 0.17 0.75 0.33 0.42 0.50 0.08 0.25 0.25 0.17 0.08 1.25 0.17 Western Wood-pewee 0.25 0.25 0.42 0.17 0.08 0.33 0.50 0.08 0.42
0BCHAPTER 6 BIRD DISTRIBUTION, ABUNDANCE AND HABITAT USE 129
Appendix Table 6-2 continued. Detection rates for species within each wetland all years combined. Detection Rates
Species AL3 B3I BBC24 ELS39 ELS61 ELW1 FC1 HC13 JC28 LCR93 LPS9 MGR36 NFIC12 PC12 RR5 SC4 SC84 SR24 TC13 Willow Flycatcher 0.17 0.42 2.75 0.75 1.92 0.58 1.50 1.50 1.08 4.25 3.33 1.75 0.17 0.75 1.83 0.58 4.08 1.33 Wilson's Warbler 0.58 0.17 1.67 0.33 0.17 0.17 0.75 1.83 1.08 4.50 0.08 1.50 0.75 0.67 3.08 0.67 0.25 2.75 0.92 Winter Wren 1.67 0.25 3.92 0.25 0.25 0.58 0.50 1.42 2.83 1.33 0.42 1.08 0.33 1.08 2.42 0.92 0.42 4.00 2.00 Wood Duck 0.33 0.17 0.17 0.08 0.25 0.08 0.08 0.08 0.08 0.17 0.25 0.08 Yellow Warbler 0.25 0.67 0.92 0.25 0.42 0.83 1.08 0.25 0.67 3.17 0.50 0.25 0.17 0.25 0.58 0.17 1.33 0.17 Yellow-rumped Warbler 0.08 0.08 0.33 0.08 0.08 0.08 0.08 0.25 0.08

0BCHAPTER 6 BIRD DISTRIBUTION, ABUNDANCE AND HABITAT USE 130
Related Documents