1 CHAPTER 5 IDEAL MODELS OF ENGINE CYCLES 5.1 INTRODUCTION 5.2 IDEAL MODELS 5.3 THERMODYNAMIC RELATIONS 5.4 Cycle analysis with constant ideal gas working fluid

Chapter 5_ice
Dec 08, 2015
Its Chapter 5 of something
Welcome message from author
This document is posted to help you gain knowledge. Please leave a comment to let me know what you think about it! Share it to your friends and learn new things together.
Transcript
1
CHAPTER 5 IDEAL MODELS OF ENGINE CYCLES
5.1 INTRODUCTION
5.2 IDEAL MODELS
5.3 THERMODYNAMIC RELATIONS
5.4 Cycle analysis with constant ideal gas
working fluid

5.1 INTRODUCTIONProcesses in ICE
intake compression combustion expansion Exhaust
2
Pressure-volume diagram of firing spark-ignition engine, rc=8.4, 3500 rpmpi=0.4 atm, pe = 1 atm
combustion
exhaust
intake
expansion
compression
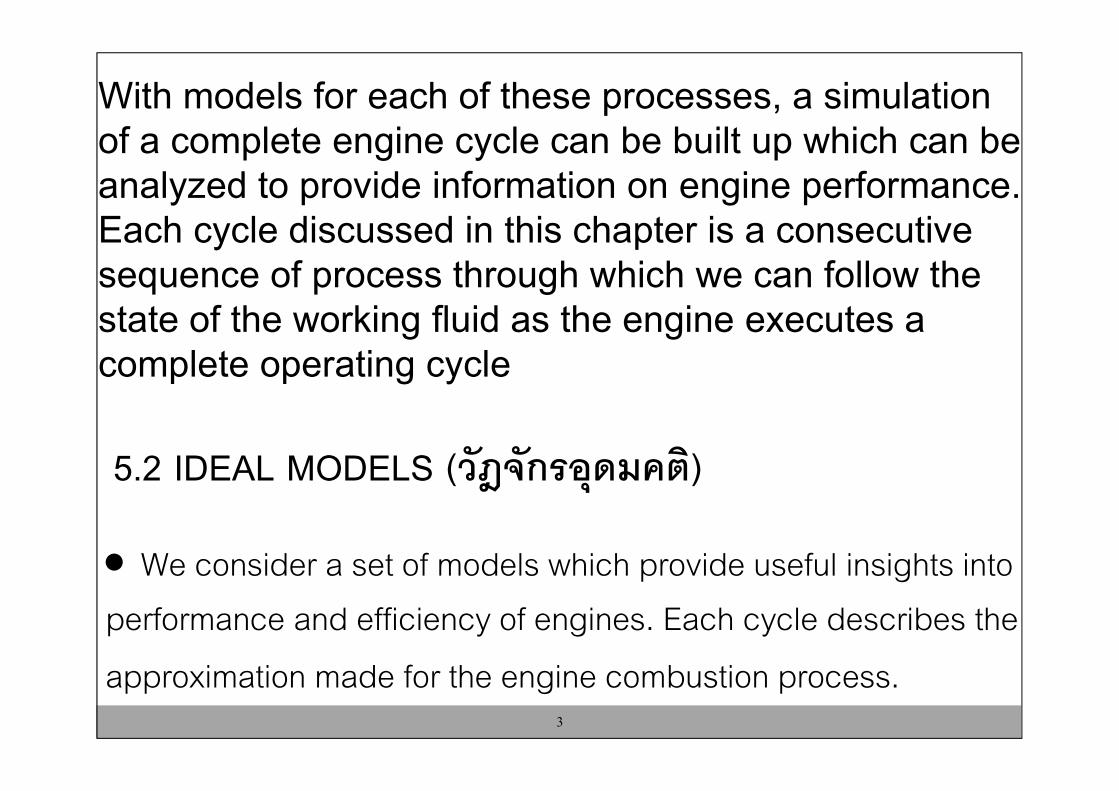
5.2 IDEAL MODELS (วัฎจักรอุดมคต)ิ
We consider a set of models which provide useful insights into performance and efficiency of engines. Each cycle describes the approximation made for the engine combustion process.
With models for each of these processes, a simulation of a complete engine cycle can be built up which can be analyzed to provide information on engine performance. Each cycle discussed in this chapter is a consecutive sequence of process through which we can follow the state of the working fluid as the engine executes a complete operating cycle
3

P-V Diagram - Gas Engine
Bottom Dead Center
Start of compression stroke -volume above piston filled with fuel/air mixture
BDCTDC
Volume
Pre
ssure

P-V Diagram - Gas Engine
BDCTDCVolume
Pre
ssu
re
Piston travels up, fuel/air compressed and pressure rises
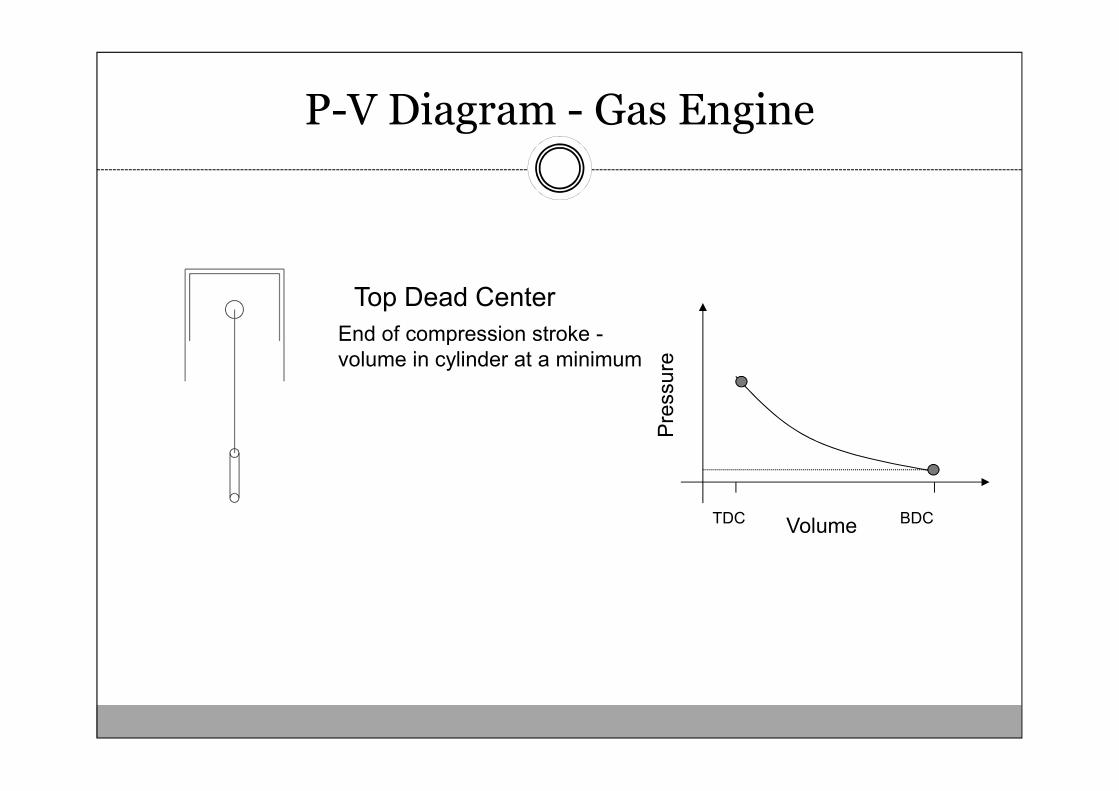
P-V Diagram - Gas Engine
Top Dead Center
End of compression stroke -volume in cylinder at a minimum
BDCTDC Volume
Pre
ssu
re
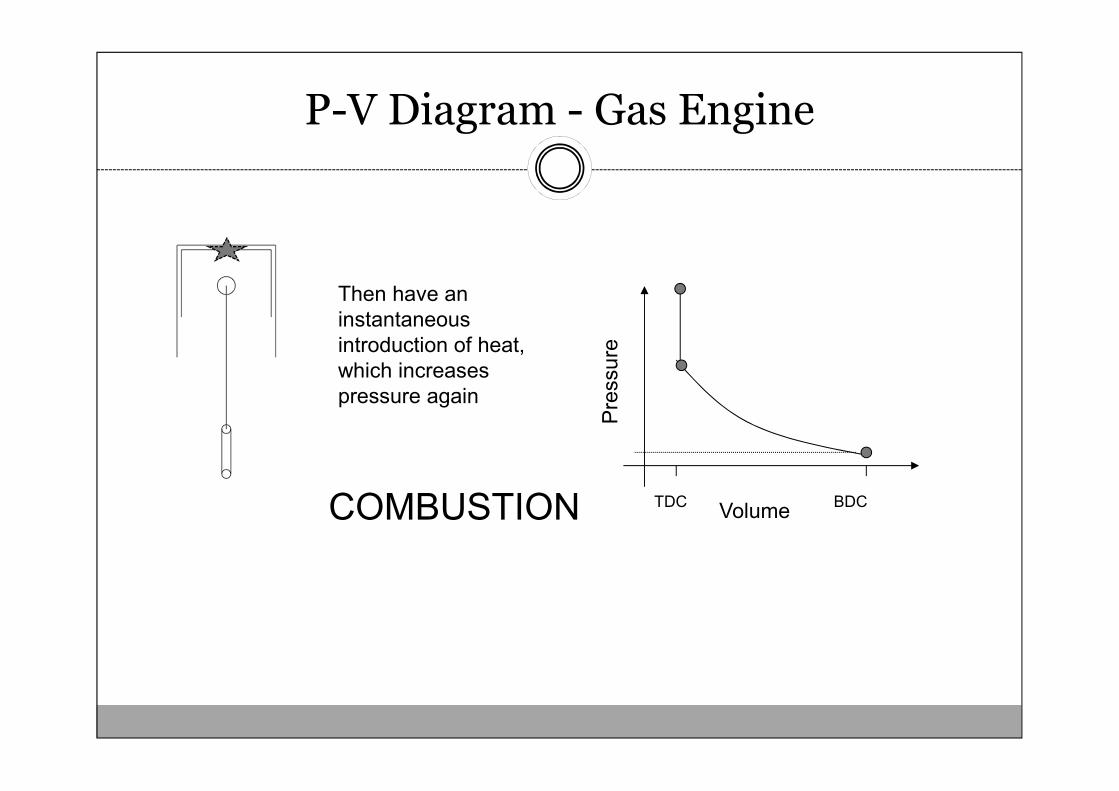
P-V Diagram - Gas Engine
Then have an instantaneous introduction of heat, which increases pressure again
BDCTDCVolume
Pre
ssu
re
COMBUSTION
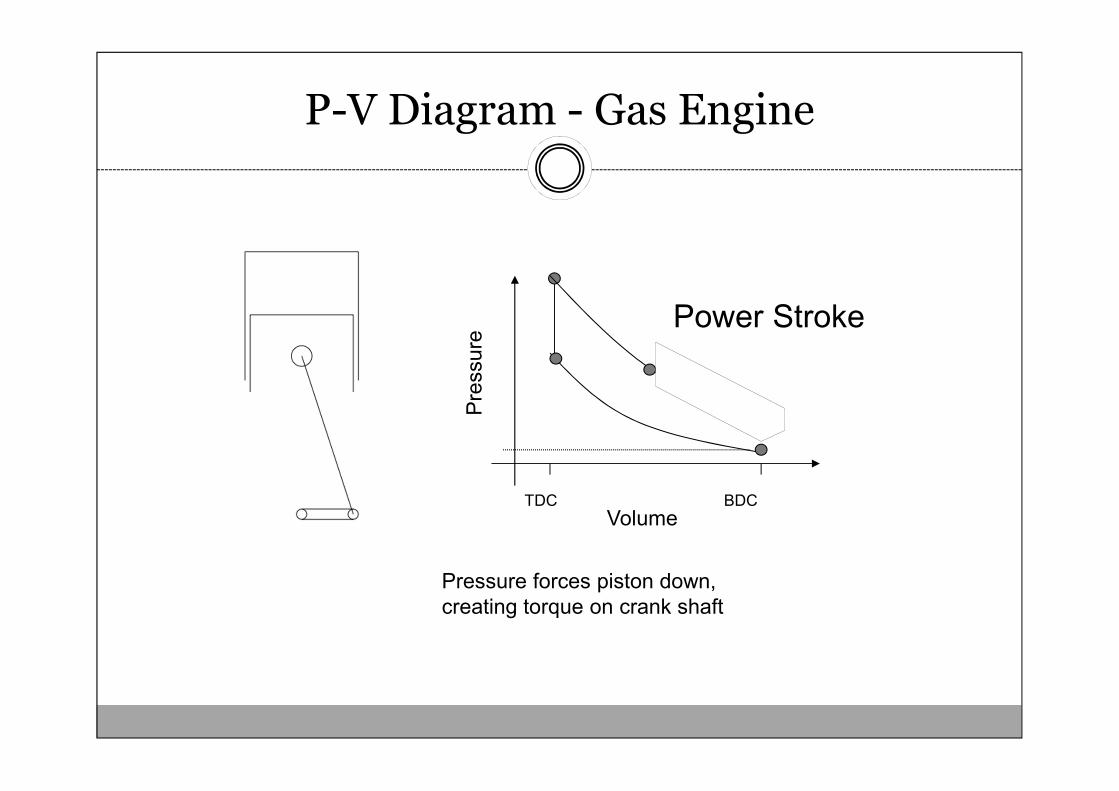
P-V Diagram - Gas Engine
Power Stroke
Pressure forces piston down, creating torque on crank shaft
BDCTDCVolume
Pre
ssu
re
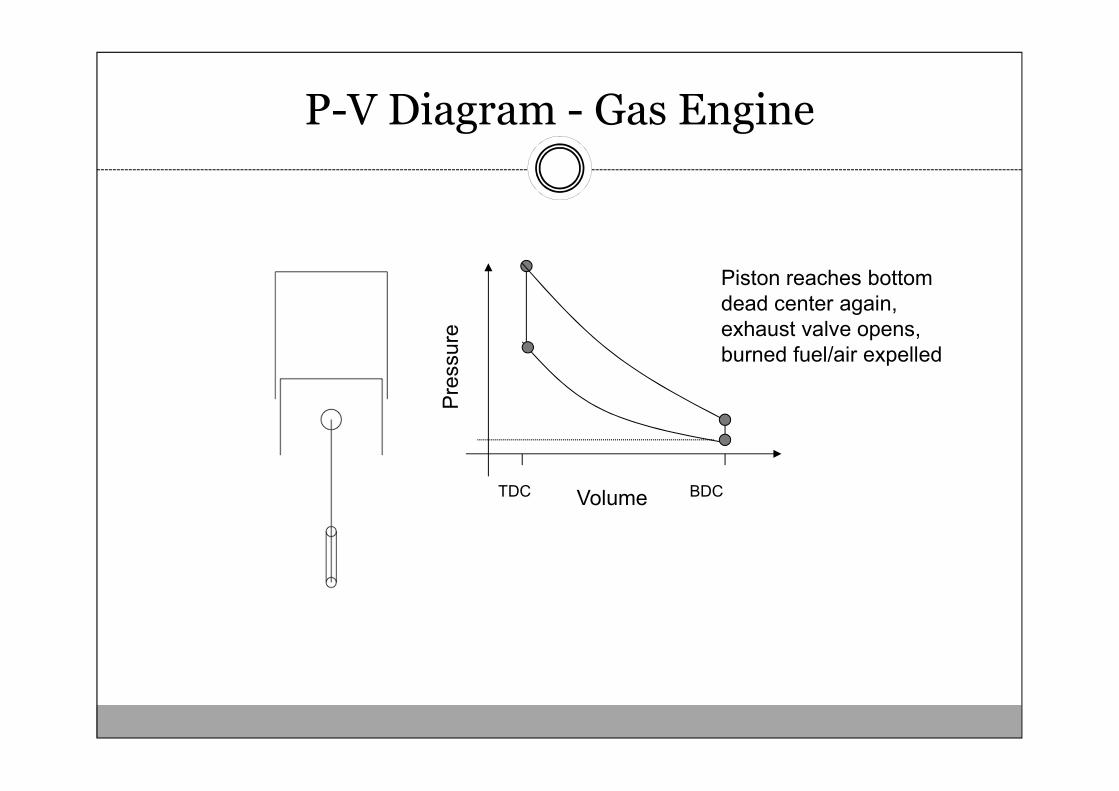
P-V Diagram - Gas Engine
Piston reaches bottom dead center again, exhaust valve opens, burned fuel/air expelled
BDCTDC Volume
Pre
ssu
re

Figure 5.1 Pressure-volume diagram of ideal cycles. Unthrottled operation: (a)constant-volume combustion; (b) constant-pressure combustion; (c) limited-pressurecombustion. (d) throttled constant-volume cycle; (e) supercharged constant-volume
cycle.
(unthrottled)
(throttled)
10
+
(supercharged)

Fresh Charge Metering System
11
www.secondchancegarage.com/public/96.cfm
Partially openedor “throttled”
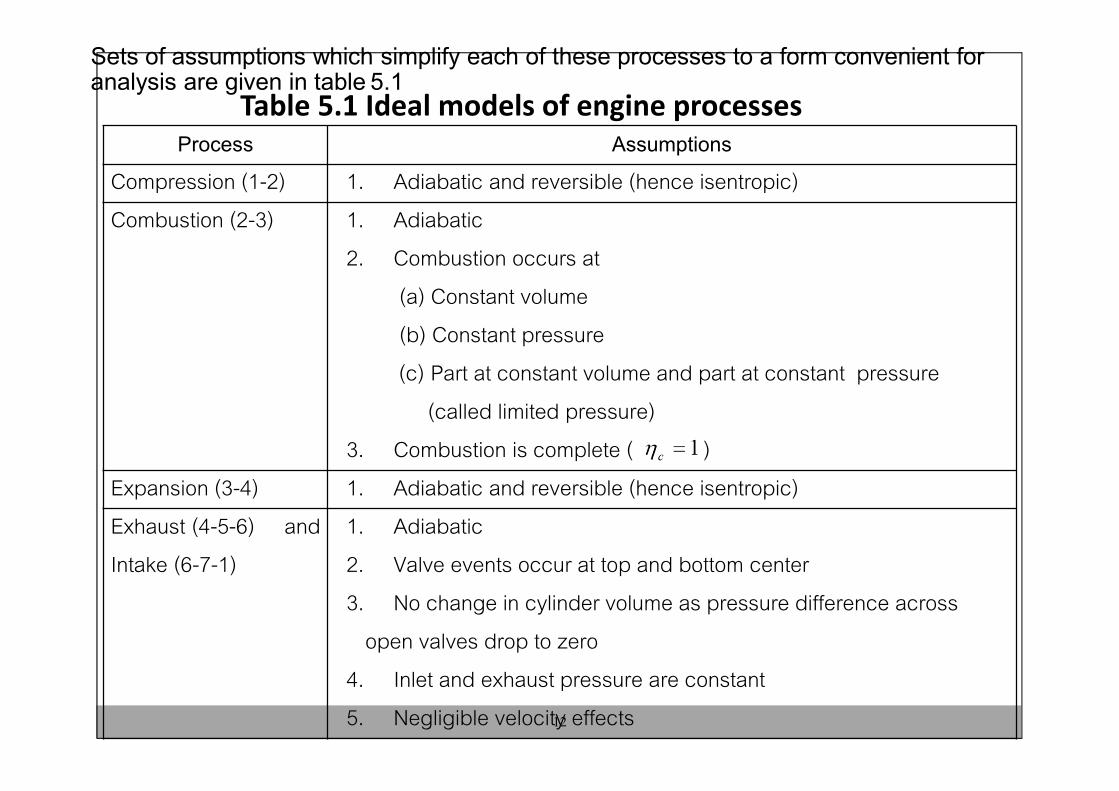
Sets of assumptions which simplify each of these processes to a form convenient for analysis are given in table 5.1
Process AssumptionsCompression (1-2) 1. Adiabatic and reversible (hence isentropic)Combustion (2-3) 1. Adiabatic
2. Combustion occurs at(a) Constant volume(b) Constant pressure(c) Part at constant volume and part at constant pressure
(called limited pressure)3. Combustion is complete ( )
Expansion (3-4) 1. Adiabatic and reversible (hence isentropic)Exhaust (4-5-6) and Intake (6-7-1)
1. Adiabatic2. Valve events occur at top and bottom center3. No change in cylinder volume as pressure difference across
open valves drop to zero4. Inlet and exhaust pressure are constant5. Negligible velocity effects
Table 5.1 Ideal models of engine processes
12

5.3 THERMODYNAMIC RELATIONS
Thermodynamic relations are very useful from which important operating parameters and properties (T, p, u, v, h) of working fluid can be calculated. The overalloperating parameters of greatest interest which can be determined from a thermodynamic analysis of the engine operating cycle are:
13
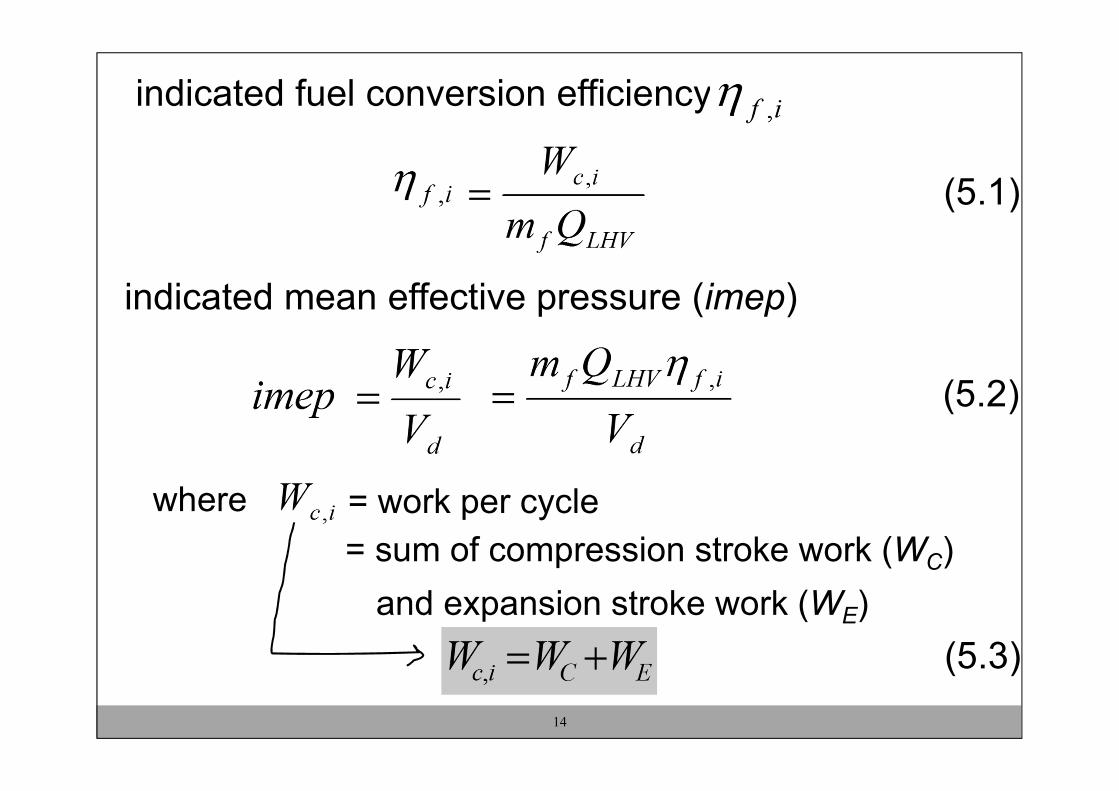
(5.1)
indicated fuel conversion efficiency
14
indicated mean effective pressure (imep)
(5.2)
where = work per cycle
= sum of compression stroke work (WC)
and expansion stroke work (WE)
(5.3)
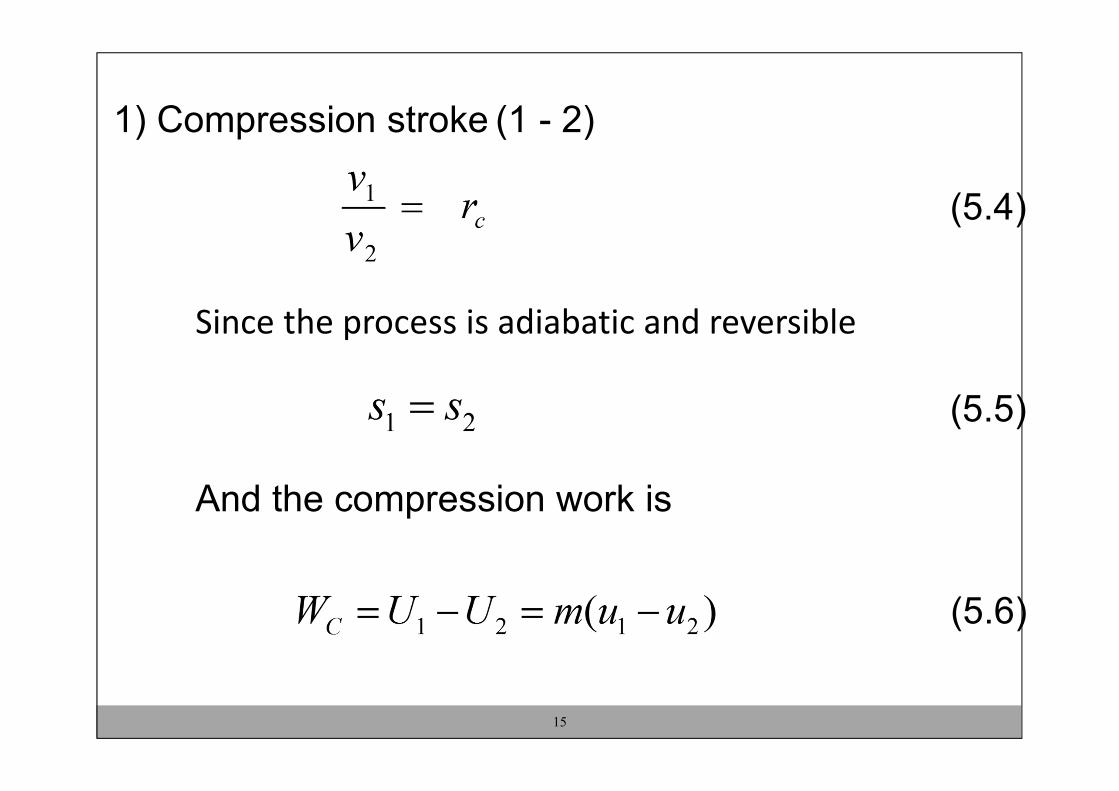
1) Compression stroke (1 - 2)
(5.4)
Since the process is adiabatic and reversible
(5.5)
And the compression work is
(5.6)
15
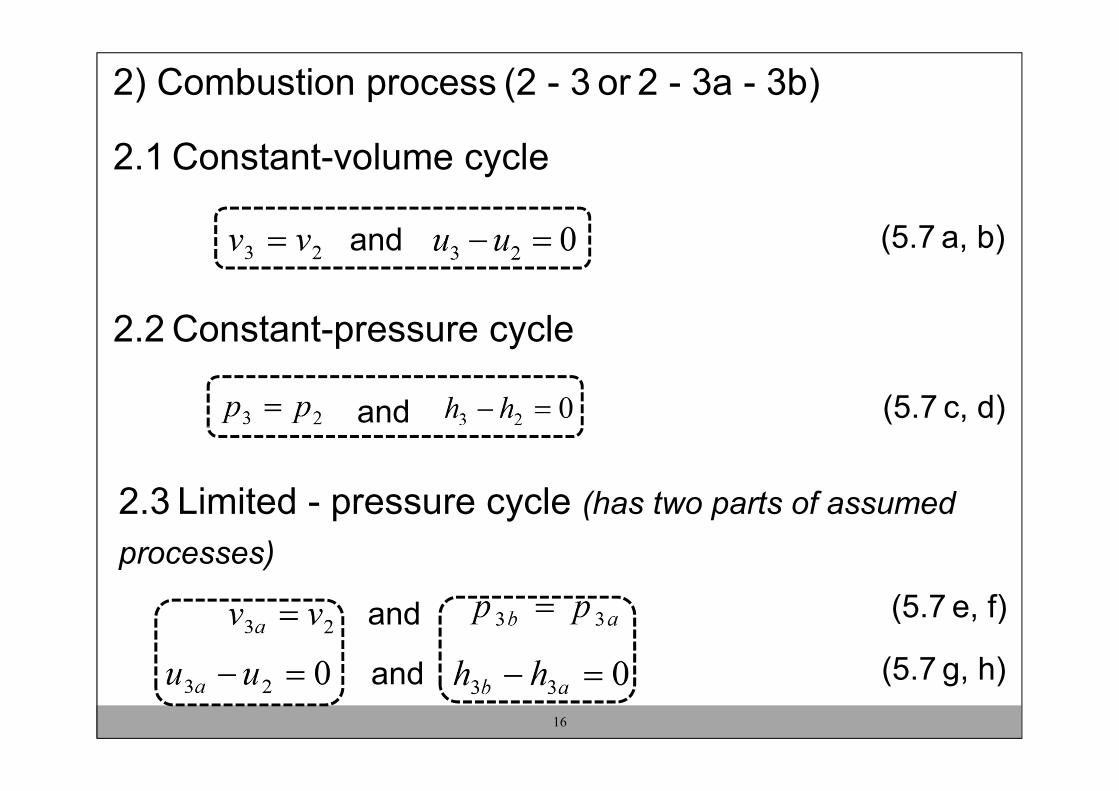
2) Combustion process (2 - 3 or 2 - 3a - 3b)
2.1 Constant-volume cycle
and (5.7 a, b)
2.2 Constant-pressure cycle
and (5.7 c, d)
2.3 Limited - pressure cycle (has two parts of assumed
processes)
and (5.7 e, f)
and (5.7 g, h)
16
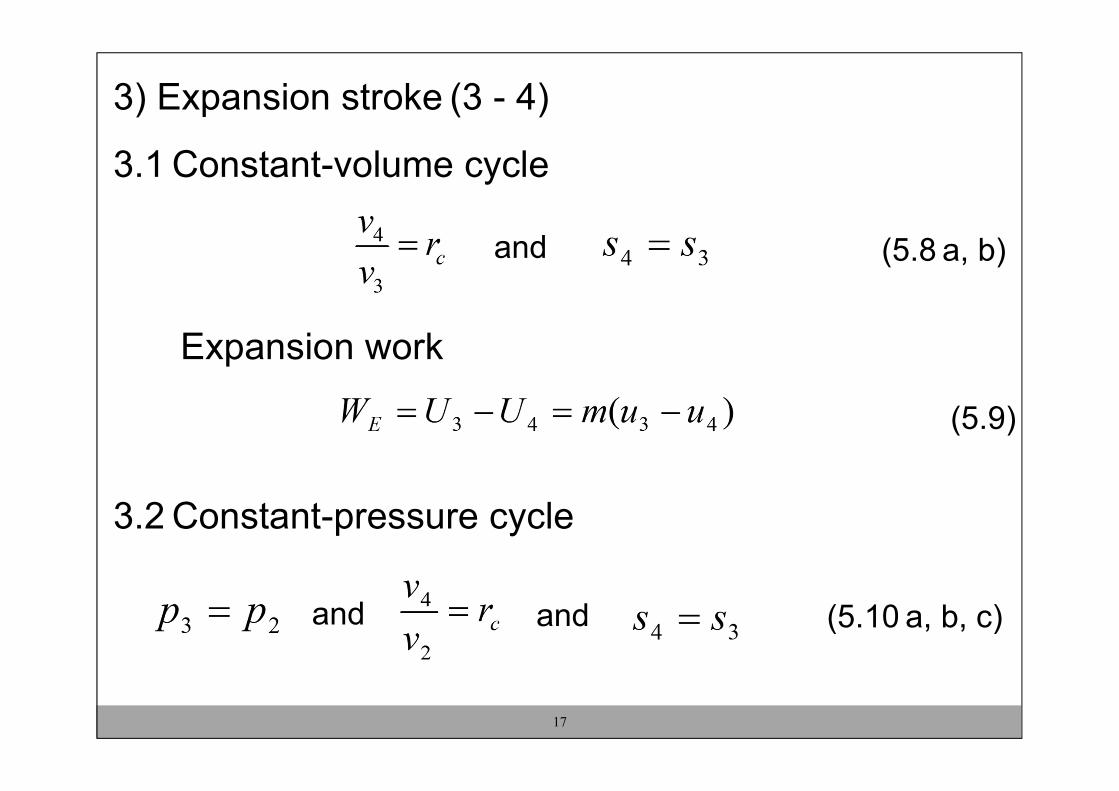
3) Expansion stroke (3 - 4)
3.1 Constant-volume cycle
and (5.8 a, b)
Expansion work
(5.9)
3.2 Constant-pressure cycle
and and (5.10 a, b, c)
17

Expansion work
(5.11)
3.3 Limited - pressure cycle
and and (5.12 a, b, c)
18

Expansion work
(5.13)
Indicated fuel conversion efficiency
19
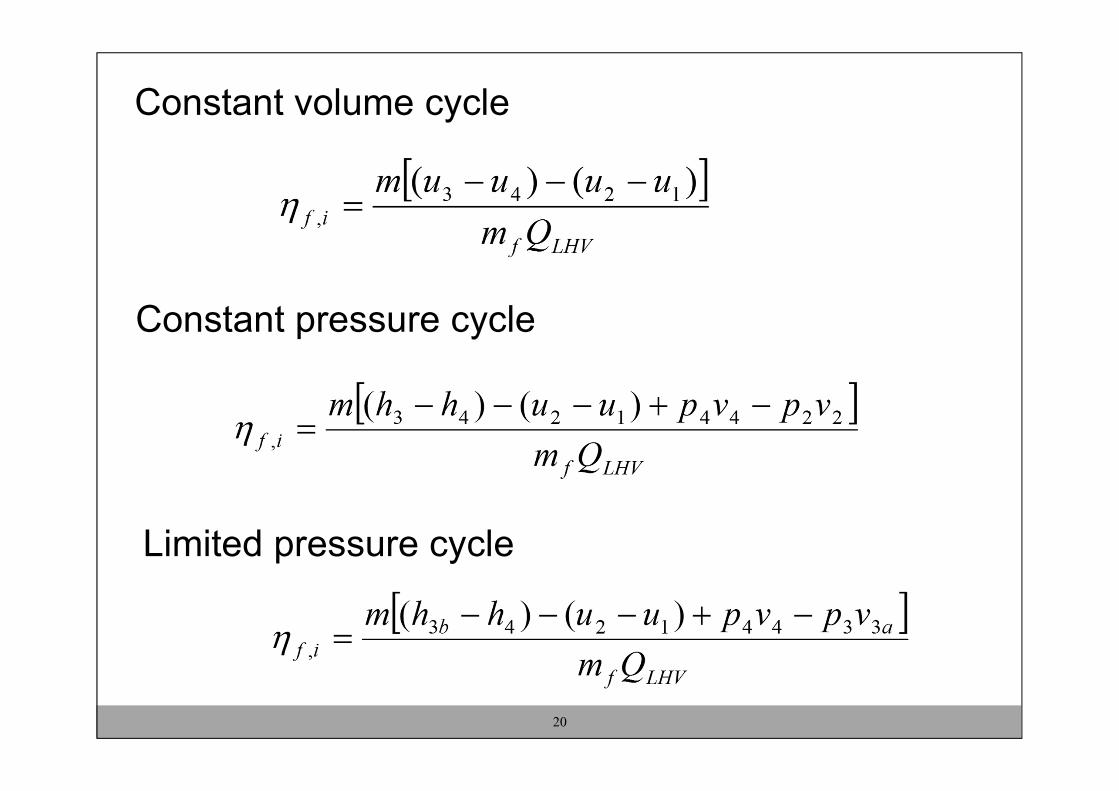
Constant volume cycle
Constant pressure cycle
Limited pressure cycle
20
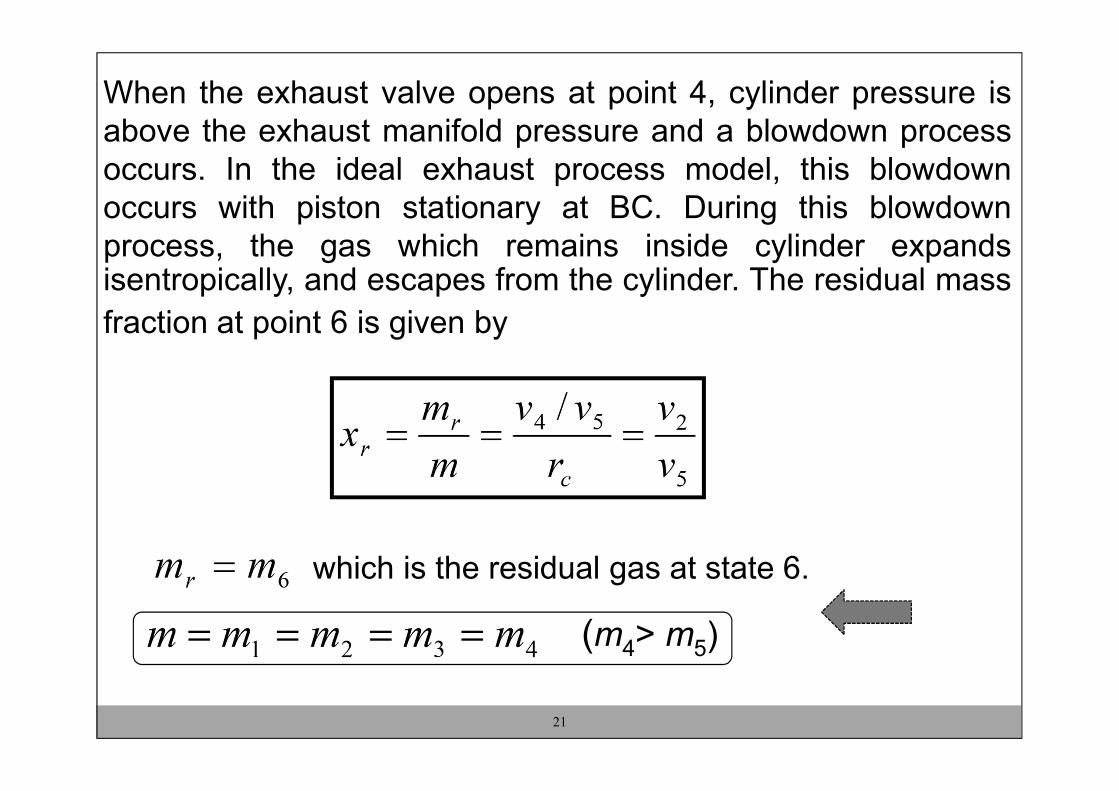
When the exhaust valve opens at point 4, cylinder pressure isabove the exhaust manifold pressure and a blowdown processoccurs. In the ideal exhaust process model, this blowdownoccurs with piston stationary at BC. During this blowdownprocess, the gas which remains inside cylinder expandsisentropically, and escapes from the cylinder. The residual mass
fraction at point 6 is given by
which is the residual gas at state 6.
(m4> m5)
21
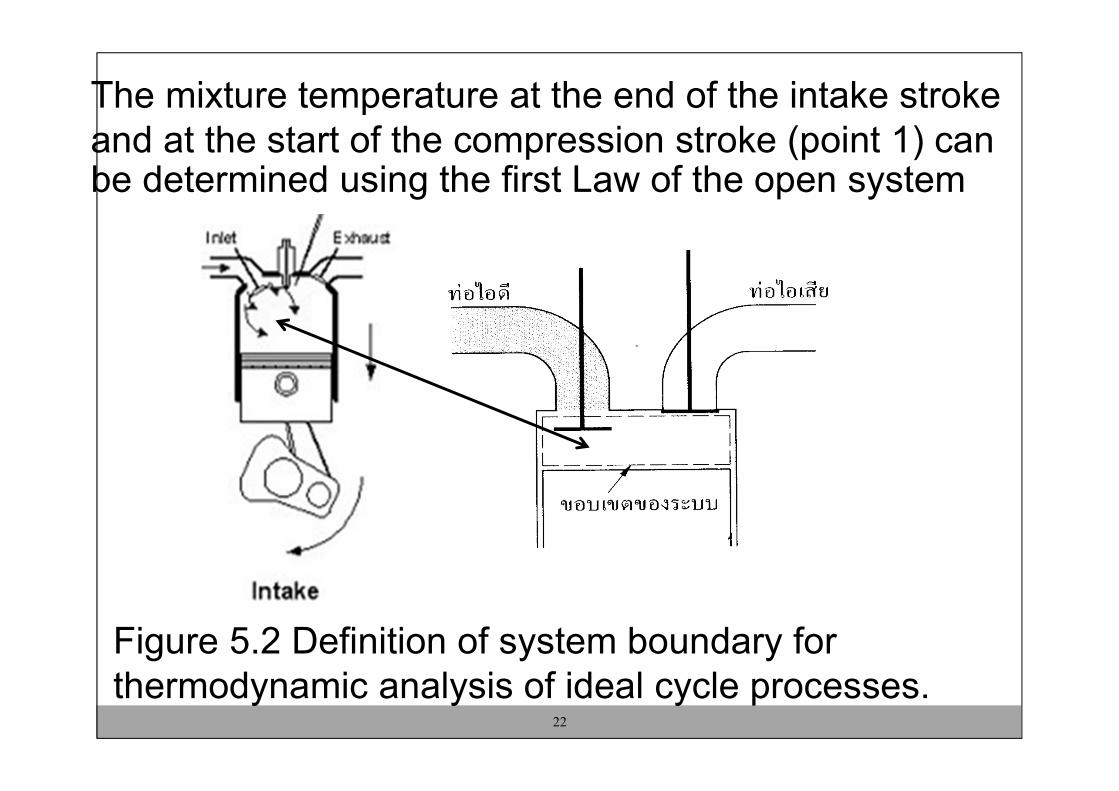
The mixture temperature at the end of the intake stroke and at the start of the compression stroke (point 1) can be determined using the first Law of the open system
Figure 5.2 Definition of system boundary for thermodynamic analysis of ideal cycle processes.
22
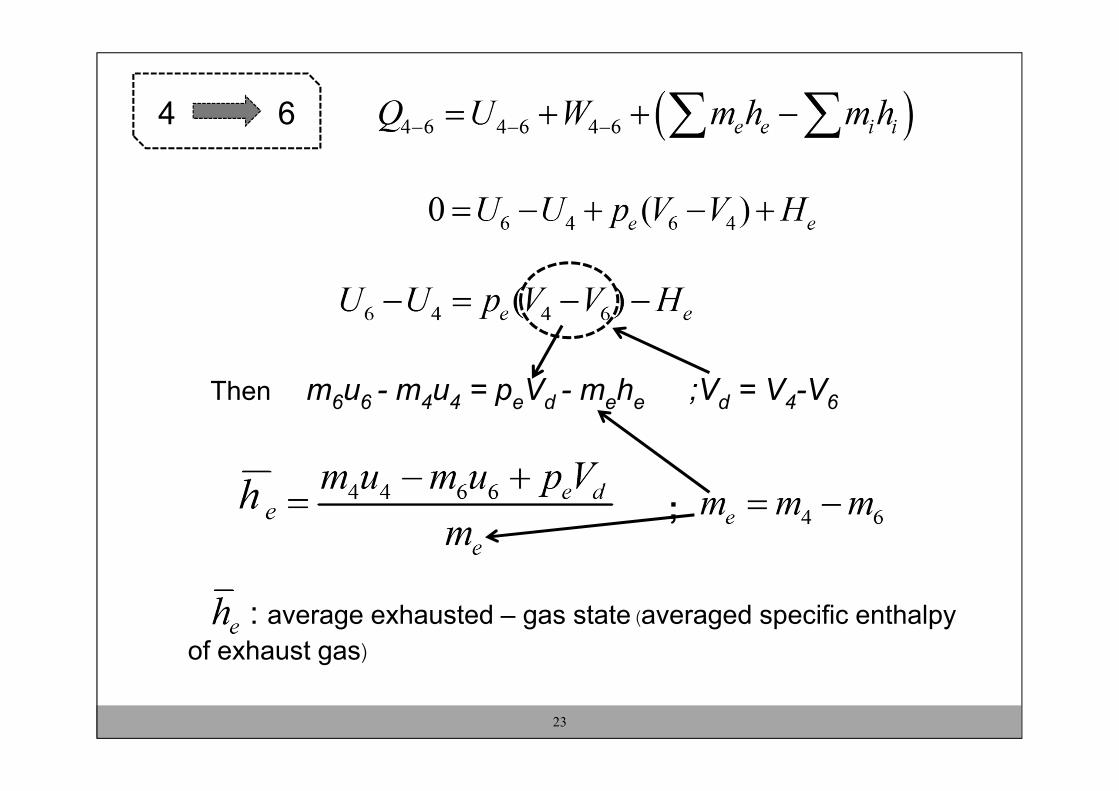
Then m6u6 - m4u4 = peVd - mehe ;Vd = V4-V6
;
: average exhausted – gas state (averaged specific enthalpy
of exhaust gas)
23
4 6
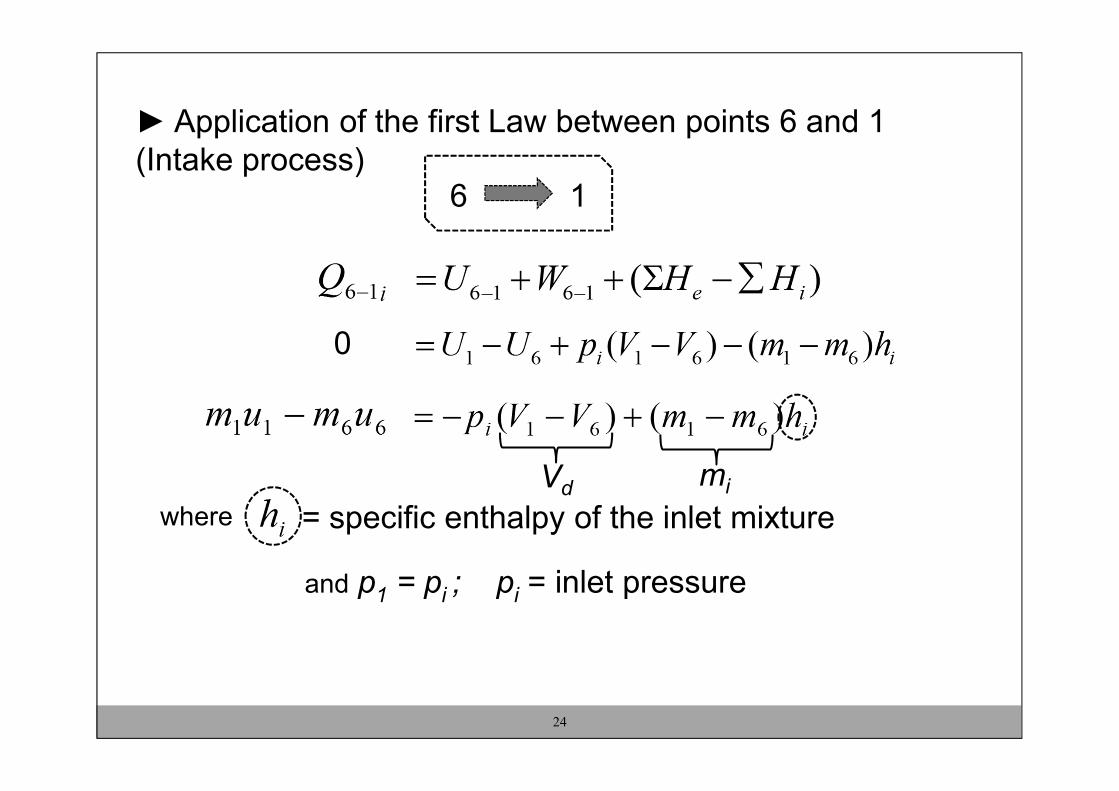
► Application of the first Law between points 6 and 1 (Intake process)
0
where = specific enthalpy of the inlet mixture
and p1 = pi ; pi = inlet pressure
24
6 1
Vd mi
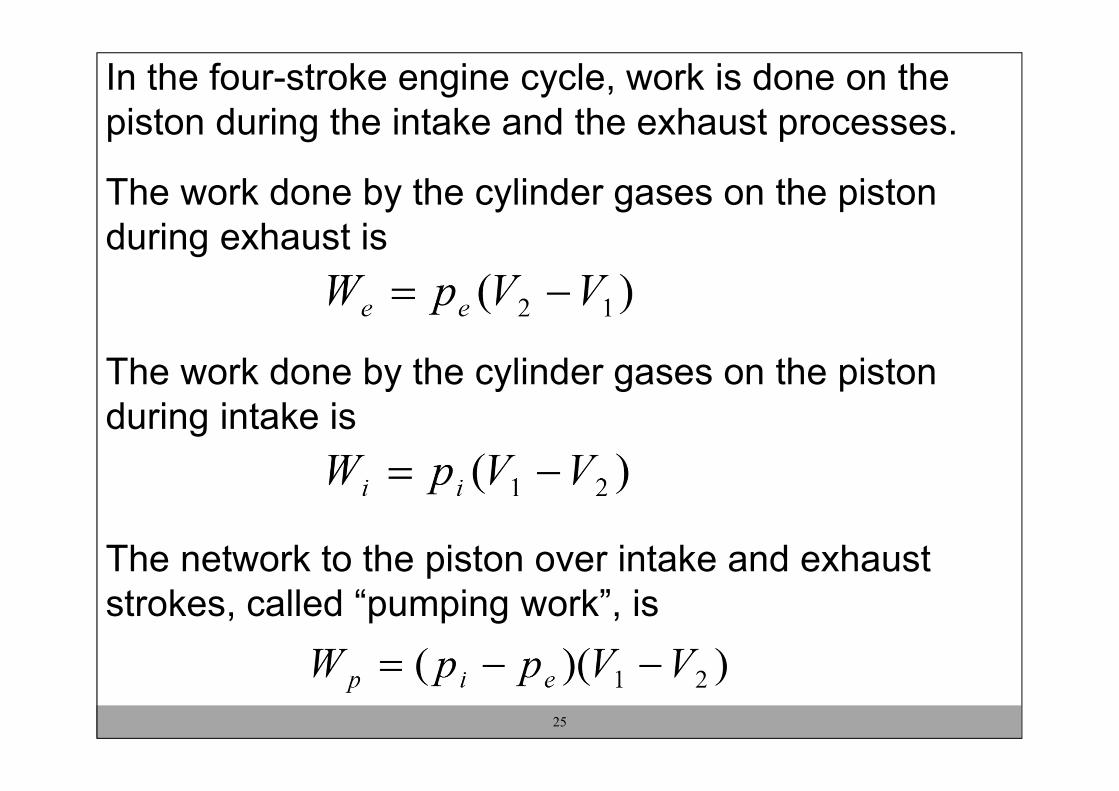
In the four-stroke engine cycle, work is done on the piston during the intake and the exhaust processes.
The work done by the cylinder gases on the piston during exhaust is
The work done by the cylinder gases on the piston during intake is
The network to the piston over intake and exhaust strokes, called “pumping work”, is
25
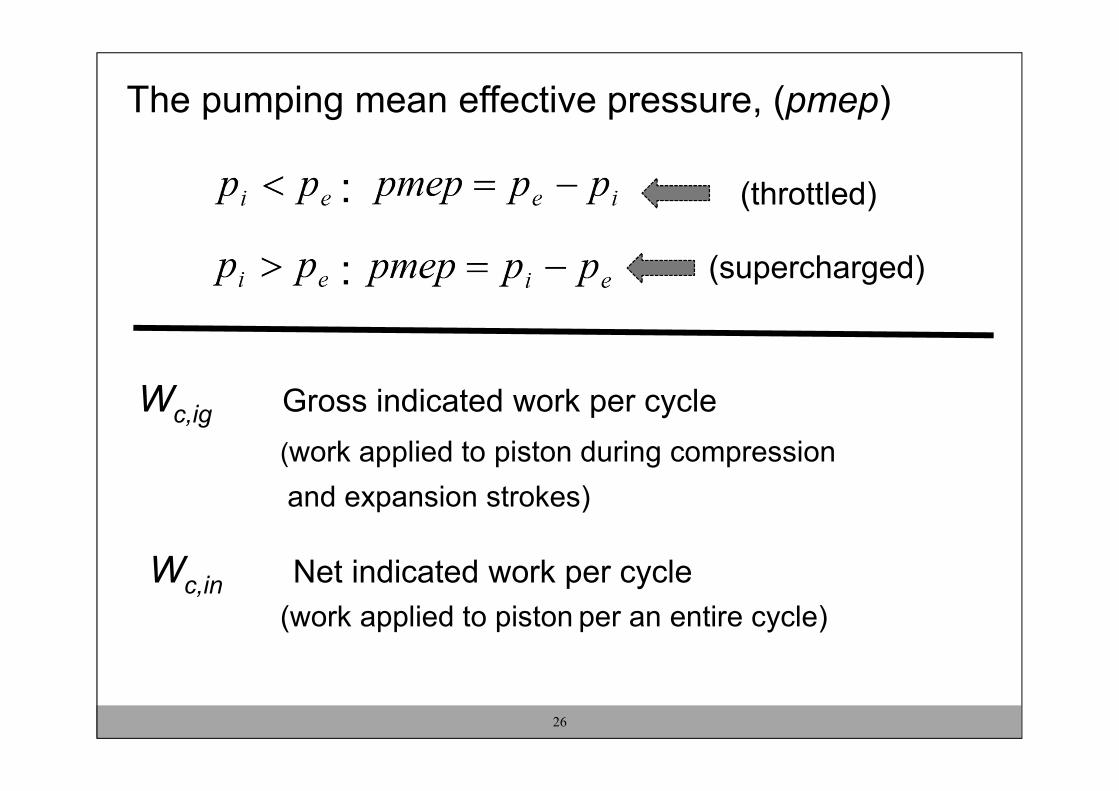
The pumping mean effective pressure, (pmep)
: (throttled)
: (supercharged)
Wc,ig Gross indicated work per cycle
(work applied to piston during compression
and expansion strokes)
Wc,in Net indicated work per cycle
(work applied to piston per an entire cycle)
26

(All W/Vd)
Throttled
Supercharged
The net indicated fuel conversion efficiency is related to the gross indicated fuel conversion efficiency by
27
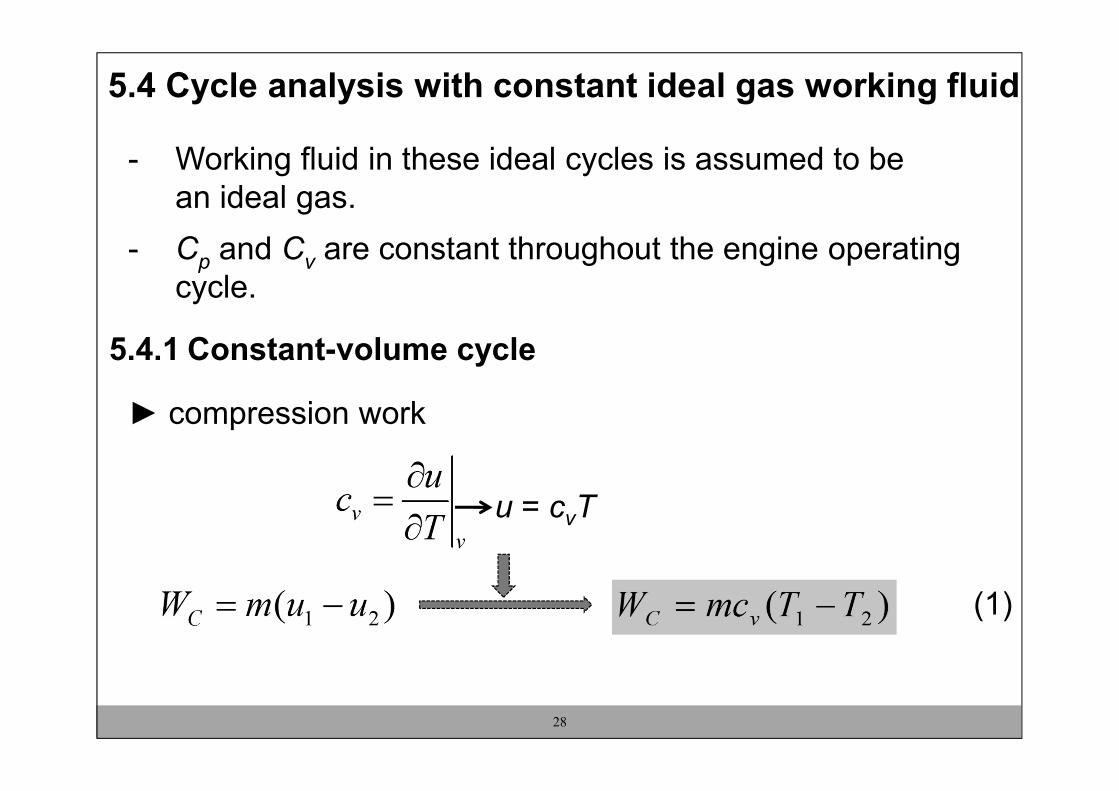
5.4 Cycle analysis with constant ideal gas working fluid
- Working fluid in these ideal cycles is assumed to be an ideal gas.
- Cp and Cv are constant throughout the engine operating cycle.
5.4.1 Constant-volume cycle
► compression work
(1)
28
u = cvT
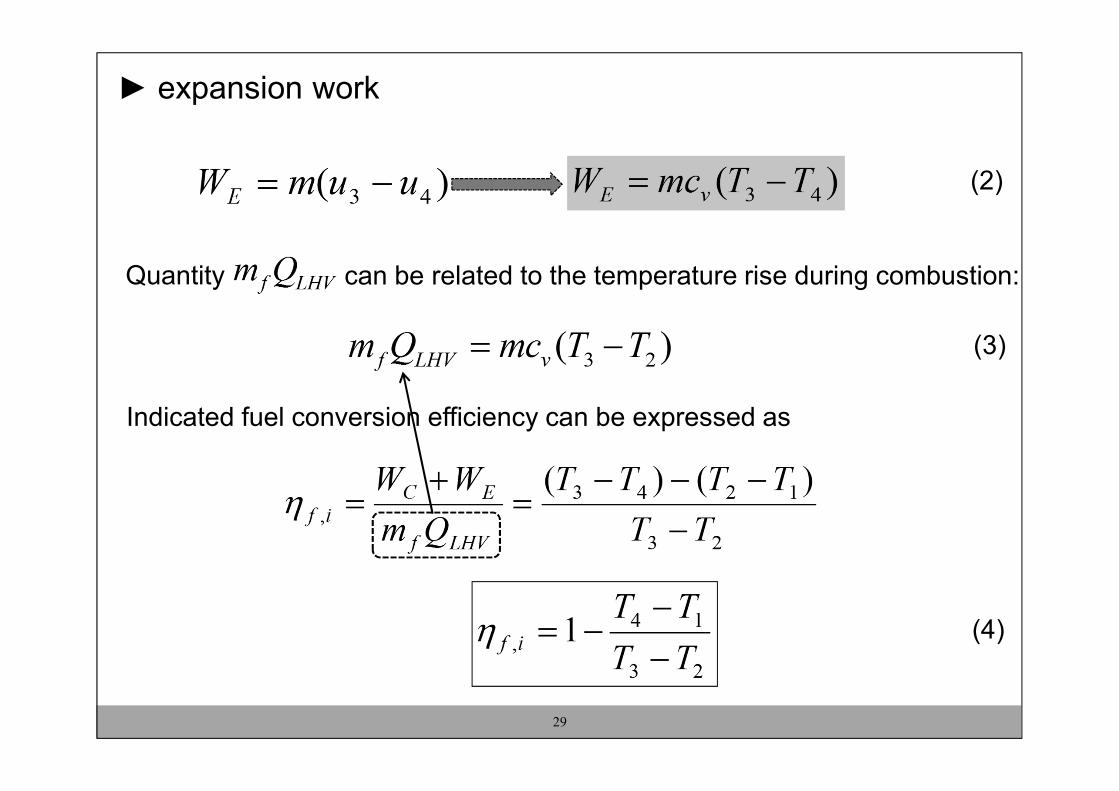
► expansion work
(2)
Quantity can be related to the temperature rise during combustion:
(3)
Indicated fuel conversion efficiency can be expressed as
(4)
29
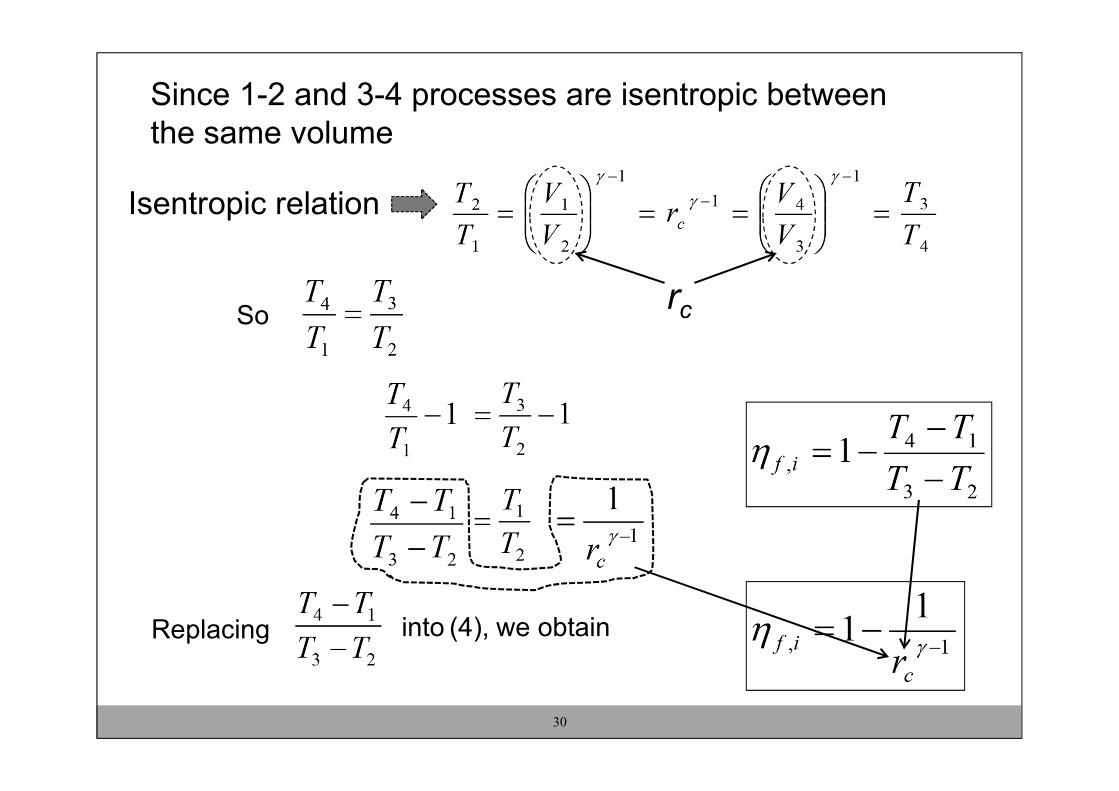
Since 1-2 and 3-4 processes are isentropic betweenthe same volume
30
Isentropic relation
rcSo
Replacing into (4), we obtain

Figure 5.2 Ideal gas constant-volume cycle fuel conversion efficiency as a function of compression ratio
31
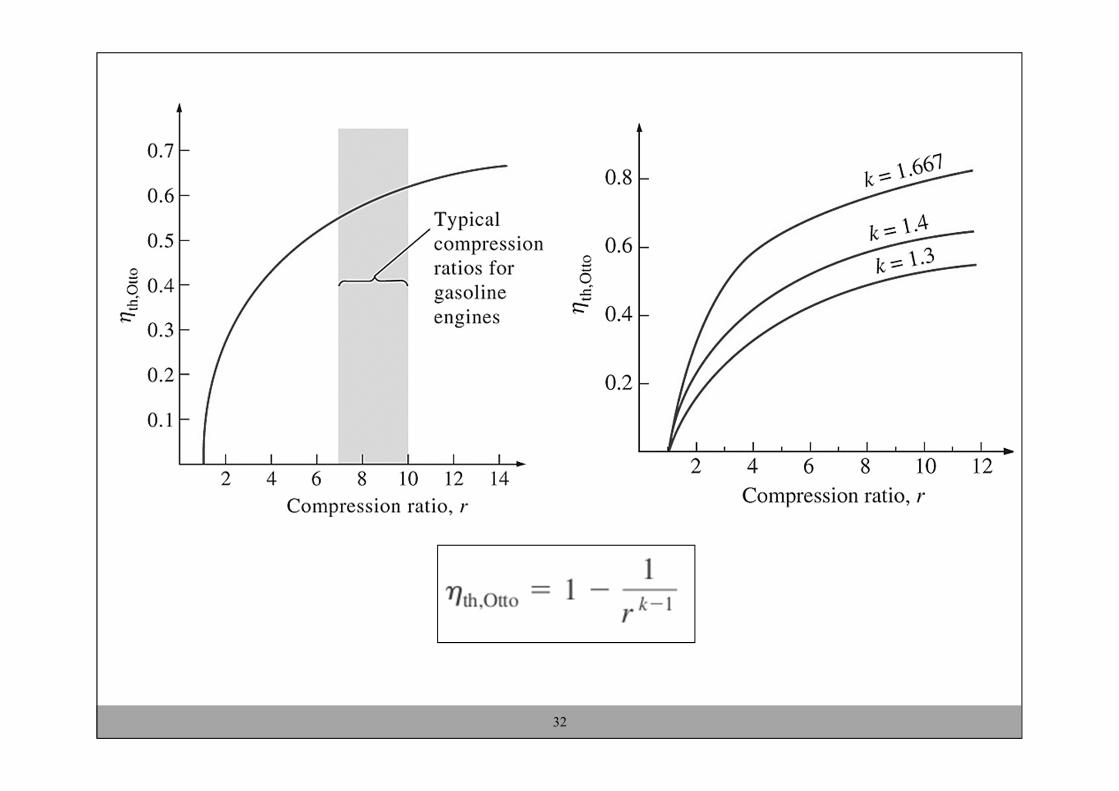
32
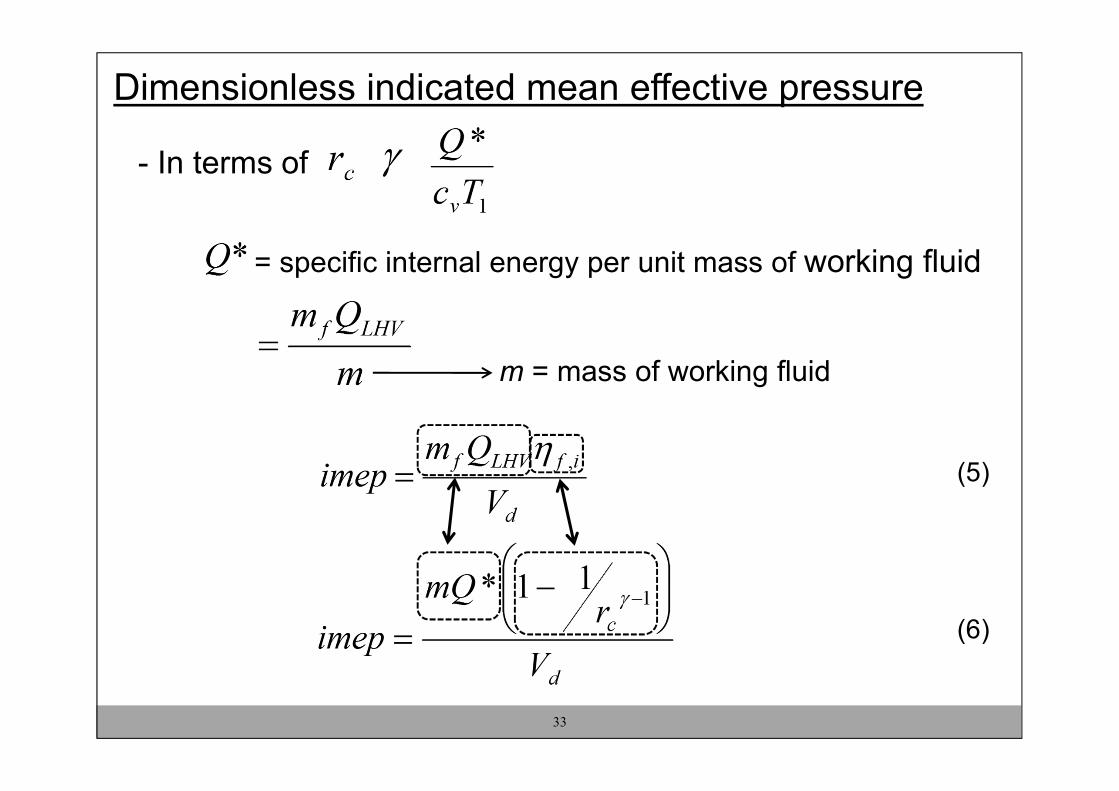
Dimensionless indicated mean effective pressure
- In terms of
= specific internal energy per unit mass of working fluid
m = mass of working fluid
33
(5)
(6)

At state (1): p1V1 = mRT1
And by the definition of rc, rc
rc Vd
34

Then using and
35
(from R = Cp- Cv)

► It is also useful to compare imep with the maximum
pressure in the cycle,
From the constant volume process (2-3)
From the isentropic process (1-2)
(7)36
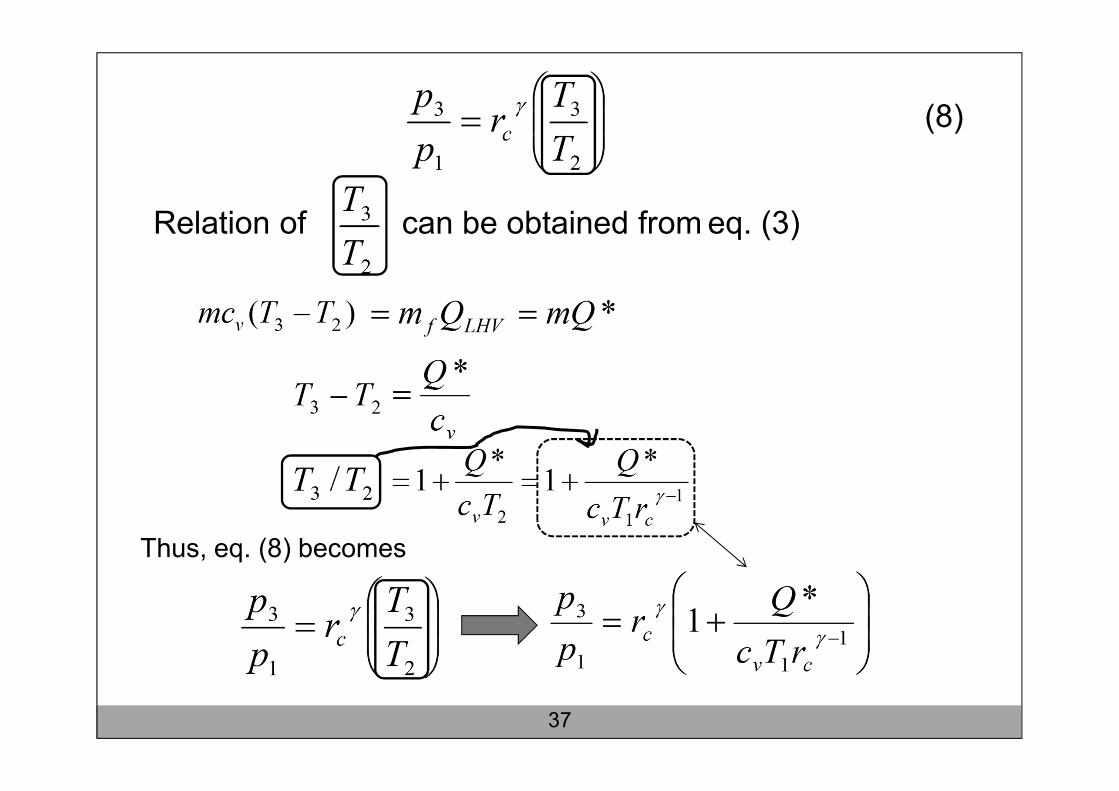
(8)
Relation of can be obtained from eq. (3)
Thus, eq. (8) becomes
37

(note that is known)
Mass fraction of residual gas xr at state 6 (end of exhaust)
: Isentropic expansion from state 4 to 5
38
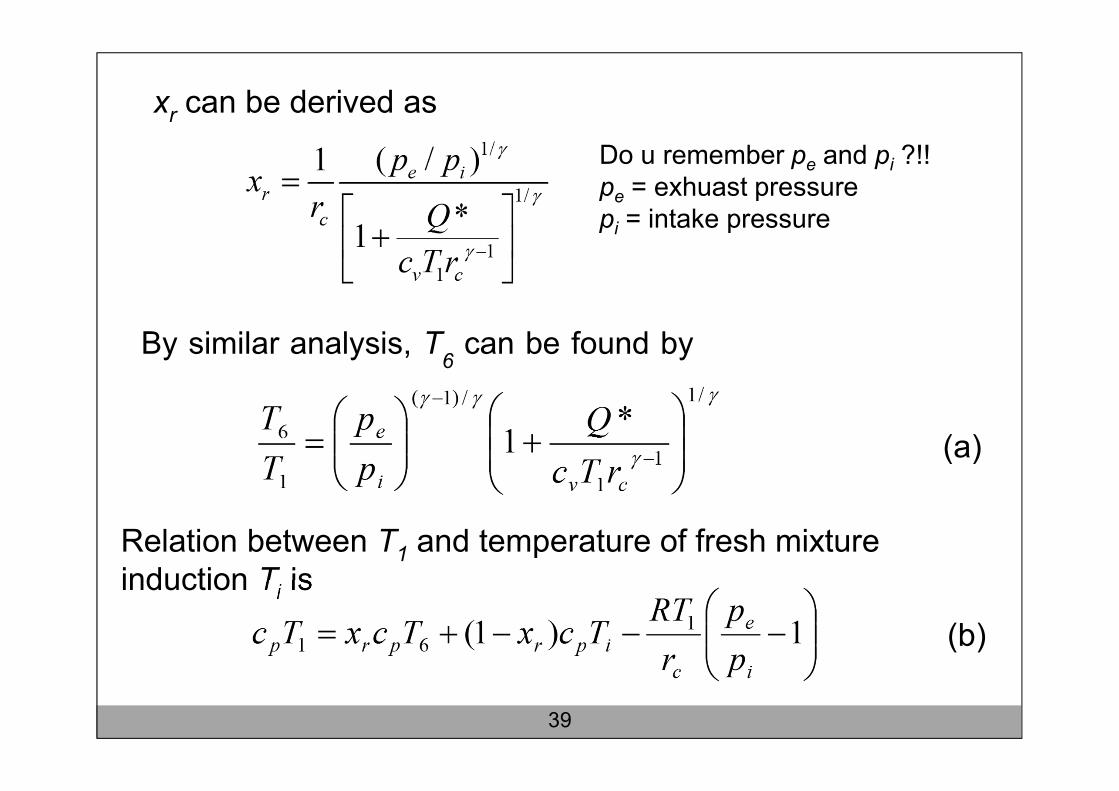
xr can be derived as
By similar analysis, T6 can be found by
(a)
Relation between T1 and temperature of fresh mixture induction Ti is
(b)
39
Do u remember pe and pi ?!!pe = exhuast pressurepi = intake pressure

From (a) and (b), we obtain ratio of T1 and Ti
5.4.2 Limited and constant pressure cycle
Compression work
►
Expansion work
►
40
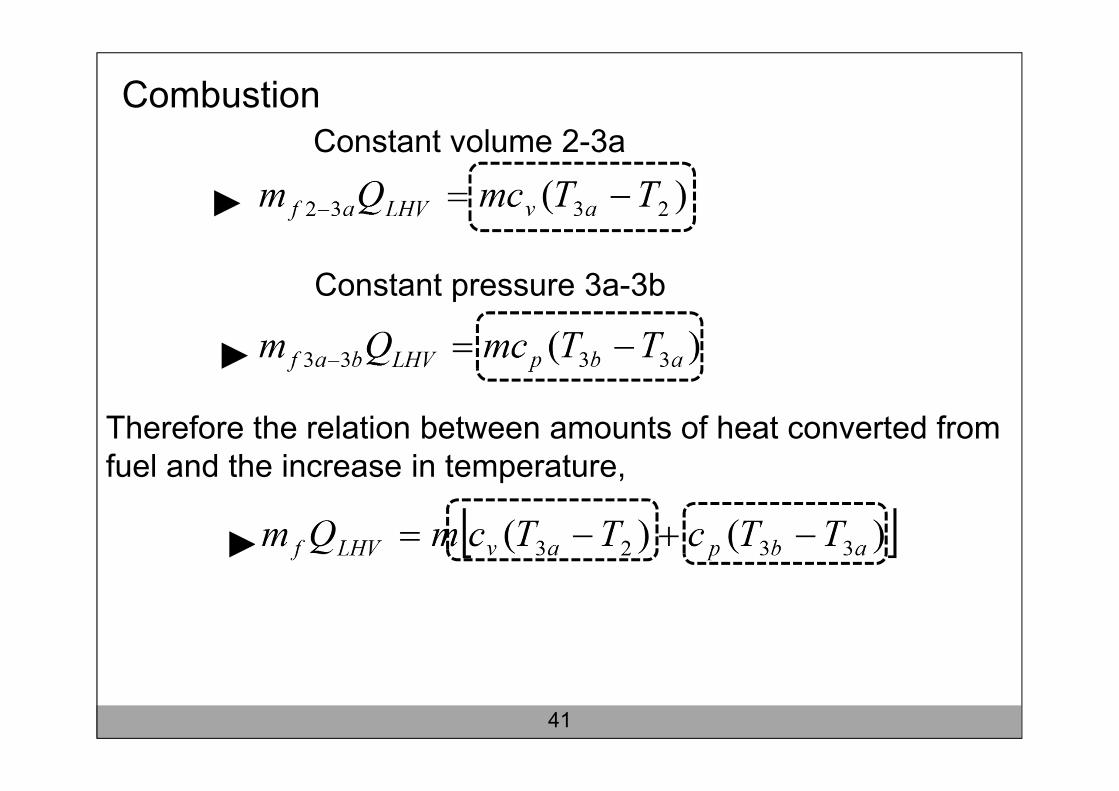
CombustionConstant volume 2-3a
►
Constant pressure 3a-3b
►
Therefore the relation between amounts of heat converted from fuel and the increase in temperature,
►
41
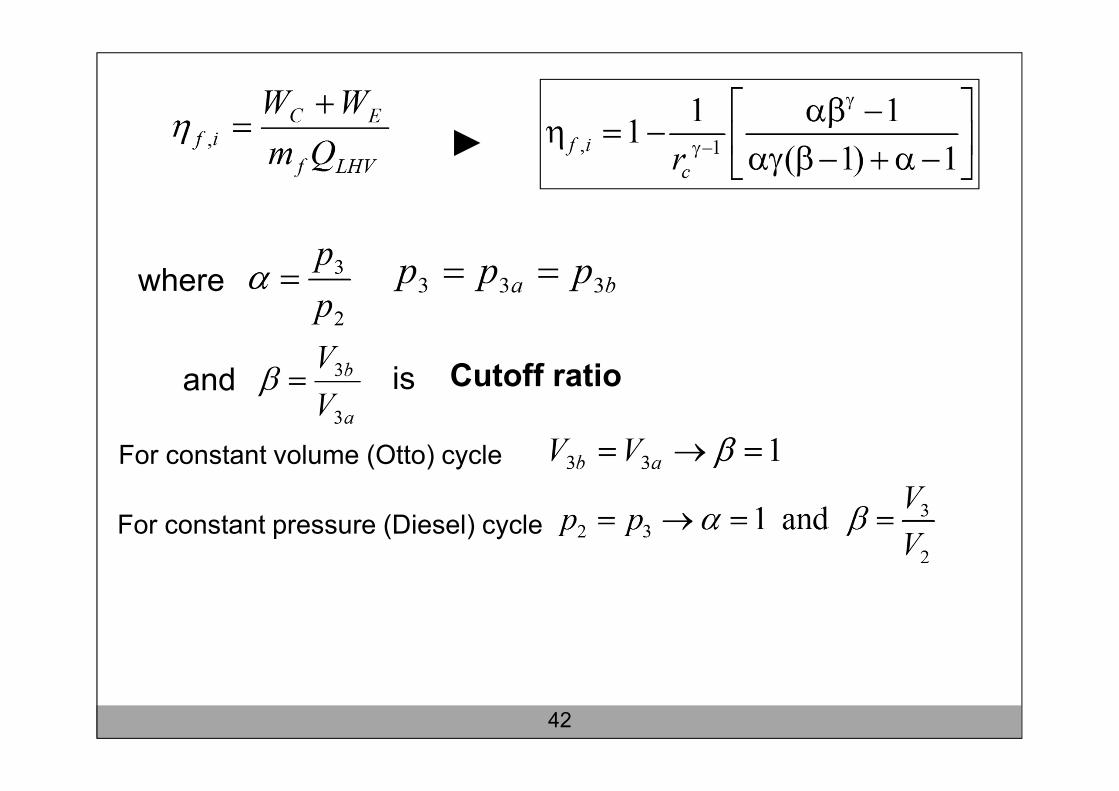
►
where
and
For constant volume (Otto) cycle
For constant pressure (Diesel) cycle
42
Cutoff ratio is

Cutoff ratio β is defined as a ratio of volumes after and before combustion :
For the same rc
Always greater than 1 !
43
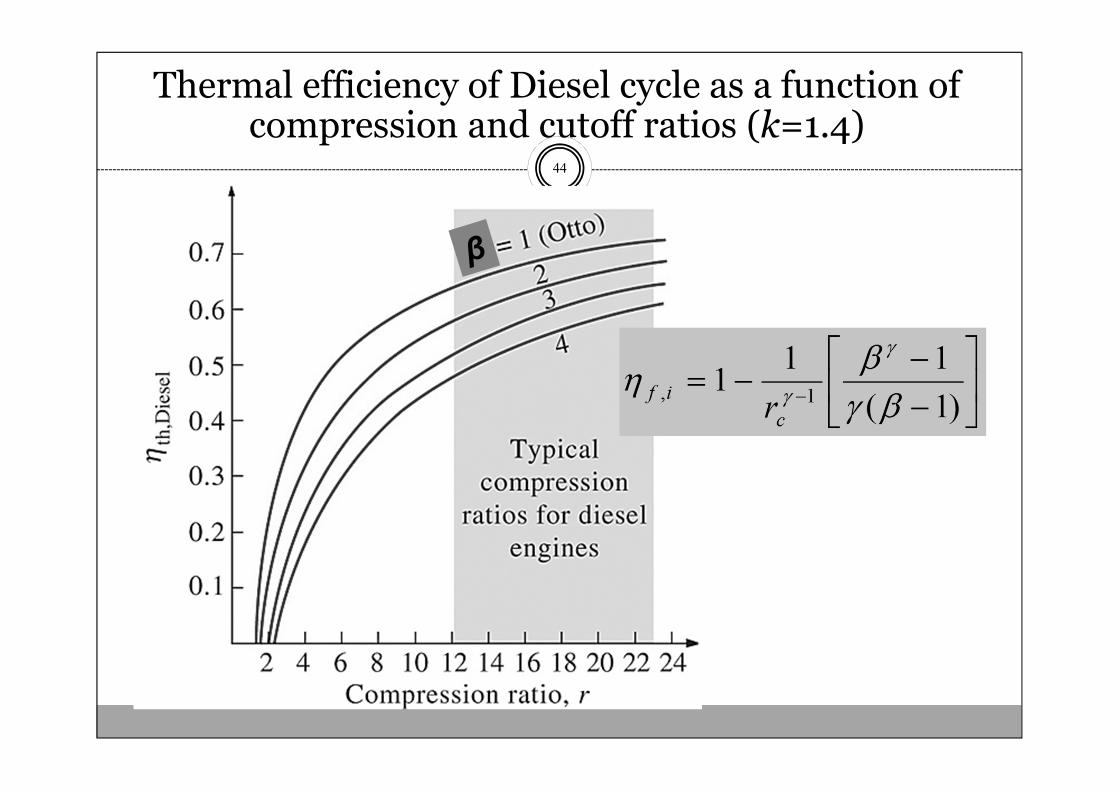
Thermal efficiency of Diesel cycle as a function of compression and cutoff ratios (k=1.4)
44
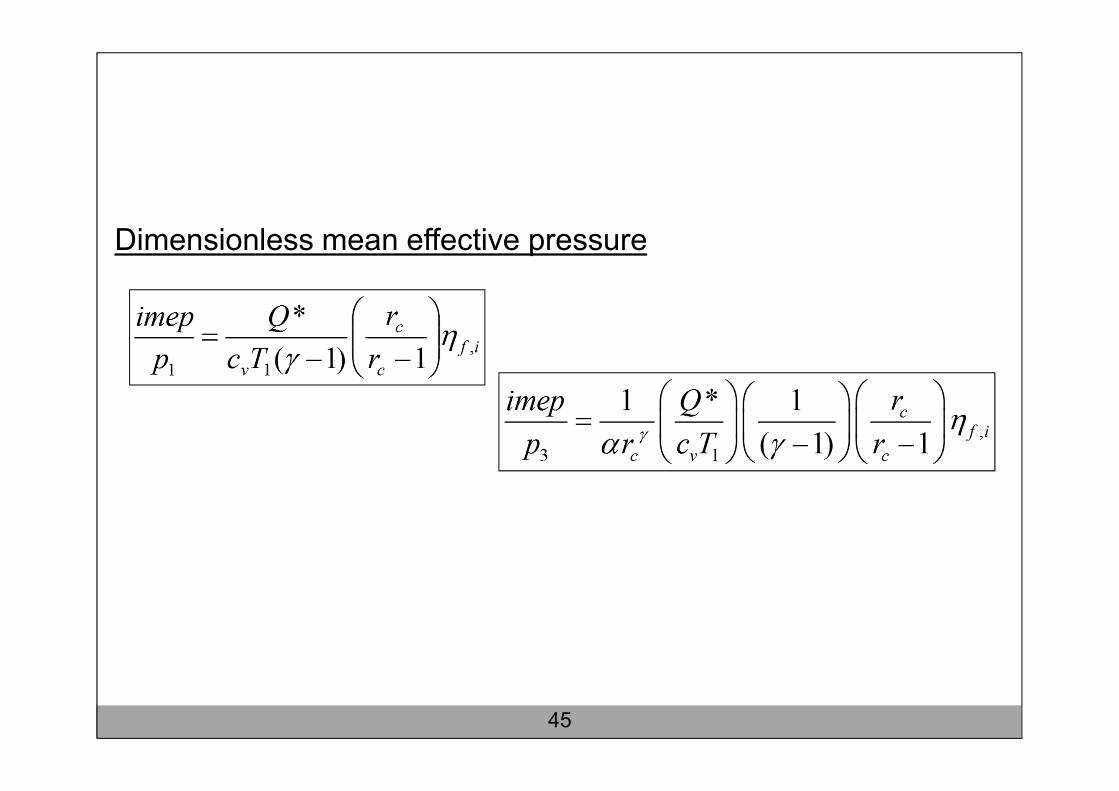
Dimensionless mean effective pressure
45
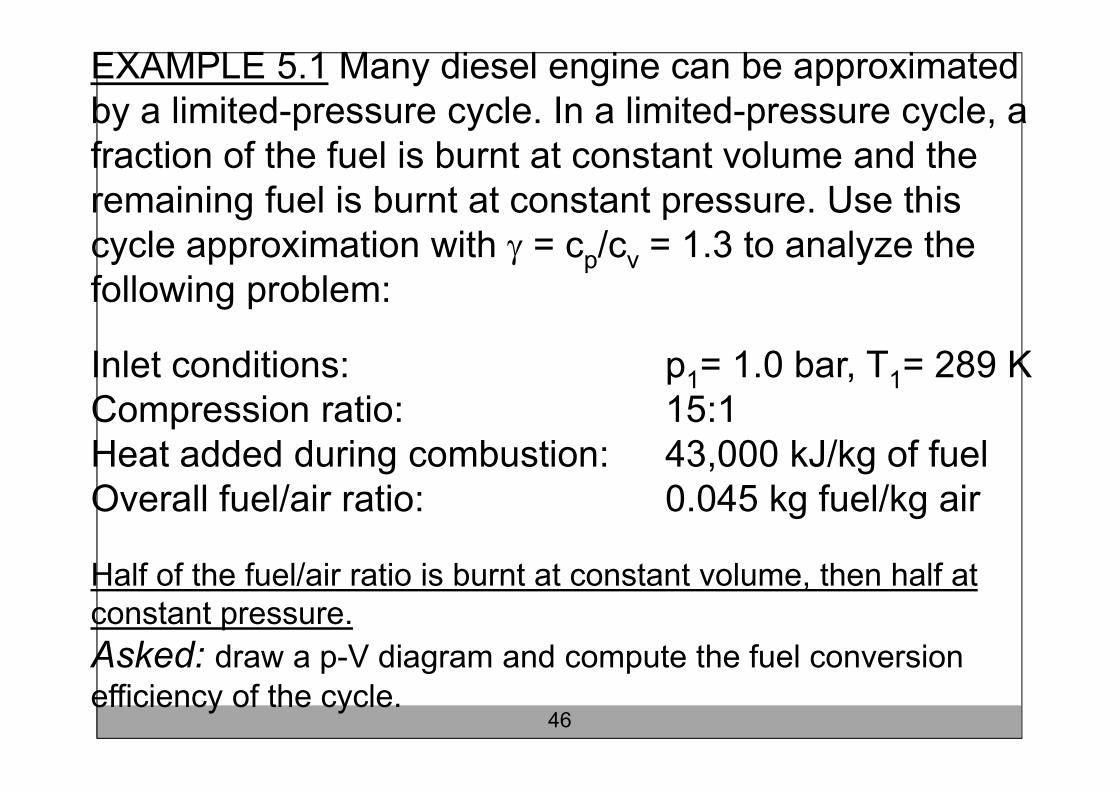
EXAMPLE 5.1 Many diesel engine can be approximated by a limited-pressure cycle. In a limited-pressure cycle, a fraction of the fuel is burnt at constant volume and the remaining fuel is burnt at constant pressure. Use this cycle approximation with = cp/cv = 1.3 to analyze the following problem:
Inlet conditions: p1= 1.0 bar, T1= 289 KCompression ratio: 15:1Heat added during combustion: 43,000 kJ/kg of fuelOverall fuel/air ratio: 0.045 kg fuel/kg air
Half of the fuel/air ratio is burnt at constant volume, then half at constant pressure.
Asked: draw a p-V diagram and compute the fuel conversion efficiency of the cycle.
46
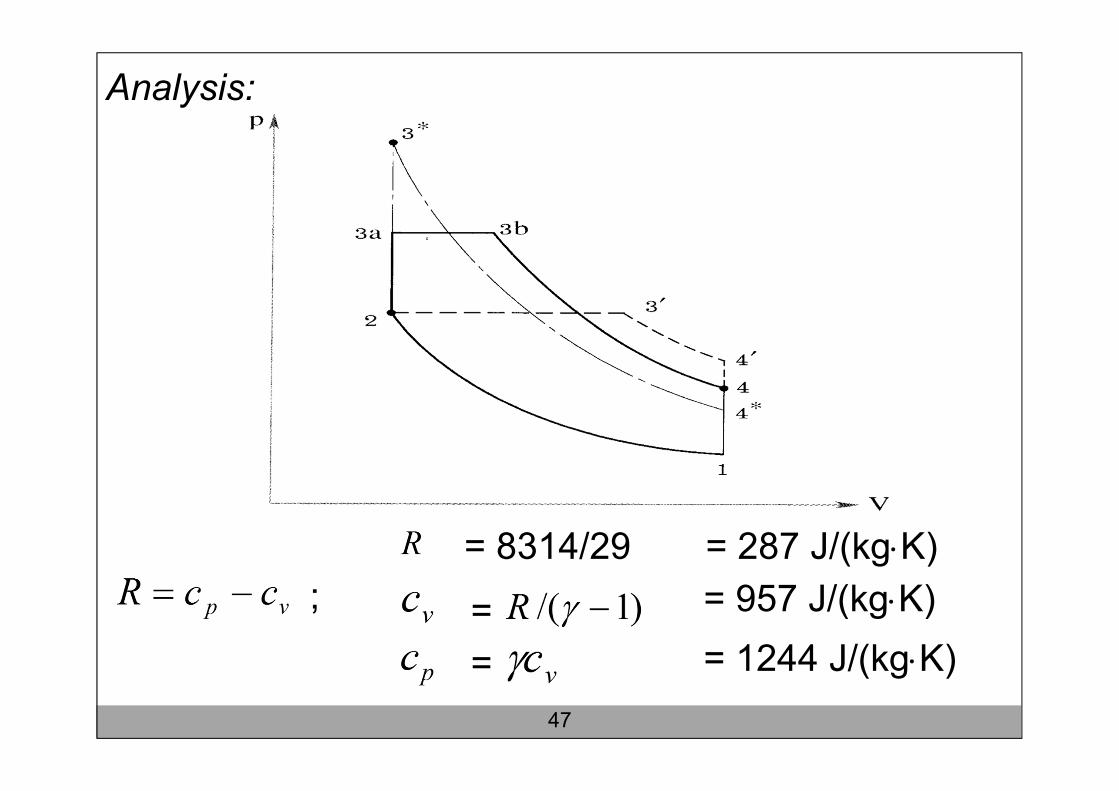
Analysis:
= 8314/29 = 287 J/(kgK)
;
=
= 957 J/(kgK)=
= 1244 J/(kgK)
47
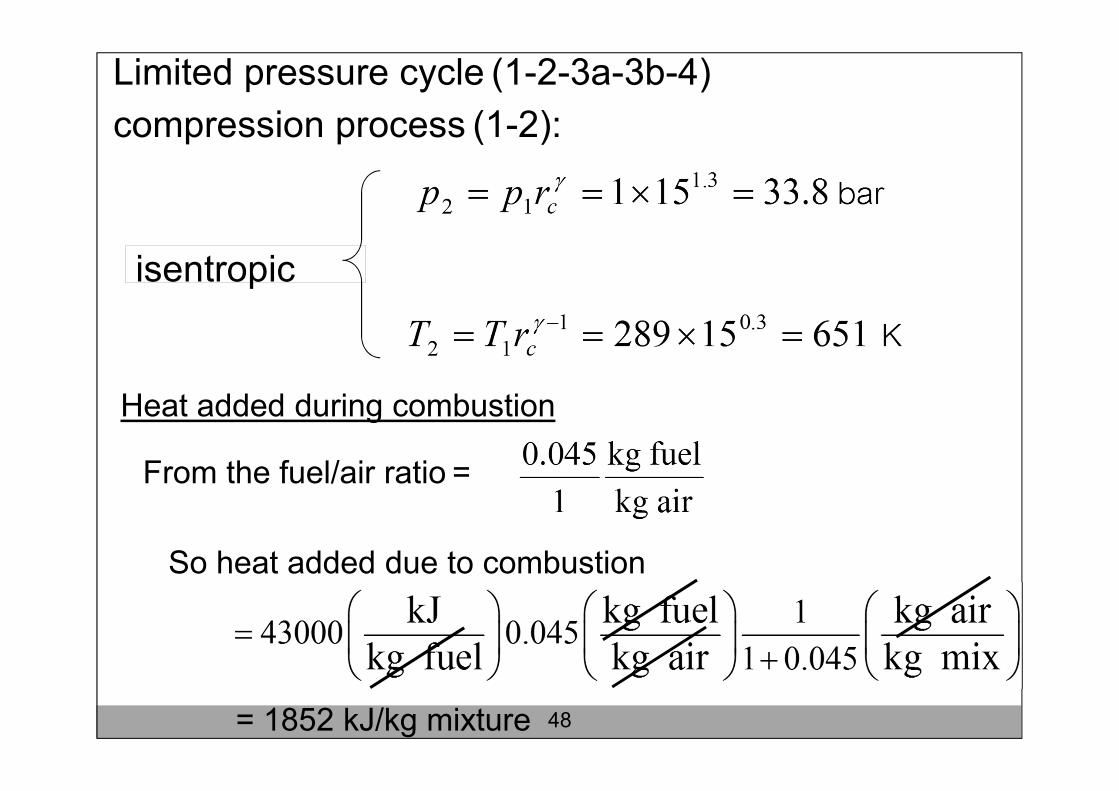
Limited pressure cycle (1-2-3a-3b-4)
compression process (1-2):
isentropic
Heat added during combustion
From the fuel/air ratio =
So heat added due to combustion
= 1852 kJ/kg mixture 48
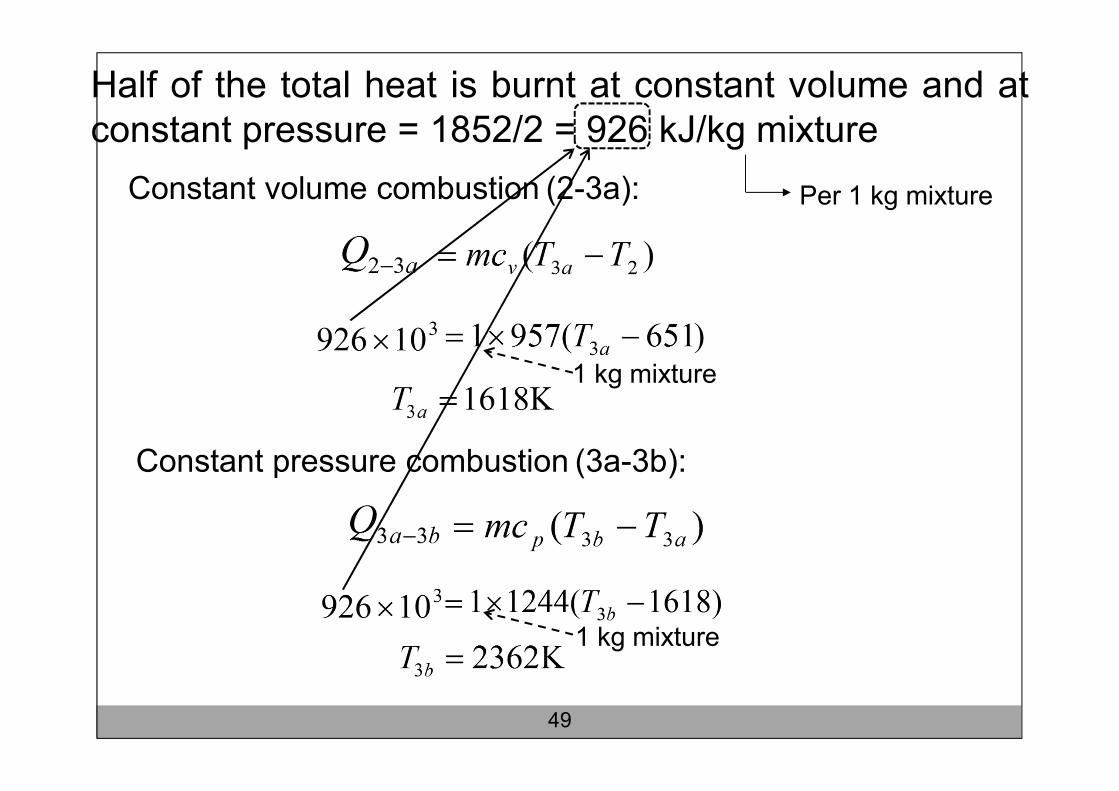
Half of the total heat is burnt at constant volume and atconstant pressure = 1852/2 = 926 kJ/kg mixture
Constant volume combustion (2-3a):
Constant pressure combustion (3a-3b):
49
Per 1 kg mixture
1 kg mixture
1 kg mixture

Then
Thus ANS
The fuel conversion efficiency calculated using equation (5.43)
ANS50
Related Documents