64 From the field notes “China, 1981. In town after town, we were the first Westerners people had seen, and they followed us in droves, curious, friendly, yet reticent. Here, in a town on the outskirts of Anyang, we had hoped to find archeological items from the Shang dynasty in a long-shuttered museum. The news of our visit had spread and a crowd was waiting. As with all the others, what struck me was the predominance of youngsters. In the rural villages and towns, the population seemed to practically consist of children. No wonder the new leadership in Beijing was trying to devise ways to reduce family size throughout the country. (No archaeological treasures remained. Destroyed during the Cultural Revolution, we were told).” Chapter 5 Processes and Cycles of Population Change 40°N 30°N 50°N 100°E 110°E 120°E 90°E 20°N East China Sea Anyang Beijing CHINA MONGOLIA RUSSIA MYANMAR INDIA VIETNAM BHUTAN N. KOREA S. KOREA

Welcome message from author
This document is posted to help you gain knowledge. Please leave a comment to let me know what you think about it! Share it to your friends and learn new things together.
Transcript
64
From the field notes
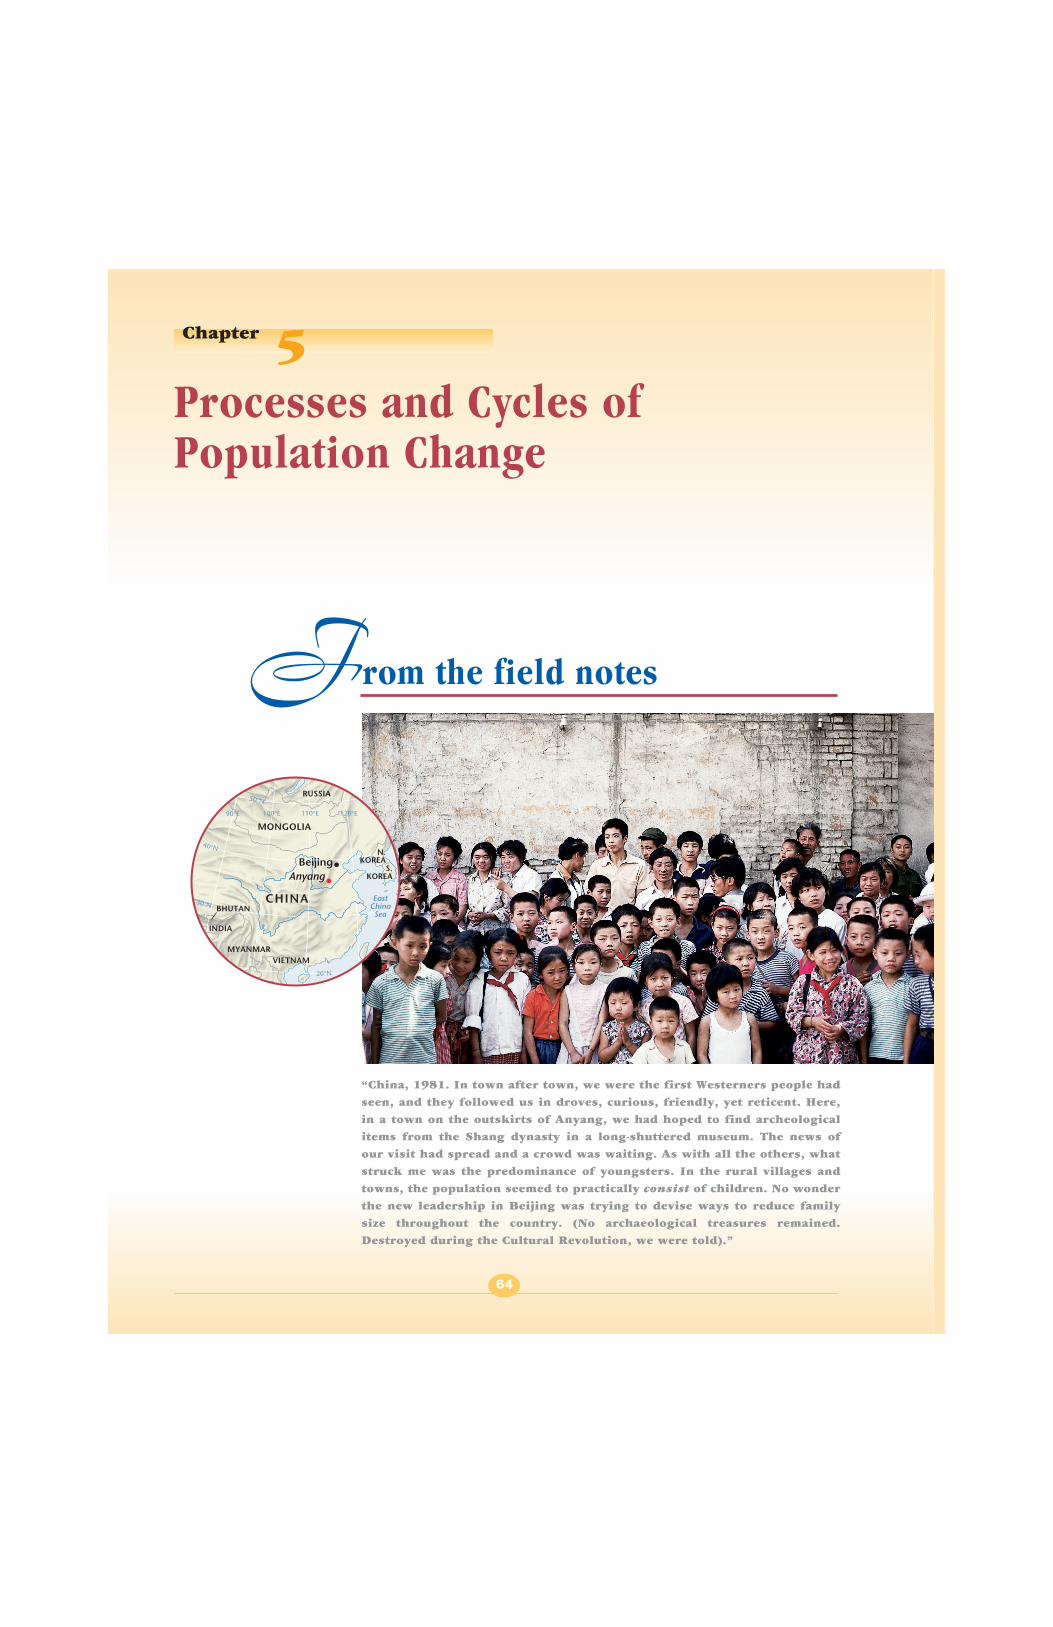
“China, 1981. In town after town, we were the first Westerners people had
seen, and they followed us in droves, curious, friendly, yet reticent. Here,
in a town on the outskirts of Anyang, we had hoped to find archeological
items from the Shang dynasty in a long-shuttered museum. The news of
our visit had spread and a crowd was waiting. As with all the others, what
struck me was the predominance of youngsters. In the rural villages and
towns, the population seemed to practically consist of children. No wonder
the new leadership in Beijing was trying to devise ways to reduce family
size throughout the country. (No archaeological treasures remained.
Destroyed during the Cultural Revolution, we were told).”
Chapter 5Processes and Cycles ofPopulation Change
40°N
30°N
50°N
100°E 110°E 120°E90°E
20°N
EastChinaSea
AnyangBeijing
CHINA
MONGOLIA
RUSSIA
MYANMAR
INDIA
VIETNAM
BHUTAN
N.KOREA
S.KOREA

During the twentieth century not a single coun-try, colony, or dependency escaped the popula-tion explosion. No state had fewer people in
the year 2000 than it did in 1900, and in many the popu-lation did not just grow, it multiplied. It took from thedawn of history to the year 1820 for the Earth’s popula-tion to reach 1 billion, and the 2-billion mark was not
reached until more than a century later, in 1930. But bythe 1970s, it took just 12 years for world population toadd 1 billion, and in 1999 the total reached 6 billion.Even if the global rate of population growth slowsdown in the decades ahead, there still may be 10 billionhuman inhabitants on this planet by the middle of thecentury. ◆
KEY POINTS
◆ The population explosion of the past 200years has increased the world’s populationfrom under 1 billion to over 6 billion.
◆ Although hundreds of millions of peopleremain inadequately nourished, the threatof global hunger has receded—perhapstemporarily.
◆ Rapid population growth varies overtime and space. Europe’s rapid growth oc-curred during the nineteenth century;Africa’s great increases occurred duringthe second half of the twentieth century.
◆ Total fertility rates are falling almosteverywhere on Earth, and in some coun-tries they are declining dramatically.
◆ Keys to the reduction of populationgrowth rates include providing greater ac-cess to education for women and securingtheir rights in society.
◆ The demographic transition model sug-gests that the world’s population will stabi-lize in the twenty-first century, but themodel may not be universally applicable.
◆ WORLDWIDE POPULATIONTRENDS
In 2002, about 137 million babies were born worldwide,and approximately 56 million people died. This meansthat we are adding about 80 million inhabitants to theglobal population every year. Most of this increase is oc-curring in regions that are least able to support the newarrivals, and of those who die, many millions are youngchildren who succumb to disease or malnutrition. Girlsare at far greater risk than boys in the poorer countries ofthe world.
Some indicators suggest that the worst may be over,that the explosive population growth of the twentiethcentury will be followed by a marked and acceleratingslowdown during the twenty-first. And indeed, as Figure5-1 shows, a number of countries’ populations have notonly stopped growing but are actually declining, notablyin Europe. The table in Resource B confirms that Italy,Sweden, Hungary, and Ukraine—among a total of 14 Eu-ropean states—exhibit “negative population growth,” a
rate of natural increase that is below 0.0 percent. Indeed,Europe as a geographic realm is not growing any longer,and only immigration keeps population growth going.
Russia’s population, too, is declining, and quiterapidly, and as we will note in more detail later, Japan’spopulation is set to begin a long, initially slow, then ac-celerating decline. But none of this stops the still-rapidglobal rate of natural increase. That is because the totalpopulations of the stabilizing and declining countries aredwarfed by the huge numbers in countries wheregrowth rates are still high, such as India, Indonesia,Bangladesh, Pakistan, and Nigeria.
As a result, world population continues to grow bynearly 1 billion per decade. In 1990 the U.S. Census Bu-reau reported that the overall growth rate of the world’spopulation had declined from approximately 2.1 percentper year during the 1965–1969 period to 1.6 percent dur-ing 1985–1989. But when the growth rate was 2.1 per-cent, the world’s population was approaching 4 billion,resulting in 80 million additional inhabitants each year.By the time the rate was down to 1.6 percent per year
65
(possibly a low estimate), the population base was al-ready 5 billion. Calculate it for yourself: a 1.6-percent in-crease, on a base of 5.0 billion, still produces over 80million additional people.
Now we are in the new century, and the globalgrowth rate (see the top of the table in Resource B) isdown to 1.4 percent, perhaps slightly lower. But todaythe world’s population is well over 6 billion, yielding anincrease that still exceeds 80 million annually. The rateof increase will have to come down well below 1.0 per-cent to make a real difference.
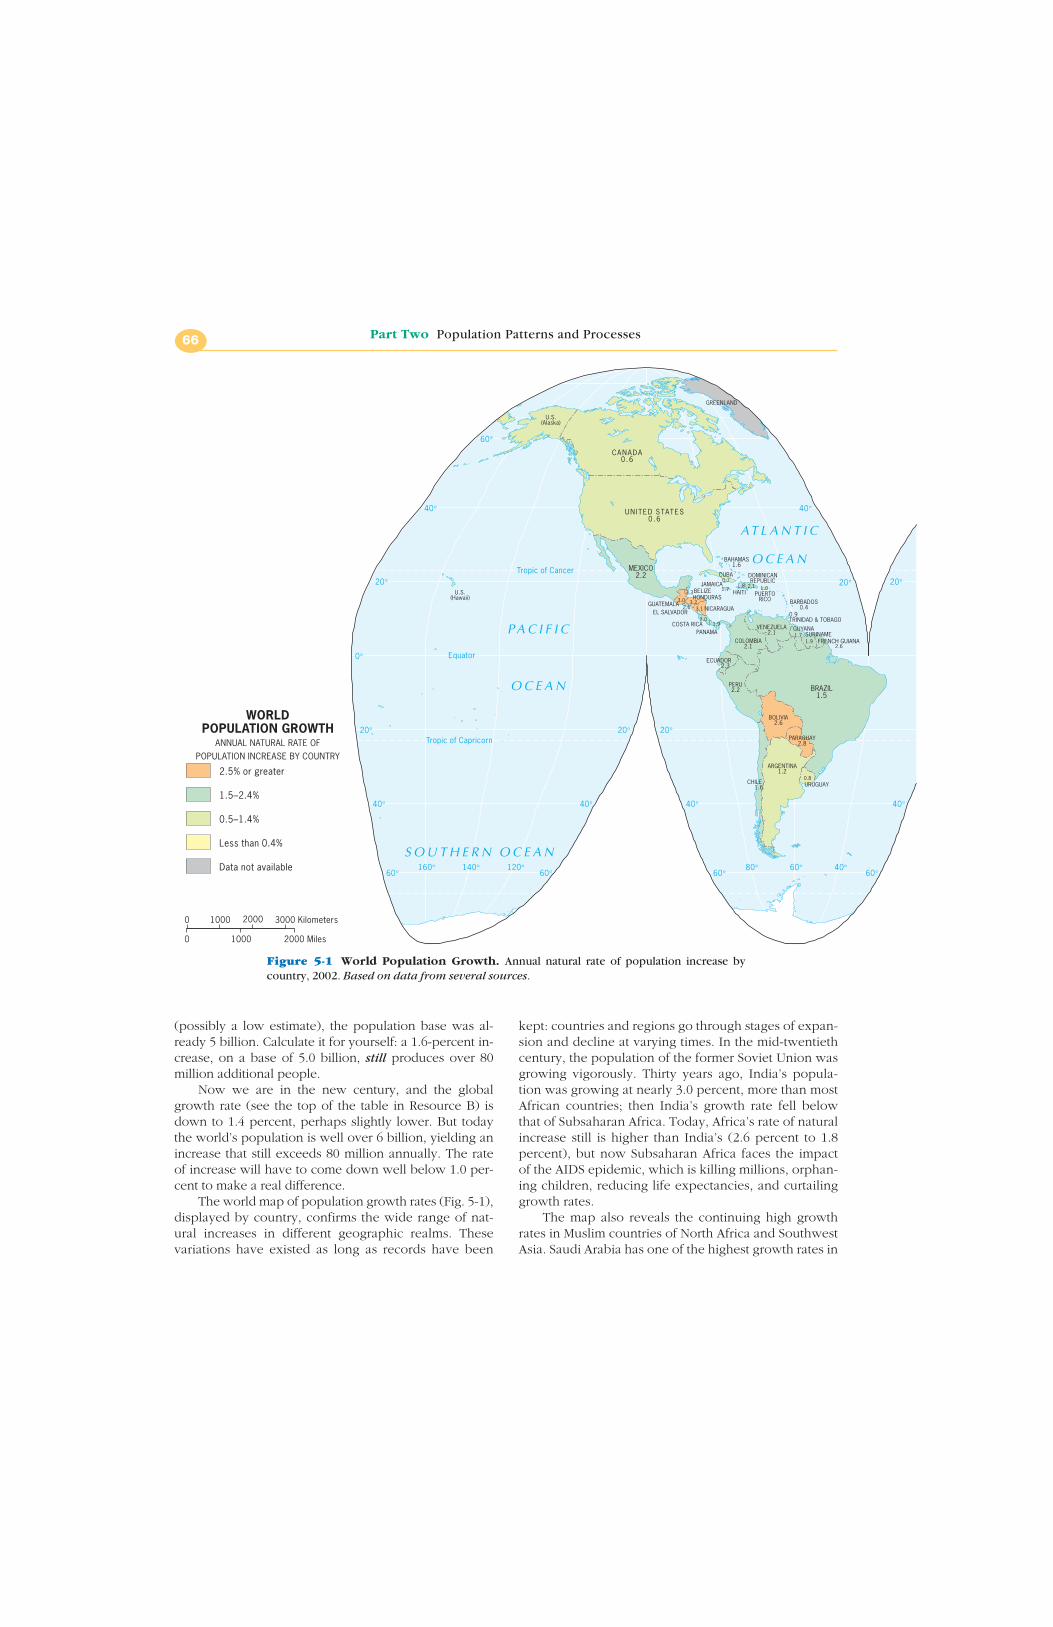
The world map of population growth rates (Fig. 5-1),displayed by country, confirms the wide range of nat-ural increases in different geographic realms. Thesevariations have existed as long as records have been
kept: countries and regions go through stages of expan-sion and decline at varying times. In the mid-twentiethcentury, the population of the former Soviet Union wasgrowing vigorously. Thirty years ago, India’s popula-tion was growing at nearly 3.0 percent, more than mostAfrican countries; then India’s growth rate fell belowthat of Subsaharan Africa. Today, Africa’s rate of naturalincrease still is higher than India’s (2.6 percent to 1.8percent), but now Subsaharan Africa faces the impactof the AIDS epidemic, which is killing millions, orphan-ing children, reducing life expectancies, and curtailinggrowth rates.
The map also reveals the continuing high growthrates in Muslim countries of North Africa and SouthwestAsia. Saudi Arabia has one of the highest growth rates in
Part Two Population Patterns and Processes66
60°
40°40°
20°20°20°
0°
20° 20° 20°
40°
60°
40°
60°
40°
60°
40°
60°160° 140° 120° 80° 60° 40°
Tropic of Cancer
Equator
Tropic of Capricorn
P A C I F I C
O C E A N
AT L A N T I C
O C E A N
S O U T H E R N O C E A N
CANADA0 .6
UN ITED STATES0 .6
U.S.(Alaska)
GREENLAND
MEXICO2.2
GUATEMALA
BELIZE
EL SALVADOR
HONDURAS
NICARAGUA
COSTA RICAPANAMA
JAMAICA
BAHAMAS1.6
CUBA0.7
HAITI
DOMINICANREPUBLIC
PUERTORICO BARBADOS
0.40.9TRINIDAD & TOBAGO
VENEZUELA2.1
COLOMBIA2.1
ECUADOR 2.3
PERU2.2
BOLIVIA2.6
BRAZIL1.5
FRENCH GUIANASURINAME
GUYANA
PARAGUAY2.8
URUGUAY
ARGENTINA1.2
CHILE 1.6
U.S.(Hawaii)
3.3
2.0
2.1
2.63.0
1.7
1.8
3.2
1.7
3.1
1.9
1.0
1.9
0.8
2.6
2.5% or greater
1.5–2.4%
0.5–1.4%
Less than 0.4%
Data not available
0
0 20001000 3000 Kilometers
1000 2000 Miles
WORLDPOPULATION GROWTH
ANNUAL NATURAL RATE OFPOPULATION INCREASE BY COUNTRY
Figure 5-1 World Population Growth. Annual natural rate of population increase bycountry, 2002. Based on data from several sources.

the world, but some smaller countries in this realm areincreasing even faster. For some time during the secondhalf of the twentieth century, countries in this realm sawtheir growth rates increase even as those in most of therest of the world were declining. But more recently sev-eral of the fast-growing populations, for example, thoseof Iran and Morocco, have shown significant declines.Demographers often point to the correlation betweenhigh growth rates and the low standing of women:where cultural traditions restrict educational and pro-fessional opportunities for women and men dominateas a matter of custom, rates of natural increase tend tobe high.
No geographic realm is more important in the popu-lation picture than South Asia, with nearly 1.4 billionpeople, including the country that appears destined toovertake China as the world’s most populous, India.
Only one country in this realm has a rate of increaselower than the world average: Sri Lanka. But Sri Lanka’stotal population is only 20 million, whereas the fast-growing countries, Pakistan and Bangladesh, have acombined population approaching 300 million. India, asthe map shows, is still growing well above the world av-erage. The situation in East Asia, the world’s most popu-lous realm, is more encouraging. China’s official rate ofnatural growth has fallen well below 1.0 percent, Japan’spopulation is stable and will soon begin to decline, andthe Koreas average below the global mean. SoutheastAsia’s growth rates remain higher, but this realm’s totalpopulation is much lower than either East or South Asiaand key countries, such as Indonesia, Thailand, andVietnam, have declining growth rates.
Significant reductions in natural population growthrates are also occurring in South America, where those
CHAPTER 5 Processes and Cycles of Population Change 67
60° 60°
40°40°
20°
0°
20° 20° 20° 20° 20°
40°
60°
40°
60°
40°
60° 60°0° 20° 40° 60° 100° 120° 140° 160°
Tropic of Cancer
Arctic Circle
Equator
Tropic of Capricorn
Antarctic Circle
ATLANTIC
OCEAN
AT L A N T I C
O C E A N
I N D I A N
O C E A N
P A C I F I C
O C E A N
O C E A NS O U T H E R N
IVORYCOAST
2.6
ERITREA2.9
SOLOMON ISLANDS 3.4
GREENLAND
TURKEY1.6
CYPRUSLEBANON
MOROCCO
WESTERNSAHARA
ALGERIA2.4 LIBYA
3.6
TUNISIA
EGYPT2.1
SUDAN2.1
CHAD2.5
NIGER3.4
MALI3.0
MAURITANIA2.6
ETHIOPIA2.8
DJIBOUTI
SOMALIA
SENEGALGAMBIA
2.5GUINEA-BISSAU GUINEA
SIERRA LEONE
LIBERIAGHANA
TOGOBENIN
NIGERIA3.0
CAMEROON2.8
BURKINAFASO
CENTRALAFRICAN REP.
2.5
DEM. REP.CONGO
3.3
CONGO2.3GABON
2.0EQUATORIALGUINEA
2.6
UGANDA 2.9 KENYA
2.6
TANZANIA3.0
RWANDA
BURUNDI
ANGOLAZAMBIA
2.1MALAWI
MOÇAMBIQUEZIMBABWE 2.6
BOTSWANA2.6
NAMIBIA
SOUTHAFRICA LESOTHO
SWAZILAND
MADAGASCAR MAURITIUS1.1
COMORO ISLANDS3.6
1.6RÉUNION
RUSSIA-0.5
GEORGIA
ARMENIA
AZERBAIJAN
TURKMENISTANUZBEKISTAN
KAZAKHSTAN0.5
KYRGYZSTAN
TAJIKISTAN
MONGOLIA2.1
IRAN2.7
CHINA1.0IRAQ
2.8
SYRIA
JORDANISRAEL1.5 KUWAIT
SAUDIARABIA
3.0
QATARBAHRAIN
U.A.E.OMAN
YEMEN
AFGHANISTAN 2.8
PAKISTAN2.8
INDIA1.9
NEPAL
SRI LANKA
BHUTAN
BANGLADESHMYANMAR(BURMA)
THAILAND1.1
CAMBODIA
LAOS
VIETNAM1.6
TAIWAN
MALAYS IA2.2
BRUNEI
PHILIPPINES
INDONES IA1.7
PAPUANEW
GUINEA2.4
AUSTRAL IA0 .7
NEWZEALAND
JAPAN
N.KOREA
S.KOREA
NEWCALEDONIA
1.8
VANUATU2.9
FIJI
SINGAPORE1.1
0.3
0.8
3.0
2.6
2.3
2.8
2.4
2.0
2.6
3.1
3.3
2.9
2.0
2.9
2.6
1.9
2.7
1.9
3.1
3.2
2.0
2.0
2.0
3.1
2.3
0.7
1.9
3.3
0.9
2.2
2.8
2.2
2.3
3.4
2.3
1.7
1.5
2.7
1.8
3.5
1.5
2.6
3.2
3.5
3.4
1.9
2.9
1.8
0.9
0.6 1.20.3 1.6
2.32.1
2.1
0.0SLOV.0.6
-0.30.1
ICELAND
IRELAND
UNITED KINGDOM
PORTUGAL SPAIN0.0
FRANCE 0.4
BELG.0.1
NETH.0.3GERMANY
-0.1
POLAND0.1
ITALY 0.0
SWITZ.AUST.
CZ. REP.-0.2
ROM.-0.3-0.5 BULGARIA
ALB.0.1
GREECE
HUNG.
NORWAY
SWEDEN
FINLAND0.2
DENMARK 0.1
ESTONIA
LITHUANIA
0.2
SLVK.
MACE.
CRO.
BOS. &HERZ.
-0.5
SERBIA& MONT.
1.7
LATVIA
BELARUS-0.4
UKRAINEMOLDOVA
0.5
0.90.4
0.1
0.0
0.2
0.10.0
-0.7-0.1
0.8
0.1 -0.50.3

rates were alarmingly high just a generation ago. Therealm as a whole is still growing at 1.7 percent, but Brazil’spopulation, for example, has declined from 2.9 percent inthe mid-1960s to 1.5 percent today. And the populationsof the southern cone (Argentine, Chile, and Uruguay) aregrowing at rates well below the world average.
As Figure 5-1 shows, the slowest-growing countries—including those with declining rates of natural popula-tion increase—lie in the economically wealthier areas ofthe world extending from the United States and Canadaacross Europe, Russia, and Japan. In the Southern Hemi-sphere, Australia, New Zealand, and Uruguay are in thiscategory. As we have noted, not all countries with low ornegative population growth are economically well off.Russia’s population is declining because of social dislo-cation in the wake of the collapse of the Soviet Union:deteriorating health conditions, rampant alcoholism anddrug use, and economic problems combine to shortenlife expectancies (especially among males) and to lowerbirth rates. Similar problems afflict Ukraine and Kazakh-stan, two of Russia’s neighbors which are also showingslow or negative growth.
No single factor, therefore, can explain the varia-tions shown on Figure 5-1. Economic prosperity as wellas social dislocation reduce natural population growthrates. Economic well-being, associated with urbaniza-tion, higher levels of education, later marriage, familyplanning, and other factors, lowers population growth.In the table in Resource B, compare the indices for nat-ural population increase and the percentage of the pop-ulation that is urbanized; in general, the higher the pop-ulation’s level of urbanization, the lower its naturalincrease. Cultural traditions also influence rates of popu-lation growth: religion, for example, has a powerful im-pact not only in Islamic countries but also in Christiansocieties (note the Roman Catholic Philippines’ growthrate) and in Hindu-dominated communities.
It is important to note that the information providedin Figure 5-1 is based on national (that is, countrywide)statistics. As we will discover, there also are significantdemographic variations within countries. In India, forexample, some States record population growth rates farabove the national average; these States lie mostly in theeast and northeast of the country. But other States, in thewest and southwest, are growing much more slowly.Our map, therefore, is a small-scale, global overview, amere introduction to the complexities of the global geo-graphy of population.
◆ DIMENSIONS OF POPULATIONGROWTH
As the figures just quoted indicate, the human popula-tion has not expanded in a linear manner, in which in-creases occur in uniform amount during a series of equaltime periods. If you have $100 and add $10 to it the firstyear and each successive year, your $100 will become$200 after 10 years, $300 after 20 years, and so on. This islinear growth (Fig. 5-2A). However, if you investedyour initial $100 at an interest rate of 10 percent, com-pounded continuously, each increase would be basedon the original amount plus previously added interest.After 10 years, your $100 would have increased to $259;after 20 years, it would have increased to $673. This isexponential growth. The difference between linearand exponential growth is obvious, and it is equally clearthat the world’s human population has been growing atexponential rates (Fig. 5-2B).
Doubling TimeAnother way of looking at exponential growth is tocompare a population’s rate of growth to its doublingtime. Every rate of growth has a doubling time; for ex-
Part Two Population Patterns and Processes68
C. DOUBLING TIMEB. EXPONENTIAL GROWTHA. LINEAR GROWTHTime Time
Qua
ntity
Qua
ntity
Annu
al g
row
th (%
)
5.0
4.5
4.0
3.5
3.0
2.5
2.0
1.5
1.0
0.5
130 110 90 70 50 30 10Years for population to double
Figure 5-2 Population Growth. (A) linear; (B) exponential; (C) doubling time.

ample, your $100 invested at 10 percent took about 7years to double to $200, and then another 7 years tobecome $400, and then another 7 years to become$800. When the growth rate is 10 percent, therefore,the doubling time is around 7 years. During the middleof this century, when the world’s population was in-creasing at an average rate of 2 percent, its doublingtime was 35 years (Fig. 5-2C). During the mid-1980s,when the rate declined to 1.8 percent, the doublingslowed to 39 years. Today, world population is dou-bling in 51 years, and the continuing slowdown is oneof the bright spots in the problematic demographicpicture.
The table in Resource B records the 2002 doublingtime for the populations of all the countries of the world.Start by looking at the regional situation: no figure isgiven for Europe because Europe’s population is notgrowing (by natural means) at all. North America is dou-bling in 124 years, and East Asia in 87, still far slowerthan the global average. But South Asia in 2002 was stilldoubling in 36 years (Pakistan in only 25!), much fasterthan the world average and indicative of the changingpopulation map. Muslim-dominated North Africa andSouthwest Asia, too, continues to double in 35 years de-spite the economic gains made in some of this realm’scountries. When you compare countries’ doubling timesto their economic well-being (for example, per capitaGNP), you can observe the burden fast-growing soci-eties must carry.
Lessons from the Population ExplosionIt is estimated that 2000 years ago the world’s populationwas about 250 million. More than 16 centuries passedbefore this total had doubled to 500 million, the esti-
mated population in 1650. Just 170 years later, in 1820,the population had doubled again, to 1 billion (Fig. 5-3).And barely more than a century after this, in 1930, itreached 2 billion. Now the doubling time was down to100 years and dropping fast; the population explosionwas in full gear. Only 45 years elapsed during the nextdoubling, to 4 billion (1975). In that decade the rate ofgrowth was approximately 2 percent per year, and thedoubling time (Fig. 5-2C) had declined to 35 years. Thehistory of humanity thus is one of growing numbers andever-higher rates of increase.
◆ EARLY WARNINGS
Concern over population growth arose even before thefull impact of the population explosion was felt. As longago as 1798, a British economist named Thomas Malthuspublished An Essay on the Principle of Population as ItAffects the Future Improvement of Society. In this workhe sounded the alarm: the world’s population was in-creasing faster than the food supplies needed to sustainit. Recognizing the nature of exponential growth,Malthus pointed out that population increases at what hecalled a geometric rate. The means of subsistence, incontrast, grow at an arithmetic (linear) rate. From 1803 to1826, Malthus issued revised editions of his essay and re-sponded vigorously to a barrage of criticism. He sug-gested that population growth in Britain might bechecked by hunger within 50 years after the first appear-ance of his warning.
Malthus could not have foreseen the impacts of col-onization and migration, and he would not have be-lieved that the United Kingdom could sustain between50 and 60 million people, as it does today. Nor was hecorrect about the linear increase of food production. It,too, has grown exponentially as the acreage under culti-vation has expanded, improved strains of seed havebeen developed, and more fertilizers have been used.Those who continue to share Malthus’ concerns (even ifthey do not agree with every detail of his argument) aresometimes called neo-Malthusians and they continue tobe alarmed. They point out that human suffering is nowoccurring on a scale unimagined even by Malthus, andthey argue that it is not enough simply to assert that thisis an inevitable stage in the history of the world’s popula-tion. Despite predictions that the population will stabi-lize later in the twenty-first century, they believe that theproblem must be addressed now.
Once one moves below the global scale, it becomesincreasingly difficult to apply Malthus’ ideas. Somecommentators speak of a “Malthusian crisis” occurringin particular regions or countries, by which they meanthat population growth is outstripping food supplies.But at the time that Malthus was writing, he could treatBritain as a more or less closed system and confine his
CHAPTER 5 Processes and Cycles of Population Change 69
8
7
6
5
4
3
2
1
0
1650
1700
1750
1800
1850
1900
1950
2000
2050
Time
Popu
latio
n (b
illion
s)
20006 billion
19754 billion
19302 billion
18201 billion
1/2 billion
20157 billion
Figure 5-3 Population Growth, 1650to (estimated) 2050. The dashed line in-dicates a possible scenario for the next 50years.

analysis to the population trends and resources of theBritish Isles. Few places in the world come close tobeing closed systems anymore. Switzerland and Japanare countries with large numbers of people living inareas with relatively few natural resources and limitedagricultural land. Yet there is little hunger or suffering inthose countries because of the strength of their politicaland economic institutions and their global economicposition.
Hence, analysis of population growth at the regionalscale requires a level of geographic understanding that isoften missing. It requires seeing regions not as isolatedplaces but as places whose nature and character areshaped both by their internal characteristics and by theirexternal geographical relationships.
◆ POPULATION STRUCTURE
Maps showing the regional distribution and density ofpopulations tell us about the numbers of people in coun-tries or regions, but they cannot reveal two other aspectsof those populations: the numbers of men and womenand their ages. These aspects are important because apopulous country in which half the population is veryyoung has very different problems than a country inwhich a large proportion of the population is elderly.When geographers study populations, therefore, theyare concerned not only with spatial distribution but alsowith population structure.
Population CompositionThe composition or structure of a population is itsmakeup in terms of age, sex, and other properties suchas marital status and education. The key indicators areage and sex, represented visually by the age-sex pyra-mid. The pyramid displays the percentages of each agegroup in the total population (normally five-year groups)by a horizontal bar whose length represents its share.Males in the group are to the left of the center line, fe-males to the right.
An age-sex pyramid can instantly convey the demo-graphic situation in a country. In the so-called develop-ing countries, where birth and death rates generally re-main high, the pyramid looks like a Christmas tree, withwide branches at the base and short ones near the top(Fig. 5-4). The youngest age groups have the largestshare of the population; in the composite pyramidshown here, the three groups up to age 14 account formore than 30 percent of it. Older people, in the threehighest age groups, represent only about 4 percent ofthe total. Slight variations of this pyramidal shape markthe population structure of such countries as Pakistan,Yemen, Guatemala, The Congo, and Laos. From agegroup 15 to 19 upward, each group is smaller than theone below it.
With economic development, however, the shape ofthe pyramid changes. Families become smaller, childrenfewer. A composite population pyramid for the econom-ically more advanced countries looks like a slightly lop-sided vase, with the largest components of the popula-tion not at the bottom, but in the middle. And thatmiddle-age bulge is moving upward, reflecting the agingof the population (Fig. 5-5). In the “developed” world,this is where the population explosion is now happen-ing, and its social and economic consequences will besignificant (see Looking Ahead Box).
Part Two Population Patterns and Processes70
Males Females
Developing Countries,2000
80+
70–74
60–64
50–54
40–44
30–34
20–24
10–14
0–4
% of population
.
........................
......................
....................
.................
.............
........
......
..
6 4 2 0 2 4 6
Figure 5-4 Age-Sex Pyramidsfor Countries with High Rates of Natural Population Increase.Source: U.S. Bureau of the Census,2001.
Males Females
Developed Countries,2000
80+
70–74
60–64
50–54
40–44
30–34
20–24
10–14
0–4
% of population
.............
....................
.................
..............
...........
.........
.........
..........
..........
6 4 2 0 2 4 6
Figure 5-5 Age-Sex Pyramidsfor Countries with Low GrowthRates. Source: U.S. Bureau of theCensus, 2001.

◆ DEMOGRAPHIC CYCLES
The study of population is called demography, and itsspatial component is population geography. We now turnto the demographic factors that underlie the patternsshown in Figure 5-1. So far we have viewed global popu-lation growth. But while some countries and regions aregrowing faster than the world average, others are growingmuch more slowly. And some countries actually have de-clining populations, that is, “negative” population growth.
A population goes through stages of growth each ofwhich forms part of its demographic cycle. Populationsin different parts of the world, and sometimes even indifferent parts of the same country, are at different stagesin their demographic cycles—and these differences canhave serious economic and political consequences.
Natural IncreaseThe rate of natural increase of a population is the dif-ference between the number of births and the numberof deaths during a specific period. These two measures,
the birth rate and the death rate, are commonly ex-pressed in terms of the number of individuals per thou-sand. In statistical tables these are reported as thecrude birth rate (CBR)—the number of live births peryear per thousand people in the population—and thecrude death rate (CDR)—the number of deaths perthousand.
The Birth RateAs Figure 5-6 shows, birth rates vary widely around theworld. In 2002, South Asia, Subsaharan Africa, and NorthAfrica and Southwest Asia continued to record the high-est birth rates by region, although India has droppedfrom the highest category. Many countries in Africa stillhave birth rates over 40 per thousand, and a few havereached or exceeded 50. But deteriorating health condi-tions are causing death rates in Africa to rise, reducingrates of natural increase.
The lowest birth rates are in Europe, where mostcountries have CBRs below 15. Other areas with lowbirth rates are North America, Australia, New Zealand,
CHAPTER 5 Processes and Cycles of Population Change 71
An Aging PopulationProjections by the American Association for the Advancementof Science suggest that while the world’s total population be-tween 2000 and 2050 may grow about 40 percent, the num-ber of people over 60 will increase by more than 230 percent.This means that the pyramid in Figure 5-5 will eventually be-come top-heavy, looking like a thick-stemmed mushroomwith a cap representing the aged.
The pyramid representing the economically richer coun-tries may look attractive to population geographers because itsignals reduced population growth and even stabilizing pop-ulations, but aging societies will face a set of serious chal-lenges. By 2030, people in Germany over 65 may well ac-count for close to half the adult population, as compared withone-fifth now. Many other European countries are on a simi-lar trajectory, and even developing countries such as Braziland China will likely experience a substantial aging of thepopulation as growth rates slow.
These changed demographics will require substantial so-cial adjustments. Older people retire and eventually sufferhealth problems, so they need pensions and medical care. Theyounger workers in the population must provide the tax rev-enues to enable the state to pay for these services—but thenumber of younger workers will decline sharply. One responseto this will be a rise in the age at which retirement benefitsbegin. But the only alternative that can really address the prob-lem is immigration: influxes of younger workers to do the worklocals are unable (or unwilling) to do. This has been the alter-
native followed by the United States in recent decades, and ithas helped sustain the economic boom of the 1980s and 1990s.Yet immigration can create its own set of social problems, ashas already happened in Germany with its large Turkish andKurdish immigration, in France with its Algerian-Muslim influx,and in the United States with the arrival of Latinos.
There are important consequences to an aging and de-clining population as well. Significant economic sectors inmany countries are geared toward the production of goodsand materials for young people. Increasingly, however, themass market will be more elevated in age, which in turn willrequire dramatic shifts in what is produced. Businesses pro-ducing such youth-oriented items as sportswear and videogames will either have to find new foreign markets or face de-clining sales. And this is only one small part of a larger pictureof adjustment that will be required as economies geared to-ward ever-increasing production face the new demographicreality.
Over the next half century, Japan will be an interestingtest case. Japan’s population will begin declining in 2007, andsome projections indicate that the Japanese population willshrink as it ages, from over 127 million in 2007 to perhaps 70million in 2050. Japan has long had one of the world’s leadingeconomies, but the population’s aging will make it increasinglydifficult to sustain this position—unless the Japanese allow for-eign workers to immigrate. But as we will see in Chapter 7, thishas been strongly resisted as a matter of tradition.
Looking Ahead

Japan, and China. It is clear that low birth rates are asso-ciated with modernization—industrialization and urban-ization—except in the case of China. Just one generationago China still had high birth rates. Although it is not yetan industrialized, urbanized nation, China achieved itspresent low birth rate by imposing stringent populationcontrols.
Looking more closely at Figure 5-6, we can see that anumber of countries that are somewhere between poorand prosperous, such as Argentina, Colombia, and Thai-land, also have intermediate (or transitional) birth rates.This would suggest that birth rates are related to thecountry’s level of economic development. Again thisgeneralization does not hold in the case of China. Eco-
nomic development is crucial, but other factors, includ-ing cultural traditions, affect the patterns shown on Fig-ure 5-6.
The Total Fertility RateAnother measure of the reproductive status of a popula-tion is the total fertility rate (TFR). This is a measureof the number of children born to women of childbear-ing age. The TFR is usually reported as the number ofchildren per woman, and it is a revealing statistic. For ex-ample, at the height of Kenya’s population explosion inthe 1980s, the number of children per woman of child-bearing age was 8.1, among the highest ever recorded.
Part Two Population Patterns and Processes72
60°
40°40°
20°20°20°
0°
20° 20° 20°
40°
60°
40°
60°
40°
60°
40°
60°160° 140° 120° 80° 60° 40°
Tropic of Cancer
Equator
Tropic of Capricorn
P A C I F I C
O C E A N
AT L A N T I C
O C E A N
S O U T H E R N O C E A N
C AN ADA13
UN I TED STATES15
U.S.(Alaska)
GREENLAND
MEXICO27
GUATEMALA
BELIZE
EL SALVADOR
HONDURAS
NICARAGUA
COSTA RICAPANAMA
JAMAICA
BAHAMAS22
CUBA14
HAITI
DOMINICANREPUBLIC
PUERTORICO
BARBADOS13
TRINIDAD & TOBAGOVENEZUELA
26COLOMBIA
27
ECUADOR 29
PERU29
BOLIVIA36
BRAZIL22
FRENCH GUIANASURINAME
GUYANA
PARAGUAY34
URUGUAY
ARGENTINA20
CHILE 21
U.S.(Hawaii)
38
24
27
3237
25
33
38
23
37
24
18
25
16
18
30
WORLDBIRTH RATE
per 1,000 population
35 or more
25–34
15–24
Under 15
Data not available
0
0 20001000 3000 Kilometers
1000 2000 Miles
Figure 5-6 World Birth Rate. World birth rates by country. Source: Based on data from sev-eral sources.
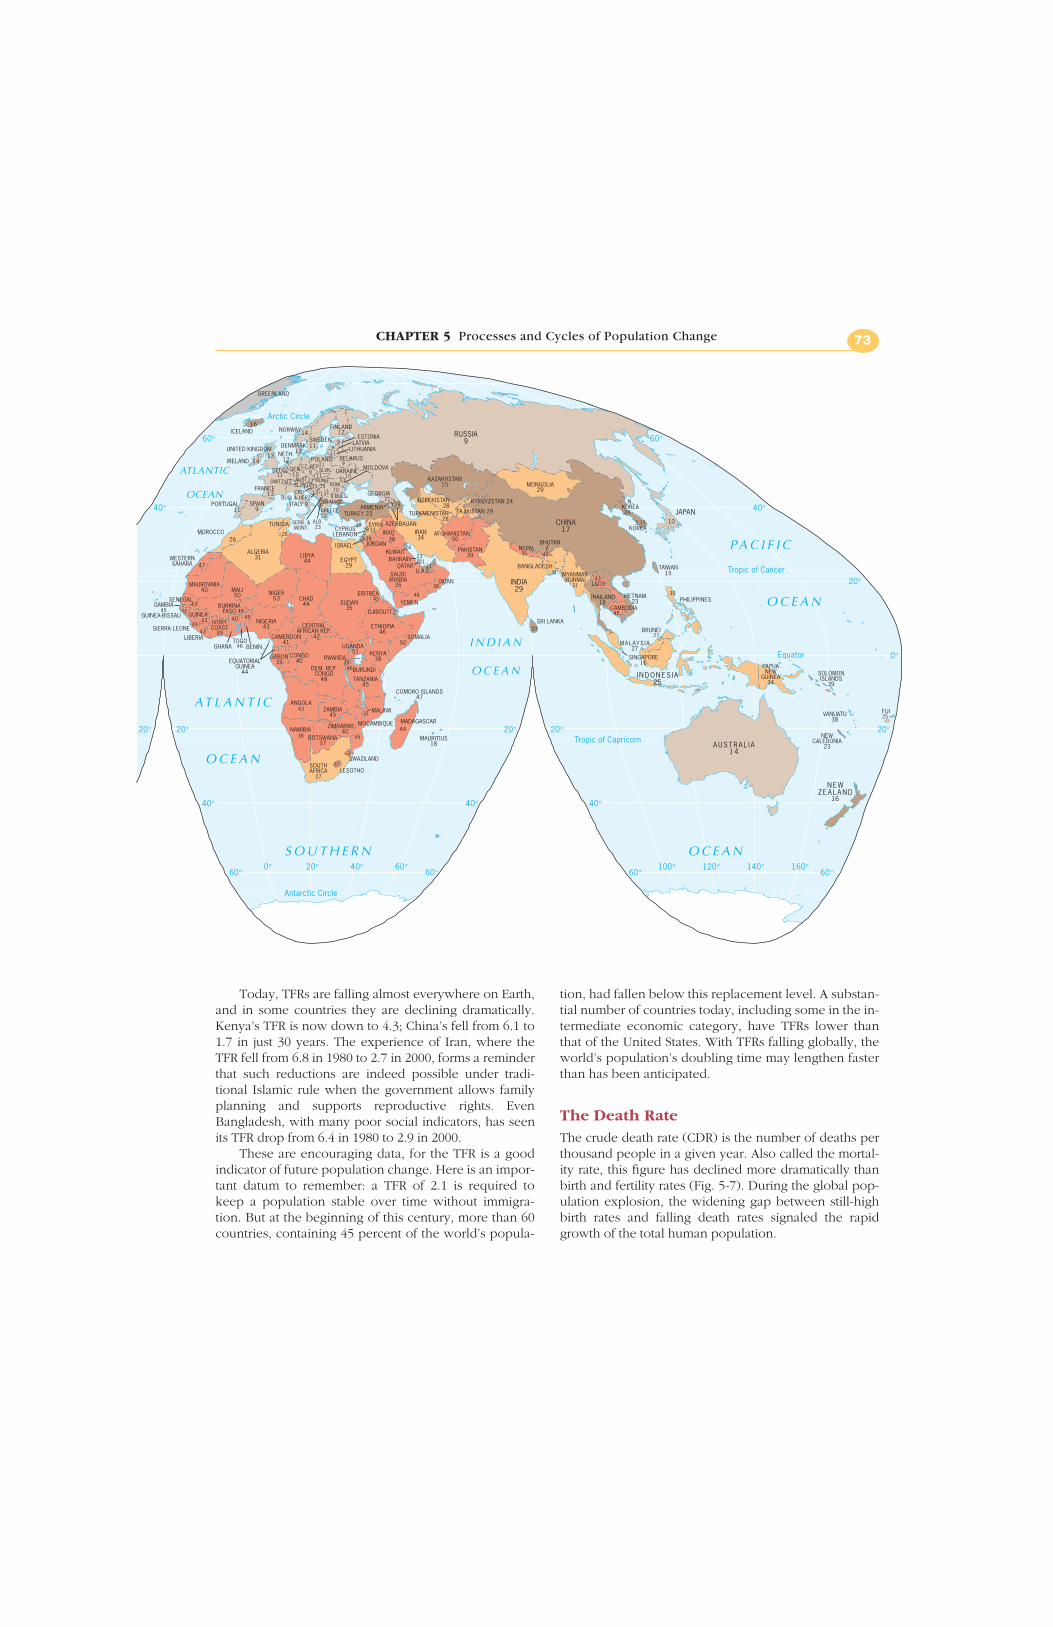
Today, TFRs are falling almost everywhere on Earth,and in some countries they are declining dramatically.Kenya’s TFR is now down to 4.3; China’s fell from 6.1 to1.7 in just 30 years. The experience of Iran, where theTFR fell from 6.8 in 1980 to 2.7 in 2000, forms a reminderthat such reductions are indeed possible under tradi-tional Islamic rule when the government allows familyplanning and supports reproductive rights. EvenBangladesh, with many poor social indicators, has seenits TFR drop from 6.4 in 1980 to 2.9 in 2000.
These are encouraging data, for the TFR is a goodindicator of future population change. Here is an impor-tant datum to remember: a TFR of 2.1 is required tokeep a population stable over time without immigra-tion. But at the beginning of this century, more than 60countries, containing 45 percent of the world’s popula-
tion, had fallen below this replacement level. A substan-tial number of countries today, including some in the in-termediate economic category, have TFRs lower thanthat of the United States. With TFRs falling globally, theworld’s population’s doubling time may lengthen fasterthan has been anticipated.
The Death RateThe crude death rate (CDR) is the number of deaths perthousand people in a given year. Also called the mortal-ity rate, this figure has declined more dramatically thanbirth and fertility rates (Fig. 5-7). During the global pop-ulation explosion, the widening gap between still-highbirth rates and falling death rates signaled the rapidgrowth of the total human population.
CHAPTER 5 Processes and Cycles of Population Change 73
Tropic of Cancer
Arctic Circle
Equator
Tropic of Capricorn
Antarctic Circle
60° 60°
40°40°
20°
0°
20° 20° 20° 20° 20°
40°
60°
40°
60°
40°
60° 60°0° 20° 40° 60° 100° 120° 140° 160°
ATLANTIC
OCEAN
AT L A N T I C
O C E A N
I N D I A N
O C E A N
P A C I F I C
O C E A N
O C E A NS O U T H E R N
GREENLAND
ICELAND
IRELAND
UNITED KINGDOM
PORTUGAL SPAIN9
FRANCE 13
BELG.11
NETH.12
GER.10
POLAND11
ITALY 9
SWITZ. AUST.
CZ. REP.9 SLVK.
11
ROM.10
9 BULG.16 MACE.
CRO.BOS. & HERZ.
SLOV.
ALB.23
GREECE10 TURKEY 23
CYPRUS
HUNG.11
NORWAY
SWEDEN
FINLAND12
DENMARK 13
ESTONIA
LITHUANIA
LEBANONMOROCCO
WESTERNSAHARA
ALGERIA31 LIBYA
44
TUNISIA
EGYPT29
SUDAN35
CHAD44
NIGER53
MALI50
MAURITANIA40
ETHIOPIA46
DJIBOUTI
ERITREA
SOMALIA
SENEGALGAMBIA
45GUINEA-BISSAU GUINEA
SIERRA LEONE
LIBERIAGHANA
IVORYCOAST
39TOGO
BENIN
NIGERIA43
CAMEROON41
BURKINAFASO
CENTRALAFRICAN REP.
42
DEM. REP.CONGO
48
CONGO40
GABON35EQUATORIAL
GUINEA44
UGANDA 51 KENYA
38
TANZANIA45
RWANDA
BURUNDI
ANGOLAZAMBIA
45MALAWI
MOCAMBIQUEZIMBABWE 40
BOTSWANA37
NAMIBIA
SOUTHAFRICA LESOTHO
SWAZILAND
MADAGASCAR
MAURITIUS18
COMORO ISLANDS47
SERB. &MONT.
LATVIA
BELARUS
UKRAINE MOLDOVA
RUSSIA9
GEORGIA
ARMENIA
AZERBAIJAN
UZBEKISTAN28
TURKMENISTAN28
KAZAKHSTAN15
KYRGYZSTAN 24
TAJIKISTAN 29
MONGOLIA29
IRAN34
CHINA17IRAQ
38
SYRIA
JORDANISRAELKUWAIT
SAUDIARABIA
35
QATARBAHRAIN
U.A.E.
OMAN
YEMEN
AFGHANISTAN 50
PAKISTAN39
INDIA29
NEPAL
SRI LANKA
BHUTAN
BANGLADESHMYANMAR(BURMA)
THAILAND18
CAMBODIA
LAOS
VIETNAM23
TAIWAN
MALAYS I A27
BRUNEI
PHILIPPINES
IN DON ES I A25
PAPUANEW
GUINEA34
AUSTRAL I A14
NEWZEALAND
JAPANN.
KOREA
S.KOREA
NEWCALEDONIA
23
VANUATU38
FIJI
SINGAPORE16
16
14
10
16
14
11
11
9
1011
1011
9911
1312
13
1311
13 19
13
48
46
39
45
4043
42
37
43
44
51
26
45
39
43
49
50
43
26
23
31
40
27
15
25
2139
15
24
43
28
35
3830
21
20
33
21
46
27
38
43
46
49
47
31
45
24
15
¸
SOLOMONISLANDS
39
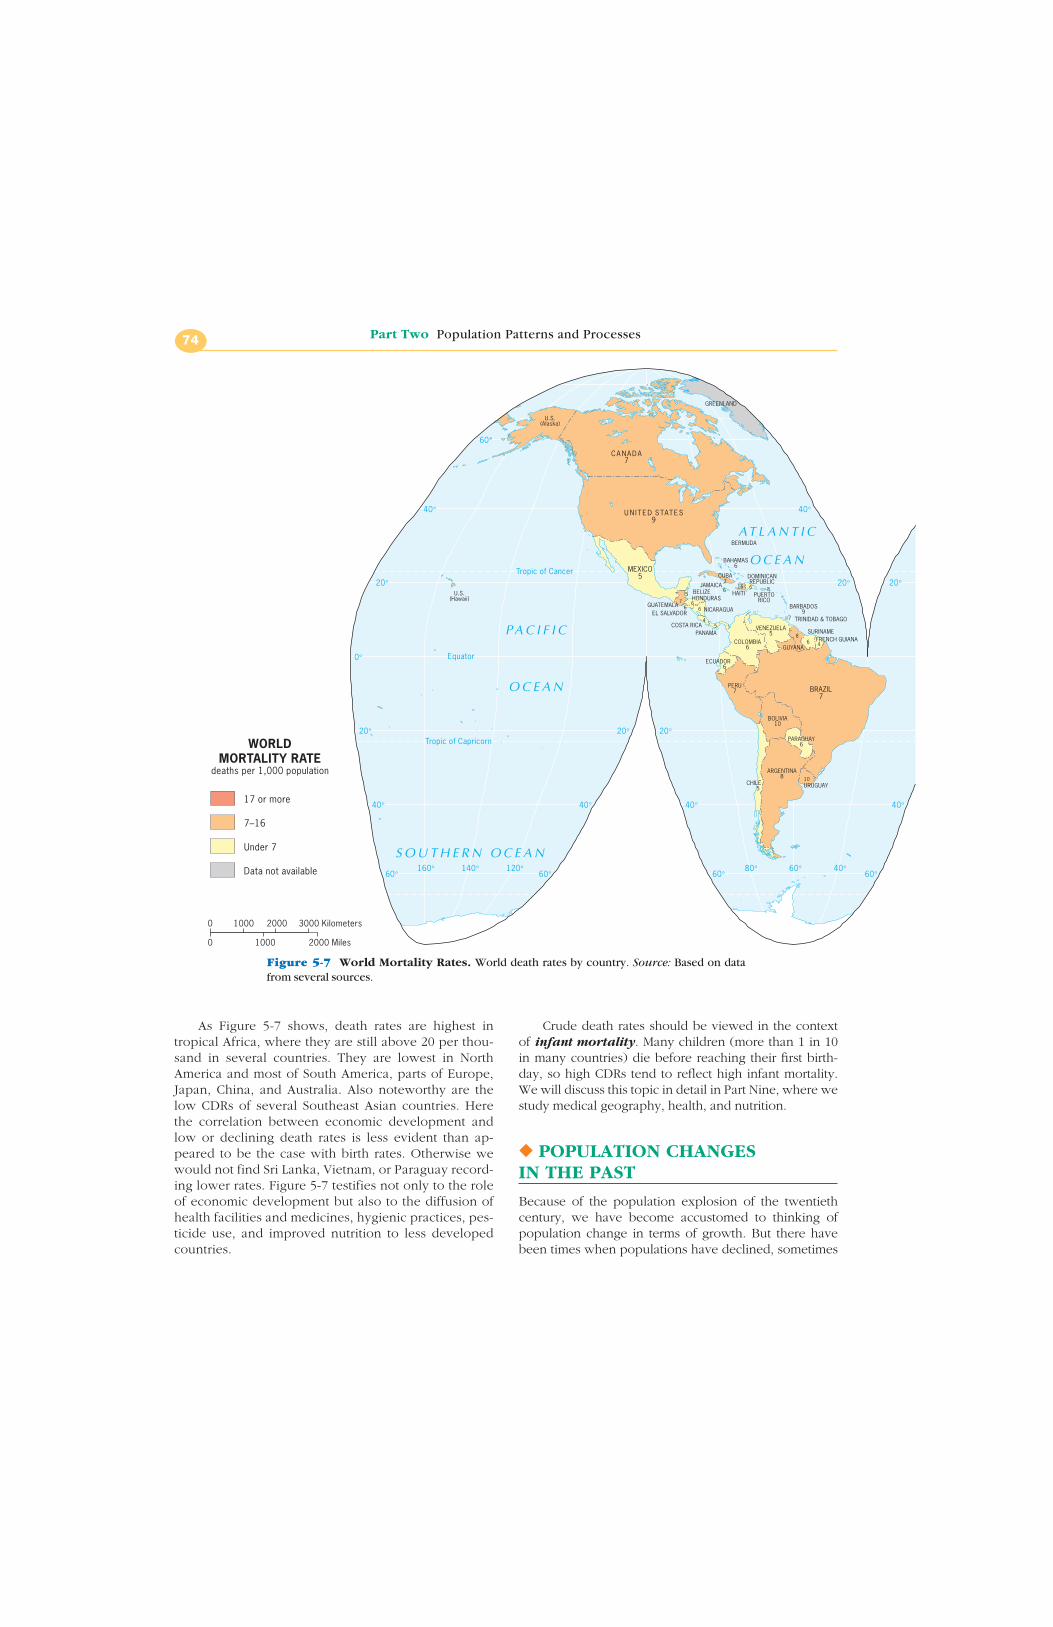
As Figure 5-7 shows, death rates are highest intropical Africa, where they are still above 20 per thou-sand in several countries. They are lowest in NorthAmerica and most of South America, parts of Europe,Japan, China, and Australia. Also noteworthy are thelow CDRs of several Southeast Asian countries. Herethe correlation between economic development andlow or declining death rates is less evident than ap-peared to be the case with birth rates. Otherwise wewould not find Sri Lanka, Vietnam, or Paraguay record-ing lower rates. Figure 5-7 testifies not only to the roleof economic development but also to the diffusion ofhealth facilities and medicines, hygienic practices, pes-ticide use, and improved nutrition to less developedcountries.
Crude death rates should be viewed in the contextof infant mortality. Many children (more than 1 in 10in many countries) die before reaching their first birth-day, so high CDRs tend to reflect high infant mortality.We will discuss this topic in detail in Part Nine, where westudy medical geography, health, and nutrition.
◆ POPULATION CHANGES IN THE PAST
Because of the population explosion of the twentiethcentury, we have become accustomed to thinking ofpopulation change in terms of growth. But there havebeen times when populations have declined, sometimes
Part Two Population Patterns and Processes74
60°
40°40°
20°20°20°
0°
20° 20° 20°
40°
60°
40°
60°
40°
60°
40°
60°160° 140° 120° 80° 60° 40°
Tropic of Cancer
Equator
Tropic of Capricorn
P A C I F I C
O C E A N
AT L A N T I C
O C E A N
S O U T H E R N O C E A N
C AN ADA7
UN I TED STATES9
U.S.(Alaska)
GREENLAND
MEXICO5
BERMUDA
GUATEMALA
BELIZE
EL SALVADOR
HONDURAS
NICARAGUA
COSTA RICAPANAMA
JAMAICA
BAHAMAS6
CUBA7
HAITI
DOMINICANREPUBLIC
PUERTORICO
BARBADOS9
TRINIDAD & TOBAGOVENEZUELA
5COLOMBIA
6
ECUADOR 6
PERU7
BOLIVIA10
BRAZIL7
FRENCH GUIANASURINAME
GUYANA
PARAGUAY6
URUGUAY
ARGENTINA8
CHILE 5
U.S.(Hawaii)
5
4
6
67
8
15
6
6
6
5
8
6
7
10
4
WORLDMORTALITY RATE
deaths per 1,000 population
17 or more
7–16
Under 7
Data not available
0
0 20001000 3000 Kilometers
1000 2000 Miles
Figure 5-7 World Mortality Rates. World death rates by country. Source: Based on datafrom several sources.
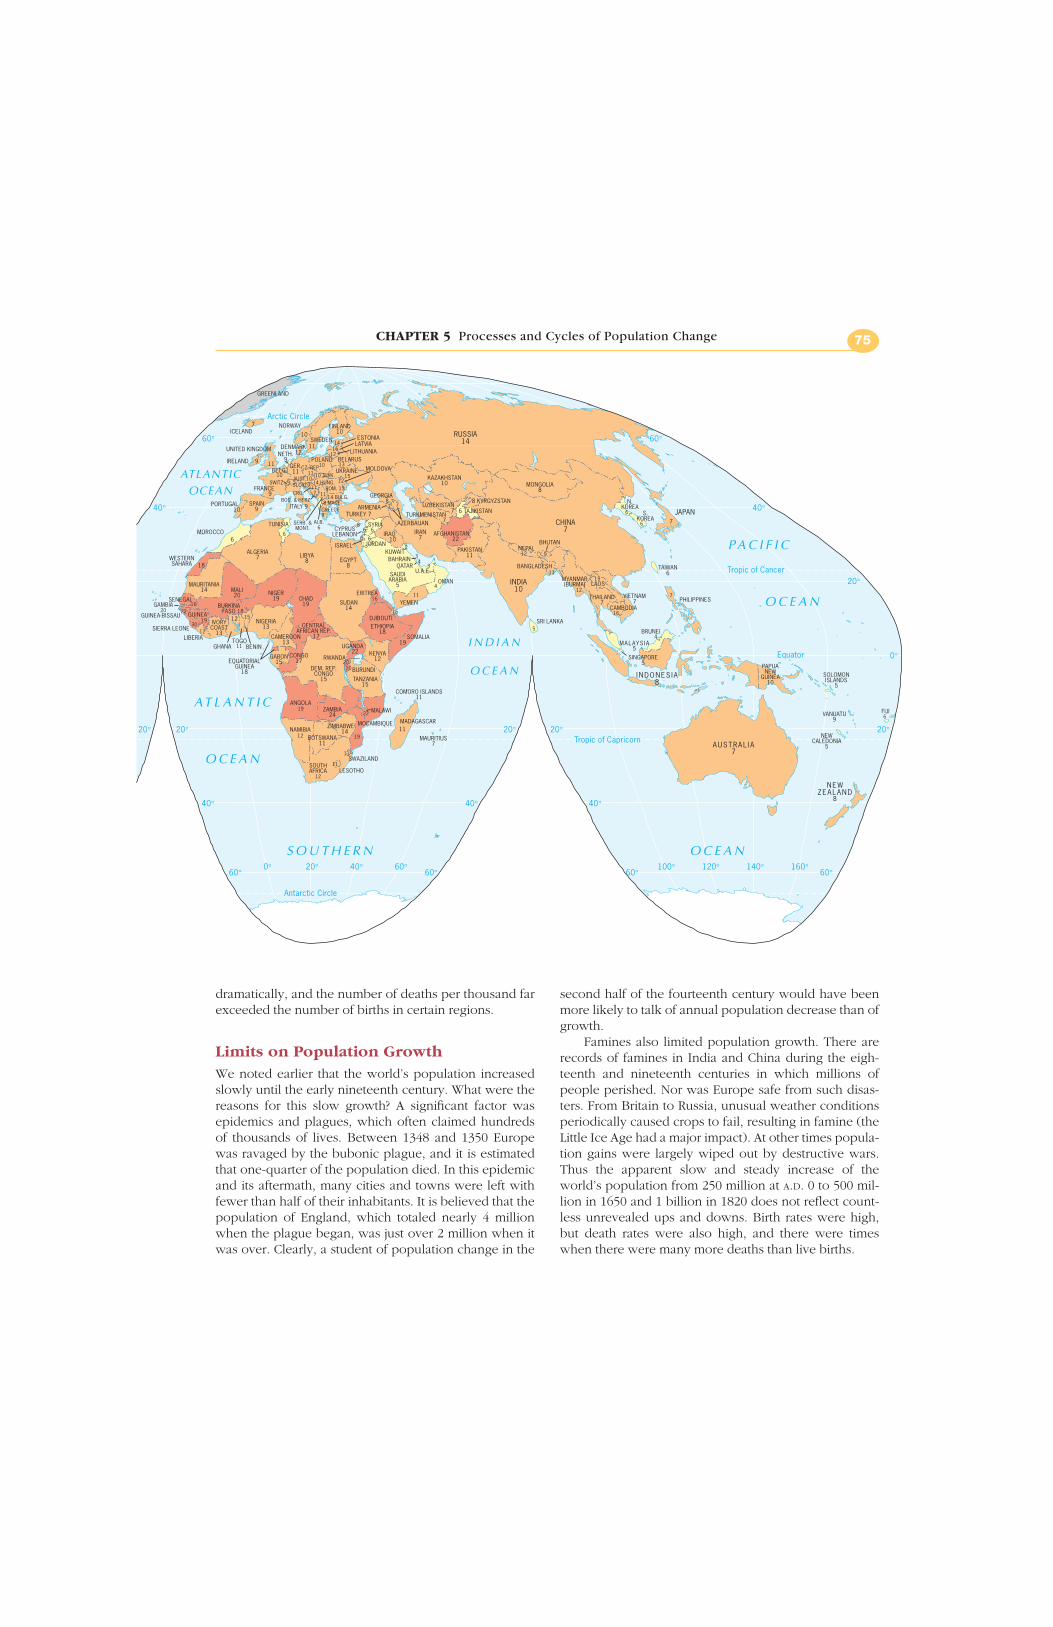
dramatically, and the number of deaths per thousand farexceeded the number of births in certain regions.
Limits on Population GrowthWe noted earlier that the world’s population increasedslowly until the early nineteenth century. What were thereasons for this slow growth? A significant factor wasepidemics and plagues, which often claimed hundredsof thousands of lives. Between 1348 and 1350 Europewas ravaged by the bubonic plague, and it is estimatedthat one-quarter of the population died. In this epidemicand its aftermath, many cities and towns were left withfewer than half of their inhabitants. It is believed that thepopulation of England, which totaled nearly 4 millionwhen the plague began, was just over 2 million when itwas over. Clearly, a student of population change in the
second half of the fourteenth century would have beenmore likely to talk of annual population decrease than ofgrowth.
Famines also limited population growth. There arerecords of famines in India and China during the eigh-teenth and nineteenth centuries in which millions ofpeople perished. Nor was Europe safe from such disas-ters. From Britain to Russia, unusual weather conditionsperiodically caused crops to fail, resulting in famine (theLittle Ice Age had a major impact). At other times popula-tion gains were largely wiped out by destructive wars.Thus the apparent slow and steady increase of theworld’s population from 250 million at A.D. 0 to 500 mil-lion in 1650 and 1 billion in 1820 does not reflect count-less unrevealed ups and downs. Birth rates were high,but death rates were also high, and there were timeswhen there were many more deaths than live births.
CHAPTER 5 Processes and Cycles of Population Change 75
60° 60°
40°40°
20°
0°
20° 20° 20° 20° 20°
40°
60°
40°
60°
40°
60° 60°0° 20° 40° 60° 100° 120° 140° 160°
Tropic of Cancer
Arctic Circle
Equator
Tropic of Capricorn
Antarctic Circle
ATLANTICOCEAN
AT L A N T I C
O C E A N
I N D I A N
O C E A N
P A C I F I C
O C E A N
O C E A NS O U T H E R N
GREENLAND
ICELAND
IRELAND
UNITED KINGDOM
PORTUGAL SPAIN9
FRANCE 9
BELG.10
NETH.9
TURKEY 7
CYPRUS
NORWAY
SWEDEN
FINLAND10
DENMARK 12
LEBANONMOROCCO
WESTERNSAHARA
ALGERIA7 LIBYA
8
TUNISIA
EGYPT8
SUDAN14
CHAD19
NIGER19
MALI20
MAURITANIA14
ETHIOPIA18
DJIBOUTI
ERITREA
SOMALIA
SENEGALGAMBIA
20GUINEA-BISSAU GUINEA
SIERRA LEONE
LIBERIAGHANA
IVORYCOAST
13TOGO
BENIN
NIGERIA13
CAMEROON13
BURKINAFASO
CENTRALAFRICAN REP.
17
DEM. REP.CONGO
15
CONGO17
GABON15EQUATORIAL
GUINEA18
UGANDA 22 KENYA
12
TANZANIA15
RWANDA
BURUNDI
ANGOLAZAMBIA
24MALAWI
MOCAMBIQUEZIMBABWE 14
BOTSWANA11
NAMIBIA
SOUTHAFRICA LESOTHO
SWAZILAND
MADAGASCAR
MAURITIUS7
COMORO ISLANDS11
RUSSIA14
8ARMENIA
GEORGIA
AZERBAIJAN
UZBEKISTAN7
TURKMENISTAN7
KAZAKHSTAN10
8 KYRGYZSTAN
6 TAJIKISTAN
MONGOLIA8
IRAN7
CHINA7
IRAQ 10
SYRIA
JORDANISRAELKUWAIT
SAUDIARABIA
5
QATARBAHRAIN
U.A.E.
OMAN
YEMEN
AFGHANISTAN 22
PAKISTAN11
INDIA10
NEPAL
SRI LANKA
BHUTAN
BANGLADESH
MYANMAR(BURMA)
THAILAND7
CAMBODIA
LAOS
VIETNAM7
TAIWAN
MALAYS I A5
BRUNEI
PHILIPPINES
IN DON ES I A8
PAPUANEW
GUINEA10
AUSTRAL I A7
NEWZEALAND
JAPANN.
KOREAS.
KOREA
NEWCALEDONIA
5
VANUATU9
FIJI
SINGAPORE5
7
9
7
8
10
10
11
11
18
20
16
16
1219
22
11
12
11
22
6
19
20
16
30
19
11
6
3
11
9
4
8
6
6 6
6
2
15
6
12
4
7
4
5
6
3
11
12
12
19
11
15
18
12
16
6
6
GER.11
POLAND10
ITALY 9
SWITZ.AUST.
CZ. REP.11 10 SLVK.
ROM. 13
14 BULG.8 MACE.
CRO.BOS. & HERZ.
SLOV.
ALB.6
GREECE9
14 HUNG.
ESTONIA
LITHUANIA
SERB. &MONT.
LATVIA
BELARUS
UKRAINE MOLDOVA13
15101011
1416
12
77
129
117
¸
SOLOMONISLANDS
5
The Second Agricultural Revolution andthe Industrial RevolutionEventually things began to change. In Europe there wasa marked increase in the growth rate during the eigh-teenth century, and this time there was no major setbackto erase the gains. This was the time of the Second Agri-cultural Revolution, when farming methods improved,crop yields increased, storage capacities were expanded,and distribution systems were improved. The Continen-tal European Industrial Revolution of the nineteenth cen-tury also had a major impact: sanitation facilities madethe towns and cities safer from epidemics, and modernmedical practices became widespread.
Disease prevention through vaccination introduceda new era in public health. Death rates declinedmarkedly. Before 1750 they probably averaged 35 per1000 (births averaged under 40), but by 1850 the deathrate was about 16 per thousand. Consider what thismeans in terms of natural growth: if in 1750 the birth ratewas 39 per thousand and the death rate 35 per thousand,the rate of natural increase was 4 per thousand, or 0.4percent. In 1850 birth rates were still high, perhaps 36per thousand, but the death rate was 16 per thousand.Now the rate of natural increase was 2.0 percent. Thechange is especially spectacular when viewed in thecontext of doubling time. In 1750, it was about 150 years;in 1850, it was only 35 years.
One effect of this increase in the rate of naturalgrowth was increased migration. Millions of people leftthe squalid, crowded industrial cities (and farms as well)to emigrate to other parts of the world—North and SouthAmerica, Australia, South Africa, and elsewhere. Theywere not the first to make this journey. Adventurers, ex-plorers, merchants, and colonists had gone before them.Those early immigrants had decimated native popula-tions through conquest, slavery, and the introduction ofdiseases against which the local people had no naturalimmunity. However, when European colonization beganin earnest during the nineteenth century, the Europeansbrought with them their newfound methods of sanitationand medical techniques, and these had the opposite ef-fect. In Africa, India, and South America death ratesbegan to decline as they had in Europe, and populationsthat had long been caught in cycles of gains and lossesbegan to grow—and to grow at increasing rates.
We can only speculate about the native populationsof the Americas, Africa, Asia, and Australia before the ar-rival of the Europeans. At about the time of the first Eu-ropean contact, there were probably fewer than 25 mil-lion people in all of North and South America; in Africasouth of the Sahara there may have been 70 million.(Some recent estimates place these totals somewhathigher.) In China in the mid-seventeenth century, thepopulation may have been less than 200 million; Indiaprobably had fewer than 100 million inhabitants. In
North America and Australia the European impact on theindigenous population was devastating, but elsewherecolonial rule reduced the impact of periodic calamitouschecks on population growth through the introductionof technologies that reduced the effects of natural haz-ards and diseases.
◆ DEMOGRAPHIC CHANGE
The population of a country (or other unit area such as aState, province, or city) changes as a result of four condi-tions; births and inmigration (immigration), which add tothe total; and deaths and outmigration (emigration),which subtract from it. Births (fertility), deaths (mortal-ity), and migration are the three demographic variables.
To calculate demographic change in a country or re-gion, we use the simple formula
TP � OP � B � D � I � E
where TP (total population) equals OP (original popula-tion) plus B (births) minus D (deaths) plus I (immigra-tion) minus E (emigration). As noted earlier, only birthsand deaths are used in calculating a population’s naturalincrease. You can calculate the natural increase for vari-ous countries by subtracting figures on the map of worldmortality (Fig. 5-7) from those of births (Fig. 5-6).
The demographic change formula explains why cal-culations based only on births and deaths do not capturethe entire picture. Population change, as recorded in Fig-ure 5-1, does not take into account emigration and immi-gration. Obviously, the world population figures re-ferred to previously represent the natural increase for theworld as a whole because our planet does not (yet) ex-perience immigration or emigration.
The Demographic TransitionDemographers who have studied population growth invarious parts of the world believe that the high rates ofincrease now occurring in many less developed coun-tries are not necessarily permanent. In Europe, for exam-ple, the situation is very different today than it was a cen-tury ago. In the United Kingdom in 1997, the crude birthrate was 13 and the crude death rate was 11, producing arate of natural increase of just 0.2 percent. In the prein-dustrial period there also was a small difference betweenbirth and death rates, but both rates were high; now bothare low. It is in the intervening stage, when birth rates re-mained high but death rates fell rapidly, that Britain’spopulation explosion took place. It is not difficult, then,to discern four stages in the United Kingdom’s demo-graphic cycle: (1) high birth rates and high death ratesand a low rate of growth; (2) continuing high birth rates,but declining and low death rates and a high rate ofgrowth; (3) declining and low death rates but a still sub-
Part Two Population Patterns and Processes76
stantial growth rate; and (4) low birth and low deathrates and, thus, a low rate of growth.
This sequence of stages has been observed in thepopulation records of several European countries, andon this basis demographers have defined what they callthe demographic cycle or demographic transition.Its four stages (Fig. 5-8) are:
1. High stationary stage, with high fertility (births)and high mortality (deaths) and variable population,but little long-term growth.
2. Early expanding stage, with high fertility and de-clining mortality.
3. Late expanding stage, with declining fertility but,as a result of already-low mortality, continuing sig-nificant growth.
4. Low stationary stage, with low fertility and lowmortality, and a very low rate of growth.
The demographic transition is represented bystages 2 and 3, during which high birth and death rates
decline. The initial rapid drop in death rates is notmatched by lowered birth rates, so a period of high nat-ural increase results. The dimensions of the expansiondepend on the size of the base population and the rateof decline in the death rate.
This is what happened in the United Kingdom andin much of Europe. Europe as a whole currently has apopulation growth rate of close to zero. It appears,therefore, that the population “bomb” may eventuallyfizzle out and that in due course the European model oflow birth and death rates and a nearly stable populationwill prevail everywhere—or will it?
Demographic Change in Developing CountriesIn Europe the birth rate declined largely because of theeffects of industrialization, urbanization, and generalmodernization. In contrast, in much of the developingworld, the majority of the people have not been greatlyaffected by such changes. Moreover, there are quantita-tive differences between the situation in Europe duringthe nineteenth century and that prevailing in certainparts of the world today. When Europe’s population rev-olution began, the base was small. Britain had between 6and 7 million residents; Germany had 7 million; France,Belgium, and the Netherlands combined had 18 million.Asia’s major population clusters were already muchlarger when the population revolution began there.China may have had over 200 million inhabitants andIndia over 100 million. If you superimpose the growthrates of the second and third stages on these large bases,the resulting population increases take on astronomicalproportions.
Therefore, it may be unwise to assume that all coun-tries’ demographic cycles will follow the sequence thatoccurred in industrializing Europe or to believe that thestill-significant growth currently taking place in Bangla-desh, Mexico, and numerous other countries will simplysubside. Nonetheless, agencies monitoring global popu-lation sometimes suggest that most (if not all) countries’populations will stop growing at some time during thetwenty-first century, reaching a so-called stationarypopulation level (SPL). This would mean, of course,that the world’s population would stabilize and that themajor problems to be faced would involve the agedrather than the young.
Such predictions require frequent revision, how-ever, and the anticipated dates for population stabiliza-tion are often moved back. In the late 1980s, for exam-ple, the World Bank predicted that the United Stateswould reach SPL in 2035 with 276 million inhabitants.Brazil’s population would stabilize at 353 million in 2070,Mexico’s at 254 million in 2075, and China’s at 1.4 billionin 2090. India, destined to become the world’s most pop-ulous country, would reach SPL at 1.6 billion in 2150.
CHAPTER 5 Processes and Cycles of Population Change 77
From the field notes
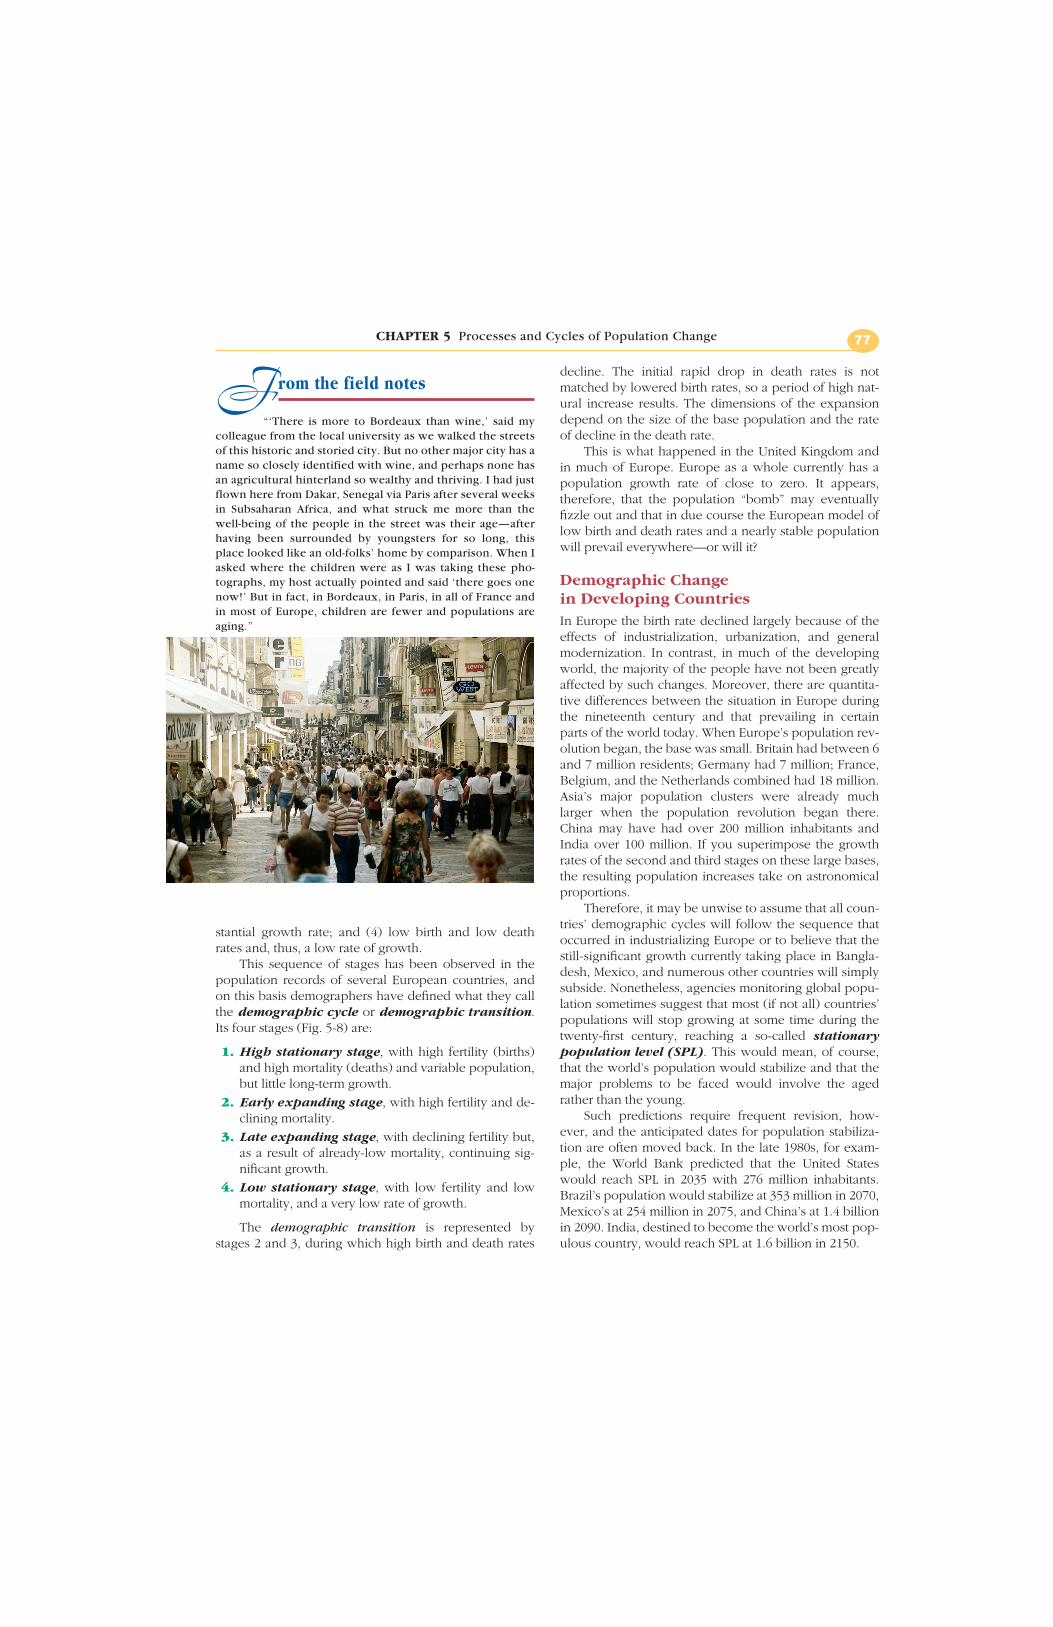
“‘There is more to Bordeaux than wine,’ said mycolleague from the local university as we walked the streetsof this historic and storied city. But no other major city has aname so closely identified with wine, and perhaps none hasan agricultural hinterland so wealthy and thriving. I had justflown here from Dakar, Senegal via Paris after several weeksin Subsaharan Africa, and what struck me more than thewell-being of the people in the street was their age—afterhaving been surrounded by youngsters for so long, thisplace looked like an old-folks’ home by comparison. When Iasked where the children were as I was taking these pho-tographs, my host actually pointed and said ‘there goes onenow!’ But in fact, in Bordeaux, in Paris, in all of France andin most of Europe, children are fewer and populations areaging.”

Today those figures seem unrealistic. China’s popu-lation passed the 1.2 billion mark in 1994; India’sreached 1 billion in 1998. If we were to project an opti-mistic decline in growth rates for both countries,China’s population would “stabilize” at 1.7 billion in2070 and India’s at 2.0 billion in the same year. But pop-ulation increase is a cyclic phenomenon, and overalldeclines mask lags and spurts (not to mention regionaldisparities).
There are some hopeful signs, however. In SriLanka, the birth rate is declining, and so is the overallgrowth rate—without the kind of economic develop-
ment that is usually considered a prerequisite for such adecline. A similar noteworthy reduction in the popula-tion growth rate has been recorded in the Indian State ofKerala, where the growth rate now stands at 1.1 percentcompared to 1.9 percent for India as a whole. It is inter-esting that the literacy rate for Kerala is about 90 percentof the population, compared to just over 50 percent forall of India. Yet there still is no proof of a permanent,worldwide reversal in population expansion. Hence,even though there are some grounds for optimism, pop-ulation expansion remains a very real issue as we enterthe twenty-first century.
Part Two Population Patterns and Processes78
A
B
50
40
30
20
10
0
Per
1000
per
yea
r
Low growth Increasinggrowth
Highgrowth
Decreasinggrowth
Low growth
Time
Stage 1 Stage 2 Stage 3 Stage 4
Birth Rate
DeathRate
Figure 5-8 The Demographic Tran-sition Model. Four stages of the demo-graphic transition.
◆ KEY TERMS ◆
age-sex pyramidcrude birth rate (CBR)crude death rate (CDR)demographic transition (cycle)demography
doubling timeexponential growthinfant mortalitylinear growthnatural increase
population compositionpopulation explosionpopulation structurestationary population level (SPL)total fertility rate (TFR)
◆ APPLYING GEOGRAPHIC KNOWLEDGE ◆
1. The debate over population growth and food supply,started by Malthus 200 years ago, still continues. Neo-Malthusians argue that what Malthus wrote aboutBritain two centuries ago can be applied to the worldas a whole today—recent gains in global food sup-plies notwithstanding. Take a pro- or anti-Malthusianposition and argue your case, using your geographicknowledge of population distribution, urbanization,resource availability, and demographic processes.
2. Some argue that the demographic transition model(see Fig. 5-8) is not necessarily an appropriate tool forunderstanding likely future population trends in Sub-saharan African countries. What is different aboutthose countries now and the Western Europeancountries at the time they went through the demo-graphic transition? Are those differences likely to ren-der the demographic transition model inapplicable toSubsaharan Africa? If so, why? If not, why not?
Related Documents