61 Chapter 5: Oxidative Stress 5.1. Background ROS are unstable molecules, which make them highly reactive. These molecules are naturally generated in small amounts during metabolic reactions of the body. ROS can react with and damage cellular molecules such as lipids, proteins and DNA. Four chemical reactions have been reported through which reactive molecules can modify other molecules and include (Wu and Cederbaum, 2003): • Hydrogen abstraction: A radical reacts with a hydrogen donor, to yield a stable molecule, which in turn makes the hydrogen donor reactive. • Addition: A radical binds to an originally stable molecule converting the combined molecule into a reactive one. • Termination: Two radicals react with each other to form a stable compound. • Disproportionation: A radical reacts with another identical radical and donates its unpaired electron to the other, thereby yielding two stable compounds. Under certain conditions the production of ROS is enhanced and/or the level or activity of antioxidants is reduced. The resulting state, which is characterized by a disturbance in the balance between ROS production, on the one hand and ROS removal and repair of damaged molecules on the other, is called oxidative stress (Cederbaum et al., 2009). The principal source of ROS production in mammalian cells is the mitochondria, which produces reactive species including •O 2 - , H 2 O 2 and the highly reactive •OH. Mitochondrial ROS are produced by the electron transport chain, which consists of four electron carrier complexes, I-IV. Electrons derived from metabolic reducing equivalents are fed into the

Welcome message from author
This document is posted to help you gain knowledge. Please leave a comment to let me know what you think about it! Share it to your friends and learn new things together.
Transcript
61
Chapter 5: Oxidative Stress
5.1. Background
ROS are unstable molecules, which make them highly reactive. These molecules are
naturally generated in small amounts during metabolic reactions of the body. ROS can react
with and damage cellular molecules such as lipids, proteins and DNA. Four chemical
reactions have been reported through which reactive molecules can modify other molecules
and include (Wu and Cederbaum, 2003):
• Hydrogen abstraction:
A radical reacts with a hydrogen donor, to yield a stable molecule, which in turn
makes the hydrogen donor reactive.
• Addition:
A radical binds to an originally stable molecule converting the combined molecule
into a reactive one.
• Termination:
Two radicals react with each other to form a stable compound.
• Disproportionation:
A radical reacts with another identical radical and donates its unpaired electron to
the other, thereby yielding two stable compounds.
Under certain conditions the production of ROS is enhanced and/or the level or activity of
antioxidants is reduced. The resulting state, which is characterized by a disturbance in the
balance between ROS production, on the one hand and ROS removal and repair of damaged
molecules on the other, is called oxidative stress (Cederbaum et al., 2009).
The principal source of ROS production in mammalian cells is the mitochondria, which
produces reactive species including •O2-, H2O2 and the highly reactive •OH. Mitochondrial
ROS are produced by the electron transport chain, which consists of four electron carrier
complexes, I-IV. Electrons derived from metabolic reducing equivalents are fed into the
62
electron transport chain through either complex I or complex II, and eventually pass to
molecular O2 to form H2O in complex IV (Liu et al., 2002). Theoretically, all of these
complexes are able to transfer electrons to O2 to form •O2-, which is quickly dismutated to
H2O2 by mitochondrial superoxide dismutase. However, studies have shown that
mitochondrial ROS originate mainly from carrier complexes I and III (Turrens and Boveris,
1980; Turrens et al., 1985).
Another major source of ROS, especially in the liver, is the membrane-bound microsomal
monooxygenase system (MMO) (Wu and Cederbaum, 2003). This system, which catalyses
the oxygenation of a wide variety of exogenous and endogenous compounds, contains CYPs
as the terminal oxidases. Monooxygenation reactions typically require the input of two
electrons that are transferred to P450 by the flavoprotein NADPH-P450 reductase but may
also come from cytochrome b5, a small hemoprotein, and its NADH-dependent reductase.
The efficiency of electron transfer from NADPH through the electron carriers to the CYP for
monooxygenation of substrate is referred to as coupling (Zangar et al., 2004). Although the
degree of coupling of NADPH consumption to substrate oxidation varies for different P450
species, it is usually less than 50%. An uncoupled state leads to ROS production as electrons
that enter the system do not end in the oxygenation of substrate but escape their natural
reaction sequence, finally affecting other molecules present through one of the four
reactions mentioned at the beginning of this chapter.
Results from the CYP1A1 experiments show that the test compounds in question are able to
induce CYP activity. As mentioned above, MMO is a major source of ROS, especially in the
liver, and the up-regulation of CYP1A1 activity is suggestive of possible increased ROS
generation and a resultant state of oxidative stress. For this reason, examining
DDT/DDE/DDD-induced ROS generation could illuminate the mechanism of the cytotoxicity
of the three test compounds.
63
5.2. Methods
5.2.1. Detection of intracellular ROS by fluorometery
Nine independent endpoint fluorometry experiments were carried out in duplicate, six with
the test compounds alone (n = 12) and three that included a 1 h NAC pre-treatment (n = 6).
Intracellular ROS was detected according to the method described by Zhang et al. (2009),
with slight modifications. Following the 48 h seeding incubation, 40 µl of 2',7'-
dichlorofluorescein diacetate DCFDA (20 µM) in PBS was added to each well and incubated
for 1 h at 37C. The loading medium was then carefully removed and cells washed with 200
µl PBS. Cells were kept hydrated by the addition of 50 µl of PBS to each well followed by the
addition of 50 µl of either PBS (1% DMSO), 2',2'-azobis(2-methylpropionamidine)
dihydrochloride AAPH (300 µM) or test compound (10 - 300 µM) to yield final
concentrations of 0.5% DMSO, 150 µM AAPH and 5 - 150 µM of the relevant test
compounds. Cells were incubated for 3 h before fluorescence was measured on a FluoStar
Optima fluorescent plate reader using λex = 492 nm and λem = 525 nm at a gain setting of
750. AAPH was used as positive oxidant control (Ximenes et al., 2009).
5.2.2. Detection of intracellular ROS by flow cytometry
To confirm the findings obtained with fluorometry, ROS detection with DCFDA was repeated
using flow cytometry. After harvesting cells by trypsinisation, 1×10⁷ cells were pooled into a
single centrifuge tube and incubated with 5.7 µM DCFDA in 1 ml EMEM for 1 h at 37°C. This
was done to ensure that all the cells for a particular experiment were pre-loaded with the
same concentration of the oxidant sensitive dye.
While the cells were being incubated to pre-load with DCFDA, 5 µl of DMSO (vehicle
solvent), AAPH (30 mM) or test compound (1 - 30 mM), were added to individual flow
cytometry tubes.
64
Following DCFDA pre-loading, cells were diluted to 2×10⁵ cells/ml (same cell density as used
in all other experiments) using PBS. Of this cell suspension, 1 ml was added to each of the
prepared flow cytometry tubes. Cells were then incubated for 3 h at 37°C, after which the
fluorescence was measured using channel FL1 (525 nm) on a Beckman Coulter FC500 flow
cytometer. A total number of 5000 events were recorded per sample, from which a mean
was obtained. Three individual experiments on individual batches of cells were performed.
5.2.3. Kinetic evaluation of ROS detected by fluorometry
To determine whether any ROS generation occurred over a longer exposure period, kinetic
experiments were conducted. As with fluorometric detection (described in Section 5.2.1.),
cells were loaded with 5.7 µM DCFDA for 1 h at 37°C. The solution was then carefully
aspirated and the cells washed with PBS. This was followed by the addition of 50 µl PBS and
an additional 50 µl of PBS containing either DMSO (1%), AAPH (300 µM) or the relevant test
compound (0.2 - 200 µM) to each well. Final concentrations of DDT, DDE and DDD were
0.01, 0.1, 1, 10 and 100 µM (0.5% DMSO final concentration). The initial concentration
range was broadened to allow for the detection of ROS below 5 µM of test compound in
order to determine whether lower concentrations may induce any significant ROS
generation. After adding the test compounds and controls, fluorescence was determined at
30 min intervals over a period of 14 h at 37°C. Fluorescence was detected on a FluoStar
Optima fluorescent plate reader using λex = 492 nm and λem = 525 nm at a gain setting of
750.
5.2.4. Statistical analyses
Nine independent endpoint fluorometry experiments were carried out in duplicate, six with
the test compounds alone (n = 12) and three that included a 1 h NAC pre-treatment (n = 6).
Outliers were detected using Grubb's test and removed, before normality of the data
distributions were evaluated with the Shapiro-Francia test. Hypothesis testing was then
65
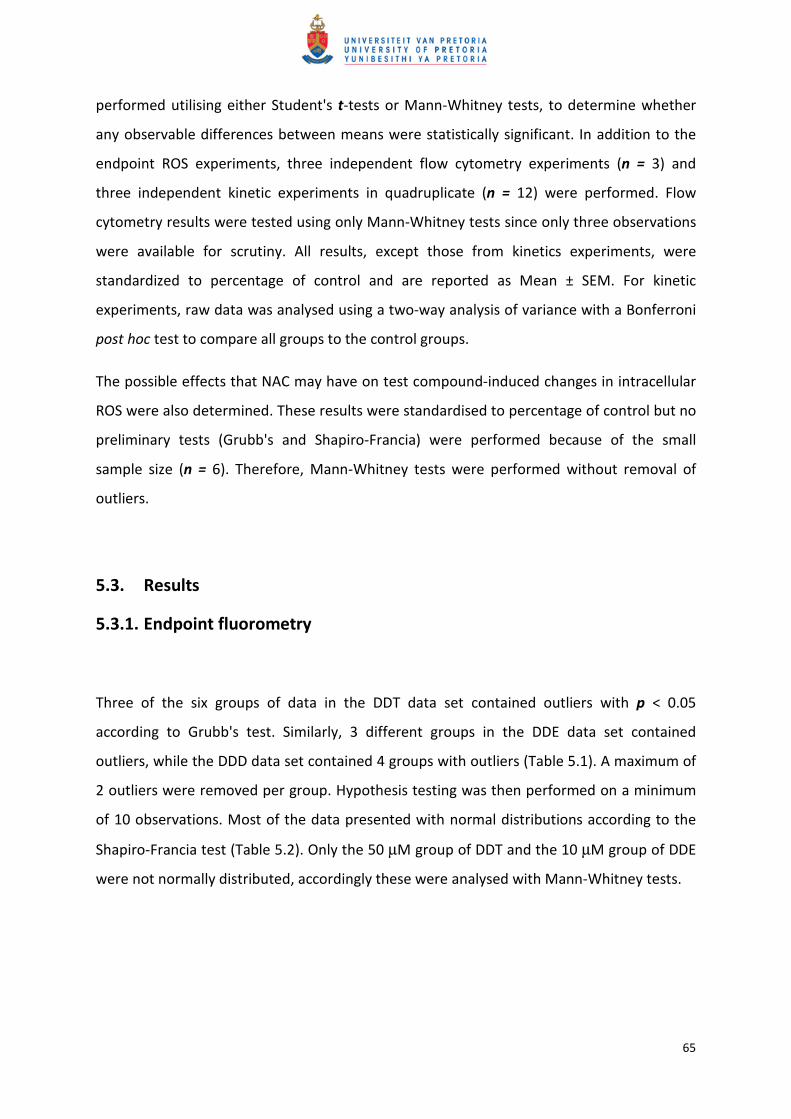
performed utilising either Student's t-tests or Mann-Whitney tests, to determine whether
any observable differences between means were statistically significant. In addition to the
endpoint ROS experiments, three independent flow cytometry experiments (n = 3) and
three independent kinetic experiments in quadruplicate (n = 12) were performed. Flow
cytometry results were tested using only Mann-Whitney tests since only three observations
were available for scrutiny. All results, except those from kinetics experiments, were
standardized to percentage of control and are reported as Mean ± SEM. For kinetic
experiments, raw data was analysed using a two-way analysis of variance with a Bonferroni
post hoc test to compare all groups to the control groups.
The possible effects that NAC may have on test compound-induced changes in intracellular
ROS were also determined. These results were standardised to percentage of control but no
preliminary tests (Grubb's and Shapiro-Francia) were performed because of the small
sample size (n = 6). Therefore, Mann-Whitney tests were performed without removal of
outliers.
5.3. Results
5.3.1. Endpoint fluorometry
Three of the six groups of data in the DDT data set contained outliers with p < 0.05
according to Grubb's test. Similarly, 3 different groups in the DDE data set contained
outliers, while the DDD data set contained 4 groups with outliers (Table 5.1). A maximum of
2 outliers were removed per group. Hypothesis testing was then performed on a minimum
of 10 observations. Most of the data presented with normal distributions according to the
Shapiro-Francia test (Table 5.2). Only the 50 µM group of DDT and the 10 µM group of DDE
were not normally distributed, accordingly these were analysed with Mann-Whitney tests.
66
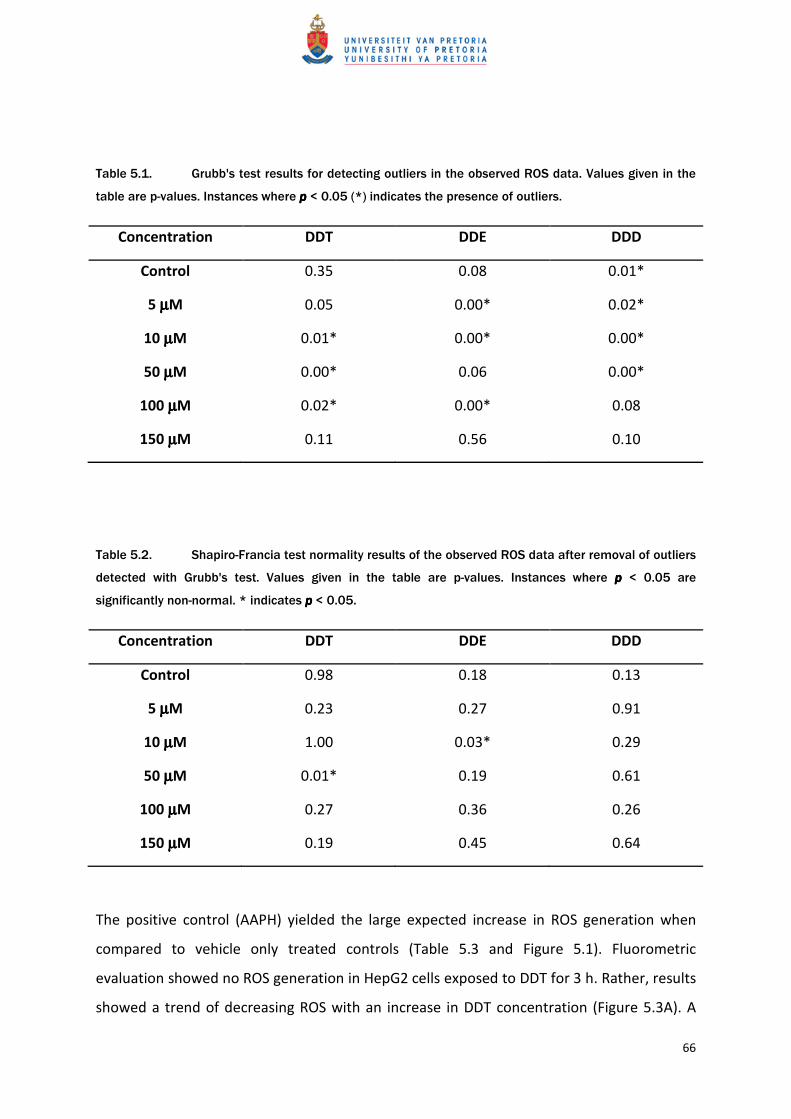
Table 5.1. Grubb's test results for detecting outliers in the observed ROS data. Values given in the
table are p-values. Instances where p p p p < 0.05 (*) indicates the presence of outliers.
Concentration DDT DDE DDD
Control 0.35 0.08 0.01*
5 µµµµM 0.05 0.00* 0.02*
10 µµµµM 0.01* 0.00* 0.00*
50 µµµµM 0.00* 0.06 0.00*
100 µµµµM 0.02* 0.00* 0.08
150 µµµµM 0.11 0.56 0.10
Table 5.2. Shapiro-Francia test normality results of the observed ROS data after removal of outliers
detected with Grubb's test. Values given in the table are p-values. Instances where p p p p < 0.05 are
significantly non-normal. * indicates p p p p < 0.05.
Concentration DDT DDE DDD
Control 0.98 0.18 0.13
5 µµµµM 0.23 0.27 0.91
10 µµµµM 1.00 0.03* 0.29
50 µµµµM 0.01* 0.19 0.61
100 µµµµM 0.27 0.36 0.26
150 µµµµM 0.19 0.45 0.64
The positive control (AAPH) yielded the large expected increase in ROS generation when
compared to vehicle only treated controls (Table 5.3 and Figure 5.1). Fluorometric
evaluation showed no ROS generation in HepG2 cells exposed to DDT for 3 h. Rather, results
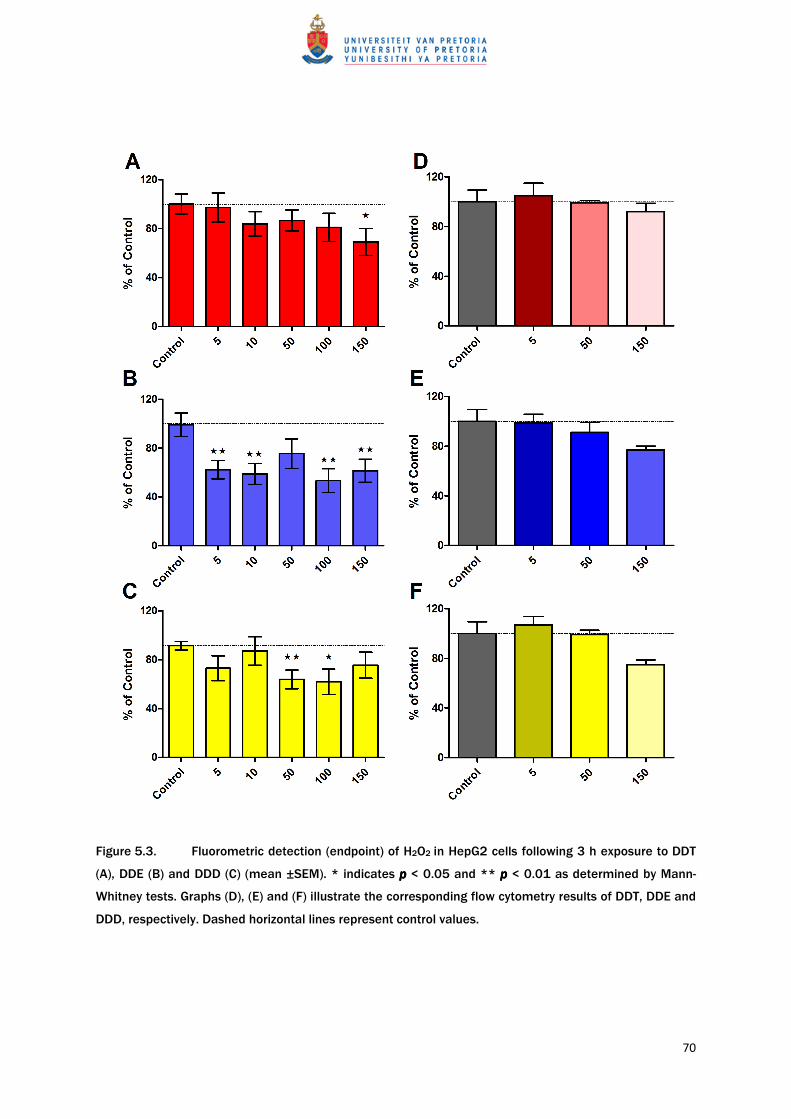
showed a trend of decreasing ROS with an increase in DDT concentration (Figure 5.3A). A
67
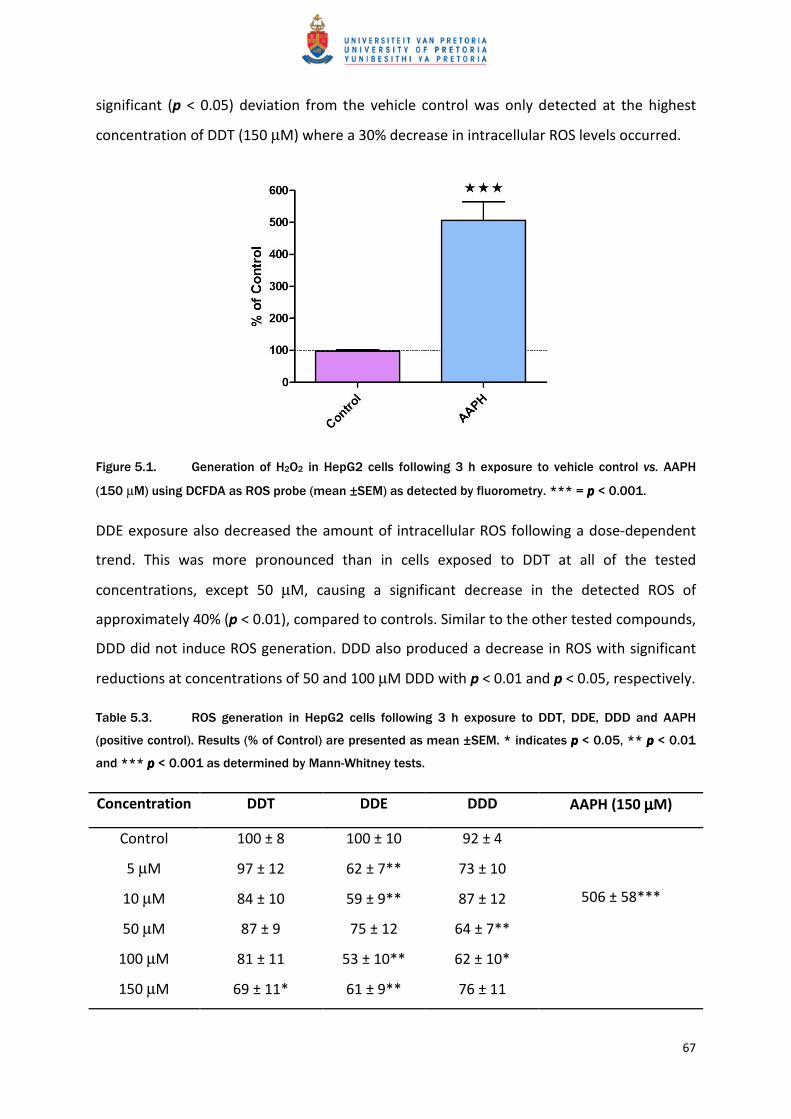
significant (p < 0.05) deviation from the vehicle control was only detected at the highest
concentration of DDT (150 µM) where a 30% decrease in intracellular ROS levels occurred.
Figure 5.1. Generation of H2O2 in HepG2 cells following 3 h exposure to vehicle control vs. AAPH
(150 µM) using DCFDA as ROS probe (mean ±SEM) as detected by fluorometry. *** = pppp < 0.001.
DDE exposure also decreased the amount of intracellular ROS following a dose-dependent
trend. This was more pronounced than in cells exposed to DDT at all of the tested
concentrations, except 50 µM, causing a significant decrease in the detected ROS of
approximately 40% (p < 0.01), compared to controls. Similar to the other tested compounds,
DDD did not induce ROS generation. DDD also produced a decrease in ROS with significant
reductions at concentrations of 50 and 100 µM DDD with p < 0.01 and p < 0.05, respectively.
Table 5.3. ROS generation in HepG2 cells following 3 h exposure to DDT, DDE, DDD and AAPH
(positive control). Results (% of Control) are presented as mean ±SEM. * indicates p p p p < 0.05, ** p p p p < 0.01
and *** p p p p < 0.001 as determined by Mann-Whitney tests.
Concentration DDT DDE DDD AAPH (150 µµµµM)
Control 100 ± 8 100 ± 10 92 ± 4
506 ± 58***
5 µM 97 ± 12 62 ± 7** 73 ± 10
10 µM 84 ± 10 59 ± 9** 87 ± 12
50 µM 87 ± 9 75 ± 12 64 ± 7**
100 µM 81 ± 11 53 ± 10** 62 ± 10*
150 µM 69 ± 11* 61 ± 9** 76 ± 11
68
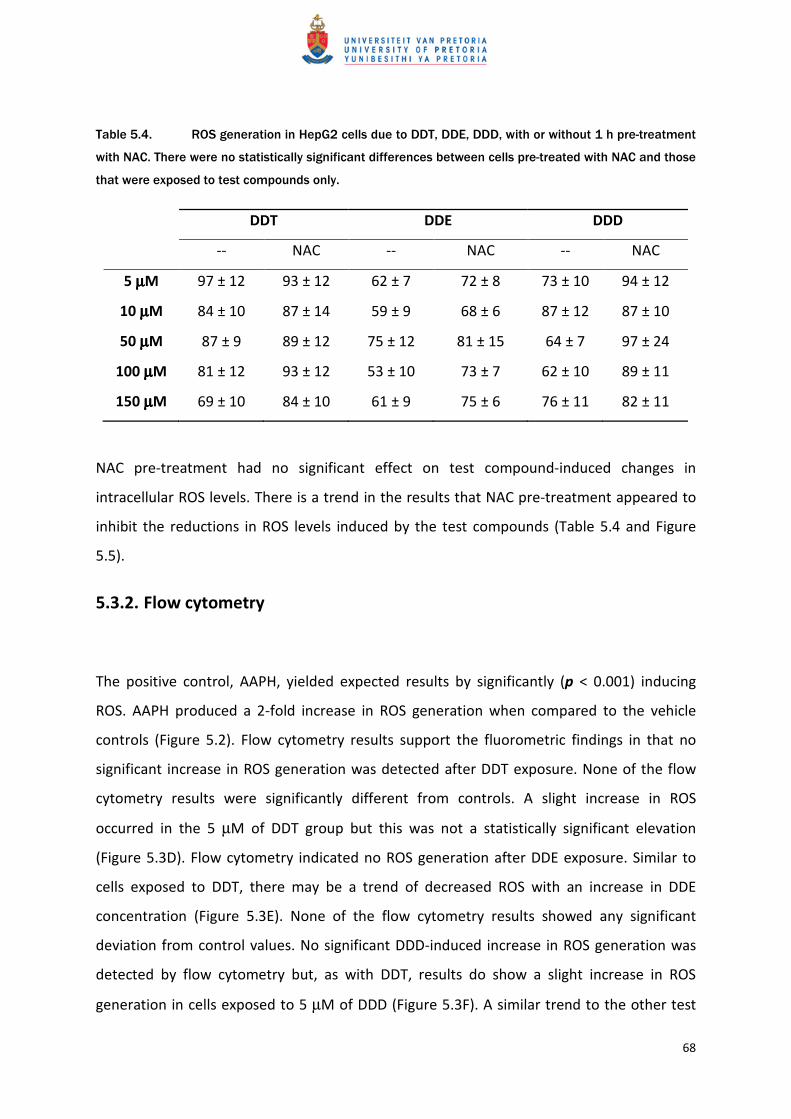
Table 5.4. ROS generation in HepG2 cells due to DDT, DDE, DDD, with or without 1 h pre-treatment
with NAC. There were no statistically significant differences between cells pre-treated with NAC and those
that were exposed to test compounds only.
DDT DDE DDD
-- NAC -- NAC -- NAC
5 µµµµM 97 ± 12 93 ± 12 62 ± 7 72 ± 8 73 ± 10 94 ± 12
10 µµµµM 84 ± 10 87 ± 14 59 ± 9 68 ± 6 87 ± 12 87 ± 10
50 µµµµM 87 ± 9 89 ± 12 75 ± 12 81 ± 15 64 ± 7 97 ± 24
100 µµµµM 81 ± 12 93 ± 12 53 ± 10 73 ± 7 62 ± 10 89 ± 11
150 µµµµM 69 ± 10 84 ± 10 61 ± 9 75 ± 6 76 ± 11 82 ± 11
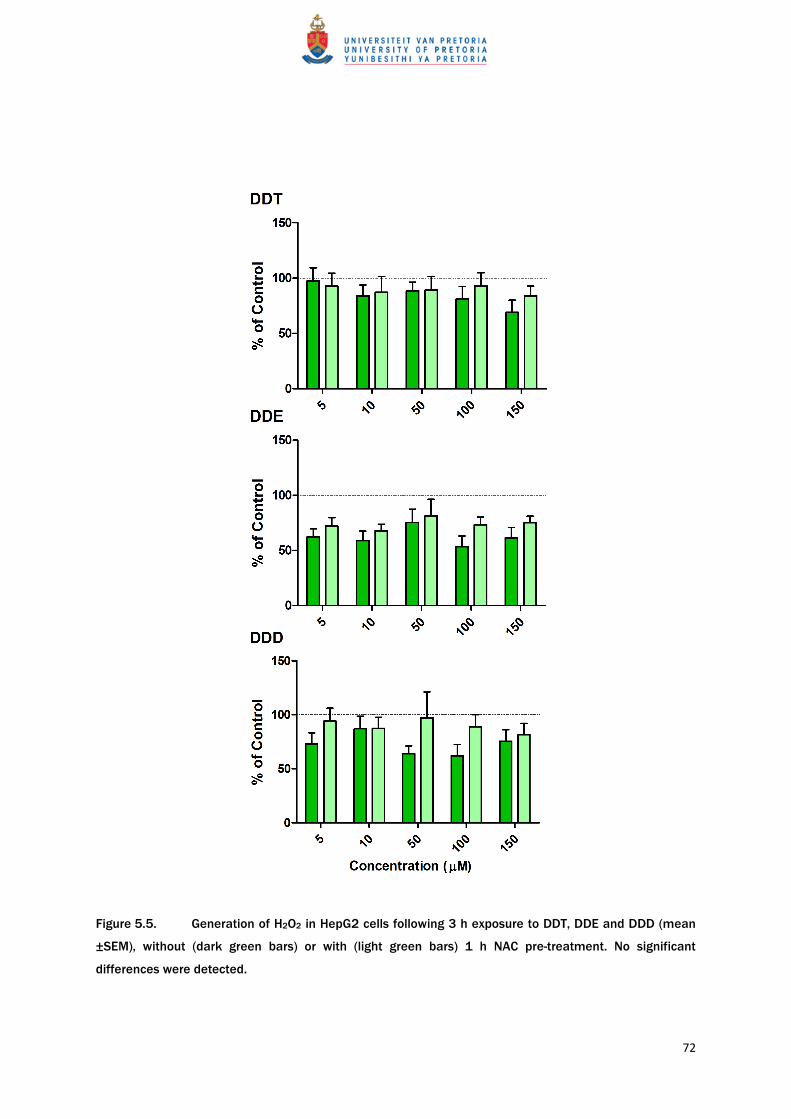
NAC pre-treatment had no significant effect on test compound-induced changes in
intracellular ROS levels. There is a trend in the results that NAC pre-treatment appeared to
inhibit the reductions in ROS levels induced by the test compounds (Table 5.4 and Figure
5.5).
5.3.2. Flow cytometry
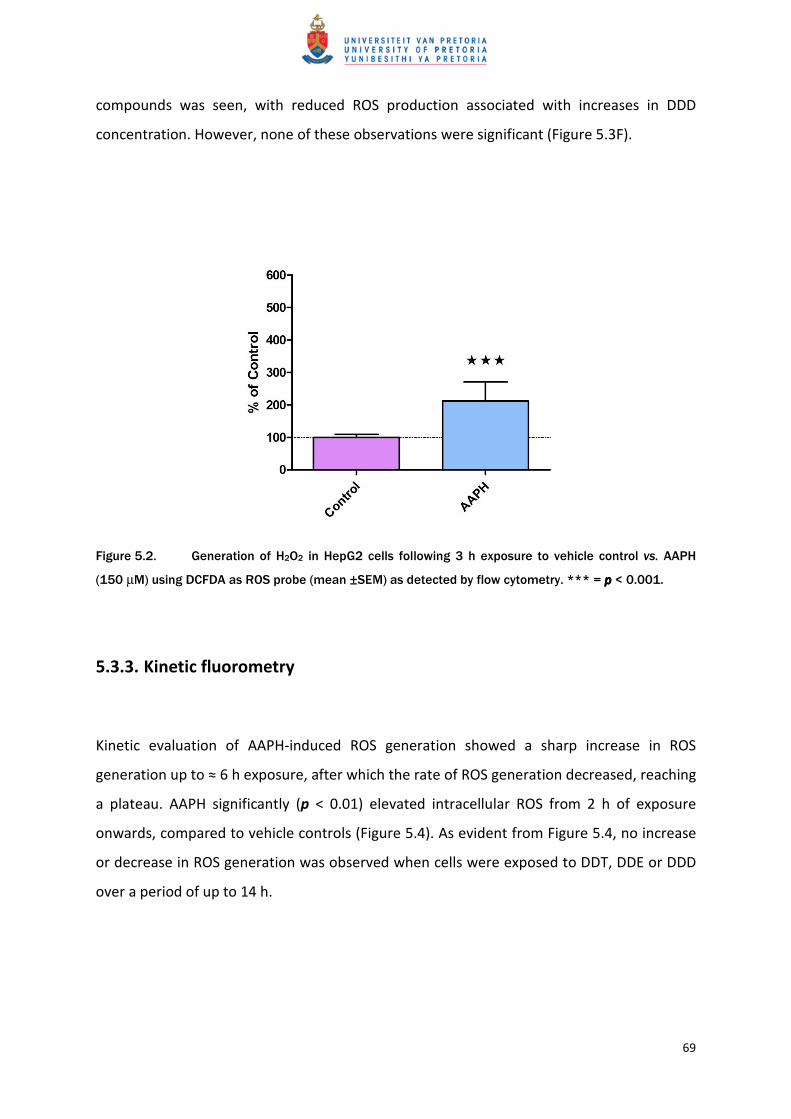
The positive control, AAPH, yielded expected results by significantly (p < 0.001) inducing
ROS. AAPH produced a 2-fold increase in ROS generation when compared to the vehicle
controls (Figure 5.2). Flow cytometry results support the fluorometric findings in that no
significant increase in ROS generation was detected after DDT exposure. None of the flow
cytometry results were significantly different from controls. A slight increase in ROS
occurred in the 5 µM of DDT group but this was not a statistically significant elevation
(Figure 5.3D). Flow cytometry indicated no ROS generation after DDE exposure. Similar to
cells exposed to DDT, there may be a trend of decreased ROS with an increase in DDE
concentration (Figure 5.3E). None of the flow cytometry results showed any significant
deviation from control values. No significant DDD-induced increase in ROS generation was
detected by flow cytometry but, as with DDT, results do show a slight increase in ROS
generation in cells exposed to 5 µM of DDD (Figure 5.3F). A similar trend to the other test
69
compounds was seen, with reduced ROS production associated with increases in DDD
concentration. However, none of these observations were significant (Figure 5.3F).
Figure 5.2. Generation of H2O2 in HepG2 cells following 3 h exposure to vehicle control vs. AAPH
(150 µM) using DCFDA as ROS probe (mean ±SEM) as detected by flow cytometry. *** = pppp < 0.001.
5.3.3. Kinetic fluorometry
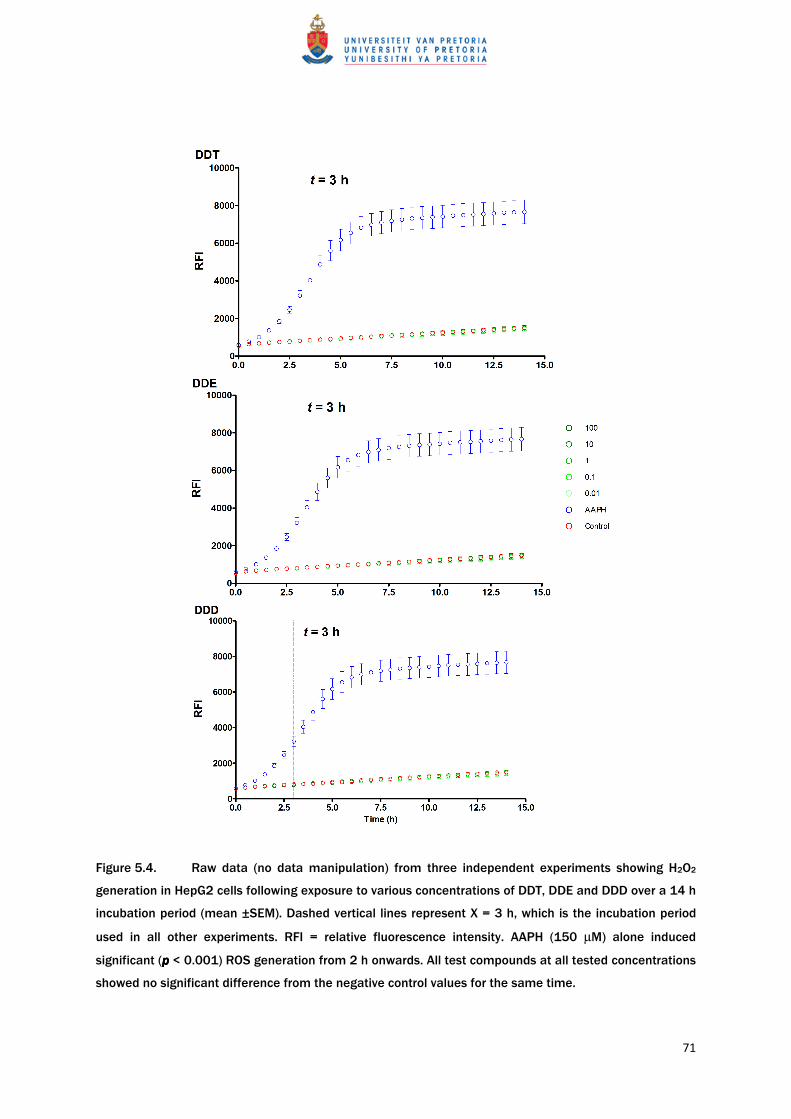
Kinetic evaluation of AAPH-induced ROS generation showed a sharp increase in ROS
generation up to ≈ 6 h exposure, after which the rate of ROS generation decreased, reaching
a plateau. AAPH significantly (p < 0.01) elevated intracellular ROS from 2 h of exposure
onwards, compared to vehicle controls (Figure 5.4). As evident from Figure 5.4, no increase
or decrease in ROS generation was observed when cells were exposed to DDT, DDE or DDD
over a period of up to 14 h.
70
Figure 5.3. Fluorometric detection (endpoint) of H2O2 in HepG2 cells following 3 h exposure to DDT
(A), DDE (B) and DDD (C) (mean ±SEM). * indicates p p p p < 0.05 and ** p p p p < 0.01 as determined by Mann-
Whitney tests. Graphs (D), (E) and (F) illustrate the corresponding flow cytometry results of DDT, DDE and
DDD, respectively. Dashed horizontal lines represent control values.
71
Figure 5.4. Raw data (no data manipulation) from three independent experiments showing H2O2
generation in HepG2 cells following exposure to various concentrations of DDT, DDE and DDD over a 14 h
incubation period (mean ±SEM). Dashed vertical lines represent X = 3 h, which is the incubation period
used in all other experiments. RFI = relative fluorescence intensity. AAPH (150 µM) alone induced
significant (p p p p < 0.001) ROS generation from 2 h onwards. All test compounds at all tested concentrations
showed no significant difference from the negative control values for the same time.
72
Figure 5.5. Generation of H2O2 in HepG2 cells following 3 h exposure to DDT, DDE and DDD (mean
±SEM), without (dark green bars) or with (light green bars) 1 h NAC pre-treatment. No significant
differences were detected.
73
5.4. Discussion
Following the removal of outliers with the Grubb’s test (Table 5.1), only 2 of the 18 data sets
presented non-normal distributions (Table 5.2), indicating good reproducibility.
When comparing the results of the fluorometric and flow cytometric methods of detection
of AAPH-induced ROS generation using DCFDA, fluorometry detected a 5-fold increase in
fluorescence compared to a 2-fold increase observed with flow cytometry (Figure 5.1 and
Figure 5.2). This would suggest that the fluorometry method is a more sensitive method
than flow cytometry. However, fluorometric evaluation demonstrates a different inhibitory
trend to that seen with flow cytometry (Figure 5.3).
Regarding the effect of the three test compounds on ROS levels, previous in vitro studies
using DCFDA as probe have demonstrated DDT-induced ROS generation in various types of
cells. Using fluorometry, researchers have reported DDT-induced ROS in skin tumour (Ruiz-
Leal and George, 2004) and U937 monocyte lymphoma cells (Sciullo et al., 2010). Studies
reporting DDT-induced ROS in hepatocytes (Filipak Neto et al., 2008; Shi et al., 2010a) have
used flow cytometry. The study by Filipak Neto et al. (2008) used primary hepatocytes
derived from a fish species. In the human-derived L-02 hepatocyte cell line, a significant
increase in intracellular ROS was observed after 24 h exposure to 10 nM and 100 nM of DDT
(Shi et al., 2010a). The effects of DDE and DDD on ROS generation in hepatocytes have not
been reported previously. However, they have been shown to induce ROS generation in
peripheral blood mononuclear cells (Perez-Maldonado et al., 2004) and primary rat Sertoli
cells (Song et al., 2008).
In the present study neither fluorometric, nor flow cytometric methods detected any
significant ROS generation caused by DDT, DDE or DDD exposure (5 - 150 µM), which may
be considered contradictory to reported literature. However, flow cytometry did reveal a
small increase in ROS generation at the lowest tested concentration of DDT and DDD (5
µM), which could suggest that concentrations of DDT and DDD lower than 5 µM may induce
more ROS generation (Figure 5.3A). To test this hypothesis, a very wide concentration range
74
(0.01 - 100 µM) of all three test compounds were tested in three independent kinetic-type
fluorometry experiments, each spanning 14 h of exposure, in an attempt to reproduce the
reported ROS generation. The chosen concentration range included concentrations of 10
and 100 nM, which has previously been reported to induce ROS generation in cultured
hepatocytes (Shi et al., 2010a). Together with flow cytometry results, these experiments
using the extended concentration range supported the initial endpoint fluorometry results
in that no ROS generation was detected in cells exposed to any of the test compounds
(Figure 5.3).
Contradictory to their first article (Filipak Neto et al., 2008), a second publication reported
that 50 nM of DDT caused a significant decrease in intracellular ROS in primary hepatocytes
(Bussolaro et al., 2010). Although the same methodology was applied, hepatocytes
originating from a different fish species were employed, which could indicate a species-
specific response to DDT in terms of intracellular ROS generation. This may explain why ROS
generation was not seen with HepG2 cells in the present study whereas ROS generation was
seen in L-02 cells (Shi et al., 2010a). Although both cell lines are of human origin, the one is
cancerous (HepG2) and the other not (L-02) (Guo et al., 2007) so they are likely to present
with different genotypic and phenotypic features and could therefore respond differently.
Another explanation for the apparent discrepancy could be the duration of exposure. In the
studies conducted by Filipak Neto et al. (2008) and Shi et al. (2010a), the authors exposed
hepatocytes to DDT for periods of 4 days and 24 h, respectively. Morel et al. (1999), who
specifically studied CYP1A1-generated ROS in HepG2 cells, exposed cultures for 30 h to
benzo(a)pyrene, a well-known CYP1A1 inducer, in order to detect ROS generation. In the
present study cells were only exposed for 3 h, which failed to yield any elevated intracellular
ROS. For this reason, the kinetics experiments were conducted over a 14 h period, but still
no ROS was detected. This may indicate that the DDT-induced ROS generation seen in
previous studies had its origin from the MMO system rather than mitochondria. It was
shown in this study that DDT induces CYP1A1 activity, which forms part of the MMO system
of enzymes. Considerable time is required for CYP1A1 up-regulation to manifest
intracellularly as the relevant receptors need to be activated and translocated to the
nucleus, after which transcription needs to occur, followed by translation and finally protein
75
synthesis. If DDT-induced ROS generation is the result of high MMO activity, all of the afore-
mentioned processes need to take place before any detectable increase in ROS will present
itself. If DDT-induced ROS generation was due to mitochondrial uncoupling, this would
manifest much faster and would probably be detectable within 14 h of exposure as was
seen with AAPH-induced ROS, which reached a maximum plateau after approximately 6 h of
exposure.
CYP1A1 and intracellular ROS are also related to each other in terms of a negative-feedback
autoregulatory loop, in which CYP1A1, that generates ROS during its catalytic cycle, is
regulated by cytosolic ROS levels, specifically H2O2 (Morel and Barouki, 1998; Morel et al.,
1999; Barouki and Morel, 2001). ROS regulation of CYP1A1 expression occurs at a
transcriptional level. The aryl hydrocarbon receptor (AhR), AhR nuclear translocator (Arnt)
and Nuclear Factor I (NFI) are all required for activation and transcription of the cyp1a1
gene and studies have shown that synergy between AhR-Arnt complex and NFI as well as
NFI integrity is diminished in the presence of H2O2 (Morel et al., 1999). The fact that CYP1A1
up-regulation was observed only after 24 h exposure to the test compounds (Chapter 4)
provides further support for the fact that DDT does not induce ROS through a rapidly
activated pathway, as observed in the present study.
NAC pre-treatment for 1 h had no significant influence on the test compound changes in
intracellular ROS (Table 5.4 and Figure 5.4), which is not unexpected as initial results
indicated that none of the test compounds induced ROS in the first place. This provides
further support in concluding that none of the tested compounds induce ROS generation in
HepG2 cells following a short 3 h exposure.
Using fluorometric detection, no elevated intracellular ROS levels were observed for any of
the test compounds at any of the tested concentrations after 3 h exposure. This was
confirmed by flow cytometry. After extending both the exposure period to 14 h and
widening the concentration range from 0.01 – 100 μM, still no elevations in ROS levels were
observed. These findings suggest that the test compounds do not induce ROS generation in
these cells by a rapidly inducible reaction pathway.
Related Documents