5 | Elasticity Figure 5.1 Netflix On-Demand Media Netflix, Inc. is an American provider of on-demand Internet streaming media to many countries around the world, including the United States, and of flat rate DVD-by-mail in the United States. (Credit: modification of work by Traci Lawson/Flickr Creative Commons) That Will Be How Much? Imagine going to your favorite coffee shop and having the waiter inform you the pricing has changed. Instead of $3 for a cup of coffee, you will now be charged $2 for coffee, $1 for creamer, and $1 for your choice of sweetener. If you pay your usual $3 for a cup of coffee, you must choose between creamer and sweetener. If you want both, you now face an extra charge of $1. Sound absurd? Well, that is the situation Netflix customers found themselves in—a 60% price hike to retain the same service. In early 2011, Netflix consumers paid about $10 a month for a package consisting of streaming video and DVD rentals. In July 2011, the company announced a packaging change. Customers wishing to retain both streaming video and DVD rental would be charged $15.98 per month, a price increase of about 60%. How would customers of the 14-year-old firm react? Would they abandon Netflix? Would the ease of access to other venues make a difference in how consumers responded to the Netflix price change? The answers to those questions will be explored in this chapter: the change in quantity with respect to a change in price, a concept economists call elasticity. Introduction to Elasticity In this chapter, you will learn about: • Price Elasticity of Demand and Price Elasticity of Supply CHAPTER 5 | ELASTICITY 99

Welcome message from author
This document is posted to help you gain knowledge. Please leave a comment to let me know what you think about it! Share it to your friends and learn new things together.
Transcript
5 | Elasticity
Figure 5.1 Netflix On-Demand Media Netflix, Inc. is an American provider of on-demand Internet streaming mediato many countries around the world, including the United States, and of flat rate DVD-by-mail in the United States.(Credit: modification of work by Traci Lawson/Flickr Creative Commons)
That Will Be How Much?Imagine going to your favorite coffee shop and having the waiter inform you the pricing has changed.Instead of $3 for a cup of coffee, you will now be charged $2 for coffee, $1 for creamer, and $1 for yourchoice of sweetener. If you pay your usual $3 for a cup of coffee, you must choose between creamerand sweetener. If you want both, you now face an extra charge of $1. Sound absurd? Well, that is thesituation Netflix customers found themselves in—a 60% price hike to retain the same service.
In early 2011, Netflix consumers paid about $10 a month for a package consisting of streaming videoand DVD rentals. In July 2011, the company announced a packaging change. Customers wishing toretain both streaming video and DVD rental would be charged $15.98 per month, a price increase ofabout 60%.
How would customers of the 14-year-old firm react? Would they abandon Netflix? Would the ease ofaccess to other venues make a difference in how consumers responded to the Netflix price change?The answers to those questions will be explored in this chapter: the change in quantity with respect to achange in price, a concept economists call elasticity.
Introduction to ElasticityIn this chapter, you will learn about:
• Price Elasticity of Demand and Price Elasticity of Supply
CHAPTER 5 | ELASTICITY 99
• Polar Cases of Elasticity and Constant Elasticity
• Elasticity and Pricing
• Elasticity in Areas Other Than Price
Anyone who has studied economics knows the law of demand: a higher price will lead to a lower quantity demanded. Whatyou may not know is how much lower the quantity demanded will be. Similarly, the law of supply shows that a higher pricewill lead to a higher quantity supplied. The question is: How much higher? This chapter will explain how to answer thesequestions and why they are critically important in the real world.
To find answers to these questions, we need to understand the concept of elasticity. Elasticity is an economics concept thatmeasures responsiveness of one variable to changes in another variable. Suppose you drop two items from a second-floorbalcony. The first item is a tennis ball. The second item is a brick. Which will bounce higher? Obviously, the tennis ball.We would say that the tennis ball has greater elasticity.
Consider an economic example. Cigarette taxes are an example of a “sin tax,” a tax on something that is bad for you, likealcohol. Cigarettes are taxed at the state and national levels. State taxes range from a low of 17 cents per pack in Missourito $4.35 per pack in New York. The average state cigarette tax is $1.51 per pack. The current federal tax rate on cigarettesis $1.01 per pack, but in April 2013 the Obama Administration proposed raising the federal tax nearly a dollar to $1.95 perpack. The key question is: How much would cigarette purchases decline?
Taxes on cigarettes serve two purposes: to raise tax revenue for government and to discourage consumption of cigarettes.However, if a higher cigarette tax discourages consumption by quite a lot, meaning a greatly reduced quantity of cigarettesis sold, then the cigarette tax on each pack will not raise much revenue for the government. Alternatively, a higher cigarettetax that does not discourage consumption by much will actually raise more tax revenue for the government. Thus, when agovernment agency tries to calculate the effects of altering its cigarette tax, it must analyze how much the tax affects thequantity of cigarettes consumed. This issue reaches beyond governments and taxes; every firm faces a similar issue. Everytime a firm considers raising the price that it charges, it must consider how much a price increase will reduce the quantitydemanded of what it sells. Conversely, when a firm puts its products on sale, it must expect (or hope) that the lower pricewill lead to a significantly higher quantity demanded.
5.1 | Price Elasticity of Demand and Price Elasticity ofSupplyBy the end of this section, you will be able to:
• Calculate the price elasticity of demand• Calculate the price elasticity of supply
Both the demand and supply curve show the relationship between price and the number of units demanded or supplied.Price elasticity is the ratio between the percentage change in the quantity demanded (Qd) or supplied (Qs) and thecorresponding percent change in price. The price elasticity of demand is the percentage change in the quantity demandedof a good or service divided by the percentage change in the price. The price elasticity of supply is the percentage changein quantity supplied divided by the percentage change in price.
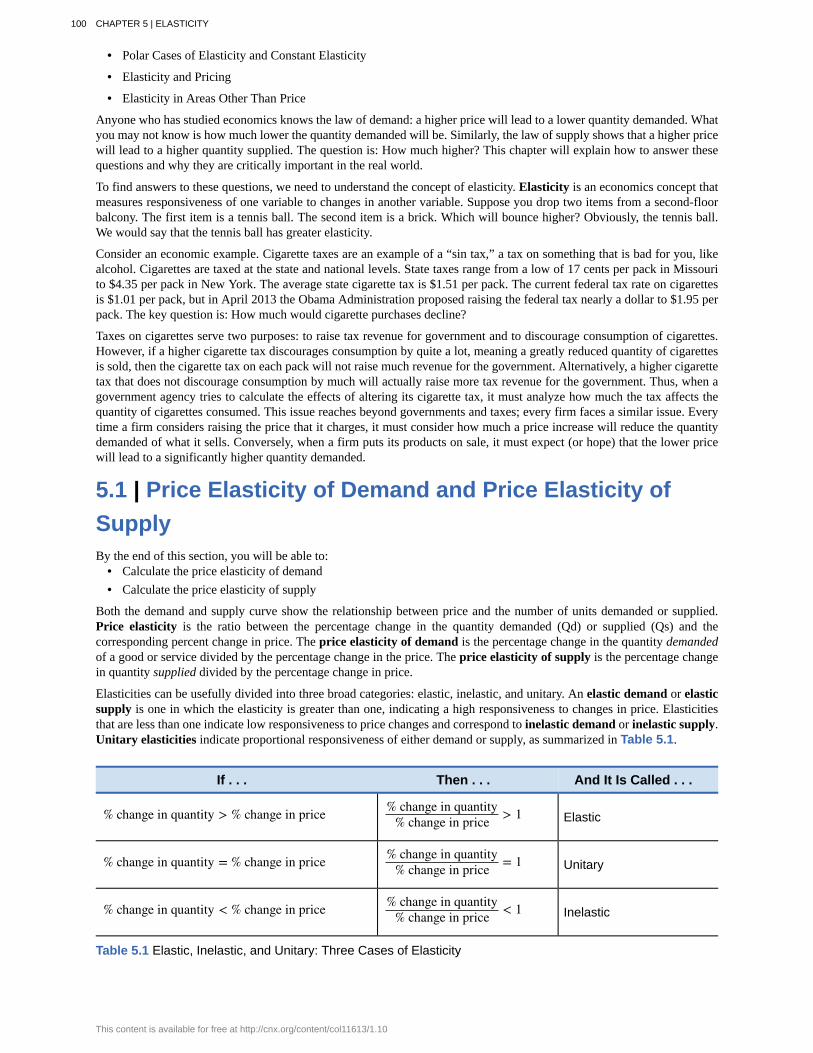
Elasticities can be usefully divided into three broad categories: elastic, inelastic, and unitary. An elastic demand or elasticsupply is one in which the elasticity is greater than one, indicating a high responsiveness to changes in price. Elasticitiesthat are less than one indicate low responsiveness to price changes and correspond to inelastic demand or inelastic supply.Unitary elasticities indicate proportional responsiveness of either demand or supply, as summarized in Table 5.1.
If . . . Then . . . And It Is Called . . .
% change in quantity > % change in price % change in quantity% change in price > 1 Elastic
% change in quantity = % change in price % change in quantity% change in price = 1 Unitary
% change in quantity < % change in price % change in quantity% change in price < 1 Inelastic
Table 5.1 Elastic, Inelastic, and Unitary: Three Cases of Elasticity
100 CHAPTER 5 | ELASTICITY
This content is available for free at http://cnx.org/content/col11613/1.10

Before we get into the nitty gritty of elasticity, enjoy this article (http://openstaxcollege.org/l/Super_Bowl)on elasticity and ticket prices at the Super Bowl.
To calculate elasticity, instead of using simple percentage changes in quantity and price, economists use the average percentchange in both quantity and price. This is called the Midpoint Method for Elasticity, and is represented in the followingequations:
% change in quantity = Q2 – Q1⎛⎝Q2 + Q1
⎞⎠ ÷ 2
× 100
% change in price = P2 – P1⎛⎝P2 + P1
⎞⎠ ÷ 2
× 100
The advantage of the is Midpoint Method is that one obtains the same elasticity between two price points whether there is aprice increase or decrease. This is because the formula uses the same base for both cases.
Calculating Price Elasticity of DemandLet’s calculate the elasticity between points A and B and between points G and H shown in Figure 5.2.
Figure 5.2 Calculating the Price Elasticity of Demand The price elasticity of demand is calculated as thepercentage change in quantity divided by the percentage change in price.
First, apply the formula to calculate the elasticity as price decreases from $70 at point B to $60 at point A:
CHAPTER 5 | ELASTICITY 101
% change in quantity = 3,000 – 2,800(3,000 + 2,800) ÷ 2 × 100
= 2002,900 × 100
= 6.9% change in price = 60 – 70
(60 + 70) ÷ 2 × 100
= –1065 × 100
= –15.4Price Elasticity of Demand = 6.9%
–15.4%= 0.45
Therefore, the elasticity of demand between these two points is 6.9%–15.4% which is 0.45, an amount smaller than one,
showing that the demand is inelastic in this interval. Price elasticities of demand are always negative since price and quantitydemanded always move in opposite directions (on the demand curve). By convention, we always talk about elasticities aspositive numbers. So mathematically, we take the absolute value of the result. We will ignore this detail from now on, whileremembering to interpret elasticities as positive numbers.
This means that, along the demand curve between point B and A, if the price changes by 1%, the quantity demanded willchange by 0.45%. A change in the price will result in a smaller percentage change in the quantity demanded. For example,a 10% increase in the price will result in only a 4.5% decrease in quantity demanded. A 10% decrease in the price willresult in only a 4.5% increase in the quantity demanded. Price elasticities of demand are negative numbers indicating thatthe demand curve is downward sloping, but are read as absolute values. The following Work It Out feature will walk youthrough calculating the price elasticity of demand.
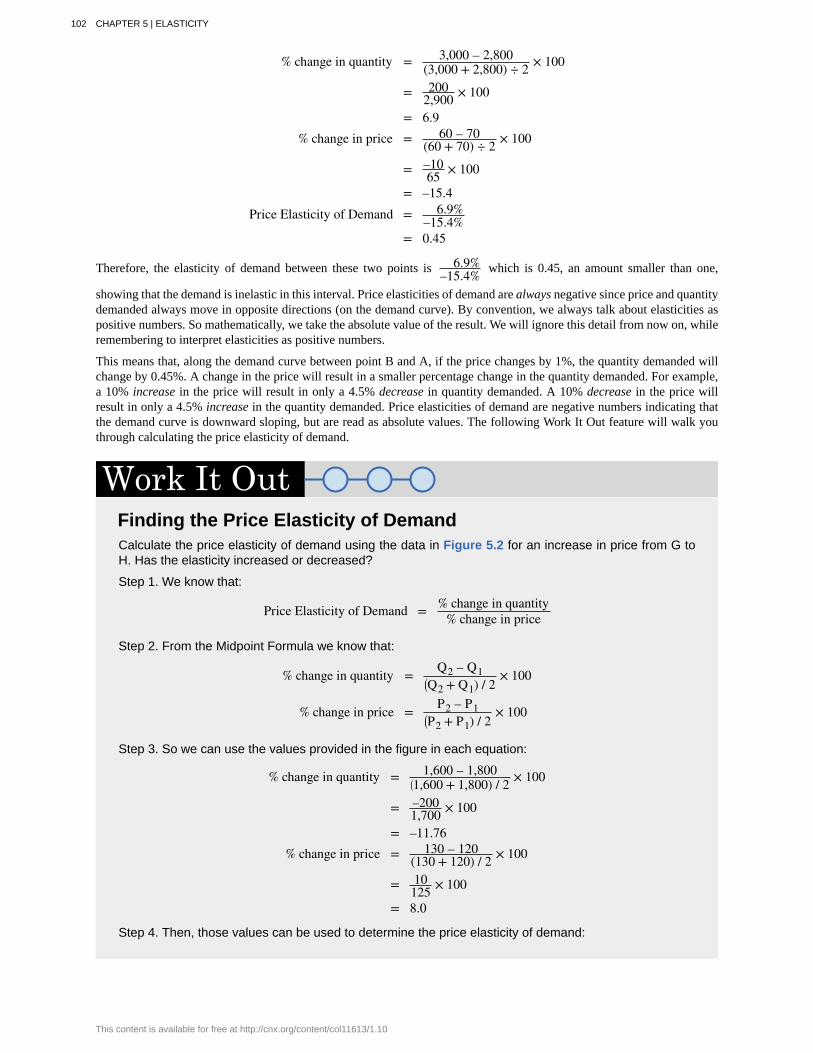
Finding the Price Elasticity of DemandCalculate the price elasticity of demand using the data in Figure 5.2 for an increase in price from G toH. Has the elasticity increased or decreased?
Step 1. We know that:
Price Elasticity of Demand = % change in quantity% change in price
Step 2. From the Midpoint Formula we know that:
% change in quantity = Q2 – Q1⎛⎝Q2 + Q1) / 2
× 100
% change in price = P2 – P1⎛⎝P2 + P1) / 2
× 100
Step 3. So we can use the values provided in the figure in each equation:
% change in quantity = 1,600 – 1,800⎛⎝1,600 + 1,800) / 2 × 100
= –2001,700 × 100
= –11.76% change in price = 130 – 120
(130 + 120) / 2 × 100
= 10125 × 100
= 8.0
Step 4. Then, those values can be used to determine the price elasticity of demand:
102 CHAPTER 5 | ELASTICITY
This content is available for free at http://cnx.org/content/col11613/1.10

Price Elasticity of Demand = % change in quantity% change in price
= –11.768
= 1.47
Therefore, the elasticity of demand from G to H 1.47. The magnitude of the elasticity has increased (inabsolute value) as we moved up along the demand curve from points A to B. Recall that the elasticitybetween these two points was 0.45. Demand was inelastic between points A and B and elastic betweenpoints G and H. This shows us that price elasticity of demand changes at different points along astraight-line demand curve.
Calculating the Price Elasticity of SupplyAssume that an apartment rents for $650 per month and at that price 10,000 units are rented as shown in Figure 5.3. Whenthe price increases to $700 per month, 13,000 units are supplied into the market. By what percentage does apartment supplyincrease? What is the price sensitivity?
Figure 5.3 Price Elasticity of Supply The price elasticity of supply is calculated as the percentage change inquantity divided by the percentage change in price.
Using the Midpoint Method,
% change in quantity = 13,000 – 10,000(13,000 + 10,000) / 2 × 100
= 3,00011,500 × 100
= 26.1
% change in price = $750 – $600($750 + $600) / 2 × 100
= 50675 × 100
= 7.4Price Elasticity of Supply = 26.1%
7.4%= 3.53
Again, as with the elasticity of demand, the elasticity of supply is not followed by any units. Elasticity is a ratio of onepercentage change to another percentage change—nothing more—and is read as an absolute value. In this case, a 1% risein price causes an increase in quantity supplied of 3.5%. The greater than one elasticity of supply means that the percentagechange in quantity supplied will be greater than a one percent price change. If you're starting to wonder if the concept ofslope fits into this calculation, read the following Clear It Up box.
CHAPTER 5 | ELASTICITY 103

Is the elasticity the slope?It is a common mistake to confuse the slope of either the supply or demand curve with its elasticity. Theslope is the rate of change in units along the curve, or the rise/run (change in y over the change in x).For example, in Figure 5.2, each point shown on the demand curve, price drops by $10 and the numberof units demanded increases by 200. So the slope is –10/200 along the entire demand curve and doesnot change. The price elasticity, however, changes along the curve. Elasticity between points A and Bwas 0.45 and increased to 1.47 between points G and H. Elasticity is the percentage change, which is adifferent calculation from the slope and has a different meaning.
When we are at the upper end of a demand curve, where price is high and the quantity demanded islow, a small change in the quantity demanded, even in, say, one unit, is pretty big in percentage terms.A change in price of, say, a dollar, is going to be much less important in percentage terms than it wouldhave been at the bottom of the demand curve. Likewise, at the bottom of the demand curve, that oneunit change when the quantity demanded is high will be small as a percentage.
So, at one end of the demand curve, where we have a large percentage change in quantity demandedover a small percentage change in price, the elasticity value would be high, or demand would berelatively elastic. Even with the same change in the price and the same change in the quantitydemanded, at the other end of the demand curve the quantity is much higher, and the price is muchlower, so the percentage change in quantity demanded is smaller and the percentage change in priceis much higher. That means at the bottom of the curve we'd have a small numerator over a largedenominator, so the elasticity measure would be much lower, or inelastic.
As we move along the demand curve, the values for quantity and price go up or down, depending onwhich way we are moving, so the percentages for, say, a $1 difference in price or a one unit differencein quantity, will change as well, which means the ratios of those percentages will change.
5.2 | Polar Cases of Elasticity and Constant ElasticityBy the end of this section, you will be able to:
• Differentiate between infinite and zero elasticity• Analyze graphs in order to classify elasticity as constant unitary, infinite, or zero
There are two extreme cases of elasticity: when elasticity equals zero and when it is infinite. A third case is that of constantunitary elasticity. We will describe each case. Infinite elasticity or perfect elasticity refers to the extreme case where eitherthe quantity demanded (Qd) or supplied (Qs) changes by an infinite amount in response to any change in price at all. Inboth cases, the supply and the demand curve are horizontal as shown in Figure 5.4. While perfectly elastic supply curvesare unrealistic, goods with readily available inputs and whose production can be easily expanded will feature highly elasticsupply curves. Examples include pizza, bread, books and pencils. Similarly, perfectly elastic demand is an extreme example.But luxury goods, goods that take a large share of individuals’ income, and goods with many substitutes are likely to havehighly elastic demand curves. Examples of such goods are Caribbean cruises and sports vehicles.
104 CHAPTER 5 | ELASTICITY
This content is available for free at http://cnx.org/content/col11613/1.10
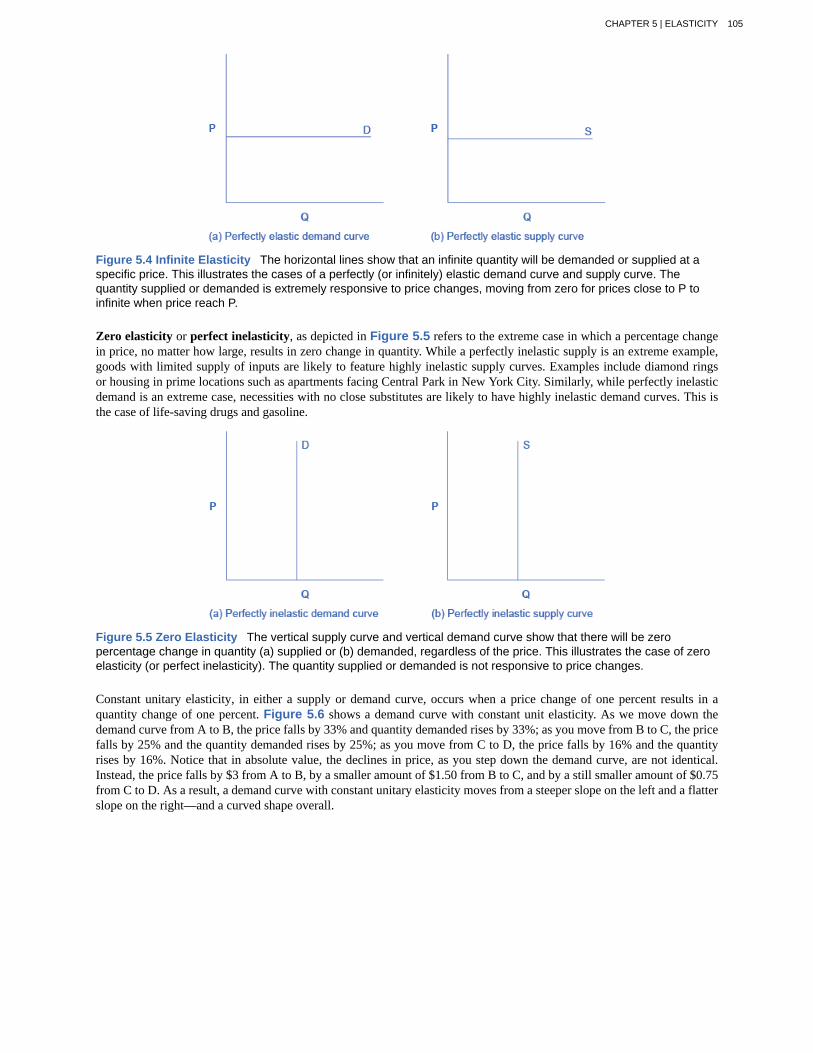
Figure 5.4 Infinite Elasticity The horizontal lines show that an infinite quantity will be demanded or supplied at aspecific price. This illustrates the cases of a perfectly (or infinitely) elastic demand curve and supply curve. Thequantity supplied or demanded is extremely responsive to price changes, moving from zero for prices close to P toinfinite when price reach P.
Zero elasticity or perfect inelasticity, as depicted in Figure 5.5 refers to the extreme case in which a percentage changein price, no matter how large, results in zero change in quantity. While a perfectly inelastic supply is an extreme example,goods with limited supply of inputs are likely to feature highly inelastic supply curves. Examples include diamond ringsor housing in prime locations such as apartments facing Central Park in New York City. Similarly, while perfectly inelasticdemand is an extreme case, necessities with no close substitutes are likely to have highly inelastic demand curves. This isthe case of life-saving drugs and gasoline.
Figure 5.5 Zero Elasticity The vertical supply curve and vertical demand curve show that there will be zeropercentage change in quantity (a) supplied or (b) demanded, regardless of the price. This illustrates the case of zeroelasticity (or perfect inelasticity). The quantity supplied or demanded is not responsive to price changes.
Constant unitary elasticity, in either a supply or demand curve, occurs when a price change of one percent results in aquantity change of one percent. Figure 5.6 shows a demand curve with constant unit elasticity. As we move down thedemand curve from A to B, the price falls by 33% and quantity demanded rises by 33%; as you move from B to C, the pricefalls by 25% and the quantity demanded rises by 25%; as you move from C to D, the price falls by 16% and the quantityrises by 16%. Notice that in absolute value, the declines in price, as you step down the demand curve, are not identical.Instead, the price falls by $3 from A to B, by a smaller amount of $1.50 from B to C, and by a still smaller amount of $0.75from C to D. As a result, a demand curve with constant unitary elasticity moves from a steeper slope on the left and a flatterslope on the right—and a curved shape overall.
CHAPTER 5 | ELASTICITY 105

Figure 5.6 A Constant Unitary Elasticity Demand Curve A demand curve with constant unitary elasticity will be acurved line. Notice how price and quantity demanded change by an identical amount in each step down the demandcurve.
Unlike the demand curve with unitary elasticity, the supply curve with unitary elasticity is represented by a straight line.In moving up the supply curve from left to right, each increase in quantity of 30, from 90 to 120 to 150 to 180, is equal inabsolute value. However, in percentage value, the steps are decreasing, from 33.3% to 25% to 16.7%, because the originalquantity points in each percentage calculation are getting larger and larger, which expands the denominator in the elasticitycalculation.
Consider the price changes moving up the supply curve in Figure 5.7. From points D to E to F and to G on thesupply curve, each step of $1.50 is the same in absolute value. However, if the price changes are measured in percentagechange terms, they are also decreasing, from 33.3% to 25% to 16.7%, because the original price points in each percentagecalculation are getting larger and larger in value. Along the constant unitary elasticity supply curve, the percentage quantityincreases on the horizontal axis exactly match the percentage price increases on the vertical axis—so this supply curve hasa constant unitary elasticity at all points.
Figure 5.7 A Constant Unitary Elasticity Supply Curve A constant unitary elasticity supply curve is a straight linereaching up from the origin. Between each point, the percentage increase in quantity demanded is the same as thepercentage increase in price.
5.3 | Elasticity and PricingBy the end of this section, you will be able to:
• Analyze how price elasticities impact revenue• Evaluate how elasticity can cause shifts in demand and supply• Predict how the long-run and short-run impacts of elasticity affect equilibrium• Explain how the elasticity of demand and supply determine the incidence of a tax on buyers and sellers
106 CHAPTER 5 | ELASTICITY
This content is available for free at http://cnx.org/content/col11613/1.10
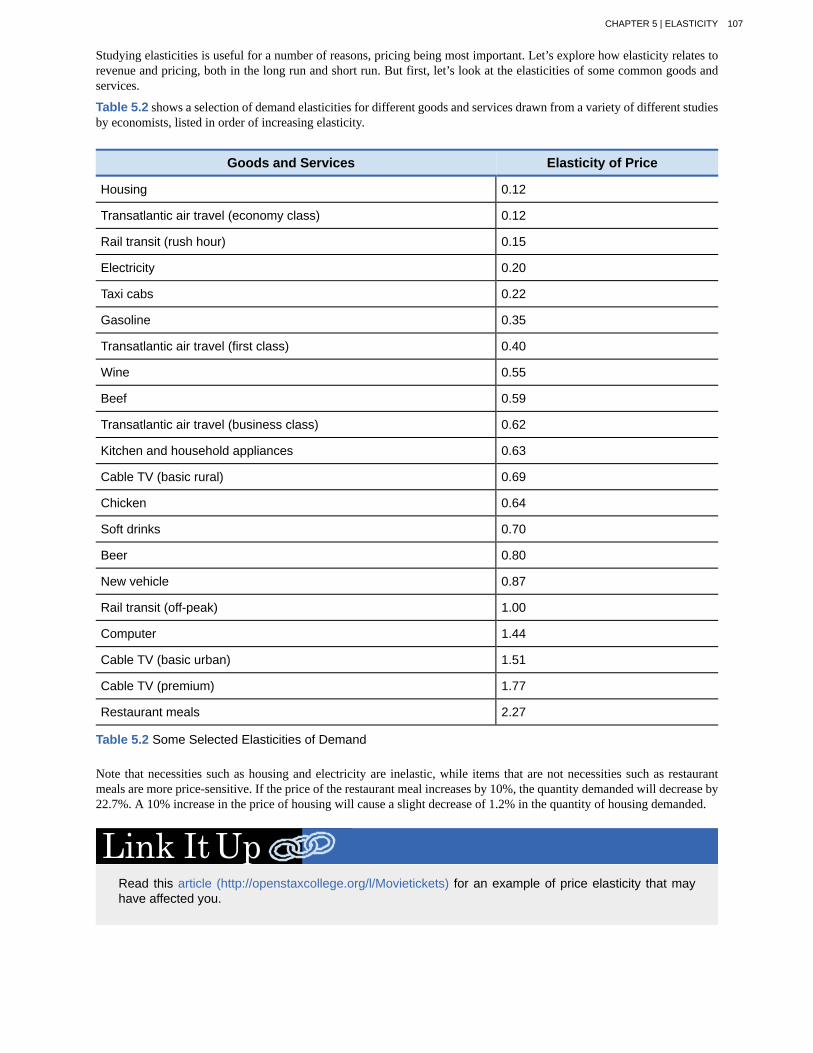
Studying elasticities is useful for a number of reasons, pricing being most important. Let’s explore how elasticity relates torevenue and pricing, both in the long run and short run. But first, let’s look at the elasticities of some common goods andservices.
Table 5.2 shows a selection of demand elasticities for different goods and services drawn from a variety of different studiesby economists, listed in order of increasing elasticity.
Goods and Services Elasticity of Price
Housing 0.12
Transatlantic air travel (economy class) 0.12
Rail transit (rush hour) 0.15
Electricity 0.20
Taxi cabs 0.22
Gasoline 0.35
Transatlantic air travel (first class) 0.40
Wine 0.55
Beef 0.59
Transatlantic air travel (business class) 0.62
Kitchen and household appliances 0.63
Cable TV (basic rural) 0.69
Chicken 0.64
Soft drinks 0.70
Beer 0.80
New vehicle 0.87
Rail transit (off-peak) 1.00
Computer 1.44
Cable TV (basic urban) 1.51
Cable TV (premium) 1.77
Restaurant meals 2.27
Table 5.2 Some Selected Elasticities of Demand
Note that necessities such as housing and electricity are inelastic, while items that are not necessities such as restaurantmeals are more price-sensitive. If the price of the restaurant meal increases by 10%, the quantity demanded will decrease by22.7%. A 10% increase in the price of housing will cause a slight decrease of 1.2% in the quantity of housing demanded.
Read this article (http://openstaxcollege.org/l/Movietickets) for an example of price elasticity that mayhave affected you.
CHAPTER 5 | ELASTICITY 107
Does Raising Price Bring in More Revenue?Imagine that a band on tour is playing in an indoor arena with 15,000 seats. To keep this example simple, assume that theband keeps all the money from ticket sales. Assume further that the band pays the costs for its appearance, but that thesecosts, like travel, setting up the stage, and so on, are the same regardless of how many people are in the audience. Finally,assume that all the tickets have the same price. (The same insights apply if ticket prices are more expensive for some seatsthan for others, but the calculations become more complicated.) The band knows that it faces a downward-sloping demandcurve; that is, if the band raises the price of tickets, it will sell fewer tickets. How should the band set the price for ticketsto bring in the most total revenue, which in this example, because costs are fixed, will also mean the highest profits for theband? Should the band sell more tickets at a lower price or fewer tickets at a higher price?
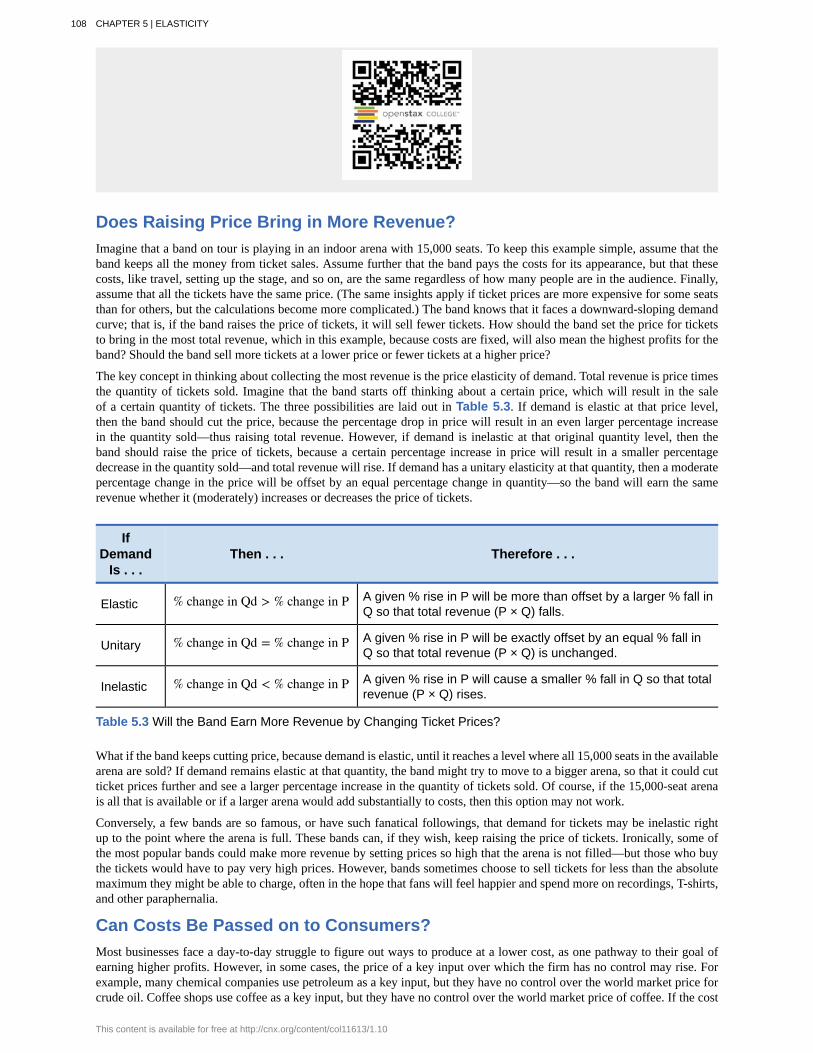
The key concept in thinking about collecting the most revenue is the price elasticity of demand. Total revenue is price timesthe quantity of tickets sold. Imagine that the band starts off thinking about a certain price, which will result in the saleof a certain quantity of tickets. The three possibilities are laid out in Table 5.3. If demand is elastic at that price level,then the band should cut the price, because the percentage drop in price will result in an even larger percentage increasein the quantity sold—thus raising total revenue. However, if demand is inelastic at that original quantity level, then theband should raise the price of tickets, because a certain percentage increase in price will result in a smaller percentagedecrease in the quantity sold—and total revenue will rise. If demand has a unitary elasticity at that quantity, then a moderatepercentage change in the price will be offset by an equal percentage change in quantity—so the band will earn the samerevenue whether it (moderately) increases or decreases the price of tickets.
IfDemand
Is . . .Then . . . Therefore . . .
Elastic % change in Qd > % change in P A given % rise in P will be more than offset by a larger % fall inQ so that total revenue (P × Q) falls.
Unitary % change in Qd = % change in P A given % rise in P will be exactly offset by an equal % fall inQ so that total revenue (P × Q) is unchanged.
Inelastic % change in Qd < % change in P A given % rise in P will cause a smaller % fall in Q so that totalrevenue (P × Q) rises.
Table 5.3 Will the Band Earn More Revenue by Changing Ticket Prices?
What if the band keeps cutting price, because demand is elastic, until it reaches a level where all 15,000 seats in the availablearena are sold? If demand remains elastic at that quantity, the band might try to move to a bigger arena, so that it could cutticket prices further and see a larger percentage increase in the quantity of tickets sold. Of course, if the 15,000-seat arenais all that is available or if a larger arena would add substantially to costs, then this option may not work.
Conversely, a few bands are so famous, or have such fanatical followings, that demand for tickets may be inelastic rightup to the point where the arena is full. These bands can, if they wish, keep raising the price of tickets. Ironically, some ofthe most popular bands could make more revenue by setting prices so high that the arena is not filled—but those who buythe tickets would have to pay very high prices. However, bands sometimes choose to sell tickets for less than the absolutemaximum they might be able to charge, often in the hope that fans will feel happier and spend more on recordings, T-shirts,and other paraphernalia.
Can Costs Be Passed on to Consumers?Most businesses face a day-to-day struggle to figure out ways to produce at a lower cost, as one pathway to their goal ofearning higher profits. However, in some cases, the price of a key input over which the firm has no control may rise. Forexample, many chemical companies use petroleum as a key input, but they have no control over the world market price forcrude oil. Coffee shops use coffee as a key input, but they have no control over the world market price of coffee. If the cost
108 CHAPTER 5 | ELASTICITY
This content is available for free at http://cnx.org/content/col11613/1.10

of a key input rises, can the firm pass those higher costs along to consumers in the form of higher prices? Conversely, ifnew and less expensive ways of producing are invented, can the firm keep the benefits in the form of higher profits, or willthe market pressure them to pass the gains along to consumers in the form of lower prices? The price elasticity of demandplays a key role in answering these questions.
Imagine that as a consumer of legal pharmaceutical products, you read a newspaper story that a technological breakthroughin the production of aspirin has occurred, so that every aspirin factory can now make aspirin more cheaply than it did before.What does this discovery mean to you? Figure 5.8 illustrates two possibilities. In Figure 5.8 (a), the demand curve isdrawn as highly inelastic. In this case, a technological breakthrough that shifts supply to the right, from S0 to S1, so thatthe equilibrium shifts from E0 to E1, creates a substantially lower price for the product with relatively little impact on thequantity sold. In Figure 5.8 (b), the demand curve is drawn as highly elastic. In this case, the technological breakthroughleads to a much greater quantity being sold in the market at very close to the original price. Consumers benefit more, ingeneral, when the demand curve is more inelastic because the shift in the supply results in a much lower price for consumers.
Figure 5.8 Passing along Cost Savings to Consumers Cost-saving gains cause supply to shift out to the rightfrom S0 to S1; that is, at any given price, firms will be willing to supply a greater quantity. If demand is inelastic, as in(a), the result of this cost-saving technological improvement will be substantially lower prices. If demand is elastic, asin (b), the result will be only slightly lower prices. Consumers benefit in either case, from a greater quantity at a lowerprice, but the benefit is greater when demand is inelastic, as in (a).
Producers of aspirin may find themselves in a nasty bind here. The situation shown in Figure 5.8, with extremely inelasticdemand, means that a new invention may cause the price to drop dramatically while quantity changes little. As a result,the new production technology can lead to a drop in the revenue that firms earn from sales of aspirin. However, if strongcompetition exists between producers of aspirin, each producer may have little choice but to search for and implement anybreakthrough that allows it to reduce production costs. After all, if one firm decides not to implement such a cost-savingtechnology, it can be driven out of business by other firms that do.
Since demand for food is generally inelastic, farmers may often face the situation in Figure 5.8 (a). That is, a surge inproduction leads to a severe drop in price that can actually decrease the total revenue received by farmers. Conversely, poorweather or other conditions that cause a terrible year for farm production can sharply raise prices so that the total revenuereceived increases. The Clear It Up box discusses how these issues relate to coffee.
How do coffee prices fluctuate?Coffee is an international crop. The top five coffee-exporting nations are Brazil, Vietnam, Colombia,Indonesia, and Guatemala. In these nations and others, 20 million families depend on selling coffeebeans as their main source of income. These families are exposed to enormous risk, because the worldprice of coffee bounces up and down. For example, in 1993, the world price of coffee was about 50 centsper pound; in 1995 it was four times as high, at $2 per pound. By 1997 it had fallen by half to $1.00 perpound. In 1998 it leaped back up to $2 per pound. By 2001 it had fallen back to 46 cents a pound; by
CHAPTER 5 | ELASTICITY 109
early 2011 it went back up to about $2.31 per pound. By the end of 2012, the price had fallen back toabout $1.31 per pound.
The reason for these price bounces lies in a combination of inelastic demand and shifts in supply. Theelasticity of coffee demand is only about 0.3; that is, a 10% rise in the price of coffee leads to a declineof about 3% in the quantity of coffee consumed. When a major frost hit the Brazilian coffee crop in1994, coffee supply shifted to the left with an inelastic demand curve, leading to much higher prices.Conversely, when Vietnam entered the world coffee market as a major producer in the late 1990s, thesupply curve shifted out to the right. With a highly inelastic demand curve, coffee prices fell dramatically.This situation is shown in Figure 5.8 (a).
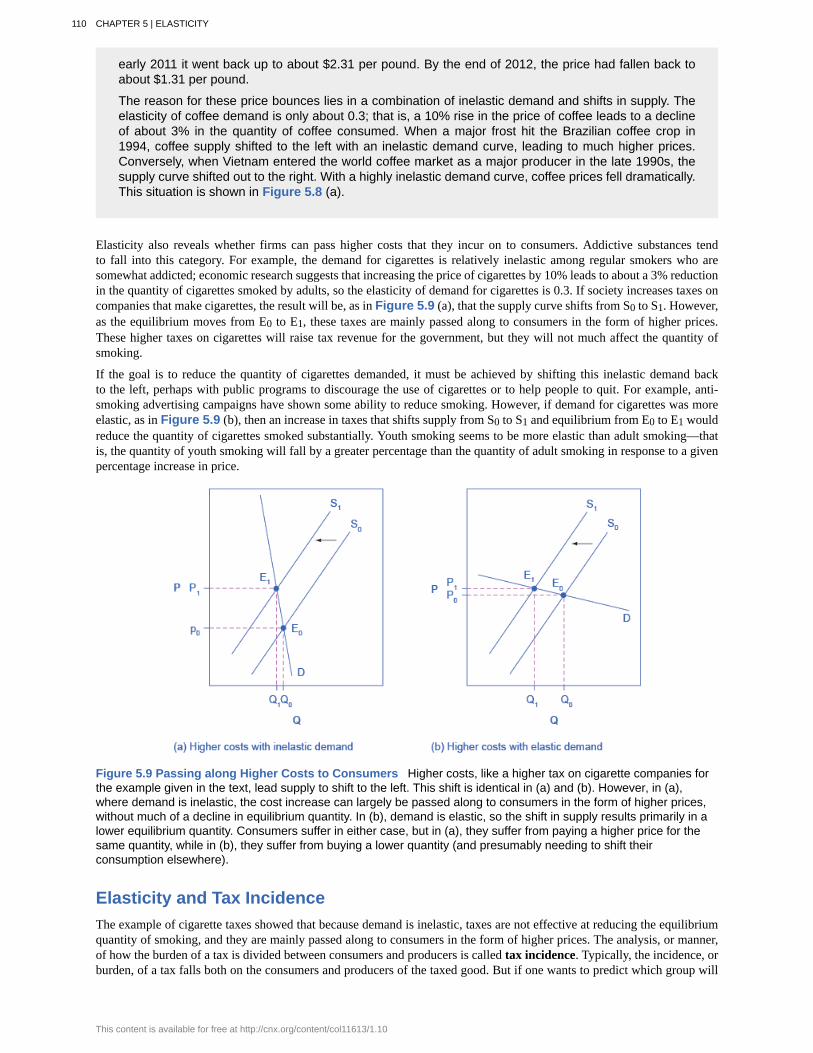
Elasticity also reveals whether firms can pass higher costs that they incur on to consumers. Addictive substances tendto fall into this category. For example, the demand for cigarettes is relatively inelastic among regular smokers who aresomewhat addicted; economic research suggests that increasing the price of cigarettes by 10% leads to about a 3% reductionin the quantity of cigarettes smoked by adults, so the elasticity of demand for cigarettes is 0.3. If society increases taxes oncompanies that make cigarettes, the result will be, as in Figure 5.9 (a), that the supply curve shifts from S0 to S1. However,as the equilibrium moves from E0 to E1, these taxes are mainly passed along to consumers in the form of higher prices.These higher taxes on cigarettes will raise tax revenue for the government, but they will not much affect the quantity ofsmoking.
If the goal is to reduce the quantity of cigarettes demanded, it must be achieved by shifting this inelastic demand backto the left, perhaps with public programs to discourage the use of cigarettes or to help people to quit. For example, anti-smoking advertising campaigns have shown some ability to reduce smoking. However, if demand for cigarettes was moreelastic, as in Figure 5.9 (b), then an increase in taxes that shifts supply from S0 to S1 and equilibrium from E0 to E1 wouldreduce the quantity of cigarettes smoked substantially. Youth smoking seems to be more elastic than adult smoking—thatis, the quantity of youth smoking will fall by a greater percentage than the quantity of adult smoking in response to a givenpercentage increase in price.
Figure 5.9 Passing along Higher Costs to Consumers Higher costs, like a higher tax on cigarette companies forthe example given in the text, lead supply to shift to the left. This shift is identical in (a) and (b). However, in (a),where demand is inelastic, the cost increase can largely be passed along to consumers in the form of higher prices,without much of a decline in equilibrium quantity. In (b), demand is elastic, so the shift in supply results primarily in alower equilibrium quantity. Consumers suffer in either case, but in (a), they suffer from paying a higher price for thesame quantity, while in (b), they suffer from buying a lower quantity (and presumably needing to shift theirconsumption elsewhere).
Elasticity and Tax IncidenceThe example of cigarette taxes showed that because demand is inelastic, taxes are not effective at reducing the equilibriumquantity of smoking, and they are mainly passed along to consumers in the form of higher prices. The analysis, or manner,of how the burden of a tax is divided between consumers and producers is called tax incidence. Typically, the incidence, orburden, of a tax falls both on the consumers and producers of the taxed good. But if one wants to predict which group will
110 CHAPTER 5 | ELASTICITY
This content is available for free at http://cnx.org/content/col11613/1.10

bear most of the burden, all one needs to do is examine the elasticity of demand and supply. In the tobacco example, the taxburden falls on the most inelastic side of the market.
If demand is more inelastic than supply, consumers bear most of the tax burden, and if supply is more inelastic than demand,sellers bear most of the tax burden.
The intuition for this is simple. When the demand is inelastic, consumers are not very responsive to price changes, and thequantity demanded remains relatively constant when the tax is introduced. In the case of smoking, the demand is inelasticbecause consumers are addicted to the product. The government can then pass the tax burden along to consumers in theform of higher prices, without much of a decline in the equilibrium quantity.
Similarly, when a tax is introduced in a market with an inelastic supply, such as, for example, beachfront hotels, and sellershave no alternative than to accept lower prices for their business, taxes do not greatly affect the equilibrium quantity. Thetax burden is now passed on to the sellers. If the supply was elastic and sellers had the possibility of reorganizing theirbusinesses to avoid supplying the taxed good, the tax burden on the sellers would be much smaller. The tax would resultin a much lower quantity sold instead of lower prices received. Figure 5.10 illustrates this relationship between the taxincidence and elasticity of demand and supply.
Figure 5.10 Elasticity and Tax Incidence An excise tax introduces a wedge between the price paid by consumers(Pc) and the price received by producers (Pp). (a) When the demand is more elastic than supply, the tax incidence onconsumers Pc – Pe is lower than the tax incidence on producers Pe – Pp. (b) When the supply is more elastic thandemand, the tax incidence on consumers Pc – Pe is larger than the tax incidence on producers Pe – Pp. The moreelastic the demand and supply curves are, the lower the tax revenue.
In Figure 5.10 (a), the supply is inelastic and the demand is elastic, such as in the example of beachfront hotels. Whileconsumers may have other vacation choices, sellers can’t easily move their businesses. By introducing a tax, the governmentessentially creates a wedge between the price paid by consumers Pc and the price received by producers Pp. In other words,of the total price paid by consumers, part is retained by the sellers and part is paid to the government in the form of a tax.The distance between Pc and Pp is the tax rate. The new market price is Pc, but sellers receive only Pp per unit sold, as theypay Pc-Pp to the government. Since a tax can be viewed as raising the costs of production, this could also be representedby a leftward shift of the supply curve, where the new supply curve would intercept the demand at the new quantity Qt. Forsimplicity, Figure 5.10 omits the shift in the supply curve.
The tax revenue is given by the shaded area, which is obtained by multiplying the tax per unit by the total quantity sold Qt.The tax incidence on the consumers is given by the difference between the price paid Pc and the initial equilibrium pricePe. The tax incidence on the sellers is given by the difference between the initial equilibrium price Pe and the price theyreceive after the tax is introduced Pp. In Figure 5.10 (a), the tax burden falls disproportionately on the sellers, and a largerproportion of the tax revenue (the shaded area) is due to the resulting lower price received by the sellers than by the resultinghigher prices paid by the buyers. The example of the tobacco excise tax could be described by Figure 5.10 (b) where thesupply is more elastic than demand. The tax incidence now falls disproportionately on consumers, as shown by the largedifference between the price they pay, Pc, and the initial equilibrium price, Pe. Sellers receive a lower price than before thetax, but this difference is much smaller than the change in consumers’ price. From this analysis one can also predict whethera tax is likely to create a large revenue or not. The more elastic the demand curve, the easier it is for consumers to reducequantity instead of paying higher prices. The more elastic the supply curve, the easier it is for sellers to reduce the quantitysold, instead of taking lower prices. In a market where both the demand and supply are very elastic, the imposition of anexcise tax generates low revenue.
Excise taxes tend to be thought to hurt mainly the specific industries they target. For example, the medical device excisetax, in effect since 2013, has been controversial for it can delay industry profitability and therefore hamper start-ups and
CHAPTER 5 | ELASTICITY 111

medical innovation. But ultimately, whether the tax burden falls mostly on the medical device industry or on the patientsdepends simply on the elasticity of demand and supply.
Long-Run vs. Short-Run ImpactElasticities are often lower in the short run than in the long run. On the demand side of the market, it can sometimes bedifficult to change Qd in the short run, but easier in the long run. Consumption of energy is a clear example. In the shortrun, it is not easy for a person to make substantial changes in the energy consumption. Maybe you can carpool to worksometimes or adjust your home thermostat by a few degrees if the cost of energy rises, but that is about all. However, in thelong-run you can purchase a car that gets more miles to the gallon, choose a job that is closer to where you live, buy moreenergy-efficient home appliances, or install more insulation in your home. As a result, the elasticity of demand for energyis somewhat inelastic in the short run, but much more elastic in the long run.
Figure 5.11 is an example, based roughly on historical experience, for the responsiveness of Qd to price changes. In 1973,the price of crude oil was $12 per barrel and total consumption in the U.S. economy was 17 million barrels per day. Thatyear, the nations who were members of the Organization of Petroleum Exporting Countries (OPEC) cut off oil exports tothe United States for six months because the Arab members of OPEC disagreed with the U.S. support for Israel. OPEC didnot bring exports back to their earlier levels until 1975—a policy that can be interpreted as a shift of the supply curve to theleft in the U.S. petroleum market. Figure 5.11 (a) and Figure 5.11 (b) show the same original equilibrium point and thesame identical shift of a supply curve to the left from S0 to S1.
Figure 5.11 How a Shift in Supply Can Affect Price or Quantity The intersection (E0) between demand curve Dand supply curve S0 is the same in both (a) and (b). The shift of supply to the left from S0 to S1 is identical in both (a)and (b). The new equilibrium (E1) has a higher price and a lower quantity than the original equilibrium (E0) in both (a)and (b). However, the shape of the demand curve D is different in (a) and (b). As a result, the shift in supply canresult either in a new equilibrium with a much higher price and an only slightly smaller quantity, as in (a), or in a newequilibrium with only a small increase in price and a relatively larger reduction in quantity, as in (b).
Figure 5.11 (a) shows inelastic demand for oil in the short run similar to that which existed for the United States in 1973.In Figure 5.11 (a), the new equilibrium (E1) occurs at a price of $25 per barrel, roughly double the price before the OPECshock, and an equilibrium quantity of 16 million barrels per day. Figure 5.11 (b) shows what the outcome would havebeen if the U.S. demand for oil had been more elastic, a result more likely over the long term. This alternative equilibrium(E1) would have resulted in a smaller price increase to $14 per barrel and larger reduction in equilibrium quantity to 13million barrels per day. In 1983, for example, U.S. petroleum consumption was 15.3 million barrels a day, which was lowerthan in 1973 or 1975. U.S. petroleum consumption was down even though the U.S. economy was about one-fourth larger in1983 than it had been in 1973. The primary reason for the lower quantity was that higher energy prices spurred conservationefforts, and after a decade of home insulation, more fuel-efficient cars, more efficient appliances and machinery, and otherfuel-conserving choices, the demand curve for energy had become more elastic.
On the supply side of markets, producers of goods and services typically find it easier to expand production in the long termof several years rather than in the short run of a few months. After all, in the short run it can be costly or difficult to build anew factory, hire many new workers, or open new stores. But over a few years, all of these are possible.
Indeed, in most markets for goods and services, prices bounce up and down more than quantities in the short run, butquantities often move more than prices in the long run. The underlying reason for this pattern is that supply and demand areoften inelastic in the short run, so that shifts in either demand or supply can cause a relatively greater change in prices. But
112 CHAPTER 5 | ELASTICITY
This content is available for free at http://cnx.org/content/col11613/1.10
since supply and demand are more elastic in the long run, the long-run movements in prices are more muted, while quantityadjusts more easily in the long run.
5.4 | Elasticity in Areas Other Than PriceBy the end of this section, you will be able to:
• Calculate the income elasticity of demand and the cross-price elasticity of demand• Calculate the elasticity in labor and financial capital markets through an understanding of the elasticity of labor supply
and the elasticity of savings• Apply concepts of price elasticity to real-world situations
The basic idea of elasticity—how a percentage change in one variable causes a percentage change in another variable—doesnot just apply to the responsiveness of supply and demand to changes in the price of a product. Recall that quantitydemanded (Qd) depends on income, tastes and preferences, the prices of related goods, and so on, as well as price. Similarly,quantity supplied (Qs) depends on the cost of production, and so on, as well as price. Elasticity can be measured for anydeterminant of supply and demand, not just the price.
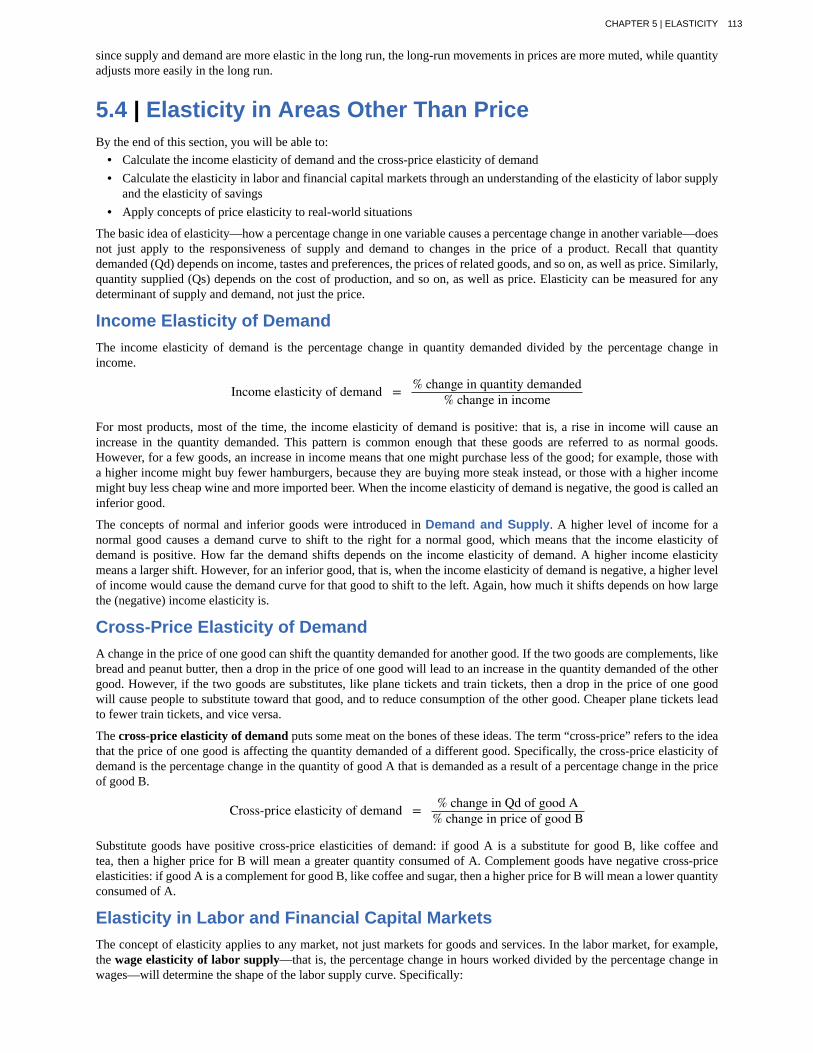
Income Elasticity of DemandThe income elasticity of demand is the percentage change in quantity demanded divided by the percentage change inincome.
Income elasticity of demand = % change in quantity demanded% change in income
For most products, most of the time, the income elasticity of demand is positive: that is, a rise in income will cause anincrease in the quantity demanded. This pattern is common enough that these goods are referred to as normal goods.However, for a few goods, an increase in income means that one might purchase less of the good; for example, those witha higher income might buy fewer hamburgers, because they are buying more steak instead, or those with a higher incomemight buy less cheap wine and more imported beer. When the income elasticity of demand is negative, the good is called aninferior good.
The concepts of normal and inferior goods were introduced in Demand and Supply. A higher level of income for anormal good causes a demand curve to shift to the right for a normal good, which means that the income elasticity ofdemand is positive. How far the demand shifts depends on the income elasticity of demand. A higher income elasticitymeans a larger shift. However, for an inferior good, that is, when the income elasticity of demand is negative, a higher levelof income would cause the demand curve for that good to shift to the left. Again, how much it shifts depends on how largethe (negative) income elasticity is.
Cross-Price Elasticity of DemandA change in the price of one good can shift the quantity demanded for another good. If the two goods are complements, likebread and peanut butter, then a drop in the price of one good will lead to an increase in the quantity demanded of the othergood. However, if the two goods are substitutes, like plane tickets and train tickets, then a drop in the price of one goodwill cause people to substitute toward that good, and to reduce consumption of the other good. Cheaper plane tickets leadto fewer train tickets, and vice versa.
The cross-price elasticity of demand puts some meat on the bones of these ideas. The term “cross-price” refers to the ideathat the price of one good is affecting the quantity demanded of a different good. Specifically, the cross-price elasticity ofdemand is the percentage change in the quantity of good A that is demanded as a result of a percentage change in the priceof good B.
Cross-price elasticity of demand = % change in Qd of good A% change in price of good B
Substitute goods have positive cross-price elasticities of demand: if good A is a substitute for good B, like coffee andtea, then a higher price for B will mean a greater quantity consumed of A. Complement goods have negative cross-priceelasticities: if good A is a complement for good B, like coffee and sugar, then a higher price for B will mean a lower quantityconsumed of A.
Elasticity in Labor and Financial Capital MarketsThe concept of elasticity applies to any market, not just markets for goods and services. In the labor market, for example,the wage elasticity of labor supply—that is, the percentage change in hours worked divided by the percentage change inwages—will determine the shape of the labor supply curve. Specifically:
CHAPTER 5 | ELASTICITY 113
Elasticity of labor supply = % change in quantity of labor supplied% change in wage
The wage elasticity of labor supply for teenage workers is generally thought to be fairly elastic: that is, a certain percentagechange in wages will lead to a larger percentage change in the quantity of hours worked. Conversely, the wage elasticity oflabor supply for adult workers in their thirties and forties is thought to be fairly inelastic. When wages move up or down bya certain percentage amount, the quantity of hours that adults in their prime earning years are willing to supply changes butby a lesser percentage amount.
In markets for financial capital, the elasticity of savings—that is, the percentage change in the quantity of savings dividedby the percentage change in interest rates—will describe the shape of the supply curve for financial capital. That is:
Elasticity of savings = % change in quantity of financial s vings% change in interest rate
Sometimes laws are proposed that seek to increase the quantity of savings by offering tax breaks so that the return on savingsis higher. Such a policy will increase the quantity if the supply curve for financial capital is elastic, because then a givenpercentage increase in the return to savings will cause a higher percentage increase in the quantity of savings. However, ifthe supply curve for financial capital is highly inelastic, then a percentage increase in the return to savings will cause only asmall increase in the quantity of savings. The evidence on the supply curve of financial capital is controversial but, at leastin the short run, the elasticity of savings with respect to the interest rate appears fairly inelastic.
Expanding the Concept of ElasticityThe elasticity concept does not even need to relate to a typical supply or demand curve at all. For example, imagine thatyou are studying whether the Internal Revenue Service should spend more money on auditing tax returns. The questioncan be framed in terms of the elasticity of tax collections with respect to spending on tax enforcement; that is, what is thepercentage change in tax collections derived from a percentage change in spending on tax enforcement?
With all of the elasticity concepts that have just been described, some of which are listed in Table 5.4, the possibility ofconfusion arises. When you hear the phrases “elasticity of demand” or “elasticity of supply,” they refer to the elasticitywith respect to price. Sometimes, either to be extremely clear or because a wide variety of elasticities are being discussed,the elasticity of demand or the demand elasticity will be called the price elasticity of demand or the “elasticity of demandwith respect to price.” Similarly, elasticity of supply or the supply elasticity is sometimes called, to avoid any possibility ofconfusion, the price elasticity of supply or “the elasticity of supply with respect to price.” But in whatever context elasticityis invoked, the idea always refers to percentage change in one variable, almost always a price or money variable, and howit causes a percentage change in another variable, typically a quantity variable of some kind.
Income elasticity of demand = % change in Qd% change in income
Cross-price elasticity of demand = % change in Qd of good A% change in price of good B
Wage elasticity of labor supply = % change in quantity of labor supplied% change in wage
Wage elasticity of labor demand = % change in quantity of labor demanded% change in wage
Interest rate elasticity of savings = % change in quantity of savings% change in interest rate
Interest rate elasticity of borrowing = % change in quantity of borrowing% change in interest rate
Table 5.4 Formulas for Calculating Elasticity
114 CHAPTER 5 | ELASTICITY
This content is available for free at http://cnx.org/content/col11613/1.10
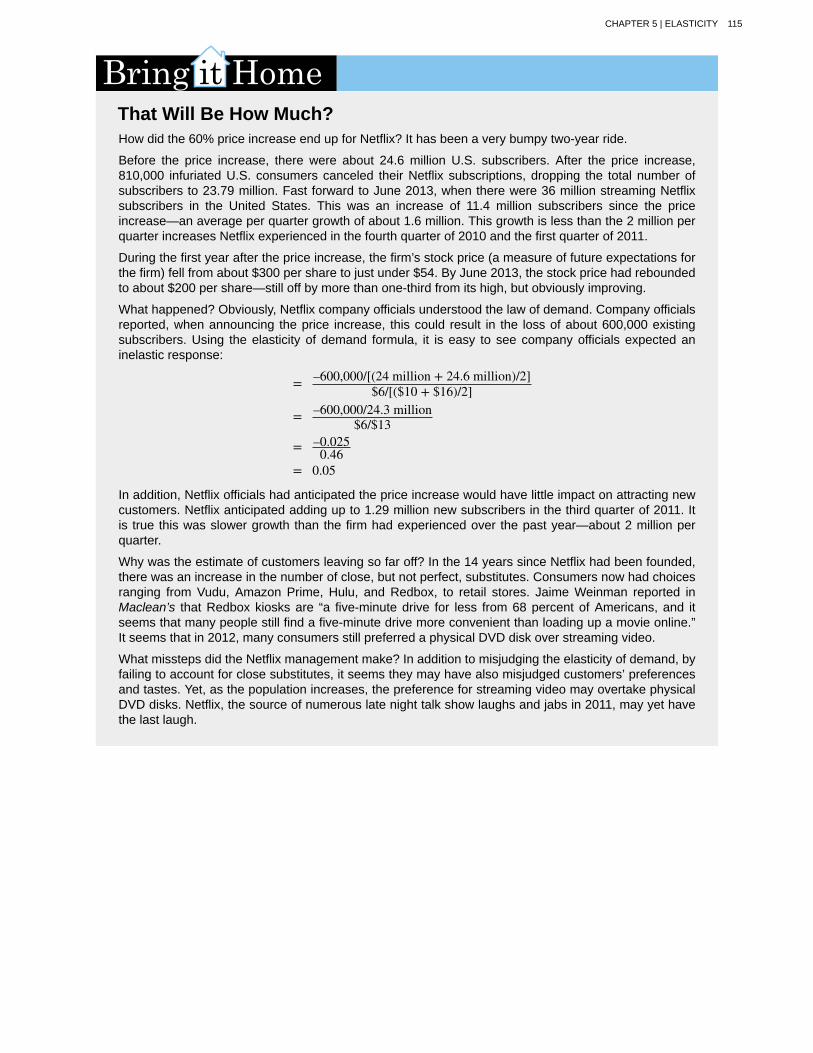
That Will Be How Much?How did the 60% price increase end up for Netflix? It has been a very bumpy two-year ride.
Before the price increase, there were about 24.6 million U.S. subscribers. After the price increase,810,000 infuriated U.S. consumers canceled their Netflix subscriptions, dropping the total number ofsubscribers to 23.79 million. Fast forward to June 2013, when there were 36 million streaming Netflixsubscribers in the United States. This was an increase of 11.4 million subscribers since the priceincrease—an average per quarter growth of about 1.6 million. This growth is less than the 2 million perquarter increases Netflix experienced in the fourth quarter of 2010 and the first quarter of 2011.
During the first year after the price increase, the firm’s stock price (a measure of future expectations forthe firm) fell from about $300 per share to just under $54. By June 2013, the stock price had reboundedto about $200 per share—still off by more than one-third from its high, but obviously improving.
What happened? Obviously, Netflix company officials understood the law of demand. Company officialsreported, when announcing the price increase, this could result in the loss of about 600,000 existingsubscribers. Using the elasticity of demand formula, it is easy to see company officials expected aninelastic response:
= –600,000/[(24 million + 24.6 million)/2]$6/[($10 + $16)/2]
= –600,000/24.3 million$6/$13
= –0.0250.46
= 0.05
In addition, Netflix officials had anticipated the price increase would have little impact on attracting newcustomers. Netflix anticipated adding up to 1.29 million new subscribers in the third quarter of 2011. Itis true this was slower growth than the firm had experienced over the past year—about 2 million perquarter.
Why was the estimate of customers leaving so far off? In the 14 years since Netflix had been founded,there was an increase in the number of close, but not perfect, substitutes. Consumers now had choicesranging from Vudu, Amazon Prime, Hulu, and Redbox, to retail stores. Jaime Weinman reported inMaclean’s that Redbox kiosks are “a five-minute drive for less from 68 percent of Americans, and itseems that many people still find a five-minute drive more convenient than loading up a movie online.”It seems that in 2012, many consumers still preferred a physical DVD disk over streaming video.
What missteps did the Netflix management make? In addition to misjudging the elasticity of demand, byfailing to account for close substitutes, it seems they may have also misjudged customers’ preferencesand tastes. Yet, as the population increases, the preference for streaming video may overtake physicalDVD disks. Netflix, the source of numerous late night talk show laughs and jabs in 2011, may yet havethe last laugh.
CHAPTER 5 | ELASTICITY 115
constant unitary elasticity
cross-price elasticity of demand
elastic demand
elastic supply
elasticity of savings
elasticity
inelastic demand
inelastic supply
infinite elasticity
perfect elasticity
perfect inelasticity
price elasticity of demand
price elasticity of supply
price elasticity
tax incidence
unitary elasticity
wage elasticity of labor supply
zero inelasticity
KEY TERMSwhen a given percent price change in price leads to an equal percentage change in quantity
demanded or supplied
the percentage change in the quantity of good A that is demanded as a result of apercentage change in good B
when the elasticity of demand is greater than one, indicating a high responsiveness of quantity demandedor supplied to changes in price
when the elasticity of either supply is greater than one, indicating a high responsiveness of quantitydemanded or supplied to changes in price
the percentage change in the quantity of savings divided by the percentage change in interest rates
an economics concept that measures responsiveness of one variable to changes in another variable
when the elasticity of demand is less than one, indicating that a 1 percent increase in price paid by theconsumer leads to less than a 1 percent change in purchases (and vice versa); this indicates a low responsiveness byconsumers to price changes
when the elasticity of supply is less than one, indicating that a 1 percent increase in price paid to the firmwill result in a less than 1 percent increase in production by the firm; this indicates a low responsiveness of the firm toprice increases (and vice versa if prices drop)
the extremely elastic situation of demand or supply where quantity changes by an infinite amount inresponse to any change in price; horizontal in appearance
see infinite elasticity
see zero elasticity
percentage change in the quantity demanded of a good or service divided the percentagechange in price
percentage change in the quantity supplied divided by the percentage change in price
the relationship between the percent change in price resulting in a corresponding percentage change in thequantity demanded or supplied
manner in which the tax burden is divided between buyers and sellers
when the calculated elasticity is equal to one indicating that a change in the price of the good or serviceresults in a proportional change in the quantity demanded or supplied
the percentage change in hours worked divided by the percentage change in wages
the highly inelastic case of demand or supply in which a percentage change in price, no matter howlarge, results in zero change in the quantity; vertical in appearance
KEY CONCEPTS AND SUMMARY
5.1 Price Elasticity of Demand and Price Elasticity of Supply
Price elasticity measures the responsiveness of the quantity demanded or supplied of a good to a change in its price.It is computed as the percentage change in quantity demanded (or supplied) divided by the percentage change inprice. Elasticity can be described as elastic (or very responsive), unit elastic, or inelastic (not very responsive). Elasticdemand or supply curves indicate that quantity demanded or supplied respond to price changes in a greater thanproportional manner. An inelastic demand or supply curve is one where a given percentage change in price will causea smaller percentage change in quantity demanded or supplied. A unitary elasticity means that a given percentagechange in price leads to an equal percentage change in quantity demanded or supplied.
116 CHAPTER 5 | ELASTICITY
This content is available for free at http://cnx.org/content/col11613/1.10
5.2 Polar Cases of Elasticity and Constant Elasticity
Infinite or perfect elasticity refers to the extreme case where either the quantity demanded or supplied changes byan infinite amount in response to any change in price at all. Zero elasticity refers to the extreme case in which apercentage change in price, no matter how large, results in zero change in quantity. Constant unitary elasticity in eithera supply or demand curve refers to a situation where a price change of one percent results in a quantity change of onepercent.
5.3 Elasticity and Pricing
In the market for goods and services, quantity supplied and quantity demanded are often relatively slow to react tochanges in price in the short run, but react more substantially in the long run. As a result, demand and supply often(but not always) tend to be relatively inelastic in the short run and relatively elastic in the long run. The tax incidencedepends on the relative price elasticity of supply and demand. When supply is more elastic than demand, buyers bearmost of the tax burden, and when demand is more elastic than supply, producers bear most of the cost of the tax. Taxrevenue is larger the more inelastic the demand and supply are.
5.4 Elasticity in Areas Other Than Price
Elasticity is a general term, referring to percentage change of one variable divided by percentage change of a relatedvariable that can be applied to many economic connections. For instance, the income elasticity of demand is thepercentage change in quantity demanded divided by the percentage change in income. The cross-price elasticity ofdemand is the percentage change in the quantity demanded of a good divided by the percentage change in the price ofanother good. Elasticity applies in labor markets and financial capital markets just as it does in markets for goods andservices. The wage elasticity of labor supply is the percentage change in the quantity of hours supplied divided by thepercentage change in the wage. The elasticity of savings with respect to interest rates is the percentage change in thequantity of savings divided by the percentage change in interest rates.
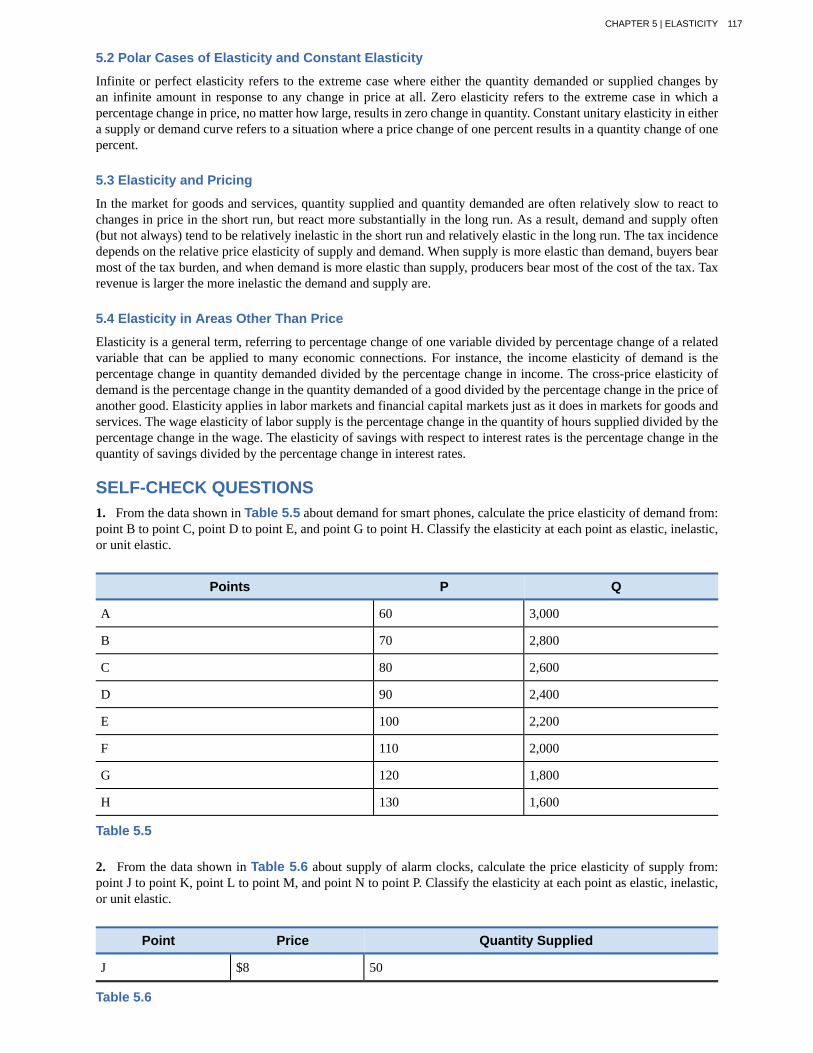
SELF-CHECK QUESTIONS1. From the data shown in Table 5.5 about demand for smart phones, calculate the price elasticity of demand from:point B to point C, point D to point E, and point G to point H. Classify the elasticity at each point as elastic, inelastic,or unit elastic.
Points P Q
A 60 3,000
B 70 2,800
C 80 2,600
D 90 2,400
E 100 2,200
F 110 2,000
G 120 1,800
H 130 1,600
Table 5.5
2. From the data shown in Table 5.6 about supply of alarm clocks, calculate the price elasticity of supply from:point J to point K, point L to point M, and point N to point P. Classify the elasticity at each point as elastic, inelastic,or unit elastic.
Point Price Quantity Supplied
J $8 50
Table 5.6
CHAPTER 5 | ELASTICITY 117
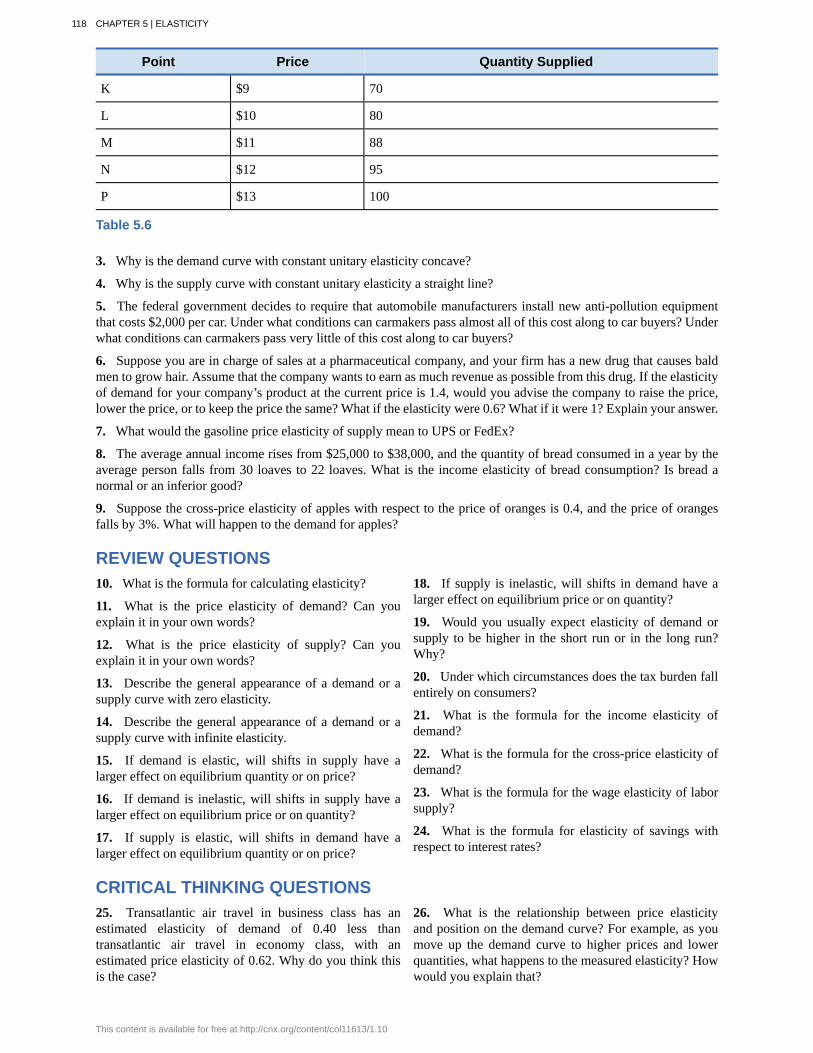
Point Price Quantity Supplied
K $9 70
L $10 80
M $11 88
N $12 95
P $13 100
Table 5.6
3. Why is the demand curve with constant unitary elasticity concave?
4. Why is the supply curve with constant unitary elasticity a straight line?
5. The federal government decides to require that automobile manufacturers install new anti-pollution equipmentthat costs $2,000 per car. Under what conditions can carmakers pass almost all of this cost along to car buyers? Underwhat conditions can carmakers pass very little of this cost along to car buyers?
6. Suppose you are in charge of sales at a pharmaceutical company, and your firm has a new drug that causes baldmen to grow hair. Assume that the company wants to earn as much revenue as possible from this drug. If the elasticityof demand for your company’s product at the current price is 1.4, would you advise the company to raise the price,lower the price, or to keep the price the same? What if the elasticity were 0.6? What if it were 1? Explain your answer.
7. What would the gasoline price elasticity of supply mean to UPS or FedEx?
8. The average annual income rises from $25,000 to $38,000, and the quantity of bread consumed in a year by theaverage person falls from 30 loaves to 22 loaves. What is the income elasticity of bread consumption? Is bread anormal or an inferior good?
9. Suppose the cross-price elasticity of apples with respect to the price of oranges is 0.4, and the price of orangesfalls by 3%. What will happen to the demand for apples?
REVIEW QUESTIONS10. What is the formula for calculating elasticity?
11. What is the price elasticity of demand? Can youexplain it in your own words?
12. What is the price elasticity of supply? Can youexplain it in your own words?
13. Describe the general appearance of a demand or asupply curve with zero elasticity.
14. Describe the general appearance of a demand or asupply curve with infinite elasticity.
15. If demand is elastic, will shifts in supply have alarger effect on equilibrium quantity or on price?
16. If demand is inelastic, will shifts in supply have alarger effect on equilibrium price or on quantity?
17. If supply is elastic, will shifts in demand have alarger effect on equilibrium quantity or on price?
18. If supply is inelastic, will shifts in demand have alarger effect on equilibrium price or on quantity?
19. Would you usually expect elasticity of demand orsupply to be higher in the short run or in the long run?Why?
20. Under which circumstances does the tax burden fallentirely on consumers?
21. What is the formula for the income elasticity ofdemand?
22. What is the formula for the cross-price elasticity ofdemand?
23. What is the formula for the wage elasticity of laborsupply?
24. What is the formula for elasticity of savings withrespect to interest rates?
CRITICAL THINKING QUESTIONS25. Transatlantic air travel in business class has anestimated elasticity of demand of 0.40 less thantransatlantic air travel in economy class, with anestimated price elasticity of 0.62. Why do you think thisis the case?
26. What is the relationship between price elasticityand position on the demand curve? For example, as youmove up the demand curve to higher prices and lowerquantities, what happens to the measured elasticity? Howwould you explain that?
118 CHAPTER 5 | ELASTICITY
This content is available for free at http://cnx.org/content/col11613/1.10
27. Can you think of an industry (or product) with nearinfinite elasticity of supply in the short term? That is,what is an industry that could increase Qs almost withoutlimit in response to an increase in the price?
28. Would you expect supply to play a more significantrole in determining the price of a basic necessity likefood or a luxury like perfume? Explain. Hint: Think abouthow the price elasticity of demand will differ betweennecessities and luxuries.
29. A city has built a bridge over a river and it decidesto charge a toll to everyone who crosses. For one year,the city charges a variety of different tolls and recordsinformation on how many drivers cross the bridge. Thecity thus gathers information about elasticity of demand.If the city wishes to raise as much revenue as possiblefrom the tolls, where will the city decide to charge a toll:
in the inelastic portion of the demand curve, the elasticportion of the demand curve, or the unit elastic portion?Explain.
30. In a market where the supply curve is perfectlyinelastic, how does an excise tax affect the price paid byconsumers and the quantity bought and sold?
31. Normal goods are defined as having a positiveincome elasticity. We can divide normal goods into twotypes: Those whose income elasticity is less than one andthose whose income elasticity is greater than one. Thinkabout products that would fall into each category. Canyou come up with a name for each category?
32. Suppose you could buy shoes one at a time, ratherthan in pairs. What do you predict the cross-priceelasticity for left shoes and right shoes would be?
PROBLEMS33. The equation for a demand curve is P = 48 – 3Q.What is the elasticity in moving from a quantity of 5 to aquantity of 6?
34. The equation for a demand curve is P = 2/Q. What isthe elasticity of demand as price falls from 5 to 4? Whatis the elasticity of demand as the price falls from 9 to 8?Would you expect these answers to be the same?
35. The equation for a supply curve is 4P = Q. What isthe elasticity of supply as price rises from 3 to 4? Whatis the elasticity of supply as the price rises from 7 to 8?Would you expect these answers to be the same?
36. The equation for a supply curve is P = 3Q – 8. Whatis the elasticity in moving from a price of 4 to a price of7?
37. The supply of paintings by Leonardo Da Vinci, whopainted the Mona Lisa and The Last Supper and died in1519, is highly inelastic. Sketch a supply and demanddiagram, paying attention to the appropriate elasticities,to illustrate that demand for these paintings willdetermine the price.
38. Say that a certain stadium for professional footballhas 70,000 seats. What is the shape of the supply curvefor tickets to football games at that stadium? Explain.
39. When someone’s kidneys fail, the person needs tohave medical treatment with a dialysis machine (unlessor until they receive a kidney transplant) or they will die.Sketch a supply and demand diagram, paying attentionto the appropriate elasticities, to illustrate that the supplyof such dialysis machines will primarily determine theprice.
40. Assume that the supply of low-skilled workers isfairly elastic, but the employers’ demand for suchworkers is fairly inelastic. If the policy goal is to expandemployment for low-skilled workers, is it better to focuson policy tools to shift the supply of unskilled labor or ontools to shift the demand for unskilled labor? What if thepolicy goal is to raise wages for this group? Explain youranswers with supply and demand diagrams.
CHAPTER 5 | ELASTICITY 119
Related Documents