Chapter 5 Ecophysiology of Great Basin and Sierra Nevada Vegetation on Contrasting Soils Evan H. DeLucia and William H. Schlesinger Introduction A dramatic feature of the landscape in the western Great Basin desert is the occurrence of "tree islands" in the midst of sagebrush vegetation (Plate 11.1). Small stands of Sierra Nevada conifers, primarily Pinus ponderosa and P. jeffreyi, occur up to 60 km east of the eastern limits of the Sierra Nevada montane forest. These stands range from one to sev- eral hectares, are largely devoid of characteristic Great Basin species, and are restricted to outcrops of azonal soil derived from hydrother- mally altered andesitic bedrock (Billings 1950). Soil derived from al- tered bedrock is light yellow and contrasts strongly with adjacent dark brown soil derived from unaltered andesite. These disjunct Sierra Nevada communities provide an opportunity to examine the ecophysiological responses of dominant Great Basin and Sierra Nevada plants growing in a desert climate. We have used this system to explore the importance of drought tolerance and water- and nutrient-use efficiency in enabling Sierra Nevada and Great Basin plants to persist at different levels of resource availability. Additionally, the role of bedrock geology in defining the distribution of desert vegeta- tion will be considered. Much of the research discussed in this chapter stems from the original description of these "tree islands" by W.D. Billings, and was undertaken with his collaboration.

Welcome message from author
This document is posted to help you gain knowledge. Please leave a comment to let me know what you think about it! Share it to your friends and learn new things together.
Transcript
Chapter 5
Ecophysiology of Great Basin
and Sierra Nevada Vegetation
on Contrasting Soils
Evan H. DeLucia and William H. Schlesinger
Introduction
A dramatic feature of the landscape in the western Great Basin desert is the occurrence of "tree islands" in the midst of sagebrush vegetation (Plate 11.1). Small stands of Sierra Nevada conifers, primarily Pinus ponderosa and P. jeffreyi, occur up to 60 km east of the eastern limits of the Sierra Nevada montane forest. These stands range from one to several hectares, are largely devoid of characteristic Great Basin species, and are restricted to outcrops of azonal soil derived from hydrothermally altered andesitic bedrock (Billings 1950). Soil derived from altered bedrock is light yellow and contrasts strongly with adjacent dark brown soil derived from unaltered andesite.
These disjunct Sierra Nevada communities provide an opportunity to examine the ecophysiological responses of dominant Great Basin and Sierra Nevada plants growing in a desert climate. We have used this system to explore the importance of drought tolerance and water- and nutrient-use efficiency in enabling Sierra Nevada and Great Basin plants to persist at different levels of resource availability. Additionally, the role of bedrock geology in defining the distribution of desert vegetation will be considered. Much of the research discussed in this chapter stems from the original description of these "tree islands" by W.D. Billings, and was undertaken with his collaboration.
144 E.H. DeLucia and W.H. Schlesinger
Vegetation
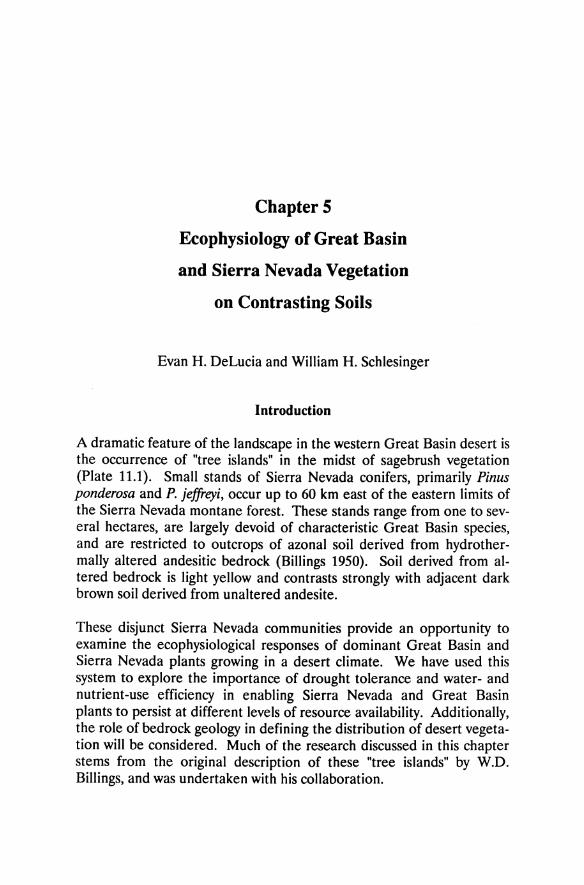
Approximately 140 stands of Sierra Nevada pines on altered rock, ranging from one to several hectares, are located in the western Great Basin desert in Nevada and on the east slopes of the Sierra Nevada in California (Billings pers. comm.). Of the 15 sites used in our studies (Figure 5.1), 10 sites occur in sagebrush steppe and pinyon-juniper woodland (1,400-2,000 m above sea level) and 5 sites occur among highelevation Sierra Nevada montane forest (1,750-2,100 m). Vegetation data are summarized for one site in each community type (Table 5.1).
Figure 5.1. Western Nevada and eastern California showing the western shoreline of the Pleistocene Lake Lahontan (hatched), the extent of present-day lakes (black), and location of the study sites. Intensive study sites as described in Table 5.1 and by DeLucia et al. (1988) are circled. From Schlesinger et al. (1989).
5. Ecophysiology of Vegetation on Contrasting Soils 145
In the Great Basin Pinus ponderosa and P. jeffreyi are dominant on altered rock of the Virginia Mountains and Peavine Mountain, whereas Artemisia tridentata and other desert shrubs are dominant on adjacent unaltered country rock (Table 5.1). At least 8 of the 15 taxa of Sierra Nevada conifers occur on altered sites at other locations in the Great Basin. Interspersed among widely spaced trees on the altered rock are a few endemics and a number of Sierra Nevada alpine plants and their congeners (Billings 1950). Eriogonum robustum (Plate 11.2), closely related to the Sierra Nevada species E. lobbU, and Calyptridium umbellatum, are two endemics on altered soil in the Great Basin. Total plant cover is uniformly lower on soils derived from altered compared to unaltered andesite. On the driest sites there is little floristic overlap with adjacent sagebrush vegetation; few of the typical desert species occur on altered rock to which the Sierra Nevada species are restricted. Moreover, the ecotone between communities on soils derived from altered and unaltered bedrock typically is defined sharply (Plate ILl).
In the slightly more mesic pinyon-juniper woodlands of the western Great Basin ranges, scattered individuals of Juniperus osteosperma, Pinus monophylla, and Amelanchier alnifolia occur on altered rock in addition to the Sierra Nevada pines. As moisture availability further increases with higher elevation in the Sierra Nevada montane forest, the species composition on adjacent rock types becomes more similar (Alpine County, Table 5.1). Pinus jeffreyi as well as Arctostaphylos patula and other shrubs occur on both soils, although at greatly reduced densities on nutrient-poor altered soils. The pattern of increasing similarity of vegetation on these two soil types with increasing elevation and precipitation suggests that moisture availability is one important factor 10
maintaining these unique forested communities in sagebrush desert.
Soil Chemistry
Hydrothermal alteration probably occurred in the late Miocene (Calkins 1944, Gianella 1936). Rising hot water introduced elemental sulfur that combined with iron in the ferromagnesian minerals of the rock to form pyrite. As exposed altered rock eroded, pyrite oxidized to sulfuric acid leaching most of the base cations and leaving shallow, acidic soils of mostly alumino-silicates.
Soils derived from andesitic bedrock in the Great Basin are primarily XeroIIic Haplargids, typical of desert brown soils, whereas altered rock
146 E.H. DeLucia and W.H. Schlesinger
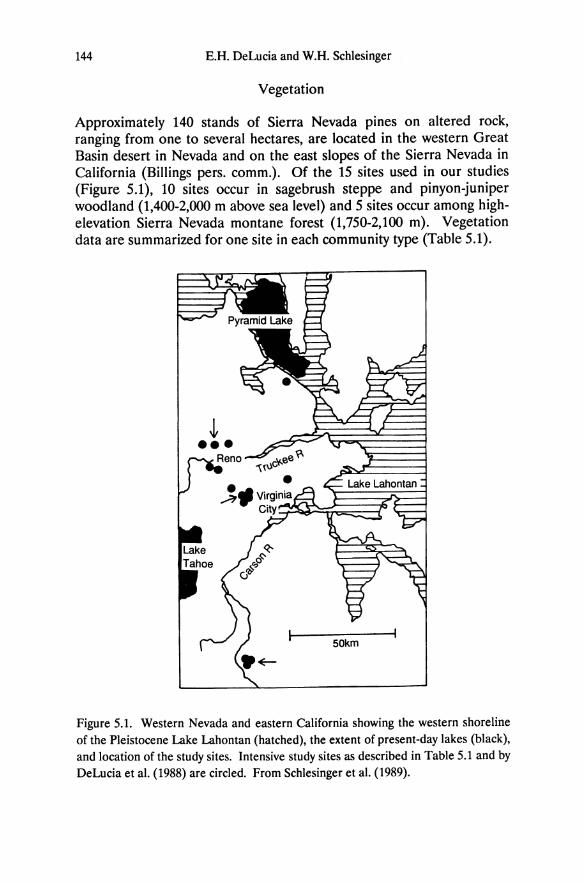
Table 5.1. Vegetation summary of selected research sites on altered and unaltered rock (from DeLucia et al. 1988). Density (plants ha-1), dominance (Dom.) of trees (basal area, m2 ha-1) or of shrubs (frequency, %), and importance value (%) are shown for all species in the tree-size class, and for the two species in the shrub-size class with the highest importance value. Importance value in the tree-size class was calculated as the mean of the relative density and relative dominance. Importance value for plants in the shrub-size class was calculated as the mean of the relative density and relative frequency.
Vegetation Unaltered site Altered Site Density Dom. Importance Density Dom. Importance
Value Value
Alpine Count; Trees (all species) Pinus jeffreyi 510 36.0 98 260 23.9 100 Abies concolor 10 <0.1 1
Cercocarpus ledifolius 10 <0.1 Shrubs Arctostaphylos patula 50 2 6 150 6 17 Purshia tridentata 2300 42 72 Pinus seedlings2 600 10 18 1500 18 83 Other 100 50
Total density 3580 1960 Herb cover (%) 0.1 <0.1
Virginia Mountains3
Trees (all species) Pinus ponderosa 100 3.9 83 Pinus monophylla 40 6.2 100 10 0.2 6 Juniperus osteosperma 30 <0.1 11 Shrubs Artemisia tridentata 4200 68 30 Chrysothamnus panyi 350 10 4 5050 40 68 Eriogonum wrightii 9450 66 45 450 6 8 Pinus seedlings2 800 20 20 Other 2400 100
Total density 16420 6540 Herb cover (%) 3.4 0.1
5. Ecophysiology of Vegetation on Contrasting Soils 147
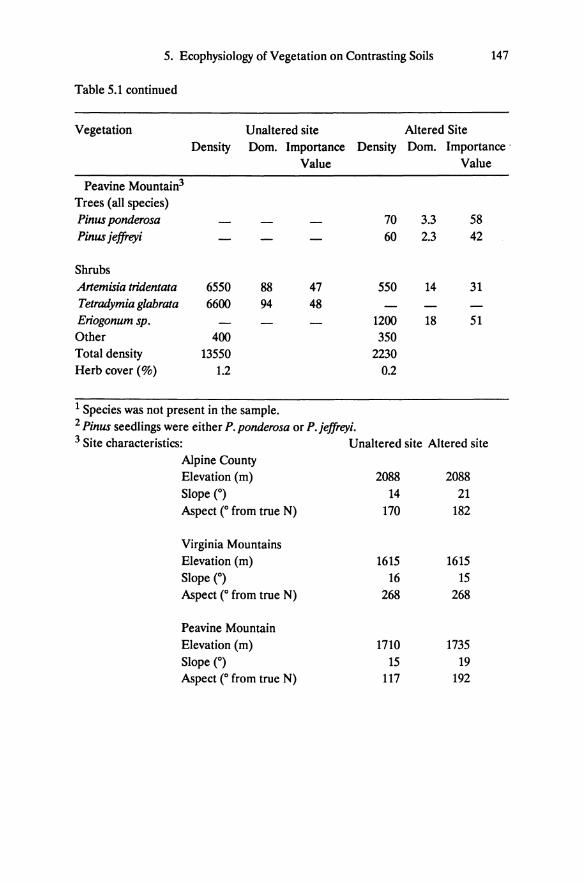
Table 5.1 continued
Vegetation Unaltered site Altered Site Density Dom. Importance Density Dom. Importance .
Value Value
Peavine Mountain3
Trees (all species) Pinw ponderosa 70 3.3 58 Pinw jeffreyi 60 2.3 42
Shrubs Artemisia tridentata 6550 88 47 550 14 31 Tetradymia glabrata 6600 94 48 Eriogonum sp. 1200 18 51 Other 400 350 Total density 13550 2230 Herb cover (%) 1.2 0.2
1 Species was not present in the sample. 2 Pinw seedlings were either P.ponderosa or P.jeffreyi. 3 Site characteristics: Unaltered site Altered site
Alpine County Elevation (m) 2088 2088 Slope e) 14 21 Aspect e from true N) 170 182
Virginia Mountains Elevation (m) 1615 1615 Slope (0) 16 15 Aspect e from true N) 268 268
Peavine Mountain Elevation (m) 1710 1735 Slope (0) 15 19 Aspect (0 from true N) 117 192
......
Tab
le 5
.2.
Soi
l ch
emic
al p
rope
rtie
s o
n a
lter
ed a
nd u
nalt
ered
par
ent
mat
eria
ls i
n th
e S
ierr
a N
evad
a an
d G
reat
Bas
in,
.j>
. 0
0
mea
sure
d o
n 1
:5 s
oil
extr
act
and
HC
03-
P e
xtra
cted
at
pH 8
.5 (
from
Sch
lesi
nger
et
al.
1989
).
All
dat
a ar
e m
eans
wit
h on
e S
E i
n p
aren
thes
es.
Ana
lysi
s o
f var
ianc
e w
as u
sed
to d
isti
ngui
sh m
ain
effe
cts
due
to l
ocat
ion
and
soil
typ
e; t
-tes
ts
wer
e us
ed t
o d
isti
ngui
sh d
iffe
renc
es b
etw
een
soil
type
s w
ithi
n a
loca
tion
. A
ster
isks
ind
icat
e si
gnif
ican
ce a
t <
.05
.
pH i
n 0.
01 M
pH
H
C0
3-S
04-
Ca2
+
H20
-P
HC
03-
P
C
N
Loc
atio
n C
aCl 2
(m
g 1"
1)
(J.lg
g-1
) (m
g g-
1)
Sie
rra
Nev
ada
* *
* *
* tT
l
Una
lter
ed
(n =
5)
5.72
6.
23
0.30
1.
01
6.38
0.
54
22.6
0.
234
0.01
1 ~
0 (0
.19)
(0
.19)
(0
.06)
(0
.12)
(1
.03)
(0
.23)
(5
.2)
(0.0
44)
(0.0
02)
0 b A
lter
ed
(n =
5)
3.99
5.
06
0.07
5.
54
2.24
0.
27
32.0
0.
224
0.00
8 ()
(0.2
2)
(0.1
7)
(0.0
3)
(1.4
6)
(0.7
0)
(0.2
2)
(19.
0)
(0.0
31)
(0.0
02)
;.
~ ::s
Gre
at B
asin
Pin
yon
Zo
ne
• •
* •
• *
c.
Una
lter
ed
(n =
4)
6.19
6.
70
0.56
1.
21
4.06
1.
14
23.3
0.
142
0.00
8 ~
(0.2
4)
(0.1
3)
(0.2
1)
(0.2
3)
(1.1
0)
(0.3
3)
(6.1
) (0
.043
) (0
.002
) ~
til
Alt
ered
(n
= 4)
3.
66
4.81
0.
04
6.46
0.
98
0.02
2.
9 0.
107
0.00
5 ()
::r
(0.1
2)
(0.1
8)
(0.0
2)
(2.6
1)
(0.4
3)
(0.0
2)
(1.7
) (0
.042
) (0
.002
) CD
'" :r
Sag
ebru
sh z
one
• •
* •
ClCl
0
Una
lter
ed
(n =
4)
6.55
7.
00
0.45
0.
84
6.07
2.
81
31.4
0.
078
0.00
6 ...,
(0.1
7)
(0.1
3)
(0.1
1)
(0.2
2)
(2.1
5)
(1.2
5)
(4.4
) (0
.012
) (0
.001
) A
lter
ed
(n =
4)
3.74
4.
69
0.03
19
.86
2.64
0.
16
5.6
0.11
5 0.
009
(0.1
5)
(0.2
3)
(0.0
2)
(12.
81)
(1.5
5)
(0.1
6)
(2.9
) (0
.015
) (0
.002
) A
NO
V A
for
mai
n ef
fect
s L
ocat
ion
ns
ns
ns
ns
ns
ns
ns
* ns
So
il *
* *
* •
* ns
ns
ns
5. Ecophysiology of Vegetation on Contrasting Soils 149
PC2
%C (r= .48)
%N (r = .37)
Sierran
pH (r = .35)
HCOa- (r = .38)
Ca++ (r = .37)
e3B
Sagebrush
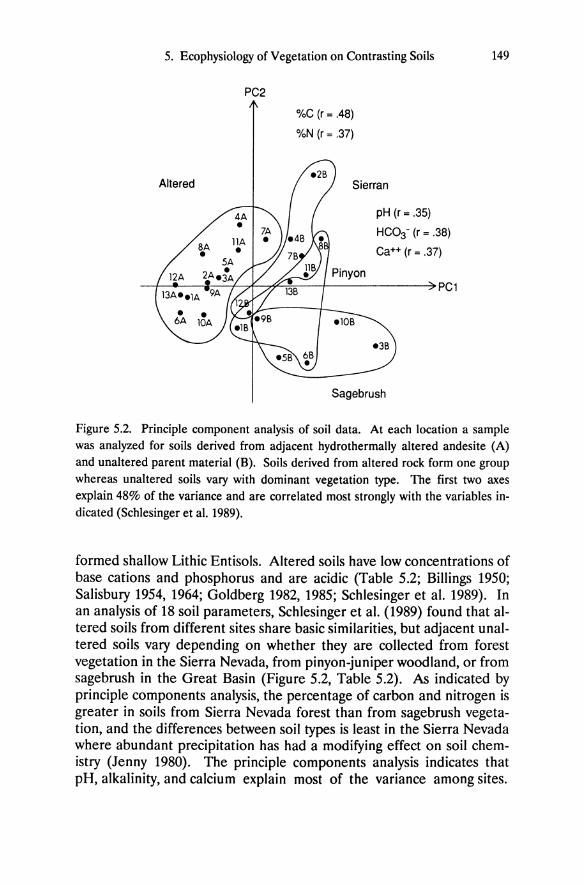
Figure 5.2. Principle component analysis of soil data. At each location a sample was analyzed for soils derived from adjacent hydrothermally altered andesite (A) and unaltered parent material (B). Soils derived from altered rock form one group whereas unaltered soils vary with dominant vegetation type. The first two axes explain 48% of the variance and are correlated most strongly with the variables indicated (Schlesinger et al. 1989).
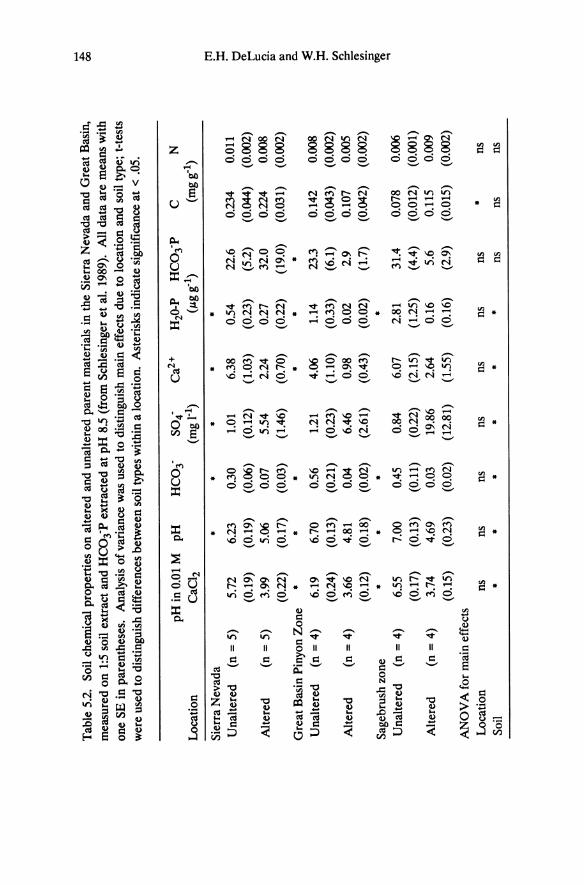
formed shallow Lithic Entisols. Altered soils have low concentrations of base cations and phosphorus and are acidic (Table 5.2; Billings 1950; Salisbury 1954, 1964; Goldberg 1982, 1985; Schlesinger et al. 1989). In an analysis of 18 soil parameters, Schlesinger et al. (1989) found that altered soils from different sites share basic similarities, but adjacent unaltered soils vary depending on whether they are collected from forest vegetation in the Sierra Nevada, from pinyon-juniper woodland, or from sagebrush in the Great Basin (Figure 5.2, Table 5.2). As indicated by principle components analysis, the percentage of carbon and nitrogen is greater in soils from Sierra Nevada forest than from sagebrush vegetation, and the differences between soil types is least in the Sierra Nevada where abundant precipitation has had a modifying effect on soil chemistry (Jenny 1980). The principle components analysis indicates that pH, alkalinity, and calcium explain most of the variance among sites.
150 E.H. DeLucia and W.H. Schlesinger
However, the biological effect of these differences is probably through the influence on phosphorus availability, which is reduced by precipitation with iron and aluminum minerals under the acidic conditions (Salisbury 1954).
Hypotheses
The presence of these unique forested ecosystems within desert sagebrush vegetation of strikingly different physiognomy and microclimate poses two important questions in plant ecology. First, the question of origin: how do these tree islands come to be? Second, the question of maintenance: how do Sierra Nevada trees and other species that are adapted to cool moist montane and alpine conditions persist in a desert climate? In this chapter we present and discuss data relevant to the maintenance of these disjunct forested communities, but first the question of origin warrants further discussion. Billings and Schlesinger proposed that these disjunct Sierra Nevada communities are relicts of a widespread occurrence of Sierra Nevada pines on many rock types during the cool moist climate of the late Pleistocene. As the climate dried, Sierra Nevada species remained only on the altered rocks because of the inability of the Great Basin taxa to invade and survive on these rocks. Although this hypothesis has not been tested explicitly, it is supported by the observation that disjunct Sierra Nevada communities do not occur east of the western shoreline of the Pleistocene Lake Lahontan (Figure 5.1).
A two-part hypothesis for the maintenance of disjunct Sierra Nevada communities in the Great Basin proposes that species from the infertile soil type (the Sierra Nevada taxa) are excluded from the more fertile soil by competition for water and conversely, species from the more fertile soil (sagebrush vegetation) are excluded from the less fertile soil by physiological intolerance of nutrient deficiency. There are many similarities in the physiognomy and dynamics of vegetation on soils derived from hydrothermally altered and serpentine rock, and a similar hypothesis has been proposed for the maintenance of distinct serpentine communities (Kruckeberg 1954, Whittaker 1954). The primary effect of altered soil on vegetation is, however, through the influence of low pH and phosphorus availability rather than the nickel and chromium toxicity of serpentine-derived soil. In addition to illustrating the role of edaphic factors in the local modification of climatically governed distribution of vegetation in the region, the altered andesite stands provide
5. Ecophysiology of Vegetation on Contrasting Soils 151
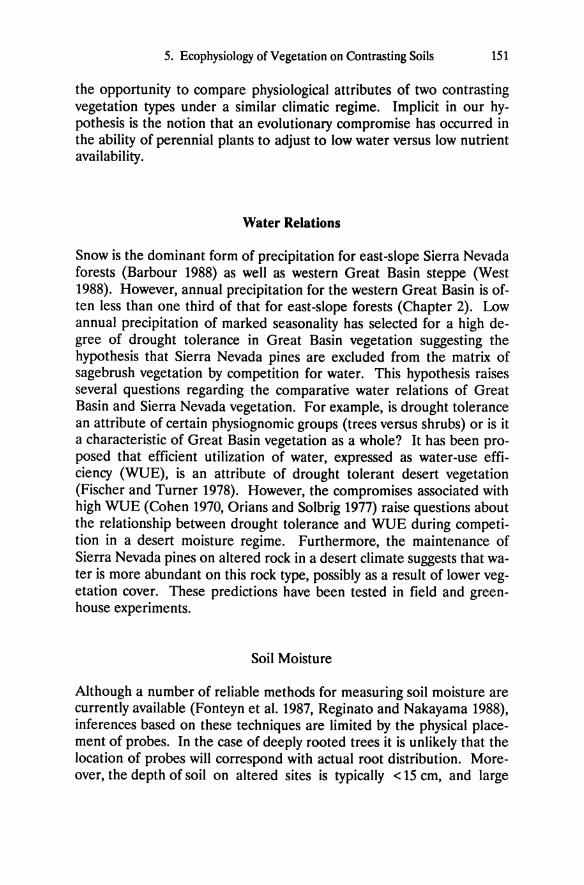
the opportunity to compare physiological attributes of two contrasting vegetation types under a similar climatic regime. Implicit in our hypothesis is the notion that an evolutionary compromise has occurred in the ability of perennial plants to adjust to low water versus low nutrient availability.
Water Relations
Snow is the dominant form of precipitation for east-slope Sierra Nevada forests (Barbour 1988) as well as western Great Basin steppe (West 1988). However, annual precipitation for the western Great Basin is often less than one third of that for east-slope forests (Chapter 2). Low annual precipitation of marked seasonality has selected for a high degree of drought tolerance in Great Basin vegetation suggesting the hypothesis that Sierra Nevada pines are excluded from the matrix of sagebrush vegetation by competition for water. This hypothesis raises several questions regarding the comparative water relations of Great Basin and Sierra Nevada vegetation. For example, is drought tolerance an attribute of certain physiognomic groups (trees versus shrubs) or is it a characteristic of Great Basin vegetation as a whole? It has been proposed that efficient utilization of water, expressed as water-use efficiency (WUE), is an attribute of drought tolerant desert vegetation (Fischer and Turner 1978). However, the compromises associated with high WUE (Cohen 1970, Orians and Solbrig 1977) raise questions about the relationship between drought tolerance and WUE during competition in a desert moisture regime. Furthermore, the maintenance of Sierra Nevada pines on altered rock in a desert climate suggests that water is more abundant on this rock type, possibly as a result of lower vegetation cover. These predictions have been tested in field and greenhouse experiments.
Soil Moisture
Although a number of reliable methods for measuring soil moisture are currently available (Fonteyn et al. 1987, Reginato and Nakayama 1988), inferences based on these techniques are limited by the physical placement of probes. In the case of deeply rooted trees it is unlikely that the location of probes will correspond with actual root distribution. Moreover, the depth of soil on altered sites is typically < 15 cm, and large
152 E.H. DeLucia and W.H. Schlesinger
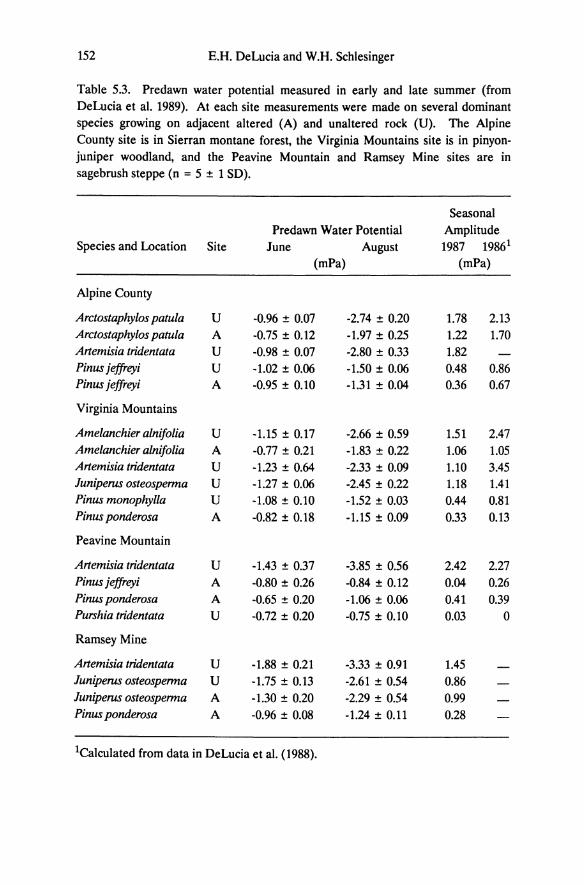
Table 5.3. Predawn water potential measured in early and late summer (from DeLucia et al. 1989). At each site measurements were made on several dominant species growing on adjacent altered (A) and unaltered rock (U). The Alpine County site is in Sierran montane forest, the Virginia Mountains site is in pinyon-juniper woodland, and the Peavine Mountain and Ramsey Mine sites are in sagebrush steppe (n = 5 ± 1 SD).
Seasonal Predawn Water Potential Amplitude
Species and Location Site June August 1987 19861
(mPa) (mPa)
Alpine County
Arctostaphylos patula U -0.96 ± 0.07 -2.74 ± 0.20 1.78 2.13 Arctostaphylos patula A -0.75 ± 0.12 -1.97 ± 0.25 1.22 1.70 Artemisia tridentata U -0.98 ± 0.07 -2.80 ± 0.33 1.82 Pinus jeffreyi U -1.02 ± 0.06 -1.50 ± 0.06 0.48 0.86 Pinus jeffreyi A -0.95 ± 0.10 -1.31 ± 0.04 0.36 0.67
Virginia Mountains
Amelanchier alnifolia U -1.15 ± 0.17 -2.66 ± 0.59 1.51 2.47 Amelanchier alnifolia A -0.77 ± 0.21 -1.83 ± 0.22 1.06 1.05 Artemisia tridentata U -1.23 ± 0.64 -2.33 ± 0.09 1.10 3.45 Juniperus osteosperma U -1.27 ± 0.06 -2.45 ± 0.22 1.18 1.41 Pinus monophylla U -1.08 ± 0.10 -1.52 ± 0.03 0.44 0.81 Pinus ponderosa A -0.82 ± 0.18 -1.15 ± 0.09 0.33 0.13
Peavine Mountain
Artemisia tridentata U -1.43 ± 0.37 -3.85 ± 0.56 2.42 2.27 Pinus jeffreyi A -0.80 ± 0.26 -0.84 ± 0.12 0.04 0.26 Pinus ponderosa A -0.65 ± 0.20 -1.06 ± 0.06 0.41 0.39 Purshia tridentata U -0.72 ± 0.20 -0.75 ± 0.10 0.03 0
Ramsey Mine
Artemisia tridentata U -1.88 ± 0.21 -3.33 ± 0.91 1.45 Juniperus osteosperma U -1.75 ± 0.13 -2.61 ± 0.54 0.86 Juniperus osteosperma A -1.30 ± 0.20 -2.29 ± 0.54 0.99 Pinus ponderosa A -0.96 ± 0.08 -1.24 ± 0.11 0.28
1Calculated from data in DeLucia et al. (1988).
5. Ecophysiology of Vegetation on Contrasting Soils 153
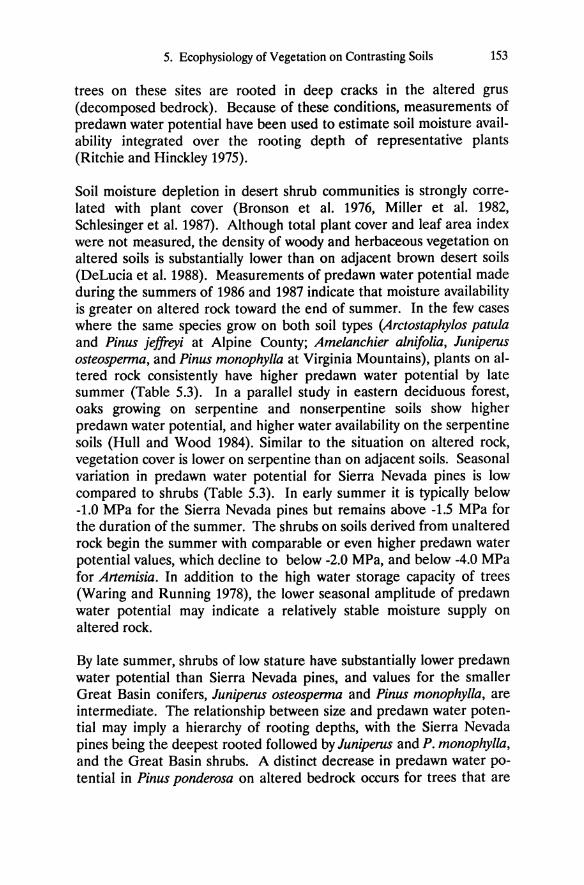
trees on these sites are rooted in deep cracks in the altered grus (decomposed bedrock). Because of these conditions, measurements of predawn water potential have been used to estimate soil moisture availability integrated over the rooting depth of representative plants (Ritchie and Hinckley 1975).
Soil moisture depletion in desert shrub communities is strongly correlated with plant cover (Bronson et al. 1976, Miller et al. 1982, Schlesinger et al. 1987). Although total plant cover and leaf area index were not measured, the density of woody and herbaceous vegetation on altered soils is substantially lower than on adjacent brown desert soils (DeLucia et al. 1988). Measurements of predawn water potential made during the summers of 1986 and 1987 indicate that moisture availability is greater on altered rock toward the end of summer. In the few cases where the same species grow on both soil types (Arctostaphylos patula and Pinus jeffreyi at Alpine County; Amelanchier alnifolia, Juniperus osteospenna, and Pinus monophylla at Virginia Mountains), plants on altered rock consistently have higher predawn water potential by late summer (Table 5.3). In a parallel study in eastern deciduous forest, oaks growing on serpentine and nonserpentine soils show higher predawn water potential, and higher water availability on the serpentine soils (Hull and Wood 1984). Similar to the situation on altered rock, vegetation cover is lower on serpentine than on adjacent soils. Seasonal variation in predawn water potential for Sierra Nevada pines is low compared to shrubs (Table 5.3). In early summer it is typically below -1.0 MPa for the Sierra Nevada pines but remains above -1.5 MPa for the duration of the summer. The shrubs on soils derived from unaltered rock begin the summer with comparable or even higher predawn water potential values, which decline to below -2.0 MPa, and below -4.0 MPa for Anemisia. In addition to the high water storage capacity of trees (Waring and Running 1978), the lower seasonal amplitude of predawn water potential may indicate a relatively stable moisture supply on altered rock.
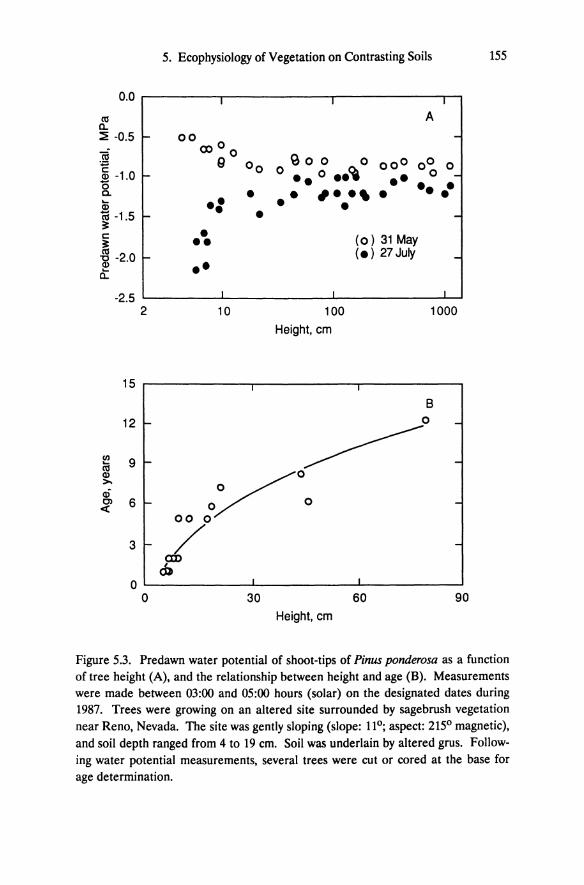
By late summer, shrubs of low stature have substantially lower predawn water potential than Sierra Nevada pines, and values for the smaller Great Basin conifers, Juniperus osteospenna and Pinus monophylla, are intermediate. The relationship between size and predawn water potential may imply a hierarchy of rooting depths, with the Sierra Nevada pines being the deepest rooted followed by Juniperus and P. monophylla, and the Great Basin shrubs. A distinct decrease in predawn water potential in Pinus ponderosa on altered bedrock occurs for trees that are
154 E.H. DeLucia and W.H. Schlesinger
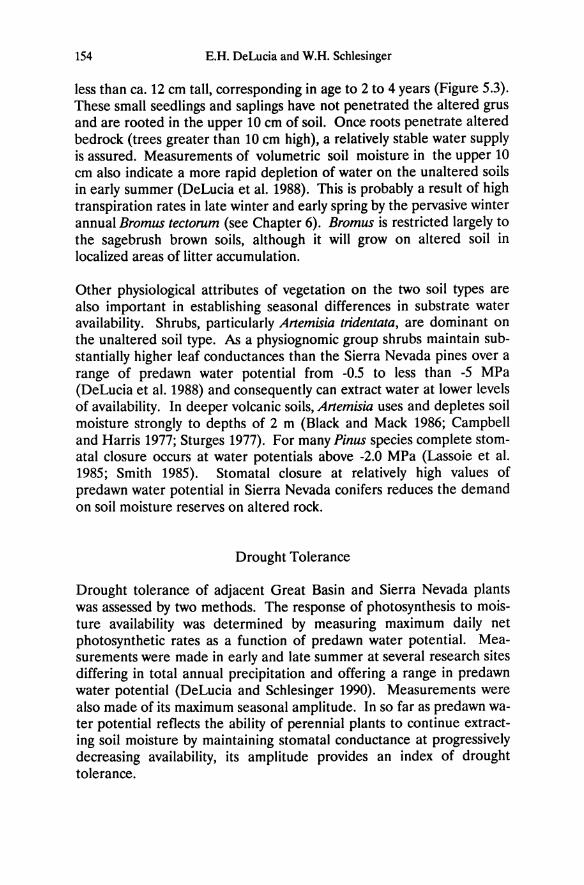
less than ca. 12 cm tall, corresponding in age to 2 to 4 years (Figure 5.3). These small seedlings and saplings have not penetrated the altered grus and are rooted in the upper 10 cm of soil. Once roots penetrate altered bedrock (trees greater than 10 cm high), a relatively stable water supply is assured. Measurements of volumetric soil moisture in the upper 10 cm also indicate a more rapid depletion of water on the unaltered soils in early summer (DeLucia et al. 1988). This is probably a result of high transpiration rates in late winter and early spring by the pervasive winter annual Bromus teetorum (see Chapter 6). Bromus is restricted largely to the sagebrush brown soils, although it will grow on altered soil in localized areas of litter accumulation.
Other physiological attributes of vegetation on the two soil types are also important in establishing seasonal differences in substrate water availability. Shrubs, particularly Artemisia tridentata, are dominant on the unaltered soil type. As a physiognomic group shrubs maintain substantially higher leaf conductances than the Sierra Nevada pines over a range of predawn water potential from -0.5 to less than -5 MPa (DeLucia et al. 1988) and consequently can extract water at lower levels of availability. In deeper volcanic soils, Artemisia uses and depletes soil moisture strongly to depths of 2 m (Black and Mack 1986; Campbell and Harris 1977; Sturges 1977). For many Pinus species complete stomatal closure occurs at water potentials above -2.0 MPa (Lassoie et al. 1985; Smith 1985). Stomatal closure at relatively high values of predawn water potential in Sierra Nevada conifers reduces the demand on soil moisture reserves on altered rock.
Drought Tolerance
Drought tolerance of adjacent Great Basin and Sierra Nevada plants was assessed by two methods. The response of photosynthesis to moisture availability was determined by measuring maximum daily net photosynthetic rates as a function of predawn water potential. Measurements were made in early and late summer at several research sites differing in total annual precipitation and offering a range in predawn water potential (DeLucia and Schlesinger 1990). Measurements were also made of its maximum seasonal amplitude. In so far as predawn water potential reflects the ability of perennial plants to continue extracting soil moisture by maintaining stomatal conductance at progressively decreasing availability, its amplitude provides an index of drought tolerance.
5. Ecophysiology of Vegetation on Contrasting Soils 155
0.0 .------..--,------.---,------,---"
a:s a.. ~ -0.5 -
~ c Q) -1.0 -8. ... Q)
n; -1.5 -~ c:
~ -g -2.0 -.... a..
-2.5 2
15
12 r
III 9 r .... a:s Q) >. q) Cl 6 r ~
3 f-
0 0
00 0 (X) 0
Q
•• • • ••
•• I
10
• •
I
So 0 0 o •• 0 •• <t .. , .. ,
•
A
-
000 0 0 0 •• 0 _
• • ••• -
(0) 31 May (.) 27 July -
I
100
Height, em
I
I
1000
B 0 -
~ -/0 0
o 0 -00 0
/ -em
cb
30 60 90 Height, em
Figure 5.3. Predawn water potential of shoot-tips of Pinus ponderosa as a function of tree height (A), and the relationship between height and age (B). Measurements were made between 03:00 and 05:00 hours (solar) on the designated dates during 1987. Trees were growing on an altered site surrounded by sagebrush vegetation near Reno, Nevada. The site was gently sloping (slope: 110 ; aspect: 2150 magnetic), and soil depth ranged from 4 to 19 cm. Soil was underlain by altered grus. Following water potential measurements, several trees were cut or cored at the base for age determination.
156 E.H. DeLucia and W.H. Schlesinger
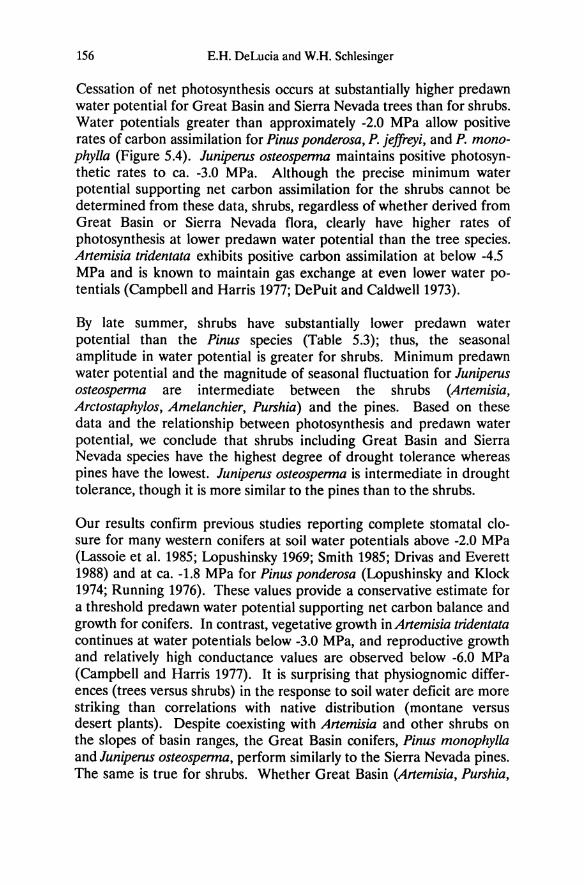
Cessation of net photosynthesis occurs at substantially higher predawn water potential for Great Basin and Sierra Nevada trees than for shrubs. Water potentials greater than approximately -2.0 MPa allow positive rates of carbon assimilation for Pinus ponderosa, P. jeffreyi, and P. monophylla (Figure 5.4). Juniperus osteosperma maintains positive photosynthetic rates to ca. -3.0 MPa. Although the precise minimum water potential supporting net carbon assimilation for the shrubs cannot be determined from these data, shrubs, regardless of whether derived from Great Basin or Sierra Nevada flora, clearly have higher rates of photosynthesis at lower predawn water potential than the tree species. Artemisia tridentata exhibits positive carbon assimilation at below -4.5 MPa and is known to maintain gas exchange at even lower water potentials (Campbell and Harris 1977; DePuit and Caldwell 1973).
By late summer, shrubs have substantially lower predawn water potential than the Pinus species (Table 5.3); thus, the seasonal amplitude in water potential is greater for shrubs. Minimum predawn water potential and the magnitude of seasonal fluctuation for Juniperus osteosperma are intermediate between the shrubs (Artemisia, Arctostaphylos, Amelanchier, Purshia) and the pines. Based on these data and the relationship between photosynthesis and predawn water potential, we conclude that shrubs including Great Basin and Sierra Nevada species have the highest degree of drought tolerance whereas pines have the lowest. Juniperus osteosperma is intermediate in drought tolerance, though it is more similar to the pines than to the shrubs.
Our results confirm previous studies reporting complete stomatal closure for many western conifers at soil water potentials above -2.0 MPa (Lassoie et al. 1985; Lopushinsky 1969; Smith 1985; Drivas and Everett 1988) and at ca. -1.8 MPa for Pinus ponderosa (Lopushinsky and Klock 1974; Running 1976). These values provide a conservative estimate for a threshold predawn water potential supporting net carbon balance and growth for conifers. In contrast, vegetative growth in Artemisia tridentata continues at water potentials below -3.0 MPa, and reproductive growth and relatively high conductance values are observed below -6.0 MPa (Campbell and Harris 1977). It is surprising that physiognomic differences (trees versus shrubs) in the response to soil water deficit are more striking than correlations with native distribution (montane versus desert plants). Despite coexisting with Artemisia and other shrubs on the slopes of basin ranges, the Great Basin conifers, Pinus monophylla and Juniperus osteosperma, perform similarly to the Sierra Nevada pines. The same is true for shrubs. Whether Great Basin (Artemisia, Purshia,
5. Ecophysiology of Vegetation on Contrasting Soils 157
20 1 1 1 /1 1 1 1 1
Amalanchier alnifo/ia /, Juniperus osteosperma
15 I- I. • -/.. I·· • ./ ~.. .
10 1- -• . , • • " • 5 • /. ... -• • ·e&
fJl 0 ,i.·.
C\J
E Arctostaphylos patula ~ Pinus monophylla C\J
/.: 0 15 - -()
(5
/ E • • ::1. 10 - /. • -<Ii •
"iii • I • a> • • - ,--5 • c 5 - • • / ->-fJl • .9 I: 0
.s::: a. 0 1il Z Artemisia tridentata Pinus jeffreyi
15 Pinus ponderosa / I- / -•
/-: t • 10 f- t-• tI· • l /' ... '-5 ke/' • • I -, ... • • .. 0 I I I I I I 1/"-1
-5 -4 -3 -2 -1 0 -4 -3 -2 -1 0
Predawn water potential, MPa
Figure 5.4. Boundary line plots of net photosynthesis versus predawn water potential for several Great Basin and Sierra Nevada shrubs and trees. Amelanclzier and Artemisia are shrubs, and Juniperus osteospenna and Pinus monophylla are trees of the Great Basin. Arctostaphylos is a shrub and Pinus ponderosa and P. jeffreyi are trees of the Sierra Nevada. Values are maximum daily photosynthetic rates expressed on a one-sided leaf area basis. Variation in predawn water potential was generated by measuring plants at several locations and at different times during the summer. It is assumed that factors other than moisture availability limit photosynthesis for those points below the boundary lines (DeLucia and Schlesinger 1990).
158 E.H. DeLucia and W.H. Schlesinger
Amelanchier) or Sierra Nevada (Arctostaphylos), shrubs have a higher degree of drought tolerance than trees. Higher drought tolerance of shrubs may be associated with a more shallow root distribution.
Given the physiological performance of the Great Basin conifers (Pinus monophylla and Juniperus osteosperma), it is unclear how these species coexist with Artemisia at higher elevations. Pinus monophylla seedlings are associated with Artemisia nurse plants during establishment (Everett et al. 1986). Nurse plants ameliorate microclimate but also compete with tree seedlings for water and nutrients (Drivas and Everett 1988). The ability of P. monophylla to survive long periods of negative carbon balance following stomatal closure induced by water stress may be a function of low growth and respiration rates. Furthermore, Great Basin trees may depend on unusually moist years for successful establishment. Relatively high values of predawn water potential in larger trees (Table 5.3) suggest that, after establishing roots at depth, competition for water between Juniperus osteosperma and Pinus monophylla and shrubs is reduced.
Water-Use Efficiency
Water-use efficiency (WUE) can be defined in ecosystem science as the ratio of net primary production to evapotranspiration and in plant physiology as the ratio of net photosynthesis to transpiration (Fischer and Turner 1978; Kramer 1983). In dry habitats, high WUEs have been observed in plants with widely different physiognomies (Field et al. 1983; Knapp and Smith 1987; Monson et al. 1986) and greater WUE in C4 plants is well established (Osmond et al. 1982). However, contrary to expectation, the less drought tolerant Sierra Nevada and Great Basin conifers have higher WUE than the more drought tolerant shrubs (DeLucia et al. 1988; DeLucia and Heckathorn 1989; DeLucia and Schlesinger 1990).
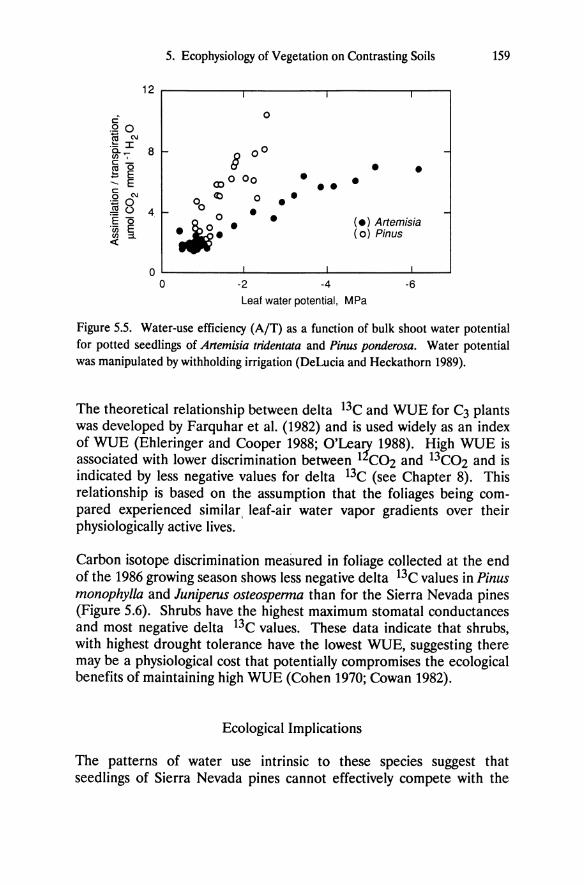
We compared WUE of Artemisia tridentata and Pinus ponderosa during a drought cycle using gas exchange techniques (DeLucia and Heckathorn 1989). The WUEs for these species are similar at high water potentials but as water potential decreases, Pinus ponderosa consistently maintains higher WUE than Artemisia tridentata (Figure 5.5). Because of difficulty interpreting instantaneous values of WUE under field conditions, we have used carbon isotope composition of foliage (expressed as delta 13e) as an index of seasonally integrated WUE (DeLucia et al. 1988).
5. Ecophysiology of Vegetation on Contrasting Soils 159
12 I I I
c: 0 .Q 0 iii C\I .!::: I
8 00 g.,";" B -
c - • ttl 0 • !:: E CD 0 00 • • ~ E •• c o C\I
00 ~ 0 •• :;:::;0
..!20 4 - • 'E (5
~: • ( .) Artemisia 'en E • (0) Pinus C/l ::1. «
0 I I I
0 -2 -4 -6
Leaf water potential, MPa
Figure 5.5. Water-use efficiency (AfT) as a function of bulk shoot water potential for potted seedlings of Artemisia tridentata and Pinus ponderosa. Water potential was manipulated by withholding irrigation (DeLucia and Heckathorn 1989).
The theoretical relationship between delta 13C and WUE for C3 plants was developed by Farquhar et al. (1982) and is used widely as an index of WUE (Ehleringer and Cooper 1988; O'Lea7, 1988). High WUE is associated with lower discrimination between 1 C02 and 13C02 and is indicated by less negative values for delta 13C (see Chapter 8). This relationship is based on the assumption that the foliages being compared experienced similar, leaf-air water vapor gradients over their physiologically active lives.
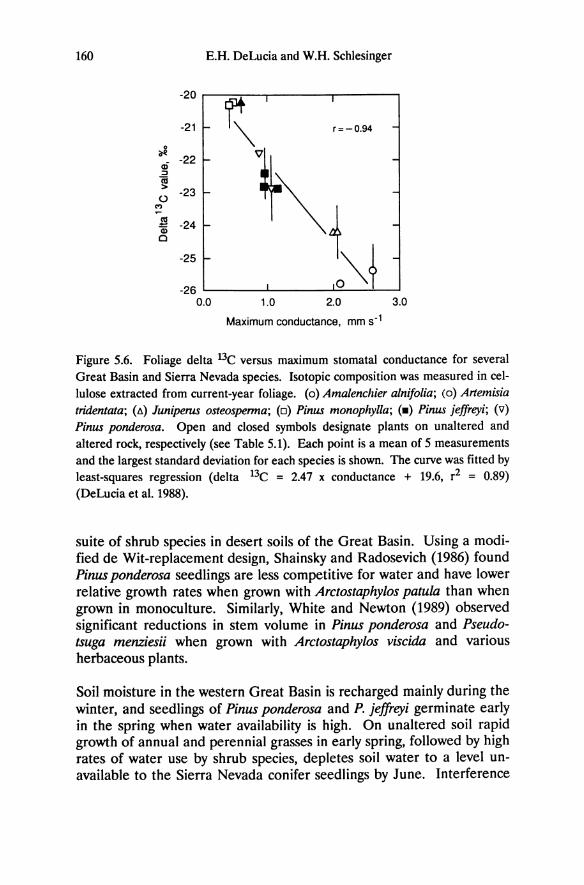
Carbon isotope discrimination measured in foliage collected at the end of the 1986 growing season shows less negative delta 13C values in Pinus monophylla and Juniperus osteosperma than for the Sierra Nevada pines (Figure 5.6). Shrubs have the highest maximum stomatal conductances and most negative delta 13C values. These data indicate that shrubs, with highest drought tolerance have the lowest WUE, suggesting there may be a physiological cost that potentially compromises the ecological benefits of maintaining high WUE (Cohen 1970; Cowan 1982).
Ecological Implications
The patterns of water use intrinsic to these species suggest that seedlings of Sierra Nevada pines cannot effectively compete with the
160
~ cD ::> "iii > ()
~ .l!! CD 0
E.H. DeLucia and W.H. Schlesinger
-20
-21 f-
-22 f-
-23 f-
-24 f-
-25 f-
-26 0.0
~I I
"'" r=-O.94 -
-
-
-
o"'~ -
I
1.0 2.0 3.0
Maximum conductance, mm s·l
Figure 5.6. Foliage delta 13C versus maximum stomatal conductance for several
Great Basin and Sierra Nevada species. Isotopic composition was measured in cellulose extracted from current-year foliage. (0) Amalenchier alnifolia; (0) Artemisia tridentata; (~) Juniperus osteosperma; (0) Pinus monophylla; (_) Pinus jeffreyi; (v) Pinus ponderosa. Open and closed symbols designate plants on unaltered and
altered rock, respectively (see Table 5.1). Each point is a mean of 5 measurements and the largest standard deviation for each species is shown. The curve was fitted by least-squares regression (delta 13C = 2.47 x conductance + 19.6, r2 = 0.89) (DeLucia et al. 1988).
suite of shrub species in desert soils of the Great Basin. Using a modified de Wit-replacement design, Shainsky and Radosevich (1986) found Pinus ponderosa seedlings are less competitive for water and have lower relative growth rates when grown with Arctostaphylos patula than when grown in monoculture. Similarly, White and Newton (1989) observed significant reductions in stem volume in Pinus ponderosa and Pseudotsuga menzies;; when grown with Arctostaphylos viscida and various herbaceous plants.
Soil moisture in the western Great Basin is recharged mainly during the winter, and seedlings of Pinus ponderosa and P. jeffrey; germinate early in the spring when water availability is high. On unaltered soil rapid growth of annual and perennial grasses in early spring, followed by high rates of water use by shrub species, depletes soil water to a level unavailable to the Sierra Nevada conifer seedlings by June. Interference
5. Ecopbysiology of Vegetation on Contrasting Soils 161
from the grass Calamagrostis rubeseens causes substantial growth reductions in P. ponderosa seedlings, as well as enhancing small size classes in the population structure of tree seedlings (Petersen 1988). In addition to increasing the frequency of fire in sagebrush steppe (Billings pers. comm.), the introduced annual Bromus teetorum also may alter significantly the patterns of seedling establishment by exploiting surface moisture reserves early in the season. Rapid depletion of surface soil moisture by Bromus lrin;; plays a similar important role in restricting the establishment of evergreen chaparral species in adjacent grasslands in southern California (Davis and Mooney 1985). Stands of Pinus ponderosa and P. jeffreyi appear to be excluded from adjacent sagebrush steppe on brown unaltered soils by competition for water.
Nutrient Relations
Few Great Basin plants occur on soil derived from altered rock, and Sierra Nevada plants thus persist in an exceptionally dry climate without competition for water with the more drought tolerant Great Basin shrubs. The question remains: why are Great Basin plants excluded from soils derived from altered rock? Schlesinger et al. (1989) proposed that as a result of evolution in a region characterized by circumneutral soils of relatively high nutrient content, Great Basin vegetation is intolerant of the low nutrient and acidic conditions of altered substrate. Dominant Great Basin and Sierra Nevada plants share two life history traits of stress tolerant plants (Grime 1979); they are long-lived woody perennials that range from evergreen to semi-deciduous. It seems, however, that physiological adaptations to drought may be disadvantageous in low nutrient situations and vice versa. Other studies have reported a physiological compromise between nutrient and water utilization in evergreen shrubs. Field et al. (1983) found that instantaneous values of water-use efficiency and nitrogen-use efficiency were inversely correlated for several chaparral species. Sierra Nevada "tree islands" provide an opportunity to compare nutrient use in adjacent Great Basin and Sierra Nevada plants.
Foliar Nutrients and Nutrient Amendments
The most pronounced differences in chemistry for soils derived from altered and adjacent unaltered andesite are low pH, phosphorus, and
162 E.H. DeLucia and W.H. Schlesinger
base cations in altered soils (Schlesinger et al. 1989). In a similar situation in the Sierra Madre of northwestern Mexico, Goldberg (1985) found that seedlings of the deciduous tree Lysiloma divaricata survive on altered soil only when pH was increased by the addition of CaC03. The biological effect of raising pH was probably related to an increase in the availability of phosphorus. Billings (1950) reported the appearance of phosphorus-deficiency symptoms in agronomic species grown in altered soils. These studies suggest that, in addition to drought tolerance, the ability to acquire phosphorus plays a fundamental role in ecologically differentiating dominant Great Basin and Sierra Nevada plants.
In examining the foliage nutrient contents from field-collected tissue, Schlesinger et al. (1989) found that for the same species growing on both soil types, mean foliar concentrations of nitrogen, phosphorus, and calcium are consistently lower for plants growing on altered rock, although differences are generally small. Pronounced differences in foliar nutrient contents between species are evident. The Sierra Nevada and Great Basin conifers have relatively low tissue nitrogen and phosphorus, and high specific leaf mass compared to the shrubs (Figures 5.7 and 5.8). The Sierra Nevada shrub Arctostaphylos patula is an exception. Although this species has a relatively broad flat leaf, it is extremely sclerophyllous and has physical and chemical properties similar to conifers. Low tissue nutrient contents and high specific leaf mass are characteristic of the long-lived foliage produced by many conifers and presumably represent an adaptation to low nutrient conditions (Chabot and Hicks 1982). In evergreens this response may maximize net carbon gain per unit of foliar nutrient content over the life of the leaf (Orians and Solbrig 1977, Schlesinger and Chabot 1977).
Results from nutrient amendment experiments support the inference that phosphorus is the primary limitation to plant growth on altered rock. When provided with a complete fertilizer, agronomic species grew as well on altered soil as in a fertilized inert medium (Billings 1950). However, withholding phosphorus and nitrogen from the fertilizer caused approximately 98 and 81 % reductions in final biomass, respectively. In similar experiments conducted with native species grown under controlled conditions, the response to nutrient additions and soil type was highly species specific (DeLucia et al. 1989).
Total biomass for Pinus monophylla, P. ponderosa, and P. jeffreyi is 10 to 28% lower when grown in altered soil. This compares with greater than 90% reductions for Artemisia tridentata and Bromus tectorum (DeLucia
5. Ecophysiology of Vegetation on Contrasting Soils 163
0.10 I I I
";-01
0.08 !::,-!::,-
- !::,!::,
0 E E 0.06 -
I· 0 -
iii • :::l (;
0 .r= 0.04 -
il,,~ -c.
C/)
0 .r= • a..
0.02 - -
0.00 I I I
0.0 0.5 1.0 1.5 2.0
Nitrogen, mmol g-l
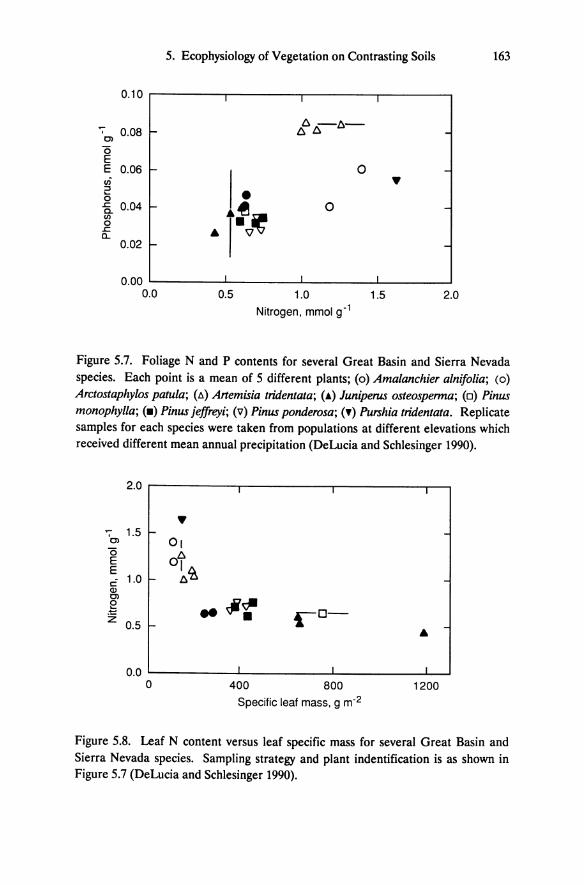
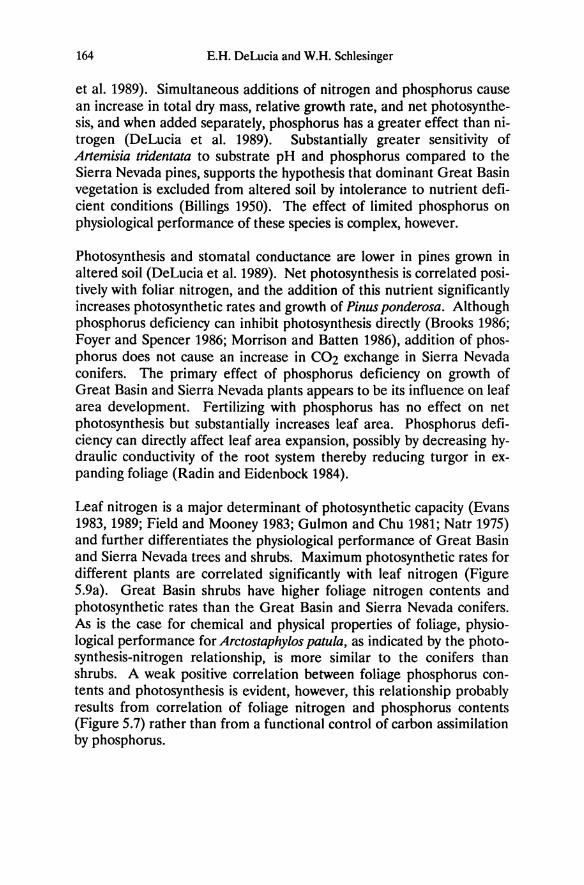
Figure 5.7. Foliage Nand P contents for several Great Basin and Sierra Nevada species. Each point is a mean of 5 different plants; (0) Amalanchier alnifolia; (0)
Arctostaphylos patula; (A) Artemisia tridentata; (~) Juniperus osteosperma; (0) Pinus monophylla; (_) Pinus jeffreyi; (\7) Pinus ponderosa; (.) Purshia tridentata. Replicate samples for each species were taken from populations at different elevations which received different mean annual precipitation (DeLucia and Schlesinger 1990).
2.0 I I I
• ";- 1.5 -
01 01 0
O!::, E E ~~ c: 1.0 I-Q) 01 .. ~: ~ ,0-Z 0.5 l- • -
0.0 I I I
0 400 800 1200
Specific leaf mass, g m-2
Figure 5.8. Leaf N content versus leaf specific mass for several Great Basin and Sierra Nevada species. Sampling strategy and plant indentification is as shown in Figure 5.7 (DeLucia and Schlesinger 1990).
164 E.H. DeLucia and W.H. Schlesinger
et al. 1989). Simultaneous additions of nitrogen and phosphorus cause an increase in total dry mass, relative growth rate, and net photosynthesis, and when added separately, phosphorus has a greater effect than nitrogen (DeLucia et al. 1989). Substantially greater sensitivity of Artemisia tridentata to substrate pH and phosphorus compared to the Sierra Nevada pines, supports the hypothesis that dominant Great Basin vegetation is excluded from altered soil by intolerance to nutrient deficient conditions (Billings 1950). The effect of limited phosphorus on physiological performance of these species is complex, however.
Photosynthesis and stomatal conductance are lower in pines grown in altered soil (DeLucia et al. 1989). Net photosynthesis is correlated positively with foliar nitrogen, and the addition of this nutrient significantly increases photosynthetic rates and growth of Pinus ponderosa. Although phosphorus deficiency can inhibit photosynthesis directly (Brooks 1986; Foyer and Spencer 1986; Morrison and Batten 1986), addition of phosphorus does not cause an increase in C02 exchange in Sierra Nevada conifers. The primary effect of phosphorus deficiency on growth of Great Basin and Sierra Nevada plants appears to be its influence on leaf area development. Fertilizing with phosphorus has no effect on net photosynthesis but substantially increases leaf area. Phosphorus deficiency can directly affect leaf area expansion, possibly by decreasing hydraulic conductivity of the root system thereby reducing turgor in expanding foliage (Radin and Eidenbock 1984).
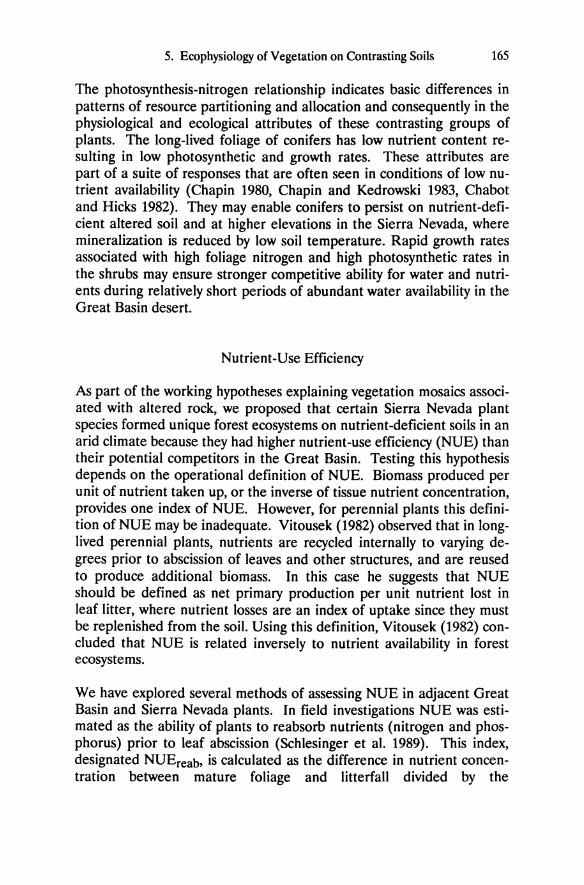
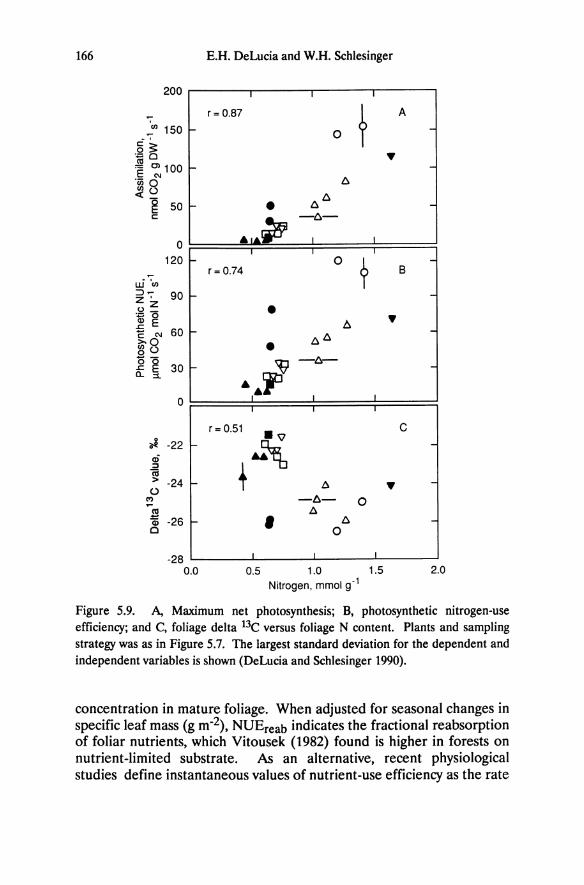
Leaf nitrogen is a major determinant of photosynthetic capacity (Evans 1983, 1989; Field and Mooney 1983; Gulmon and Chu 1981; Natr 1975) and further differentiates the physiological performance of Great Basin and Sierra Nevada trees and shrubs. Maximum photosynthetic rates for different plants are correlated significantly with leaf nitrogen (Figure 5.9a). Great Basin shrubs have higher foliage nitrogen contents and photosynthetic rates than the Great Basin and Sierra Nevada conifers. As is the case for chemical and physical properties of foliage, physiological performance for Arctostaphylos patula, as indicated by the photosynthesis-nitrogen relationship, is more similar to the conifers than shrubs. A weak positive correlation between foliage phosphorus contents and photosynthesis is evident, however, this relationship probably results from correlation of foliage nitrogen and phosphorus contents (Figure 5.7) rather than from a functional control of carbon assimilation by phosphorus.
5. Ecophysiology of Vegetation on Contrasting Soils 165
The photosynthesis-nitrogen relationship indicates basic differences in patterns of resource partitioning and allocation and consequently in the physiological and ecological attributes of these contrasting groups of plants. The long-lived foliage of conifers has low nutrient content resulting in low photosynthetic and growth rates. These attributes are part of a suite of responses that are often seen in conditions of low nutrient availability (Chapin 1980, Chapin and Kedrowski 1983, Chabot and Hicks 1982). They may enable conifers to persist on nutrient-deficient altered soil and at higher elevations in the Sierra Nevada, where mineralization is reduced by low soil temperature. Rapid growth rates associated with high foliage nitrogen and high photosynthetic rates in the shrubs may ensure stronger competitive ability for water and nutrients during relatively short periods of abundant water availability in the Great Basin desert.
Nutrient-Use Efficiency
As part of the working hypotheses explaining vegetation mosaics associated with altered rock, we proposed that certain Sierra Nevada plant species formed unique forest ecosystems on nutrient-deficient soils in an arid climate because they had higher nutrient-use efficiency (NUE) than their potential competitors in the Great Basin. Testing this hypothesis depends on the operational definition of NUE. Biomass produced per unit of nutrient taken up, or the inverse of tissue nutrient concentration, provides one index of NUE. However, for perennial plants this definition of NUE may be inadequate. Vitousek (1982) observed that in longlived perennial plants, nutrients are recycled internally to varying degrees prior to abscission of leaves and other structures, and are reused to produce additional biomass. In this case he suggests that NUE should be defined as net primary production per unit nutrient lost in leaf litter, where nutrient losses are an index of uptake since they must be replenished from the soil. Using this definition, Vitousek (1982) concluded that NUE is related inversely to nutrient availability in forest ecosystems.
We have explored several methods of assessing NUE in adjacent Great Basin and Sierra Nevada plants. In field investigations NUE was estimated as the ability of plants to reabsorb nutrients (nitrogen and phosphorus) prior to leaf abscission (Schlesinger et al. 1989). This index, designated NUEreab, is calculated as the difference in nutrient concentration between mature foliage and Iitterfall divided by the
166
200
~(J) 150 f-
5"3: . ~ 0 = Ol 100 E C\I
f-
'inQ (J)U «-
~ c:
W' (J) :J~ z' .2 ~ Q5 0
.s::: E - C\I ~Q :gU
~g a.. ::1.
~ cD ::::I "iii > U
C')
as ~ 0
50 f-
0 120 f-
90 f-
60 f-
30
0
-22 f-
-24 f-
-26 f-
-28 0.0
E.H. DeLucia and W.H. Schlesinger
I I I
r= 0.87
? A
0 -
.. -
6
• 66 -
.IA~ -6-
I I
T T 0
~ -
r = 0.74 B
-•
6 ..
-
• 66
%I -fro-.. ~ I I I
r=0.51 • C .. ~ -
+ 6 .. --6- 0
6 , 6 -0
I I
0.5 1.0 1.5 2.0 Nitrogen, mmol g-1
Figure 5.9. A, Maximum net photosynthesis; B, photosynthetic nitrogen-use efficiency; and e, foliage delta 13e versus foliage N content. Plants and sampling strategy was as in Figure 5.7. The largest standard deviation for the dependent and independent variables is shown (DeLucia and Schlesinger 1990).
concentration in mature foliage. When adjusted for seasonal changes in specific leaf mass (g m-2), NUEreab indicates the fractional reabsorption of foliar nutrients, which Vitousek (1982) found is higher in forests on nutrient-limited substrate. As an alternative, recent physiological studies define instantaneous values of nutrient-use efficiency as the rate
5. Ecophysiology of Vegetation on Contrasting Soils 167
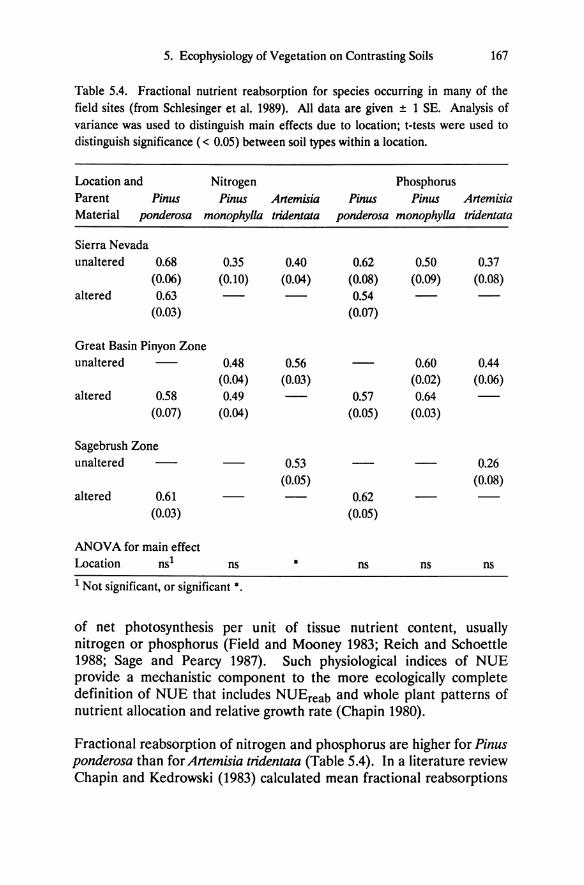
Table 5.4. Fractional nutrient reabsorption for species occurring in many of the field sites (from Schlesinger et al. 1989). All data are given ± 1 SE. Analysis of variance was used to distinguish main effects due to location; t-tests were used to distinguish significance « 0.05) between soil types within a location.
Location and Nitrogen Phosphorus Parent Pinus Pinus Artemisia Pinus Pinus Artemisia Material ponderosa monophyl/a tridentata ponderosa monophylla tridentata
Sierra Nevada unaltered 0.68 0.35 0.40 0.62 0.50 0.37
(0.06) (0.10) (0.04) (0.08) (0.09) (0.08) altered 0.63 0.54
(0.03) (0.07)
Great Basin Pinyon Zone unaltered 0.48 0.56 0.60 0.44
(0.04) (0.03) (0.02) (0.06) altered 0.58 0.49 0.57 0.64
(0.07) (0.04) (0.05) (0.03)
Sagebrush Zone unaltered 0.53 0.26
(0.05) (0.08) altered 0.61 0.62
(0.03) (0.05)
ANOV A for main effect Location nst ns • ns ns ns
t Not significant, or significant •.
of net photosynthesis per unit of tissue nutrient content, usually nitrogen or phosphorus (Field and Mooney 1983; Reich and Schoettle 1988; Sage and Pearcy 1987). Such physiological indices of NUE provide a mechanistic component to the more ecologically complete definition of NUE that includes NUEreab and whole plant patterns of nutrient allocation and relative growth rate (Chapin 1980).
Fractional reabsorption of nitrogen and phosphorus are higher for Pinus ponderosa than for Artemisia tridentala (Table 5.4). In a literature review Chapin and Kedrowski (1983) calculated mean fractional reabsorptions
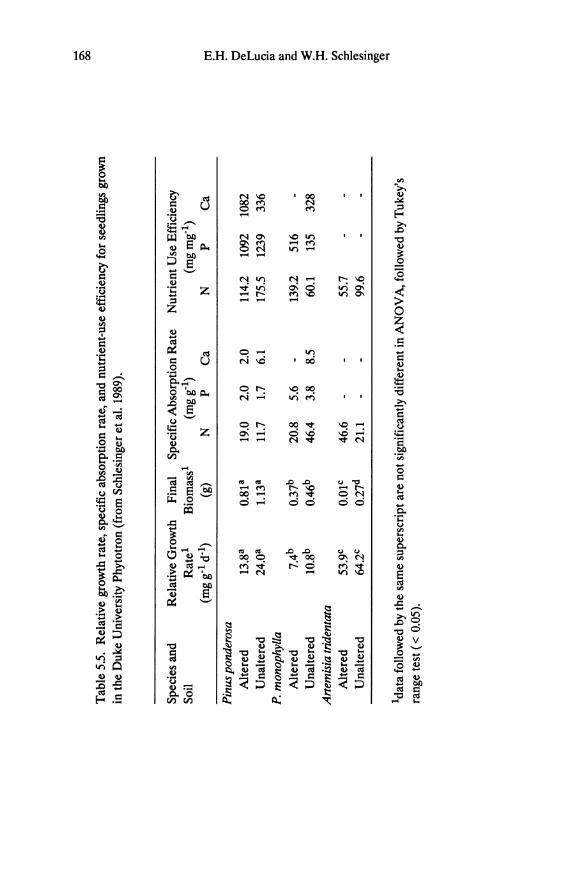
Tab
le 5
.5.
Rel
ativ
e gr
owth
rat
e, s
peci
fic
abso
rpti
on r
ate,
and
nut
rien
t-us
e ef
fici
ency
for
see
dlin
gs g
row
n in
the
Duk
e U
nive
rsit
y P
hyto
tron
(fr
om S
chle
sing
er e
t al.
1989
).
Spe
cies
and
R
elat
ive
Gro
wth
F
inal
Sp
ecif
ic A
bsor
ptio
n R
ate
Nut
rien
t Use
Eff
icie
ncy
Soil
Rat
el
Bio
mas
sl
(mgg
-l)
(mg
mg-
l )
(mg
g-l d
-l)
(g)
N
P C
a N
P
Ca
Pin
us p
onde
rosa
A
lter
ed
13.8
a 0.
81a
19.0
2.
0 2.
0 11
4.2
1092
10
82
Una
lter
ed
24.0
a 1.
13a
11.7
1.
7 6.
1 17
5.5
1239
33
6 P.
mon
ophy
lla
Alt
ered
7.
4b
0.37
b 20
.8
5.6
139.
2 51
6 U
nalt
ered
1O
.8b
0.46
b 46
.4
3.8
8.5
60.1
13
5 32
8 A
rtem
isia
trid
enta
ta
Alt
ered
53
.9c
O.0
1c
46.6
55
.7
Una
lter
ed
64.2
c 0.
27d
21.1
99
.6
ldat
a fo
llow
ed b
y th
e sa
me
supe
rscr
ipt a
re n
ot s
igni
fica
ntly
dif
fere
nt in
AN
DV
A, f
ollo
wed
by
Tuk
ey's
ra
nge
test
« 0
.05)
.
.....
&l
ttl ;:c 0 n b S- II>
::I
0- ~
?= en
g. n '" ~ . ...
5. Ecophysiology of Vegetation on Contrasting Soils 169
of 0.52 for nitrogen and 0.43 for phosphorus. Pinus ponderosa is generally higher and Artemisia tridentata lower than these mean values. However, among P. ponderosa occurring in different habitats there is no indication of greater NUEreab in the low nutrient soils on altered bedrock. Similarly, Birk and Vitousek (1986) found little acclimation in NUEreab among P. taeda occurring along a nitrogen fertility gradient, and limited acclimation in NUEreab is seen in other species of Great Basin and Sierra Nevada trees and shrubs (Schlesinger et al. 1989).
There are no consistent trends in specific absorption rate (mg nutrient in plantjg root dry weight) of nitrogen or phosphorus for seedlings of Pinus ponderosa, P. monophylla, and Artemisia tridentata grown under controlled growth chamber conditions (Table 5.5). However, growth based nutrient-use efficiency for nitrogen is consistently higher for the two pines than for Artemisia tridentata. Conifers generally show higher reabsorption efficiency than broad-leaf species (Vitousek 1982; Waring and Schlesinger 1985). It seems that evolution in soils with relatively high available phosphorus has not selected for high nutrient reabsorption efficiency in desert shrubs, although Artemisia shows specialized mechanisms to enhance phosphorus uptake in calcareous soils (Jurinak et al. 1986).
A very different picture emerges when Great Basin and Sierra Nevada plants are compared using a physiological index of nutrient-use efficiency based on photosynthetic nitrogen-use efficiency (NUEps) (DeLucia and Schlesinger 1990). NUEps for different species is correlated positively with foliage nitrogen contents (Figure 5.9b). Compared to the shrubs, Sierra Nevada and Great Basin conifers have low foliage nitrogen and NUEps. Purshia tridentata, a nitrogen fixing species (Virginia and Delwiche 1982), has the highest foliage nitrogen and Amelanchier alnifolia the highest NUEps' Although Arctostaphylos patula has nitrogen contents similar to the conifers, this species has values of NUEps similar to the shrubs (Figure 5.10b). There is no consistent relationship between photosynthetic phosphorus-use efficiency and phosphorus contents. However, high foliage phosphorus and low photosynthetic phosphorus-use efficiency for Artemisia tridentata may be ecologically significant in that they suggest a high phosphorus requirement for this species.
170 E.H. DeLucia and W.H. Schlesinger
Ecological Implications
Reich and Schoettle (1988) found a strong correlation between instantaneous photosynthetic measurements of NUE and growth estimates of NUE for Pinus strobus grown under a variety of climatic and edaphic conditions,. Our data suggest high NUEps in shrubs of the Great Basin Desert, whereas data for NUEreab and growth per unit nutrient uptake suggest the opposite. This raises questions about the relative merits of these indices and their ecological interpretation. A complication arises in interspecific comparisons of instantaneous measurements of NUE for plants with different leaf durations. In the case of evergreen foliage, an appropriate index of NUE should include carbon fixed per unit nitrogen or phosphorus over the life of the leaf to accommodate use of reabsorbed nutrients (Vitousek 1982). Assuming the nutrient content and growth based estimates of NUE provide a more complete ecological assessment of nutrient use, our data support the hypothesis of greater tolerance to low nutrient conditions in Sierra Nevada vegetation.
The physiologically based indices of NUE are not without merit since they provide a means of examining allocation and utilization of nitrogen and other nutrients at the functional level of the leaf. NUEps is one of many components determining patterns of whole plant nutrient use. For species shown in Figure 5.9b there is a positive relationship between NUEps and foliage nitrogen, as reported by Field and Mooney (1986) in a survey of 21 species ranging from desert annuals to evergreen trees and shrubs. This relationship illustrates the functional dependence of photosynthesis on nitrogen content and partitioning and leaf structure (Evans 1989).
Shrubs, with the possible exception of Arctostaphylos patula, probably invest a high proportion of leaf nitrogen in various components of the photosynthetic apparatus enabling these species to maintain high maximum photosynthetic rates and NUEps. In contrast, sclerophyllous conifer foliage has high specific leaf mass, and low nitrogen, low NUEps and low maximum photosynthetic rates. Field and Mooney (1986) proposed that a high proportion of leaf nitrogen is invested in non-photosynthetic components in sclerophyllous leaves- components perhaps necessary for leaf longevity. Medina (cited in Field and Mooney 1986) suggested that low NUEps in this type of foliage results from high mesophyll resistance to COz diffusion associated with relatively impermeable cell walls. However, less negative delta 13C values (Figure 5.9c) and relatively steep slopes for the photosynthesis versus conductance
5. Ecophysiology of Vegetation on Contrasting Soils 171
relationship in conifers (DeLucia unpublished) indicate that stomatal limitations predominate for conifers. Various attributes of dominant Sierra Nevada trees, including leaf longevity, slow relative growth rates, and high NUE in growth, support the hypothesis that Sierra Nevada trees are better adapted to low nutrient conditions than shrubs.
Physiognomic Relationships
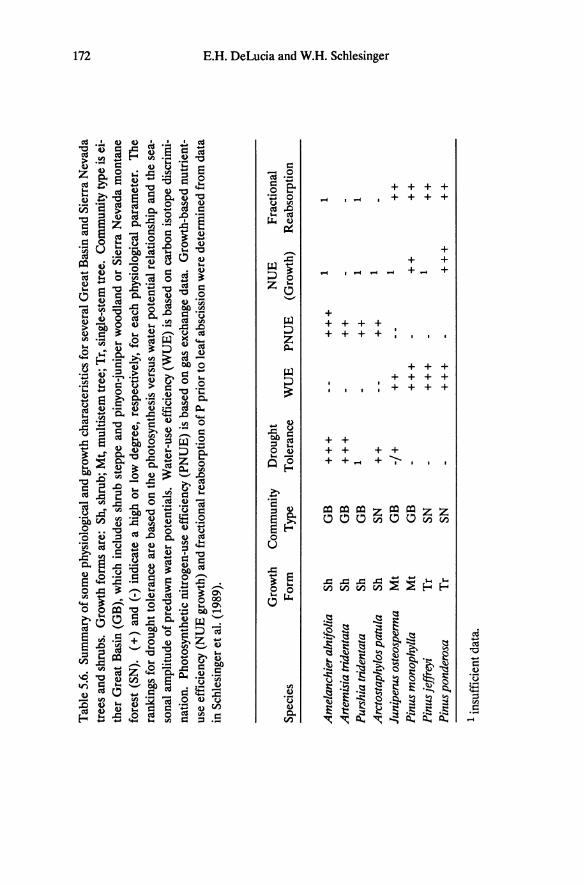
As a physiognomic group Great Basin and Sierra Nevada shrubs possess many physiological characteristics that distinguish them from trees. Shrubs examined here have a higher degree of drought tolerance and lower WUE than trees (Table 5.6), and, with the exception of Arctostaphylos patula, shrubs also possess higher foliage nutrient contents and NUEps. When gas exchange parameters are calculated on a projected leaf area basis, the maximum values for leaf conductance and rates of net photosynthesis are higher for shrubs than for the trees (DeLucia et al. 1988).
Fisher and Turner (1978) proposed that in dry habitats natural selection should favor plants with high WUE. The opposite appears to be the case for dominant Great Basin and Sierra Nevada plants; low WUE is associated with drought tolerance in the shrubs (Table 5.6) suggesting a possible ecological cost associated with the maintenance of high WUE (Cohen 1970, Cowan 1982). Because of the non-linear relationship between photosynthesis and transpiration (Cowan 1982, Raschke 1979) and the additional resistances to diffusion of C02 associated with the mesophyll (Nobel 1983), stomatal closure causes a proportionately greater decrease in transpiration than photosynthesis thereby increasing WUE. High WUE for trees is maintained by operating at low seasonal conductances. However, this also reduces absolute net photosynthetic rates therefore reducing growth and possibly competitive ability. High WUE also can be achieved by increasing the intrinsic photosynthetic capacity at low leaf nitrogen as illustrated by C4 photosynthesis. Increasing photosynthetic capacity in C3 plants often involves an increase in nitrogen allocation to photosynthetic enzymes, which, depending on the nature of the photosynthesis-nitrogen relationship, may decrease nitrogen-use efficiency (Field and Mooney 1986).
The relationship between low WUE and drought tolerance in shrubs raises several questions regarding the ecological significance of WUE.
Tab
le 5
.6.
Sum
mar
y of
som
e ph
ysio
logi
cal a
nd g
row
th c
hara
cter
isti
cs f
or s
ever
al G
reat
Bas
in a
nd S
ierr
a N
evad
a tr
ees
and
shru
bs.
Gro
wth
for
ms
are:
Sh,
shr
ub;
Mt,
mul
tist
em tr
ee;
Tr,
sin
gle-
stem
tree
. C
omm
unit
y ty
pe is
ei
ther
Gre
at B
asin
(G
B),
whi
ch i
nclu
des
shru
b st
eppe
and
pin
yon-
juni
per
woo
dlan
d or
Sie
rra
Nev
ada
mon
tane
fo
rest
(SN
). (+
) an
d (-
) in
dica
te a
hig
h or
low
deg
ree,
res
pect
ivel
y, f
or e
ach
phys
iolo
gica
l pa
ram
eter
. T
he
rank
ings
for
dro
ught
tol
eran
ce a
re b
ased
on
the
phot
osyn
thes
is v
ersu
s w
ater
pot
enti
al r
elat
ions
hip
and
the
sea
sona
l am
plit
ude
of p
reda
wn
wat
er p
oten
tial
s.
Wat
er-u
se e
ffic
ienc
y (W
UE
) is
bas
ed o
n ca
rbon
isot
ope
disc
rim
ina
tion
. Ph
otos
ynth
etic
nit
roge
n-us
e ef
fici
ency
(P
NU
E)
is b
ased
on
gas
exch
ange
dat
a.
Gro
wth
-bas
ed n
utri
ent
use
effi
cien
cy (
NU
E g
row
th)
and
frac
tion
al r
eabs
orpt
ion
of P
pri
or to
leaf
abs
ciss
ion
wer
e de
term
ined
fro
m d
ata
in S
chle
sing
er e
t al.
(198
9).
Gro
wth
C
omm
unity
D
roug
ht
NU
E
Fra
ctio
nal
Spec
ies
For
m
Typ
e T
oler
ance
W
UE
P
NU
E
(Gro
wth
) R
eabs
orpt
ion
Am
elan
chie
r aln
ifolia
Sh
G
B
++
+
++
+
1 1
Art
emis
ia tr
iden
tata
Sh
G
B
++
+
++
P
ursh
ia tr
iden
tata
S
h G
B
1 +
+
1 1
Arc
tost
aphy
los p
atul
a Sh
SN
+
+
++
1
Juni
peru
s os
teos
perm
a M
t G
B
-/+
+
+
1 +
+
Pin
us m
onop
hylla
M
t G
B
++
+
++
+
+
Pin
us je
ffrey
i T
r SN
+
++
1
++
P
inus
pon
dero
sa
Tr
SN
++
+
++
+
++
1 in
suff
icie
nt d
ata.
.....
td rn ;t ~ 2· ~ ~ ;z: f ~. ...
5. Ecophysiology of Vegetation on Contrasting Soils 173
Given the potential costs of maintaining high WUE, namely lower rates of photosynthesis and growth, Cohen (1970) argues that selection for high WUE would be advantageous only if conserved soil moisture is available for uptake later in the season. Although Arlemisia tridentala can develop root systems up to 2 m deep, a high proportion of its roots are in the upper 0.5 m where there is intense competition with grasses and other shrubs for water (Caldwell et al. 1985; Campell and Harris 1977; Eissenstat and Caldwell 1988; Sturges 1977). It is therefore unlikely that surface moisture conserved by Arlemisia would be available later in the growing season. Instead, moisture would be lost by evaporation or to a competitor. The relatively small magnitude of seasonal change in predawn water potential for mature pines suggests that these species are deeply rooted and largely free of competition for water with the shallow-rooted shrub species. Under these conditions conservative use of water (high WUE) would lengthen the period favorable for net carbon assimilation and more closely match growth with low rates of nutrient availability on nutrient-poor sites (Chapin 1980).
In our studies plants with high WUE have low physiologically based NUEps. However, WUE is positively correlated with growth based measurements of NUE such as fractional reabsorption from senescing tissue and the ratio of biomass production to nutrient content (Table 5.6). Field et al. (1983) suggest an inverse relationship between WUE and NUEps for several evergreen species that have different degrees of drought tolerance. This tradeoff is based on the relationship of WUE and NUEps to intercellular C02 concentration (Ci); as Cj increases WUE decreases and NUEps increases (Field et al. 1983). The balance between WUE and NUEps probably represents a functional compromise between maximizing net photosynthesis (high leaf N, high conductances, low specific leaf mass) and physiological and morphological adaptations to drought (low leaf N, low conductances, high specific leaf mass) (Orians and Solbrig 1977), rather than a compromise between nutrient and water acquisition per se. For Sierra Nevada trees high WUE, high growth-based NUE, and relatively low growth rates represent adaptations to low nutrient availability. In this case high WUE represents a conservative ecophysiological strategy that is detrimental under conditions of intense competition for water. For more shallowly rooted shrubs, the combination of an "exploitive" use of water (low WUE) and high degree of drought tolerance is a successful combination of physiological characteristics in water-limited but relatively high nutrient habitats.
174 E.H. DeLucia and W.H. Schlesinger
Acknowledgements
We thank JL Nachlinger, WT Peterjohn, SM Billings, and SA Heckathorn for assistance with fieldwork and the Desert Research Institute, Reno, Nevada, for providing logistical support. This project was funded by NSF grant BRS 85-04859 (Ecology Program) to WD Billings and WH Schlesinger. Additional support was provided by a USDA Competitive Research Grant (Forest Biology Program) and a University of Illinois Research Board grant to EH DeLucia.
References
Barbour MG (1988) California upland forest. pp. 131-164. In Barbour MG and Billings WD (editors) North American Terrestrial Vegetation. Cambridge Univ. Press, NY.
Billings WD (1950) Vegetation and plant growth as affected by chemically altered rocks in the western Great Basin. Ecology 31:62-74.
Birk EM and Vitousek PM (1986) Nitrogen availability and nitrogen use efficiency in loblolly pine stands. Ecology 67:69-79.
Black RA and Mack RN (1986) Mount St. Helens ash: recreating its effects on the steppe environment and ecophysiology. Ecology 67:1289-1302.
Branson FA, Miller RF, and McQueen IS (1976) Moisture relationships in twelve northern desert shrub communities near Grand Junction, Colorado. Ecology 57:1104-1124.
Brooks A (1986) Effects of phosphorus nutrition on ribulose-l,5-bisphosphate carboxylase activation, photosynthetic quantum yield and amounts of some Calvin cycle metabolites in spinach leaves. Aust. J. Plant Physiol. 13:221-237.
Caldwell MM, Eissenstat OM, Richards JH, and Allen MF (1985) Competition for phosphorus: Differential uptake from dual-isotope-labeled soil interspaces between shrub and grass. Science 229:384-386.
Calkins FC (1944) Outline of the geology of the Comstock Lode district, Nevada. 35 pp. US Geological Survey Washington, DC.
Campbell GA and Harris GA (1977) Water relations and water use patterns for Artemisia tridentata Nutt. in wet and dry years. Ecology 58:652-659.
Chabot BF and Hicks OJ (1982) The ecology of leaf life spans. Ann. Rev. Ecol. Sys. 13:229-259.
Chapin III FS (1980) The mineral nutrition of wild plants. Ann. Rev. Ecol. Sys. 11:233-260.
5. Ecophysiology of Vegetation on Contrasting Soils 175
Chapin III FS and Kedrowski RA (1983) Seasonal changes in nitrogen and phosphorus fractions and autumn retranslocation in evergreen and deciduous taiga trees. Ecology 64:376-391.
Cohen D (1970) The expected efficiency of water utilization in plants under different competition and selection regimes. Israel J. Bot. 19:50-54.
Cowan IR (1982) Regulation of water use in relation to carbon gain in higher plants. pp. 589-613. In Lange OL, Nobel PS, Osmond CB, and Ziegler H (editors) Physiological Plant Ecology II: Water Relations and Carbon Assimilation. Encyclopedia of Plant Physiology (New Series), Vol. 12B. Springer-Verlag, Heidelberg.
Davis SD and Mooney HA (1985) Comparative water relations of adjacent California shrub and grassland communities. Oecologia 66:522-529.
DeLucia EH and Heckathorn SA (1989) The effect of soil drought on water-use efficiency in contrasting Great Basin desert and Sierran montane species. Plant Cell Environ. 12:935-940.
DeLucia EH and Schlesinger WH (1990) Water-use efficiency and drought tolerance in adjacent Great Basin and Sierran plants. Ecology, in press.
DeLucia EH, Schlesinger WH, and Billings WD (1988) Water relations and the maintenance of Sierran conifers on hydrothermally altered rock. Ecology 69:303-311.
DeLucia EH, Schlesinger WH, and Billings WD (1989) Edaphic limitations to growth and photosynthesis in Sierran and Great Basin vegetation. Oecologia 78:184-190.
DePuit EJ and Caldwell MM (1973) Seasonal pattern of net photosynthesis of Artemisia tridentata. Amer. J. Bot. 60:426-435.
Drivas EP and Evertt RL (1988) Water relations characteristics of competing singleleafpinyon seedlings and sagebrush nurse plants. For. Ecol. Manag. 23:27-37.
Ehleringer JR and Cooper TA (1988) Correlations between carbon isotope ratio and microhabitat in desert plants. Oecologia 76:562-566.
Eissenstat DM and Caldwell MM (1988) Competitive ability is linked to rates ofwater extraction: a field study of two aridland tussock grasses. Oecologia 75: 1-7.
Evans JR (1983) Nitrogen and photosynthesis in the flag leaf of wheat (Triticum aestivum L.). Plant Physiol. 72:297-302.
Evans JR (1989) Photosynthesis and nitrogen relationships in leaves of C3 plants. Oecologia 78:9-19.
Everett RL, Koniak Sand Budy J (1986) Pinyon seedling distribution among soil microsites. USDA Forest Service Intermountain Research Station Research Paper INT-363.
Farquhar GD, O'Leary MH and Berry JA (1982) On the relationship between carbon isotope discrimination and the intercellular carbon dioxide concentration in leaves. Aust. J. Plant Physiol. 9:121-137.
176 E.H. DeLucia and W.H. Schlesinger
Field C and Mooney HA (1983) Leaf age and seasonal effects of light, water, and nitrogen use efficiency in a California shrub. Oecologia 56:348-355.
Field C and Mooney HA (1986) The photosynthesis-nitrogen relationship in wild plants. pp. 25-55. In Givnish TJ (editor) On the Economy of Plant Form and Function. Cambridge Univ. Press, NY.
Field C, Merino J, and Mooney HA (1983) Compromises between water-use efficiency and nitrogen-use efficiency in five species of California evergreens. Oecologia 60:384-389.
Fischer RA and Turner NC (1978) Plant productivity in the arid and semiarid zones. Ann. Rev. Plant Physiol. 29:277-317.
Fonteyn PJ, Schlesinger WH, and Marion GM (1987) Accuracy of soil thermocouple hygrometer measurements in desert ecosystems. Ecology 68:1121-1124.
Foyer C and Spencer C (1986) The relationship between phosphate status and photosynthesis in leaves: effects of orthophosphate distribution, photosynthesis and assimilate partitioning. Planta 167:369-375.
Gianella VP (1936) Geology of the Silver City district on the southern portion of the Comstock Lode, Nevada. Univ. Nev. Bull. 30(9):1-108.
Goldberg DE (1982) The distribution of evergreen and deciduous trees relative to soil type: an example from the Sierra Madre, Mexico, and a general model. Ecology 63:942-951.
Goldberg DE (1985) Effects of soil pH, competition, and seed predation on the distributions of two tree species. Ecology 66:503-511.
Grime JP (1979) Plant Strategies and Vegetation Processes. John Wiley and Sons, NY.
Gulmon SL and Chu CC (1981) The effects of light and nitrogen on photosynthesis, leaf characteristics, and dry matter allocation in the chaparral shrub, Dip/acus aurantiacus. Oecologia 49:207-212.
Hull JC and Wood SG (1984) Water relations of oak species on and adjacent to a Maryland serpentine soil. Amer. MidI. Nat. 112:224-234.
Jenny H (1980) The Soil Resource. Ecological Studies Vol. 37. Springer-Verlag, NY.
Jurinak JJ, Dudley LM, Allen MF, and Knight WG (1986) The role of calcium oxalate in the availability of phosphorus in soils of semiarid regions: A thermodynamic study. Soil Science 142:255-261.
Knapp AK and Smith WK (1987) Stomatal and photosynthetic responses during sun/shade transitions in subalpine plants. Oecologia 74:62-67.
Kramer PJ (1983) Water Relations of Plants. Academic Press, NY. Kruckeberg AR (1954) The ecology of serpentine soils. III. Plant species in relation
to serpentine soils. Ecology 35:267-274. Lassoie JP, Hinckley TM, and Grier CC (1985) Coniferous forests of the Pacific
Northwest. pp. 127-161. In Chabot BF and Mooney HA (editors) Physiological Ecology of North American Plant Communities. Chapman Hall, NY.
5. Ecophysiology of Vegetation on Contrasting Soils 177
Lopushinsky W (1969) Stomatal closure in conifer seedlings in response to leaf moisture stress. Bot. Gaz. 130:250-263.
Lopushinsky Wand Klock GO (1974) Transpiration of conifer seedlings in relation to soil water potential. Forest Science 20:181-186.
Miller RF, Branson FA, McQueen IS, and Snyder CT (1982) Water relations in soils as related to plant communities in Ruby Valley, Nevada. J. Range Manag. 34:462-468.
Monson RK, Sackschewsky MR, and Williams GW III (1986) Field measurements of photosynthesis, water-use efficiency, and growth in Andropogon smithii (C3)
and Bouteloua gracilis (C4) in the Colorado shortgrass steppe. Oecologia 68:400-409.
Morrison JIL and Batten GD (1986) Regulation of mesophyll photosynthesis in intact wheat leaves by cytoplasmic phosphate concentrations. Planta 168:200-206.
Natr L (1975) Influence of mineral nutrition on photosynthesis and the use of assimilates. pp.537-556. In Cooper JP (editor) Photosynthesis and Productivity in Different Environments. Cambridge Univ. Press, Cambridge.
Nobel PS (1983) Biophysical Plant Physiology and Ecology. WH Freeman and Company, NY.
O'Leary MH (1988) Carbon isotopes in photosynthesis. BioScience 38:328-336. Orians GH and Solbrig OT (1977) A cost-income model of leaves and roots with
special reference to arid and semiarid areas. Amer. Nat. 111:677-690. Osmond CB, Winter K, and Ziegler H (1982) Functional significance of different
pathways of CO2 fixation in photosynthesis. pp. 479-547. In Lange OL, Nobel PS, Osmond CB, and Ziegler H (editors) Physiological Plant Ecology II: Water Relations and Carbon Assimilation. Encyclopedia of Plant Physiology (New Series), Vol. 12B. Springer-Verlag, Heidelberg.
Petersen TD (1988) Effects of interference from Calamagrostis rubescens on size distributions in stands of Pinus ponderosa. J. Appl. Ecol. 25:265-272.
Radin JW and Eidenbock MP (1984) Hydraulic conductance as a factor limiting expansion of phosphorus-deficient cotton plants. Plant Physiol. 76:392-394.
Raschke K (1979) Movements of stomata. pp.383-441. In Haupt Wand Feinleib ME (editors) Physiology of Movements. Encyclopedia of Plant Physiology (New Series), Vol. 7. Springer-Verlag, Heidelberg.
Reginato RJ and Nakayama FS (1988) Neutron probe calibration based on plastic transfer standards. Soil Science 145:381-384.
Reich PB and Schoettle AW (1988) Role of phosphorus and nitrogen in photosynthetic and whole plant carbon gain and nutrient use efficiency in eastern white pine. Oecologia 77:25-33.
Ritchie GA and Hinckley TM (1975) The pressure chamber as an instrument for ecological research. Adv. Ecol. Res. 9:166-254.
Running SW (1976) Environmental control of leaf water conductance in conifers. Can. J. Forest Res. 6:104-112.
178 E.H. DeLucia and W.H. Schlesinger
Sage RF and Pearcy RW (1987) The nitrogen use efficiency of C3 and C4 plants. II. Leaf nitrogen effects on the gas exchange characteristics of Chenopodium album (L.) and Amaranthus retroflexus (L.). Plant Physiol. 84:959-963.
Salisbury FB (1954) Some chemical and biological investigations of materials derived from hydrothermally altered rock in Utah. Soil Science 78:277-294.
Salisbury FB (1964) Soil formation and vegetation on hydrothermally altered rock material in Utah. Ecology 45:1-9.
Schlesinger WH and Chabot BF (1977) The use of water and minerals by evergreen and deciduous shrubs in Okefenokee swamp. Bot. Gaz. 138:490-497.
Schlesinger WH, DeLucia EH, and Billings WD (1989) Nutrient-use efficiency of woody plants on contrasting soils in the western Great Basin, Nevada. Ecology 70:105-113.
Schlesinger WH, Fonteyn PJ, and Marion GM (l987) Soil moisture content and plant transpiration in the Chihuahuan desert of New Mexico. J. Arid Env. 12:119-126.
Shainsky U and Radosevich SR (1986) Growth and water relations of Pinus pon
derosa seedlings in competitive regimes with Arctostaphylos patula seedlings. J. Appl. Ecol. 23:957-966.
Smith WK (1985) Western montane forests. pp.95-126. In Chabot BF and Mooney HA (editors) Physiological Ecology of North American Plant Communities. Chapman and Hall, NY.
Sturges DL (1977) Soil water withdrawal and root characteristics of big sagebrush. Amer. Mid. Nat. 98:257-274.
Virginia RA and Delwiche CC (1982) Natural 15N abundance of presumed N2-fixing and non-Nz-fixing plants from selected ecosystems. Oecologia 54:317-325.
Vitousek PM (1982) Nutrient cycling and nutrient use efficiency. Amer. Nat. 119:553-572.
Waring RH and Running SW (l978) Sapwood water storage: its contribution to transpiration and effect upon water conductance through the stems of oldgrowth Douglas-fir. Plant Cell Environ. 1:131-140.
Waring RH and Schlesinger WH (1985) Forest Ecosystems. Academic Press, NY. West NE (1988) Intermountain deserts, shrub steppes, and woodland. pp. 209-231.
In Barbour MG and Billings WD (editors) North American Terrestrial Vegetation. Cambridge Univ. Press, NY.
White DE and Newton M (1989) Competitive interactions of whiteleaf manzanita, herbs, Douglas-fir, and Ponderosa pine in southwest Oregon. Can. J. For. Res. 19:232-238.
Whittaker RH (l954) The ecology of serpentine soils. IV. The vegetational response to serpentine soils. Ecology 35:275-288.
234 S.D. Smith and R.S. Nowak
Freeman DC, Klikoff LG, and Harper KT (1976) Differential resource utilization by the sexes of dioecious plants. Science 193: 597-599.
Garcia-Moya E and McKell CM (1970) Contribution of shrubs to the nitrogen economy of a desert-wash plant community. Ecology 51:81-88.
Gile LH, Peterson FF, and Grossman RB (1966) Morphological and genetic sequences of carbonate accumulation in desert soils. Soil Sci. 101:347-360.
Gollan T, Turner NC, and Schulze E-D (1985) The responses of stomata and leaf gas exchange to vapor pressure deficits and soil water content. III. In the sclerophyllous woody species Nerium oleander. Oecologia 65:356-362.
Goodman PJ (1973) Physiological and ecotypic adaptations of plants to salt desert conditions in Utah. J. Ecol. 61:473-494.
Harris GA (1967) Some competitive relationships between Agropyron spicatum and Bromus tectorum. Ecol. Monogr. 37:89-111.
Harris, GA and Wilson AM (1970) Competition for moisture among seedlings of annual and perennial grasses as influenced by root elongation at low temperature. Ecology 51:530-534.
Hodgkinson KC, Johnson PS, and Norton BE (1978) Influence of summer rainfall on root and shoot growth of a cold-winter desert shrub, Atriplex confertifolia.
Oecologia 34:353-362. Holthausen RS and Caldwell MM (1980) Seasonal dynamics of root system respira
tion in Atriplex confertifolia. Plant Soil 55:307-317. Hulbert LC (1955) Ecological studies of Bromus tectorum and other annual
bromegrasses. Ecol. Monogr. 25:181-213. Hull AC Jr and Klomp GL (1974) Yield of crested wheatgrass under four densities
of big sagebrush in southern Idaho. USDA Technical Bulletin 1483. Hutchings SS and Stewart G (1953) Increasing forage yields and sheep production
on Intermountain winter ranges. USDA Circular 925. Jaeger EC (1957) The North American Deserts. Stanford Univ. Press, Stanford. James DW and Jurinak JJ (1978) Nitrogen fertilization of dominant plants in the
northeastern Great Basin desert. pp. 219-231. In West NE and Skujins JJ (editors), Nitrogen in Desert Ecosystems. Dowden, Hutchinson, and Ross, Stroudsburg, P A.
Jarvis PG and McNaughton KB (1986) Stomatal control of transpiration: scaling up from leaf to region. pp. 1-49. In MacFadyen A and Ford ED (editors), Advances in Ecological Research, Vol 15. Academic Press, London.
Jeffries DL and Klopatek JM (1987) Effects of grazing on the vegetation of the blackbrush association. J. Range Manage. 40:390-392.
Johnson PS and Norton BE (1980) The effects of subsurface irrigation on current and subsequent year's growth in shadscale. J. Range Manage. 33:331-336.
Jordan PW and Nobel PS (1979) Infrequent establishment of seedlings of Agave
deserti (Agavaceae) in the northwestern Sonoran Desert. Amer. J. Bot. 66:1079-1084.
6. Ecophysiology of Plants in the Intermountain Lowlands 235
Kay BL and Evans RA (1965) Effects of fertilization on a mixed stand of cheatgrass and intermediate wheatgrass. J. Range Manage. 18:7-11.
Klikoff LG (1966) Competitive response to moisture stress of a winter annual of the Sonoran Desert. Amer. MidI. Nat. 75: 383-391.
Klubek B, Eberhardt PJ, and Skujins J (1978) Ammonia volatilization from Great Basin desert soils. pp. 1-49. In West NE and Skujins JJ (editors), Nitrogen in Desert Ecosystems. Dowden, Hutchinson, and Ross, Stroudsburg, PA
Lane U, Romney EM, and Hakonson TE (1984) Water balance calculations and net production of perennial vegetation in the northern Mojave Desert. J. Range Manage. 37:12-18.
Levitt J (1980) Responses of Plants to Environmental Stress, Vol. II. Water, Radiation, Salt, and Other Stresses. Academic Press, NY.
Ludwig JA (1987) Primary productivity in arid lands: myths and realities. J. Arid Environ. 13:1-7.
Lunt OR, Letey J, and Clark SB (1973) Oxygen requirements for root growth in three species of desert shrubs. Ecology 54: 1356-1362.
Mack RN (1981) The invasion of Bromus teetorum L into Western North America: an ecological chronicle. Agro-Ecosystems 7: 145-165.
Mack RN and Pyke DA (1983) The demography of Bromus teetorum: variation in time and space. J. Ecol. 71:69-93.
MacMahon JA (1979) North American deserts: their floral and faunal components. pp.21-82. In Goodall DW and Perry RA (editors), Arid-land Ecosystems: Structure, Functioning and Management, Voll. Cambridge Univ. Press, Cambridge:
MacMahon JA (1987) Warm deserts. pp. 231-264. In Barbour MG and Billings WD (editors), North American Terrestrial Vegetation. Cambridge Univ. Press, Cambridge.
MacMahon JA and Schimpf DJ (1981) Water as a factor in the biology of North American desert plants. pp. 114-117. In Evans DD and Thames JL (editors), Water in Desert Ecosystems. Dowden, Hutchinson, and Ross, Stroudsburg, PA
McAuliffe JR (1988) Markovian dynamics of simple and complex desert plant communities. Amer. Nat. 131:459-490.
McIlvanie SK (1942) Carbohydrate and nitrogen trends in bluebunch wheatgrass, Agropyron spicatum, with special reference to grazing influences. Plant Physiol. 17:540-557.
Miller RF (1988) Comparison of water use by Artemisia tridentata spp. wyomingensis and Chrysothamnus viseidiflorus spp. viseidijlorus. J. Range Manage. 41 :58-62.
Miller RF and Schultz LM (1987) Development and longevity of ephemeral and perennial leaves on Artemisia tridentata Nutt. ssp. wyomingensis. Great Basin Nat. 47:227-230.
Miller RF, Branson FA, McQueen IS, and Snyder CT (1982) Water relations in soils as related to plant communities in Ruby Valley, Nevada. J. Range Manage. 35:462-468.
236 S.D. Smith and R.S. Nowak
Monson RK and Smith SD (1982) Seasonal water potential components of Sonoran Desert plants. Ecology 63:113-123.
Monson RK and Szarek SR (1981) Life cycle characteristics of Machaeranthera gracilis (Compositae) in desert habitats. Oecologia 49:50-55.
Mooney HA, Bjorkman 0, and Collatz GJ (1977a) Photosynthetic acclimation to temperature in the desert shrub, l.an"ea divaricata. I. Carbon dioxide exchange characteristics of intact leaves. Plant Physiol. 61:406-410 .
Mooney HA, Ehleringer J, and Bjorkman 0 (1977b) The energy balance of leaves of the evergreen desert shrub Atriplex hymenelytra. Oecologia 29:301-310.
Mooney HA, West NE, and Brayton R (1966) Field measurements of the metabolic responses of bristlecone pine and big sagebrush in the White Mountains of California. Bot. Gaz 127:105-113.
Moore PD (1984) Why be an evergreen? Nature 312:703. Moore RT, White RS, and Caldwell MM (1972) Transpiration of At rip lex confertifo
lia and Eurotia lanata in relation to soil, plant, and atmospheric moisture stresses. Can. J. Bot. 50:2411-2418.
Morrow LA and Stahlman PW (1984) The history and distribution of downy brome (Bromw tectorum) in North America. Weed Sci. 32S:2-6.
Mozafar A and Goodin JR (1970) Vesiculated hairs, a mechanism for salt tolerance in Atriplex halimw L Plant Physiol. 45:62-65.
Mueggler WF (1972) Influence of competition on the response of bluebunch wheatgrass to clipping. J. Range Manage. 25:88-92.
Mulroy TW and Rundel PW (1977) Annual plants: adaptations to desert environments. BioScience 27:109-114.
Neilson RP (1987) Biotic regionalization and climatic controls in western North America. Vegetatio 70:135-147.
Nobel PS and Franco AC (1986) Annual root growth and intraspecific competition for a desert bunchgrass. J. Eco\. 74:1119-1126.
Nowak RS and Caldwell MM (1984a) Photosynthetic activity and survival of foliage during winter for two bunchgrass species in a cold-winter steppe environment. Photosynthetica 18: 192-200.
Nowak RS and Caldwell (1984b) A test of compensatory photosynthesis in the field: implications for herbivory tolerance. Oecologia 61:311-318.
Nowak RS and Caldwell MM (1986) Photosynthetic characteristics of crested wheatgrass and bluebunch wheatgrass. J. Range Manage. 39:443-450.
Nowak RS, Anderson JE, and Toft NL (1988) Gas exchange of Agropyron desertorum: diurnal patterns and responses to water vapor gradient and temperature. Oecologia 77:289-295.
Noy-Meir I (1973) Desert ecosystems: environment and producers. Annu. Rev. Ecol. System. 4:25-51.
Noy-Meir I (1979/80) Structure and function of desert ecosystems. Israel J. Bot. 28:1-19.
6. Ecophysiology of Plants in the Intermountain Lowlands 237
O'Leary JF and Minnich RA (1981) Postfire recovery of creosote bush scrub in the western Colorado Desert. Madrono 28:61-66.
Osmond CB (1979) Ion uptake, transport and excretion. pp.607-625. In Goodall DW, and Perry RA (editors), Arid-land Ecosystems: Structure, Functioning and Management, Voll. Cambridge Univ. Press, Cambridge.
Osmond CB, Austin MP, Berry JA, Billings WD, Boyer JS, Dacey JWH, Nobel PS, Smith SD, and Winner WE (1987a) Stress physiology and the distribution of plants. BioScience 37:38-48.
Osmond CB, Smith SD, Ben G-Y, and Sharkey TO (1987b) Stem photosynthesis in a desert ephemeral, Eriogonum inflatum: characterization of leaf and stem C02 fIXation and H20 vapor exchange under controlled conditions. Oecologia 72:542-549.
Pearson LC (1965) Primary production in grazed and ungrazed desert communities of eastern Idaho. Ecology 46:278-285.
Phillips DL and MacMahon JA (1981) Competition and spacing patterns in desert shrubs. J. Beol. 69:97-115.
Power JF (1986) Nitrogen cycling in seven cool-season perennial grass species. Agron. J. 78:681-687.
Power JF and Alessi J (1970) Effects of nitrogen source and phosphorous on crested wheatgrass growth and water use. J. Range Manage. 23:175-178.
Rasmussen lL and Brotherson JD (1986) Response of winterfat (Ceratoides lanata) communities to release from grazing pressure. Great Basin Nat. 46:148-156.
Rice B and Westoby M (1978) Vegetation responses of some Great Basin shrub communities protected against jackrabbits or domestic stock. J. Range Manage. 31:28-34.
Richards JH (1984) Root growth response to defoliation in two Agropyron bunchgrasses: field observations with an improved root periscope. Oecologia 64:21-25.
Richards JH (1986) Plant response to grazing: the role of photosynthetic capacity and stored carbon reserves. pp.428-430. In Joss PJ, Lynch PW, and Williams OB (editors), Rangelands: A Resource Under Siege. Proceedings Second Rangeland Congress, Australian Acad. Sci., Canberra.
Richards JH and Caldwell MM (1985) Soluble carbohydrates, concurrent photosynthesis and efficiency in regrowth following defoliation: a field study with Agropyron species. J. AppJ. EcoJ. 22:907-920.
Rickard WH (1967) Seasonal soil moisture patterns in adjacent greasewood and sagebrush stands. Ecology 48: 1034-1038.
Robberecht R, Mahall BE, and Nobel PS (1983) Experimental removal of intraspecific competitors - effects on water relations and productivity of a desert bunchgrass, Hilaria rigida. Oecologia 60:21-24.
Robertson JH (1947) Responses of range grasses to different intensities of competition with sagebrush (Artemisia tridentata Nutt.). Ecology 28:1-16.
238 S.D. Smith and R.S. Nowak
Romo IT and Haferkamp MR (1988) Comparative water relations in Artemisia tridentata Nutt. subsp. wyomingensis and Kochia prostrata (L) Schred. J. Arid Env. 15:53-64.
Sage RF and Sharkey TO (1987) The effect of temperature on the occurrence of O2
and CO2 insensitive photosynthesis in field grown plants. Plant Physiol. 84:658664.
Schlesinger WH (1985) The formation of caliche in soils ofthe Mojave Desert, California. Geochim. Cosmochim. Acta 49:57-66.
Schulze E-D (1986) Carbon dioxide and water vapor exchange in response to drought in the atmosphere and in the soil. Annu. Rev. Plant Physiol. 37:247-274.
Shantz HL (1927) Drought resistance and soil moisture. Ecology 8:145-157. Sheps LO (1973) Survival of Larrea tridentata seedlings in Death Valley National
Monument, California. Israel J. Bot. 22:8-17. Shown LM, Lusby GC, and Branson FA (1972) Soil-moisture effects of conversion
of sagebrush cover to bunchgrass cover. Water Res. Bull. 8: 1265-1272. Shreve F (1942) The desert vegetation of North America. Bot. Rev. 8:195-246. Shreve F and Mallery TO (1933) The relation of caliche to desert plants. Soil Sci.
35:99-113. Shumar ML and Anderson JE (1986) Water relations of two susbspecies of big
sagebrush on sand dunes in southeastern Idaho. Northwest Sci. 60:179-185. Sinclair R and Thomas DA (1970) Optical properties of leaves of some species in
arid South Australia. Aust J. Bot. 18:261-273. Skujins J (1981) Nitrogen cycling in arid ecosystems. pp.477-491. In Clark FE and
Rosswall T (editors), Terrestrial Nitrogen Cycles: Processes, Strategies and Management Impacts. Swedish National Science Research Council, Stockholm.
Smith SO and Ludwig JA (1978) The distribution and phytosociology of Yucca elata in southern New Mexico. Amer. MidI. Nat. 100: 202-212.
Smith SO and Nobel PS (1986) Deserts. pp. 13-62. In Baker NR and Long SP (editors), Photosynthesis in Contrasting Environments. Elsevier, Amsterdam.
Smith SO and Osmond CB (1987) Stem photosynthesis in a desert ephemeral, Eriogonum inflatum: morphology, stomatal conductance and water-use efficiency in field populations. Oecologia 72:533-541.
Smith SO, Hartsock TL, and Nobel PS (1983) Ecophysiology of Yucca brevifolia, an arborescent monocot of the Mojave Desert. Oecologia 60: 10-17.
Smith SO, Strain BR, and Sharkey TO (1987) Effects of CO2 enrichment on four Great Basin grasses. Func. Ecol. 1:139-143.
Smith WK and Nobel PS (1978) Influence of irradiation, soil water potential, and leaf temperature on leaf morphology of a desert broadleaf, Encelia farinosa Gray (Compositae). Amer. J. Bot. 65:429-432.
Sneva FA (1973) Crested wheatgrass response to nitrogen and clipping. J. Range Manage. 26:47-50.
6. Ecophysiology of Plants in the Intermountain Lowlands 239
Sneva FA (1977) Correlations of precipitation and temperature with spring regrowth and mature crested wheatgrass yields. J. Range Manage. 30:270-275.
Sneva FA, Hyder DN, and Cooper CS (1958) The influence of ammonium nitrate on the growth and yield of crested wheatgrass on the Oregon high desert. Agron. J. 50:40-44.
Strojan CL, Turner FB, and Castetter R (1979) Utter fall from shrubs in the northern Mojave Desert. Ecology 60:891-900.
Sturges DL (1977) Soil water withdrawal and root characteristics of big sagebrush. Amer. MidI. Nat. 98:257-273.
Stutz HC (1978) Explosive evolution of perennial Atriplex in western America. Great Basin Nat. Mem. 2:161-168.
Szarek SR (1979) Primary production in four North American deserts: indices of efficiency. J. Arid. Environ. 2:187-209.
Thill DC, Schirman RD, and Appleby AP (1979) Influence of soil moisture, temperature, and compaction on the germination of downy brome (Bromus tectorum). Weed Sci. 27:625-630.
Thomson WW, Berry WL, and Uu LL (1970) Localization and secretion of salt by the salt glands of Tamarix aphylla. Proc. Nat. Acad. Sci. USA 63:310-317.
Thorgeirsson H (1985) Temporal and spatial partitioning of the soil water resource between two Agropyron bunchgrasses and Artemisia tridentata. Thesis, Utah State Univ., Logan, UT.
Thornthwaite CW (1948) An approach toward a rational classification of climate. Geogr. Rev. 38:55-94.
Toft NL and Pearcy RW (1982) Gas exchange characteristics and temperature relations of two desert annuals: a comparison of a winter-active and a summeractive species. Oecologia 55:170-177.
Toft NL, Anderson JE, and Nowak RS (1989) Water use efficiency and carbon isotope composition of plants in a cold desert environment. Oecologia (in press).
Trlica MJ Jr and Cook CW (1971) Defoliation effects on carbohydrate reserves of desert species. J. Range Manage. 24:418-425.
Turner FB and Randall DC (1987) The phenology of desert shrubs in southern Nevada. J. Arid Env. 13:119-128.
Vasek FC (1980) Creosote bush: long-lived clones in the Mojave Desert. Amer. J. Bot. 67:246-255.
Wallace A, Romney EM, and Hale VQ (1973) Sodium relations in desert plants: 1. Cation contents of some plant species from the Mojave and Great Basin deserts. Soil Sci. 115:284-287.
Wallace A, Bamberg SA, and Cha JW (1974a) Quantitative studies of roots of perennial plants in the Mojave Desert. Ecology 55: 1160-1162.
Wallace A, Romney EM, Cha JW, and Alexander GV (1974b) Sodium relations in desert plants: 3. Cation-anion relationships in three species which accumulate high levels of cations in leaves. Soil Sci. 118:397-401.
240 S.D. Smith and R.S. Nowak
Wallace A, Romney EM, and Cha JW (1980a) Depth distribution of roots of some perennial plants in the Nevada Test Site area of the northern Mojave Desert. Great Basin Nat. Mem. 4:201-207.
Wallace A, Romney EM, and Kinnear JE (1980b) Frequency distribution of three perennial plant species to nearest neighbor of the same species in the northern Mojave Desert. Great Basin Nat. Mem. 4:89-93.
Walter H, Harnickell E, and Mueller-Dombois D (1975) Climate-Diagram Maps of the Individual Continents and the Ecological Climate Regions of the Earth. Springer-Verlag, Heidelberg.
Wang J (1988) Response of Artemisia tridenJala ssp. wyomingensis and Stipa thurberiana to nitrogen amendments. Thesis, Oregon State Univ., Corvallis.
Welch BL and Jacobson TLC (1988) Root growth of Artemisia tridentala. J. Range Manage. 41:332-334.
Went FW (1948) Ecology of desert plants. I. Observations on germination in the Joshua Tree National Monument, California. Ecology 29:242-253.
Went FW (1949) Ecology of desert plants. II. The effect of rain and temperature on germination and growth. Ecology 30:1-13.
Went FW (1979) Germination and seedling behavior of desert plants. pp.477-489. In Goodall DW and Perry RA (editors), Arid-land Ecosystems: Structure, Functioning and Management, Vol. 1. Cambridge Univ. Press, Cambridge.
Wentworth TR (1981) Vegetation on limestone and granite in the Mule Mountains, Arizona. Ecology 62:469-482.
Wentworth TR and Davidson EA (1987) Foliar mineral elements in native plants on contrasting rock types: multivariate patterns and nutrient balance regulation. Soil Sci. 144: 190-201.
Werk KS and Ehleringer JR (1983) Photosynthesis by flowers in Encelia farinosa and Encelia cali/ornica (Asteraceae). Oecologia 57:311-315.
Werk KS and Ehleringer J (1985) Photosynthetic characteristics of Lactuca serriola L. Plant Cell Environ. 8:345-350.
West NE (1983) Ecosystems of the World, Vol 5. Temperate Deserts and Semideserts. Elsevier, NY.
West NE (1987) Intermountain deserts, shrub steppes, and woodlands. pp.209-230. In Barbour MG, Billings WD (editors), North American Terrestrial Vegetation. Cambridge Univ. Press, Cambridge.
West NE and Gasto J (1978) Phenology of the aerial portions of shadscale and winterfat in Curlew Valley, Utah. J. Range Manage. 31:43-45.
West NE, Tausch RJ, Rea KH, and Tueller PT (1978) Taxonomic determination, distribution, and ecological indicator values of sagebrush within the pinyonjuniper woodlands of the Great Basin. J. Range Manage. 31 :87-92.
West NE, Provenza FD, Johnson PA, and Owens MK (1984) Vegetation change after 13 years of livestock grazing exclusion on sagebrush semi desert in west central Utah. J. Range Manage. 37:262-264.
6. Ecophysiology of Plants in the Intermountain Lowlands 241
Westerman RL and Tucker TC (1978) Denitrification in desert soils. pp.75-106. In West NE and Skujins JJ (editors), Nitrogen in Desert Ecosystems. Dowden, Hutchinson, and Ross, Stroudsburg, PA
Wiebe HH, Al-Saadi HA, and Kimball SL (1974) Photosynthesis in the anomalous secondary wood of Atriplex confertifolia stems. Amer. J. Bot. 61:444-448.
Wight JR and Black AL (1972) Energy fixation and precipitation-use efficiency in a fertilized rangeland ecosystem of the northern Great Plains. J. Range Manage. 25:376-380.
Wight JR and Skiles JW (1987) SPUR: simulation of production and utilization of rangelands. Documentation and user guide. USDA Agricultural Research Service Publication 63.
Williams RJ, Boersma K, and Van Ryswyk AL (1979) The effects of nitrogen fertilization on water use by crested wheatgrass. J. Range Manage. 32:98-100.
Wilson AM, Harris GA, and Gates DH (1966) Fertilization of mixed cheatgrassbluebunch wheatgrass stands. J. Range Manage. 19: 134-137.
Woodell SRJ, Mooney HA, and Hill AJ (1969) The behaviour of Larrea divaricata (creosote bush) in response to rainfall in California. J. Ecol. 57:37-44.
Wraith JM, Johnson DA, Hanks RJ, and Sisson DV (1987) Soil and plant water relations in a crested wheatgrass pasture: response to spring grazing by cattle. Oecologia 73:573-578.
Yeaton RI and Cody ML (1976) Competition and spacing in plant communities: the northern Mojave Desert. J. Ecol. 64:689-696.
Young JA and Evans RA (1973) Downy brome: intruder in the plant succession of big sagebrush communities in the Great Basin. J. Range Manage. 26:410-415.
Young JA and Evans RA (1978) Population dynamics after wildfires in sagebrush rangelands. J. Range Manage. 31:283-289.
Young JA and Evans RA (1986) Erosion and deposition of fine sediments from playas. J. Arid Env. 10:103-115.
Young JA, Evans RA, and Tueller PT (1975) Great Basin plant communities - pristine and grazed. pp. 187-212. In Elston R (editor), Holocene Climate in the Great Basin. Nevada Archeological Survey, Reno, NV.
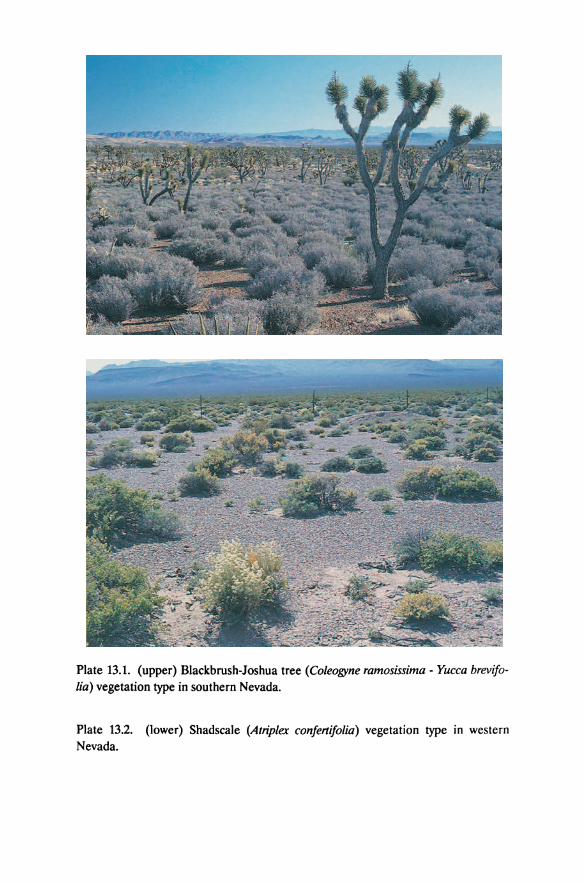
Plate 13.1. (upper) Blackbrush-Joshua tree (Coleogyne ramosissima - Yucca brevifolia) vegetation type in southern Nevada.
Plate 13.2. (lower) Shadscale (Atriplex confertifolia) vegetation type in western Nevada.
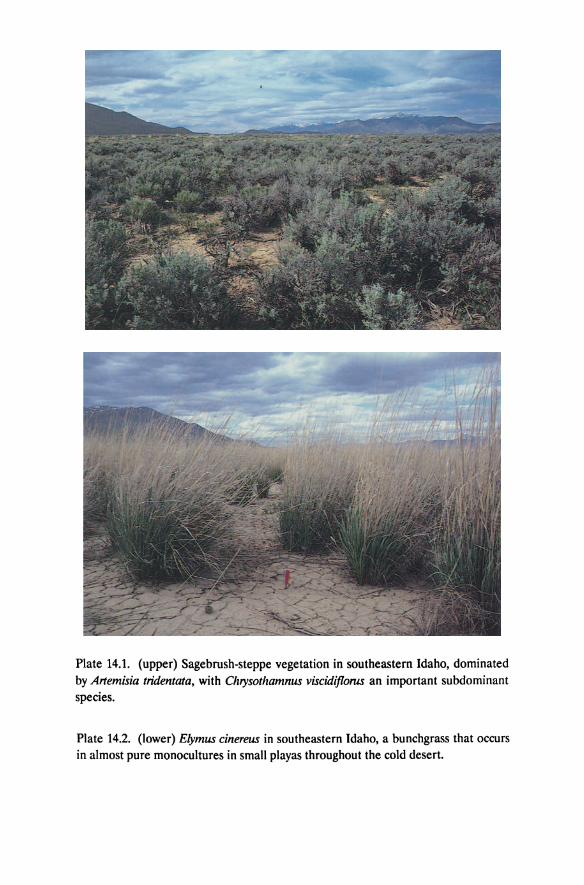
Plate 14.1. (upper) Sagebrush-steppe vegetation in southeastern Idaho, dominated by Artemisia tridentata, with Chrysothamnus viscidifloTUS an important subdominant species.
Plate 14.2. (lower) Elymus cinereus in southeastern Idaho, a bunchgrass that occurs in almost pure monocultures in small playas throughout the cold desert.
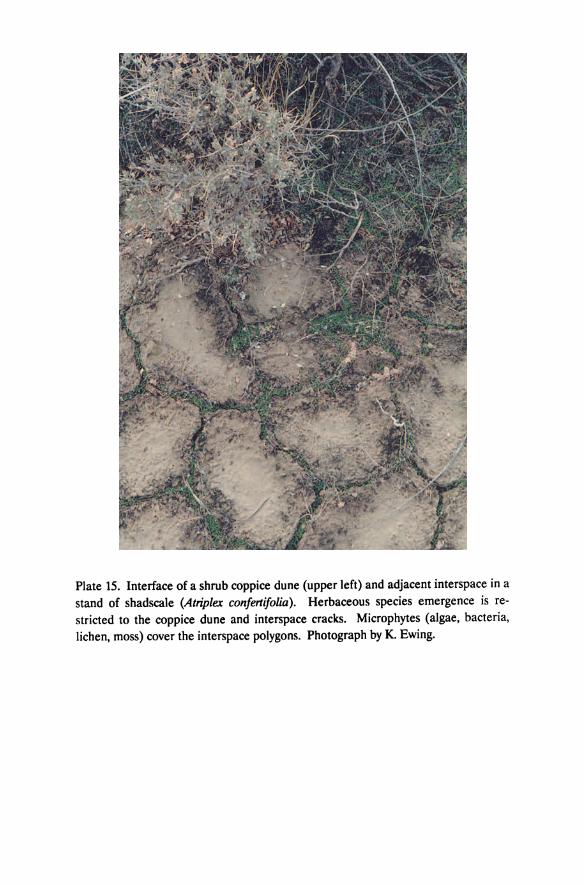
Plate 15. Interface of a shrub coppice dune (upper left) and adjacent interspace in a stand of shadscale (A/rip/ex confertifolia). Herbaceous species emergence is restricted to the coppice dune and interspace cracks. Microphytes (algae, bacteria, lichen, moss) cover the interspace polygons. Photograph by K. Ewing.
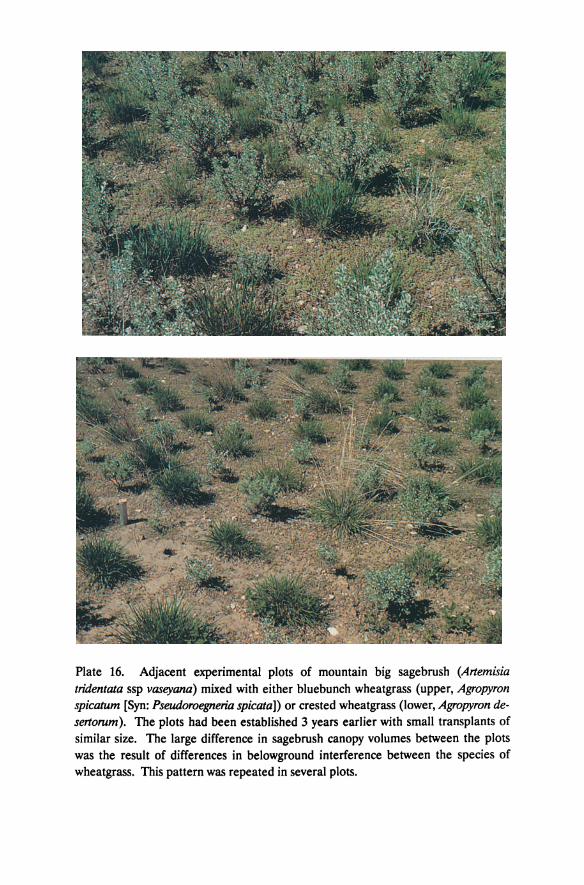
Plate 16. Adjacent experimental plots of mountain big sagebrush (Artemisia tridentata ssp vaseyana) mixed with either bluebunch wheatgrass (upper, Agropyron spicatum [Syn: Pseudoroegneria spicata)) or crested wheatgrass (lower, Agropyron desertorum). The plots had been established 3 years earlier with small transplants of similar size. The large difference in sagebrush canopy volumes between the plots was the result of differences in belowground interference between the species of wheatgrass. This pattern was repeated in several plots.
Chapter 7
Basin Hydrology and Plant Root Systems
James P. Dobrowolski, Martyn M. Caldwell, and James H. Richards
Introduction
The Great Basin of western North America represents more than onefifteenth the area of the United States and can be defined and circumscribed on the basis of drainage, that is, no outlet except to the atmosphere, and general aridity (Houghton 1976). The Great Basin is a physiographic unit, covering about 70% (373,000 km2) of the Basin and Range Province outlined by Fenneman (1931). Although the hydrologic boundaries are well defined (Figure 7.1), less consensus exists regarding the physiographic boundaries. The Basin extends from the Sierra Nevada-Cascade ranges in the west to the Wasatch-Rockies with tributary valleys into Wyoming on the east. The north-southeast boundaries are generally delimited by the Columbia lava plateau and Colorado River plateaus, respectively. Southward, the Basin extends into the Sonoran Province (Blackwelder 1948).
The Basin and Range Province includes portions of the Mojave, Sonoran and Chihuahuan deserts. This chapter will focus on the Great Basin section, where internal or partial drainage characteristics confer many unique features to the region. The hydrologic properties of Great Basin lowlands, from the special features of soil surface crusts to the basin drainage and flow patterns, will be described. Root systems of lowland Great Basin plants exhibit unique properties. The structure and function of these root systems will be described from experiments on selected species. These descriptions of root systems range from characterization of the form and quantity of roots to the function of roots in immediate competition with roots of neighboring plants.
244 J.P. Dobrowolski, M.M. Caldwell, and J.H. Richards
Great Basin Hydrology
The Physiographic Setting
The Great Basin is not composed of a single large basin as its name implies, but a collection of over 100 basins interspersed with more than 150 mountain ranges (Young and Evans 1986). Many of these basins exhibit internal drainage, though some are drained partially either directly or via the eight major river systems (Bear, Weber, Jordan, Sevier, Humboldt, Carson, Truckee, and Walker) into the five principal sinks or lakes (Eakin et al. 1976). These sinks include the Humboldt-Carson Sink, Pyramid Lake, and Walker Lake in Nevada, and the Great Salt Lake and Sevier Lake in Utah. The Great Basin is characterized by generally parallel, north-to-northeast trending mountain ranges separated by alluvial basins. Plate extension and intensive block faulting from the Miocene to the present have produced the current structure. Displacement and erosion in the mountains have provided alluvium of Quaternary age, which has been deposited at the canyon mouths (Snyder 1962). Coalescence of these alluvial fans tends to form aggradational piedmont plains or bajadas. These piedmont plains typically lead to fine-textured flats in closed basins (Mabbutt 1979).
Most of the basins in the Great Basin contain flat and generally unvegetated lower areas that periodically flood, desiccate, and accumulate sediment. Generally these areas are referred to as playas (Neal 1975a). Playas are a very important component of closed basin hydrology. They transform from dry to wet or the reverse in response to changing conditions. Duffy and AI-Hassan (1988) observed the dry playa in Pilot Valley, Nevada to become moist as a result of a recharge-produced water table rise or due to surface flooding. An ephemeral lake may form on a moist playa in response to a single thunderstorm. They also observed the appearance of a lake during the winter months due to surface flooding when evaporation could not keep up with water table rise.
During the wetter periods of the Quaternary, the saline lakes and playas of the Great Basin went through successive wet and dry cycles. Snyder and Langbein (1962) found evidence for a Pleistocene lake of considerable area in the closed basin of Spring Valley, Nevada. Using climatic inferences from the current dry playa and extrapolations from closed basins with existing lakes, they found lake levels to be sensitive to even small climatic changes. Morrison (1968) referred to these lakes as
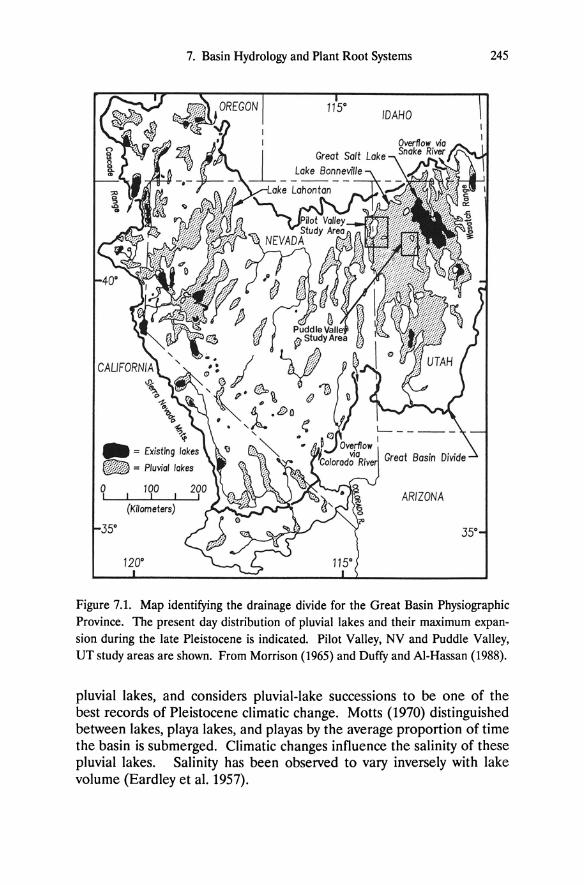
7. Basin Hydrology and Plant Root Systems
'\ 10 ~." " 1> ~
• = E)(isting lakes
@2B = Pluvial lakes
q I lqO I
(Knometers)
1200
ARIZONA
245
350
Figure 7.1. Map identifying the drainage divide for the Great Basin Physiographic Province. The present day distribution of pluvial lakes and their maximum expansion during the late Pleistocene is indicated. Pilot Valley, NV and Puddle Valley, UT study areas are shown. From Morrison (1965) and Duffy and AI-Hassan (1988).
pluvial lakes, and considers pluvial-lake successions to be one of the best records of Pleistocene climatic change. Motts (1970) distinguished between lakes, playa lakes, and playas by the average proportion of time the basin is submerged. Climatic changes influence the salinity of these pluvial lakes. Salinity has been observed to vary inversely with lake volume (Eardley et al. 1957).
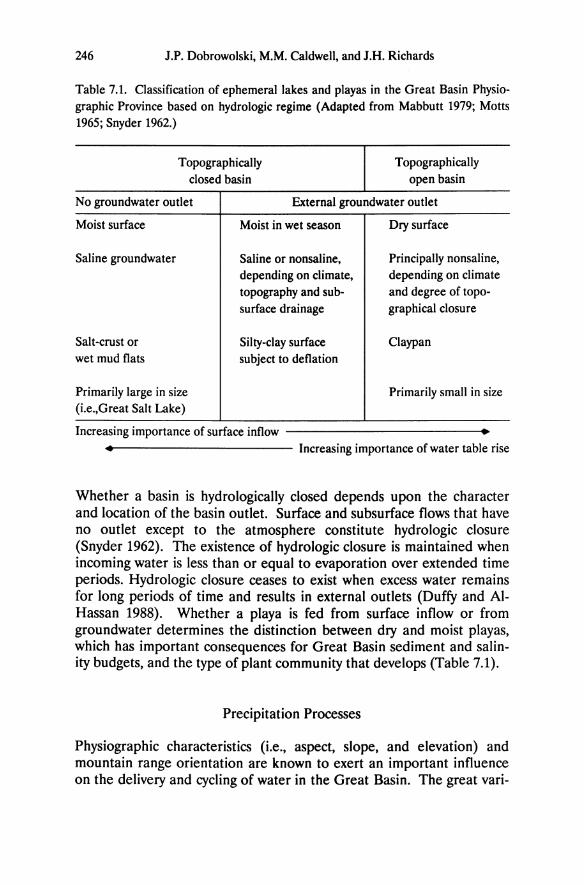
246 J.P. Dobrowolski, M.M. Caldwell, and J.H. Richards
Table 7.1. Classification of ephemeral lakes and playas in the Great Basin Physiographic Province based on hydrologic regime (Adapted from Mabbutt 1979; Motts 1965; Snyder 1962.)
Topographically closed basin
Topographically open basin
No groundwater outlet External groundwater outlet
Moist surface
Saline groundwater
Salt-crust or wet mud flats
Moist in wet season
Saline or nonsaline, depending on climate, topography and subsurface drainage
Silty-clay surface subject to deflation
Dry surface
Principally nonsaline, depending on climate and degree of topographical closure
Claypan
Primarily large in size Primarily small in size (Le.,Great Salt Lake)
Increasing importance of surface inflow • • Increasing importance of water table rise
Whether a basin is hydrologically closed depends upon the character and location of the basin outlet. Surface and subsurface flows that have no outlet except to the atmosphere constitute hydrologic closure (Snyder 1962). The existence of hydrologic closure is maintained when incoming water is less than or equal to evaporation over extended time periods. Hydrologic closure ceases to exist when excess water remains for long periods of time and results in external outlets (Duffy and AIHassan 1988). Whether a playa is fed from surface inflow or from groundwater determines the distinction between dry and moist playas, which has important consequences for Great Basin sediment and salinity budgets, and the type of plant community that develops (Table 7.1).
Precipitation Processes
Physiographic characteristics (i.e., aspect, slope, and elevation) and mountain range orientation are known to exert an important influence on the delivery and cycling of water in the Great Basin. The great vari-
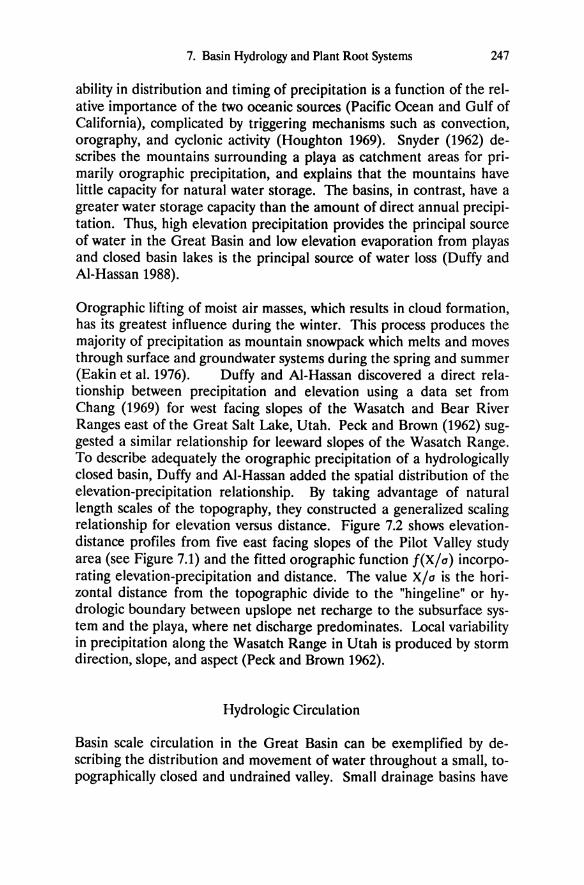
7. Basin Hydrology and Plant Root Systems 247
ability in distribution and timing of precipitation is a function of the relative importance of the two oceanic sources (Pacific Ocean and Gulf of California), complicated by triggering mechanisms such as convection, orography, and cyclonic activity (Houghton 1969). Snyder (1962) describes the mountains surrounding a playa as catchment areas for primarily orographic precipitation, and explains that the mountains have little capacity for natural water storage. The basins, in contrast, have a greater water storage capacity than the amount of direct annual precipitation. Thus, high elevation precipitation provides the principal source of water in the Great Basin and low elevation evaporation from playas and closed basin lakes is the principal source of water loss (Duffy and AI-Hassan 1988).
Orographic lifting of moist air masses, which results in cloud formation, has its greatest influence during the winter. This process produces the majority of precipitation as mountain snowpack which melts and moves through surface and groundwater systems during the spring and summer (Eakin et al. 1976). Duffy and AI-Hassan discovered a direct relationship between precipitation and elevation using a data set from Chang (1969) for west facing slopes of the Wasatch and Bear River Ranges east of the Great Salt Lake, Utah. Peck and Brown (1962) suggested a similar relationship for leeward slopes of the Wasatch Range. To describe adequately the orographic precipitation of a hydrologically closed basin, Duffy and AI-Hassan added the spatial distribution of the elevation-precipitation relationship. By taking advantage of natural length scales of the topography, they constructed a generalized scaling relationship for elevation versus distance. Figure 7.2 shows elevationdistance profiles from five east facing slopes of the Pilot Valley study area (see Figure 7.1) and the fitted orographic function f(xlo) incorporating elevation-precipitation and distance. The value xl a is the horizontal distance from the topographic divide to the "hingeline" or hydrologic boundary between upslope net recharge to the subsurface system and the playa, where net discharge predominates. Local variability in precipitation along the Wasatch Range in Utah is produced by storm direction, slope, and aspect (Peck and Brown 1962).
Hydrologic Circulation
Basin scale circulation in the Great Basin can be exemplified by describing the distribution and movement of water throughout a small, topographically closed and undrained valley. Small drainage basins have
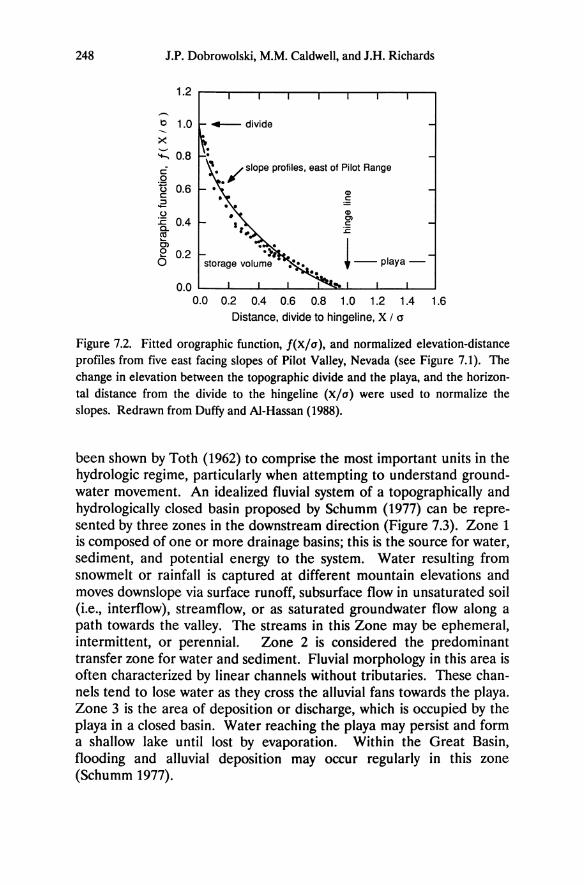
248 J.P. Dobrowolski, M.M. Caldwell, and J.H. Richards
1.2 r----r--,---r--...,.--r-----r-.....,....---,
,-..
t:) 1.0 4-- divide
:>< ;;::. 0.8 C .Q g 0.6 .2 o :c 0.4 ~ ~ o 0.2
i\ •• / slope profiles. east of Pilot Range
CD
:E CD Cl c: :2
!-Playa-
0.0 '------'_----L_--L.._-.J......:::s!<-'--_-'--_.L...-----'
0.0 0.2 0.4 0.6 0.8 1.0 1.2 1.4 1.6 Distance, divide to hingeline, X / a
Figure 7.2. Fitted orographic function, f(x/a), and normalized elevation-distance profiles from five east facing slopes of Pilot Valley, Nevada (see Figure 7.1). The change in elevation between the topographic divide and the playa, and the horizontal distance from the divide to the hingeline (x/a) were used to normalize the slopes. Redrawn from Duffy and AI-Hassan (1988).
been shown by Toth (1962) to comprise the most important units in the hydrologic regime, particularly when attempting to understand groundwater movement. An idealized fluvial system of a topographically and hydrologically closed basin proposed by Schumm (1977) can be represented by three zones in the downstream direction (Figure 7.3). Zone 1 is composed of one or more drainage basins; this is the source for water, sediment, and potential energy to the system. Water resulting from snowmelt or rainfall is captured at different mountain elevations and moves downslope via surface runoff, subsurface flow in unsaturated soil (i.e., interflow), streamflow, or as saturated groundwater flow along a path towards the valley. The streams in this Zone may be ephemeral, intermittent, or perennial. Zone 2 is considered the predominant transfer zone for water and sediment. Fluvial morphology in this area is often characterized by linear channels without tributaries. These channels tend to lose water as they cross the alluvial fans towards the playa. Zone 3 is the area of deposition or discharge, which is occupied by the playa in a closed basin. Water reaching the playa may persist and form a shallow lake until lost by evaporation. Within the Great Basin, flooding and alluvial deposition may occur regularly in this zone (Schumm 1977).
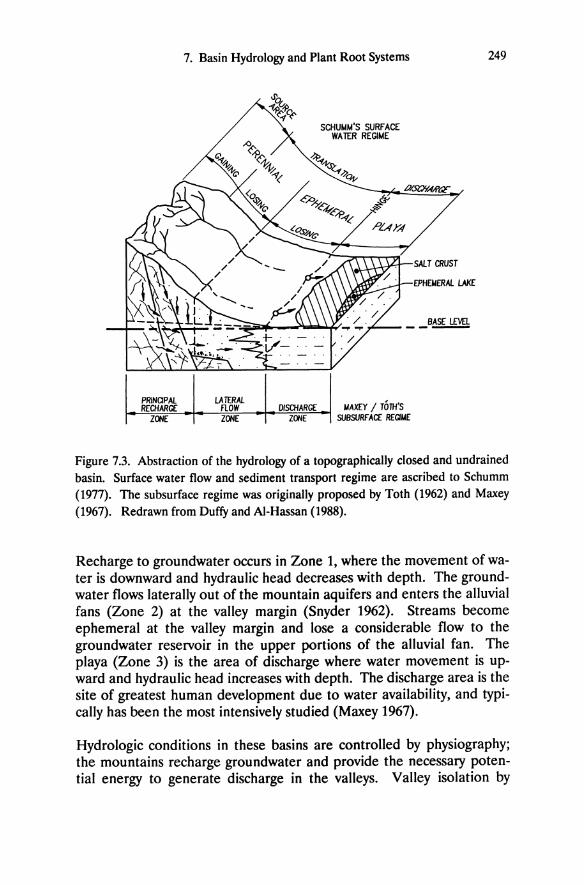
7. Basin Hydrology and Plant Root Systems
SCHUMM'S SURFACE WA l£R REGIME
PRINOPAl LA TERAL I--!.!!:RE~CHSAR;;-"GE"---e-i-_,:;,;Fl;:;;OW=----t--",0/"':;SCH2A~R""G['--l MAXEY / TOTH'S
ZONE ZONE ZONE SUBSURFACE REGIME
SALT CRUST
EPHEMERAL lAKE
249
Figure 7.3. Abstraction of the hydrology of a topographically closed and undrained basin. Surface water flow and sediment transport regime are ascribed to Schumm (1977). The subsurface regime was originally proposed by Toth (1962) and Maxey (1967). Redrawn from Duffy and AI-Hassan (1988).
Recharge to groundwater occurs in Zone 1, where the movement of water is downward and hydraulic head decreases with depth. The groundwater flows laterally out of the mountain aquifers and enters the alluvial fans (Zone 2) at the valley margin (Snyder 1962). Streams become ephemeral at the valley margin and lose a considerable flow to the groundwater reservoir in the upper portions of the alluvial fan. The playa (Zone 3) is the area of discharge where water movement is upward and hydraulic head increases with depth. The discharge area is the site of greatest human development due to water availability, and typically has been the most intensively studied (Maxey 1967).
Hydrologic conditions in these basins are controlled by physiography; the mountains recharge groundwater and provide the necessary potential energy to generate discharge in the valleys. Valley isolation by
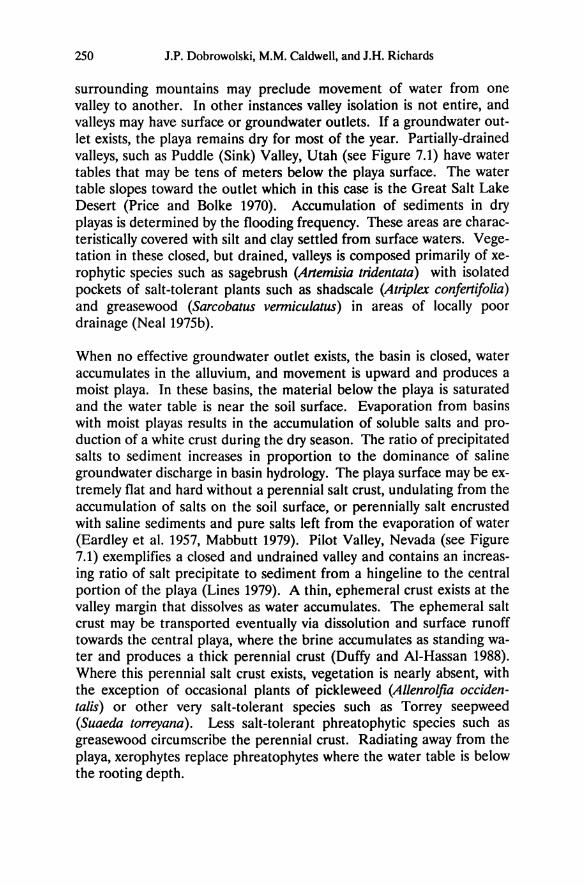
250 J.P. Dobrowolski, M.M. Caldwell, and J.H. Richards
surrounding mountains may preclude movement of water from one valley to another. In other instances valley isolation is not entire, and valleys may have surface or groundwater outlets. If a groundwater outlet exists, the playa remains dry for most of the year. Partially-drained valleys, such as Puddle (Sink) Valley, Utah (see Figure 7.1) have water tables that may be tens of meters below the playa surface. The water table slopes toward the outlet which in this case is the Great Salt Lake Desert (Price and Boike 1970). Accumulation of sediments in dry playas is determined by the flooding frequency. These areas are characteristically covered with silt and clay settled from surface waters. Vegetation in these closed, but drained, valleys is composed primarily of xerophytic species such as sagebrush (Anemisia tridentata) with isolated pockets of salt-tolerant plants such as shadscale (Atriplex confenifolia) and greasewood (Sarcobatus vermiculatus) in areas of locally poor drainage (Neal 1975b).
When no effective groundwater outlet exists, the basin is closed, water accumulates in the alluvium, and movement is upward and produces a moist playa. In these basins, the material below the playa is saturated and the water table is near the soil surface. Evaporation from basins with moist playas results in the accumulation of soluble salts and production of a white crust during the dry season. The ratio of precipitated salts to sediment increases in proportion to the dominance of saline groundwater discharge in basin hydrology. The playa surface may be extremely flat and hard without a perennial salt crust, undulating from the accumulation of salts on the soil surface, or perennially salt encrusted with saline sediments and pure salts left from the evaporation of water (Eardley et at. 1957, Mabbutt 1979). Pilot Valley, Nevada (see Figure 7.1) exemplifies a closed and undrained valley and contains an increasing ratio of salt precipitate to sediment from a hingeline to the central portion of the playa (Lines 1979). A thin, ephemeral crust exists at the valley margin that dissolves as water accumulates. The ephemeral salt crust may be transported eventually via dissolution and surface runoff towards the central playa, where the brine accumulates as standing water and produces a thick perennial crust (Duffy and AI-Hassan 1988). Where this perennial salt crust exists, vegetation is nearly absent, with the exception of occasional plants of pickleweed (Allenrolfia occidentalis) or other very salt-tolerant species such as Torrey seepweed (Suaeda ton-eyana). Less salt-tolerant phreatophytic species such as greasewood circumscribe the perennial crust. Radiating away from the playa, xerophytes replace phreatophytes where the water table is below the rooting depth.
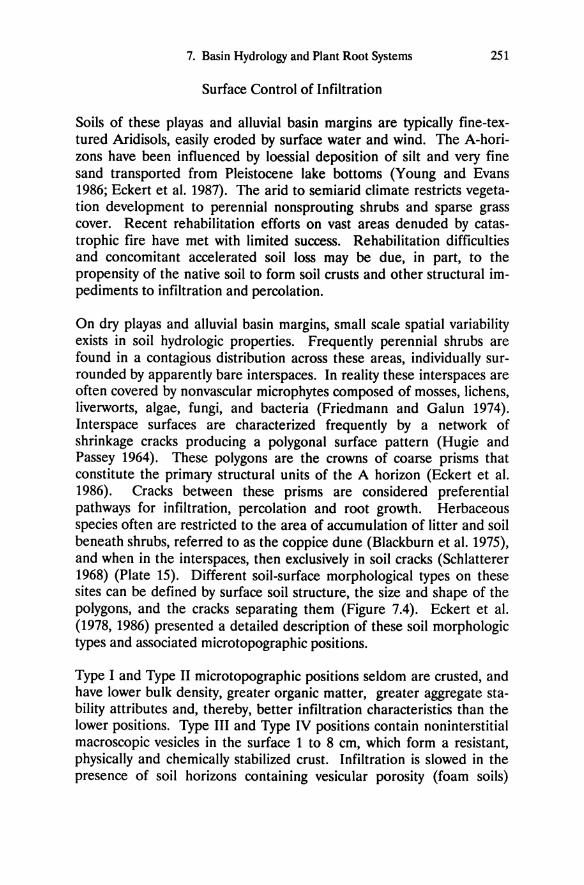
7. Basin Hydrology and Plant Root Systems 251
Surface Control of Infiltration
Soils of these playas and alluvial basin margins are typically fine-textured Aridisols, easily eroded by surface water and wind. The A-horizons have been influenced by loessial deposition of silt and very fine sand transported from Pleistocene lake bottoms (Young and Evans 1986; Eckert et al. 1987). The arid to semiarid climate restricts vegetation development to perennial nonsprouting shrubs and sparse grass cover. Recent rehabilitation efforts on vast areas denuded by catastrophic fire have met with limited success. Rehabilitation difficulties and concomitant accelerated soil loss may be due, in part, to the propensity of the native soil to form soil crusts and other structural impediments to infiltration and percolation.
On dry playas and alluvial basin margins, small scale spatial variability exists in soil hydrologic properties. Frequently perennial shrubs are found in a contagious distribution across these areas, individually surrounded by apparently bare interspaces. In reality these interspaces are often covered by nonvascular microphytes composed of mosses, lichens, liverworts, algae, fungi, and bacteria (Friedmann and Galun 1974). Interspace surfaces are characterized frequently by a network of shrinkage cracks producing a polygonal surface pattern (Hugie and Passey 1964). These polygons are the crowns of coarse prisms that constitute the primary structural units of the A horizon (Eckert et al. 1986). Cracks between these prisms are considered preferential pathways for infiltration, percolation and root growth. Herbaceous species often are restricted to the area of accumulation of litter and soil beneath shrubs, referred to as the coppice dune (Blackburn et al. 1975), and when in the interspaces, then exclusively in soil cracks (Schlatterer 1968) (Plate 15). Different soil-surface morphological types on these sites can be defined by surface soil structure, the size and shape of the polygons, and the cracks separating them (Figure 7.4). Eckert et al. (1978, 1986) presented a detailed description of these soil morphologic types and associated microtopographic positions.
Type I and Type II microtopographic positions seldom are crusted, and have lower bulk density, greater organic matter, greater aggregate stability attributes and, thereby, better infiltration characteristics than the lower positions. Type III and Type IV positions contain noninterstitial macroscopic vesicles in the surface 1 to 8 cm, which form a resistant, physically and chemically stabilized crust. Infiltration is slowed in the presence of soil horizons containing vesicular porosity (foam soils)
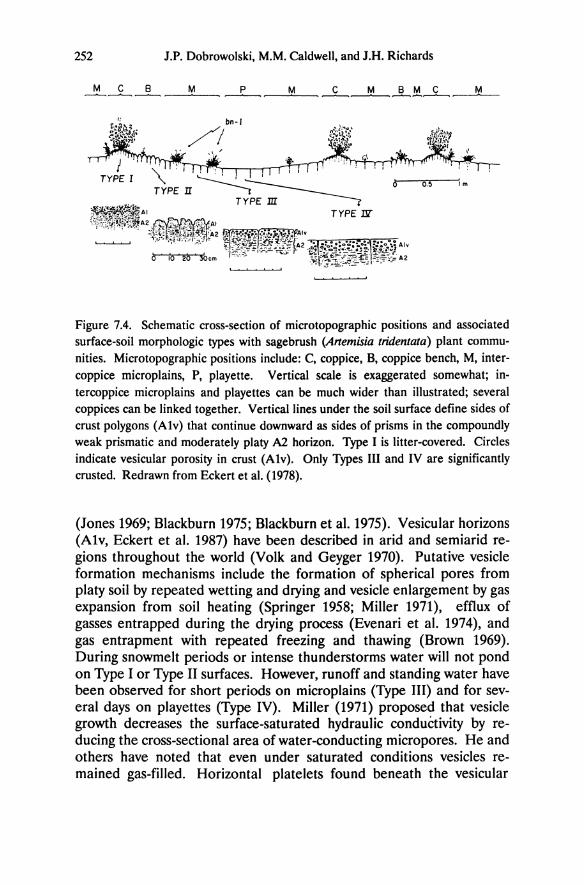
252 J.P. Dobrowolski, M.M. Caldwell, and J.H. Richards
p ~~.. bn-J
~ /{, . .,.fTh.-, ~~\~, ....--1'fT'rorr-11f'
TYPE I '\ ~ I ~~' olr' -""o,"'-!l--:,m TYPE II ----,
TYPE m TYPE 1Jl
Figure 7.4. Schematic cross-section of microtopographic positions and associated surface-soil morphologic types with sagebrush (Artemisia tridentata) plant communities. Microtopographic positions include: C, coppice, B, coppice bench, M, intercoppice microplains, P, playette. Vertical scale is exaggerated somewhat; intercoppice microplains and playettes can be much wider than illustrated; several coppices can be linked together. Vertical lines under the soil surface define sides of crust polygons (Alv) that continue downward as sides of prisms in the compoundly weak prismatic and moderately platy A2 horizon. Type I is litter-covered. Circles indicate vesicular porosity in crust (Alv). Only Types III and IV are significantly crusted. Redrawn from Eckert et al. (1978).
(Jones 1969; Blackburn 1975; Blackburn et al. 1975). Vesicular horizons (A1v. Eckert et al. 1987) have been described in arid and semiarid regions throughout the world (Volk and Geyger 1970). Putative vesicle formation mechanisms include the formation of spherical pores from platy soil by repeated wetting and drying and vesicle enlargement by gas expansion from soil heating (Springer 1958; Miller 1971). efflux of gasses entrapped during the drying process (Evenari et al. 1974). and gas entrapment with repeated freezing and thawing (Brown 1969). During snowmelt periods or intense thunderstorms water will not pond on Type I or Type II surfaces. However. runoff and standing water have been observed for short periods on microplains (Type III) and for several days on playettes (Type IV). Miller (1971) proposed that vesicle growth decreases the surface-saturated hydraulic conductivity by reducing the cross-sectional area of water-conducting micropores. He and others have noted that even under saturated conditions vesicles remained gas-filled. Horizontal platelets found beneath the vesicular
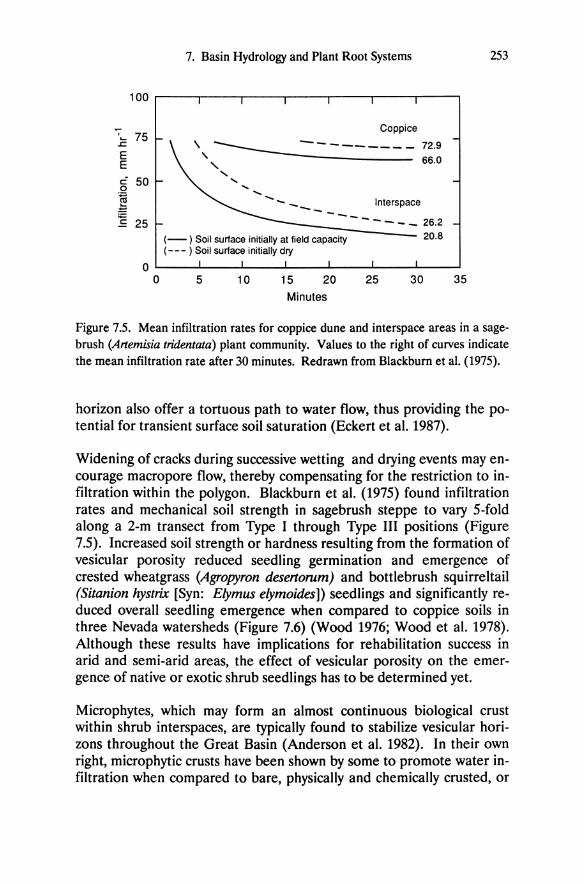
100
'7 75 .... .s= E E r: 50 0
~ ~
~ 25
0 0
7. Basin Hydrology and Plant Root Systems
Coppice
\ --, ------___ 72.9 , 66.0
"- .... .... .... .... - Interspace --- ---
(- ) Soil surface initially at field capacity (--- ) Soil surface initially dry
5 10 15 20 Minutes
- ---_ 26.2 20.8
25 30
253
35
Figure 7.5. Mean infiltration rates for coppice dune and interspace areas in a sagebrush (Artemisia tridentata) plant community. Values to the right of curves indicate the mean infiltration rate after 30 minutes. Redrawn from Blackburn et al. (1975).
horizon also offer a tortuous path to water flow, thus providing the potential for transient surface soil saturation (Eckert et al. 1987).
Widening of cracks during successive wetting and drying events may encourage macropore flow, thereby compensating for the restriction to infiltration within the polygon. Blackburn et al. (1975) found infiltration rates and mechanical soil strength in sagebrush steppe to vary 5-fold along a 2-m transect from Type I through Type III positions (Figure 7.5). Increased soil strength or hardness resulting from the formation of vesicular porosity reduced seedling germination and emergence of crested wheatgrass (Agropyron desertorum) and bottlebrush squirreltail (Sitanion hystrix [Syn: Elymus elymoides D seedlings and significantly reduced overall seedling emergence when compared to coppice soils in three Nevada watersheds (Figure 7.6) (Wood 1976; Wood et al. 1978). Although these results have implications for rehabilitation success in arid and semi-arid areas, the effect of vesicular porosity on the emergence of native or exotic shrub seedlings has to be determined yet.
Microphytes, which may form an almost continuous biological crust within shrub interspaces, are typically found to stabilize vesicular horizons throughout the Great Basin (Anderson et al. 1982). In their own right, microphytic crusts have been shown by some to promote water infiltration when compared to bare, physically and chemically crusted, or
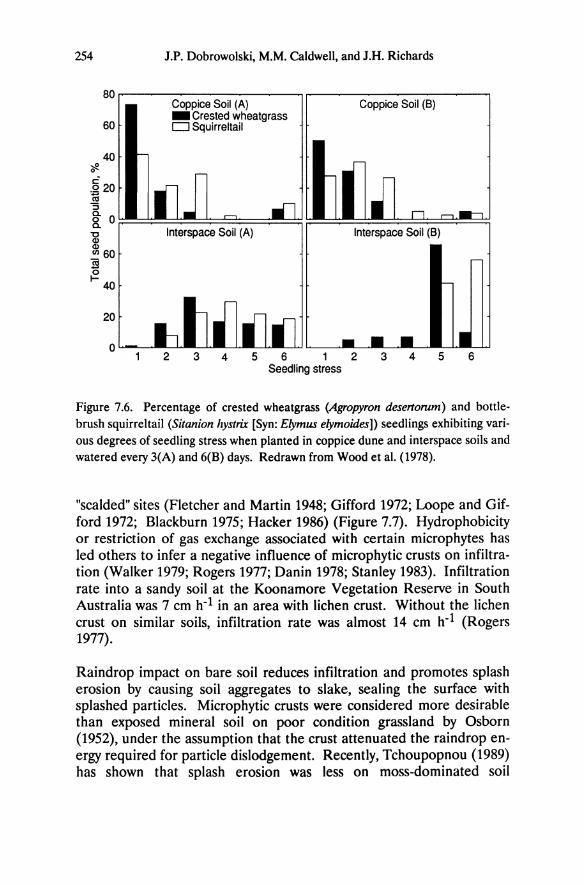
254
60
40 ~ r: .~ 20 "3
J.P. Dobrowolski, M.M. Caldwell, and J.H. Richards
Coppice Soil (A) _ Crested wheatgrass o Squirreltail
Coppice Soil (8)
& O~~~~~~======~~~~~~~~~~==~~~~ ~ Interspace Soil (A) Interspace Soil (8)
31 60
~ I- 40
20
o 2 3 4 5 6 1 2 345 6
Seedling stress
Figure 7.6. Percentage of crested wheatgrass (Agropyron desertorum) and bottlebrush squirreltail (Sitanion hystrix [Syn: Elymus elymoides)) seedlings exhibiting various degrees of seedling stress when planted in coppice dune and interspace soils and watered every 3(A) and 6(B) days. Redrawn from Wood et al. (1978).
"scalded" sites (Fletcher and Martin 1948; Gifford 1972; Loope and Gifford 1972; Blackburn 1975; Hacker 1986) (Figure 7.7). Hydrophobicity or restriction of gas exchange associated with certain microphytes has led others to infer a negative influence of microphytic crusts on infiltration (Walker 1979; Rogers 1977; Danin 1978; Stanley 1983). Infiltration rate into a sandy soil at the Koonamore Vegetation Reserve in South Australia was 7 cm h-1 in an area with lichen crust. Without the lichen crust on similar soils, infiltration rate was almost 14 cm h-1 (Rogers 1977).
Raindrop impact on bare soil reduces infiltration and promotes splash erosion by causing soil aggregates to slake, sealing the surface with splashed particles. Microphytic crusts were considered more desirable than exposed mineral soil on poor condition grassland by Osborn (1952), under the assumption that the crust attenuated the raindrop energy required for particle dislodgement. Recently, Tchoupopnou (1989) has shown that splash erosion was less on moss-dominated soil
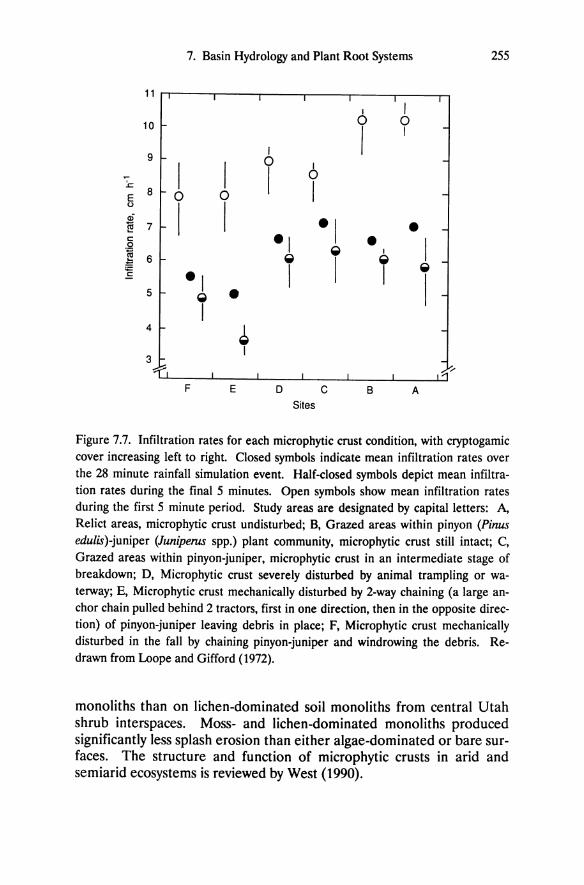
:c E 0
~ c: 0
~ :5 E
11
10
9
8
7
6
5
4
3 "'(,
I 0
I
7. Basin Hydrology and Plant Root Systems
I
I 0 I
I 0
I 0
I -I ~
I -I ~ -I
~ I
F E o Sites
, 0
I
-I ~
I
c
-, ~
I
B
I o ,
-
A
255
I ~
I
,,-'1
Figure 7.7. Infiltration rates for each microphytic crust condition, with cryptogamic cover increasing left to right. Closed symbols indicate mean infiltration rates over the 28 minute rainfall simulation event. Half-closed symbols depict mean infiltration rates during the final 5 minutes. Open symbols show mean infiltration rates during the first 5 minute period. Study areas are designated by capital letters: A, Relict areas, microphytic crust undisturbed; B, Grazed areas within pinyon (Pinus edu/is)-juniper (Juniperus spp.) plant community, microphytic crust still intact; C, Grazed areas within pinyon-juniper, microphytic crust in an intermediate stage of breakdown; D, Microphytic crust severely disturbed by animal trampling or waterway; E, Microphytic crust mechanically disturbed by 2-way chaining (a large anchor chain pulled behind 2 tractors, first in one direction, then in the opposite direction) of pinyon-juniper leaving debris in place; F, Microphytic crust mechanically disturbed in the fall by chaining pinyon-juniper and windrowing the debris. Redrawn from Loope and Gifford (1972).
monoliths than on lichen-dominated soil monoliths from central Utah shrub interspaces. Moss- and lichen-dominated monoliths produced significantly less splash erosion than either algae-dominated or bare surfaces. The structure and function of microphytic crusts in arid and semiarid ecosystems is reviewed by West (1990).
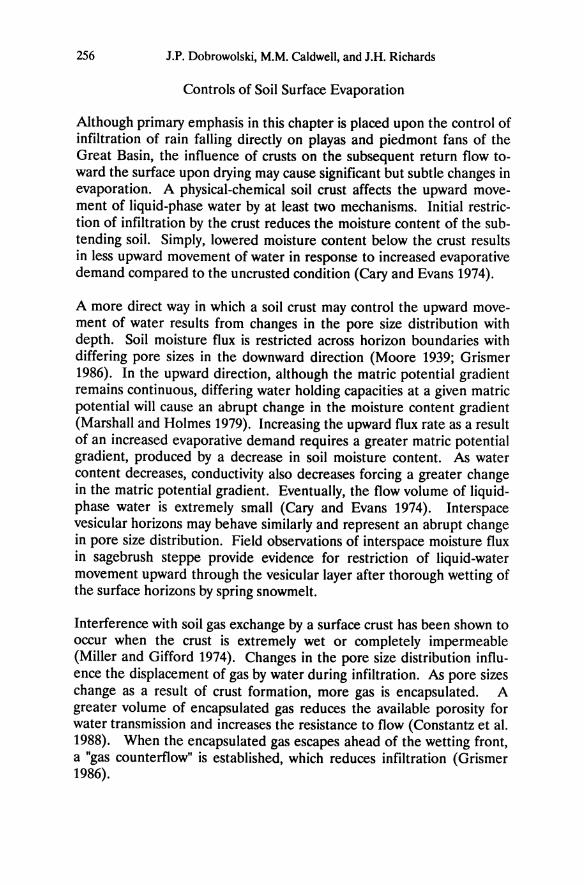
256 J.P. Dobrowolski, M.M. Caldwell, and J.H. Richards
Controls of Soil Surface Evaporation
Although primary emphasis in this chapter is placed upon the control of infiltration of rain falling directly on playas and piedmont fans of the Great Basin, the influence of crusts on the subsequent return flow toward the surface upon drying may cause significant but subtle changes in evaporation. A physical-chemical soil crust affects the upward movement of liquid-phase water by at least two mechanisms. Initial restriction of infiltration by the crust reduces the moisture content of the subtending soil. Simply, lowered moisture content below the crust results in less upward movement of water in response to increased evaporative demand compared to the uncrusted condition (Cary and Evans 1974).
A more direct way in which a soil crust may control the upward movement of water results from changes in the pore size distribution with depth. Soil moisture flux is restricted across horizon boundaries with differing pore sizes in the downward direction (Moore 1939; Grismer 1986). In the upward direction, although the matric potential gradient remains continuous, differing water holding capacities at a given matric potential will cause an abrupt change in the moisture content gradient (Marshall and Holmes 1979). Increasing the upward flux rate as a result of an increased evaporative demand requires a greater matric potential gradient, produced by a decrease in soil moisture content. As water content decreases, conductivity also decreases forcing a greater change in the matric potential gradient. Eventually, the flow volume of Iiquidphase water is extremely small (Cary and Evans 1974). Interspace vesicular horizons may behave similarly and represent an abrupt change in pore size distribution. Field observations of interspace moisture flux in sagebrush steppe provide evidence for restriction of liquid-water movement upward through the vesicular layer after thorough wetting of the surface horizons by spring snowmelt.
Interference with soil gas exchange by a surface crust has been shown to occur when the crust is extremely wet or completely impermeable (Miller and Gifford 1974). Changes in the pore size distribution influence the displacement of gas by water during infiltration. As pore sizes change as a result of crust formation, more gas is encapsulated. A greater volume of encapsulated gas reduces the available porosity for water transmission and increases the resistance to flow (Constantz et al. 1988). When the encapsulated gas escapes ahead of the wetting front, a "gas counterflow" is established, which reduces infiltration (Grismer 1986).
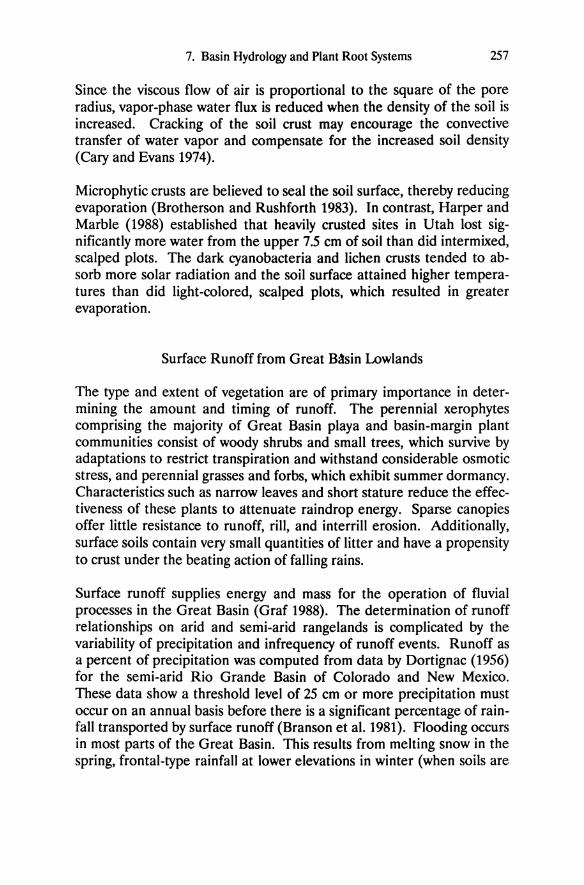
7. Basin Hydrology and Plant Root Systems 257
Since the viscous flow of air is proportional to the square of the pore radius, vapor-phase water flux is reduced when the density of the soil is increased. Cracking of the soil crust may encourage the convective transfer of water vapor and compensate for the increased soil density (Cary and Evans 1974).
Microphytic crusts are believed to seal the soil surface, thereby reducing evaporation (Brotherson and Rushforth 1983). In contrast, Harper and Marble (1988) established that heavily crusted sites in Utah lost significantly more water from the upper 7.5 cm of soil than did intermixed, scalped plots. The dark cyanobacteria and lichen crusts tended to absorb more solar radiation and the soil surface attained higher temperatures than did light-colored, scalped plots, which resulted in greater evaporation.
Surface Runoff from Great Bctsin Lowlands
The type and extent of vegetation are of primary importance in determining the amount and timing of runoff. The perennial xerophytes comprising the majority of Great Basin playa and basin-margin plant communities consist of woody shrubs and small trees, which survive by adaptations to restrict transpiration and withstand considerable osmotic stress, and perennial grasses and forbs, which exhibit summer dormancy. Characteristics such as narrow leaves and short stature reduce the effectiveness of these plants to attenuate raindrop energy. Sparse canopies offer little resistance to runoff, rill, and interrill erosion. Additionally, surface soils contain very small quantities of litter and have a propensity to crust under the beating action of falling rains.
Surface runoff supplies energy and mass for the operation of fluvial processes in the Great Basin (Graf 1988). The determination of runoff relationships on arid and semi-arid rangelands is complicated by the variability of precipitation and infrequency of runoff events. Runoff as a percent of precipitation was computed from data by Dortignac (1956) for the semi-arid Rio Grande Basin of Colorado and New Mexico. These data show a threshold level of 25 cm or more precipitation must occur on an annual basis before there is a significant percentage of rainfall transported by surface runoff (Branson et al. 1981). Flooding occurs in most parts of the Great Basin. This results from melting snow in the spring, frontal-type rainfall at lower elevations in winter (when soils are
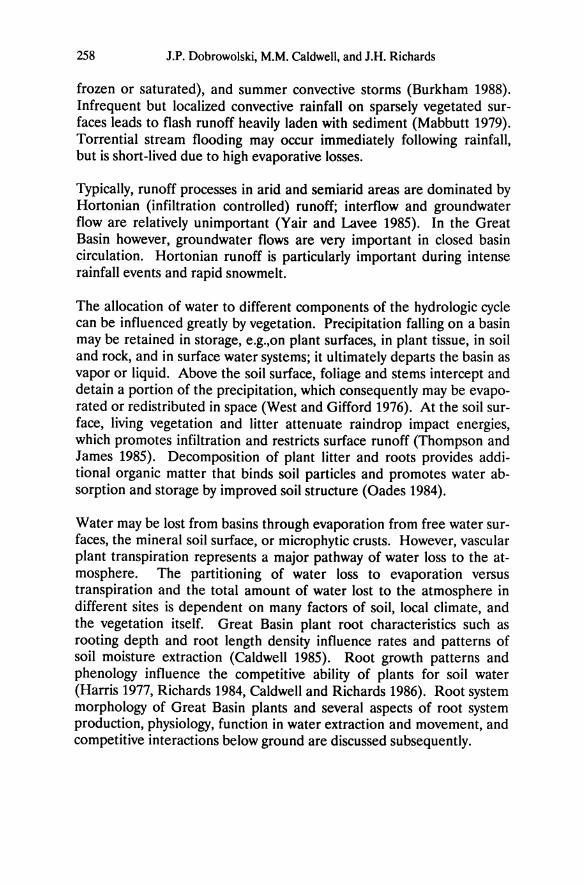
258 J.P. Dobrowolski, M.M. Caldwell, and J.H. Richards
frozen or saturated), and summer convective storms (Burkham 1988). Infrequent but localized convective rainfall on sparsely vegetated surfaces leads to flash runoff heavily laden with sediment (Mabbutt 1979). Torrential stream flooding may occur immediately following rainfall, but is short-lived due to high evaporative losses.
Typically, runoff processes in arid and semiarid areas are dominated by Hortonian (infiltration controlled) runoff; interflow and groundwater flow are relatively unimportant (Yair and Lavee 1985). In the Great Basin however, groundwater flows are very important in closed basin circulation. Hortonian runoff is particularly important during intense rainfall events and rapid snowmelt.
The allocation of water to different components of the hydrologic cycle can be influenced greatly by vegetation. Precipitation falling on a basin may be retained in storage, e.g.,on plant surfaces, in plant tissue, in soil and rock, and in surface water systems; it ultimately departs the basin as vapor or liquid. Above the soil surface, foliage and stems intercept and detain a portion of the precipitation, which consequently may be evaporated or redistributed in space (West and Gifford 1976). At the soil surface, living vegetation and litter attenuate raindrop impact energies, which promotes infiltration and restricts surface runoff (Thompson and James 1985). Decomposition of plant litter and roots provides additional organic matter that binds soil particles and promotes water absorption and storage by improved soil structure (Oades 1984).
Water may be lost from basins through evaporation from free water surfaces, the mineral soil surface, or microphytic crusts. However, vascular plant transpiration represents a major pathway of water loss to the atmosphere. The partitioning of water loss to evaporation versus transpiration and the total amount of water lost to the atmosphere in different sites is dependent on many factors of soil, local climate, and the vegetation itself. Great Basin plant root characteristics such as rooting depth and root length density influence rates and patterns of soil moisture extraction (Caldwell 1985). Root growth patterns and phenology influence the competitive ability of plants for soil water (Harris 1977, Richards 1984, Caldwell and Richards 1986). Root system morphology of Great Basin plants and several aspects of root system production, physiology, function in water extraction and movement, and competitive interactions below ground are discussed subsequently.
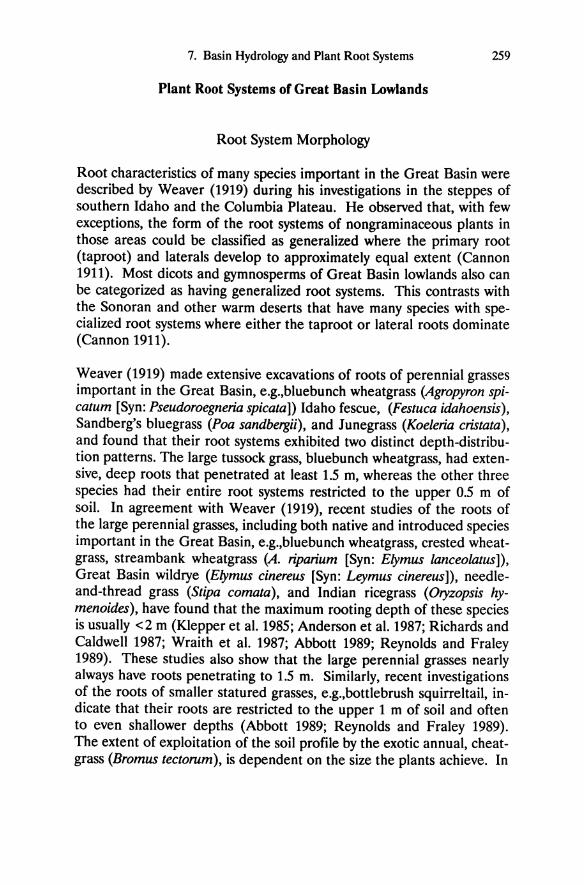
7. Basin Hydrology and Plant Root Systems 259
Plant Root Systems of Great Basin Lowlands
Root System Morphology
Root characteristics of many species important in the Great Basin were described by Weaver (1919) during his investigations in the steppes of southern Idaho and the Columbia Plateau. He observed that, with few exceptions, the form of the root systems of nongraminaceous plants in those areas could be classified as generalized where the primary root (taproot) and laterals develop to approximately equal extent (Cannon 1911). Most dicots and gymnosperms of Great Basin lowlands also can be categorized as having generalized root systems. This contrasts with the Sonoran and other warm deserts that have many species with specialized root systems where either the taproot or lateral roots dominate (Cannon 1911).
Weaver (1919) made extensive excavations of roots of perennial grasses important in the Great Basin, e.g.,bluebunch wheatgrass (Agropyron spicatum [Syn: Pseudoroegneria spicata]) Idaho fescue, (Festuca idahoensis), Sandberg's bluegrass (Poa sandbergii), and Junegrass (Koeleria cristata), and found that their root systems exhibited two distinct depth-distribution patterns. The large tussock grass, bluebunch wheatgrass, had extensive, deep roots that penetrated at least 1.5 m, whereas the other three species had their entire root systems restricted to the upper 0.5 m of soil. In agreement with Weaver (1919), recent studies of the roots of the large perennial grasses, including both native and introduced species important in the Great Basin, e.g.,bluebunch wheatgrass, crested wheatgrass, stream bank wheatgrass (A. riparium [Syn: Elymus lanceolatus D, Great Basin wildrye (Elymus cinereus [Syn: Leymus cinereusD, needleand-thread grass (Stipa comata), and Indian ricegrass (Oryzopsis hymenoides), have found that the maximum rooting depth of these species is usually <2 m (Klepper et al. 1985; Anderson et al. 1987; Richards and Caldwell 1987; Wraith et al. 1987; Abbott 1989; Reynolds and Fraley 1989). These studies also show that the large perennial grasses nearly always have roots penetrating to 1.5 m. Similarly, recent investigations of the roots of smaller statured grasses, e.g.,bottlebrush squirrel tail, indicate that their roots are restricted to the upper 1 m of soil and often to even shallower depths (Abbott 1989; Reynolds and Fraley 1989). The extent of exploitation of the soil profile by the exotic annual, cheatgrass (Bromus tectorum), is dependent on the size the plants achieve. In
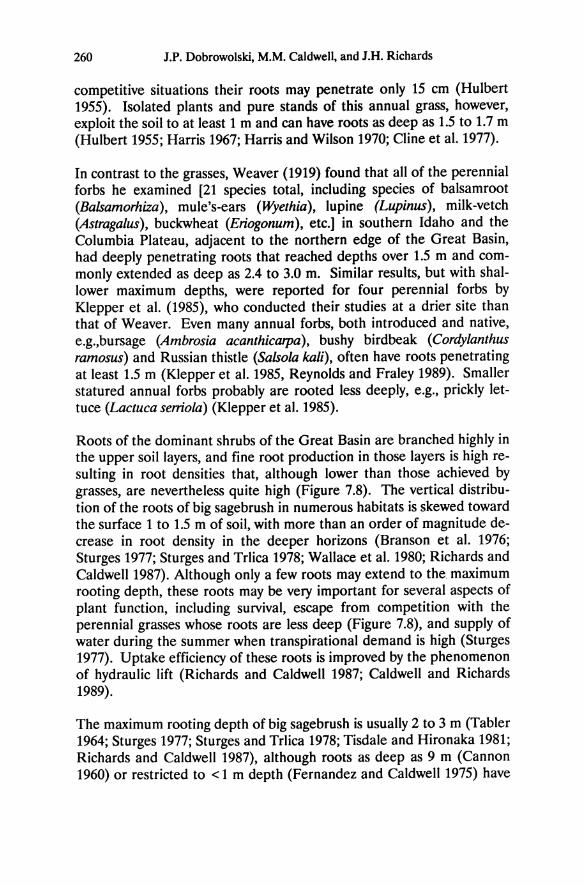
260 J.P. Dobrowolski, M.M. Caldwell, and J.H. Richards
competitive situations their roots may penetrate only 15 cm (Hulbert 1955). Isolated plants and pure stands of this annual grass, however, exploit the soil to at least 1 m and can have roots as deep as 1.5 to 107m (Hulbert 1955; Harris 1967; Harris and Wilson 1970; Cline et at. 1977).
In contrast to the grasses, Weaver (1919) found that all of the perennial forbs he examined [21 species total, including species of balsamroot (Balsamorhiza) , mule's-ears (Wyethia) , lupine (Lupinus) , milk-vetch (Astragalus), buckwheat (Eriogonum), etc.] in southern Idaho and the Columbia Plateau, adjacent to the northern edge of the Great Basin, had deeply penetrating roots that reached depths over 1.5 m and commonly extended as deep as 2.4 to 3.0 m. Similar results, but with shallower maximum depths, were reported for four perennial forbs by Klepper et at. (1985), who conducted their studies at a drier site than that of Weaver. Even many annual forbs, both introduced and native, e.g.,bursage (Ambrosia acanthicarpa), bushy birdbeak (Cordylanthus ramosus) and Russian thistle (Salsola kali), often have roots penetrating at least 1.5 m (Klepper et at. 1985, Reynolds and Fraley 1989). Smaller statu red annual forbs probably are rooted less deeply, e.g., prickly lettuce (Lactuca serriola) (Klepper et at. 1985).
Roots of the dominant shrubs of the Great Basin are branched highly in the upper soil layers, and fine root production in those layers is high resulting in root densities that, although lower than those achieved by grasses, are nevertheless quite high (Figure 7.8). The vertical distribution of the roots of big sagebrush in numerous habitats is skewed toward the surface 1 to 1.5 m of soil, with more than an order of magnitude decrease in root density in the deeper horizons (Branson et at. 1976; Sturges 1977; Sturges and Trlica 1978; Wallace et at. 1980; Richards and Caldwell 1987). Although only a few roots may extend to the. maximum rooting depth, these roots may be very important for several aspects of plant function, including survival, escape from competition with the perennial grasses whose roots are less deep (Figure 7.8), and supply of water during the summer when transpirational demand is high (Sturges 1977). Uptake efficiency of these roots is improved by the phenomenon of hydraulic lift (Richards and Caldwell 1987; Caldwell and Richards 1989).
The maximum rooting depth of big sagebrush is usually 2 to 3 m (Tabler 1964; Sturges 1977; Sturges and Trlica 1978; Tisdale and Hironaka 1981; Richards and Caldwell 1987), although roots as deep as 9 m (Cannon 1960) or restricted to < 1 m depth (Fernandez and Caldwell 1975) have
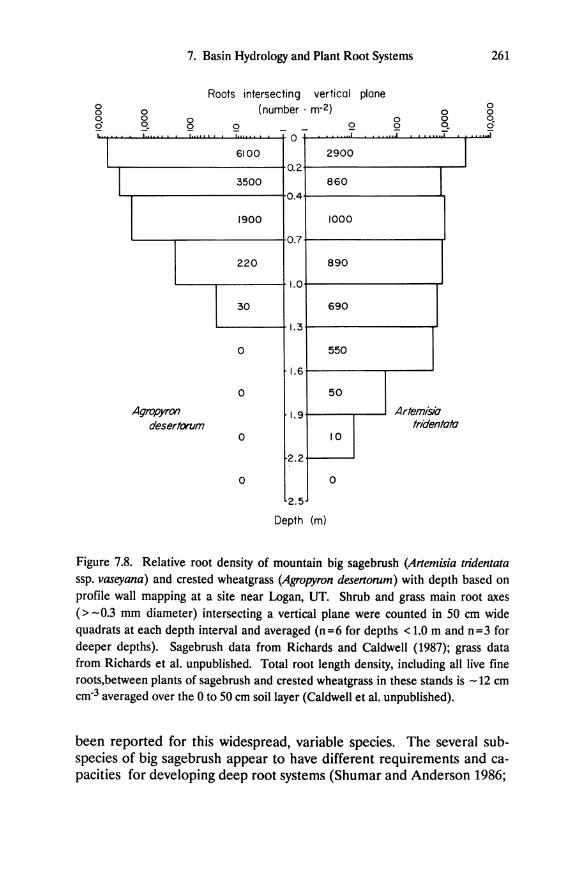
I I
7. Basin Hydrology and Plant Root Systems
o g
Agropyron desertorum
Roots intersecting vertical plane (number . m-2)
6100
3500
1900
220
30
0
0
0
0
- -o
0.2
0.4
0.7
1.0
1.3
1.6
1.9
2.2
2.5
Depth (m)
2900
860
1000
890
690
550
50
10
0
8 q. -
Artemisia fridentoto
I
261
o o C!. Q
Figure 7.8. Relative root density of mountain big sagebrush (Artemisia tridentata ssp. vaseyana) and crested wheatgrass (Agropyron desertorum) with depth based on profile wall mapping at a site near Logan, UT. Shrub and grass main root axes (> -0.3 mm diameter) intersecting a vertical plane were counted in 50 em wide quadrats at each depth interval and averaged (n=6 for depths < 1.0 m and n=3 for deeper depths). Sagebrush data from Richards and Caldwell (1987); grass data from Richards et al. unpublished. Total root length density, including all live fine roots,between plants of sagebrush and crested wheatgrass in these stands is -12 em cm-3 averaged over the 0 to 50 cm soil layer (Caldwell et al. unpublished).
been reported for this widespread, variable species. The several subspecies of big sagebrush appear to have different requirements and capacities for developing deep root systems (Shumar and Anderson 1986;
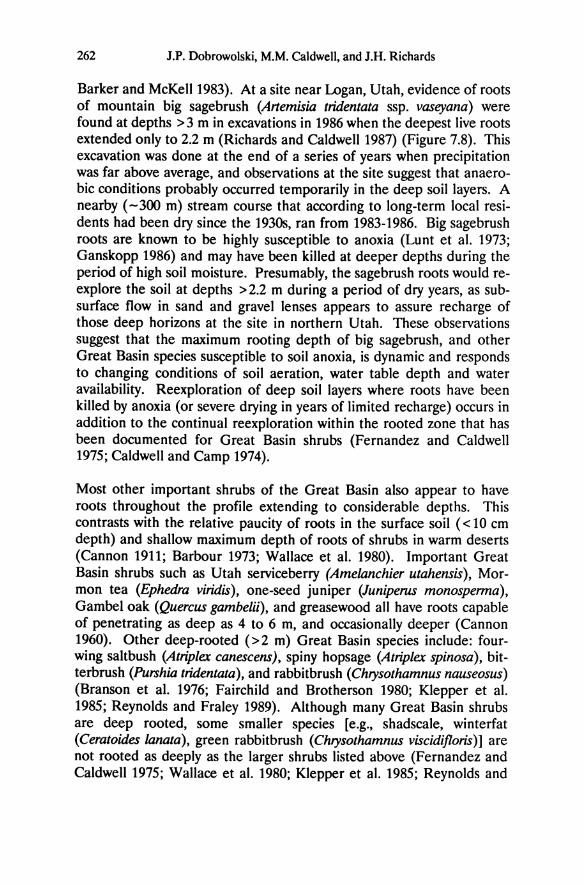
262 J.P. Dobrowolski, M.M. Caldwell, and J.H. Richards
Barker and McKell 1983). At a site near Logan, Utah, evidence of roots of mountain big sagebrush (Artemisia tridentata ssp. vaseyana) were found at depths > 3 m in excavations in 1986 when the deepest live roots extended only to 2.2 m (Richards and Caldwell 1987) (Figure 7.8). This excavation was done at the end of a series of years when precipitation was far above average, and observations at the site suggest that anaerobic conditions probably occurred temporarily in the deep soil layers. A nearby (-300 m) stream course that according to long-term local residents had been dry since the 1930s, ran from 1983-1986. Big sagebrush roots are known to be highly susceptible to anoxia (Lunt et al. 1973; Ganskopp 1986) and may have been killed at deeper depths during the period of high soil moisture. Presumably, the sagebrush roots would reexplore the soil at depths > 2.2 m during a period of dry years, as subsurface flow in sand and gravel lenses appears to assure recharge of those deep horizons at the site in northern Utah. These observations suggest that the maximum rooting depth of big sagebrush, and other Great Basin species susceptible to soil anoxia, is dynamic and responds to changing conditions of soil aeration, water table depth and water availability. Reexploration of deep soil layers where roots have been killed by anoxia (or severe drying in years of limited recharge) occurs in addition to the continual reexploration within the rooted zone that has been documented for Great Basin shrubs (Fernandez and Caldwell 1975; Caldwell and Camp 1974).
Most other important shrubs of the Great Basin also appear to have roots throughout the profile extending to considerable depths. This contrasts with the relative paucity of roots in the surface soil « 10 cm depth) and shallow maximum depth of roots of shrubs in warm deserts (Cannon 1911; Barbour 1973; Wallace et al. 1980). Important Great Basin shrubs such as Utah serviceberry (Amelanchier utahensis), Mormon tea (Ephedra viridis), one-seed juniper (Juniperus monosperma), Gambel oak (Quercus gambelii), and greasewood all have roots capable of penetrating as deep as 4 to 6 m, and occasionally deeper (Cannon 1960). Other deep-rooted (>2 m) Great Basin species include: fourwing saltbush (Atriplex canescens), spiny hopsage (Atriplex spinosa), bitterbrush (Purshia tridentata), and rabbitbrush (Chrysothamnus nauseosus) (Branson et al. 1976; Fairchild and Brotherson 1980; Klepper et al. 1985; Reynolds and Fraley 1989). Although many Great Basin shrubs are deep rooted, some smaller species [e.g., shadscale, winterfat (Ceratoides lanata), green rabbitbrush (Chrysothamnus viscidifloris)] are not rooted as deeply as the larger shrubs listed above (Fernandez and Caldwell 1975; Wallace et al. 1980; Klepper et al. 1985; Reynolds and
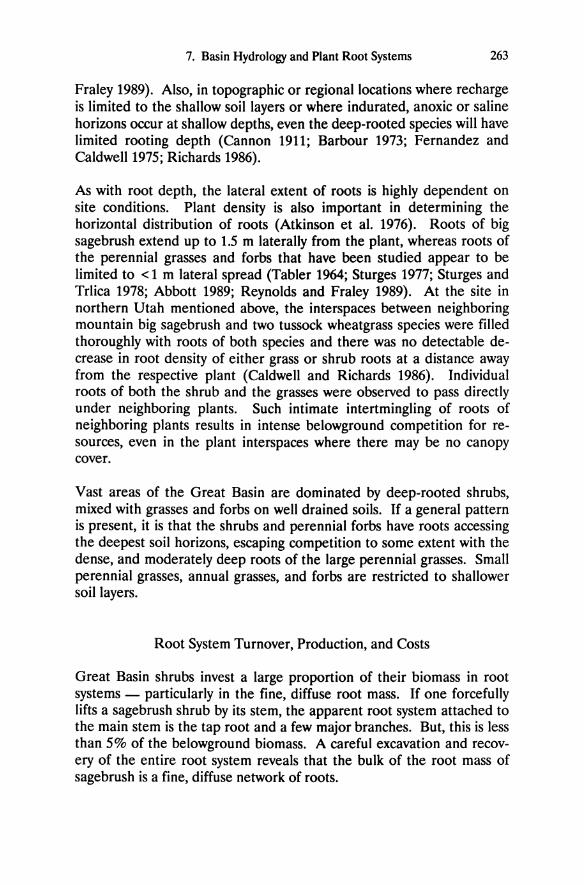
7. Basin Hydrology and Plant Root Systems 263
Fraley 1989). Also, in topographic or regional locations where recharge is limited to the shallow soil layers or where indurated, anoxic or saline horizons occur at shallow depths, even the deep-rooted species will have limited rooting depth (Cannon 1911; Barbour 1973; Fernandez and Caldwell 1975; Richards 1986).
As with root depth, the lateral extent of roots is highly dependent on site conditions. Plant density is also important in determining the horizontal distribution of roots (Atkinson et al. 1976). Roots of big sagebrush extend up to 1.5 m laterally from the plant, whereas roots of the perennial grasses and forbs that have been studied appear to be limited to < 1 m lateral spread (Tabler 1964; Sturges 1977; Sturges and Trlica 1978; Abbott 1989; Reynolds and Fraley 1989). At the site in northern Utah mentioned above, the interspaces between neighboring mountain big sagebrush and two tussock wheatgrass species were filled thoroughly with roots of both species and there was no detectable decrease in root density of either grass or shrub roots at a distance away from the respective plant (Caldwell and Richards 1986). Individual roots of both the shrub and the grasses were observed to pass directly under neighboring plants. Such intimate intertmingling of roots of neighboring plants results in intense belowground competition for resources, even in the plant interspaces where there may be no canopy cover.
Vast areas of the Great Basin are dominated by deep-rooted shrubs, mixed with grasses and forbs on well drained soils. If a general pattern is present, it is that the shrubs and perennial forbs have roots accessing the deepest soil horizons, escaping competition to some extent with the dense, and moderately deep roots of the large perennial grasses. Small perennial grasses, annual grasses, and forbs are restricted to shallower soil layers.
Root System Turnover, Production, and Costs
Great Basin shrubs invest a large proportion of their biomass in root systems - particularly in the fine, diffuse root mass. If one forcefully lifts a sagebrush shrub by its stem, the apparent root system attached to the main stem is the tap root and a few major branches. But, this is less than 5% of the belowground biomass. A careful excavation and recovery of the entire root system reveals that the bulk of the root mass of sagebrush is a fine, diffuse network of roots.
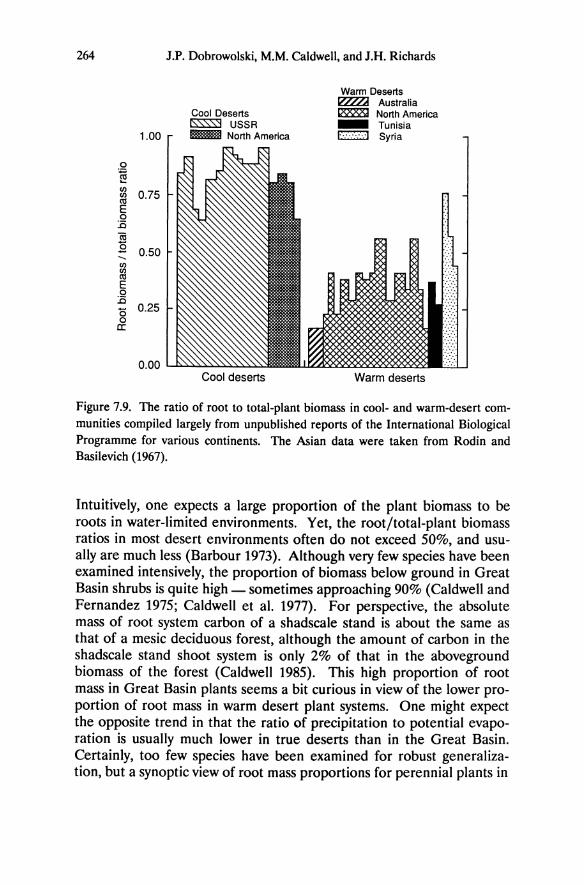
264
1.00
0
'e C/)
0.75 C/)
til E 0 :.c iii .8 0.50 --C/) C/)
til E 0
:.c 0.25 "0
0 cr:
J.P. Dobrowolski, M.M. Caldwell, and J.H. Richards
Cool Deserts ~ USSR ~ North America
Cool deserts
Warm Deserts I?ZZ.Z.!I Australia ~ North America _ Tunisia c::::J Syria
Warm deserts
Figure 7.9. The ratio of root to total-plant biomass in cool- and warm-desert communities compiled largely from unpublished reports of the International Biological Programme for various continents. The Asian data were taken from Rodin and Basilevich (1967).
Intuitively, one expects a large proportion of the plant biomass to be roots in water-limited environments. Yet, the root/total-plant biomass ratios in most desert environments often do not exceed 50%, and usually are much less (Barbour 1973). Although very few species have been examined intensively, the proportion of biomass below ground in Great Basin shrubs is quite high - sometimes approaching 90% (Caldwell and Fernandez 1975; Caldwell et al. 1977). For perspective, the absolute mass of root system carbon of a shadscale stand is about the same as that of a mesic deciduous forest, although the amount of carbon in the shadscale stand shoot system is only 2% of that in the aboveground biomass of the forest (Caldwell 1985). This high proportion of root mass in Great Basin plants seems a bit curious in view of the lower proportion of root mass in warm desert plant systems. One might expect the opposite trend in that the ratio of precipitation to potential evaporation is usually much lower in true deserts than in the Great Basin. Certainly, too few species have been examined for robust generalization, but a synoptic view of root mass proportions for perennial plants in
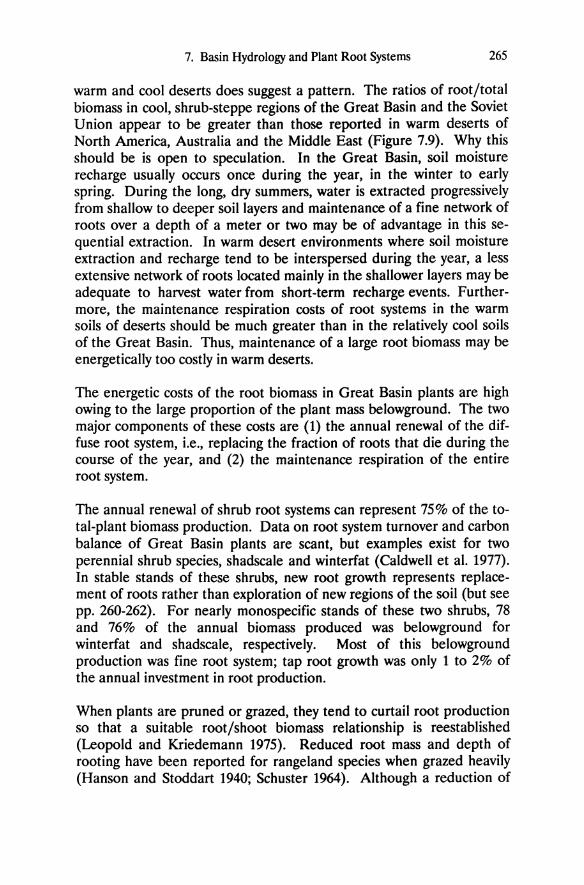
7. Basin Hydrology and Plant Root Systems 265
warm and cool deserts does suggest a pattern. The ratios of root/total biomass in cool, shrub-steppe regions of the Great Basin and the Soviet Union appear to be greater than those reported in warm deserts of North America, Australia and the Middle East (Figure 7.9). Why this should be is open to speculation. In the Great Basin, soil moisture recharge usually occurs once during the year, in the winter to early spring. During the long, dry summers, water is extracted progressively from shallow to deeper soil layers and maintenance of a fine network of roots over a depth of a meter or two may be of advantage in this sequential extraction. In warm desert environments where soil moisture extraction and recharge tend to be interspersed during the year, a less extensive network of roots located mainly in the shallower layers may be adequate to harvest water from short-term recharge events. Furthermore, the maintenance respiration costs of root systems in the warm soils of deserts should be much greater than in the relatively cool soils of the Great Basin. Thus, maintenance of a large root biomass may be energetically too costly in warm deserts.
The energetic costs of the root biomass in Great Basin plants are high owing to the large proportion of the plant mass belowground. The two major components of these costs are (1) the annual renewal of the diffuse root system, i.e., replacing the fraction of roots that die during the course of the year, and (2) the maintenance respiration of the entire root system.
The annual renewal of shrub root systems can represent 75% of the total-plant biomass production. Data on root system turnover and carbon balance of Great Basin plants are scant, but examples exist for two perennial shrub species, shadscale and winterfat (Caldwell et al. 1977). In stable stands of these shrubs, new root growth represents replacement of roots rather than exploration of new regions of the soil (but see pp. 260-262). For nearly monospecific stands of these two shrubs, 78 and 76% of the annual biomass produced was belowground for winterfat and shadscale, respectively. Most of this belowground production was fine root system; tap root growth was only 1 to 2% of the annual investment in root production.
When plants are pruned or grazed, they tend to curtail root production so that a suitable root/shoot biomass relationship is reestablished (Leopold and Kriedemann 1975). Reduced root mass and depth of rooting have been reported for rangeland species when grazed heavily (Hanson and Stoddart 1940; Schuster 1964). Although a reduction of
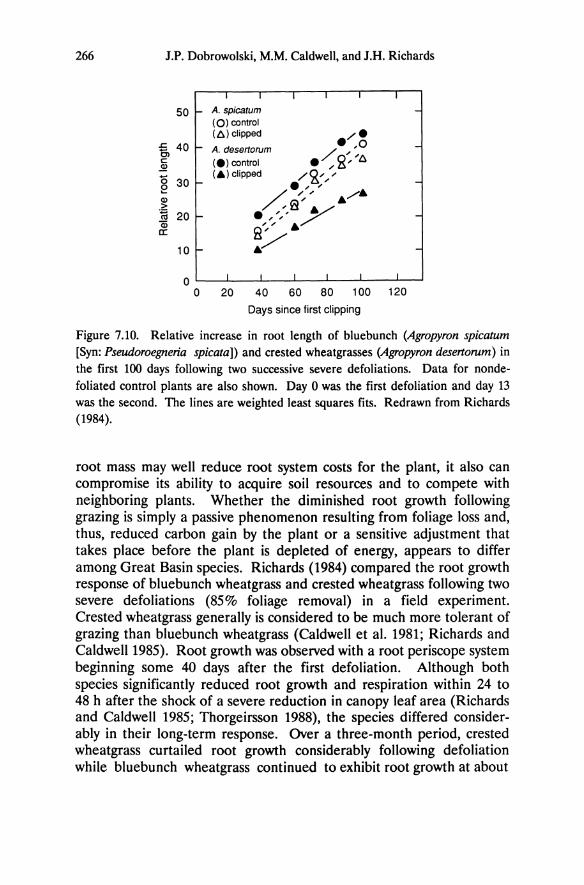
266 J.P. Dobrowolski, M.M. Caldwell, and J.H. Richards
I I I I I I
50 _ A. spicatum (0) control (LI.) clipped e":~ -5 40 - A. desertorum -
Cl e~~~'LI. c: (e) control ~ (5 30 r
(.)clipped /~"";; -e e, , CD / /;' ....... > e ,,;,8 y ~ 20 r -iii g"; • a:
10 I- / -
0 I I I I ~ I
a 20 40 60 80 100 120
Days since first clipping
Figure 7.10. Relative increase in root length of bluebunch (Agropyron spicatum [Syn: Pseudoroegneria spicata]) and crested wheatgrasses (Agropyron desertorum) in the first 100 days following two successive severe defoliations. Data for nondefoliated control plants are also shown. Day 0 was the first defoliation and day 13 was the second. The lines are weighted least squares fits. Redrawn from Richards (1984).
root mass may well reduce root system costs for the plant, it also can compromise its ability to acquire soil resources and to compete with neighboring plants. Whether the diminished root growth following grazing is simply a passive phenomenon resulting from foliage loss and, thus, reduced carbon gain by the plant or a sensitive adjustment that takes place before the plant is depleted of energy, appears to differ among Great Basin species. Richards (1984) compared the root growth response of bluebunch wheatgrass and crested wheatgrass following two severe defoliations (85% foliage removal) in a field experiment. Crested wheatgrass generally is considered to be much more tolerant of grazing than bluebunch wheatgrass (Caldwell et al. 1981; Richards and Caldwell 1985). Root growth was observed with a root periscope system beginning some 40 days after the first defoliation. Although both species significantly reduced root growth and respiration within 24 to 48 h after the shock of a severe reduction in canopy leaf area (Richards and Caldwell 1985; Thorgeirsson 1988), the species differed considerably in their long-term response. Over a three-month period, crested wheatgrass curtailed root growth considerably following defoliation while bluebunch wheatgrass continued to exhibit root growth at about
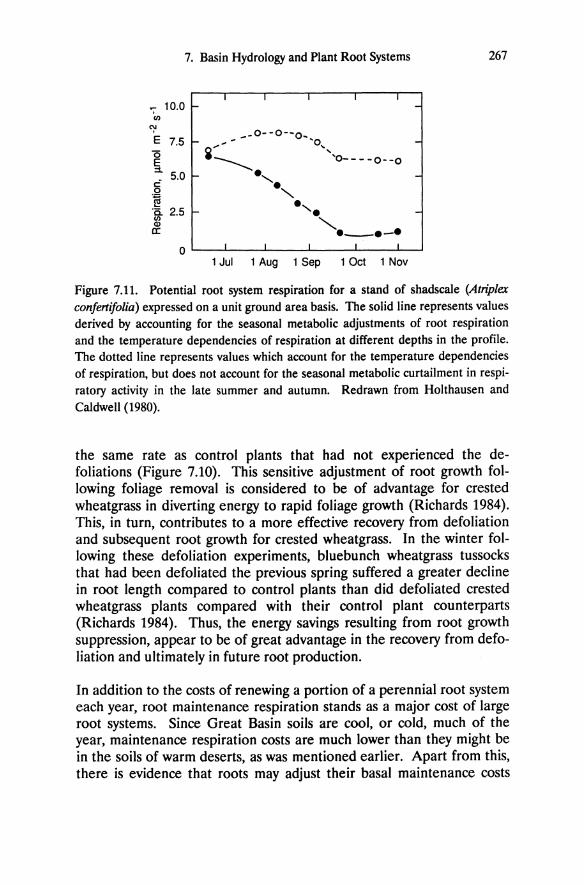
7. Basin Hydrology and Plant Root Systems 267
I I I I I
";" 10.0 r- -(/l
1 Jul 1 Aug 1 Sep 1 Oct 1 Nov
Figure 7.11. Potential root system respiration for a stand of shadscale (Atrip/ex confertifolia) expressed on a unit ground area basis. The solid line represents values derived by accounting for the seasonal metabolic adjustments of root respiration and the temperature dependencies of respiration at different depths in the profile. The dotted line represents values which account for the temperature dependencies of respiration, but does not account for the seasonal metabolic curtailment in respiratory activity in the late summer and autumn. Redrawn from Holthausen and Caldwell (1980).
the same rate as control plants that had not experienced the defoliations (Figure 7.10). This sensitive adjustment of root growth following foliage removal is considered to be of advantage for crested wheatgrass in diverting energy to rapid foliage growth (Richards 1984). This, in turn, contributes to a more effective recovery from defoliation and subsequent root growth for crested wheatgrass. In the winter following these defoliation experiments, bluebunch wheatgrass tussocks that had been defoliated the previous spring suffered a greater decline in root length compared to control plants than did defoliated crested wheatgrass plants compared with their control plant counterparts (Richards 1984). Thus, the energy savings resulting from root growth suppression, appear to be of great advantage in the recovery from defoliation and ultimately in future root production.
In addition to the costs of renewing a portion of a perennial root system each year, root maintenance respiration stands as a major cost of large root systems. Since Great Basin soils are cool, or cold, much of the year, maintenance respiration costs are much lower than they might be in the soils of warm deserts, as was mentioned earlier. Apart from this, there is evidence that roots may adjust their basal maintenance costs
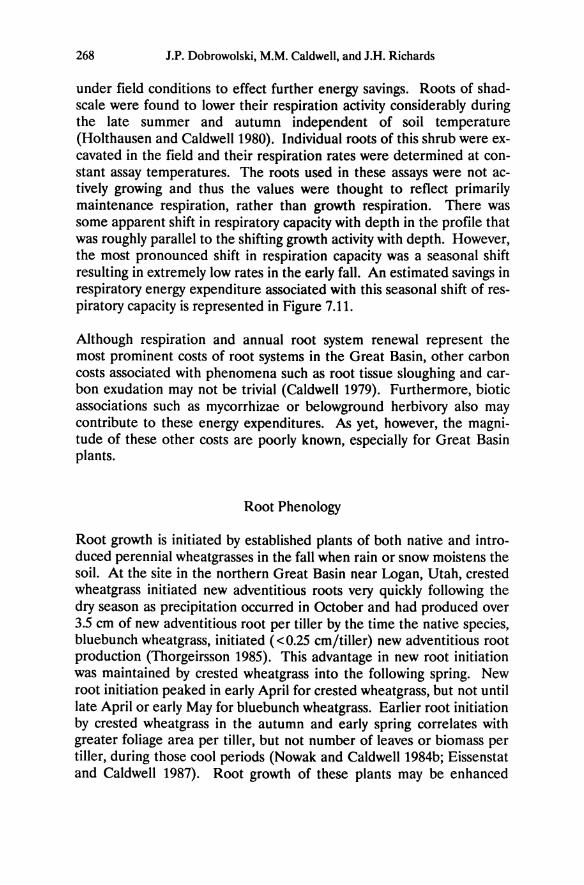
268 J.P. Dobrowolski, M.M. Caldwell, and J.H. Richards
under field conditions to effect further energy savings. Roots of shadscale were found to lower their respiration activity considerably during the late summer and autumn independent of soil temperature (Holthausen and Caldwell 1980). Individual roots of this shrub were excavated in the field and their respiration rates were determined at constant assay temperatures. The roots used in these assays were not actively growing and thus the values were thought to reflect primarily maintenance respiration, rather than growth respiration. There was some apparent shift in respiratory capacity with depth in the profile that was roughly parallel to the shifting growth activity with depth. However, the most pronounced shift in respiration capacity was a seasonal shift resulting in extremely low rates in the early fall. An estimated savings in respiratory energy expenditure associated with this seasonal shift of respiratory capacity is represented in Figure 7.11.
Although respiration and annual root system renewal represent the most prominent costs of root systems in the Great Basin, other carbon costs associated with phenomena such as root tissue sloughing and carbon exudation may not be trivial (Caldwell 1979). Furthermore, biotic associations such as mycorrhizae or belowground herbivory also may contribute to these energy expenditures. As yet, however, the magnitude of these other costs are poorly known, especially for Great Basin plants.
Root Phenology
Root growth is initiated by established plants of both native and introduced perennial wheatgrasses in the fall when rain or snow moistens the soil. At the site in the northern Great Basin near Logan, Utah, crested wheatgrass initiated new adventitious roots very quickly following the dry season as precipitation occurred in October and had produced over 3.5 cm of new adventitious root per tiller by the time the native species, bluebunch wheatgrass, initiated ( < 0.25 cm/tiller) new adventitious root production (Thorgeirsson 1985). This advantage in new root initiation was maintained by crested wheatgrass into the following spring. New root initiation peaked in early April for crested wheatgrass, but not until late April or early May for bluebunch wheatgrass. Earlier root initiation by crested wheatgrass in the autumn and early spring correlates with greater foliage area per tiller, but not number of leaves or biomass per tiller, during those cool periods (Nowak and Caldwell 1984b; Eissenstat and Caldwell 1987). Root growth of these plants may be enhanced
7. Basin Hydrology and Plant Root Systems 269
during brief periods of warmer temperatures in the cool seasons partly because some photosynthate can be produced by overwintering basal green leaves (Nowak and Caldwell 1984b).
Winter root growth into disturbed soil patches at the same site in the northern Great Basin was greater for crested wheatgrass than for bluebunch wheatgrass, but the benefits of this root growth were not detected immediately by uptake of radioactive phosphorus placed in the disturbed soils (Eissenstat and Caldwell 1989). These authors discussed the difficulty of extrapolating results showing greater root growth at low soil temperatures (Harris and Wilson 1970; Eissenstat and Caldwell 1987) to an immediate advantage in resource acquisition under field conditions. Nevertheless, crested wheatgrass appears to have greater ability than the native bluebunch wheatgrass to grow both new adventitious root axes and lateral roots from preexisting axes during the cool conditions of autumn, winter and early spring. Destructive harvests of plants on the same field site indicated that total root biomass and nitrogen acquisition of crested wheatgrass increased one month earlier in the spring than it did for bluebunch wheatgrass (Caldwell et at. 1981). Early root growth may be important not only for acquisition of some resources, such as nitrogen, that are only available temporarily, but also may result in the placement of roots in locations or horizons of the soil where resources remain available longer as resource supply becomes limiting later in the season.
Under cold conditions an advantage similar to that of crested wheatgrass is likely to be important for the success of introduced annual grasses like cheatgrass and medusahead (Taeniatherum asperum), seedlings of which are capable of root growth at soil temperatures as low as 2 to 3° C (Harris 1967, 1977; Harris and Wilson 1970). In the field studies by Harris (1967, 1977), much of the root growth of seedlings of these species occurred during late autumn and winter, placing roots deep in the profile before substantial canopy development and water use occurred in May. Here again, the benefit of root growth under cool conditions may not result in immediate resource gain, but this early growth places roots where they can acquire resources, especially water, when resource availability becomes limiting later in the season.
Root growth duration is greater than that of aboveground growth in perennial Great Basin plants. Root growth continued for several months into, or through, the dry summer period after shoot vegetative
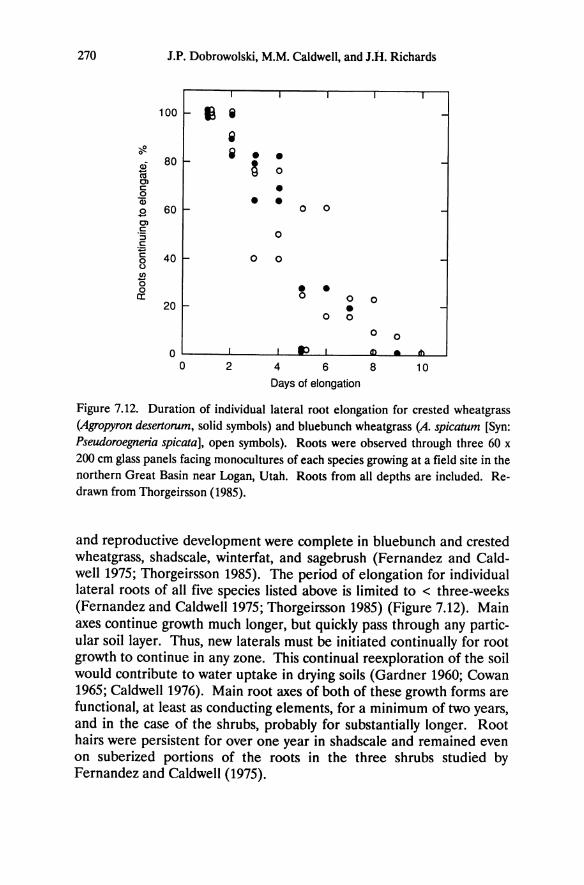
270
;,!! o
J.P. Dobrowolski, M.M. Caldwell, and J.R. Richards
I
100 r i i
Q Q •
~ 80 -
• 60 -
40 - o
20 t-
I
• o
• • o
o
o
I
o
• o • o 0
I I
o
o o
-
-
-
-
o ~--~I ____ ~I __ ~~_~I __ ~~~~.L-~~~~
o 2 4 6 8 10
Days of elongation
Figure 7.12. Duration of individual lateral root elongation for crested wheatgrass (Agropyron desertorum, solid symbols) and bluebunch wheatgrass (A. spicatum [Syn: Pseudoroegneria spicataj, open symbols). Roots were observed through three 60 x 200 cm glass panels facing monocuItures of each species growing at a field site in the northern Great Basin near Logan, Utah. Roots from all depths are included. Redrawn from Thorgeirsson (1985).
and reproductive development were complete in bluebunch and crested wheatgrass, shadscale, winterfat, and sagebrush (Fernandez and Caldwell 1975; Thorgeirsson 1985). The period of elongation for individual lateral roots of all five species listed above is limited to < three-weeks (Fernandez and Caldwell 1975; Thorgeirsson 1985) (Figure 7.12). Main axes continue growth much longer, but quickly pass through any particular soil layer. Thus, new laterals must be initiated continually for root growth to continue in any zone. This continual reexploration of the soil would contribute to water uptake in drying soils (Gardner 1960; Cowan 1965; Caldwell 1976). Main root axes of both of these growth forms are functional, at least as conducting elements, for a minimum of two years, and in the case of the shrubs, probably for substantially longer. Root hairs were persistent for over one year in shadscale and remained even on suberized portions of the roots in the three shrubs studied by Fernandez and Caldwell (1975).
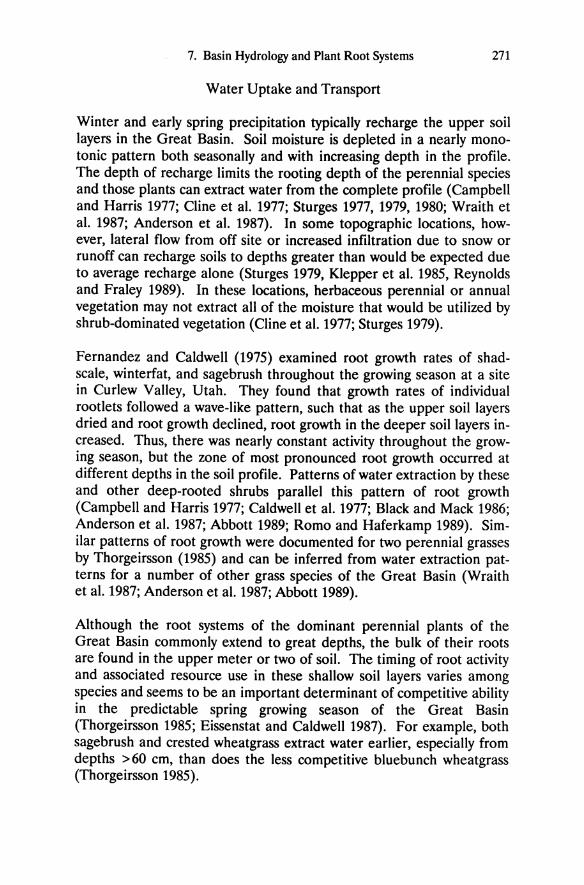
7. Basin Hydrology and Plant Root Systems 271
Water Uptake and Transport
Winter and early spring precipitation typically recharge the upper soil layers in the Great Basin. Soil moisture is depleted in a nearly monotonic pattern both seasonaIly and with increasing depth in the profile. The depth of recharge limits the rooting depth of the perennial species and those plants can extract water from the complete profile (Campbell and Harris 1977; Cline et al. 1977; Sturges 1977, 1979, 1980; Wraith et al. 1987; Anderson et al. 1987). In some topographic locations, however, lateral flow from off site or increased infiltration due to snow or runoff can recharge soils to depths greater than would be expected due to average recharge alone (Sturges 1979, Klepper et al. 1985, Reynolds and Fraley 1989). In these locations, herbaceous perennial or annual vegetation may not extract all of the moisture that would be utilized by shrub-dominated vegetation (Cline et al. 1977; Sturges 1979).
Fernandez and Caldwell (1975) examined root growth rates of shadscale, winterfat, and sagebrush throughout the growing season at a site in Curlew Valley, Utah. They found that growth rates of individual rootlets followed a wave-like pattern, such that as the upper soil layers dried and root growth declined, root growth in the deeper soil layers increased. Thus, there was nearly constant activity throughout the growing season, but the zone of most pronounced root growth occurred at different depths in the soil profile. Patterns of water extraction by these and other deep-rooted shrubs parallel this pattern of root growth (Campbell and Harris 1977; Caldwell et al. 1977; Black and Mack 1986; Anderson et al. 1987; Abbott 1989; Romo and Haferkamp 1989). Similar patterns of root growth were documented for two perennial grasses by Thorgeirsson (1985) and can be inferred from water extraction patterns for a number of other grass species of the Great Basin (Wraith et al. 1987; Anderson et al. 1987; Abbott 1989).
Although the root systems of the dominant perennial plants of the Great Basin commonly extend to great depths, the bulk of their roots are found in the upper meter or two of soil. The timing of root activity and associated resource use in these shallow soil layers varies among species and seems to be an important determinant of competitive ability in the predictable spring growing season of the Great Basin (Thorgeirsson 1985; Eissenstat and Caldwell 1987). For example, both sagebrush and crested wheatgrass extract water earlier, especially from depths > 60 cm, than does the less competitive bluebunch wheatgrass (Thorgeirsson 1985).
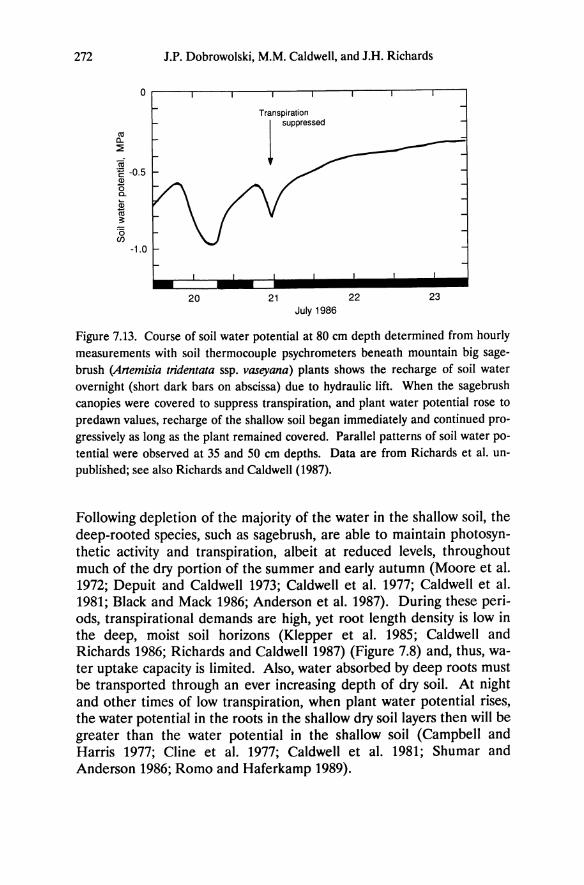
272 J.P. Dobrowolski, M.M. Caldwell, and J.H. Richards
o .---~----r----.----.----r----.----r---' Transpiration
I"P'~'"'
-1.0
20 21 22 23 July 1986
Figure 7.13. Course of soil water potential at 80 cm depth determined from hourly measurements with soil thermocouple psychrometers beneath mountain big sagebrush (Artemisia tridentala ssp. vaseyana) plants shows the recharge of soil water overnight (short dark bars on abscissa) due to hydraulic lift. When the sagebrush canopies were covered to suppress transpiration, and plant water potential rose to predawn values, recharge of the shallow soil began immediately and continued progressively as long as the plant remained covered. Parallel patterns of soil water potential were observed at 35 and 50 cm depths. Data are from Richards et al. unpublished; see also Richards and Caldwell (1987).
Following depletion of the majority of the water in the shallow soil, the deep-rooted species, such as sagebrush, are able to maintain photosynthetic activity and transpiration, albeit at reduced levels, throughout much of the dry portion of the summer and early autumn (Moore et al. 1972; Depuit and Caldwell 1973; Caldwell et al. 1977; Caldwell et al. 1981; Black and Mack 1986; Anderson et al. 1987). During these periods, transpirational demands are high, yet root length density is low in the deep, moist soil horizons (Klepper et al. 1985; Caldwell and Richards 1986; Richards and Caldwell 1987) (Figure 7.8) and, thus, water uptake capacity is limited. Also, water absorbed by deep roots must be transported through an ever increasing depth of dry soil. At night and other times of low transpiration, when plant water potential rises, the water potential in the roots in the shallow dry soil layers then will be greater than the water potential in the shallow soil (Campbell and Harris 1977; Cline et al. 1977; Caldwell et al. 1981; Shumar and Anderson 1986; Romo and Haferkamp 1989).
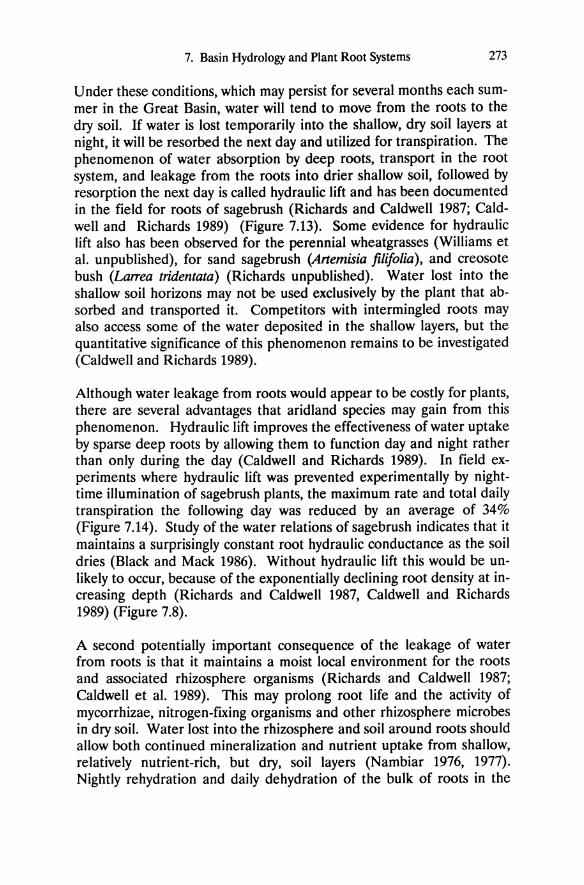
7. Basin Hydrology and Plant Root Systems 273
Under these conditions, which may persist for several months each summer in the Great Basin, water will tend to move from the roots to the dry soil. If water is lost temporarily into the shallow, dry soil layers at night, it will be resorbed the next day and utilized for transpiration. The phenomenon of water absorption by deep roots, transport in the root system, and leakage from the roots into drier shallow soil, followed by resorption the next day is called hydraulic lift and has been documented in the field for roots of sagebrush (Richards and Caldwell 1987; Caldwell and Richards 1989) (Figure 7.13). Some evidence for hydraulic lift also has been observed for the perennial wheatgrasses (Williams et al. unpublished), for sand sagebrush (Artemisia fili/olia), and creosote bush (La"ea tridentata) (Richards unpublished). Water lost into the shallow soil horizons may not be used exclusively by the plant that absorbed and transported it. Competitors with intermingled roots may also access some of the water deposited in the shallow layers, but the quantitative significance of this phenomenon remains to be investigated (Caldwell and Richards 1989).
Although water leakage from roots would appear to be costly for plants, there are several advantages that aridland species may gain from this phenomenon. Hydraulic lift improves the effectiveness of water uptake by sparse deep roots by allowing them to function day and night rather than only during the day (Caldwell and Richards 1989). In field experiments where hydraulic lift was prevented experimentally by nighttime illumination of sagebrush plants, the maximum rate and total daily transpiration the following day was reduced by an average of 34% (Figure 7.14). Study of the water relations of sagebrush indicates that it maintains a surprisingly constant root hydraulic conductance as the soil dries (Black and Mack 1986). Without hydraulic lift this would be unlikely to occur, because of the exponentially declining root density at increasing depth (Richards and CaldweIl 1987, Caldwell and Richards 1989) (Figure 7.8).
A second potentially important consequence of the leakage of water from roots is that it maintains a moist local environment for the roots and associated rhizosphere organisms (Richards and Caldwell 1987; Caldwell et al. 1989). This may prolong root life and the activity of mycorrhizae, nitrogen-fixing organisms and other rhizosphere microbes in dry soil. Water lost into the rhizosphere and soil around roots should allow both continued mineralization and nutrient uptake from shallow, relatively nutrient-rich, but dry, soil layers (Nambiar 1976, 1977). Nightly rehydration and daily dehydration of the bulk of roots in the
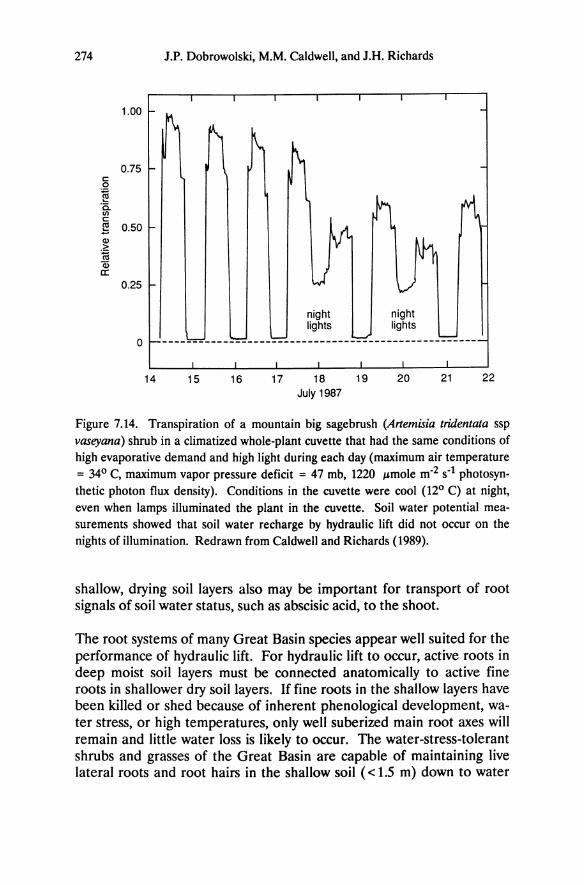
274
c 0
~ .5-
'" c ~ Q)
> .~
Qi a::
J.P. Dobrowolski, M.M. Caldwell, and J.H. Richards
1.00
0.75
0.50
0.25
night night lights lights
o ----------------------------------------------------
14 15 16 17 18 July 1987
19 20 21 22
Figure 7.14. Transpiration of a mountain big sagebrush (Artemisia tridentata ssp vaseyana) shrub in a cJimatized whole-plant cuvette that had the same conditions of high evaporative demand and high light during each day (maximum air temperature = 340 C, maximum vapor pressure deficit = 47 mb, 1220 J£mole m·2 s·l photosynthetic photon flux density). Conditions in the cuvette were cool (120 C) at night, even when lamps illuminated the plant in the cuvette. Soil water potential measurements showed that soil water recharge by hydraulic lift did not occur on the nights of illumination. Redrawn from Caldwell and Richards (1989).
shallow, drying soil layers also may be important for transport of root signals of soil water status, such as abscisic acid, to the shoot.
The root systems of many Great Basin species appear well suited for the performance of hydraulic lift. For hydraulic lift to occur, active roots in deep moist soil layers must be connected anatomically to active fine roots in shallower dry soil layers. If fine roots in the shallow layers have been killed or shed because of inherent phenological development, water stress, or high temperatures, only well suberized main root axes will remain and little water loss is likely to occur. The water-stress-tolerant shrubs and grasses of the Great Basin are capable of maintaining live lateral roots and root hairs in the shallow soil « 1.5 m) down to water
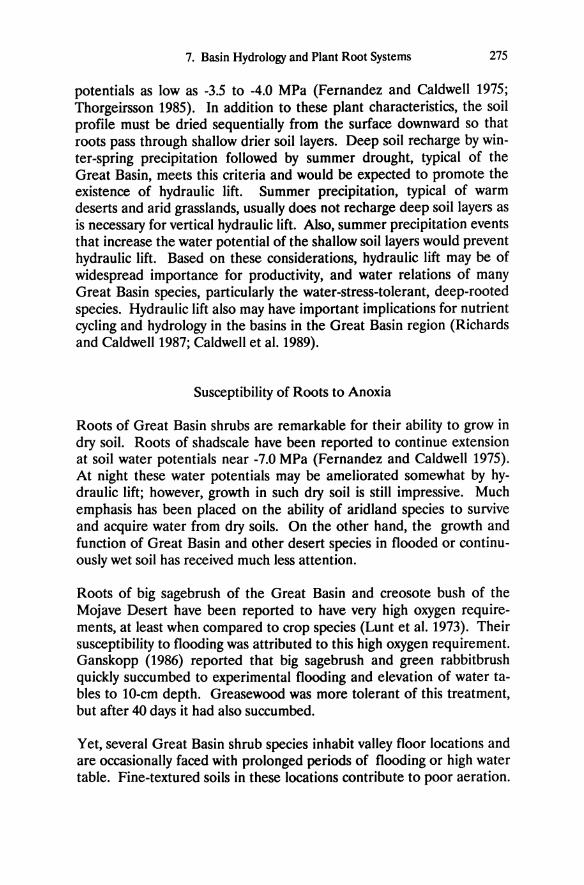
7. Basin Hydrology and Plant Root Systems 275
potentials as low as -3.5 to -4.0 MPa (Fernandez and Caldwell 1975; Thorgeirsson 1985). In addition to these plant characteristics, the soil profile must be dried sequentially from the surface downward so that roots pass through shallow drier soil layers. Deep soil recharge by winter-spring precipitation followed by summer drought, typical of the Great Basin, meets this criteria and would be expected to promote the existence of hydraulic lift. Summer precipitation, typical of warm deserts and arid grasslands, usually does not recharge deep soil layers as is necessary for vertical hydraulic lift. Also, summer precipitation events that increase the water potential of the shallow soil layers would prevent hydraulic lift. Based on these considerations, hydraulic lift may be of widespread importance for productivity, and water relations of many Great Basin species, particularly the water-stress-tolerant, deep-rooted species. Hydraulic lift also may have important implications for nutrient cycling and hydrology in the basins in the Great Basin region (Richards and Caldwell 1987; Caldwell et al. 1989).
Susceptibility of Roots to Anoxia
Roots of Great Basin shrubs are remarkable for their ability to grow in dry soil. Roots of shadscale have been reported to continue extension at soil water potentials near -7.0 MPa (Fernandez and Caldwell 1975). At night these water potentials may be ameliorated somewhat by hydraulic lift; however, growth in such dry soil is still impressive. Much emphasis has been placed on the ability of arid land species to survive and acquire water from dry soils. On the other hand, the growth and function of Great Basin and other desert species in flooded or continuously wet soil has received much less attention.
Roots of big sagebrush of the Great Basin and creosote bush of the Mojave Desert have been reported to have very high oxygen requirements, at least when compared to crop species (Lunt et al. 1973). Their susceptibility to flooding was attributed to this high oxygen requirement. Ganskopp (1986) reported that big sagebrush and green rabbitbrush quickly succumbed to experimental flooding and elevation of water tables to lO-cm depth. Greasewood was more tolerant of this treatment, but after 40 days it had also succumbed.
Yet, several Great Basin shrub species inhabit valley floor locations and are occasionally faced with prolonged periods of flooding or high water table. Fine-textured soils in these locations contribute to poor aeration.
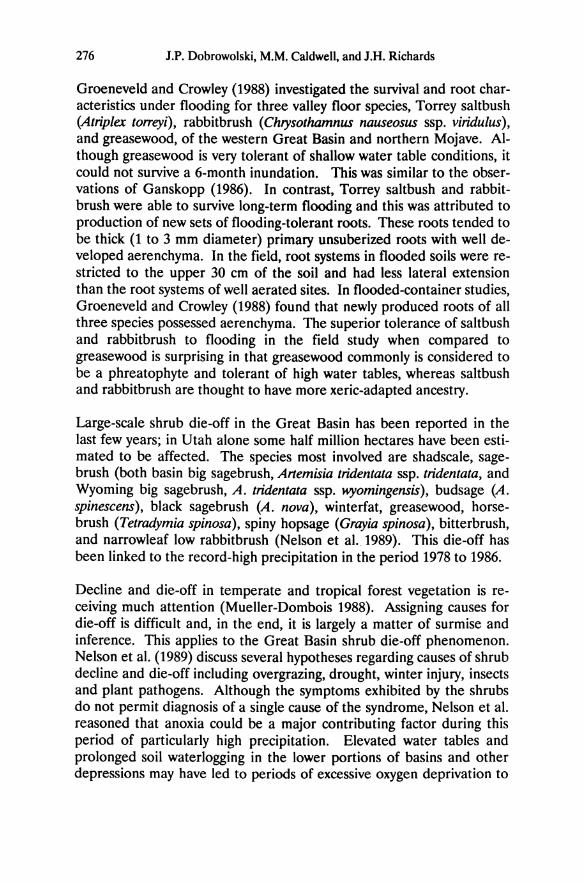
276 J.P. Dobrowolski, M.M. Caldwell, and J.H. Richards
Groeneveld and Crowley (1988) investigated the survival and root characteristics under flooding for three valley floor species, Torrey saltbush (Atriplex torreyi) , rabbitbrush (Chrysothamnus nauseosus ssp. viridulus), and greasewood, of the western Great Basin and northern Mojave. Although greasewood is very tolerant of shallow water table conditions, it could not survive a 6-month inundation. This was similar to the observations of Ganskopp (1986). In contrast, Torrey saltbush and rabbitbrush were able to survive long-term flooding and this was attributed to production of new sets of flooding-tolerant roots. These roots tended to be thick (1 to 3 mm diameter) primary unsuberized roots with well developed aerenchyma. In the field, root systems in flooded soils were restricted to the upper 30 cm of the soil and had less lateral extension than the root systems of well aerated sites. In flooded-container studies, Groeneveld and Crowley (1988) found that newly produced roots of all three species possessed aerenchyma. The superior tolerance of saltbush and rabbitbrush to flooding in the field study when compared to greasewood is surprising in that greasewood commonly is considered to be a phreatophyte and tolerant of high water tables, whereas saltbush and rabbitbrush are thought to have more xeric-adapted ancestry.
Large-scale shrub die-off in the Great Basin has been reported in the last few years; in Utah alone some half million hectares have been estimated to be affected. The species most involved are shadscale, sagebrush (both basin big sagebrush, Artemisia tridentata ssp. tridentata, and Wyoming big sagebrush, A. tridentata ssp. wyomingensis), budsage (A. spinescens), black sagebrush (A. nova), winterfat, greasewood, horsebrush (Tetradymia spinosa), spiny hopsage (Grayia spinosa), bitterbrush, and narrowleaf low rabbitbrush (Nelson et al. 1989). This die-off has been linked to the record-high precipitation in the period 1978 to 1986.
Decline and die-off in temperate and tropical forest vegetation is receiving much attention (Mueller-Dombois 1988). Assigning causes for die-off is difficult and, in the end, it is largely a matter of surmise and inference. This applies to the Great Basin shrub die-off phenomenon. Nelson et al. (1989) discuss several hypotheses regarding causes of shrub decline and die-off including overgrazing, drought, winter injury, insects and plant pathogens. Although the symptoms exhibited by the shrubs do not permit diagnosis of a single cause of the syndrome, Nelson et al. reasoned that anoxia could be a major contributing factor during this period of particularly high precipitation. Elevated water tables and prolonged soil waterlogging in the lower portions of basins and other depressions may have led to periods of excessive oxygen deprivation to
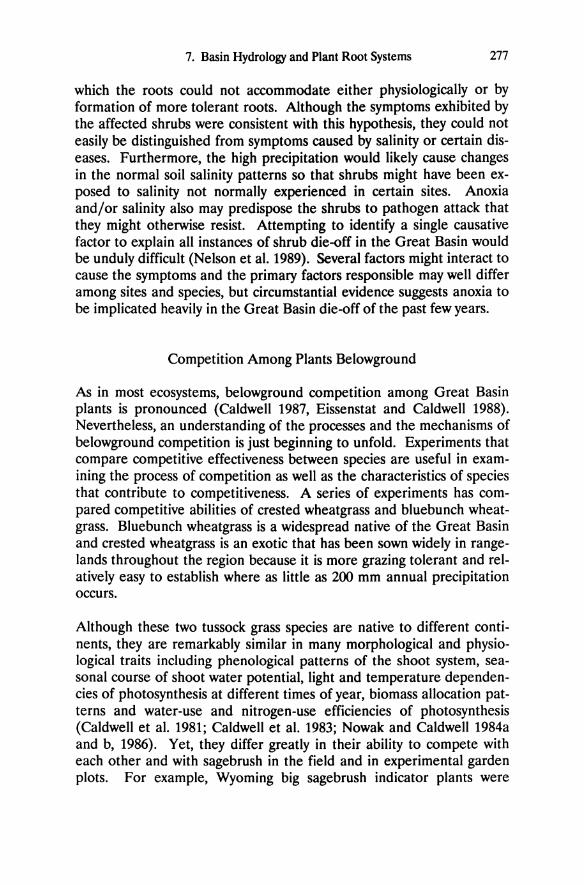
7. Basin Hydrology and Plant Root Systems 277
which the roots could not accommodate either physiologically or by formation of more tolerant roots. Although the symptoms exhibited by the affected shrubs were consistent with this hypothesis, they could not easily be distinguished from symptoms caused by salinity or certain diseases. Furthermore, the high precipitation would likely cause changes in the normal soil salinity patterns so that shrubs might have been exposed to salinity not normally experienced in certain sites. Anoxia and/or salinity also may predispose the shrubs to pathogen attack that they might otherwise resist. Attempting to identify a single causative factor to explain all instances of shrub die-off in the Great Basin would be unduly difficult (Nelson et a1. 1989). Several factors might interact to cause the symptoms and the primary factors responsible may well differ among sites and species, but circumstantial evidence suggests anoxia to be implicated heavily in the Great Basin die-off of the past few years.
Competition Among Plants Belowground
As in most ecosystems, belowground competition among Great Basin plants is pronounced (Caldwell 1987, Eissenstat and Caldwell 1988). Nevertheless, an understanding of the processes and the mechanisms of belowground competition is just beginning to unfold. Experiments that compare competitive effectiveness between species are useful in examining the process of competition as well as the characteristics of species that contribute to competitiveness. A series of experiments has compared competitive abilities of crested wheatgrass and bluebunch wheatgrass. Bluebunch wheatgrass is a widespread native of the Great Basin and crested wheatgrass is an exotic that has been sown widely in rangelands throughout the region because it is more grazing tolerant and relatively easy to establish where as little as 200 mm annual precipitation occurs.
Although these two tussock grass species are native to different continents, they are remarkably similar in many morphological and physiological traits including phenological patterns of the shoot system, seasonal course of shoot water potential, light and temperature dependencies of photosynthesis at different times of year, biomass allocation patterns and water-use and nitrogen-use efficiencies of photosynthesis (Caldwell et a1. 1981; Caldwell et a1. 1983; Nowak and Caldwell 1984a and b, 1986). Yet, they differ greatly in their ability to compete with each other and with sagebrush in the field and in experimental garden plots. For example, Wyoming big sagebrush indicator plants were
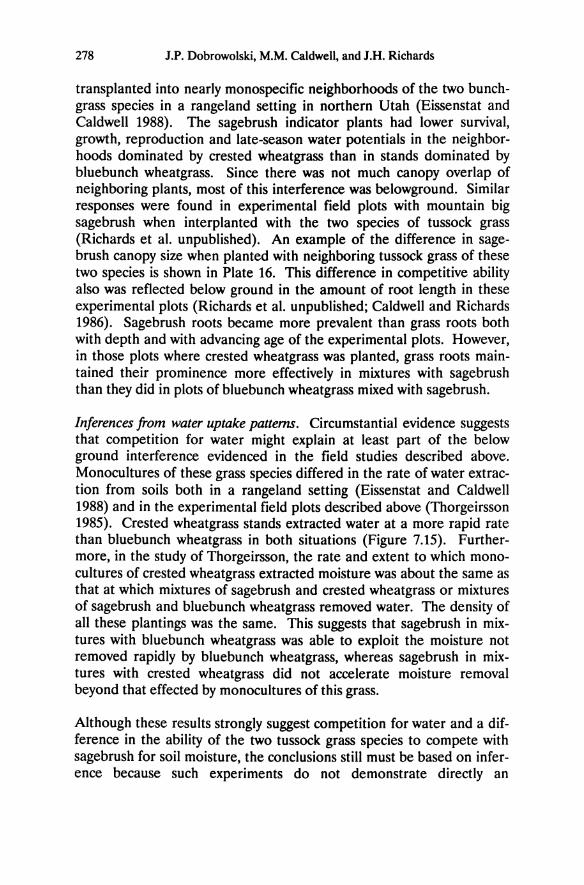
278 J.P. Dobrowolski, M.M. Caldwell, and J.H. Richards
transplanted into nearly monospecific neighborhoods of the two bunchgrass species in a rangeland setting in northern Utah (Eissenstat and Caldwell 1988). The sagebrush indicator plants had lower survival, growth, reproduction and late-season water potentials in the neighborhoods dominated by crested wheatgrass than in stands dominated by bluebunch wheatgrass. Since there was not much canopy overlap of neighboring plants, most of this interference was belowground. Similar responses were found in experimental field plots with mountain big sagebrush when interplanted with the two species of tussock grass (Richards et at. unpublished). An example of the difference in sagebrush canopy size when planted with neighboring tussock grass of these two species is shown in Plate 16. This difference in competitive ability also was reflected below ground in the amount of root length in these experimental plots (Richards et at. unpublished; Caldwell and Richards 1986). Sagebrush roots became more prevalent than grass roots both with depth and with advancing age of the experimental plots. However, in those plots where crested wheatgrass was planted, grass roots maintained their prominence more effectively in mixtures with sagebrush than they did in plots of bluebunch wheatgrass mixed with sagebrush.
Inferences from water uptake patterns. Circumstantial evidence suggests that competition for water might explain at least part of the below ground interference evidenced in the field studies described above. Monocultures of these grass species differed in the rate of water extraction from soils both in a rangeland setting (Eissenstat and Caldwell 1988) and in the experimental field plots described above (Thorgeirsson 1985). Crested wheatgrass stands extracted water at a more rapid rate than bluebunch wheatgrass in both situations (Figure 7.15). Furthermore, in the study of Thorgeirsson, the rate and extent to which monocultures of crested wheatgrass extracted moisture was about the same as that at which mixtures of sagebrush and crested wheatgrass or mixtures of sagebrush and bluebunch wheatgrass removed water. The density of all these plantings was the same. This suggests that sagebrush in mixtures with bluebunch wheatgrass was able to exploit the moisture not removed rapidly by bluebunch wheatgrass, whereas sagebrush in mixtures with crested wheatgrass did not accelerate moisture removal beyond that effected by monocultures of this grass.
Although these results strongly suggest competition for water and a difference in the ability of the two tussock grass species to compete with sagebrush for soil moisture, the conclusions still must be based on inference because such experiments do not demonstrate directly an
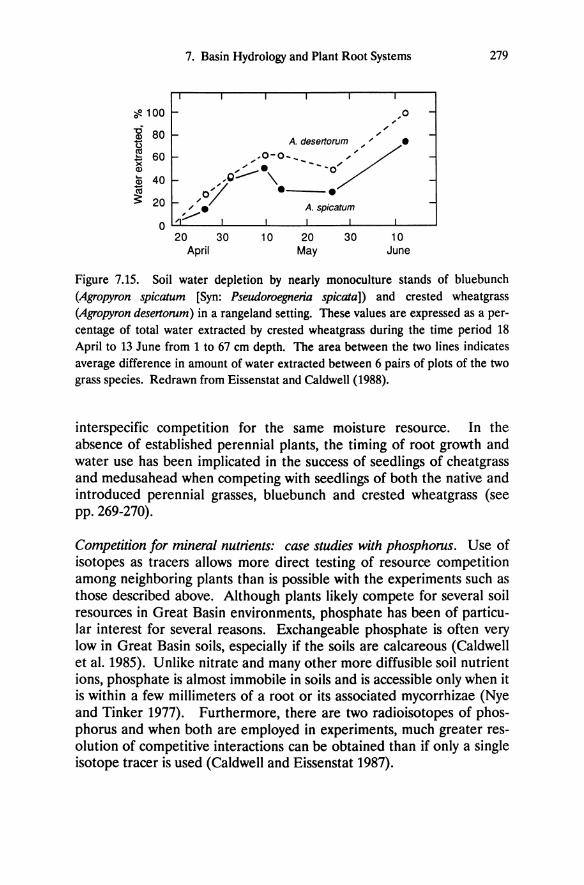
7. Basin Hydrology and Plant Root Systems 279
I I I I I I
tfl. 100 I- ,0 -" -c 80 I-
,
N , -
A. desertorum " " •
60 I- • 0-0.. '/ -x ,;' • ....- ...... 0", Q) ... 40 I- ,,-0:"-- \ -Q)
~ 20 0/ e-e -I- ,," e A. spicatum
0 ~ I I I
20 30 10 20 30 10 April May June
Figure 7.15. Soil water depletion by nearly monoculture stands of bluebunch (Agropyron spicatum [Syn: Pseudoroegneria spicaJa]) and crested wheatgrass (Agropyron desertorum) in a rangeland setting. These values are expressed as a percentage of total water extracted by crested wheatgrass during the time period 18 April to 13 June from 1 to 67 em depth. The area between the two lines indicates average difference in amount of water extracted between 6 pairs of plots of the two grass species. Redrawn from Eissenstat and Caldwell (1988).
interspecific competition for the same moisture resource. In the absence of established perennial plants, the timing of root growth and water use has been implicated in the success of seedlings of cheatgrass and medusahead when competing with seedlings of both the native and introduced perennial grasses, bluebunch and crested wheatgrass (see pp. 269-270).
Competition for mineral nutrients: case studies with phosphorus. Use of isotopes as tracers allows more direct testing of resource competition among neighboring plants than is possible with the experiments such as those described above. Although plants likely compete for several soil resources in Great Basin environments, phosphate has been of particular interest for several reasons. Exchangeable phosphate is often very low in Great Basin soils, especially if the soils are calcareous (Caldwell et a1. 1985). Unlike nitrate and many other more diffusible soil nutrient ions, phosphate is almost immobile in soils and is accessible only when it is within a few millimeters of a root or its associated mycorrhizae (Nye and Tinker 1977). Furthermore, there are two radioisotopes of phosphorus and when both are employed in experiments, much greater resolution of competitive interactions can be obtained than if only a single isotope tracer is used (Caldwell and Eissenstat 1987).
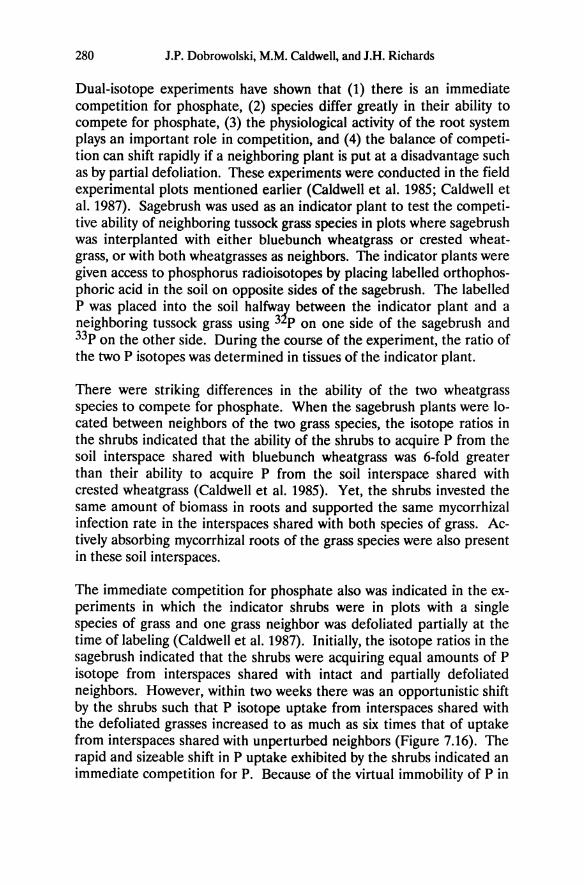
280 J.P. Dobrowolski, M.M. Caldwell, and J.H. Richards
Dual-isotope experiments have shown that (1) there is an immediate competition for phosphate, (2) species differ greatly in their ability to compete for phosphate, (3) the physiological activity of the root system plays an important role in competition, and (4) the balance of competition can shift rapidly if a neighboring plant is put at a disadvantage such as by partial defoliation. These experiments were conducted in the field experimental plots mentioned earlier (Caldwell et al. 1985; Caldwell et al. 1987). Sagebrush was used as an indicator plant to test the competitive ability of neighboring tussock grass species in plots where sagebrush was interplanted with either bluebunch wheatgrass or crested wheatgrass, or with both wheatgrasses as neighbors. The indicator plants were given access to phosphorus radioisotopes by placing labelled orthophosphoric acid in the soil on opposite sides of the sagebrush. The labelled P was placed into the soil halfwa~ between the indicator plant and a neighboring tussock grass using 3 P on one side of the sagebrush and 33p on the other side. During the course of the experiment, the ratio of the two P isotopes was determined in tissues of the indicator plant.
There were striking differences in the ability of the two wheatgrass species to compete for phosphate. When the sagebrush plants were located between neighbors of the two grass species, the isotope ratios in the shrubs indicated that the ability of the shrubs to acquire P from the soil interspace shared with bluebunch wheatgrass was 6-fold greater than their ability to acquire P from the soil interspace shared with crested wheatgrass (Caldwell et al. 1985). Yet, the shrubs invested the same amount of biomass in roots and supported the same mycorrhizal infection rate in the interspaces shared with both species of grass. Actively absorbing mycorrhizal roots of the grass species were also present in these soil interspaces.
The immediate competition for phosphate also was indicated in the experiments in which the indicator shrubs were in plots with a single species of grass and one grass neighbor was defoliated partially at the time of labeling (Caldwell et al. 1987). Initially, the isotope ratios in the sagebrush indicated that the shrubs were acquiring equal amounts of P isotope from interspaces shared with intact and partially defoliated neighbors. However, within two weeks there was an opportunistic shift by the shrubs such that P isotope uptake from interspaces shared with the defoliated grasses increased to as much as six times that of uptake from interspaces shared with unperturbed neighbors (Figure 7.16). The rapid and sizeable shift in P uptake exhibited by the shrubs indicated an immediate competition for P. Because of the virtual immobility of P in
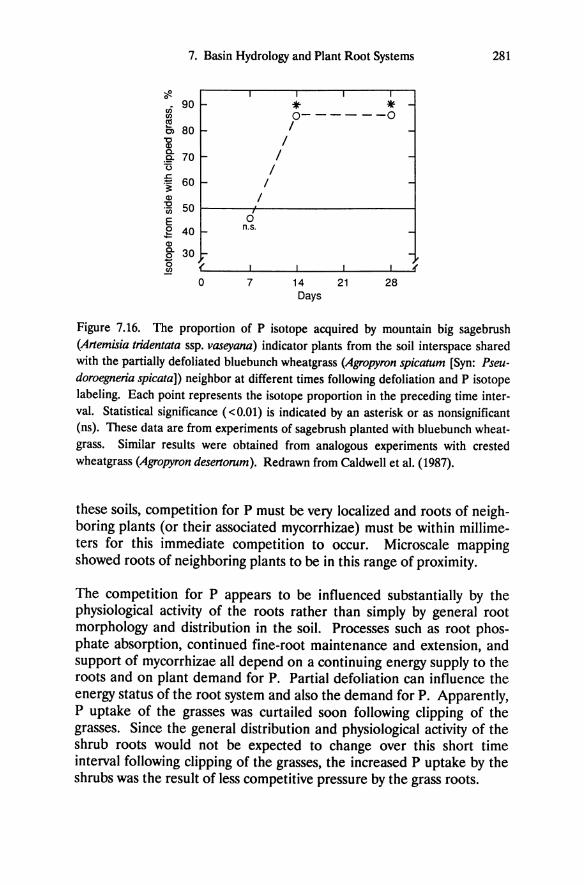
7. Basin Hydrology and Plant Root Systems 281
~ I I I
~ 0
ui 90 r- * -<Jl 0- --- --0 !!!
80 l- I -01 "C I Q) c.
70 - / -.9-(3 / .c .~ 60 - / -Q) I "C 50 .(jj
E 0 .g 40 I-
n.s .
Q) c. 30 l-E 0 < ". !!!.
0 7 14 21 28 Days
Figure 7.16. The proportion of P isotope acquired by mountain big sagebrush (Artemisia tridentata ssp. vaseyana) indicator plants from the soil interspace shared with the partially defoliated bluebunch wheatgrass (Agropyron spicatum [Syn: Pseudoroegneria spicata)) neighbor at different times following defoliation and P isotope labeling. Each point represents the isotope proportion in the preceding time interval. Statistical significance « 0.01) is indicated by an asterisk or as nonsignificant (ns). These data are from experiments of sagebrush planted with bluebunch wheatgrass. Similar results were obtained from analogous experiments with crested wheatgrass (Agropyron desertorum). Redrawn from Caldwell et al. (1987).
these soils, competition for P must be very localized and roots of neighboring plants (or their associated mycorrhizae) must be within millimeters for this immediate competition to occur. Microscale mapping showed roots of neighboring plants to be in this range of proximity.
The competition for P appears to be influenced substantially by the physiological activity of the roots rather than simply by general root morphology and distribution in the soil. Processes such as root phosphate absorption, continued fine-root maintenance and extension, and support of mycorrhizae all depend on a continuing energy supply to the roots and on plant demand for P. Partial defoliation can influence the energy status of the root system and also the demand for P. Apparently, P uptake of the grasses was curtailed soon following clipping of the grasses. Since the general distribution and physiological activity of the shrub roots would not be expected to change over this short time interval following clipping of the grasses, the increased P uptake by the shrubs was the result of less competitive pressure by the grass roots.
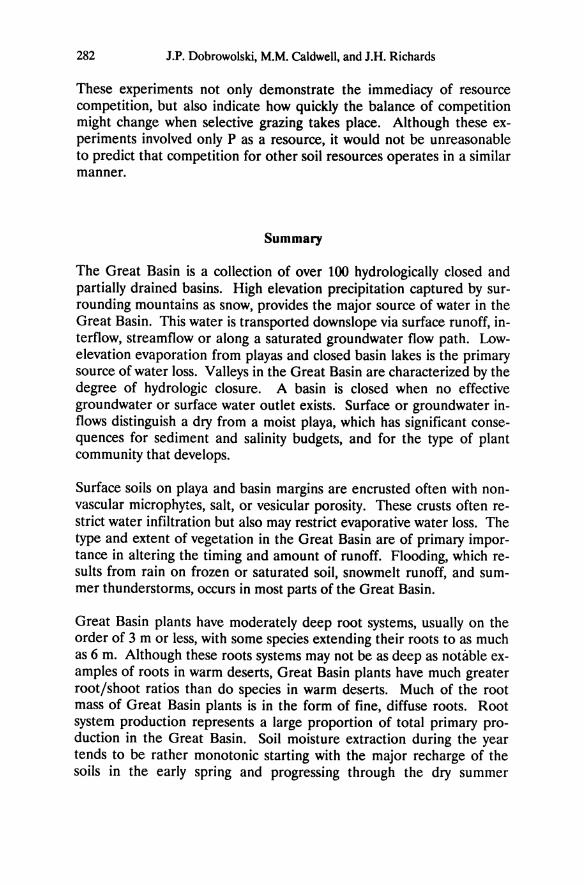
282 J.P. Dobrowolski, M.M. Caldwell, and J.H. Richards
These experiments not only demonstrate the immediacy of resource competition, but also indicate how quickly the balance of competition might change when selective grazing takes place. Although these experiments involved only P as a resource, it would not be unreasonable to predict that competition for other soil resources operates in a similar manner.
Summary
The Great Basin is a collection of over 100 hydrologically closed and partially drained basins. High elevation precipitation captured by surrounding mountains as snow, provides the major source of water in the Great Basin. This water is transported downslope via surface runoff, interflow, streamflow or along a saturated groundwater flow path. Lowelevation evaporation from playas and closed basin lakes is the primary source of water loss. Valleys in the Great Basin are characterized by the degree of hydrologic closure. A basin is closed when no effective groundwater or surface water outlet exists. Surface or groundwater inflows distinguish a dry from a moist playa, which has significant consequences for sediment and salinity budgets, and for the type of plant community that develops.
Surface soils on playa and basin margins are encrusted often with nonvascular microphytes, salt, or vesicular porosity. These crusts often restrict water infiltration but also may restrict evaporative water loss. The type and extent of vegetation in the Great Basin are of primary importance in altering the timing and amount of runoff. Flooding, which results from rain on frozen or saturated soil, snowmelt runoff, and summer thunderstorms, occurs in most parts of the Great Basin.
Great Basin plants have moderately deep root systems, usually on the order of 3 m or less, with some species extending their roots to as much as 6 m. Although these roots systems may not be as deep as notable examples of roots in warm deserts, Great Basin plants have much greater root/shoot ratios than do species in warm deserts. Much of the root mass of Great Basin plants is in the form of fine, diffuse roots. Root system production represents a large proportion of total primary production in the Great Basin. Soil moisture extraction during the year tends to be rather monotonic starting with the major recharge of the soils in the early spring and progressing through the dry summer
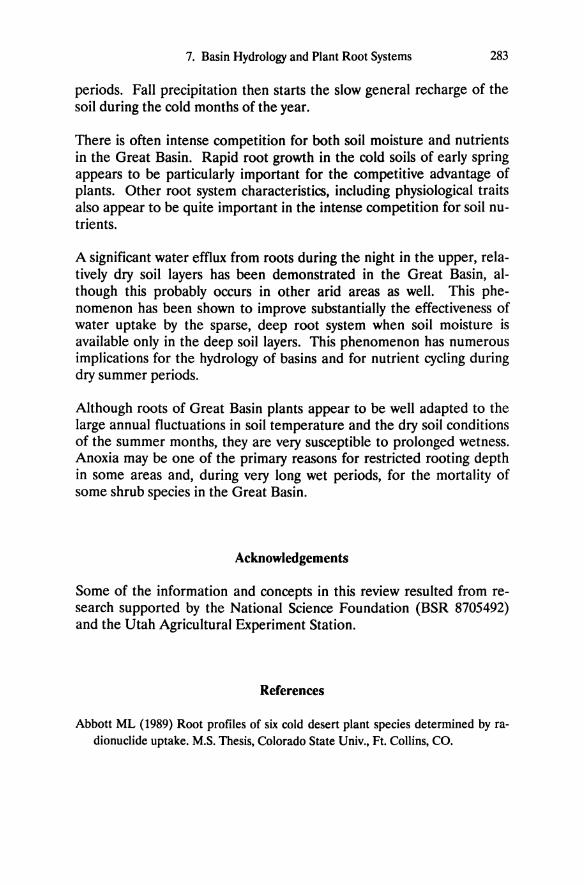
7. Basin Hydrology and Plant Root Systems 283
periods. Fall precipitation then starts the slow general recharge of the soil during the cold months ofthe year.
There is often intense competition for both soil moisture and nutrients in the Great Basin. Rapid root growth in the cold soils of early spring appears to be particularly important for the competitive advantage of plants. Other root system characteristics, including physiological traits also appear to be quite important in the intense competition for soil nutrients.
A significant water efflux from roots during the night in the upper, relatively dry soil layers has been demonstrated in the Great Basin, although this probably occurs in other arid areas as well. This phenomenon has been shown to improve substantially the effectiveness of water uptake by the sparse, deep root system when soil moisture is available only in the deep soil layers. This phenomenon has numerous implications for the hydrology of basins and for nutrient cycling during dry summer periods.
Although roots of Great Basin plants appear to be well adapted to the large annual fluctuations in soil temperature and the dry soil conditions of the summer months, they are very susceptible to prolonged wetness. Anoxia may be one of the primary reasons for restricted rooting depth in some areas and, during very long wet periods, for the mortality of some shrub species in the Great Basin.
Acknowledgements
Some of the information and concepts in this review resulted from research supported by the National Science Foundation (BSR 8705492) and the Utah Agricultural Experiment Station.
References
Abbott ML (1989) Root profiles of six cold desert plant species determined by radionuclide uptake. M.S. Thesis, Colorado State Univ., Ft. Collins, CO.
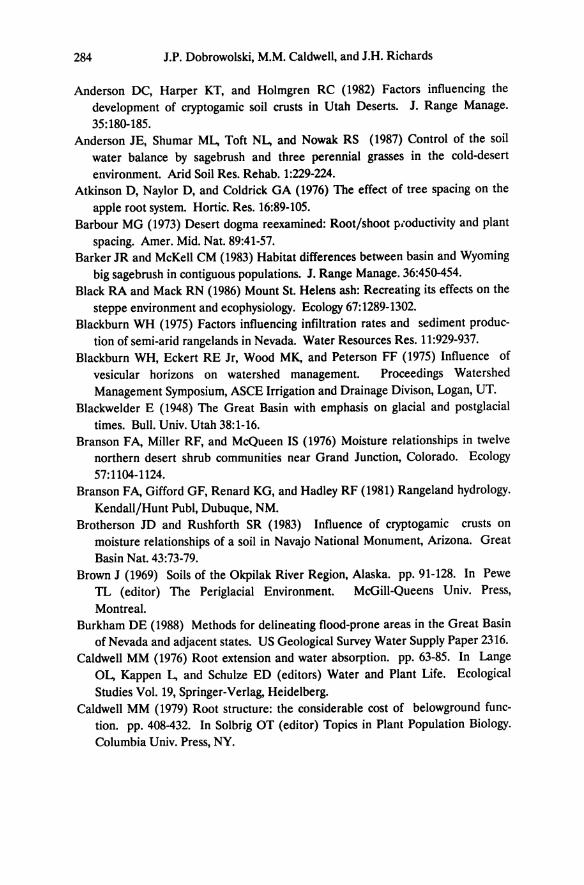
284 J.P. Dobrowolski, M.M. Caldwell, and J.H. Richards
Anderson DC, Harper KT, and Holmgren RC (1982) Factors influencing the development of cryptogamic soil crusts in Utah Deserts. J. Range Manage. 35:180-185.
Anderson JE, Shumar M1., Toft N1., and Nowak RS (1987) Control of the soil water balance by sagebrush and three perennial grasses in the cold-desert environment. Arid Soil Res. Rehab. 1:229-224.
Atkinson D, Naylor D, and Coldrick GA (1976) The effect of tree spacing on the apple root system. Hortic. Res. 16:89-105.
Barbour MG (1973) Desert dogma reexamined: Root/shoot plOductivity and plant spacing. Amer. Mid. Nat. 89:41-57.
Barker JR and McKell CM (1983) Habitat differences between basin and Wyoming big sagebrush in contiguous populations. J. Range Manage. 36:450-454.
Black RA and Mack RN (1986) Mount St. Helens ash: Recreating its effects on the steppe environment and ecophysiology. Ecology 67:1289-1302.
Blackburn WH (1975) Factors influencing infiltration rates and sediment production of semi-arid rangelands in Nevada. Water Resources Res. 11:929-937.
Blackburn WH, Eckert RE Jr, Wood MK, and Peterson FF (1975) Influence of vesicular horizons on watershed management. Proceedings Watershed Management Symposium, ASCE Irrigation and Drainage Divison, Logan, UT.
Blackwelder E (1948) The Great Basin with emphasis on glacial and postglacial times. Bull. Univ. Utah 38:1-16.
Branson FA, Miller RF, and McQueen IS (1976) Moisture relationships in twelve northern desert shrub communities near Grand Junction, Colorado. Ecology 57:1104-1124.
Branson FA, Gifford GF, Renard KG, and Hadley RF (1981) Rangeland hydrology. Kendall/Hunt Publ, Dubuque, NM.
Brotherson JD and Rushforth SR (1983) Influence of cryptogamic crusts on moisture relationships of a soil in Navajo National Monument, Arizona. Great Basin Nat. 43:73-79.
Brown J (1969) Soils of the Okpilak River Region, Alaska. pp. 91-128. In Pewe TL (editor) The Periglacial Environment. McGill-Queens Univ. Press, Montreal.
Burkham DE (1988) Methods for delineating flood-prone areas in the Great Basin of Nevada and adjacent states. US Geological Survey Water Supply Paper 2316.
Caldwell MM (1976) Root extension and water absorption. pp. 63-85. In Lange 01., Kappen 1., and Schulze ED (editors) Water and Plant Life. Ecological Studies Vol. 19, Springer-Verlag, Heidelberg.
Caldwell MM (1979) Root structure: the considerable cost of belowground function. pp. 408-432. In Solbrig OT (editor) Topics in Plant Population Biology. Columbia Univ. Press, NY.
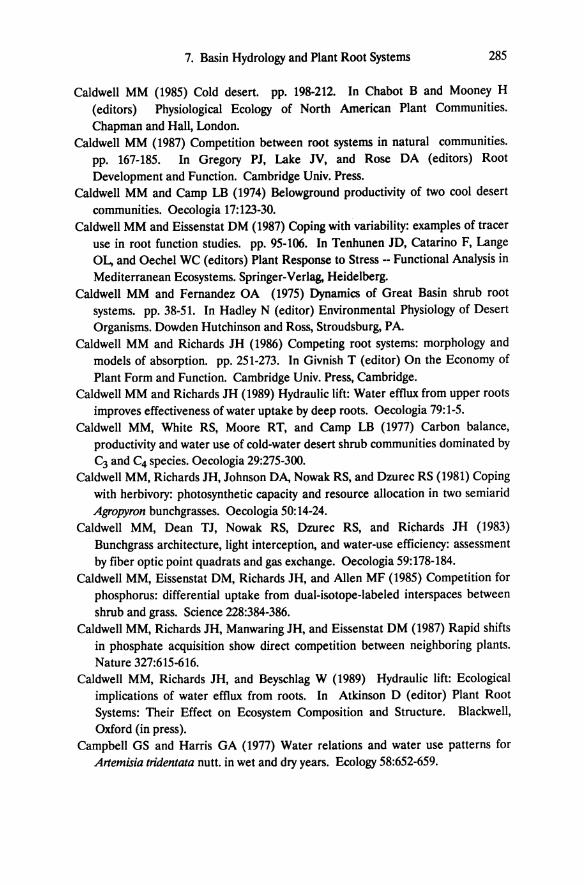
7. Basin Hydrology and Plant Root Systems 285
Caldwell MM (1985) Cold desert. pp. 198-212. In Chabot B and Mooney H (editors) Physiological Ecology of North American Plant Communities. Chapman and Hall, London.
Caldwell MM (1987) Competition between root systems in natural communities. pp. 167-185. In Gregory PJ, Lake JV, and Rose DA (editors) Root Development and Function. Cambridge Univ. Press.
Caldwell MM and Camp LB (1974) Belowground productivity of two cool desert communities. Oecologia 17:123-30.
Caldwell MM and Eissenstat DM (1987) Coping with variability: examples of tracer use in root function studies. pp. 95-106. In Tenhunen JD, Catarino F, Lange OL, and Oechel WC (editors) Plant Response to Stress -- Functional Analysis in Mediterranean Ecosystems. Springer-Verlag, Heidelberg.
Caldwell MM and Fernandez OA (1975) Dynamics of Great Basin shrub root systems. pp. 38-51. In Hadley N (editor) Environmental Physiology of Desert Organisms. Dowden Hutchinson and Ross, Stroudsburg, P A.
Caldwell MM and Richards JH (1986) Competing root systems: morphology and models of absorption. pp. 251-273. In Givnish T (editor) On the Economy of Plant Form and Function. Cambridge Univ. Press, Cambridge.
Caldwell MM and Richards JH (1989) Hydraulic lift: Water efflux from upper roots improves effectiveness of water uptake by deep roots. Oecologia 79:1-5.
Caldwell MM, White RS, Moore RT, and Camp LB (1977) Carbon balance, productivity and water use of cold-water desert shrub communities dominated by C3 and C4 species. Oecologia 29:275-300.
Caldwell MM, Richards JH, Johnson DA, Nowak RS, and Dzurec RS (1981) Coping with herbivory: photosynthetic capacity and resource allocation in two semiarid Agropyron bunchgrasses. Oecologia 50:14-24.
Caldwell MM, Dean TJ, Nowak RS, Dzurec RS, and Richards JH (1983) Bunchgrass architecture, light interception, and water-use efficiency: assessment by fiber optic point quadrats and gas exchange. Oecologia 59:178-184.
Caldwell MM, Eissenstat DM, Richards JH, and Allen MF (1985) Competition for phosphorus: differential uptake from dual-isotope-Iabeled interspaces between shrub and grass. Science 228:384-386.
Caldwell MM, Richards JH, Manwaring JH, and Eissenstat DM (1987) Rapid shifts in phosphate acquisition show direct competition between neighboring plants. Nature 327:615-616.
Caldwell MM, Richards JH, and Beyschlag W (1989) Hydraulic lift: Ecological implications of water efflux from roots. In Atkinson D (editor) Plant Root Systems: Their Effect on Ecosystem Composition and Structure. Blackwell, Oxford (in press).
Campbell GS and Harris GA (1977) Water relations and water use patterns for Artemisia tridentata nutt. in wet and dry years. Ecology 58:652-659.
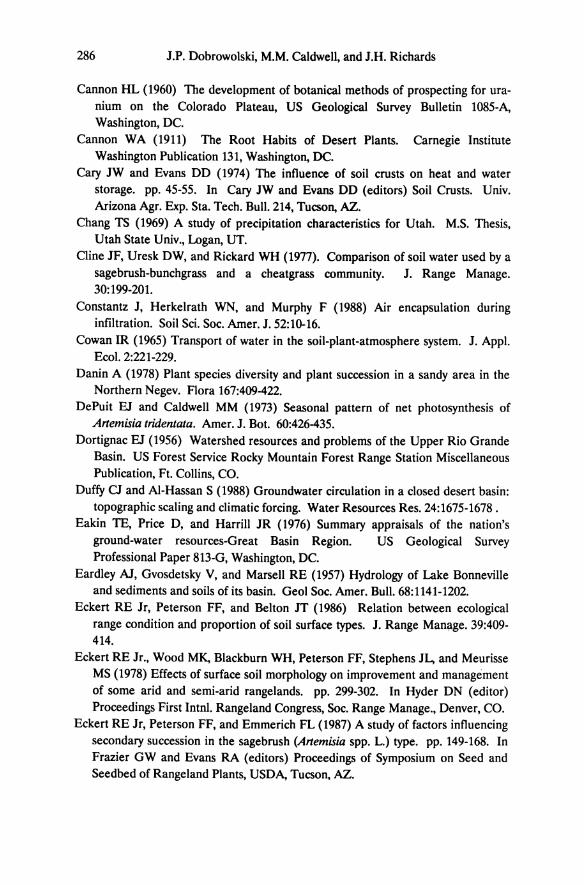
286 J.P. Dobrowolski, M.M. Caldwell, and J.R. Richards
Cannon HL (1960) The development of botanical methods of prospecting for uranium on the Colorado Plateau, US Geological Survey Bulletin lO85-A, Washington, DC.
Cannon WA (1911) The Root Habits of Desert Plants. Carnegie Institute Washington Publication 131, Washington, DC.
Cary JW and Evans DD (1974) The influence of soil crusts on heat and water storage. pp. 45-55. In Cary JW and Evans DD (editors) Soil Crusts. Univ. Arizona Agr. Exp. Sta. Tech. Bull. 214, Tucson, AZ.
Chang TS (1969) A study of precipitation characteristics for Utah. M.S. Thesis, Utah State Univ., Logan, UT.
Cline JF, Uresk DW, and Rickard WH (1977). Comparison of soil water used by a sagebrush-bunchgrass and a cheatgrass community. J. Range Manage. 30:199-201.
Constantz J, Herkelrath WN, and Murphy F (1988) Air encapsulation during infiltration. Soil Sci. Soc. Amer. J. 52:10-16.
Cowan IR (1965) Transport of water in the soil-plant-atmosphere system. J. Appl. Ecol. 2:221-229.
Danin A (1978) Plant species diversity and plant succession in a sandy area in the Northern Negev. Flora 167:409-422.
DePuit EJ and Caldwell MM (1973) Seasonal pattern of net photosynthesis of Artemisia tridentata. Amer. J. Bot. 60:426-435.
Dortignac EJ (1956) Watershed resources and problems of the Upper Rio Grande Basin. US Forest Service Rocky Mountain Forest Range Station Miscellaneous Publication, Ft. Collins, CO.
Duffy 0 and AI-Hassan S (1988) Groundwater circulation in a closed desert basin: topographic scaling and climatic forcing. Water Resources Res. 24:1675-1678.
Eakin TE, Price D, and Harrill JR (1976) Summary appraisals of the nation's ground-water resources-Great Basin Region. US Geological Survey Professional Paper 813-G, Washington, DC.
Eardley AJ, Gvosdetsky V, and Marsell RE (1957) Hydrology of Lake Bonneville and sediments and soils of its basin. Geol Soc. Amer. Bull. 68: 1141-1202.
Eckert RE Jr, Peterson FF, and Belton JT (1986) Relation between ecological range condition and proportion of soil surface types. J. Range Manage. 39:409-414.
Eckert RE Jr., Wood MK, Blackburn WH, Peterson FF, Stephens JL, and Meurisse MS (1978) Effects of surface soil morphology on improvement and management of some arid and semi-arid rangelands. pp. 299-302. In Hyder DN (editor) Proceedings First Intnl. Rangeland Congress, Soc. Range Manage., Denver, CO.
Eckert RE Jr, Peterson FF, and Emmerich FL (1987) A study of factors influencing secondary succession in the sagebrush (Artemisia spp. L.) type. pp. 149-168. In Frazier GW and Evans RA (editors) Proceedings of Symposium on Seed and Seedbed of Rangeland Plants, USDA, Tucson, AZ.
7. Basin Hydrology and Plant Root Systems 287
Eissenstat DM and Caldwell MM (1987) Characteristics of successful competitors: an evaluation of potential growth rate in two cold desert tussock grasses. Oecologia 71:167-173.
Eissenstat DM and Caldwell MM (1988) Competitive ability is linked to rates of water extraction. A field study of two aridland tussock grasses. Oecologia 75:1-7.
Eissenstat DM and Caldwell MM (1989) Invasive root growth into disturbed soil of two tussock grasses that differ in competitive effectiveness. Functional Eco\. 3:345-353.
Evenari M, Yaalon DH, and Gutterman Y (1974) Note on soils with vesicular structure in deserts. Z. Geomorph. NF 16:162-172.
Fairchild JA and Brotherson JD (1980) Microhabitat relationships of six major shrubs in Navajo National Monument, Arizona. J. Range Manage. 33:150-156.
Fenneman NM (1931) Physiography of the Western United States. McGraw-Hill, NY.
Fernandez OA and Caldwell MM (1975) Phenology and dynamics of root growth of three cool semi-desert shrubs under field conditions. J. Eco\. 63:703-714.
Fletcher JE and Martin WP (1948) Some effects of algae and molds in the raincrust of desert soils. Ecology 29:95-100.
Friedmann EI and Galun M (1974) Desert algae,lichens, and fungi. pp. 165-212. In Brown GW (editor) Desert Biology Vol. 2. Academic Press, NY.
Ganskopp DC (1986) Tolerances of sagebrush, rabbitbrush and greasewood to elevated water tables. J. Range Manage 39:334-337.
Gardner WR (1960) Dynamic aspects of water availability to plants. Soil Sci 89:63-73.
Gifford GF (1972) Infiltration rate and sediment production on a plowed big sage-brush site. J. Range Manage 25:53-55.
Graf WL (1988) Fluvial processes in dryland rivers. Springer-Verlag, Heidelberg. Grismer ME (1986) Pore size distributions and infiltration. Soil Sci. 141:249-260. Groeneveld DP and Crowley DE (1988) Root system response to flooding in three
desert shrub species. Funct. Eco\. 2:491-497. Hacker RB (1986) Effects of grazing on chemical and physical properties of an
earthy sand in the Western Australian mulga zone. Austr. Range J. 8:11-17. Hanson WR and Stoddart LA (1940) Effects of grazing upon bunch wheat grass. J.
Amer Soc. Agron 32:278-289. Harper KT and Marble JT (1988) Effects of cryptogamic plants on water relations
or Utah desert soils. In Tueller PT (editor) Vegetation Science Applications for Rangeland Analysis and Management. Kluwer, Dordrecht.
Harris GA (1967) Some competitive relationships between Agropyron spicatum and Bromus teetorum. Eco\. Monogr 37:89-111.
Harris GA (1977) Root phenology as a factor of competition among grass seedlings. J. Range Manage. 30:172-177.
288 J.P. Dobrowolski, M.M. Caldwell, and J.H. Richards
Harris GA and Wilson AM (1970) Competition for moisture among seedlings of annual and perennial grasses as influenced by root elongation at low temperature. Ecology 51:530-534.
Holthausen RS and Caldwell MM (1980) Seasonal dynamics of root system respiration in Atriplex confertifolia. Plant Soil 55:307-317.
Houghton SG (1976) A Trace of Desert Waters: The Great Basin Story. Arthur H. Clark, Glendale.
Houghton JG (1969) Characteristics of rainfall in the Great Basin. Univ. Nevada Desert Res. Inst. Rep., Reno, NV.
Hugie VK and Passey HB (1964) Soil surface patterns of some semiarid soils in northern Utah, southern Idaho, and northeastern Nevada. Soil Sci. Soc. Amer. Proc. 28:786-792.
Hulbert LC (1955) Ecological studies of Bromus tectorum and other annual bromegrasses. Ecol. Monogr 25:181-213.
Jones RM (1969) Scald reclamation studies in the Hay District Part IV-Scale soils: Their properties and changes with reclamation. J. Soil Cons. Servo NSW 25:104-120.
Klepper EL, Gano KA, and Cadwell LL (1985) Rooting depth and distribution of deep-rooted plants in the 200 area control zone of the Hanford Site, PNL-5247, Nat. Tech. Info. Serv., Springfield.
Larcher W (1975) Physiological Plant Ecology. Springer-Verlag, Heidelberg. Leopold AC and Kriedemann PE (1975) Plant Growth and Development. Second
Ed., McGraw-Hill, NY. Lines, GC (1979) Hydrology and surface morphology of the Bonneville Salt Flats
and Pilot Valley playa, Utah. US Geological Survey Water Supply Paper 2057, Washington, DC.
Loope WL and Gifford GF (1972) Influence of a soil microfloral crust on select properties of soils under pinyon-juniper in southeastern Utah. J. Soil Water Conserv.27:164-167.
Lunt OR, Letey J, and Clark SB (1973) Oxygen requirements for root growth in three species of desert shrubs. Ecology 54:1356-1362.
Mabbutt J (1979) Desert Landforms. MIT Press, Cambridge, MA. Marshall TJ and Holmes JW (1979) Soil Physics. Cambridge Univ. Press,
Cambridge. Maxey GB (1967) Hydrogeology of desert basins. Symp. Groundwater Devel. in
Arid Basins, Utah State Univ., Logan, UT. Miller DE (1971) Formation of vesicular structure in soil. Soil Sci. Soc. Amer. Proc.
35:635-737. Miller DE and Gifford RO (1974) Modification of soil crust for plant growth. pp.
45-55. In Cary JW and Evans DD (editors) Soil Crusts. Univ. Arizona Agr. Exp. Sta. Tech. Bull. 214, Tucson, AZ.
7. Basin Hydrology and Plant Root Systems 289
Moore RE (1939) Water conduction from shallow water tables. Hilgardia 12:383-426.
Moore RT, White RS, and Caldwell MM (1972) Transpiration of Atriplex con/erti/olia and Eurotia lanata in relation to soil, plant, and atmospheric moisture stresses. Can. J. Bot. 50:2411-2418.
Morrison RB (1965) Quaternary geology of the Great Basin. pp. 265-285. In HE Wright and DG Frey (editors) The Quaternary of the United States, Princeton Univ. Press, Princeton, NJ.
Morrison RB (1968) Pluvial lakes. pp. 873-883. In Fairbridge RW (e.ditor) The Encyclopedia of Geomorphology. Van Nostrand-Reinhold, NY.
Motts WS (1965) Hydrologic types of playas and closed valleys and relation of hydrology to playa geology, geology, mineralogy, and hydrology of U.S. playas. pp. 73-104. In Air Force Cambridge Res. Lab Environ. Res. Paper 96.
Motts WS (1970) Geology and hydrology of selected playas in western United States. Air Force Cambridge Res. Lab, Office at Aerospace Res., US Air Force, Bedford.
Mueller-Dombois D (1988) Forest decline and dieback - A global ecological problem. Trends Ecol. Evol. 3:310-312.
Nambiar EKS (1976) Uptake of Zn65 from dry soil by plants. Plant Soil 44:267-271.
Nambiar EKS (1977) The effects of water content of the topsoil on micronutrient availability and uptake in a siliccous sandy soil. Plant Soil 46:175-183.
Neal IT (1975a) Playas and dried lakes, occurrence and development. Benchmark Papers in Geology, Halsted Press, NY.
Neal IT (1975b) Playas and Dried Lakes. Dowden, Hutchison and Ross, Stroudsburg, PA
Nelson DL, Harper KT, Boyer KC, Weber DJ, Haws BA, and Marble JR (1989) Wildland shrub dieoffs in Utah: an approach to understanding the cause. pp. 119-135. In Proceedings--Symposium on Shrub Ecophysiology and Biotechnology. USDA For. Servo Gen. Tech. Rep. INT-256.
Nowak RS and Caldwell MM (1984a) A test of compensatory photosynthesis in the field: implications for herbivory tolerance. Oecologia 61:311-318.
Nowak RS and Caldwell MM (1984b) Photosynthetic activity and survival of foliage during winter for two bunchgrass species in a cold-winter steppe environment. Photosynthetica 18:192-200.
Nowak RS and Caldwell MM (1986) Photosynthetic characteristics of crested wheatgrass and bluebunch wheatgrass. J. Range Manage. 39:443-450.
Nye PH and Tinker PB (1977) Solute Movement in the Soil-Root System. Univ. of California Press, Berkeley.
Oades JM (1984) Soil organic matter and structural stability: mechanisms and implications for management. Plant Soil 76:319-337.
290 J.P. Dobrowolski, M.M. Caldwell, and J.H. Richards
Osborn B (1952) Range conditions influence water uptake. J. Soil Water Conserv. 7:128-132.
Peck E and Brown M (1962) An approach to the development of isohyetal maps for mountainous areas. J. Geophys. Res. 67:681-694.
Price D and Boike EL (1970) Hydrologic reconnaissance of the Sink Valley area, Tooele and Box Elder Counties, Utah. Utah Dept. Nat. Res. Tech. Pub. Number 26, Salt Lake City, UT.
Reynolds TD and Fraley L (1989) Root profiles of some native and exotic plant species in southeastern Idaho. Env. Exp. Bot. 29:241-248.
Richards JH (1984) Root growth response to defoliation in two Agropyron bunchgrasses: field observations with an improved root periscope. Oecologia 64:21-25.
Richards JH (1986) Root form and depth distribution in several biomes. pp.82-97. In Carlisle D, Berry WI.., Kaplan IR, and Watterson JR (editors) Mineral Exploration: Biological Systems and Organic Matter. Rubey Vol. V. PrenticeHall, Englewood Cliffs, NJ.
Richards JH and Caldwell MM (1985) Soluble carbohydrates, concurrent photosynthesis and efficiency in regrowth following defoliation: a field study with Agropyron species. J. Appl. Ecol. 22:907-920.
Richards JH and Caldwell MM (1987) Hydraulic lift: Substantial nocturnal water transport between soil layers by Artemisia tridentata roots. Oecologia 73:486-489.
Roden LE and Bazilevich NI (1967) Production and Mineral Cycling in Terrestrial Vegetation. Oliver and Boyd, Edinburgh.
Rogers RW (1977) Lichens of hot and semi-arid lands. pp. 211-252. In Steward MRD (editor) Lichen Ecology. Academic Press, NY.
Romo IT and Haferkamp MR (1989) Water relations of Artemisia tridentata ssp. wyomingensis and Sarcobatus vermiculatus in the steppe of southeastern Oregon. Amer. MidI. Nat. 121:155-164.
Satterlund DR (1972) Wildland Watershed Management. John Wiley, NY. Schlatterer EF (1968) Establishment and survival of three native grasses under nat
ural and artificial conditions. M.S. Thesis, Univ. of Idaho, Moscow. Schumm SA (1977) The Fluvial System. Wiley, NY. Schuster JL (1964) Root development of native plants under three grazing intensi
ties. Ecology 39:63-70. Shumar ML and Anderson JE (1986) Water relations of two subspecies of big sage
brush on sand dunes in Southeastern Idaho. Northwest Sci. 60:179-185. Snyder CT (1962). A hydrologic classification of valleys in the Great Basin, western
United States. Bull. Internat. Assoc. Sci. Hydro\. 7:53-59. Snyder CT and Langbein WT (1962) The pleistocene lake in Spring Valley, Nevada
and its climatic implications. J. Geophys. Res. 67:2385-2394.
7. Basin Hydrology and Plant Root Systems 291
Springer ME (1958) Desert pavement and vesicular layer of some soils of the desert
of the Lahontan Basin, Nevada. Soil Sci. Soc. Amer. PrO<:. 22:63-66. Stanley RJ (1983) Soils and vegetation: An assessment of current status. pp. 8-18.
In Messer J and Mosely G (editors) What Future for Australia's Arid Land?
Austr. Conserv. Found, Canberra. Sturges DL (1977) Soil water withdrawal and root characteristics of big sagebrush.
Amer. MidI. Nat. 98:257-274. Sturges DL (1979) Hydrologic relations of sagebrush lands. pp.86-100. In Gifford
GF and Busby FE (editors) The Sagebrush Ecosystem: A Symposium. Utah State Univ. Press, Logan, UT.
Sturges DL (1980) Soil water withdrawal and root distribution under grubbed, sprayed, and undisturbed big sagebrush vegetation. Great Basin Nat. 40:157-164.
Sturges DL and Trlica MJ (1978) Root weights and carbohydrate reserves of big sagebrush. Ecology 59:1282-1285.
Tabler RD (1964) The root system of Artemisia tridentata at 9,500 feet in Wyoming. Ecology 45:633-636.
Tchoupopnou E (1989) Experimental studies of rain splash erosion from soil microphytic crusts on Utah rangelands. M.S. Thesis, Utah State Univ., Logan, UT.
Thompson AL and James LG (1985) Water droplet impact and its effect on infiltration. Trans. ASAE 28:1506-1510.
Thorgeirsson H (1985) Temporal and spatial partitioning of the soil water resource between two Agropyron bunchgrass and Artemisia tridentata. M.S. Thesis, Utah State Univ., Logan, UT.
Thorgeirsson H (1988) The modeling and measurement of respiratory carbon use and net carbon gain of two Agropyron bunchgrasses. PhD Dissertation, Utah State Univ., Logan, UT.
Tisdale EW and Hironaka M (1981) The sagebrush-grass region: A review of the ecological literature. Bull. 33 Forest Wildlife and Range Exp. Sta., Univ. of Idaho, Moscow.
Toth J (1962) A theory of groundwater motion in small drainage basins in Central Alberta, Canada. J. Geophys. Res. 67:4375-4387.
Yolk OH and Geyger E (1970) Schaumboden als Ursache der Vegetationslosigkeit in ariden Gebieten. Z. Geomorph. NF 14:79-95.
Walker BH (1979) Game ranching in Africa. pp. 55-81. In Walker BH (editor) Management of Arid Ecosystems. Elsevier, Amsterdam.
Wallace A, Romney EM, and Cha JW (1980) Depth distribution of roots of some perennial plants in the Nevada test site area of the Northern Mojave Desert. Great Basin Nat. Mem. 4:201-207.
Weaver JE (1919) The Ecological Relations of Roots, Carnegie Institute Washington Publication 286, Washington, DC.

292 J.P. Dobrowolski, M.M. Caldwell, and J.H. Richards
West NE and Gifford GF (1976) Rainfall interception by cool-desert shrubs. J. Range Manage. 29:171-172.
West NE (1990) Structure and function of soil microphytic crusts in wildland ecosystems of arid to semi-arid regions. Adv. Ecology (in press).
Wood MK (1976) The effects of vesicular horizons on emergence of grasses and shrubs. M.S. Thesis, Univ. Nevada, Reno, NV.
Wood MK, Blackburn WH, Eckert RE Jr, and Peterson FF (1978) Interrelations of the physical properties of coppice dune and vesicular dune interspace soils with grass seedling emergence. J. Range Manage. 31:189-192.
Wraith JF, Johnson DA, Hanks RJ, and Sisson DV (1987) Soil and plant water relations in a crested wheatgrass pasture: response to spring grazing by cattle. Oecologia 73:573-578.
Yair A and Lavee H (1974) Areal contribution to runoff on scree slopes in an extremely arid environment - a simulated rainstorm experiment. Z. Geomorph. Suppl. 21:106-121.
Young JA and Evans RA (1986) Erosion and deposition of fine sediments from playas. J. Arid Environ. 10:103-115.
Chapter 8
Isotopic Assessment of Vegetation Changes
in Grassland and Woodland Systems
Larry L. Tieszen and Steven Archer
Introduction
Dwight Billings is directly responsible for much of our understanding of plant ecophysiology, and he was one of the first to elucidate and interpret plant physiological processes in relation to ecosystem structure and function. Recent advances in stable isotope chemistry offer opportunities to identify, clarify, and trace further the linkages between plant and ecosystem-level processes, both past and present. It is within this framework of a new integrative technology, which facilitates the approaches developed by Billings, that we present this contribution. To date, there have been few studies of Great Basin vegetation processes using the techniques discussed here, and these have been described in Chapters 5 and 6, so most of our examples have been drawn from adjacent ecosystems.
An understanding of factors affecting the composition and productivity of communities through time is a fundamental interest of plant ecologists. However, in many cases we are not sure if vegetation has changed, let alone how or why. It is reasonable to expect that if we can identify and understand causes of past changes, we will be better able to anticipate future events and design management strategies to ensure sustained productivity and minimize the likelihood of undesirable, anthropogenically-induced shifts in vegetation structure. For example, one controversial problem of many arid and semi-arid landscapes in North and South America, Australia, Africa, and India in recent history is the presumed replacement of productive grasslands and savannas with high
294 L.L Tieszen and S. Archer
densities of unpalatable woody perennials. If herbaceous productivity of present-day grasslands and savannas is to be maintained in the face of increasing human population pressures and anticipated global climatic changes, which may favor woody plants (Emanuel et al. 1985a, b), an understanding of the dynamics of grasses and woody plants is essential. The use of stable isotopes, by contributing to our ability to assess vegetation history directly, will aid in anticipating the rate, magnitude, and direction of future vegetation change in such ecosystems.
The existence of stable isotopic forms of a number of elements that are of biogeochemical interest has been known for some time. For example, it was 50 years ago that we realized land plants were depleted in 13C relative to atmospheric C02 and carbonates (Nier and Gulbransen 1939) and that some plants were less depleted than others. This initial geochemical discovery was given more biological meaning 20 years ago when Bender (1968) suggested a systematic, predictable relationship between the photosynthetic carbon reduction pathways (C3 and C4 systems) and delta 13C values. This discovery, concurrent with rapid advances in our understanding of C3 and C4 photosynthetic mechanisms and the realization that these labels are transmitted to other trophic levels, has now made available a powerful research tool, which has contributed to our fundamental understanding of ecology (Tieszen and Boutton 1989).
Carbon stable isotope analysis has been useful especially in quantifying energy flow through higher trophic levels in terrestrial (Ambrose and DeNiro 1986; Tieszen and Imbamba 1980) and aquatic (Schell and Ziemann 1988; Fry and Sherr 1984; Peterson and Fry 1987) systems, in archeology and paleonutrition (DeNiro 1987; Schwartz et al. 1985), and most recently in analyses of water-use efficiency (Hubick et al. 1986; Farquhar et al. 1988; Johnson et al. 1990).
Several recent studies have documented changes in the isotopic labels of soil organic matter (SOM) and have inferred shifts in community composition and distribution (Dzurec et al. 1985) or paleoclimate (Krishnamurthy and DeNiro 1982). These approaches have been refined to provide excellent tools to assess SOM turnover in situ (Schwartz et al. 1986; Volkoff and Cerri 1987; Balesdent et al. 1987, 1988).
Other naturally occurring isotopes are rapidly becoming similarly useful for ecological studies, largely because we both understand the behavior
8. Isotopic Assessment of Vegetation Changes 295
of these isotopes better than we did 10 years ago and because of the increased availability of analytical techniques and services. Isotopic forms of H, N, 0, and S are especially relevant and ecological applications are reviewed by Rundel, Ehleringer and Nagy (1989). In this paper we wish to describe the use of natural abundances of stable isotopes to quantify the transfer of carbon from primary producers to other trophic levels, including grazing and detrital food chains. We will concentrate on grassland-woodland systems with examples from North America and appropriate systems elsewhere.
Uses of Stable Isotopes of C in Ecological Research
Most of the carbon in natural systems is in isotopic form carbon-12 (12C) with only 1.11% as carbon-13 (13C). Fractionation of these two forms can result in samples of organic carbon that are enriched or depleted in 13e. In all cases it is important to remember that mass balance is maintained. As one compartment becomes enriched in 13C, another must become def,leted. This enrichment or depletion results in different ratios of 13Cjl C, which can be measured following complete combustion to COz and cryogenic purification of the gas before admission to an isotope ratio mass spectrometer .
. Biologists usually describe the isotopic relationship of a sample by its delta 13C value. This is calculated by comparing the ratio of 13C02 to 12COz (mass 45 to mass 44) in a sample to a standard, usually the international PeeDee belemnite (PDB) standard. All results are expressed in the units, "per mil" (%0) according to the following:
delta 13C (°/00) = 13CjI2C (sample) - 13CjI2C (standard) x 1000
13CjI2C (standard)
Compared to the PDB standard, bulk atmospheric air is depleted in 13C (delta 13Cair = ca. -7,1°/00), C4 plants often are depleted slightly more (around -12.5°/00), and C3 plants are depleted strongly (around -26.5°/00). In this treatment we will attempt to describe consistently samples that are more depleted in 13C as being more negative than the standard or other referenced material.
Isotopic ratios of naturally occurring elements are useful for ecological research because they can be used as quantitative or qualitative tracers,
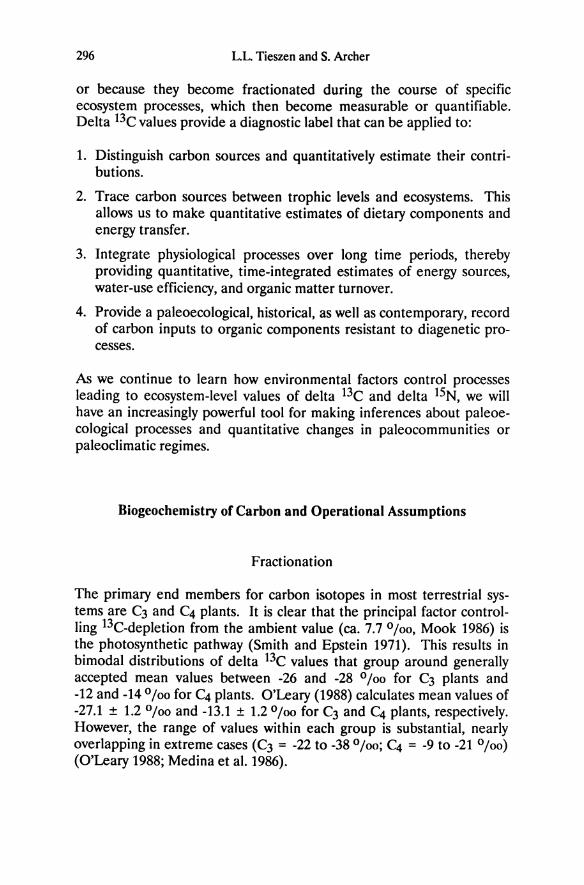
296 L.L. Tieszen and S. Archer
or because they become fractionated during the course of specific ecosystem processes, which then become measurable or quantifiable. Delta 13C values provide a diagnostic label that can be applied to:
1. Distinguish carbon sources and quantitatively estimate their contributions.
2. Trace carbon sources between trophic levels and ecosystems. This allows us to make quantitative estimates of dietary components and energy transfer.
3. Integrate physiological processes over long time periods, thereby providing quantitative, time-integrated estimates of energy sources, water-use efficiency, and organic matter turnover.
4. Provide a paleoecological, historical, as well as contemporary, record of carbon inputs to organic components resistant to diagenetic processes.
As we continue to learn how environmental factors control processes leading to ecosystem-level values of delta 13C and delta 15N, we will have an increasingly powerful tool for making inferences about paleoecological processes and quantitative changes in paleocommunities or paleoclimatic regimes.
Biogeochemistry of Carbon and Operational Assumptions
Fractionation
The primary end members for carbon isotopes in most terrestrial systems are C3 and C4 plants. It is clear that the principal factor controlling 13C-depletion from the ambient value (ca. 7.7 0 /00, Mook 1986) is the photosynthetic pathway (Smith and Epstein 1971). This results in bimodal distributions of delta 13C values that group around generally accepted mean values between -26 and -28 0/00 for C3 plants and -12 and -14 0 /00 for C4 plants. O'Leary (1988) calculates mean values of -27.1 ± 1.2 0 /00 and -13.1 ± 1.2 0 /00 for C3 and C4 plants, respectively. However, the range of values within each group is substantial, nearly overlapping in extreme cases (C3 = -22 to -38 0/00; C4 = -9 to -21 0/00)
(O'Leary 1988; Medina et al. 1986).
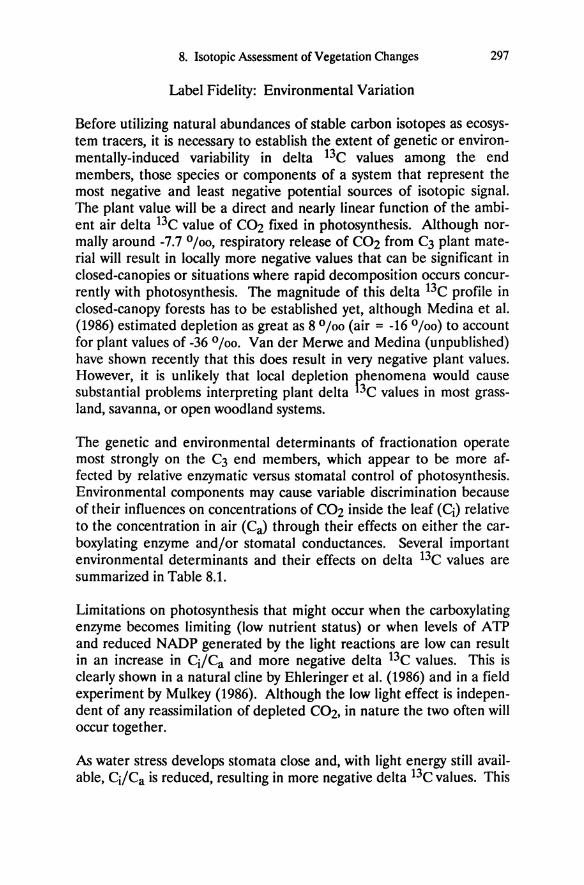
8. Isotopic Assessment of Vegetation Changes 297
Label Fidelity: Environmental Variation
Before utilizing natural abundances of stable carbon isotopes as ecosystem tracers, it is necessary to establish the extent of genetic or environmentally-induced variability in delta 13C values among the end members, those species or components of a system that represent the most negative and least negative potential sources of isotopic signal. The plant value will be a direct and nearly linear function of the ambient air delta 13C value of C~ fixed in photosynthesis. Although normally around -7.7 0/00, respiratory release of C02 from C3 plant material will result in locally more negative values that can be significant in closed-canopies or situations where rapid decomposition occurs concurrently with photosynthesis. The magnitude of this delta 13C profile in closed-canopy forests has to be established yet, although Medina et al. (1986) estimated depletion as great as 8 0 / 00 (air = -16 0 /00) to account for plant values of -36 0 /00. Van der Merwe and Medina (unpublished) have shown recently that this does result in very negative plant values. However, it is unlikely that local depletion rhenomena would cause substantial problems interpreting plant delta 3C values in most grassland, savanna, or open woodland systems.
The genetic and environmental determinants of fractionation operate most strongly on the C3 end members, which appear to be more affected by relative enzymatic versus stomatal control of photosynthesis. Environmental components may cause variable discrimination because of their influences on concentrations of C02 inside the leaf (Cj) relative to the concentration in air (Ca> through their effects on either the carboxylating enzyme and/or stomatal conductances. Several important environmental determinants and their effects on delta 13C values are summarized in Table 8.1.
Limitations on photosynthesis that might occur when the carboxylating enzyme becomes limiting (low nutrient status) or when levels of ATP and reduced NADP generated by the light reactions are low can result in an increase in Cj/Ca and more negative delta 13C values. This is clearly shown in a natural cline by Ehleringer et al. (1986) and in a field experiment by Mulkey (1986). Although the low light effect is independent of any reassimilation of depleted C~, in nature the two often will occur together.
As water stress develops stomata close and, with light energy still available, Cj/Ca is reduced, resulting in more negative delta 13C values. This
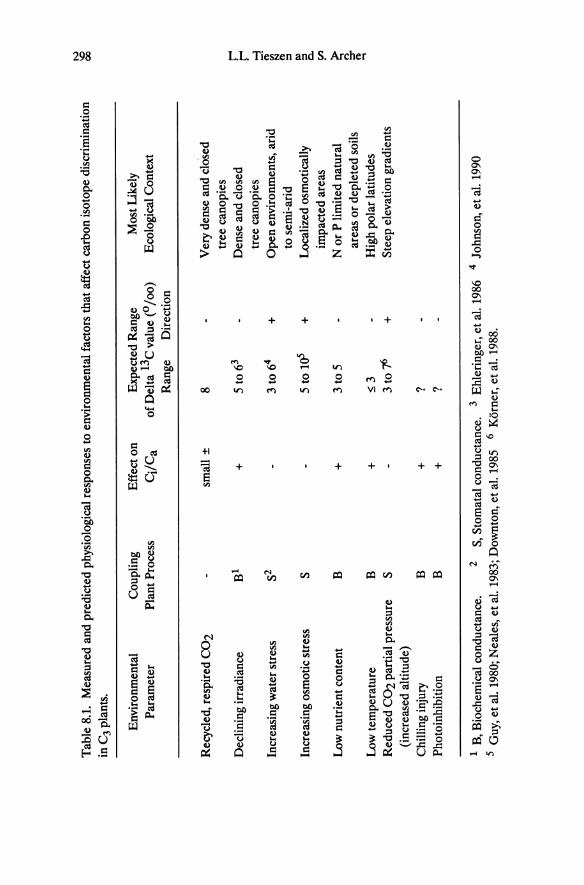
N
Tab
le 8
.1.
Mea
sure
d an
d p
redi
cted
phy
siol
ogic
al r
espo
nses
to
envi
ronm
enta
l fa
ctor
s th
at a
ffec
t ca
rbon
isot
ope
disc
rim
inat
ion
\Q
00
in C
3 pl
ants
.
Env
iron
men
tal
Cou
plin
g E
ffec
t on
E
xpec
ted
Ran
ge
Mos
t lik
ely
P
aram
eter
P
lant
Pro
cess
C
i/C
a o
f D
elta
13 C
val
ue (
0/00
) E
colo
gica
l C
onte
xt
Ran
ge
Dir
ecti
on
Rec
ycle
d, r
espi
red
CO
2 sm
all
±
8 V
ery
dens
e an
d cl
osed
tr
ee c
anop
ies
Dec
lini
ng ir
radi
ance
B
l +
5
to 6
3 D
ense
and
clo
sed
r r tr
ee c
anop
ies
~
Incr
easi
ng w
ater
str
ess
S2
3 to
64
+
Op
en e
nvir
onm
ents
, ar
id
n '" N to
sem
i-ar
id
n ::l
Incr
easi
ng o
smot
ic s
tres
s S
5 to
105
+
L
ocal
ized
osm
otic
ally
~
::l
0-
impa
cted
are
as
fIl
Low
nut
rien
t con
tent
B
+
3
to 5
N
or
P li
mit
ed n
atur
al
~
area
s o
r de
plet
ed s
oils
n ::r
n
Low
tem
pera
ture
B
:;;
3 H
igh
pola
r la
titu
des
.... +
R
educ
ed C
02
par
tial
pre
ssur
e S
3 to
'"f>
+
Ste
ep e
leva
tion
gra
dien
ts
(inc
reas
ed a
ltit
ude)
C
hill
ing
inju
ry
B
+
? P
hoto
inhi
biti
on
B
+
?
1 B
, Bio
chem
ical
con
duct
ance
. 2
S, S
tom
atal
con
duct
ance
. 3
Ehl
erin
ger,
et a
l. 19
86
4 Jo
hnso
n, e
t al
. 19
90
5 G
uy, e
t al
. 19
80;
Nea
les,
et a
l. 19
83; D
ownt
on, e
t al.
1985
6
Kor
ner,
et a
l. 19
88.
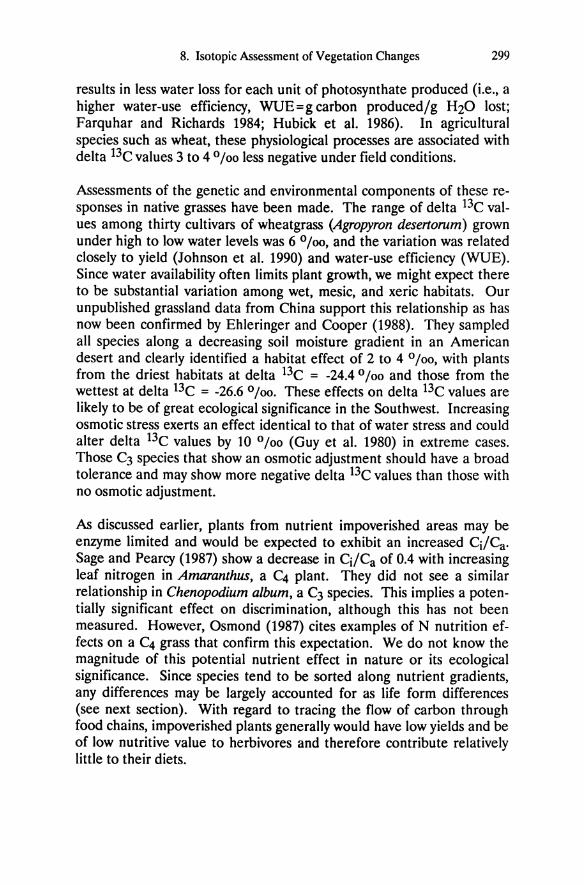
8. Isotopic Assessment of Vegetation Changes 299
results in less water loss for each unit of photosynthate produced (Le., a higher water-use efficiency, WUE=g carbon producedjg H20 lost; Farquhar and Richards 1984; Hubick et al. 1986). In agricultural species such as wheat, these physiological processes are associated with delta 13C values 3 to 4 0 /00 less negative under field conditions.
Assessments of the genetic and environmental components of these responses in native grasses have been made. The range of delta 13C values among thirty cultivars of wheatgrass (Agropyron desenorum) grown under high to low water levels was 6 0/00, and the variation was related closely to yield (Johnson et al. 1990) and water-use efficiency (WUE). Since water availability often limits plant growth, we might expect there to be substantial variation among wet, mesic, and xeric habitats. Our unpublished grassland data from China support this relationship as has now been confirmed by Ehleringer and Cooper (1988). They sampled all species along a decreasing soil moisture gradient in an American desert and clearly identified a habitat effect of 2 to 4 0/00, with plants from the driest habitats at delta 13C = -24.4 0/00 and those from the wettest at delta 13C = -26.6 0/00. These effects on delta 13C values are likely to be of great ecological significance in the Southwest. Increasing osmotic stress exerts an effect identical to that of water stress and could alter delta 13C values by 10 0/00 (Guy et al. 1980) in extreme cases. Those C3 species that show an osmotic adjustment should have a broad tolerance and may show more negative delta 13C values than those with no osmotic adjustment.
As discussed earlier, plants from nutrient impoverished areas may be enzyme limited and would be expected to exhibit an increased CjjCa. Sage and Pearcy (1987) show a decrease in CjjCa of 0.4 with increasing leaf nitrogen in Amaranthus, a C4 plant. They did not see a similar relationship in Chenopodium album, a C3 species. This implies a potentially significant effect on discrimination, although this has not been measured. However, Osmond (1987) cites examples of N nutrition effects on a C4 grass that confirm this expectation. We do not know the magnitude of this potential nutrient effect in nature or its ecological significance. Since species tend to be sorted along nutrient gradients, any differences may be largely accounted for as life form differences (see next section). With regard to tracing the flow of carbon through food chains, impoverished plants generally would have low yields and be of low nutritive value to herbivores and therefore contribute relatively little to their diets.
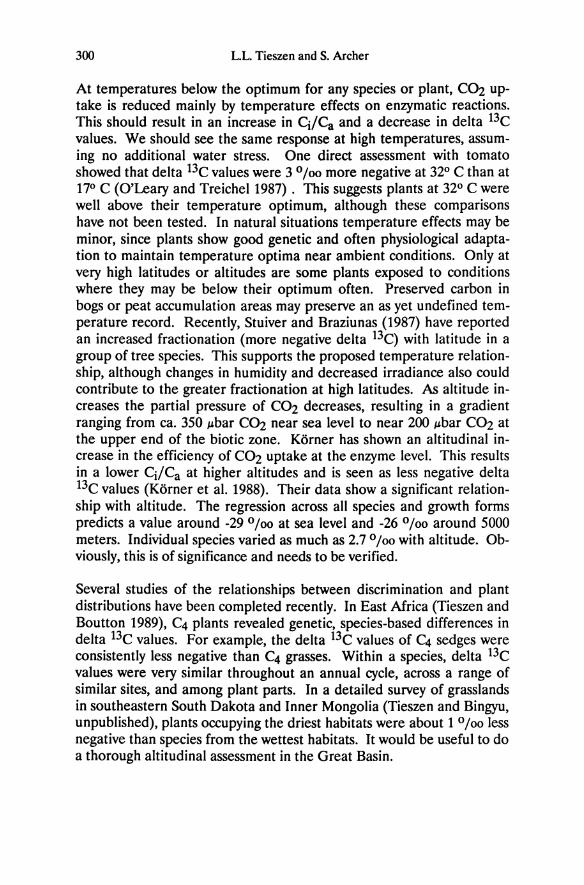
300 LL Tieszen and S. Archer
At temperatures below the optimum for any species or plant, C02 uptake is reduced mainly by temperature effects on enzymatic reactions. This should result in an increase in ~/Ca and a decrease in delta 13C values. We should see the same response at high temperatures, assuming no additional water stress. One direct assessment with tomato showed that delta 13C values were 3 0/00 more negative at 32° C than at 17° C (O'Leary and Treichel 1987) . This suggests plants at 32° C were well above their temperature optimum, although these comparisons have not been tested. In natural situations temperature effects may be minor, since plants show good genetic and often physiological adaptation to maintain temperature optima near ambient conditions. Only at very high latitudes or altitudes are some plants exposed to conditions where they may be below their optimum often. Preserved carbon in bogs or peat accumulation areas may preserve an as yet undefined temperature record. Recently, Stuiver and Braziunas (1987) have reported an increased fractionation (more negative delta 13e) with latitude in a group of tree species. This supports the proposed temperature relationship, although changes in humidity and decreased irradiance also could contribute to the greater fractionation at high latitudes. As altitude increases the partial pressure of C02 decreases, resulting in a gradient ranging from ca. 350 "bar C~ near sea level to near 200 "bar C02 at the upper end of the biotic zone. Korner has shown an altitudinal increase in the efficiency of C02 uptake at the enzyme level. This results in a lower ~/Ca at higher altitudes and is seen as less negative delta 13C values (Korner et al. 1988). Their data show a significant relationship with altitude. The regression across all species and growth forms predicts a value around -29 0/00 at sea level and -26 0/00 around 5000 meters. Individual species varied as much as 2.7 0 / 00 with altitude. Obviously, this is of significance and needs to be verified.
Several studies of the relationships between discrimination and plant distributions have been completed recently. In East Africa (Tieszen and Boutton 1989), C4 plants revealed genetic, species-based differences in delta 13C values. For example, the delta 13C values of <4 sedges were consistently less negative than C4 grasses. Within a species, delta 13C values were very similar throughout an annual cycle, across a range of similar sites, and among plant parts. In a detailed survey of grasslands in southeastern South Dakota and Inner Mongolia (Tieszen and Bingyu, unpublished), plants occupying the driest habitats were about 1 0/00 less negative than species from the wettest habitats. It would be useful to do a thorough altitudinal assessment in the Great Basin.
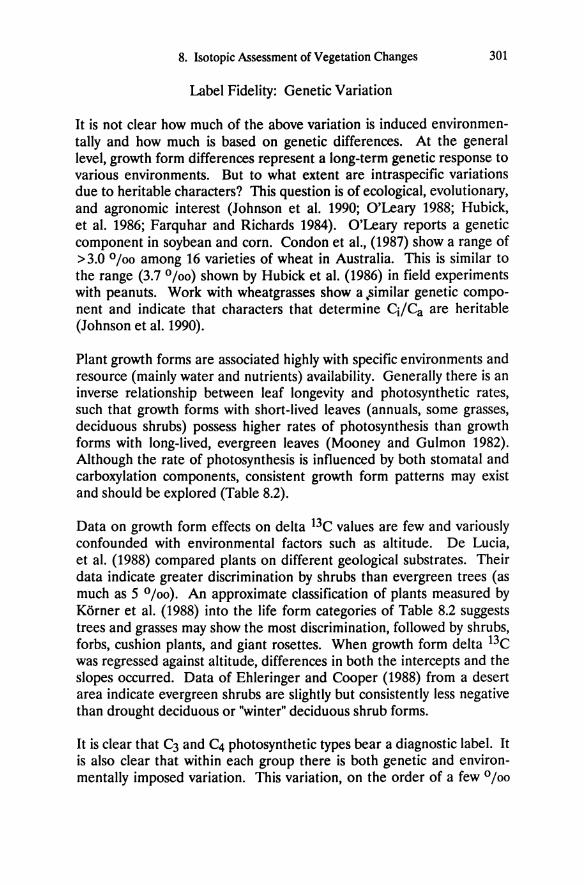
8. Isotopic Assessment of Vegetation Changes 301
Label Fidelity: Genetic Variation
It is not clear how much of the above variation is induced environmentally and how much is based on genetic differences. At the general level, growth form differences represent a long-term genetic response to various environments. But to what extent are intraspecific variations due to heritable characters? This question is of ecological, evolutionary, and agronomic interest (Johnson et ai. 1990; O'Leary 1988; Hubick, et al. 1986; Farquhar and Richards 1984). O'Leary reports a genetic component in soybean and corn. Condon et aI., (1987) show a range of > 3.0 0/00 among 16 varieties of wheat in Australia. This is similar to the range (3.7 0/00) shown by Hubick et ai. (1986) in field experiments with peanuts. Work with wheatgrasses show a .similar genetic component and indicate that characters that determine Cj/Ca are heritable (Johnson et ai. 1990).
Plant growth forms are associated highly with specific environments and resource (mainly water and nutrients) availability. Generally there is an inverse relationship between leaf longevity and photosynthetic rates, such that growth forms with short-lived leaves (annuals, some grasses, deciduous shrubs) possess higher rates of photosynthesis than growth forms with long-lived, evergreen leaves (Mooney and Gulmon 1982). Although the rate of photosynthesis is influenced by both stomatal and carboxylation components, consistent growth form patterns may exist and should be explored (Table 8.2).
Data on growth form effects on delta l3C values are few and variously confounded with environmental factors such as altitude. De Lucia, et ai. (1988) compared plants on different geological substrates. Their data indicate greater discrimination by shrubs than evergreen trees (as much as 5 0/00). An approximate classification of plants measured by Korner et al. (1988) into the life form categories of Table 8.2 suggests trees and grasses may show the most discrimination, followed by shrubs, forbs, cushion plants, and giant rosettes. When growth form delta 13C was regressed against altitude, differences in both the intercepts and the slopes occurred. Data of Ehleringer and Cooper (1988) from a desert area indicate evergreen shrubs are slightly but consistently less negative than drought deciduous or "winter" deciduous shrub forms.
It is clear that C3 and C4 photosynthetic types bear a diagnostic label. It is also clear that within each group there is both genetic and environmentally imposed variation. This variation, on the order of a few 0/00
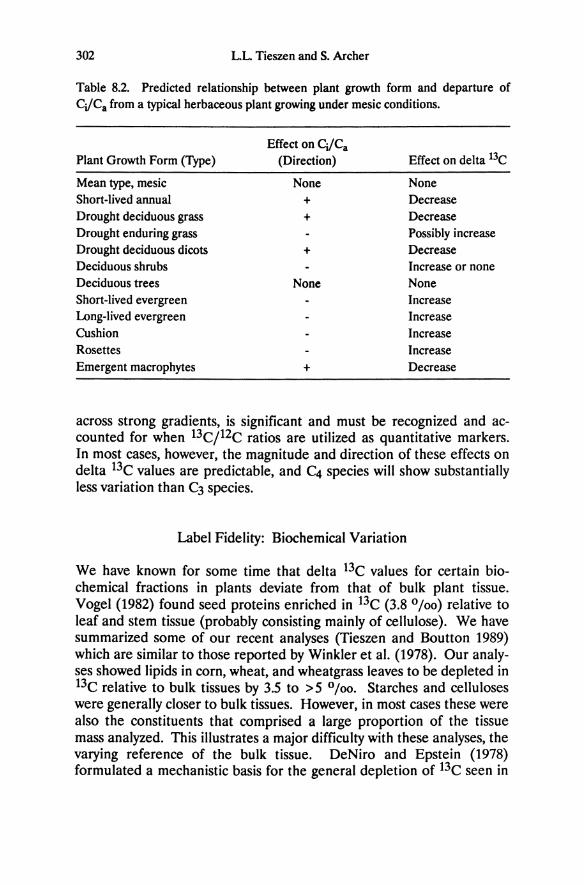
302 LL Tieszen and S. Archer
Table 8.2. Predicted relationship between plant growth form and departure of CJCa from a typical herbaceous plant growing under mesic conditions.
Plant Growth Form (Type)
Mean type, mesic Short-lived annual Drought deciduous grass Drought enduring grass Drought deciduous dicots Deciduous shrubs Deciduous trees Short-lived evergreen Long-lived evergreen Cushion Rosettes Emergent macrophytes
Effect on CJCa (Direction)
None + +
+
None
+
Effect on delta 13C
None Decrease Decrease Possibly increase Decrease Increase or none None Increase Increase Increase Increase Decrease
across strong gradients, is significant and must be recognized and accounted for when 13ej12e ratios are utilized as quantitative markers. In most cases, however, the magnitude and direction of these effects on delta 13e values are predictable, and e4 species will show substantially less variation than e3 species.
Label Fidelity: Biochemical Variation
We have known for some time that delta 13e values for certain biochemical fractions in plants deviate from that of bulk plant tissue. Vogel (1982) found seed proteins enriched in 13e (3.8 0/00) relative to leaf and stem tissue (probably consisting mainly of cellulose). We have summarized some of our recent analyses (Tieszen and Boutton 1989) which are similar to those reported by Winkler et a1. (1978). Our analyses showed lipids in com, wheat, and wheatgrass leaves to be depleted in 13e relative to bulk tissues by 3.5 to > 5 0/00• Starches and celluloses were generally closer to bulk tissues. However, in most cases these were also the constituents that comprised a large proportion of the tissue mass analyzed. This illustrates a major difficulty with these analyses, the varying reference of the bulk tissue. DeNiro and Epstein (1978) formulated a mechanistic basis for the general depletion of 13e seen in
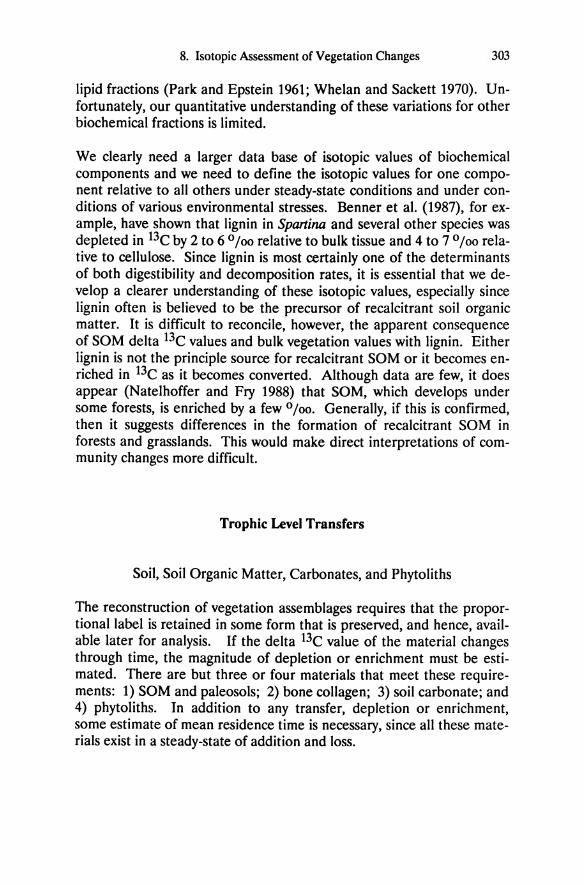
8. Isotopic Assessment of Vegetation Changes 303
lipid fractions (Park and Epstein 1961; Whelan and Sackett 1970). Unfortunately, our quantitative understanding of these variations for other biochemical fractions is limited.
We clearly need a larger data base of isotopic values of biochemical components and we need to define the isotopic values for one component relative to all others under steady-state conditions and under conditions of various environmental stresses. Benner et al. (1987), for example, have shown that lignin in Spartina and several other species was depleted in 13C by 2 to 6 0 /00 relative to bulk tissue and 4 to 7 0 /00 relative to cellulose. Since lignin is most certainly one of the determinants of both digestibility and decomposition rates, it is essential that we develop a clearer understanding of these isotopic values, especially since lignin often is believed to be the precursor of recalcitrant soil organic matter. It is difficult to reconcile, however, the apparent consequence of SOM delta 13C values and bulk vegetation values with lignin. Either lignin is not the principle source for recalcitrant SOM or it becomes enriched in 13C as it becomes converted. Although data are few, it does appear (Natelhoffer and Fry 1988) that SOM, which develops under some forests, is enriched by a few 0/00. Generally, if this is confirmed, then it suggests differences in the formation of recalcitrant SOM in forests and grasslands. This would make direct interpretations of community changes more difficult.
Trophic Level Transfers
Soil, Soil Organic Matter, Carbonates, and Phytoliths
The reconstruction of vegetation assemblages requires that the proportionallabel is retained in some form that is preserved, and hence, available later for analysis. If the delta 13C value of the material changes through time, the magnitude of depletion or enrichment must be estimated. There are but three or four materials that meet these requirements: 1) SOM and paleosols; 2) bone collagen; 3) soil carbonate; and 4) phytoliths. In addition to any transfer, depletion or enrichment, some estimate of mean residence time is necessary, since all these materials exist in a steady-state of addition and loss.
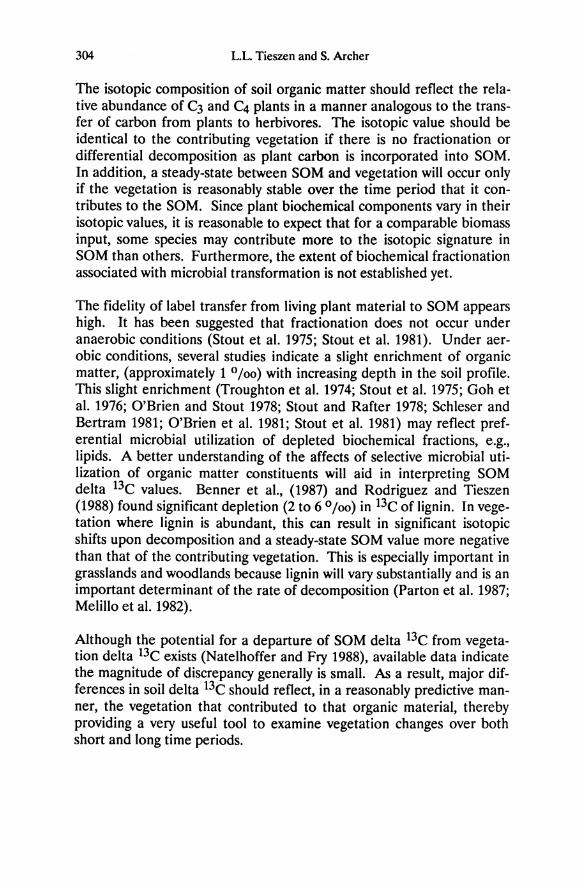
304 L.L. Tieszen and S. Archer
The isotopic composition of soil organic matter should reflect the relative abundance of C3 and C4 plants in a manner analogous to the transfer of carbon from plants to herbivores. The isotopic value should be identical to the contributing vegetation if there is no fractionation or differential decomposition as plant carbon is incorporated into SOM. In addition, a steady-state between SOM and vegetation will occur only if the vegetation is reasonably stable over the time period that it contributes to the SOM. Since plant biochemical components vary in their isotopic values, it is reasonable to expect that for a comparable biomass input, some species may contribute more to the isotopic signature in SOM than others. Furthermore, the extent of biochemical fractionation associated with microbial transformation is not established yet.
The fidelity of label transfer from living plant material to SOM appears high. It has been suggested that fractionation does not occur under anaerobic conditions (Stout et al. 1975; Stout et al. 1981). Under aerobic conditions, several studies indicate a slight enrichment of organic matter, (approximately 1 0/00) with increasing depth in the soil profile. This slight enrichment (Troughton et al. 1974; Stout et al. 1975; Goh et al. 1976; O'Brien and Stout 1978; Stout and Rafter 1978; Schleser and Bertram 1981; O'Brien et al. 1981; Stout et al. 1981) may reflect preferential microbial utilization of depleted biochemical fractions, e.g., lipids. A better understanding of the affects of selective microbial utilization of organic matter constituents will aid in interpreting SOM delta 13C values. Benner et aI., (1987) and Rodriguez and Tieszen (1988) found significant depletion (2 to 6 0/00) in 13C of lignin. In vegetation where lignin is abundant, this can result in significant isotopic shifts upon decomposition and a steady-state SOM value more negative than that of the contributing vegetation. This is especially important in grasslands and woodlands because lignin will vary substantially and is an important determinant of the rate of decomposition (Parton et al. 1987; Melillo et al. 1982).
Although the potential for a departure of SOM delta 13C from vegetation delta 13C exists (Natelhoffer and Fry 1988), available data indicate the magnitude of discrepancy generally is small. As a result, major differences in soil delta 13C should reflect, in a reasonably predictive manner, the vegetation that contributed to that organic material, thereby providing a very useful tool to examine vegetation changes over both short and long time periods.
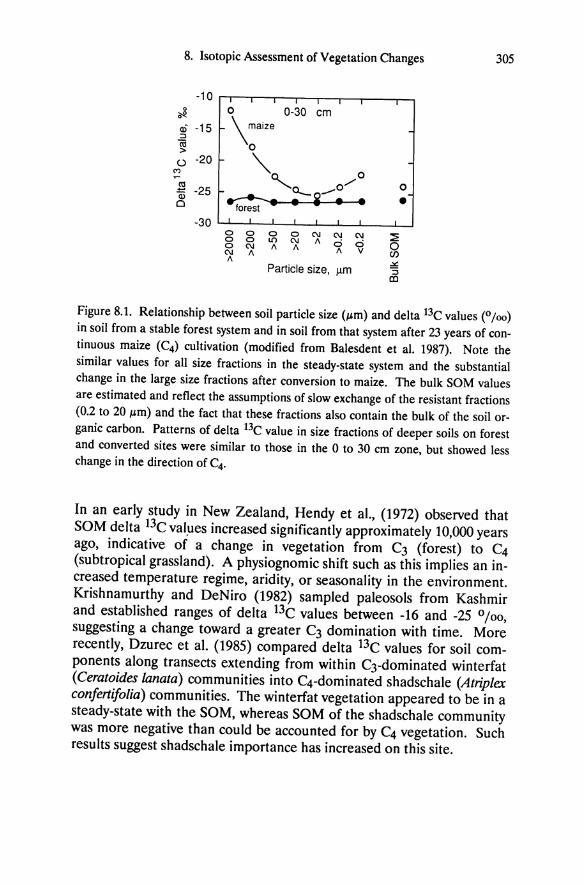
8. Isotopic Assessment of Vegetation Changes 305
-10 0 0 0-30 em ~
\ maize CIi -15 =:J
~ 0
0 -20
'" '" "-.~ _0/ ° .l!! -25 ° Q) ~ •• i • • • 0
-30 0 0 0 0 C\J C\J C\J ::E 0 0 LO C\J II ci ci 0 0 C\J II II II V C\J II (f) II ..>::
Particle size, 11m 'S ell
Figure 8.1. Relationship between soil particle size (~m) and delta 13C values (0/00)
in soil from a stable forest system and in soil from that system after 23 years of continuous maize (C4) cultivation (modified from Balesdent et al. 1987). Note the similar values for aU size fractions in the steady-state system and the substantial change in the large size fractions after conversion to maize. The bulk SOM values are estimated and reflect the assumptions of slow exchange of the resistant fractions (0.2 to 20 ~m) and the fact that these fractions also contain the bulk of the soil organic carbon. Patterns of delta 13C value in size fractions of deeper soils on forest and converted sites were similar to those in the 0 to 30 cm zone, but showed less change in the direction of C4.
In an early study in New Zealand, Hendy et at., (1972) observed that SOM delta 13C val~es increased significantly approximately 10,000 years ago, indicative of a change in vegetation from C3 (forest) to C4 (subtropical grassland). A physiognomic shift such as this implies an increased temperature regime, aridity, or seasonality in the environment. Krishnamurthy and DeNiro (1982) sampled paleosols from Kashmir and established ranges of delta 13C values between -16 and -25 0/00,
suggesting a change toward a greater C3 domination with time. More recently, Dzurec et at. (1985) compared delta 13C values for soil components along transects extending from within C3-dominated winterfat (Ceratoides lanata) communities into C4-dominated shadschale (Atriplex confertifolia) communities. The winterfat vegetation appeared to be in a steady-state with the SOM, whereas SOM of the shadschale community was more negative than could be accounted for by C4 vegetation. Such results suggest shadschale importance has increased on this site.
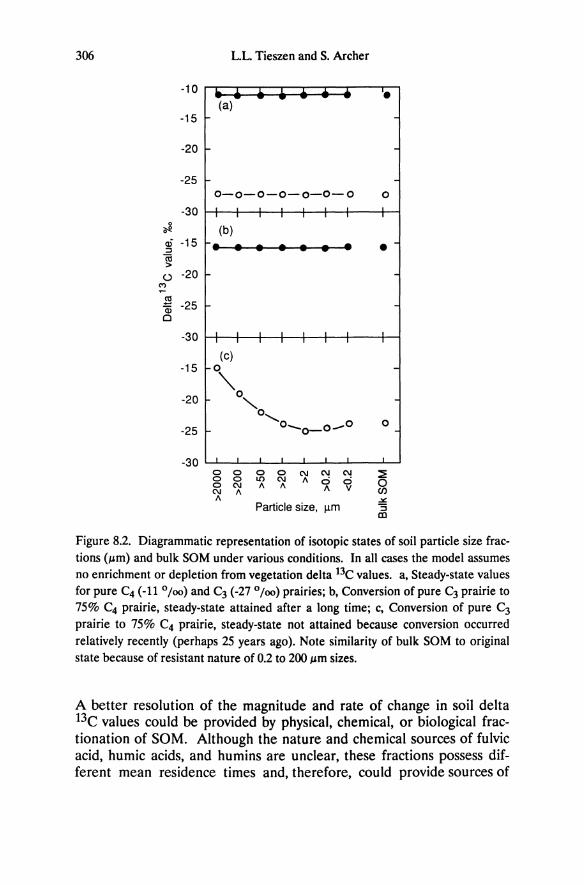
306 LL Tieszen and S. Archer
-10 (a)- - ... •
-15
-20
-25 0-0-0-0-0-0-0 0
-30 0
il"! (b) CIi -15 :l • • • • • • • • iii >
Q -20 ~ g
-25 a; Cl
-30
(c) -15
-20
-25
0"-0
'0 ........ 0 0_0-0 _ 0
-30
Particle size, ~m
Figure 8.2. Diagrammatic representation of isotopic states of soil particle size fractions (~m) and bulk SOM under various conditions. In all cases the model assumes no enrichment or depletion from vegetation delta 13C values. a, Steady-state values for pure C4 (-11 °/(0) and C3 (-27 °/(0) prairies; b, Conversion of pure C3 prairie to 75% C4 prairie, steady-state attained after a long time; c, Conversion of pure C3 prairie to 75% C4 prairie, steady-state not attained because conversion occurred relatively recently (perhaps 25 years ago). Note similarity of bulk SOM to original state because of resistant nature of 0.2 to 200 ~m sizes.
A better resolution of the magnitude and rate of change in soil delta 13e values could be provided by physical, chemical, or biological fractionation of SOM. Although the nature and chemical sources of fulvic acid, humic acids, and humins are unclear, these fractions possess different mean residence times and, therefore, could provide sources of
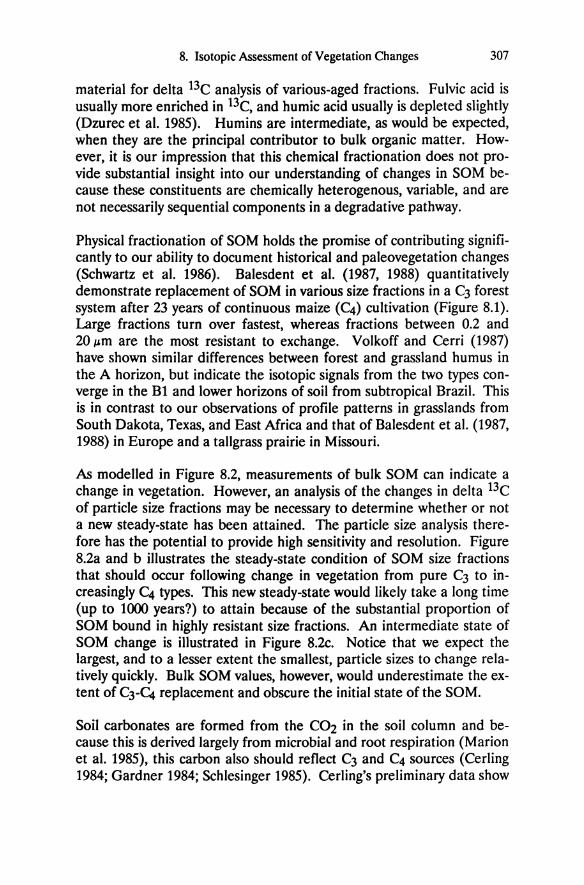
8. Isotopic Assessment of Vegetation Changes 307
material for delta 13e analysis of various-aged fractions. Fulvic acid is usually more enriched in 13e, and humic acid usually is depleted slightly (Dzurec et al. 1985). Humins are intermediate, as would be expected, when they are the principal contributor to bulk organic matter. However, it is our impression that this chemical fractionation does not provide substantial insight into our understanding of changes in SOM because these constituents are chemically heterogenous, variable, and are not necessarily sequential components in a degradative pathway.
Physical fractionation of SOM holds the promise of contributing significantly to our ability to document historical and paleovegetation changes (Schwartz et al. 1986). Balesdent et al. (1987, 1988) quantitatively demonstrate replacement of SOM in various size fractions in a C3 forest system after 23 years of continuous maize (C.) cultivation (Figure 8.1). Large fractions turn over fastest, whereas fractions between 0.2 and 20 ",m are the most resistant to exchange. Volkoff and Cerri (1987) have shown similar differences between forest and grassland humus in the A horizon, but indicate the isotopic signals from the two types converge in the Bl and lower horizons of soil from subtropical Brazil. This is in contrast to our observations of profile patterns in grasslands from South Dakota, Texas, and East Africa and that of Balesdent et al. (1987, 1988) in Europe and a tallgrass prairie in Missouri.
As modelled in Figure 8.2, measurements of bulk SOM can indicate a change in vegetation. However, an analysis of the changes in delta 13e of particle size fractions may be necessary to determine whether or not a new steady-state has been attained. The particle size analysis therefore has the potential to provide high sensitivity and resolution. Figure 8.2a and b illustrates the steady-state condition of SOM size fractions that should occur following change in vegetation from pure C3 to increasingly C4 types. This new steady-state would likely take a long time (up to 1000 years?) to attain because of the substantial proportion of SOM bound in highly resistant size fractions. An intermediate state of SOM change is illustrated in Figure 8.2c. Notice that we expect the largest, and to a lesser extent the smallest, particle sizes to change relatively quickly. Bulk SOM values, however, would underestimate the extent of e3-c. replacement and obscure the initial state of the SOM.
Soil carbonates are formed from the C02 in the soil column and because this is derived largely from microbial and root respiration (Marion et al. 1985), this carbon also should reflect C3 and C4 sources (Cerling 1984; Gardner 1984; Schlesinger 1985). Cerling's preliminary data show
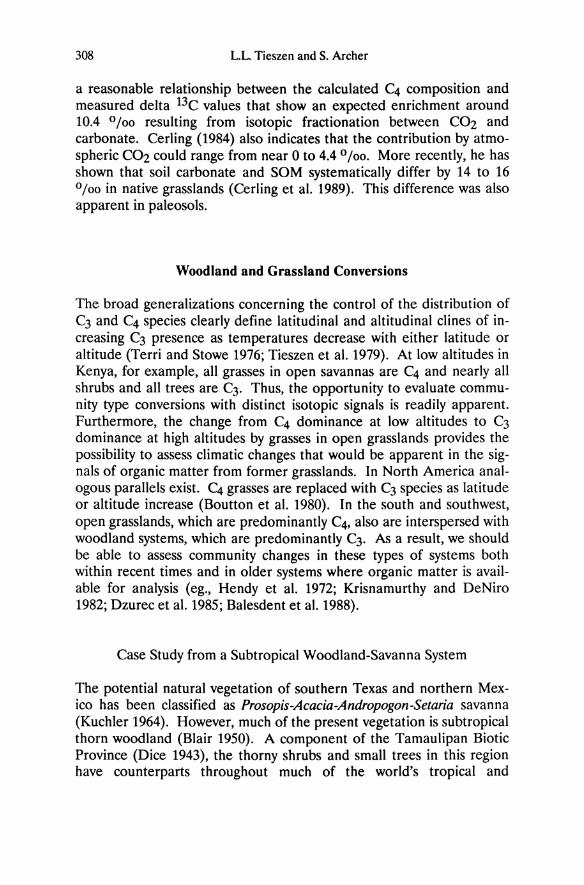
308 LL Tieszen and S. Archer
a reasonable relationship between the calculated (4 composition and measured delta 13C values that show an expected enrichment around 10.4 0/00 resulting from isotopic fractionation between C02 and carbonate. Cerling (1984) also indicates that the contribution by atmospheric C02 could range from near 0 to 4.4 0 /00. More recently, he has shown that soil carbonate and SaM systematically differ by 14 to 16 0/00 in native grasslands (Cerling et at. 1989). This difference was also apparent in paleosols.
Woodland and Grassland Conversions
The broad generalizations concerning the control of the distribution of C3 and C4 species clearly define latitudinal and altitudinal clines of increasing C3 presence as temperatures decrease with either latitude or altitude (Terri and Stowe 1976; Tieszen et at. 1979). At low altitudes in Kenya, for example, all grasses in open savannas are C4 and nearly all shrubs and all trees are C3. Thus, the opportunity to evaluate community type conversions with distinct isotopic signals is readily apparent. Furthermore, the change from C4 dominance at low altitudes to C3 dominance at high altitudes by grasses in open grasslands provides the possibility to assess climatic changes that would be apparent in the signals of organic matter from former grasslands. In North America analogous parallels exist. (4 grasses are replaced with C3 species as latitude or altitude increase (Boutton et at. 1980). In the south and southwest, open grasslands, which are predominantly C4, also are interspersed with woodland systems, which are predominantly C3. As a result, we should be able to assess community changes in these types of systems both within recent times and in older systems where organic matter is available for analysis (eg., Hendy et at. 1972; Krisnamurthy and DeNiro 1982; Dzurec et at. 1985; Balesdent et at. 1988).
Case Study from a Subtropical Woodland-Savanna System
The potential natural vegetation of southern Texas and northern Mexico has been classified as Prosopis-Acacia-Andropogon-Setaria savanna (Kuchler 1964). However, much of the present vegetation is subtropical thorn woodland (Blair 1950). A component of the Tamaulipan Biotic Province (Dice 1943), the thorny shrubs and small trees in this region have counterparts throughout much of the world's tropical and
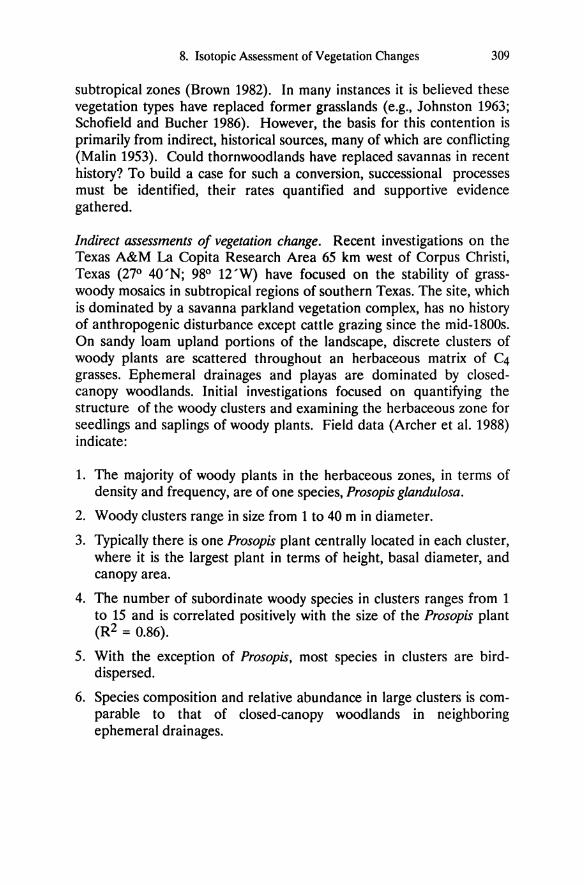
8. Isotopic A"sessment of Vegetation Changes 309
subtropical zones (Brown 1982). In many instances it is believed these vegetation types have replaced former grasslands (e.g., Johnston 1963; Schofield and Bucher 1986). However, the basis for this contention is primarily from indirect, historical sources, many of which are conflicting (Malin 1953). Could thornwood lands have replaced savannas in recent history? To build a case for such a conversion, successional processes must be identified, their rates quantified and supportive evidence gathered.
Indirect assessments of vegetation change. Recent investigations on the Texas A&M La Copita Research Area 65 km west of Corpus Christi, Texas (270 40'N; 980 12'W) have focused on the stability of grasswoody mosaics in subtropical regions of southern Texas. The site, which is dominated by a savanna parkland vegetation complex, has no history of anthropogenic disturbance except cattle grazing since the mid-1800s. On sandy loam upland portions of the landscape, discrete clusters of woody plants are scattered throughout an herbaceous matrix of C4 grasses. Ephemeral drainages and playas are dominated by c1osedcanopy woodlands. Initial investigations focused on quantifying the structure of the woody clusters and examining the herbaceous zone for seedlings and saplings of woody plants. Field data (Archer et a1. 1988) indicate:
1. The majority of woody plants in the herbaceous zones, in terms of density and frequency, are of one species, Prosopis glandulosa.
2. Woody clusters range in size from 1 to 40 m in diameter.
3. Typically there is one Prosopis plant centrally located in each cluster, where it is the largest plant in terms of height, basal diameter, and canopy area.
4. The number of subordinate woody species in clusters ranges from 1 to 15 and is correlated positively with the size of the Prosopis plant (R2 = 0.86).
5. With the exception of Prosopis, most species in clusters are birddispersed.
6. Species composition and relative abundance in large clusters is comparable to that of closed-canopy woodlands in neighboring ephemeral drainages.
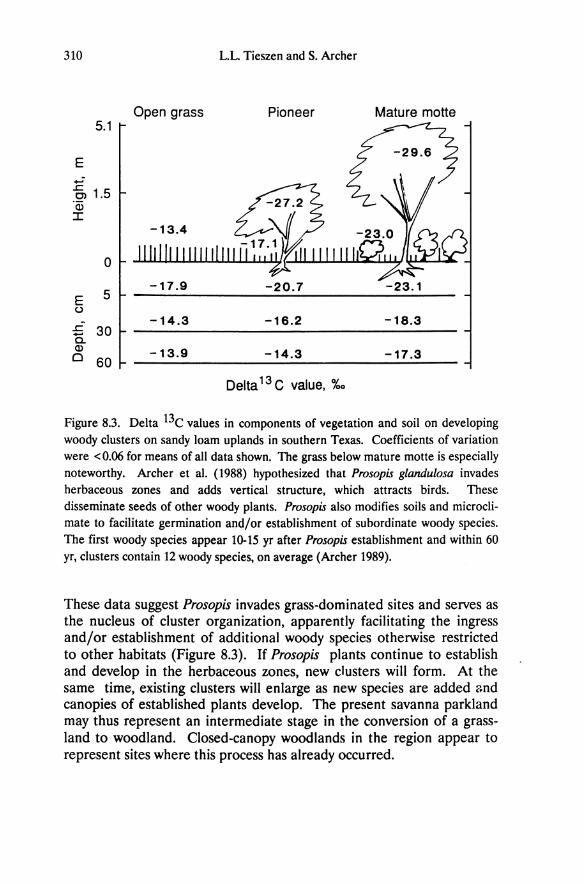
310 L.L. Tieszen and S. Archer
Open grass Pioneer Mature motte 5.1
E ...;--g, 1.5 ·CD I
0
5 -17.9
E -20.7
(.)
-14.3 L: 30 - -16.2 -18.3
a. Q)
-13.9 0 60 -14.3 -17.3
Delta 13 C value, %0
Figure 8.3. Delta 13C values in components of vegetation and soil on developing
woody clusters on sandy loam uplands in southern Texas. Coefficients of variation were < 0.06 for means of all data shown. The grass below mature motte is especially noteworthy. Archer et at. (1988) hypothesized that Prosopis glandulosa invades
herbaceous zones and adds vertical structure, which attracts birds. These disseminate seeds of other woody plants. Prosopis also modifies soils and microclimate to facilitate germination and/or establishment of subordinate woody species. The first woody species appear 10-15 yr after Prosopis establishment and within 60
yr, clusters contain 12 woody species, on average (Archer 1989).
These data suggest Prosopis invades grass-dominated sites and serves as the nucleus of cluster organization, apparently facilitating the ingress and/or establishment of additional woody species otherwise restricted to other habitats (Figure 8.3). If Prosopis plants continue to establish and develop in the herbaceous zones, new clusters will form. At the same time, existing clusters will enlarge as new species are added and canopies of established plants develop. The present savanna parkland may thus represent an intermediate stage in the conversion of a grassland to woodland. Closed-canopy woodlands in the region appear to represent sites where this process has already occurred.
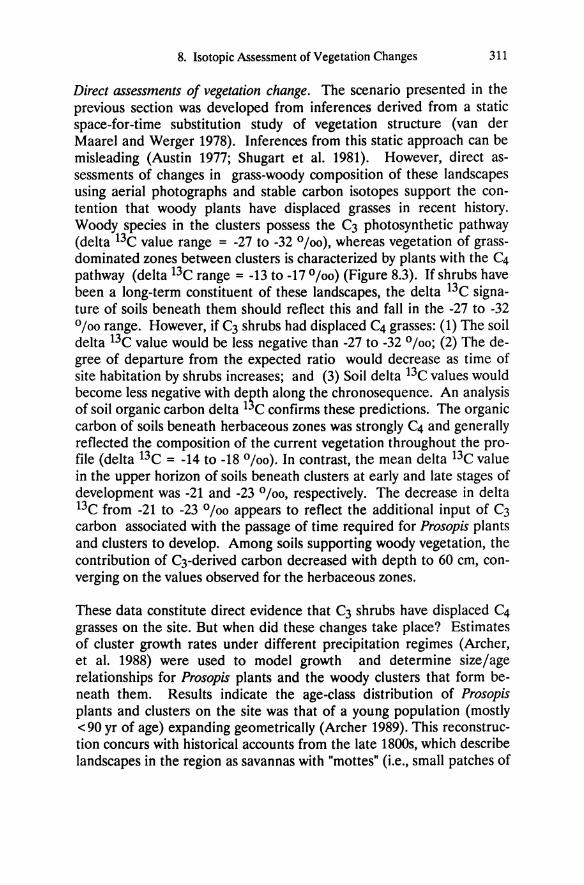
8. Isotopic Assessment of Vegetation Changes 311
Direct assessments of vegetation change. The scenario presented in the previous section was developed from inferences derived from a static space-for-time substitution study of vegetation structure (van der Maarel and Werger 1978). Inferences from this static approach can be misleading (Austin 1977; Shugart et al. 1981). However, direct assessments of changes in grass-woody composition of these landscapes using aerial photographs and stable carbon isotopes support the contention that woody plants have displaced grasses in recent history. Woody species in the clusters possess the C3 photosynthetic pathway (delta 13C value range = -27 to -32 0/00), whereas vegetation of grassdominated zones between clusters is characterized by plants with the C4 pathway (delta 13C range = -13 to -17 0/00) (Figure 8.3). If shrubs have been a long-term constituent of these landscapes, the delta 13C signature of soils beneath them should reflect this and fall in the -27 to -32 0/00 range. However, if C3 shrubs had displaced C4 grasses: (1) The soil delta 13C value would be less negative than -27 to -32 0/00; (2) The degree of departure from the expected ratio would decrease as time of site habitation by shrubs increases; and (3) Soil delta BC values would become less negative with de~th along the chronosequence. An analysis of soil organic carbon delta 1 C confirms these predictions. The organic carbon of soils beneath herbaceous zones was strongly C4 and generally reflected the composition of the current vegetation throughout the profile (delta BC = -14 to -18 0/00). In contrast, the mean delta 13C value in the upper horizon of soils beneath clusters at early and late stages of development was -21 and -23 0/00, respectively. The decrease in delta BC from -21 to -23 0/00 appears to reflect the additional input of C3 carbon associated with the passage of time required for Prosopis plants and clusters to develop. Among soils supporting woody vegetation, the contribution of C3-derived carbon decreased with depth to 60 cm, converging on the values observed for the herbaceous zones.
These data constitute direct evidence that C3 shrubs have displaced C4 grasses on the site. But when did these changes take place? Estimates of cluster growth rates under different precipitation regimes (Archer, et al. 1988) were used to model growth and determine size/age relationships for Prosopis plants and the woody clusters that form beneath them. Results indicate the age-class distribution of Prosopis plants and clusters on the site was that of a young population (mostly <90 yr of age) expanding geometrically (Archer 1989). This reconstruction concurs with historical accounts from the late 1800s, which describe landscapes in the region as savannas with "mottes" (Le., small patches of
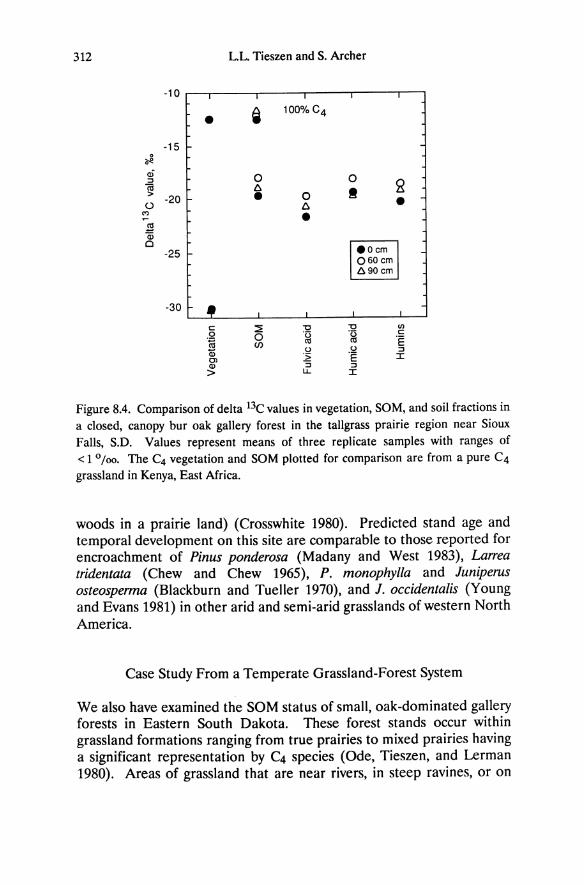
312 L.L. Tieszen and S. Archer
-10
• i 100% C4
-15 0
~
Cli 0 0 ::l g Cii A ! > -20 • 0 () A • '" • .cg CD 0
-25 .Oem 060em A90em
-30
c ::2 "0 "0 '" 0 0 °u °u c o~ en <1l <1l °E Q) 0 0 ::l
0) 2 °E :::c CD ::l ::l > u.. :::c
Figure 8.4. Comparison of delta 13C values in vegetation, SOM, and soil fractions in a closed, canopy bur oak gallery forest in the tallgrass prairie region near Sioux Falls, S.D. Values represent means of three replicate samples with ranges of < 1 0/00• The C4 vegetation and SOM plotted for comparison are from a pure C4
grassland in Kenya, East Africa.
woods in a prairie land) (Crosswhite 1980). Predicted stand age and temporal development on this site are comparable to those reported for encroachment of Pinus ponderosa (Madany and West 1983), Larrea tridentata (Chew and Chew 1965), P. monophylla and Juniperus osteosperma (Blackburn and Tueller 1970), and J. occidentalis (Young and Evans 1981) in other arid and semi-arid grasslands of western North America.
Case Study From a Temperate Grassland-Forest System
We also have examined the SOM status of small, oak-dominated gallery forests in Eastern South Dakota. These forest stands occur within grassland formations ranging from true prairies to mixed prairies having a significant representation by C4 species (Ode, Tieszen, and Lerman 1980). Areas of grassland that are near rivers, in steep ravines, or on
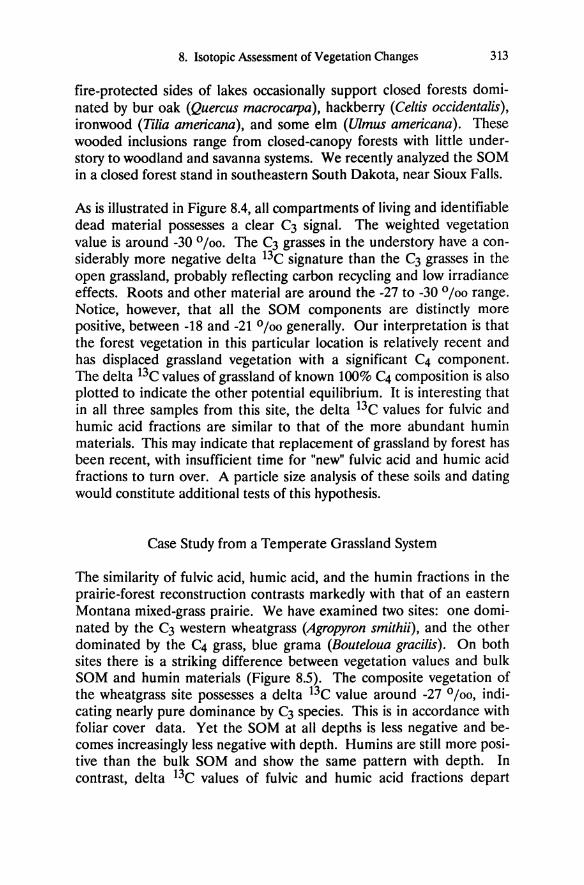
8. Isotopic Assessment of Vegetation Changes 313
fire-protected sides of lakes occasionally support closed forests dominated by bur oak (Quercus macrocarpa), hackberry (Celtis occidentalis), ironwood (TWa americana), and some elm (Ulmus americana). These wooded inclusions range from closed-canopy forests with little understory to woodland and savanna systems. We recently analyzed the SOM in a closed forest stand in southeastern South Dakota, near Sioux Falls.
As is illustrated in Figure 8.4, all compartments of living and identifiable dead material possesses a clear C3 signal. The weighted vegetation value is around -30 0/00. The C3 grasses in the understory have a considerably more negative delta 13C signature than the C3 grasses in the open grassland, probably reflecting carbon recycling and low irradiance effects. Roots and other material are around the -27 to -30 0/00 range. Notice, however, that all the SOM components are distinctly more positive, between -18 and -21 0/00 generally. Our interpretation is that the forest vegetation in this particular location is relatively recent and has displaced grassland vegetation with a significant C4 component. The delta 13C values of grassland of known 100% C4 composition is also plotted to indicate the other potential equilibrium. It is interesting that in all three samples from this site, the delta 13C values for fulvic and humic acid fractions are similar to that of the more abundant humin materials. This may indicate that replacement of grassland by forest has been recent, with insufficient time for "new" fulvic acid and humic acid fractions to turn over. A particle size analysis of these soils and dating would constitute additional tests of this hypothesis.
Case Study from a Temperate Grassland System
The similarity of fulvic acid, humic acid, and the humin fractions in the prairie-forest reconstruction contrasts markedly with that of an eastern Montana mixed-grass prairie. We have examined two sites: one dominated by the C3 western wheatgrass (Agropyron smithii), and the other dominated by the C4 grass, blue grama (Bouteloua gracilis). On both sites there is a striking difference between vegetation values and bulk SOM and humin materials (Figure 8.5). The composite vegetation of the wheatgrass site possesses a delta 13C value around -27 0/00, indicating nearly pure dominance by C3 species. This is in accordance with foliar cover data. Yet the SOM at all depths is less negative and becomes increasingly less negative with depth. Humins are still more positive than the bulk SOM and show the same pattern with depth. In contrast, delta 13C values of fulvic and humic acid fractions depart
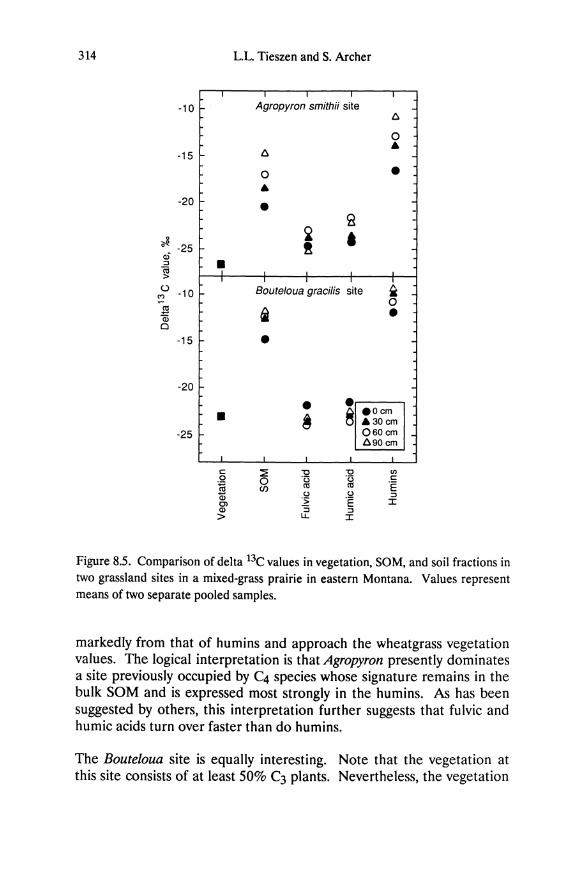
314 L.L. Tieszen and S. Archer
I
-10 Agropyron smithii site 6
0 A
-15 6
0 • A
-20 • H 0 2 • ~ -25 !
cU ::l • Cii > ()
-10 Boute/oua gracilis site ~ '" 0 ~ i • OJ Cl
-15 • -20
• • • ~ B .Oem A30em
-25 060em 690 em
c: ::::i: "0 "0 rn 0 0 "1:5 "0 c:
~ (/) C1l C1l "E u u ::l Q) "S "E I OJ
Q) ::; ::l
> LL I
Figure 8.5. Comparison of delta 13C values in vegetation, SOM, and soil fractions in two grassland sites in a mixed-grass prairie in eastern Montana. Values represent means of two separate pooled samples.
markedly from that of hum ins and approach the wheatgrass vegetation values. The logical interpretation is that Agropyron presently dominates a site previously occupied by C4 species whose signature remains in the bulk SOM and is expressed most strongly in the humins. As has been suggested by others, this interpretation further suggests that fulvic and humic acids turn over faster than do humins.
The Bouteloua site is equally interesting. Note that the vegetation at this site consists of at least 50% C3 plants. Nevertheless, the vegetation
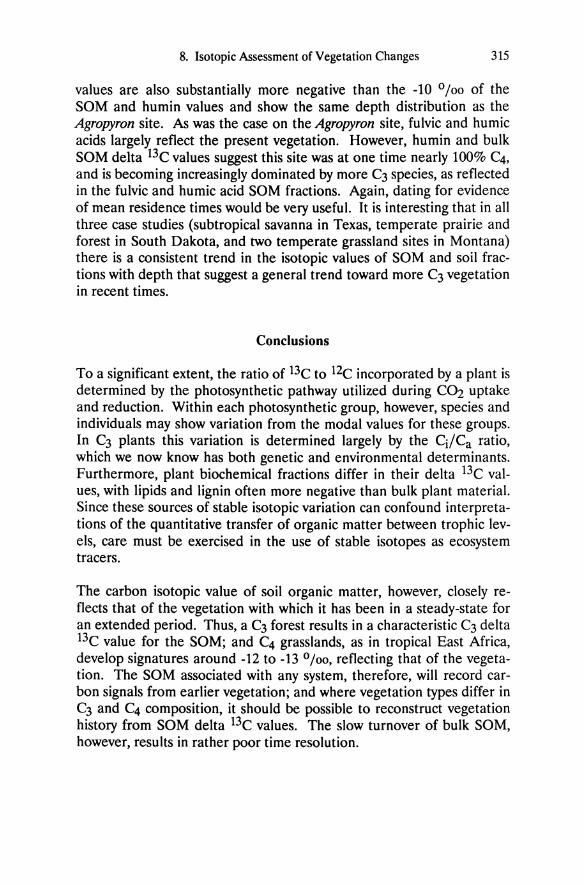
8. Isotopic Assessment of Vegetation Changes 315
values are also substantially more negative than the -10 0/00 of the SOM and humin values and show the same depth distribution as the Agropyron site. As was the case on the Agropyron site, fulvic and humic acids largely reflect the present vegetation. However, humin and bulk SOM delta 13C values suggest this site was at one time nearly 100% C4, and is becoming increasingly dominated by more C3 species, as reflected in the fulvic and humic acid SOM fractions. Again, dating for evidence of mean residence times would be very useful. It is interesting that in all three case studies (subtropical savanna in Texas, temperate prairie and forest in South Dakota, and two temperate grassland sites in Montana) there is a consistent trend in the isotopic values of SOM and soil fractions with depth that suggest a general trend toward more C3 vegetation in recent times.
Conclusions
To a significant extent, the ratio of 13C to 12C incorporated by a plant is determined by the photosynthetic pathway utilized during C02 uptake and reduction. Within each photosynthetic group, however, species and individuals may show variation from the modal values for these groups. In C3 plants this variation is determined largely by the CjjCa ratio, which we now know has both genetic and environmental determinants. Furthermore, plant biochemical fractions differ in their delta 13C values, with lipids and lignin often more negative than bulk plant material. Since these sources of stable isotopic variation can confound interpretations of the quantitative transfer of organic matter between trophic levels, care must be exercised in the use of stable isotopes as ecosystem tracers.
The carbon isotopic value of soil organic matter, however, closely reflects that of the vegetation with which it has been in a steady-state for an extended period. Thus, a C3 forest results in a characteristic C3 delta 13C value for the SOM; and C4 grasslands, as in tropical East Africa, develop signatures around -12 to -13 0/00, reflecting that of the vegetation. The SOM associated with any system, therefore, will record carbon signals from earlier vegetation; and where vegetation types differ in C3 and C4 composition, it should be possible to reconstruct vegetation history from SOM delta 13C values. The slow turnover of bulk SOM, however, results in rather poor time resolution.
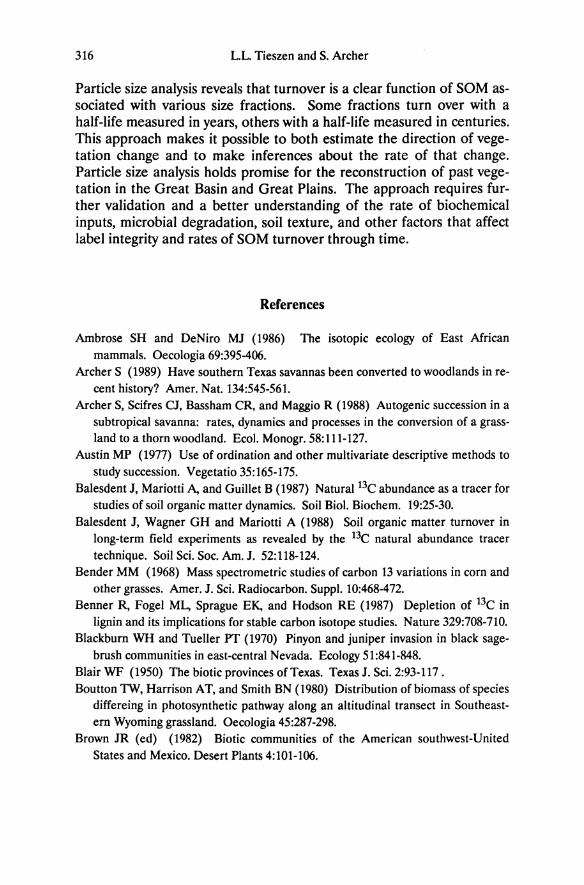
316 LL Tieszen and S. Archer
Particle size analysis reveals that turnover is a clear function of SOM associated with various size fractions. Some fractions turn over with a half-life measured in years, others with a half-life measured in centuries. This approach makes it possible to both estimate the direction of vegetation change and to make inferences about the rate of that change. Particle size analysis holds promise for the reconstruction of past vegetation in the Great Basin and Great Plains. The approach requires further validation and a better understanding of the rate of biochemical inputs, microbial degradation, soil texture, and other factors that affect label integrity and rates of SOM turnover through time.
References
Ambrose SH and DeNiro MJ (1986) The isotopic ecology of East African mammals. Oecologia 69:395-406.
Archer S (1989) Have southern Texas savannas been converted to woodlands in recent history? Amer. Nat. 134:545-561.
Archer S, Scifres CJ, Bassham CR, and Maggio R (1988) Autogenic succession in a subtropical savanna: rates, dynamics and processes in the conversion of a grassland to a thorn woodland. Ecol. Monogr. 58:111-127.
Austin MP (1977) Use of ordination and other multivariate descriptive methods to study succession. Vegetatio 35:165-175.
Balesdent J, Mariotti A, and Guillet B (1987) Natural 13C abundance as a tracer for studies of soil organic matter dynamics. Soil BioI. Biochem. 19:25-30.
Balesdent J, Wagner GH and Mariotti A (1988) Soil organic matter turnover in long-term field experiments as revealed by the 13C natural abundance tracer technique. Soil Sci. Soc. Am. J. 52:118-124.
Bender MM (1968) Mass spectrometric studies of carbon 13 variations in com and other grasses. Amer. J. Sci. Radiocarbon. Suppl. 10:468-472.
Benner R, Fogel ML, Sprague EK, and Hodson RE (1987) Depletion of 13C in lignin and its implications for stable carbon isotope studies. Nature 329:708-710.
Blackburn WH and Tueller PT (1970) Pinyon and juniper invasion in black sagebrush communities in east-central Nevada. Ecology 51:841-848.
Blair WF (1950) The biotic provinces of Texas. Texas J. Sci. 2:93-117 . Boutton TW, Harrison AT, and Smith BN (1980) Distribution of biomass of species
differeing in photosynthetic pathway along an altitudinal transect in Southeastern Wyoming grassland. Oecologia 45:287-298.
Brown JR (ed) (1982) Biotic communities of the American southwest-United States and Mexico. Desert Plants 4:101-106.
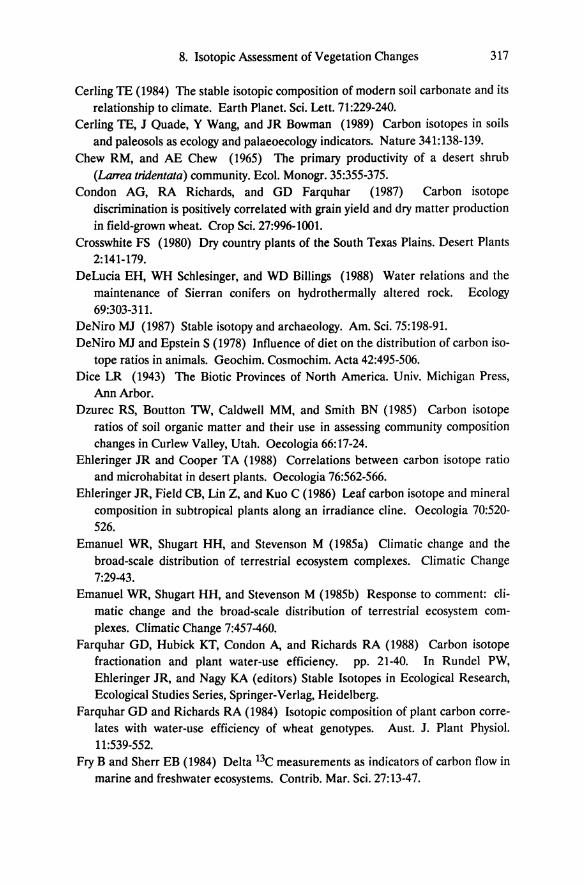
8. Isotopic Assessment of Vegetation Changes 317
Cerling TE (1984) The stable isotopic composition of modern soil carbonate and its relationship to climate. Earth Planet. Sci. Lett. 71:229-240.
Cerling TE, J Quade, Y Wang, and JR Bowman (1989) Carbon isotopes in soils and paleosols as ecology and palaeoecology indicators. Nature 341:138-139.
Chew RM, and AE Chew (1965) The primary productivity of a desert shrub (Lama tridentata) community. Ecol. Monogr.35:355-375.
Condon AG, RA Richards, and GD Farquhar (1987) Carbon isotope discrimination is positively correlated with grain yield and dry matter production in field-grown wheat. Crop Sci. 27:996-1001.
Crosswhite FS (1980) Dry country plants of the South Texas Plains. Desert Plants 2:141-179.
DeLucia EH, WH Schlesinger, and WD Billings (1988) Water relations and the maintenance of Sierran conifers on hydrothermally altered rock. Ecology 69:303-311.
DeNiro MJ (1987) Stable isotopy and archaeology. Am. Sci. 75:198-91. DeNiro MJ and Epstein S (1978) Influence of diet on the distribution of carbon iso
tope ratios in animals. Geochim. Cosmochim. Acta 42:495-506. Dice LR (1943) The Biotic Provinces of North America. Univ. Michigan Press,
Ann Arbor. Dzurec RS, Boutton TW, Caldwell MM, and Smith BN (1985) Carbon isotope
ratios of soil organic matter and their use in assessing community composition changes in Curlew Valley, Utah. Oecologia 66:17-24.
Ehleringer JR and Cooper T A (1988) Correlations between carbon isotope ratio and microhabitat in desert plants. Oecologia 76:562-566.
Ehleringer JR, Field CB, Lin Z. and Kuo C (1986) Leaf carbon isotope and mineral composition in subtropical plants along an irradiance cline. Oecologia 70:520-526.
Emanuel WR, Shugart HH, and Stevenson M (1985a) Climatic change and the broad-scale distribution of terrestrial ecosystem complexes. Climatic Change 7:29-43.
Emanuel WR, Shugart HH, and Stevenson M (1985b) Response to comment: climatic change and the broad-scale distribution of terrestrial ecosystem complexes. Climatic Change 7:457-460.
Farquhar GD, Hubick KT, Condon A, and Richards RA (1988) Carbon isotope fractionation and plant water-use efficiency. pp. 21-40. In Rundel PW, Ehleringer JR, and Nagy KA (editors) Stable Isotopes in Ecological Research, Ecological Studies Series, Springer-Verlag. Heidelberg.
Farquhar GD and Richards RA (1984) Isotopic composition of plant carbon correlates with water-use efficiency of wheat genotypes. Aust. J. Plant Physiol. 11:539-552.
Fry B and Sherr EB (1984) Delta 13C measurements as indicators of carbon flow in marine and freshwater ecosystems. Contrib. Mar. Sci. 27:13-47.
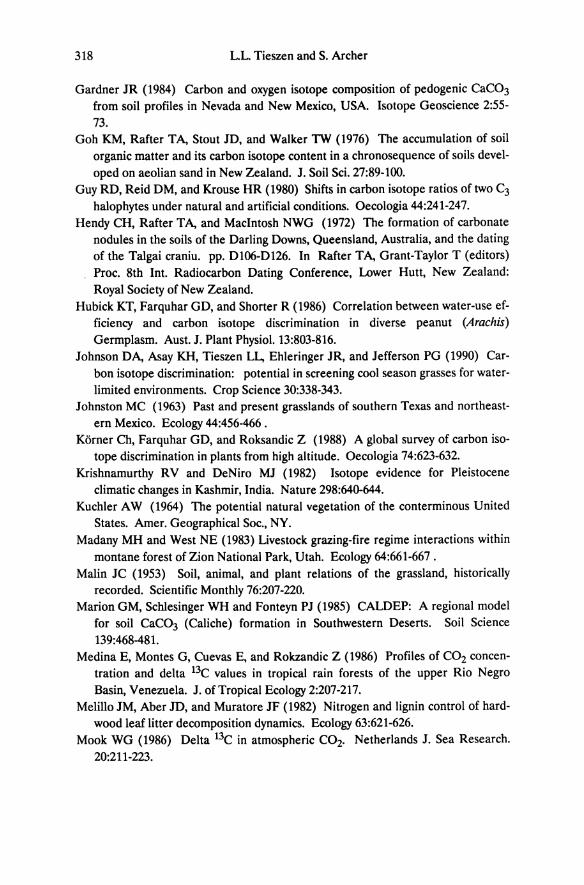
318 L.L. Tieszen and S. Archer
Gardner JR (1984) Carbon and oxygen isotope composition of pedogenic CaC03 from soil profiles in Nevada and New Mexico, USA. Isotope Geoscience 2:55-73.
Goh KM, Rafter TA, Stout JD, and Walker TW (1976) The accumulation of soil organic matter and its carbon isotope content in a chronosequence of soils developed on aeolian sand in New Zealand. J. Soil Sci. 27:89-100.
Guy RD, Reid OM, and Krouse HR (1980) Shifts in carbon isotope ratios of two C3 halophytes under natural and artificial conditions. Oecologia 44:241-247.
Hendy CH, Rafter T A, and MacIntosh NWG (1972) The formation of carbonate nodules in the soils of the Darling Downs, Queensland, Australia, and the dating of the Talgai craniu. pp. 0106-0126. In Rafter TA, Grant-Taylor T (editors) Proc. 8th Int. Radiocarbon Dating Conference, Lower Hutt, New Zealand: Royal Society of New Zealand.
Hubick KT, Farquhar GO, and Shorter R (1986) Correlation between water-use efficiency and carbon isotope discrimination in diverse peanut (Arachis)
Germplasm. Aust. J. Plant Physiol. 13:803-816. Johnson DA, Asay KH, Tieszen LL, Ehleringer JR, and Jefferson PG (1990) Car
bon isotope discrimination: potential in screening cool season grasses for waterlimited environments. Crop Science 30:338-343.
Johnston MC (1963) Past and present grasslands of southern Texas and northeastern Mexico. Ecology 44:456-466 .
Korner Ch, Farquhar GO, and Roksandic Z (1988) A global survey of carbon isotope discrimination in plants from high altitude. Oecologia 74:623-632.
Krishnamurthy RV and DeNiro MJ (1982) Isotope evidence for Pleistocene climatic changes in Kashmir, India. Nature 298:640-644.
Kuchler AW (1964) The potential natural vegetation of the conterminous United States. Amer. Geographical Soc., NY.
Madany MH and West NE (1983) Livestock grazing-fire regime interactions within montane forest of Zion National Park, Utah. Ecology 64:661-667 .
Malin JC (1953) Soil, animal, and plant relations of the grassland, historically recorded. Scientific Monthly 76:207-220.
Marion GM, Schlesinger WH and Fonteyn PJ (1985) CALDEP: A regional model for soil CaC03 (Caliche) formation in Southwestern Deserts. Soil Science 139:468-481.
Medina E, Montes G, Cuevas E, and Rokzandic Z (1986) Profiles of CO2 concentration and delta 13C values in tropical rain forests of the upper Rio Negro Basin, Venezuela. J. of Tropical Ecology 2:207-217.
Melillo JM, Aber JD, and Muratore JF (1982) Nitrogen and lignin control of hardwood leaf litter decomposition dynamics. Ecology 63:621-626.
Mook WG (1986) Delta 13C in atmospheric CO2. Netherlands J. Sea Research. 20:211-223.
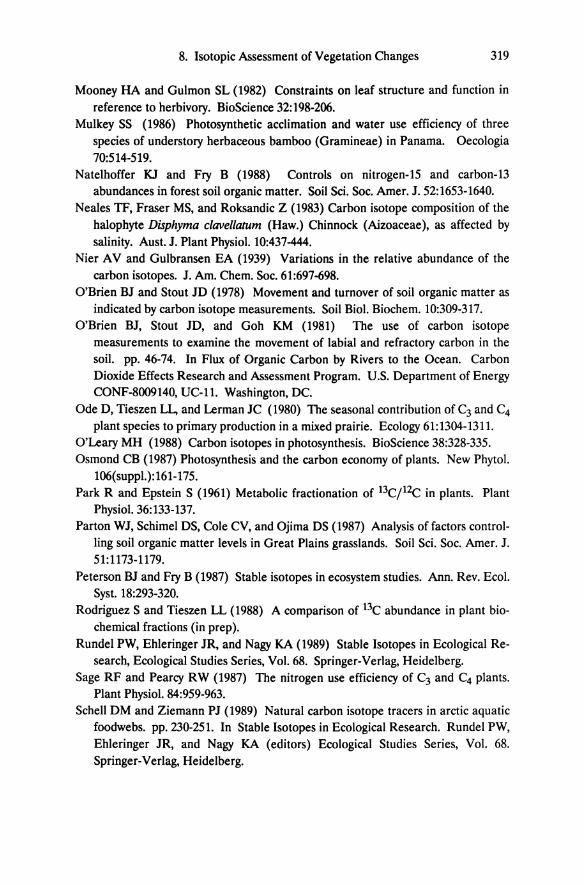
8. Isotopic Assessment of Vegetation Changes 319
Mooney HA and Gulmon SL (1982) Constraints on leaf structure and function in reference to herbivory. BioScience 32:198-206.
Mulkey SS (1986) Photosynthetic acclimation and water use efficiency of three species of understory herbaceous bamboo (Gramineae) in Panama. Oecologia 70:514-519.
Natelhoffer KJ and Fry B (1988) Controls on nitrogen-15 and carbon-13 abundances in forest soil organic matter. Soil Sci. Soc. Amer. J. 52:1653-1640.
Neales TF, Fraser MS, and Roksandic Z (1983) Carbon isotope composition of the halophyte Disphyma clavellatum (Haw.) Chinnock (Aizoaceae), as affected by salinity. Aust. J. Plant Physiol. 10:437-444.
Nier AV and Gulbransen EA (1939) Variations in the relative abundance of the carbon isotopes. J. Am. Chern. Soc. 61:697-698.
O'Brien BJ and Stout JD (1978) Movement and turnover of soil organic matter as indicated by carbon isotope measurements. Soil BioI. Biochem. 10:309-317.
O'Brien BJ, Stout JD, and Goh KM (1981) The use of carbon isotope measurements to examine the movement of labial and refractory carbon in the soil. pp. 46-74. In Flux of Organic Carbon by Rivers to the Ocean. Carbon Dioxide Effects Research and Assessment Program. U.S. Department of Energy CONF-8009140, UC-11. Washington, DC.
Ode D, Tieszen LL, and Lerman JC (1980) The seasonal contribution of C3 and C4
plant species to primary production in a mixed prairie. Ecology 61:1304-1311. O'Leary MH (1988) Carbon isotopes in photosynthesis. BioScience 38:328-335. Osmond CB (1987) Photosynthesis and the carbon economy of plants. New Phytol.
106(suppl.):161-175. Park R and Epstein S (1961) Metabolic fractionation of 13Cjl 2c in plants. Plant
Physiol. 36:133-137. Parton WJ, Schimel DS, Cole CV, and Ojima DS (1987) Analysis offactors control
ling soil organic matter levels in Great Plains grasslands. Soil Sci. Soc. Amer. J. 51:1173-1179.
Peterson BJ and Fry B (1987) Stable isotopes in ecosystem studies. Ann. Rev. Ecol. Syst. 18:293-320.
Rodriguez S and Tieszen LL (1988) A comparison of 13C abundance in plant biochemical fractions (in prep).
Rundel PW, Ehleringer JR, and Nagy KA (1989) Stable Isotopes in Ecological Research, Ecological Studies Series, Vol. 68. Springer-Verlag, Heidelberg.
Sage RF and Pearcy RW (1987) The nitrogen use efficiency of y and C4 plants. Plant Physiol. 84:959-963.
Schell DM and Ziemann PJ (1989) Natural carbon isotope tracers in arctic aquatic foodwebs. pp. 230-251. In Stable Isotopes in Ecological Research. Rundel PW, Ehleringer JR, and Nagy KA (editors) Ecological Studies Series, Vol. 68. Springer-Verlag, Heidelberg.
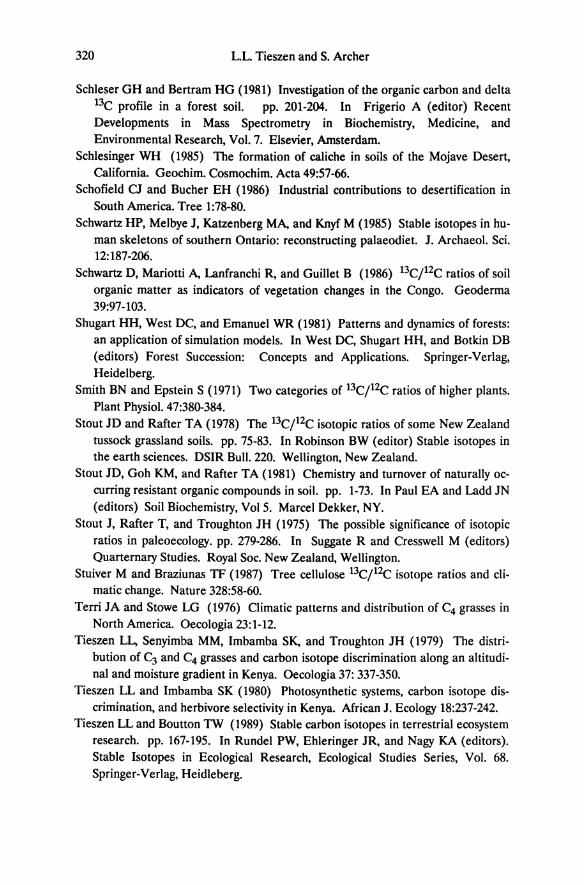
320 L.L Tieszen and S. Archer
Schleser GH and Bertram HG (1981) Investigation of the organic carbon and delta 13C profile in a forest soil. pp. 201-204. In Frigerio A (editor) Recent Developments in Mass Spectrometry in Biochemistry, Medicine, and Environmental Research, Vol. 7. Elsevier, Amsterdam.
Schlesinger WH (1985) The formation of caliche in soils of the Mojave Desert, California. Geochim. Cosmochim. Acta 49:57-66.
Schofield CJ and Bucher EH (1986) Industrial contributions to desertification in South America. Tree 1:78-80.
Schwartz HP, Melbye J, Katzenberg MA, and Knyf M (1985) Stable isotopes in human skeletons of southern Ontario: reconstructing palaeodiet. J. Archaeol. Sci. 12:187-206.
Schwartz D, Mariotti A, Lanfranchi R, and Guillet B (1986) 13C/12C ratios of soil organic matter as indicators of vegetation changes in the Congo. Geoderma 39:97-103.
Shugart HH, West DC, and Emanuel WR (1981) Patterns and dynamics of forests: an application of simulation models. In West DC, Shugart HH, and Botkin DB (editors) Forest Succession: Concepts and Applications. Springer-Verlag, Heidelberg.
Smith BN and Epstein S (1971) Two categories of 13C/I2C ratios of higher plants. Plant Physiol. 47:380-384.
Stout JD and Rafter TA (1978) The BC/I2C isotopic ratios of some New Zealand tussock grassland soils. pp. 75-83. In Robinson BW (editor) Stable isotopes in the earth sciences. DSIR Bull. 220. Wellington, New Zealand.
Stout JD, Goh KM, and Rafter TA (1981) Chemistry and turnover of naturally occurring resistant organic compounds in soil. pp. 1-73. In Paul EA and Ladd IN (editors) Soil Biochemistry, Vol 5. Marcel Dekker, NY.
Stout J, Rafter T, and Troughton JH (1975) The possible significance of isotopic ratios in paleoecology. pp. 279-286. In Suggate R and Cresswell M (editors) Quarternary Studies. Royal Soc. New Zealand, Wellington.
Stuiver M and Braziunas TF (1987) Tree cellulose BC/12C isotope ratios and climatic change. Nature 328:58-60.
Terri JA and Stowe LG (1976) Climatic patterns and distribution of C4 grasses in North America. Oecologia 23:1-12.
Tieszen LL, Senyimba MM, Imbamba SK, and Troughton JH (1979) The distribution of C3 and C4 grasses and carbon isotope discrimination along an altitudinal and moisture gradient in Kenya. Oecologia 37: 337-350.
Tieszen LL and Imbamba SK (1980) Photosynthetic systems, carbon isotope discrimination, and herbivore selectivity in Kenya. African J. Ecology 18:237-242.
Tieszen LL and Boutton TW (1989) Stable carbon isotopes in terrestrial ecosystem research. pp. 167-195. In Rundel PW, Ehleringer JR, and Nagy KA (editors). Stable Isotopes in Ecological Research, Ecological Studies Series, Vol. 68. Springer-Verlag, Heidleberg.
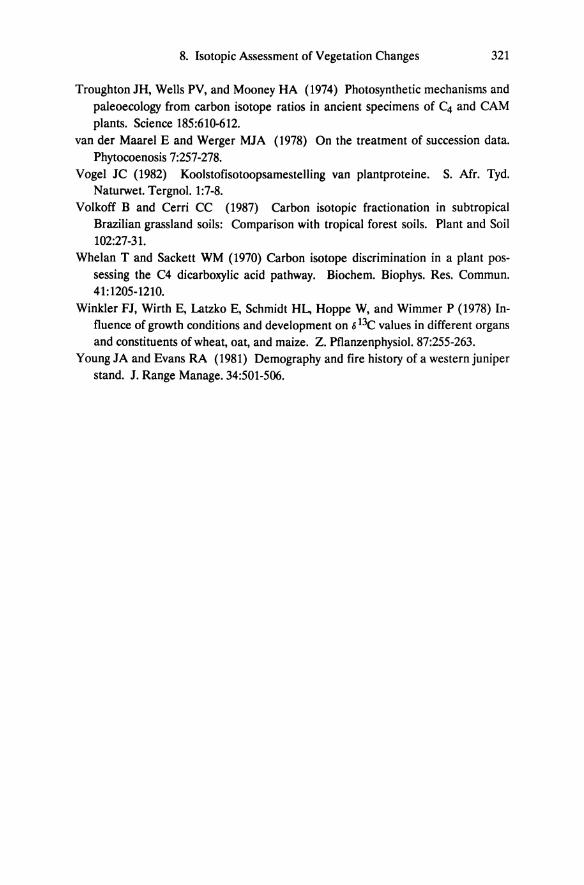
8. Isotopic Assessment of Vegetation Changes 321
TroughtonJH, Wells PV, and Mooney HA (1974) Photosynthetic mechanisms and paleoecology from carbon isotope ratios in ancient specimens of C4 and CAM plants. Science 185:610-612.
van der Maarel E and Werger MJA (1978) On the treatment of succession data. Phytocoenosis 7:257-278.
Vogel JC (1982) Koolstofisotoopsamestelling van plantproteine. S. Afr. Tyd. Naturwet. Tergnol. 1:7-8.
Volkoff B and Cerri CC (1987) Carbon isotopic fractionation in subtropical Brazilian grassland soils: Comparison with tropical forest soils. Plant and Soil 102:27-31.
Whelan T and Sackett WM (1970) Carbon isotope discrimination in a plant possessing the C4 dicarboxylic acid pathway. Biochem. Biophys. Res. Commun. 41:1205-1210.
Winkler FJ, Wirth E, Latzko E, Schmidt HL, Hoppe W, and Wimmer P (1978) Influence of growth conditions and development on 613c values in different organs and constituents of wheat, oat, and maize. Z. Pflanzenphysiol. 87:255-263.
Young JA and Evans RA (1981) Demography and fire history of a western juniper stand. J. Range Manage. 34:501-506.
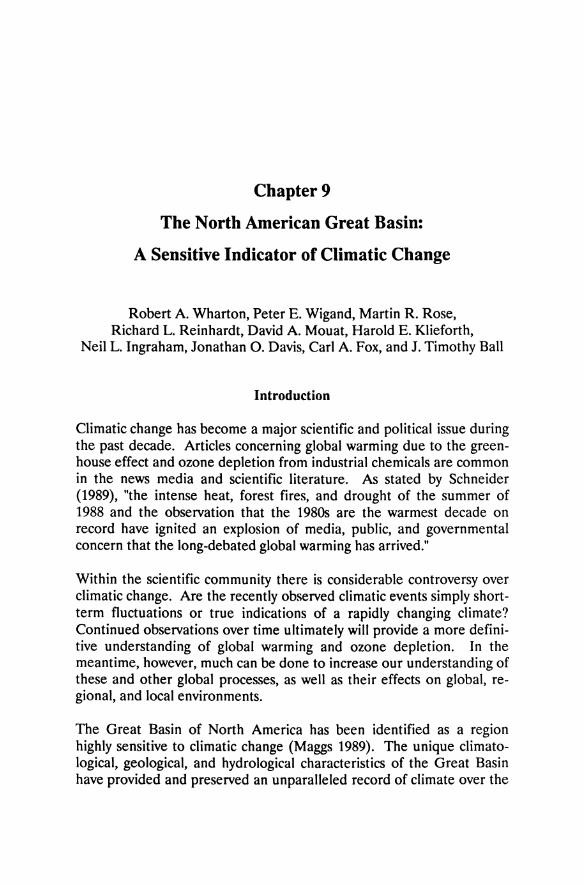
Chapter 9
The North American Great Basin:
A Sensitive Indicator of Climatic Change
Robert A. Wharton, Peter E. Wigand, Martin R. Rose, Richard L. Reinhardt, David A. Mouat, Harold E. Klieforth,
Neil L. Ingraham, Jonathan O. Davis, Carl A. Fox, and J. Timothy Ball
Introduction
Climatic change has become a major scientific and political issue during the past decade. Articles concerning global warming due to the greenhouse effect and ozone depletion from industrial chemicals are common in the news media and scientific literature. As stated by Schneider (1989), "the intense heat, forest fires, and drought of the summer of 1988 and the observation that the 1980s are the warmest decade on record have ignited an explosion of media, public, and governmental concern that the long-debated global warming has arrived."
Within the scientific community there is considerable controversy over climatic change. Are the recently observed climatic events simply shortterm fluctuations or true indications of a rapidly changing climate? Continued observations over time ultimately will provide a more definitive understanding of global warming and ozone depletion. In the meantime, however, much can be done to increase our understanding of these and other global processes, as well as their effects on global, regional, and local environments.
The Great Basin of North America has been identified as a region highly sensitive to climatic change (Maggs 1989). The unique climatological, geological, and hydrological characteristics of the Great Basin have provided and preserved an unparalleled record of climate over the
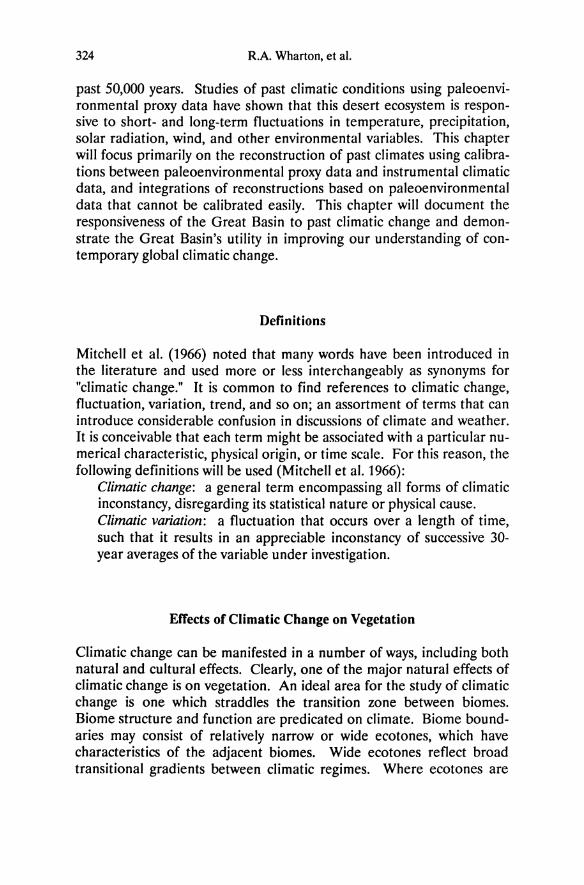
324 R.A. Wharton, et al.
past 50,000 years. Studies of past climatic conditions using paleoenvironmental proxy data have shown that this desert ecosystem is responsive to short- and long-term fluctuations in temperature, precipitation, solar radiation, wind, and other environmental variables. This chapter will focus primarily on the reconstruction of past climates using calibrations between paleoenvironmental proxy data and instrumental climatic data, and integrations of reconstructions based on paleoenvironmental data that cannot be calibrated easily. This chapter will document the responsiveness of the Great Basin to past climatic change and demonstrate the Great Basin's utility in improving our understanding of contemporary global climatic change.
Definitions
Mitchell et al. (1966) noted that many words have been introduced in the literature and used more or less interchangeably as synonyms for "climatic change." It is common to find references to climatic change, fluctuation, variation, trend, and so on; an assortment of terms that can introduce considerable confusion in discussions of climate and weather. It is conceivable that each term might be associated with a particular numerical characteristic, physical origin, or time scale. For this reason, the following definitions will be used (Mitchell et al. 1966):
Climatic change: a general term encompassing all forms of climatic inconstancy, disregarding its statistical nature or physical cause. Climatic variation: a fluctuation that occurs over a length of time, such that it results in an appreciable inconstancy of successive 30-year averages of the variable under investigation.
EtTects of Climatic Change on Vegetation
Climatic change can be manifested in a number of ways, including both natural and cultural effects. Clearly, one of the major natural effects of climatic change is on vegetation. An ideal area for the study of climatic change is one which straddles the transition zone between biomes. Biome structure and function are predicated on climate. Biome boundaries may consist of relatively narrow or wide ecotones, which have characteristics of the adjacent biomes. Wide ecotones reflect broad transitional gradients between climatic regimes. Where ecotones are
Climatic Change in the Great Basin 325
narrow the transition between climatic regimes is typically more abrupt. Areas especially sensitive to climatic change typically have narrow ecotones accompanied by sharp climatic zone boundaries. (Climatic zones are areas with similar temperature, precipitation, wind regimes, etc., that have a zonal arrangement, that is not strictly latitudinal.) Conceptually, those areas which straddle major biomes and are influenced by highly divergent climatic zones are ideal for the study of climatic change, because when the movement of these boundaries occurs the vegetational response usually will be noticeable.
Although examples of the above can be found on most continents, the resulting ecotones usually tend to be too broad for effective study. Occasionally, terrain factors exist which serve to narrow ecotones. For example, changes in elevation with minimal changes in slope angle and aspect often result in relatively narrow ecotones. In the Great Basin of western North America, elevational changes associated with the "island" mountains are accompanied by extremely sharp changes in vegetation (Billings 1951; Chapter 3). Some of these changes could be attributed to slope, exposure, and rock (soil) type, but they primarily result from the climatic effect associated with elevation. An example of a recent change in Great Basin biomes is the boundary between shrubland (dominated by Artemisia tridentata) and woodland (Pinus spp. and Juniperus spp.). Varying vegetation boundaries between these two basic biomes reflect climatic change during the past few hundred years (Hastings and Turner 1965; Turner and Karpiscak 1980; Rogers 1982; Mehringer and Wigand 1987; Wigand 1987).
The North American Great Basin
Environmental Factors
The boundaries of the Great Basin are the crests of the Sierra Nevada and Cascade Mountains on the west, the Snake River Plain on the north, the Wasatch Range on the east, and the Colorado River drainage basin on the south. Within the Great Basin are numerous mountain ranges, trending north-south and separated by basins or valleys. The Great Basin is characterized by an interior drainage resulting in hydrologically closed systems (Houghton 1969). At present, the characteristic climate of the Great Basin is semiarid to arid (Houghton 1969;
326 R.A Wharton, et al.
Houghton et al. 1975; Chapter 2}. Except on a few mountain summits, precipitation averages <50 cm yr -1, and in about three quarters of the province,25 cm yr -1. In a transect from west to east across the central Great Basin, average precipitation ranges from less than 13 cm yr -1 in the rainshadow of the Sierra Nevada to about 25 cm yr -1 near the Wasatch Front. In the northern Great Basin, winters are cold (-12 to 4° C) and summers are warm (10 to 27° C). The southern Great Basin has milder winters (4 to 100 C) and hotter summers (27 to 32° C).
The Great Basin lies at the convergence of Pacific, Continental and Gulf atmospheric circulation systems (Houghton et al. 1975; Chapter 2). Movement of these systems and their impact on local and regional climate is reflected in changes in hydrology, erosional and depositional processes, and vegetation. Displacement of winter and summer stormtracks and penetration of the summer monsoon all are affected by the positions of these pressure systems. Decreased monsoonal penetration in the Great Basin caused by southeastward movement of the Gulf of Mexico-dominated Bermuda High often results in decreased summer precipitation. However, this effect is sometimes offset by a southward displacement of summertime storms originating in the Pacific. Expansion of the Continental pressure systems during the winter often results in increased winter precipitation in the Great Basin by southward displacement of the Pacific storm-track (Houghton et al. 1975).
Topographic diversity in the Great Basin serves as a trigger for orographic rainfall (Houghton 1969). The resulting disparity in the distribution of precipitation between mountaintops and valley floors has resulted in the distribution of a multiplicity of vegetation types within close proximity to each other. Elevational changes in plant distributions through time can be dramatic as storm-track shifts combine with the orographic effect of the north-south trending mountain ranges to radically change the distribution of precipitation on the landscape (Houghton 1969; Wigand 1987).
The arid nature of the Great Basin enhances its usefulness as an indicator of climatic change through the relatively immediate and direct effect of climate on landscape and vegetation, as well as by the preservation of paleoenvironmental indicators. Despite sparse vegetation cover, relatively low rainfall and high evaporation rates with resulting low "effective" precipitation generally lead to lower slope erosion and slower basin bottom deposition rates (Wigand 1987). Large increases in effective precipitation, because of sparse vegetation cover, will be marked in
Climatic Change in the Great Basin 327
the sedimentological record by increases in slope erosion rates and basin bottom deposition rates. With continued higher effective precipitation rates, vegetation density will increase and stabilizing soils will form, thereby reducing the rate of sediment movement (Mehringer and Wigand 1987). A return to lower effective precipitation for a time will sustain low slope-erosion rates. However, in the basin bottoms, aeolian erosion and deposition will be initiated as lakes dry, exposing playa bottoms to wind action (Currey and James 1982; Davis 1982; Mehringer 1986).
Low effective precipitation favors the preservation of certain kinds of paleoenvironmental indicators. Plant microfossils preserved in dry cave deposits and woodrat middens can provide intermittent records of local vegetation spanning tens of thousands of years (Spaulding et al. 1983). Wood from long-dead trees, preserved by the relatively dry conditions that characterize upper and lower tree-lines in the Great Basin, provides continuous long-term evidence of climatic change that may extend the record already obtained from living trees perhaps to 10,000 years B.P. (Fritts 1976; Hughes et al. 1982; Graybill 1985, 1987). Although lakes with lifetimes spanning the Holocene are rare in the Great Basin, especially in the southern portion, desert springs such as those found in Ash Meadows (Mehringer and Warren 1976) and at Tule Springs (Mehringer 1967) often provide a record of past vegetational change. These springs typically have relatively high deposition rates, which hold the potential for the generation of high frequency regional pollen and local aquatic plant microfossil records. These records can allow for comparisons with tree-ring data resulting in the generation of long, detailed and mutually corroborative records of regional climate.
Annual production of plant biomass is extremely sensitive to effective precipitation (Walter 1954; Whittaker 1970; Chapters 5-7). Therefore, the arid climate of the Great Basin results in a vegetation highly responsive to even minor changes in precipitation. Such changes in vegetation can be measured directly today through satellite imagery, historically through repeat photography, and prehistorically through tree-ring analysis and fluctuating pollen production reflected in pollen influx.
The rapid response of Great Basin vegetation to changes in climate is primarily the result of both the physiological and morphological characteristics of the individual plant species that have evolved as a result of millions of years of adaptation to arid and semiarid conditions (Brown 1987). Many of the plants growing in the Great Basin are opportunistic
328 R.A Wharton, et al.
(Odum 1971), and they can take advantage of increased precipitation rather quickly. Yearly fluctuations of precipitation can be reflected in increased pollen production (Mehringer and Wigand 1990) and even single rainfalls can initiate new foliage production. Also, many of these species have wind-dispersed pollen and seeds, which enhances rapid dispersal of propagules when conditions are favorable. The seeds of other plants such as juniper and pinyon are ingested by animals which may carry the seeds great distances (Wells 1983). Long-term seed and plant dormancy until adequate precipitation has occurred is also characteristic of many of the plants found in the Great Basin (Went 1957). The year-to-year vegetative response of individual plants is also dramatic. As a result, subtle changes in the patterns of plant distribution can occur within one to two years. Thus, the Great Basin is responsive to the full spectrum of climatic change, not only to long-term trends and rather abrupt discontinuities, but also to higher frequency fluctuations and variabili ty.
Paleoclimatic and Modern Climatic Data Sources
Many locations worldwide have paleoenvironmental proxy data of one form or another that yield information on long-term climatic change. However, few have as many different types of paleoenvironmental proxies as the Great Basin, especially with the length of available records and spatial coverage. The uniqueness of the Great Basin results in part from the arid conditions that allow for outstanding preservation of paleoenvironmental information. The paleoenvironmental reconstructions possible with such a constellation of data sets resolve changes occurring from seasons and years to decades, hundreds, and thousands of years. Furthermore, the different data sets frequently cover the same points in time and space and allow for mutual corroboration, or they complement one another in the sense that each can be used to reconstruct a different aspect of climatic change.
There are many data sets pertinent to the analysis of climatic variations in the Great Basin over the last 50,000 years. These sets are comprised of pollen data, woodrat midden data, tree-ring data, and lake level. Modern observations including stream flow, isotopic data, aircraft and satellite imagery, and meteorological data obtained from the National Cooperative Observers Network, Soil Conservation Service (SNOTEL), Bureau of Land Management and Forest Service (Remote Automatic Weather Stations - RAWS), are discussed below.
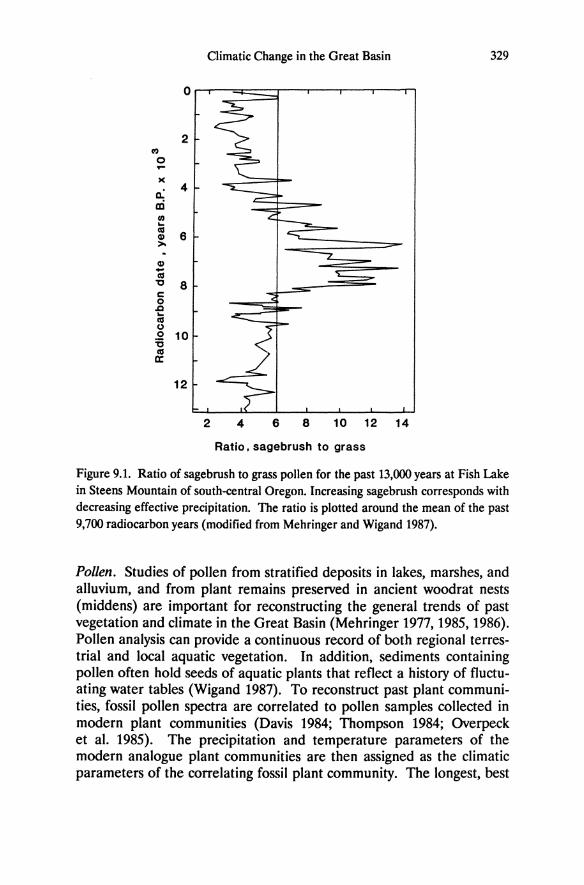
to)
o ... )(
Q) -as
2
" 8 c o .Q ... as ()
o 10 =s as a:
12
Climatic Change in the Great Basin 329
2 4 6 8 10 12 14
Ratio. sagebrush to grass
Figure 9.1. Ratio of sagebrush to grass pollen for the past 13,000 years at Fish Lake in Steens Mountain of south-central Oregon. Increasing sagebrush corresponds with decreasing effective precipitation. The ratio is plotted around the mean of the past 9,700 radiocarbon years (modified from Mehringer and Wigand 1987).
Pollen. Studies of pollen from stratified deposits in lakes, marshes, and alluvium, and from plant remains preserved in ancient woodrat nests (middens) are important for reconstructing the general trends of past vegetation and climate in the Great Basin (Mehringer 1977, 1985, 1986). Pollen analysis can provide a continuous record of both regional terrestrial and local aquatic vegetation. In addition, sediments containing pollen often hold seeds of aquatic plants that reflect a history of fluctuating water tables (Wigand 1987). To reconstruct past plant communities, fossil pollen spectra are correlated to pollen samples collected in modern plant communities (Davis 1984; Thompson 1984; Overpeck et al. 1985). The precipitation and temperature parameters of the modern analogue plant communities are then assigned as the climatic parameters of the correlating fossil plant community. The longest, best
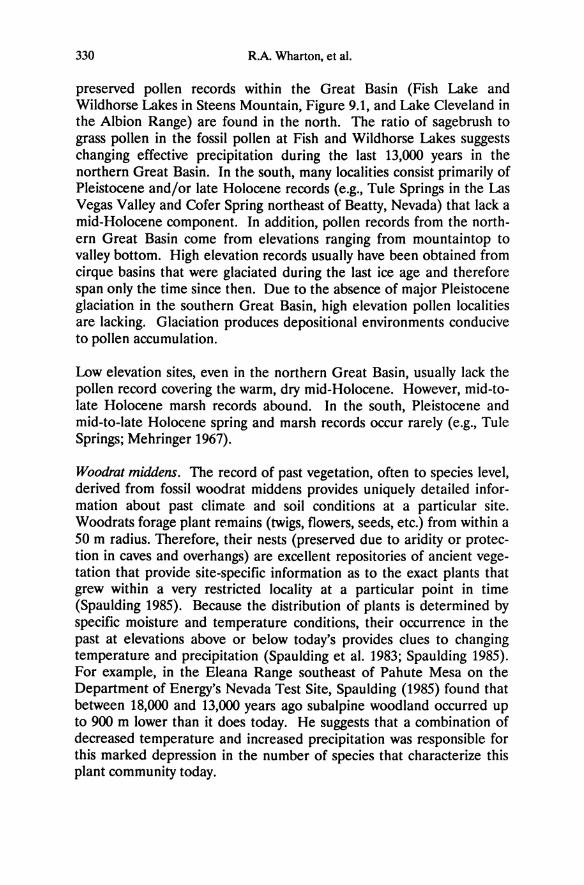
330 R.A Wharton, et al.
preserved pollen records within the Great Basin (Fish Lake and Wildhorse Lakes in Steens Mountain, Figure 9.1, and Lake Cleveland in the Albion Range) are found in the north. The ratio of sagebrush to grass pollen in the fossil pollen at Fish and Wildhorse Lakes suggests changing effective precipitation during the last 13,000 years in the northern Great Basin. In the south, many localities consist primarily of Pleistocene and/or late Holocene records (e.g., Tule Springs in the Las Vegas Valley and Cofer Spring northeast of Beatty, Nevada) that lack a mid-Holocene component. In addition, pollen records from the northern Great Basin come from elevations ranging from mountaintop to valley bottom. High elevation records usually have been obtained from cirque basins that were glaciated during the last ice age and therefore span only the time since then. Due to the absence of major Pleistocene glaciation in the southern Great Basin, high elevation pollen localities are lacking. Glaciation produces depositional environments conducive to pollen accumulation.
Low elevation sites, even in the northern Great Basin, usually lack the pollen record covering the warm, dry mid-Holocene. However, mid-tolate Holocene marsh records abound. In the south, Pleistocene and mid-to-Iate Holocene spring and marsh records occur rarely (e.g., Tule Springs; Mehringer 1967).
Woodrat middens. The record of past vegetation, often to species level, derived from fossil wood rat middens provides uniquely detailed information about past climate and soil conditions at a particular site. Woodrats forage plant remains (twigs, flowers, seeds, etc.) from within a 50 m radius. Therefore, their nests (preserved due to aridity or protection in caves and overhangs) are excellent repositories of ancient vegetation that provide site-specific information as to the exact plants that grew within a very restricted locality at a particular point in time (Spaulding 1985). Because the distribution of plants is determined by specific moisture and temperature conditions, their occurrence in the past at elevations above or below today's provides clues to changing temperature and precipitation (Spaulding et al. 1983; Spaulding 1985). For example, in the Eleana Range southeast of Pahute Mesa on the Department of Energy's Nevada Test Site, Spaulding (1985) found that between 18,000 and 13,000 years ago subalpine woodland occurred up to 900 m lower than it does today. He suggests that a combination of decreased temperature and increased precipitation was responsible for this marked depression in the number of species that characterize this plant community today.
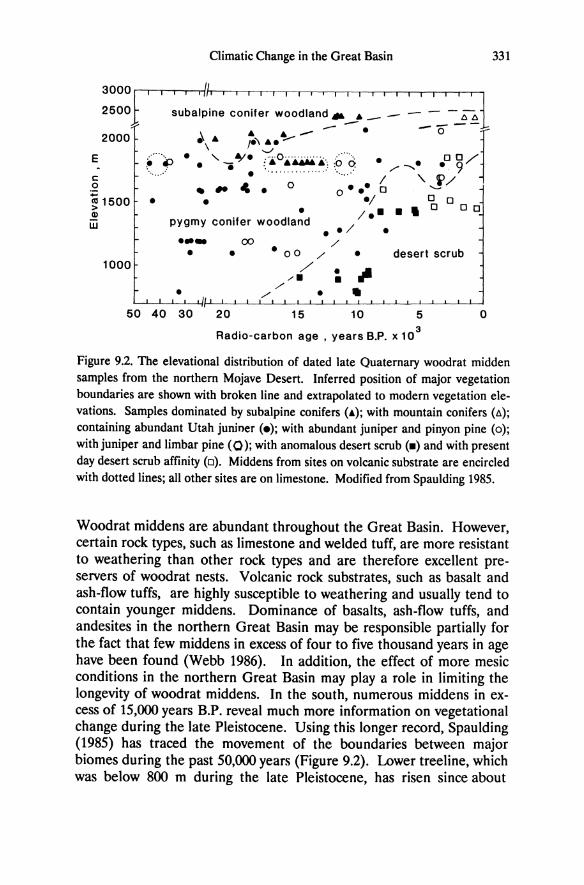
Climatic Change in the Great Basin
3000~ 25001 subalpine conifer woodland /1& .-!' _ - - - - ~
E 2000 ....... • ~\: _.~:':.~:O~.:·:O······O··. .. _: 00 ~~r ~ lip. .......... ....... /', • 9
§ • 0 ......• / ,,~/ ... ~ • 0 •• 0 ~
~ 1500 Q)
w
1000
• • ~ 0 0 • I. _ _ • 0 00
pygmy conifer woodland •• I .... 00
• •
•
/ • 00 / • /i ~ Ii
/' /' •
• desert scrub
50 40 30 20 15 10 5
Radio-carbon age. years B.P. x 103
o
331
Figure 9.2. The elevational distribution of dated late Quaternary woodrat midden samples from the northern Mojave Desert. Inferred position of major vegetation boundaries are shown with broken line and extrapolated to modern vegetation elevations. Samples dominated by subalpine conifers (.); with mountain conifers (A); containing abundant Utah junioer (_); with abundant juniper and pinyon pine (0); with juniper and limbar pine (0 ); with anomalous desert scrub (_) and with present day desert scrub affinity (0). Middens from sites on volcanic substrate are encircled with dotted lines; alI other sites are on limestone. Modified from Spaulding 1985.
Woodrat middens are abundant throughout the Great Basin. However, certain rock types, such as limestone and welded tuff, are more resistant to weathering than other rock types and are therefore excellent preservers of wood rat nests. Volcanic rock substrates, such as basalt and ash-flow tuffs, are highly susceptible to weathering and usually tend to contain younger middens. Dominance of basalts, ash-flow tuffs, and andesites in the northern Great Basin may be responsible partially for the fact that few middens in excess of four to five thousand years in age have been found (Webb 1986). In addition, the effect of more mesic conditions in the northern Great Basin may playa role in limiting the longevity of woodrat middens. In the south, numerous middens in excess of 15,000 years B.P. reveal much more information on vegetational change during the late Pleistocene. Using this longer record, Spaulding (1985) has traced the movement of the boundaries between major biomes during the past 50,000 years (Figure 9.2). Lower treeline, which was below 800 m during the late Pleistocene, has risen since about
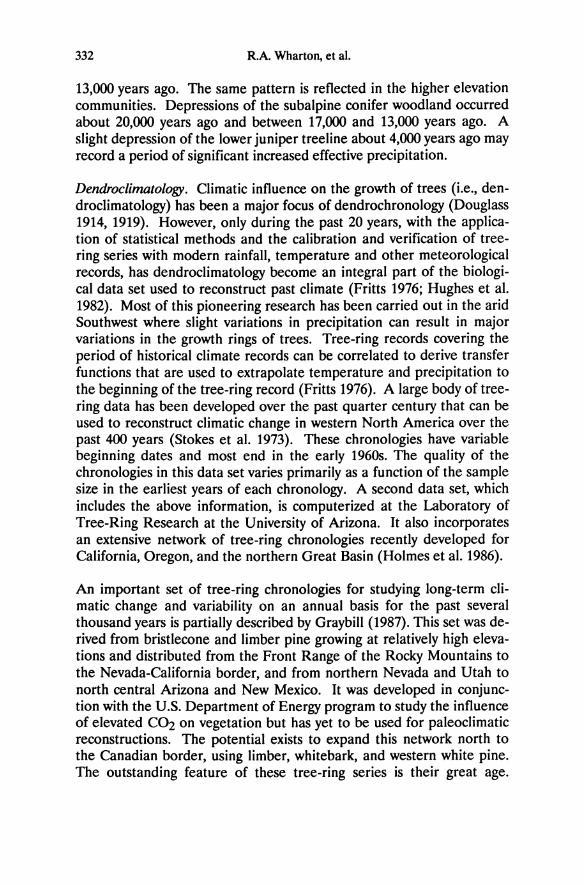
332 R.A. Wharton, et al.
13,000 years ago. The same pattern is reflected in the higher elevation communities. Depressions of the subalpine conifer woodland occurred about 20,000 years ago and between 17,000 and 13,000 years ago. A slight depression of the lower juniper treeline about 4,000 years ago may record a period of significant increased effective precipitation.
Dendroclimatology. Climatic influence on the growth of trees (Le., dendroclimatology) has been a major focus of dendrochronology (Douglass 1914, 1919). However, only during the past 20 years, with the application of statistical methods and the calibration and verification of treering series with modern rainfall, temperature and other meteorological records, has dendroclimatology become an integral part of the biological data set used to reconstruct past climate (Fritts 1976; Hughes et al. 1982). Most of this pioneering research has been carried out in the arid Southwest where slight variations in precipitation can result in major variations in the growth rings of trees. Tree-ring records covering the period of historical climate records can be correlated to derive transfer functions that are used to extrapolate temperature and precipitation to the beginning of the tree-ring record (Fritts 1976). A large body of treering data has been developed over the past quarter century that can be used to reconstruct climatic change in western North America over the past 400 years (Stokes et al. 1973). These chronologies have variable beginning dates and most end in the early 1960s. The quality of the chronologies in this data set varies primarily as a function of the sample size in the earliest years of each chronology. A second data set, which includes the above information, is computerized at the Laboratory of Tree-Ring Research at the University of Arizona. It also incorporates an extensive network of tree-ring chronologies recently developed for California, Oregon, and the northern Great Basin (Holmes et al. 1986).
An important set of tree-ring chronologies for studying long-term climatic change and variability on an annual basis for the past several thousand years is partially described by Graybill (1987). This set was derived from bristlecone and limber pine growing at relatively high elevations and distributed from the Front Range of the Rocky Mountains to the Nevada-California border, and from northern Nevada and Utah to north central Arizona and New Mexico. It was developed in conjunction with the U.S. Department of Energy program to study the influence of elevated C02 on vegetation but has yet to be used for paleoclimatic reconstructions. The potential exists to expand this network north to the Canadian border, using limber, whitebark, and western white pine. The outstanding feature of these tree-ring series is their great age.
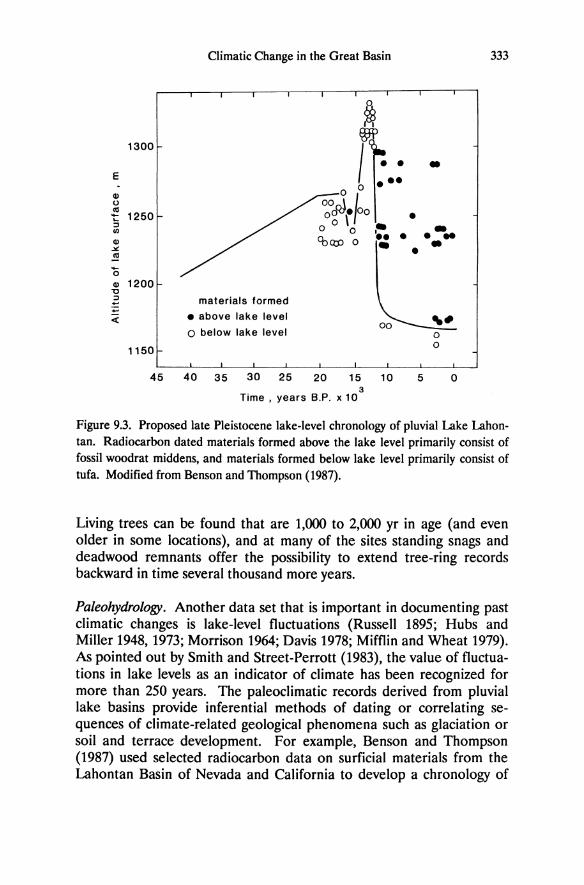
E
Q)
u
1300
~ 1250 ::l III
Q)
~
~
'0 Q) 1200
"tJ ::l .... ....
c:(
1150
Climatic Change in the Great Basin
materials formed
• above lake level
o below lake level
o
~ Wi
I :.: o 0
~OOcJ·/OO o \ • o 0 ,.
'tlQ:O 0 ~. •
00
45 40 35 30 25 20 15 10 5 3
Time. years B.P. x 10
•
-. .. •
... o o
o
333
Figure 9.3. Proposed late Pleistocene lake-level chronology of pluvial Lake Lahontan. Radiocarbon dated materials formed above the lake level primarily consist of fossil wood rat middens, and materials formed below lake level primarily consist of tufa. Modified from Benson and Thompson (1987).
Living trees can be found that are 1,000 to 2,000 yr in age (and even older in some locations), and at many of the sites standing snags and deadwood remnants offer the possibility to extend tree-ring records backward in time several thousand more years.
Paleohydrology. Another data set that is important in documenting past climatic changes is lake-level fluctuations (Russell 1895; Hubs and Miller 1948, 1973; Morrison 1964; Davis 1978; Mifflin and Wheat 1979). As pointed out by Smith and Street-Perrott (1983), the value of fluctuations in lake levels as an indicator of climate has been recognized for more than 250 years. The paleoclimatic records derived from pluvial lake basins provide inferential methods of dating or correlating sequences of climate-related geological phenomena such as glaciation or soil and terrace development. For example, Benson and Thompson (1987) used selected radiocarbon data on surficial materials from the Lahontan Basin of Nevada and California to develop a chronology of
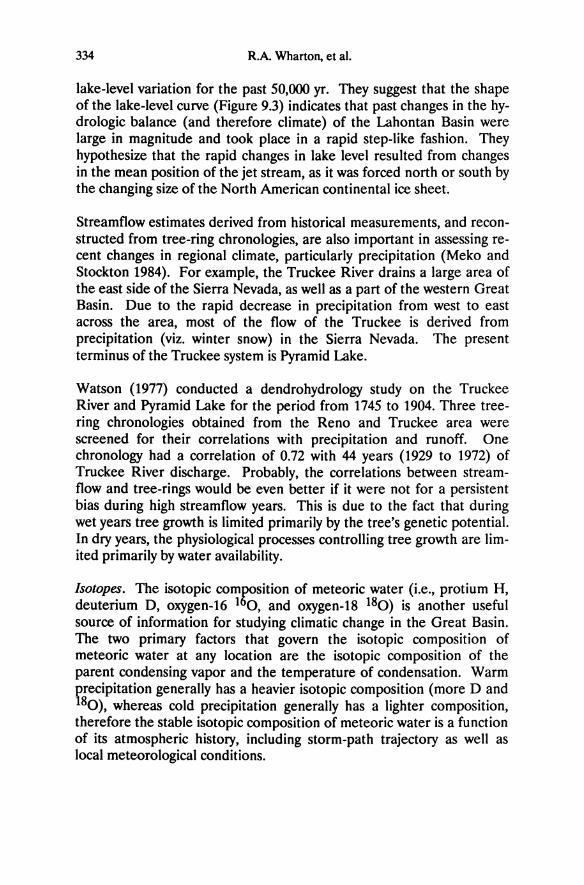
334 R.A Wharton, et al.
lake-level variation for the past 50,000 yr. They suggest that the shape of the lake-level curve (Figure 9.3) indicates that past changes in the hydrologic balance (and therefore climate) of the Lahontan Basin were large in magnitude and took place in a rapid step-like fashion. They hypothesize that the rapid changes in lake level resulted from changes in the mean position of the jet stream, as it was forced north or south by the changing size of the North American continental ice sheet.
Streamflow estimates derived from historical measurements, and reconstructed from tree-ring chronologies, are also important in assessing recent changes in regional climate, particularly precipitation (Meko and Stockton 1984). For example, the Truckee River drains a large area of the east side of the Sierra Nevada, as well as a part of the western Great Basin. Due to the rapid decrease in precipitation from west to east across the area, most of the flow of the Truckee is derived from precipitation (viz. winter snow) in the Sierra Nevada. The present terminus of the Truckee system is Pyramid Lake.
Watson (1977) conducted a dendrohydrology study on the Truckee River and Pyramid Lake for the period from 1745 to 1904. Three treering chronologies obtained from the Reno and Truckee area were screened for their correlations with precipitation and runoff. One chronology had a correlation of 0.72 with 44 years (1929 to 1972) of Truckee River discharge. Probably, the correlations between streamflow and tree-rings would be even better if it were not for a persistent bias during high streamflow years. This is due to the fact that during wet years tree growth is limited primarily by the tree's genetic potential. In dry years, the physiological processes controlling tree growth are limited primarily by water availability.
Isotopes. The isotopic composition of meteoric water (i.e., protium H, deuterium D, oxygen-16 160, and oxygen-18 180) is another useful source of information for studying climatic change in the Great Basin. The two primary factors that govern the isotopic composition of meteoric water at any location are the isotopic composition of the parent condensing vapor and the temperature of condensation. Warm precipitation generally has a heavier isotopic composition (more D and 180), whereas cold precipitation generally has a lighter composition, therefore the stable isotopic composition of meteoric water is a function of its atmospheric history, including storm-path trajectory as well as local meteorological conditions.
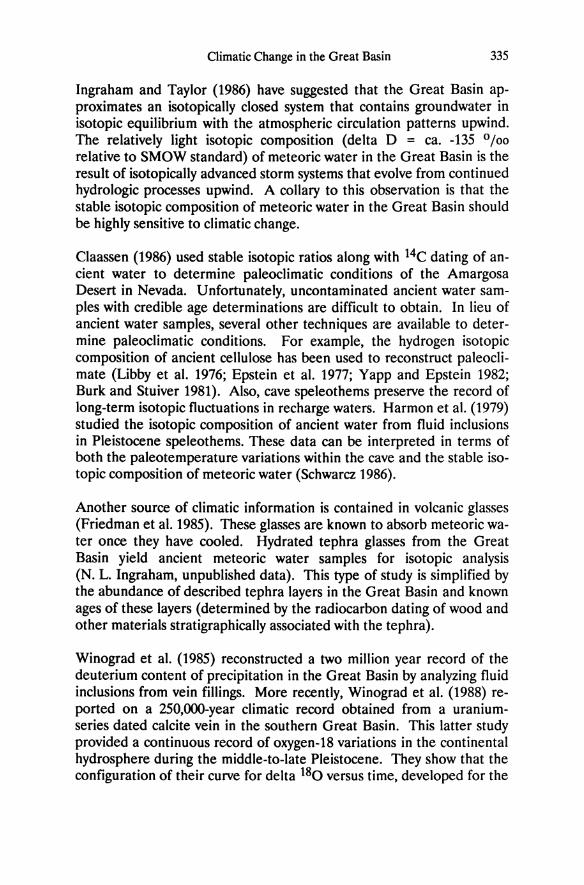
Climatic Change in the Great Basin 335
Ingraham and Taylor (1986) have suggested that the Great Basin approximates an isotopically closed system that contains groundwater in isotopic equilibrium with the atmospheric circulation patterns upwind. The relatively light isotopic composition (delta D = ca. -135 0/00
relative to SMOW standard) of meteoric water in the Great Basin is the result of isotopically advanced storm systems that evolve from continued hydrologic processes upwind. A collary to this observation is that the stable isotopic composition of meteoric water in the Great Basin should be highly sensitive to climatic change.
Claassen (1986) used stable isotopic ratios along with 14C dating of ancient water to determine paleoclimatic conditions of the Amargosa Desert in Nevada. Unfortunately, uncontaminated ancient water samples with credible age determinations are difficult to obtain. In lieu of ancient water samples, several other techniques are available to determine paleoclimatic conditions. For example, the hydrogen isotopic composition of ancient cellulose has been used to reconstruct paleoclimate (Libby et al. 1976; Epstein et al. 1977; Yapp and Epstein 1982; Burk and Stuiver 1981). Also, cave speleothems preserve the record of long-term isotopic fluctuations in recharge waters. Harmon et al. (1979) studied the isotopic composition of ancient water from fluid inclusions in Pleistocene speleothems. These data can be interpreted in terms of both the paleotemperature variations within the cave and the stable isotopic composition of meteoric water (Schwarcz 1986).
Another source of climatic information is contained in volcanic glasses (Friedman et al. 1985). These glasses are known to absorb meteoric water once they have cooled. Hydrated tephra glasses from the Great Basin yield ancient meteoric water samples for isotopic analysis (N. L. Ingraham, unpublished data). This type of study is simplified by the abundance of described tephra layers in the Great Basin and known ages of these layers (determined by the radiocarbon dating of wood and other materials stratigraphically associated with the tephra).
Winograd et al. (1985) reconstructed a two million year record of the deuterium content of precipitation in the Great Basin by analyzing fluid inclusions from vein fillings. More recently, Winograd et al. (1988) reported on a 250,OOO-year climatic record obtained from a uraniumseries dated calcite vein in the southern Great Basin. This latter study provided a continuous record of oxygen-18 variations in the continental hydrosphere during the middle-to-Iate Pleistocene. They show that the configuration of their curve for delta 180 versus time, developed for the
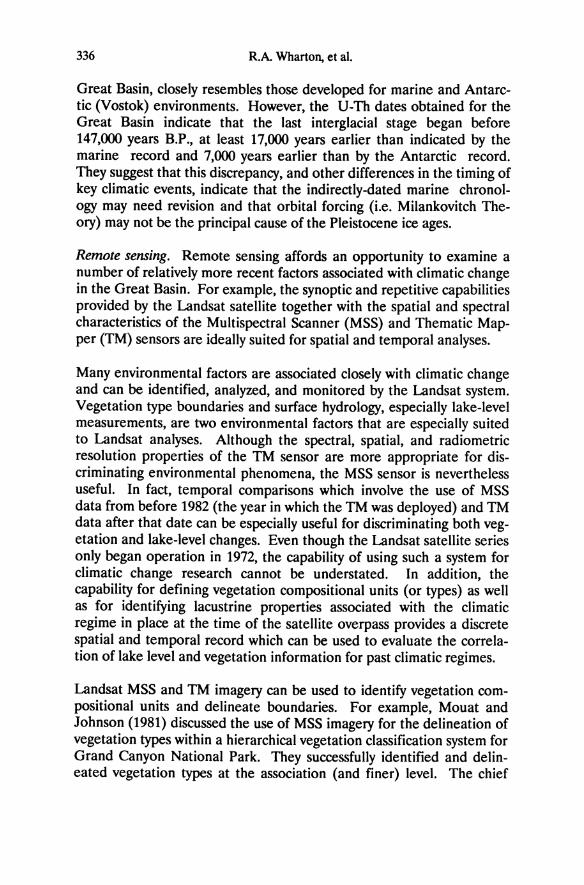
336 R.A Wharton, et al.
Great Basin, closely resembles those developed for marine and Antarctic (Vostok) environments. However, the U-Th dates obtained for the Great Basin indicate that the last interglacial stage began before 147,000 years B.P., at least 17,000 years earlier than indicated by the marine record and 7,000 years earlier than by the Antarctic record. They suggest that this discrepancy, and other differences in the timing of key climatic events, indicate that the indirectly-dated marine chronology may need revision and that orbital forcing (i.e. Milankovitch Theory) may not be the principal cause of the Pleistocene ice ages.
Remote sensing. Remote sensing affords an opportunity to examine a number of relatively more recent factors associated with climatic change in the Great Basin. For example, the synoptic and repetitive capabilities provided by the Landsat satellite together with the spatial and spectral characteristics of the Multispectral Scanner (MSS) and Thematic Mapper (TM) sensors are ideally suited for spatial and temporal analyses.
Many environmental factors are associated closely with climatic change and can be identified, analyzed, and monitored by the Landsat system. Vegetation type boundaries and surface hydrology, especially lake-level measurements, are two environmental factors that are especially suited to Landsat analyses. Although the spectral, spatial, and radiometric resolution properties of the TM sensor are more appropriate for discriminating environmental phenomena, the MSS sensor is nevertheless useful. In fact, temporal comparisons which involve the use of MSS data from before 1982 (the year in which the TM was deployed) and TM data after that date can be especially useful for discriminating both vegetation and lake-level changes. Even though the Landsat satellite series only began operation in 1972, the capability of using such a system for climatic change research cannot be understated. In addition, the capability for defining vegetation compositional units (or types) as well as for identifying lacustrine properties associated with the climatic regime in place at the time of the satellite overpass provides a discrete spatial and temporal record which can be used to evaluate the correlation of lake level and vegetation information for past climatic regimes.
Landsat MSS and TM imagery can be used to identify vegetation compositional units and delineate boundaries. For example, Mouat and Johnson (1981) discussed the use of MSS imagery for the delineation of vegetation types within a hierarchical vegetation classification system for Grand Canyon National Park. They successfully identified and delineated vegetation types at the association (and finer) level. The chief
Climatic Change in the Great Basin 337
problem in delineating vegetation types at the biome level lies in the characterization of ecotones.
As well, Landsat MSS and TM imagery has been used successfully in the discrimination of lake surface extent in semiarid terrain (Currey 1987). A comparison of terrain in western Nevada imaged by the Landsat MSS sensor in the summer of 1977 (a drought year) and also imaged by the Landsat TM sensor in the summers of 1984 and 1985 (wet years), is particularly instructive. The pine and juniper covered ranges east of the Sierra Nevada are clearly visible in each image, as are the remnants of Pleistocene lakes. During the drought year of 1977, the water bodies shrank to small vestiges of their size during moist years. Although the boundaries of the water bodies are very precise and distinct, the higher and lower elevation boundaries of the tree-covered mountain ranges are less distinct. With careful analysis, however, these boundaries, especially the lower boundaries, can be identified. These boundaries represent the integration of a considerable period of climatic fluctuation, perhaps extending back several hundred years. They may be considered a contemporaneous baseline against which past vegetation assemblages and their concomitant climates may be compared.
Climatic data. A considerable amount of 19th-century temperature and precipitation data also exists for the Great Basin (Chapter 2). Most of these data are derived from detailed meteorological records that were kept by military surgeons at outposts in the region. After 1871, the records were kept by the Army signal corps until 1892, when the U.S. Weather Bureau was established. The State of Nevada alone has records prior to 1890 from 21 different stations. Many of these stations have continuous records that were maintained from the 19th century through to the present. Historical Climate Network data from 1895 to the present are available from the Department of Energy, Oak Ridge National Laboratory. These data have been subjected to extensive evaluation and corrections to insure that the information is of the highest quality. Variables include monthly minimum, maximum, and mean temperature, total monthly precipitation, and the Palmer Drought Severity Index.
Convergence of data. Review of the site locations (Figure 9.4) at which pollen, woodrat midden, tree-ring, temperature and precipitation data were obtained reveals that there are several areas within the Great Basin that already have a significant spatial and temporal data overlap. These data are sufficient to develop a paleoclimatic reconstruction for
338 R.A Wharton. et al.
many parts of the Great Basin in Nevada. Data sets are also available for southeastern Nevada (P.E. Wigand, unpublished data). The integration of these data sets and problems associated with integration are discussed below.
Climatic Reconstructions
Paleoclimatic proxy data are actually paleoenvironmental indicators used to reconstruct past climate. The term "proxy" is used because the measurement of climatic parameters is indirect through biological, geological, or isotopic data and not by direct measurement of precipitation or temperature. For example, instrumental records of annual precipitation in the Great Basin are only 50-100 years long. A study of long-term change in annual precipitation requires the use of paleoenvironmental records (i.e., proxy data), such as tree-rings or pollen distribution, that are sensitive to spatial-temporal changes in many aspects of the moisture regime and that can be used as a surrogate. The appropriateness of a particular proxy is determined by establishing its covariance with the target climatic variable during a period of overlap between the two records.
Integration of Paleoclimatic Proxy Data
Although fossil pollen and plant remains have been used extensively for reconstructing past vegetation and climatic history in the arid west, they have rarely been used in conjunction with each other or with tree-ring analyses to provide more accurate estimates of precipitation and temperature. The use of regional environmental pollen data in combination with woodrat midden data has been carried out primarily in the northern Great Basin where both kinds of data are available (Mehringer and Wigand 1987; Wigand 1987; Thompson 1984). The feasibility of integrating these data with tree-ring data has been illustrated only recently (Mehringer and Wigand 1990). The limitation to integration of these data has been the problem of difference in sampling intervals. In most cases, the sampling intervals of pollen data have not been frequent enough to allow comparisons with tree-ring records. With continuous or near continuous pollen sampling intervals, as in the upper part of the Diamond Pond record from south-central Oregon, much closer correspondence with the tree-ring record has been achieved (Petersen 1988; Mehringer and Wigand 1990). The integration of
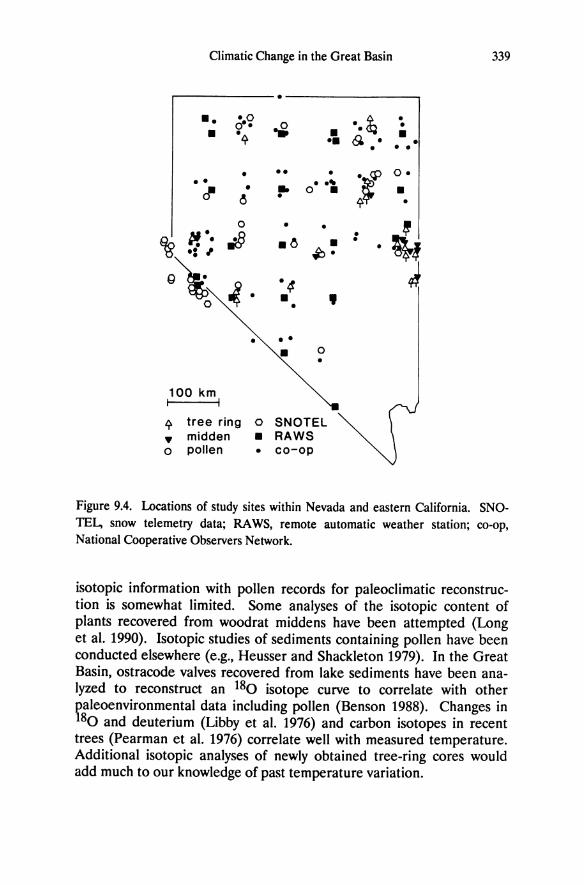
Climatic Change in the Great Basin 339
•
•• ·0 .. ~ • 0·· ~ • • .IT' • • •• s • • • • •
• •• • :~~
o • •• . .,
c1 • • 0 • • ~ • • 0 • •
~~ M·· ,;.? • .~ • • % .:. ~ ~. •
g~ ~. ·4 J. • ,
0 •
• • • • 0
•
100 km I I
IT' tree ring 0 SNOTEL
• midden • RAWS 0 pollen • co-op
Figure 9.4. Locations of study sites within Nevada and eastern California. SNOTEL, snow telemetry data; RAWS, remote automatic weather station; co-op, National Cooperative Observers Network.
isotopic information with pollen records for paleoclimatic reconstruction is somewhat limited. Some analyses of the isotopic content of plants recovered from woodrat middens have been attempted (Long et al. 1990). Isotopic studies of sediments containing pollen have been conducted elsewhere (e.g., Heusser and Shackleton 1979). In the Great Basin, ostracode valves recovered from lake sediments have been analyzed to reconstruct an 180 isotope curve to correlate with other r:aleoenvironmental data including pollen (Benson 1988). Changes in 80 and deuterium (Libby et al. 1976) and carbon isotopes in recent
trees (Pearman et al. 1976) correlate well with measured temperature. Additional isotopic analyses of newly obtained tree-ring cores would add much to our knowledge of past temperature variation.
340 R.A. Wharton, et al.
The use of other paleolimnological data in the Great Basin is very limited. At Walker Lake in west central Nevada, microfossil data help to unravel the complex record of fluctuating lake levels based upon a combination of climatic and geomorphic factors (Benson 1988; Bradbury 1987; Bradbury et al. 1989). These data indicate that from 16,000 to 5,000 years ago Walker Lake became saline and may have dried up due to diversion of the Walker River (which feeds the lake) into the Carson River. A low water episode between 2,500 and 2,000 years ago probably reflects climatic change rather than river diversion.
Ostracode data together with pollen data are being used currently to detail the fluctuating Pleistocene lake level of Pluvial Lake Chewaucan in south central Oregon by A. Cohen and J.O. Davis (Pippin and Davis 1986). Although the results of this research are still incomplete, it appears that during periods when pine dominates the pollen rain, the ostracode record indicates relatively deep water. Conversely, sediments with lower levels of pine pollen include salt tolerant ostracodes, and therefore suggest lower lake levels.
Important Factors Affecting Data Interpretation
Temporal and spatial comparisons and integrations of various measured climatic parameters with paleoenvironmental indicators may be complicated by many factors, including: 1) sampling frequency, 2) period of record, 3) environmental signal strength, 4) response time, 5) data incongruencies, and 6) spatial distribution.
Sampling frequencies vary between the different types of paleoclimatic proxy data. For example, tree-rings are dated accurately to the year in which they developed (Fritts 1976), and at the highest frequency they yield climatic information on a yearly and seasonal basis. Also they potentially respond to climatic changes occurring over the entire frequency range, from years to decades, to hundreds of years. In contrast, single pollen or sediment samples obtained in geological or archaeological contexts may comprise the data from a few to many years. However, potentially both pollen and sediment samples can be obtained from locations with relatively rapid sedimentation rates such that each sample represents a smaller time interval.
To some extent, the temporal and spatial control exhibited by different climatic records and paleoclimatic proxy data is a function of the
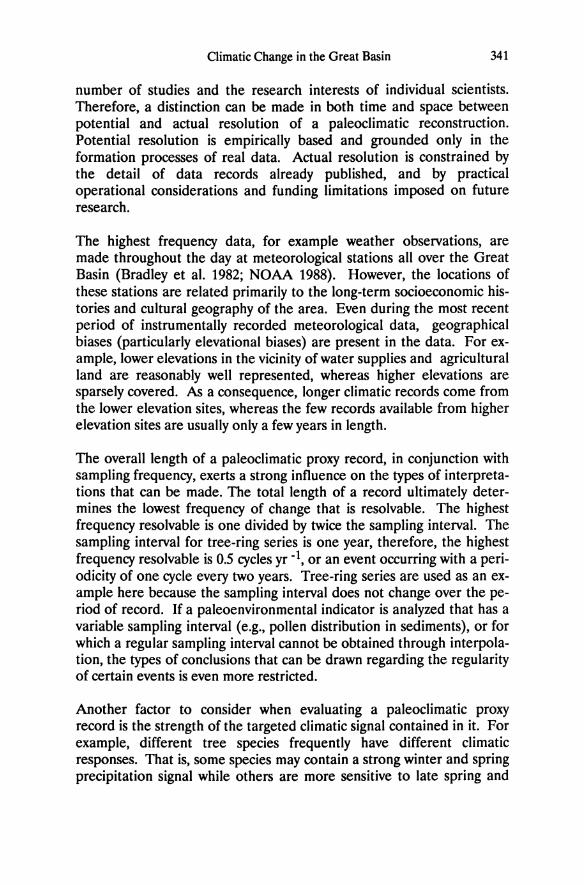
Climatic Change in the Great Basin 341
number of studies and the research interests of individual scientists. Therefore, a distinction can be made in both time and space between potential and actual resolution of a paleoclimatic reconstruction. Potential resolution is empirically based and grounded only in the formation processes of real data. Actual resolution is constrained by the detail of data records already published, and by practical operational considerations and funding limitations imposed on future research.
The highest frequency data, for example weather observations, are made throughout the day at meteorological stations all over the Great Basin (Bradley et al. 1982; NOAA 1988). However, the locations of these stations are related primarily to the long-term socioeconomic histories and cultural geography of the area. Even during the most recent period of instrumentally recorded meteorological data, geographical biases (particularly elevational biases) are present in the data. For example, lower elevations in the vicinity of water supplies and agricultural land are reasonably well represented, whereas higher elevations are sparsely covered. As a consequence, longer climatic records come from the lower elevation sites, whereas the few records available from higher elevation sites are usually only a few years in length.
The overall length of a paleoclimatic proxy record, in conjunction with sampling frequency, exerts a strong influence on the types of interpretations that can be made. The total length of a record ultimately determines the lowest frequency of change that is resolvable. The highest frequency resolvable is one divided by twice the sampling interval. The sampling interval for tree-ring series is one year, therefore, the highest frequency resolvable is 0.5 cycles yr -1, or an event occurring with a periodicity of one cycle every two years. Tree-ring series are used as an example here because the sampling interval does not change over the period of record. If a paleoenvironmental indicator is analyzed that has a variable sampling interval (e.g., pollen distribution in sediments), or for which a regular sampling interval cannot be obtained through interpolation, the types of conclusions that can be drawn regarding the regularity of certain events is even more restricted.
Another factor to consider when evaluating a paleoclimatic proxy record is the strength of the targeted climatic signal contained in it. For example, different tree species frequently have different climatic responses. That is, some species may contain a strong winter and spring precipitation signal while others are more sensitive to late spring and
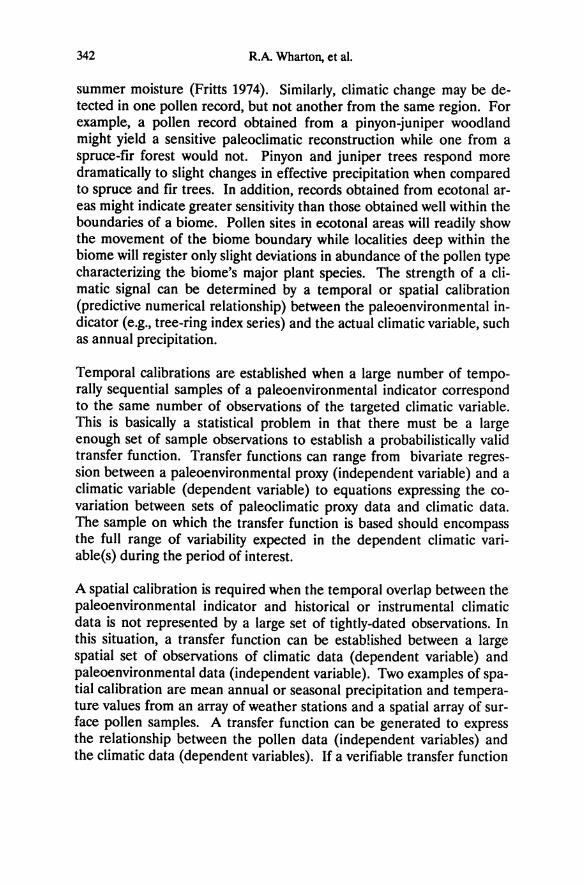
342 R.A Wharton, et aJ.
summer moisture (Fritts 1974). Similarly, climatic change may be detected in one pollen record, but not another from the same region. For example, a pollen record obtained from a pinyon-juniper woodland might yield a sensitive paleoclimatic reconstruction while one from a spruce-fir forest would not. Pinyon and juniper trees respond more dramatically to slight changes in effective precipitation when compared to spruce and fir trees. In addition, records obtained from ecotonal areas might indicate greater sensitivity than those obtained well within the boundaries of a biome. Pollen sites in ecotonal areas will readily show the movement of the biome boundary while localities deep within the biome will register only slight deviations in abundance of the pollen type characterizing the biome's major plant species. The strength of a climatic signal can be determined by a temporal or spatial calibration (predictive numerical relationship) between the paleoenvironmental indicator (e.g., tree-ring index series) and the actual climatic variable, such as annual precipitation.
Temporal calibrations are established when a large number of temporally sequential samples of a paleoenvironmental indicator correspond to the same number of observations of the targeted climatic variable. This is basically a statistical problem in that there must be a large enough set of sample observations to establish a probabilistically valid transfer function. Transfer functions can range from bivariate regression between a paleoenvironmental proxy (independent variable) and a climatic variable (dependent variable) to equations expressing the covariation between sets of paleoclimatic proxy data and climatic data. The sample on which the transfer function is based should encompass the full range of variability expected in the dependent climatic variable(s) during the period of interest.
A spatial calibration is required when the temporal overlap between the paleoenvironmental indicator and historical or instrumental climatic data is not represented by a large set of tightly-dated observations. In this situation, a transfer function can be established between a large spatial set of observations of climatic data (dependent variable) and paleoenvironmental data (independent variable). Two examples of spatial calibration are mean annual or seasonal precipitation and temperature values from an array of weather stations and a spatial array of surface pollen samples. A transfer function can be generated to express the relationship between the pollen data (independent variables) and the climatic data (dependent variables). If a verifiable transfer function
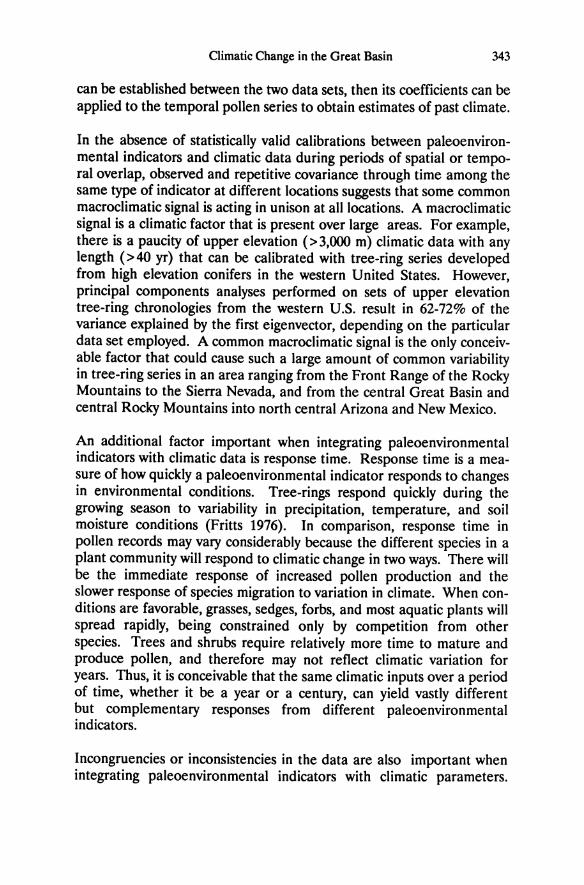
Climatic Change in the Great Basin 343
can be established between the two data sets, then its coefficients can be applied to the temporal pollen series to obtain estimates of past climate.
In the absence of statistically valid calibrations between paleoenvironmental indicators and climatic data during periods of spatial or temporal overlap, observed and repetitive covariance through time among the same type of indicator at different locations suggests that some common macroclimatic signal is acting in unison at all locations. A macroclimatic signal is a climatic factor that is present over large areas. For example, there is a paucity of upper elevation (>3,000 m) climatic data with any length (> 40 yr) that can be calibrated with tree-ring series developed from high elevation conifers in the western United States. However, principal components analyses performed on sets of upper elevation tree-ring chronologies from the western U.S. result in 62-72% of the variance explained by the first eigenvector, depending on the particular data set employed. A common macroclimatic signal is the only conceivable factor that could cause such a large amount of common variability in tree-ring series in an area ranging from the Front Range of the Rocky Mountains to the Sierra Nevada, and from the central Great Basin and central Rocky Mountains into north central Arizona and New Mexico.
An additional factor important when integrating paleoenvironmental indicators with climatic data is response time. Response time is a measure of how quickly a paleoenvironmental indicator responds to changes in environmental conditions. Tree-rings respond quickly during the growing season to variability in precipitation, temperature, and soil moisture conditions (Fritts 1976). In comparison, response time in pollen records may vary considerably because the different species in a plant community will respond to climatic change in two ways. There will be the immediate response of increased pollen production and the slower response of species migration to variation in climate. When conditions are favorable, grasses, sedges, forbs, and most aquatic plants will spread rapidly, being constrained only by competition from other species. Trees and shrubs require relatively more time to mature and produce pollen, and therefore may not reflect climatic variation for years. Thus, it is conceivable that the same climatic inputs over a period of time, whether it be a year or a century, can yield vastly different but complementary responses from different paleoenvironmental indicators.
Incongruencies or inconsistencies in the data are also important when integrating paleoenvironmental indicators with climatic parameters.
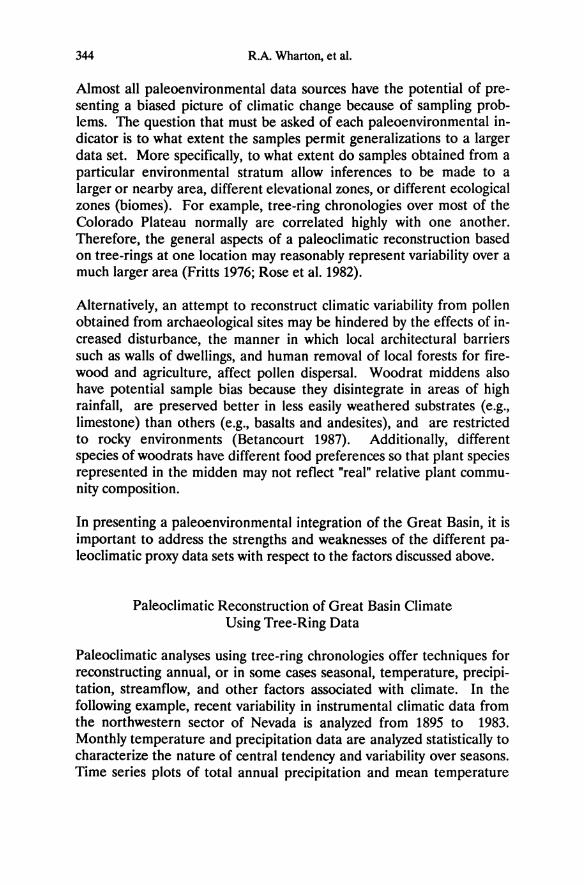
344 R.A Wharton, et aI.
Almost all paleoenvironmental data sources have the potential of presenting a biased picture of climatic change because of sampling problems. The question that must be asked of each paleoenvironmental indicator is to what extent the samples permit generalizations to a larger data set. More specifically, to what extent do samples obtained from a particular environmental stratum allow inferences to be made to a larger or nearby area, different elevational zones, or different ecological zones (biomes). For example, tree-ring chronologies over most of the Colorado Plateau normally are correlated highly with one another. Therefore, the general aspects of a paleoclimatic reconstruction based on tree-rings at one location may reasonably represent variability over a much larger area (Fritts 1976; Rose et al. 1982).
Alternatively, an attempt to reconstruct climatic variability from pollen obtained from archaeological sites may be hindered by the effects of increased disturbance, the manner in which local architectural barriers such as walls of dwellings, and human removal of local forests for firewood and agriculture, affect pollen dispersal. Wood rat middens also have potential sample bias because they disintegrate in areas of high rainfall, are preserved better in less easily weathered substrates (e.g., limestone) than others (e.g., basalts and andesites), and are restricted to rocky environments (Betancourt 1987). Additionally, different species of woodrats have different food preferences so that plant species represented in the midden may not reflect "real" relative plant community composition.
In presenting a paleoenvironmental integration of the Great Basin, it is important to address the strengths and weaknesses of the different paleoclimatic proxy data sets with respect to the factors discussed above.
Paleoclimatic Reconstruction of Great Basin Climate Using Tree-Ring Data
Paleoclimatic analyses using tree-ring chronologies offer techniques for reconstructing annual, or in some cases seasonal, temperature, precipitation, streamflow, and other factors associated with climate. In the following example, recent variability in instrumental climatic data from the northwestern sector of Nevada is analyzed from 1895 to 1983. Monthly temperature and precipitation data are analyzed statistically to characterize the nature of central tendency and variability over seasons. Time series plots of total annual precipitation and mean temperature
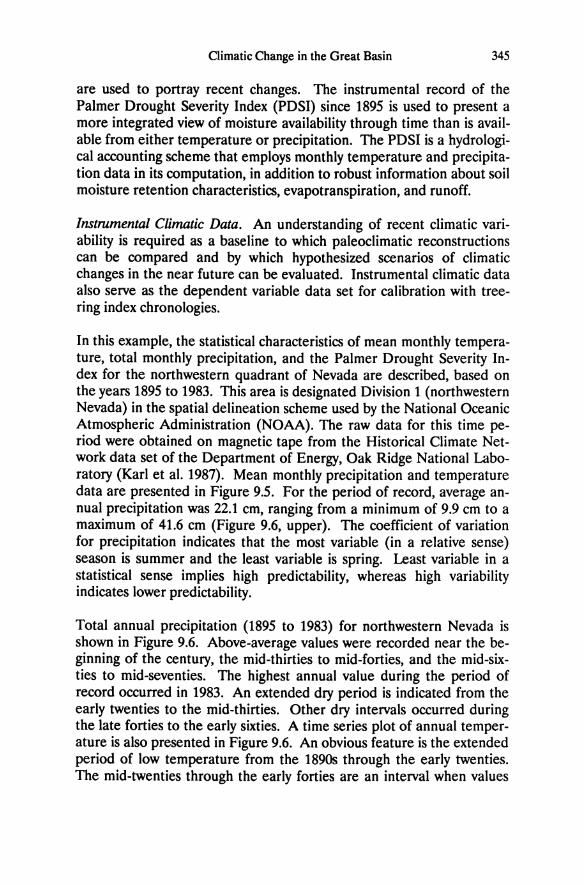
Climatic Change in the Great Basin 345
are used to portray recent changes. The instrumental record of the Palmer Drought Severity Index (PDSI) since 1895 is used to present a more integrated view of moisture availability through time than is available from either temperature or precipitation. The PDSI is a hydrological accounting scheme that employs monthly temperature and precipitation data in its computation, in addition to robust information about soil moisture retention characteristics, evapotranspiration, and runoff.
Instrumental Climatic Data. An understanding of recent climatic variability is required as a baseline to which paleoclimatic reconstructions can be compared and by which hypothesized scenarios of climatic changes in the near future can be evaluated. Instrumental climatic data also serve as the dependent variable data set for calibration with treering index chronologies.
In this example, the statistical characteristics of mean monthly temperature, total monthly precipitation, and the Palmer Drought Severity Index for the northwestern quadrant of Nevada are described, based on the years 1895 to 1983. This area is designated Division 1 (northwestern Nevada) in the spatial delineation scheme used by the National Oceanic Atmospheric Administration (NOAA). The raw data for this time period were obtained on magnetic tape from the Historical Climate Network data set of the Department of Energy, Oak Ridge National Laboratory (Karl et at. 1987). Mean monthly precipitation and temperature data are presented in Figure 9.5. For the period of record, average annual precipitation was 22.1 cm, ranging from a minimum of 9.9 cm to a maximum of 41.6 cm (Figure 9.6, upper). The coefficient of variation for precipitation indicates that the most variable (in a relative sense) season is summer and the least variable is spring. Least variable in a statistical sense implies high predictability, whereas high variability indicates lower predictability.
Total annual precipitation (1895 to 1983) for northwestern Nevada is shown in Figure 9.6. Above-average values were recorded near the beginning of the century, the mid-thirties to mid-forties, and the mid-sixties to mid-seventies. The highest annual value during the period of record occurred in 1983. An extended dry period is indicated from the early twenties to the mid-thirties. Other dry intervals occurred during the late forties to the early sixties. A time series plot of annual temperature is also presented in Figure 9.6. An obvious feature is the extended period of low temperature from the 1890s through the early twenties. The mid-twenties through the early forties are an interval when values
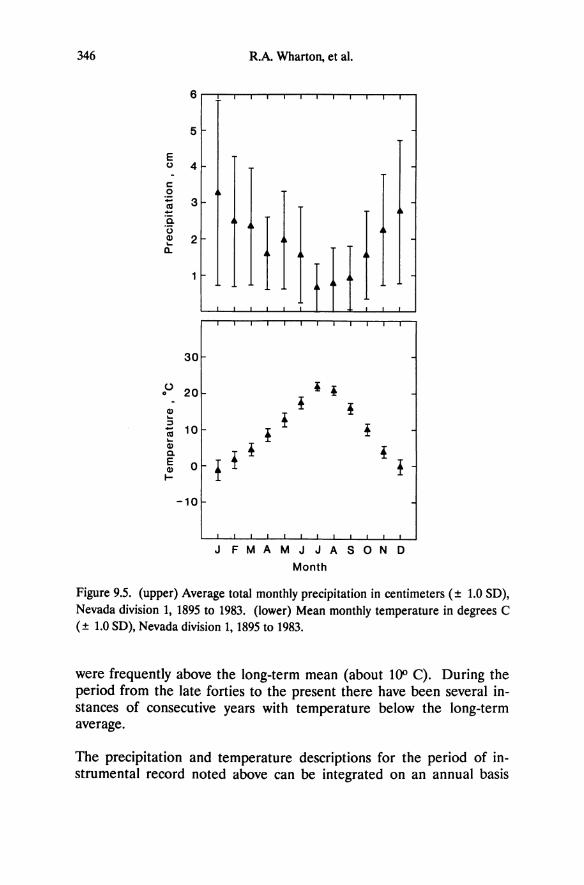
346 R.A Wharton, et al.
6
5
E (J 4
c: 0
~ 3
.!;
I (J CD 2 ... a.
30
0 20 i i 0
CD J J ... ! :;I
J m 10 t ... CD , t ! c. E 0 ! CD t I-
-10
J F M A M J J A SON D
Month
Figure 9.5. (upper) Average total monthly precipitation in centimeters (± 1.0 SD), Nevada division 1, 1895 to 1983. (lower) Mean monthly temperature in degrees C (± 1.0 SD), Nevada division 1, 1895 to 1983.
were frequently above the long-term mean (about 100 C). During the period from the late forties to the present there have been several instances of consecutive years with temperature below the long-term average.
The precipitation and temperature descriptions for the period of instrumental record noted above can be integrated on an annual basis
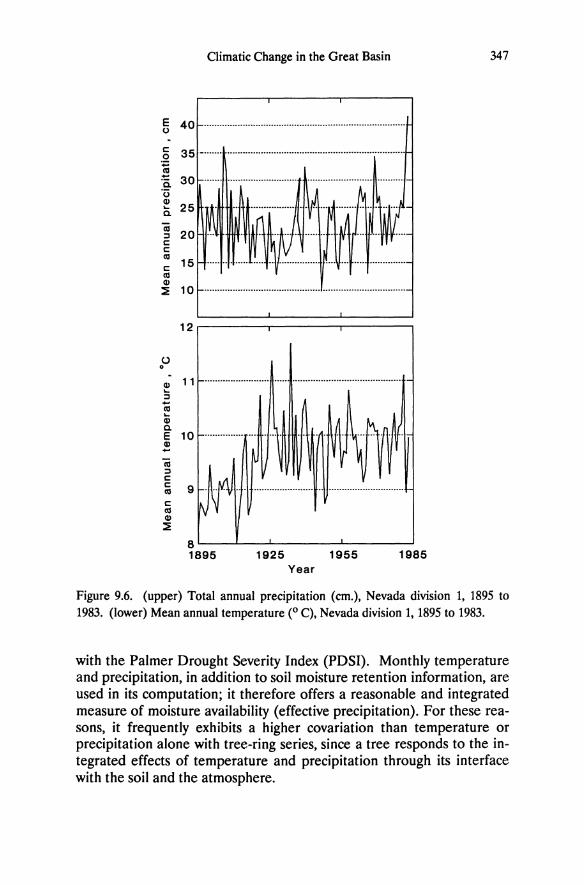
Climatic Change in the Great Basin
~ 40 ............................................................................. .
c: o +=
35 _ .......................................................................... .
!! .c. 30 ·u ~ 25 c.
iii :l 20 ... c: c: as c: 15 as II) ~ 10 ............................................................................ .
12r-------~--------r-------,
o o
II) 11 ... :l -as ... II) c. E II) - 10 ...................... .
8~--~--~------~~------~
1895 1925 1955 1985 Year
347
Figure 9.6. (upper) Total annual precipitation (em.), Nevada division 1, 1895 to 1983. (lower) Mean annual temperature (0 C), Nevada division 1, 1895 to 1983.
with the Palmer Drought Severity Index (PDSI). Monthly temperature and precipitation, in addition to soil moisture retention information, are used in its computation; it therefore offers a reasonable and integrated measure of moisture availability (effective precipitation). For these reasons, it frequently exhibits a higher covariation than temperature or precipitation alone with tree-ring series, since a tree responds to the integrated effects of temperature and precipitation through its interface with the soil and the atmosphere.
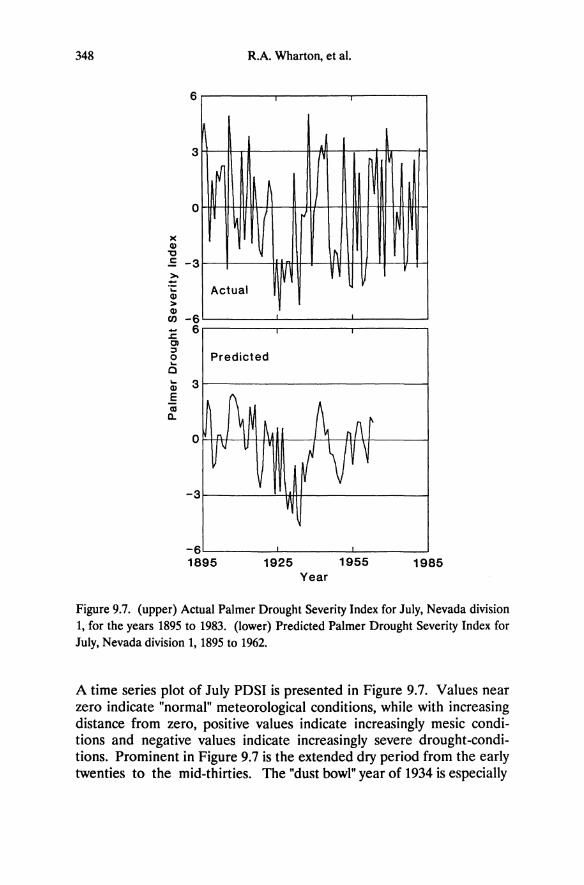
348
)(
CD 'tJ
6
3
o
.: -3 >. -.;: CD > CD
C/) -6
R.A. Wharton, et al.
~ ~
~
lh W
V
Actual
:c 6.--------r----..-------, 01
g Predicted ... o Q; 3t------------------t E a; Q.
-3r----~~+_------~
-6~---~----~---~ 1895 1925 1955 1985
Year
Figure 9.7. (upper) Actual Palmer Drought Severity Index for July, Nevada division 1, for the years 1895 to 1983. (lower) Predicted Palmer Drought Severity Index for July, Nevada division 1, 1895 to 1962.
A time series plot of July PDSI is presented in Figure 9.7. Values near zero indicate "normal" meteorological conditions, while with increasing distance from zero, positive values indicate increasingly mesic conditions and negative values indicate increasingly severe drought-conditions. Prominent in Figure 9.7 is the extended dry period from the early twenties to the mid-thirties. The "dust bowl" year of 1934 is especially
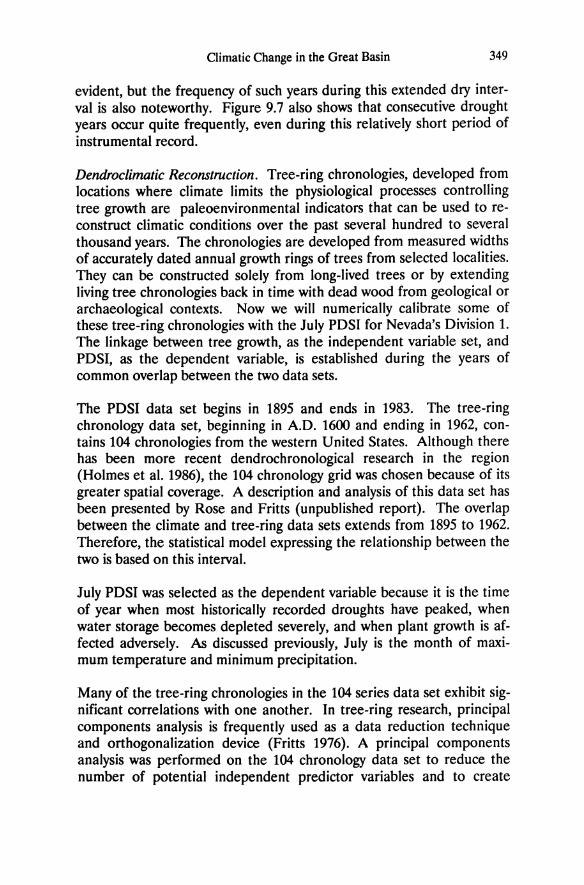
Climatic Change in the Great Basin 349
evident, but the frequency of such years during this extended dry interval is also noteworthy. Figure 9.7 also shows that consecutive drought years occur quite frequently, even during this relatively short period of instrumental record.
Dendroclimatic Reconstruction. Tree-ring chronologies, developed from locations where climate limits the physiological processes controlling tree growth are paleoenvironmental indicators that can be used to reconstruct climatic conditions over the past several hundred to several thousand years. The chronologies are developed from measured widths of accurately dated annual growth rings of trees from selected localities. They can be constructed solely from long-lived trees or by extending living tree chronologies back in time with dead wood from geological or archaeological contexts. Now we will numerically calibrate some of these tree-ring chronologies with the July POSI for Nevada's Division 1. The linkage between tree growth, as the independent variable set, and PDSI, as the dependent variable, is established during the years of common overlap between the two data sets.
The PDSI data set begins in 1895 and ends in 1983. The tree-ring chronology data set, beginning in AD. 1600 and ending in 1962, contains 104 chronologies from the western United States. Although there has been more recent dendrochronological research in the region (Holmes et al. 1986), the 104 chronology grid was chosen because of its greater spatial coverage. A description and analysis of this data set has been presented by Rose and Fritts (unpublished report). The overlap between the climate and tree-ring data sets extends from 1895 to 1962. Therefore, the statistical model expressing the relationship between the two is based on this interval.
July PDSI was selected as the dependent variable because it is the time of year when most historically recorded droughts have peaked, when water storage becomes depleted severely, and when plant growth is affected adversely. As discussed previously, July is the month of maximum temperature and minimum precipitation.
Many of the tree-ring chronologies in the 104 series data set exhibit significant correlations with one another. In tree-ring research, principal components analysis is frequently used as a data reduction technique and orthogonalization device (Fritts 1976). A principal components analysis was performed on the 104 chronology data set to reduce the number of potential independent predictor variables and to create
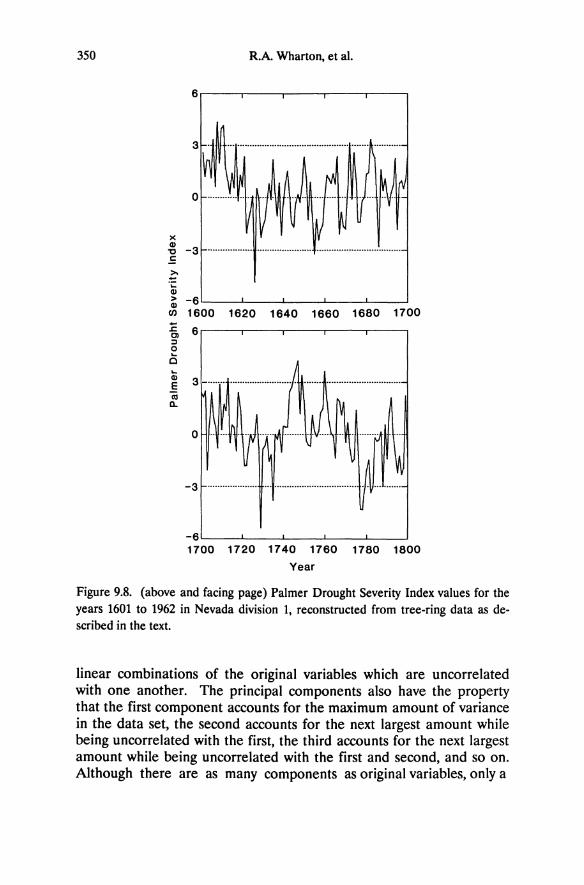
350 R.A Wharton, et aI.
6.----.----.----.----,----,
>< ~ -3 ......................................................................... . c:
>-+-.;: Q)
~ -6~--~----~----~--~----~ en 1600 1620 1640 1660 1680 1700 ~ 6.----.----.-----,----,----, OJ :l o ... C
-6L-__ ~ ____ ~ ____ L_ __ ~ ____ ~
1700 1720 1740 1760 1780 1800
Year
Figure 9.8. (above and facing page) Palmer Drought Severity Index values for the years 1601 to 1962 in Nevada division I, reconstructed from tree-ring data as described in the text.
linear combinations of the original variables which are uncorrelated with one another. The principal components also have the property that the first component accounts for the maximum amount of variance in the data set, the second accounts for the next largest amount while being uncorrelated with the first, the third accounts for the next largest amount while being uncorrelated with the first and second, and so on. Although there are as many components as original variables, only a
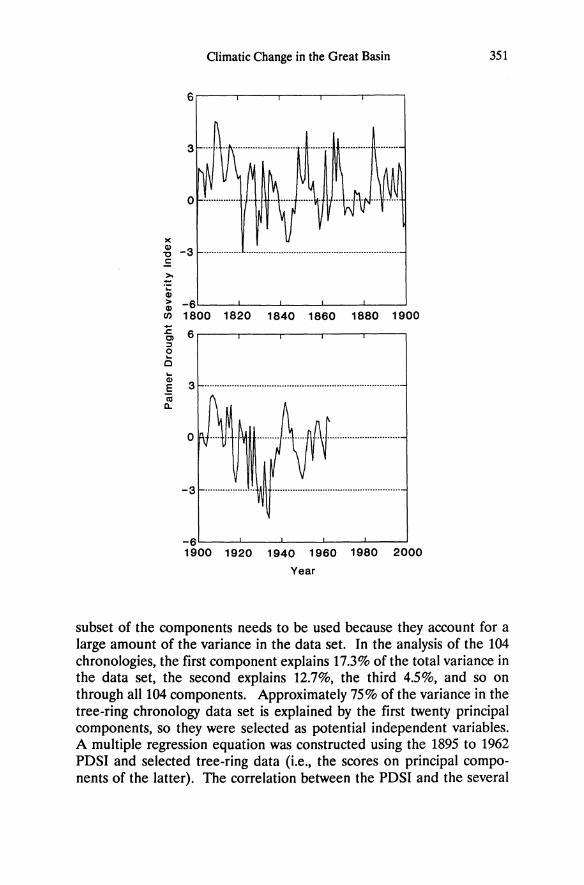
Climatic Change in the Great Basin
)(
~ -3 c::
>--.;: Q) ~ -6L----L ____ ~ __ ~ ____ _L __ ~
en 1800 1820 1840 1860 1880 1900
~ 6r-----,-----...,..------r-----r----. ::l o ... C ... ~ 3 ............................................................................. . al
D..
o
-6L----L ____ ~ __ ~~ __ -L __ ~
1900 1920 1940 1960 1980 2000
Year
351
subset of the components needs to be used because they account for a large amount of the variance in the data set. In the analysis of the 104 chronologies, the first component explains 17.3% of the total variance in the data set, the second explains 12.7%, the third 4.5%, and so on through all 104 components. Approximately 75% of the variance in the tree-ring chronology data set is explained by the first twenty principal components, so they were selected as potential independent variables. A multiple regression equation was constructed using the 1895 to 1962 PDSI and selected tree-ring data (Le., the scores on principal components of the latter). The correlation between the PDSI and the several
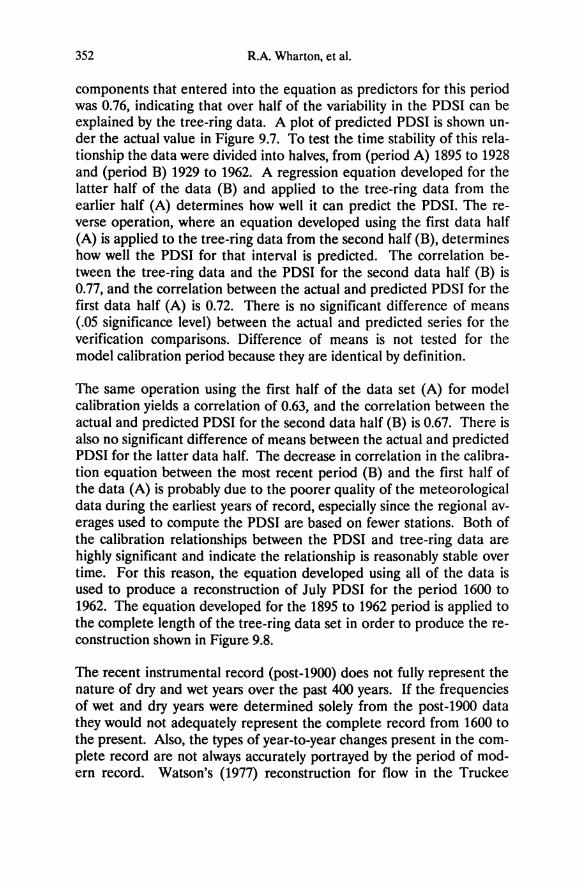
352 R.A. Wharton, et al.
components that entered into the equation as predictors for this period was 0.76, indicating that over half of the variability in the PDSI can be explained by the tree-ring data. A plot of predicted PDSI is shown under the actual value in Figure 9.7. To test the time stability of this relationship the data were divided into halves, from (period A) 1895 to 1928 and (period B) 1929 to 1962. A regression equation developed for the latter half of the data (B) and applied to the tree-ring data from the earlier half (A) determines how well it can predict the PDSI. The reverse operation, where an equation developed using the first data half (A) is applied to the tree-ring data from the second half (B), determines how well the PDSI for that interval is predicted. The correlation between the tree-ring data and the PDSI for the second data half (B) is 0.77, and the correlation between the actual and predicted PDSI for the first data half (A) is 0.72. There is no significant difference of means (.05 significance level) between the actual and predicted series for the verification comparisons. Difference of means is not tested for the model calibration period because they are identical by definition.
The same operation using the first half of the data set (A) for model calibration yields a correlation of 0.63, and the correlation between the actual and predicted PDSI for the second data half (B) is 0.67. There is also no significant difference of means between the actual and predicted PDSI for the latter data half. The decrease in correlation in the calibration equation between the most recent period (B) and the first half of the data (A) is probably due to the poorer quality of the meteorological data during the earliest years of record, especially since the regional averages used to compute the PDSI are based on fewer stations. Both of the calibration relationships between the PDSI and tree-ring data are highly significant and indicate the relationship is reasonably stable over time. For this reason, the equation developed using all of the data is used to produce a reconstruction of July PDSI for the period 1600 to 1962. The equation developed for the 1895 to 1962 period is applied to the complete length of the tree-ring data set in order to produce the reconstruction shown in Figure 9.8.
The recent instrumental record· (post-1900) does not fully represent the nature of dry and wet years over the past 400 years. If the frequencies of wet and dry years were determined solely from the post-1900 data they would not adequately represent the complete record from 1600 to the present. Also, the types of year-to-year changes present in the complete record are not always accurately portrayed by the period of modern record. Watson's (1977) reconstruction for flow in the Truckee
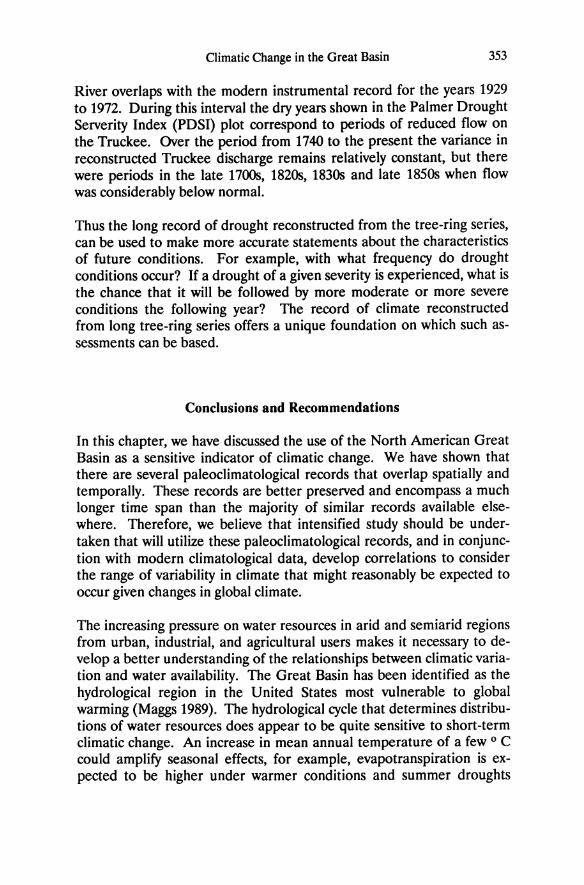
Climatic Change in the Great Basin 353
River overlaps with the modern instrumental record for the years 1929 to 1972. During this interval the dry years shown in the Palmer Drought Serverity Index (PDSI) plot correspond to periods of reduced flow on the Truckee. Over the period from 1740 to the present the variance in reconstructed Truckee discharge remains relatively constant, but there were periods in the late 1700s, 1820s, 1830s and late 1850s when flow was considerably below normal.
Thus the long record of drought reconstructed from the tree-ring series, can be used to make more accurate statements about the characteristics of future conditions. For example, with what frequency do drought conditions occur? If a drought of a given severity is experienced, what is the chance that it will be followed by more moderate or more severe conditions the following year? The record of climate reconstructed from long tree-ring series offers a unique foundation on which such assessments can be based.
Conclusions and Recommendations
In this chapter, we have discussed the use of the North American Great Basin as a sensitive indicator of climatic change. We have shown that there are several paleoclimatological records that overlap spatially and temporally. These records are better preserved and encompass a much longer time span than the majority of similar records available elsewhere. Therefore, we believe that intensified study should be undertaken that will utilize these paleoclimatological records, and in conjunction with modern climatological data, develop correlations to consider the range of variability in climate that might reasonably be expected to occur given changes in global climate.
The increasing pressure on water resources in arid and semiarid regions from urban, industrial, and agricultural users makes it necessary to develop a better understanding of the relationships between climatic variation and water availability. The Great Basin has been identified as the hydrological region in the United States most vulnerable to global warming (Maggs 1989). The hydrological cycle that determines distributions of water resources does appear to be quite sensitive to short-term climatic change. An increase in mean annual temperature of a few 0 C could amplify seasonal effects, for example, evapotranspiration is expected to be higher under warmer conditions and summer droughts
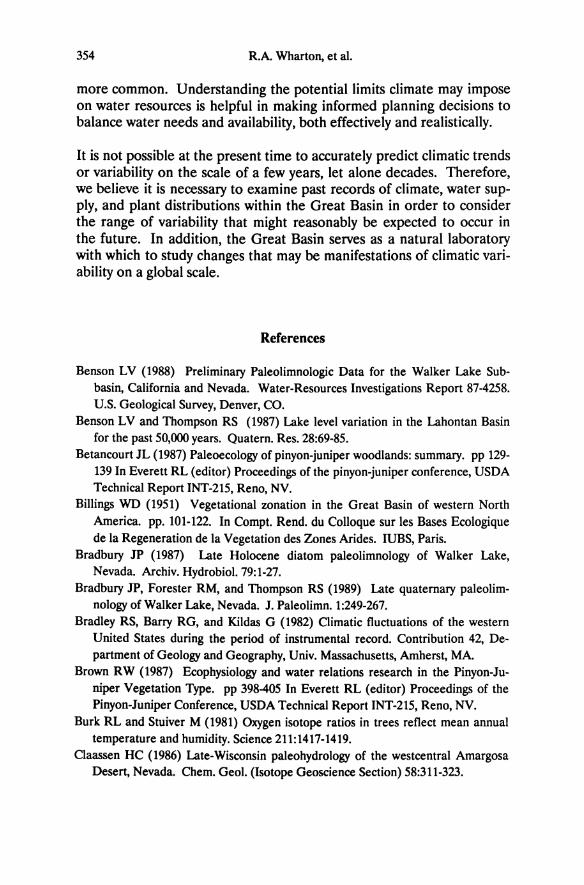
354 R.A Wharton, et aI.
more common. Understanding the potential limits climate may impose on water resources is helpful in making informed planning decisions to balance water needs and availability, both effectively and realistically.
It is not possible at the present time to accurately predict climatic trends or variability on the scale of a few years, let alone decades. Therefore, we believe it is necessary to examine past records of climate, water supply, and plant distributions within the Great Basin in order to consider the range of variability that might reasonably be expected to occur in the future. In addition, the Great Basin serves as a natural laboratory with which to study changes that may be manifestations of climatic variability on a global scale.
References
Benson LV (1988) Preliminary Paleolimnologic Data for the Walker Lake Subbasin, California and Nevada. Water-Resources Investigations Report 87-4258. U.S. Geological Survey, Denver, CO.
Benson LV and Thompson RS (1987) Lake level variation in the Lahontan Basin for the past 50,000 years. Quatern. Res. 28:69-85.
Betancourt JL (1987) Paleoecology of pinyon-juniper woodlands: summary. pp 129-139 In Everett RL (editor) Proceedings of the pinyon-juniper conference, USDA Technical Report INT-215, Reno, NV.
Billings WD (1951) Vegetational zonation in the Great Basin of western North America. pp. 101-122. In Compt. Rend. du Colloque sur les Bases Ecologique de la Regeneration de la Vegetation des Zones Arides. IUBS, Paris.
Bradbury JP (1987) Late Holocene diatom paleolimnology of Walker Lake, Nevada. Archiv. Hydrobiol. 79:1-27.
Bradbury JP, Forester RM, and Thompson RS (1989) Late quaternary paleolimnology of Walker Lake, Nevada. J. Paleolimn. 1:249-267.
Bradley RS, Barry RG, and Kildas G (1982) Climatic fluctuations of the western United States during the period of instrumental record. Contribution 42, Department of Geology and Geography, Univ. Massachusetts, Amherst, MA
Brown RW (1987) Ecophysiology and water relations research in the Pinyon-Juniper Vegetation Type. pp 398-405 In Everett RL (editor) Proceedings of the Pinyon-Juniper Conference, USDA Technical Report INT-215, Reno, NV.
Burk RL and Stuiver M (1981) Oxygen isotope ratios in trees reflect mean annual temperature and humidity. Science 211:1417-1419.
Claassen HC (1986) Late-Wisconsin paleohydrology of the westcentral Amargosa Desert, Nevada. Chern. Geol. (Isotope Geoscience Section) 58:311-323.
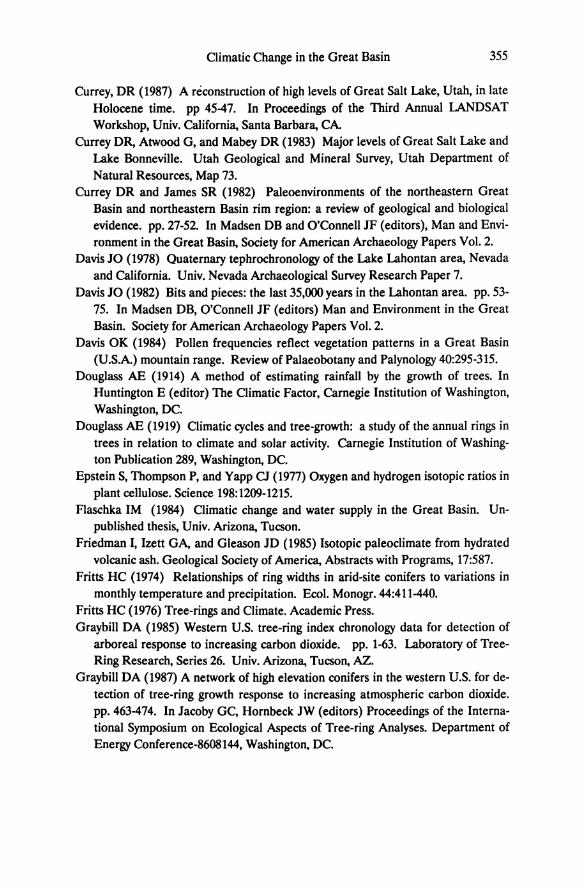
Climatic Change in the Great Basin 355
Currey, DR (1987) A reconstruction of high levels of Great Salt Lake, Utah, in late Holocene time. pp 45-47. In Proceedings of the Third Annual lANDSAT Workshop, Univ. California, Santa Barbara, CA
Currey DR, Atwood G, and Mabey DR (1983) Major levels of Great Salt Lake and Lake Bonneville. Utah Geological and Mineral Survey, Utah Department of Natural Resources, Map 73.
Currey DR and James SR (1982) Paleoenvironments of the northeastern Great Basin and northeastern Basin rim region: a review of geological and biological evidence. pp.27-52. In Madsen DB and O'Connell JF (editors), Man and Environment in the Great Basin, Society for American Archaeology Papers Vol. 2.
Davis JO (1978) Quaternary tephrochronology of the Lake Lahontan area, Nevada and California. Univ. Nevada Archaeological Survey Research Paper 7.
Davis JO (1982) Bits and pieces: the last 35,000 years in the Lahontan area. pp.53-75. In Madsen DB, O'Connell JF (editors) Man and Environment in the Great Basin. Society for American Archaeology Papers Vol. 2.
Davis OK (1984) Pollen frequencies reflect vegetation patterns in a Great Basin (U.S.A) mountain range. Review of Palaeobotany and Palynology 40:295-315.
Douglass AE (1914) A method of estimating rainfall by the growth of trees. In Huntington E (editor) The Climatic Factor, Carnegie Institution of Washington, Washington, DC.
Douglass AE (1919) Climatic cycles and tree-growth: a study of the annual rings in trees in relation to climate and solar activity. Carnegie Institution of Washington Publication 289, Washington, DC.
Epstein S, Thompson P, and Yapp CJ (1977) Oxygen and hydrogen isotopic ratios in plant cellulose. Science 198:1209-1215.
Flaschka 1M (1984) Oimatic change and water supply in the Great Basin. Unpublished thesis, Univ. Arizona, Tucson.
Friedman I, lzett GA, and Gleason JD (1985) Isotopic paleoclimate from hydrated volcanic ash. Geological Society of America, Abstracts with Programs, 17:587.
Fritts HC (1974) Relationships of ring widths in arid-site conifers to variations in monthly temperature and precipitation. Ecol. Monogr. 44:411-440.
Fritts HC (1976) Tree-rings and Climate. Academic Press. Graybill DA (1985) Western U.S. tree-ring index chronology data for detection of
arboreal response to increasing carbon dioxide. pp. 1-63. Laboratory of TreeRing Research, Series 26. Univ. Arizona, Tucson, AZ.
Graybill DA (1987) A network of high elevation conifers in the western U.S. for detection of tree-ring growth response to increasing atmospheric carbon dioxide. pp.463-474. In Jacoby Gc, Hornbeck JW (editors) Proceedings of the International Symposium on Ecological Aspects of Tree-ring Analyses. Department of Energy Conference-8608144, Washington, DC.
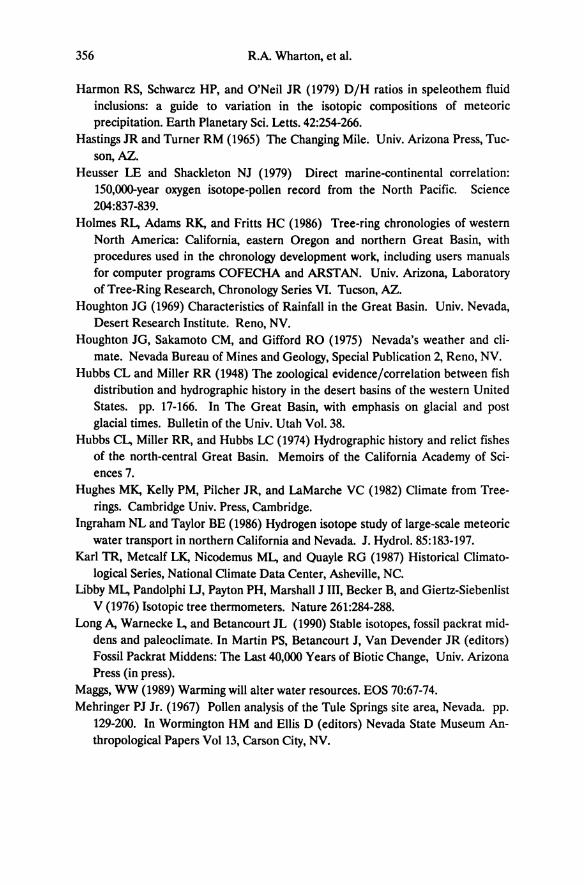
356 RA Wharton, et al.
Harmon RS, Schwarcz HP, and O'Neil JR (1979) D/H ratios in speleothem fluid inclusions: a guide to variation in the isotopic compositions of meteoric precipitation. Earth Planetary Sci. Letts. 42:254-266.
Hastings JR and Turner RM (1965) The Changing Mile. Univ. Arizona Press, Tucson,AZ.
Heusser LE and Shackleton NJ (1979) Direct marine-continental correlation: 150,OOO-year oxygen isotope-pollen record from the North Pacific. Science 204:837-839.
Holmes RL, Adams RK, and Fritts HC (1986) Tree-ring chronologies of western North America: California, eastern Oregon and northern Great Basin, with procedures used in the chronology development work, including users manuals for computer programs COFECHA and ARST AN. Univ. Arizona, Laboratory of Tree-Ring Research, Chronology Series VI. Tucson, AZ.
Houghton JG (1969) Characteristics of Rainfall in the Great Basin. Univ. Nevada, Desert Research Institute. Reno, NV.
Houghton JG, Sakamoto CM, and Gifford RO (1975) Nevada's weather and climate. Nevada Bureau of Mines and Geology, Special Publication 2, Reno, NV.
Hubbs CL and Miller RR (1948) The zoological evidence/correlation between fish distribution and hydrographic history in the desert basins of the western United States. pp. 17-166. In The Great Basin, with emphasis on glacial and post glacial times. Bulletin of the Univ. Utah Vol. 38.
Hubbs CL, Miller RR, and Hubbs LC (1974) Hydrographic history and relict fishes of the north-central Great Basin. Memoirs of the California Academy of Sciences 7.
Hughes MK, Kelly PM, Pilcher JR, and LaMarche VC (1982) Climate from Treerings. Cambridge Univ. Press, Cambridge.
Ingraham NL and Taylor BE (1986) Hydrogen isotope study of large-scale meteoric water transport in northern California and Nevada. J. Hydrol. 85:183-197.
Karl TR, Metcalf LK, Nicodemus ML, and Quayle RG (1987) Historical Climatological Series, National Climate Data Center, Asheville, NC.
Ubby ML, Pandolphi U, Payton PH, Marshall J III, Becker B, and Giertz-Siebenlist V (1976) Isotopic tree thermometers. Nature 261:284-288.
Long A, Warnecke L, and Betancourt JL (1990) Stable isotopes, fossil packrat middens and paleoclimate. In Martin PS, Betancourt J, Van Devender JR (editors) Fossil Packrat Middens: The Last 40,000 Years of Biotic Change, Univ. Arizona Press (in press).
Maggs, WW (1989) Warming will alter water resources. EOS 70:67-74. Mehringer PJ Jr. (1967) Pollen analysis of the Tule Springs site area, Nevada. pp.
129-200. In Wormington HM and Ellis 0 (editors) Nevada State Museum Anthropological Papers Vol 13, Carson City, NV.
Climatic Change in the Great Basin 357
Mehringer PJ Jr. (1977) Great Basin late Quaternary environments and chronology. pp. 113-167. In Fowler, DD (editor), Models and Great Basin Prehistory: A Symposium. Desert Research Institute Publications in the Social Sciences 12, Reno,NV.
Mehringer PJ Jr. (1985) Late-Quaternary pollen records from the interior Pacific Northwest and northern Great Basin of the United States. pp. 165-187. In Bryant VA, Holloway RG (editors) Pollen Records of Late-Quaternary North American Sediments. American Association of Stratigraphic Palynologists, Dallas, TX.
Mehringer PJ Jr. (1986) Prehistoric environments. pp.31-50. In D'Azevedo WL (editor) Handbook on North American Indians. Volume 11: Great Basin. Sturtevant WC (editor), Smithsonian Institution, Washington, DC.
Mehringer PJ Jr. and Warren CN (1976) Marsh, dune and archaeological chronology, Ash Meadows, Amargosa Desert, Nevada. pp. 120-150. In Elston R (editor) Holocene Environmental Change in the Great Basin. Nevada Archeological Survey Research Papers Vol. 6.
Mehringer PJ Jr. (1986) Holocene history of Skull Creek dunes, Catlow Valley, Oregon, U.S.A J. Arid. Environ. 11:117-138.
Mehringer PJ Jr. and Wigand PE (1987) Western Juniper in the Holocene. pp. 109-119. In Proceedings of the Pinyon-Juniper Conference, USDA Technical Report INT-215, Reno.
Mehringer PJ Jr. and Wigand PE (1990) Comparison of Late Holocene environments from woodrat middens and pollen, Diamond Craters, Oregon. In Martin PS, Betancourt J, and Van Devender TR (editors) Fossil Packrat Middens: The Last 40,000 Years of Biotic Change. Univ. Arizona Press. (in press).
Meko DM and Stockton CW (1984) Secular variations in streamflow in the western United States. J. Clim. Appl. Meteor. 23:889-897.
Mifflin MD and Wheat MM (1979) Pluvial lakes and estimated pluvial climates of Nevada. Nevada Bureau of Mines and Geology, Bulletin 94, Reno, NV.
Mitchell JM, Dzerdzeevskii B, Flohn H, Hofmeyr WL, Lamb HH, Rao KN, and Wallen CC (1966) Climatic change, Technical Note 79, World Meteorological Organization, Geneva.
Morrison RB (1964) Lake Lahontan: geology of southern Carson Desert, Nevada. U.S. Geological Survey Professional Paper 40l.
Morrison RB and JC Frye (1965) Correlation of the middle and late Quaternary successions of the Lake Lahontan, Lake Bonneville, Rocky Mountain (Wasatch Range), southern Great Plains, and eastern Midwest areas. Nevada Bureau of Mines and Geology Report 9, Reno, NV.
Mouat DA and Johnson RR (1981) An inventory and assessment of wildlife habitat in Grand Canyon National Park using remote sensing techniques. pp. 105-113. In Proc. 4th Pecors Symposium on Remote Sensing, Sioux Falls, Iowa.
358 R.A. Wharton, et al.
NOAA (1988) Climatological data annual summary. National Climate Data Center, Asheville, 102(13).
Odum EP (1971) Fundamentals of Ecology. Third Edition. W. B. Saunders Company, Philadelphia, P A.
Overpeck IT, Webb T III, and Prentice IC (1985) Quantitative interpretation of fossil pollen spectra: dissimilarity coefficients and the method of modern analogs. Quatern. Res. 23:87-108.
Pearman GI, Francey RJ, and Fraser PJB (1976) Climatic implications of stable carbon isotopes in tree rings. Nature 260:771-773.
Petersen KL (1988) Climate and the Dolores River Anasazi. Univ. Utah Anthropological Papers 113.
Pippin I.e and Davis JO (1986) Long pollen record from pluvial lake sediments at Summer Lake, south central Oregon. Geological Society of America, Abstracts with Programs 18:719.
Rogers GF (1982) Then and Now: A Photographic History of Vegetation Change in the Central Great Basin Desert. Univ. Utah Press, Salt Lake City, UT.
Rose MR, Robinson WJ, and Dean JS (1982) Dendroclimatic reconstruction for the southeastern Colorado Plateau. Laboratory of Tree-ring Research, Univ. Arizona, Tuscon, AZ.
Russell IC (1895) Present and extinct lakes of Nevada. National Geographic Society Monographs 1:101-136.
Schneider SH (1989) The greenhouse effect: science and policy. Science 243:771-781.
Schwarcz HP (1986) Geochronology and isotopic geochemistry of speleothems. In Fritz P and Fontes JCh (editors) Handbook of Terrestrial Geochemistry, vol 2, The Terrestrial Environment. Elsevier, Amsterdam.
Siegal RD (1983) Paleoclimatic significance of DIH and 13c/lZe ratios in Pleistocene and Holocene wood. Unpublished M.S. thesis, Univ. Arizona, Tucson, AZ.
Smith GI and Street-Perrott FA (1983) Pluvial lakes of the western United States. pp. 190-191. In Porter SC (editor) Late-quaternary Environments of the United States, Vol. 1 The Late Pleistocene. Univ. Minnesota Press, Minneapolis, MN.
Spaulding WG (1985) Vegetation and climates of the last 45,000 years in the vicinity of the Nevada Test Site, south-central Nevada. U.S. Geological Survey Professional Paper 1329.
Spaulding WG, Leopold EB, and Van Devender TR (1983) Late Wisconsin paleoecology of the American Southwest. pp. 259-293. In Wright HE Jr and Porter SC (editors), Late Quaternary Environments of the United States, Vol. 1, The Late Pleistocene. Univ. Minnesota Press, Minneapolis, MN.
Stokes MA, Drew LG, and Stockton CW (1973) Tree-ring chronologies of western North America, I. Selected tree-ring stations. Laboratory of Tree-ring Research Chronology Series 1, Univ. Arizona, Tucson, AZ.
Climatic Change in the Great Basin 359
Thompson RS (1984) Late Pleistocene and Holocene environments in the Great
Basin. Unpublished PhD dissertation, Univ. Arizona, Tucson, AZ. Turner RM and Karpiscak MM (1980) Recent vegetation changes along the Col
orado River between Glen Canyon Dam and Lake Mead, Arizona. u.s. Geo
logical Survey Professional Paper 1132. Walter H (1954) Le facteur eau dans les regions arides et sa signification pour
l'organisation de la vegetation dans les contrees sub-tropicales. pp. 27-39. In Les Divisions Ecologiques du Monde. CNRS, Paris.
Watson PC (1977) Dendrochronologic Reconstruction of Water Levels for Pyramid Lake, Nevada, 1745 to 1904 A.D., unpublished M.S. Thesis, Univ. Nevada, Reno, NY.
Webb RH (1986) Spatial and temporal distribution of radiocarbon ages on rodent middens from the southwestern United States. Radiocarbon 28:1-8.
Wells PV (1983) Paleobiogeography of montane islands in the Great Basin since the last glaciopluvial. Eco!. Monogr. 53: 341-382.
Went FW (1957) The Experimental Control of Plant Growth. Chronica Botanica, Waltham, MA.
Whittaker RH (1970) Communities and Ecosystems. Macmillian, NY. Wigand PE (1987) Diamond Pond, Harney County, Oregon: vegetation history and
water table in the eastern Oregon Desert. Great Basin Naturalist 47:427-458. Winograd U, Szabo BJ, Coplen TB, Riggs AC, and Kolesar PT (1985) Two-million
year record of deuterium in Great Basin ground waters. Science 227:519-522. Winograd U, Szabo BJ, Coplen TB, and Riggs AC (1988) A 250,OOO-year climatic
record from Great Basin calcite: implications for Milankovitch Theory. Science 242: 1275-1280.
Yapp 0 and Epstein S (1982) A reexamination of cellulose carbon-bound hydrogen 6D measurements and some factors affecting plant-water D/H relationships. Geochim. Cosmochim. Acta 46:955-965.
TAXONOMIC INDEX
Abies, 57, 117 Abies amabilis, 62, 82 Abies balsamea, 52, 53, 56, 61, 104 Abies bracteata, 80 Abies concolor, 70, 79, 146 Abies fraseri, 56 Abies grandis, 62 Abies lasiocarpa, 58, 60, 70, 74, 83,
116-7,123 Abies magnifica, 78, 79 Abies magnifica var. shastensis, 81 Abies procera, 83 Acacia, 308 Acer, 6, 54 Acer grandidentatum, 73 Acer pensylvanicum, 55 Acer rubrum, 52 Acer saccharum, 52, 55 Aesculus califomica, 79 Aesculus octandra, 55 Agropyron, 206, 314 Agropyron dasystachyum, 207, 208,
212-4, 222-4 Agropyron desertorum, 209, 217, 219,
253-4,261,266,270,279,281, 299
Agropyron riparium, 259 Agropyron smithii, 314 Agropyron spicatum, 210, 259, 266, 279,
281 Allenrolfia occidentalis, 250 Alnus,6 Amaranthus, 299
Ambrosia acanthicarpa, 260 Ambrosia dumosa, 205 Amelanchier, 156, 157, 158 Amelanchier alnifolia, 145, ]52-3, 160,
]63, ]69 Amelanchier utahensis, 262 Andropogon, 308 Arctostaphylos, 156, 157, 158 Arctostaphylos patula, 145, 146, 152,
153, 160, 162, 163, 164, 169, 170, 171
Arctostaphylos viscida, 160 Arnica cordifolia, 97, 127 Arnica latifolia, 97 Artemisia, 75, 153, 154, 156, 157, 158,
169, 173 Artemisia filifolia, 273 Artemisia nova, 276 Artemisia tridentata, 2, 145, 146, ]47,
152, 154, 156, 158, 159, 160, 162, 163,164, ]67, 169, 173,206,224, 250,252,253,325
Artemisia tridentata ssp. vaseyana, 274 Artemisia tridentata ssp. tridentata, 276 Artemisia tridentata ssp. vaseyana, 261,
262,272,274,281 Artemisia tridentata ssp. wyomingensis,
276 Astragalus, 260 Atriplex, 207, 214 A triplex canescens, 262 A triplex confertifolia, 206, 214, 250,
267,305
362 Taxonomic Index
Atriplex spinosa, 262 Atriplex torreyi, 276
Balsamorhiza, 260 Betula, 54 Betula alleghaniensis, 52, 55-6 Betula glandulosa, 59 Betula lenta, 52 Betula papyrifera, 52-3, 56, 58, 60 Betula papyrifera var. commutata, 62 Betula populifolia, 52 Bouteloua, 314 Bouteloua gracilis, 314 Bromus, 154,227 Bromus tectorum, 154, 161, 162,210,
227,259 Bromus trinii, 161
Calamagrostis rubescens, 161 Calocedrus decurrens, 78, 79 Calyptridium umbel/atum, 145 Camellia, 98 Carya, 54 Celtis occidentalis, 313 Ceratoides lanata, 206, 214, 224, 262,
305 Cercocarpus ledifolius, 75, 146 Chamaecyparis nootkatensis, 83 Chenopodium album, 299 Chrysothamnus, 206 Chrysothamnus nauseosus, 213, 262 Chrysothamnus nauseosus ssp.
viridulus, 276 Chrysothamnus parryi, 146 Chrysothamnus viscidifloris, 262 Cordylanthus ramosus, 260
Distichlis,206 Distichlis spicata, 206
Elymus cinereus, 259 Elymus elymoides, 253, 254 Elymus lanceolatus, 259 Enceliafarinosa, 205, 217 Ephedra viridis, 262 Eriogonum, 147,217,260 Eriogonum injlatum, 209, 217, 218 Eriogonum lobbii, 145 Eriogonum robustum, 145 Eriogonum wrightii, 146
Fagus, 54 Fagus grandifolia, 52, 55, 56 Festuca idahoensis, 259 Fraxinus, 52
Grayia spinosa, 276 Gutierrezia sarothrae, 209, 214, 215
Halesia, 55 Halesia carolina, 55 Herpatrichia nigra, 98 Hilaria rigida, 205
Juniperus, 153,255,325 Juniperus monospenna, 65, 70, 262 Juniperus occidentalis, 78, 79, 312 Juniperus osteospenna, 74, 145, 146,
152, 153, 156, 157, 158, 159, 160, 163,312
Juniperus scopulorum, 68
Koeleria cristata, 259
Lactuca serriola, 260 Larix,60 Larix laricina, 52, 58, 60 Larix lyallii, 58, 62 Larix occidentalis, 83 Larrea tridentata, 205, 206, 213, 273,
312 Liriodendron,54,55 Lithocarpus, 6, 9 Lupinus, 260 Lysiloma divaricata, 162
Magnolia, 54 Magnolia acuminata, 55 Magnolia fraseri, 55 Mahonia, 9 Metasequoia, 6 Metrosideros, 82
Nothofagus, 82
Oryzopsis hymenoides, 259
Picea, 57, 60, 112, 117 Picea engelmannii, 61, 116-7, 123 Picea glauca, 52, 59, 60 Picea mariana, 52, 59, 60 Picea pungens, 67
Taxonomic Index 363
Picea rubens, 53, 55, 56 Picea sitchensis, 82 Pinus, 54, 57,112,117, 146, 147, 154,
156,325 Pinus albicaulis, 62, 74, 79 Pinus aristata, 65, 70, 74 Pinus contorta, 61, 65, 79, 116-7, 123,
125 Pinus contorta var. latifolia, 58, 60-1 Pinus coulteri, 80 Pinus edulis, 65, 69, 70, 255 Pinus fiexilis, 62, 63, 65, 70 Pinus jeffreyi, 79, 142, 145-7, 152-3,
156-7, 160-3 Pinus lambertiana, 78-9 Pinuslongaeva, 65, 74 Pinus monoplzylla, 74, 145-6, 152-3,
156-163,169,312 Pinus monticola, 79 Pinus ponderosa, 65, 78, 79,117,142,
145-7,152-3, 155-64, 167, 169, 312
Pinus sabiniana, 79 Pinus strobus, 52, 170 Pinus taeda, 169 Poa sandbergii, 259 Populus, 60 Populus angustifolia, 67 Populus balsamifera, 59, 60 Populus tremuloides, 52, 58, 60, 65,
127,132 Prosopis,308,310, 312 Prosopis glandulosa, 309, 310, 311 Prunus, 9 Prunus serotina, 55 Pseudoroegneria spicata, 259, 266, 270,
279,281 Pseudotsuga macrocarpa, 80 Pseudotsuga menziesii, 63-4, 79, 82, 88,
117,124,160 Purshia, 156 Purslzia tridentata, 146, 152, 160, 163,
169,262
Quercus, 6,9,54,79 Quercus chrysolepis, 79 Quercus douglasii, 79 Quercus gambelii, 73, 262 Quercus kelloggii, 79 Quercus macrocarpa, 313 Quercus rubra, 52, 55
Quercus wislizenii, 79
Ranunculus, 106 Rhododendron, 55
Salsola kali, 260 Sarcobatus, 206 Sarcobatus vermiculatus, 206, 250 Scroplzularia desertorum, 214 Sequoiadendron, 6, 9 Sequoiadendron giganteum, 78, 79 Setaria, 308 Sitanion Izystrix, 222, 223, 224, 253, 254 Spartina, 303 Stipa comata, 259 Suaedato"eyana, 250
Taeniatlzerum asperum, 269 Tamarix, 207 Taxodium, 6 Tetradymia glabrata, 147 Tetradymia spinosa, 276 Thuja, 62 Thuja plicata, 62, 82 Tilia, 55 Ti/ia americana, 313 Tsuga, 54, 55 Tsuga canadensis, 52 Tsuga heterophylla, 62, 82 Tsuga mertensiana, 62, 79, 82, 83
Ulmus, 52 Ulmus americana, 313
Wyethia, 260
Yucca brevi/olia, 213
INDEX
Aboveground biomass, 100, 264 Absaroka Mountain, 57, 64-5 Absorptance, 195-7 Accelerated life cycles, 198 Acclimation, 120 Accumulation of sediments, 250 Acid rain, 37 Active growth period, 118 Adaptation, 87-9,107,111,119,131,
161,173,181,182,189,212,257 Adirondack Mountains, 51,53 Adventitious roots, 269 Aeolian erosion, 327 Aerenchyma, 276 Air mass blending, 23 Air pollution, 19, 36, 37, 41-2, 76 Air temperature, 28-30,36, 71, 89, 90-
93,99-102, 108, 112-8, 121, 126, 185, 193-8,209,219-20,274
Albion Range, 330 Alaska yellow cedar, 83 ALERT, 36 Algae, 251,255 Alluvial fans, 1, 179,244,248,249 Alpine glaciers, 81 Alpine larch, 62 Alpine tundra, 51, 105 Altered andesite, 149, 151,221 Altered grus, 153, 154, 155 Altered rock, 144-5, 149-154, 160-5 Ammonia release, 224 Ammonium, atmospheric, 36, 40-2
Anaerobic conditioni 262,275-7,283, 304
Annual carbon gain, 88, 104, 121, 131 Annual mean relative humidity, 22,
29 Annual production, 100, 111,327 Annuals, 170, 191-2, 197-200,204,
222,260,301 Anthropogenic disturbance, 310 Appalachian Mountains, 47-56,60,83 Aquatic vegetation, 329 Arapaho Peaks, 69 Archaeology, 9 Ash, 211-12,327,331 Ashes, 52 Aspen, 52, 58-68, 70, 75 Assimilation rate, 208,213-217 Availability of phosphorus, 162 Avoidance mechanisms, 131
Bajadas, 70, 179, 181, 186-9,204,244 Balsam fir, 52-3,61, 104 Balsam poplar, 59,61 Balsamroot, 260 Basin drainage and flow patterns, 243 Basin scale circulation, 248 Basin wildrye, 210,211,259 Beartooth, 57, 64, 74 Bedrock geology, 143 Beech,52,54,55,56 Belowground processes, 106, 125, 205,
221,225,263,265,268,277-8
366
Bermuda High, 20, 326 Big Horn Mountains, 57, 64-65 Big sagebrush, 260-3, 272, 274-6, 278,
281 Big Snowy Mountain, 64 Bigtree, 79 Biochemical components, 303-4 Biological isotope fractionation, 306 Birch, 52-62 Bitterbrush, 263, 276 Black Mountains, 51,56,57 Black Range, 72 Black Rock Desert, 9 Black Rock Range, 4 Black sagebrush, 276 Black spruce, 52,59,61 Blackbrush, 187,188,191,221 Blue grama, 314 Blue Ridge Mountains, 53-5 Blue spruce, 67 Bluebunch, 211,259,266-7,269-71,
277-81 Bone collagen, 303 Boreal forest, 58 Bottlebrush, 253-4, 259 Boundaries of the Great Basin, 3, 28,
179,243,325 Bristlecone pines, 17,65 Brooks Range, 49, 57-60 Buckwheat, 260 Budsage, 276 Bull Run Mountain, 4 Bunchgrasses, 189, 190,202,213 Bursage, 187-8, 191,221,260 Bushy birdbeak, 260
C3 pathway of photosynthesis, 99, 121, 159,171,193, 197,214,294-9, 302-8,311-16
C4 pathway of photosynthesis, 99, 158, 171,193,197,214,294-6,299-316 .
Cacti, 188 Caliche, 186, 188,201-2 Calico Mountains, 4 Canopy layer model, 212 Canopy opening, 95 Canopy water use, 212 Carboxylating enzymes, 107, 297 Carson Range, 34, 80
Index
Carbon 14 dating, 333-5 Carbon isotope composition, 106-8,
159-60, 293-316, 334-5 Carbon recycling, 313 Carson Sink, 9, 244 Carson Valley, 25 Cascade Mountains, 31,41,47-8,75,
78,80-9,109,179,183,243,325 Cation exchange capacity, 42 Cell wall elasticity, 204 Cenozoic, 57 Cessation of net photosynthesis, 156 Cheatgrass, 190,210,212,259,269,
279 Chemical composition of
precipitation, 39 Chemicals in precipitation, 19 Chestnut, 55 Chihuahuan Desert, 181,243 Chinook, 28, 63 Chlorofluorohydrocarbons, 18 Ci/Ca, 108,297-302,316 Clan Alpine Mountain, 4 Clay, 11,246,250 Climatic change, 7, 19,48,56,57, 182,
227,245,294,308,323-8,332-6, 340-5, 353-4
Climatic variability, 18, 324, 344-5, 354
Climatic zones, 325 Closed basin, 244-8, 258, 282 Closed-canopy forests, 297,313 Cloud cover, 23, 29, 30 Cloud formation, 29, 91, 247 Cloudiness, 19,21,23,30-1,99 CO2 exchange, 104, 107, 109, Ill,
119, 164 CO2 levels, 93, 95, 108 Coast Ranges, 80, 81 Coastal mountains, 62, 82, 90 Cofer Spring, 330 Cold air drainage, 28, 50, 76, 184 Cold desert, 65, 184, 187, 200, 202,
204 Cold precipitation, 334 Colorado pinyon, 65 Colorado River plateaus, 243 Columbia River, 20 Competition, 151,158, 160-1, 165,
171, 173-4,202,205-6,211,221,
225,243,258,260,263,271,277-83,343
Compatibility of root systems, 189 Compensation points, 121 Congeneric pairs, 108 Conifers, 7,31,47,57-8,61,82,87,
103-5,109,111-12,114-15,118, 120-1, 143, 145, 153-54, 157-8, 162,164-5,169, 171,221,331, 343
Continental ice, 48, 54, 60, 334 Continental mountains, 90, 99 Convective cooling, 115 Coppice dune, 251,253-4 Cordilleran flora, 6, 73 Cortez Mountains, 74 Cottonwood, 68, 188 Coulter pine, 80 Cove forests, 55 Cracking of soil crust, 257 Creosote bush, 273, 275 Crested wheatgrass, 190, 209-11, 215,
253-4,259,261,266-71,277-81 Cryptogams, 192 Cucumber tree, 55 Cushion-like growth form, 90 Cuticular conductance, 97 Cycling of water, 247 Cyclones, 30, 33, 34
Death Valley, 181, 184, 192,200,218 Deciduous forest, 54-6, 98, 153, 264 Decomposition, 125, 258, 297, 303-4 Deep Creek, 4, 74 Deep soil recharge, 275 Defoliation, 220,266-7,280-1 Deglaciation, 60 Dendrochronology, 332 Dendroclimatology, 332 Dendrohydrology, 334 Denitrification, 224 Desert willow, 188 Desertification, 7 Deuterium, 334, 336, 339 Dewfall, 91,93, 104, 119 Diamond Mountain, 75, 338 Diffusion of CO2, 91, 93 Digger pine, 79 Dimethyl sulfide, 36 Dispersal, 199,328,344
Index 367
Diurnal circulation pattern, 25 Diurnal pattern of conductance, 209 Diurnal patterns of photosynthesis,
214,215 Douglas Fir, 63, 71, 88 Drainage basins, 181, 183, 186,248 Drought tolerance, 97, 118, 143, 151,
154, 156, 158-9, 162, 171-3, 192, 204,217
Drought-deciduous shrubs, 192-4 Drought-evasion, 204 Dry deposition, 37,38,41,42 Dual-isotope experiments, 280 Dust bowl, 348 Dust devils, 20
Eagle Mountain, 5, 25 East Humboldt Mountain, 4 East Warner Mountain, 4 Ecological fitness, 131-2 Ecotone, 52, 56, 63, 96, 98, 106, 131,
145,325,337 Eleana Range, 330 Elevated atmospheric CO2, 227, 333 Elevational effects on photosynthesis,
93 Elevational gradients, 49 Elko County, 65, 75 Elm, 52,313 Energy balance, 126,212 Energy savings, 267, 268 Engelmann spruce, 61-7, 70,74,80 Eocene, 7 Ephemeral lakes, 244-6 Ephemeral salt crust, 250 Eureka Valley, 26, 192 Evergreen shrubs, 161,192, 194,301 Evaporation, 7, 173, 182-5,210,226,
244, 246-8, 250, 256-8, 264, 282, 327
Evapotranspiration, 20, 90, 158, 182, 184,210,345,354
Exchangeable phosphate, 279
Facultative perennation, 198 Fault block mountains, 3, 179 Feather River, 77 Fertilization, 124-5, 211, 222-4 Fine roots, 106, 125,261,274
368
Fir, 53, 56-83, 94, 100, 104, 106, 342 Fire cycle, 66 Fire-successional lodgepole pine, 67 Fires, 3,31,35,61,64-5, 191,323 Fish Lake, 329, 330 Flagged trees, 106 Flooding, 244,248,250,257-8,275-6,
282 Fluvial morphology, 248 Foehn, 28,29 Fog, 29,30,37,41,56,77,91 Foliar nutrients, 161-2,166, 171 Forest deterioration, 53, 57 Forest understory, 88,98, 126 Forest zonation, 68, 70, 72, 74, 78 Forest-meadow boundaries, 106 Fossil floras, 6, 7, 13, 80 Freezing nights, 102, 111 Front Range, 66,68-71,333,343 Frost, 11, 29, 50, 93, 126, 184, 185 Frozen soils, 96, 185 Fulvic acid, 306-7,314
Gambel oak, 263 Generalized root systems, 259 Germination, 189, 198-9,253,311 Glaciation, 7,27,48, 54, 330, 333 Global warming, 323, 354 Goose Creek Range, 4 Gorges, 54, 55 Grass balds, 54, 56 Grassland, 28,47,51,63,65-9, 161,
204,213,254,275,293-9,305-16 Grazing pressure, 190, 211, 217, 225,
255,265 Greasewood, 187-8, 190,221,250,
263,275-6 Great Basin Anticyclone, 22 Great Basin National Park, 14,27,35 Great Salt Lake, 5, 6, 244-7, 250 Great Smoky Mountains, 56 Greenhouse effect, 323 Green Mountain, 53 Green rabbitbrush, 263, 275 Greenhouse gases, 18 Ground surface temperatures, 126 Groundwater flow, 248, 258, 282 Growth efficiency, 123-4
Index
Hackberry, 313 Hail, 35 Halophytes, 188, 207 Hart Mountain, 4 Harvey Lake, 5 Haze, 29,31 Hemlock, 52, 54, 62, 80-3 Herbaceous plants, 65,97,109, 120,
129, 160,251 Herbivores, 56, 299, 304 High barometric pressure, 20, 22 High elevation larch, 62 Holocene, 56, 327, 330 Honey Lake, 5 Horsebrush, 276 Hot Creek Range, 4 Hot desert, 184 House Range, 4 Human impacts, 31,37,54, 182,227 Humboldt River, 2, 75 Humic acids, 306,314,315 Humins, 306,307,314 Hunter-gatherer cultures, 7, 9, 12 Hurricanes, 35,51 Hydraulic conductivity, 164, 252 Hydraulic lift, 260, 272-5 Hydrocarbon vapor, 31, 36 Hydrogen sulfide, 36 Hydrologic circulation, 247 Hydrologic closure, 246, 282 Hydrologic cycle, 258 Hydrological characteristics, 249, 324 Hydrothermal alteration, 145 Hypostomatous plants, 109 Ice crystals, 96 Idaho fescue, 259 Insolation, 26,28,89,95, 104, 108,
112, 119, 121, 126 Incense cedar, 79 Inceptisols, 42 Independence Mountains, 4, 74 Indian ricegrass, 259 Indicator plants, 278, 280, 281 Infiltration, 12,212,251-8,271,282 Interspaces, 251-6,280-1 Intercellular C~, 95,130, 173,207-8,
214,295-8 Interference, 256, 278 Interior drainage, 325 Intertropical convergence zone, 20 Ironwood, 313
Irrigation, 13, 222 Jarbridge Mountain, 4 Jeffrey pine, 79,81 Jet stream, 20, 334 Junegrass, 259 Juniper, 1,6-7,28,65,68-78, 144-5,
149,152,255,263,328,331-2, 337,342
Kampfzone, 96 Klamath Mountains, 80 Krummholz, 27,51,61,68,80,96,98,
104, 105, 106 Lahontan Basin, 5,144,333,334 Lahontan Reservoir, 5, 12 Lake Albert, 5 Lake Bonneville, 6 Lake Chewaucan, 340 Lake Cleveland, 330 Lake level, 328, 333-6, 340 Lake Tahoe, 5, 34-5 LANDSAT, 36, 336-7 Lapse rate, 28, 90, 113 Laramie Mountains, 58, 64-8 Larch, 52,61,83 Lassen, 81 Lateral extent of roots, 263 Lateral root elongation, 270 Latitudinal gradients, 48 Leaf anatomy, 108 Leaf area, 97, 104, 109, 120, 123-4,
153,157,164,171,192-4,266 Leaf clustering, 112 Leaf conductance, 101, 109, 114, 154,
171,204,207-9,212 Leaf desiccation, 96 Leaf morphology, 105, 195 Leaf mortality, 96, 104 Leaf necrosis, 97 Leaf nitrogen, 104, 108, 164, 171,299 Leaf reflectance, 195 Leaf surface wetness, 93 Leaf temperature, 91,93, 102, 114-15,
118,126,195,207-8,213 Leaf thickness, 104, 108, 195, 197 Leaf to air vapor pressure difference,
90-1, 100-3, 108, 112-21, 126, 130,208
Leakage from roots, 273 Leviathan Ranges, 78 Lewis Range, 62, 63 Lichen, 254-7
Index
Light saturation, 108, 121,213 Lightning, 35, 59, 65-8
369
Limber pine, 62-6, 70, 74-5, 333 Liquid-phase water movement, 256 Livestock, 190 Lodgepole pine, 58,61-7,70,72,79-
80 Longwave radiation, 91, 126, 184 Longitudinal gradients, 48 Low-level wind patterns, 25 Lupine, 260
Macmillan Pass, 61 Macroclimatic signals, 343 Macrogradients, 48,49 Magnolia, 54, 55 Malheur Lake, 5 Maple, 52, 54, 73 Matric potential gradient, 256 Maximum rooting depth, 259-62 Meadow species, 50, 106 Mean annual precipitation, 31, 32, 55,
82, 163 Mean relative humidity, 71 Mechanical damage, 27, 96 Medicine Bow, 58, 65-8 Medusahead, 269, 279 Mesogradients, 49 Mesophyll cell area, 105 Mesophyll efficiency, 108 Mesquite, 188 Microclimate, 28,89,94, 108, 131,
150,158,209,211,215,226,311 Microfossils, 327 Microgradients, 50 Microphytes, 251-4,282 Microphytic crusts, 253, 254, 255, 257,
258 Microscale mapping, 281 Microsites, 89, 94, 108-9, 126, 132,
251-2 Middens, 7,327-333,338-9,344 Migration, 18, 38, 48, 60, 80, 343 Milk-vetch, 260 Mineralization, 165,274 Miocene, 6, 73, 145,244 Mixed mesophytic forests, 55 Mogollon Rim, 72 Moisture surplus, 184 Mojave Deserts, 181, 183-4, 191, 194
370
Monitor Range, 4 Monsoonal precipitation, 183 Montane forests, 60-1, 67, 75, 80, 83,
143-5,152 Mormon tea, 263 Mortality, 96,98,131-2, 191, 198,283 Moss, 254-5 Mountain brush, 74-6 Mountain mahogany, 75 Mt. Evans, 70 Mt. Mitchell, 51,57 Mt. Rainier, 83 Mt. Rose, 34, 78, 80 Mt. Shasta, 81 Mt. St. Helen's, 211 Mt. Washington, 51,52,54 Mt. Whitney, 28, 78 Mutual shading, 120, 123 Mule's-ears, 260 Mycorrhizae, 268,274,279-281 N20, 18,36 Narrowleaf low rabbitbrush, 276 Needle temperatures, 105, 111-2 Needle-and-thread grass, 259 Negev Desert, 10 Net annual primary productivity, 221 Nevada Test Site, 189,194,330 Nitric acid, 19,36,37 Nitrogen, 19,37,42, 124-5, 149, 161-
71,218,221-6,269,274,278 Nocturnal water recharge, 117 Non-steady-state physiological
responses, 104, 126 North Platte River, 66, 68 Northern red oak, 52, 55 Nutrient use efficiency, 165-73 Nutrients, 41-2,99, 102, 124-5, 143,
145, 151, 161-73, 186,200,206, 221,274-5,279,283,297,299
Oak, 7, 52, 54-5, 73, 79, 153, 313, 337, 345
Ogilvie Mountains, 61 Ohio River Valley, 39 Oligocene, 6 Open woodlands, 56 Optimal water use, 114 Oquirrh Mountain, 4 Orographic effects, 20,27,34,89,247 Osmoregulation, 204, 226 Ostracode valves, 339 Osmotic potentials, 118, 204
Index
Osmotic stress, 257, 299 Owens Valley, 28,75 Owl Canyon, 69 Owyhee River, 5 Oxygen requirement, 275 Oxygen-18, 334, 336 Ozone, 37,38,42, 124,323 Pacific-Northwest, 109 Pah Rah Mountain, 4 Pahute Mesa, 330 Paiute tribe, 13 Paleoclimatic reconstruction, 7, 294,
335,338-9,341-4 Paleoenvironmental indicators, 327,
338,340,343-4,349 Paleohydrology, 333 Paleosols, 303, 305, 308 Palmer Drought Severity Index, 337,
345,347,348,350 Pancake Range, 4 Particulates, 18,19,21 Partial defoliation, 281 Particle size analysis, 307,314,316 Patterned mineral distribution, 206 Patterns of water extraction, 271 Peace River, 57,61,62 Pebble-mound, 9, 10, 12 Penetration of plant roots, 201 Pequop Mountain, 4 Percolation, 41, 251 Perennial forbs, 192, 260, 263 Perennial grasses, 160, 189, 191-2,
257,259-60,263,271,279 Perennial salt crust, 250 Perennial species, 185, 189, 193,218,
222,271 Phenology, 119, 132, 191-5,258,268,
274 Phosphorus, 149-51, 162, 164, 166-70,
269,279-80 Photochemical reactions, 37 Photosynthesis, 90, 93, 95, 100-4, 106,
111-8,121,126-8,154-8,164-73, 181, 186, 195,209,212-15,217, 220,226,278,297,301
Photosynthetic inhibition, 114 Photosynthetic light reactions, 119 Photosynthetic photon flux density,
102, 119,208,274
Photosynthetic potential, 101, 102, 112,118, 124, 129, 164, 171,215, 226
Phreatophytes, 192, 193,200,250 Physical fractionation, 307 Physiognomic relationships, 171 Physiographic setting, 244 Physiological compromises, 161 Physiological costs, 173,217-20,263-8 Phytogeographic boundary, 78 Phytoliths, 303 Pickleweed, 250 Piedmont plains, 244 Pine Nut Range, 4 Pinyon pine, 1,6,28,68-70,73-77,
144-145,149,152,167,255,328, 331,342
Pioneers, 2 Plant water potentials, 117-8, 186,
194,202,205-6,226,272 Plant water status, 103, 114-6, 130 Playa, 6,35, 179,244-51,256-7,282,
309-10,327 Pleistocene, 26,48,54,57,144, 150,
245,251,330-3,335-7,340 Pliocene, 6, 7 Pluvial lakes, 11, 245 Podzols, 56 Pogonip, 30, 77 Pollen, 54, 206, 327-,30, 338-44 Polygonal surface pattern, 251 Ponderosa pine, 63-9,73-5,79,81,83 Poorly-drained soils, 186 Population structure, 161 Population biology, 132, 226 Potable water, 9, 11 Precipitation, 7, 12, 19,20,29,30-41,
49,62,71,75,83,87-90,145,149, 150-1, 154, 182-5, 192-4, 198, 200,210,212,214,221-2,246-7, 257-8,262,264,269,271,275-7, 282-3, 312, 324-49
Pre-Cambrian granite, 66,68 Precipitation, extreme, 277 Prickly lettuce, 260 Productivity, 7, 11,82, 100, 103, 109,
125,158,165,173,190,197,205, 212,220-6,250,258,260,263, 265, 267-8, 275-6, 282, 293-4, 327-8,343
Pubescence, 195
Index 371
Pyramid Lake, 2, 5, 6, 13, 34-5, 244, 334
Quaternary, 6,80,244,331
Rabbitbrush, 262, 275, 276 Radioisotopes, 279, 280, 333 Railroad, 10 Raindrop energy, 254, 257 Rainshadow, 7, 48, 72, 75, 83, 183,
326 Ratio root/shoot, 199-201,282 Ratio root/total plant, 264 Ratio salts/sediment, 250 RAWS, 36, 328, 339 Recruitment, 132, 189, 226 Reabsorbed nutrients, 165 Recharge events, 182, 184, 249, 265 Red maples, 52 Red oak, 52, 55 Red spruce, 53, 55 Reese River, 5 Regional climates, 19 Relative humidity, 29,31,71,89 Remote sensing, 2, 13, 336 Reproductive biology, 132, 199, 226 Reproductive potential, 206 Respiration, 41, 42, 158, 217, 265-8,
307 Response time, 18, 340, 343 Rhizosphere, 273 Rhododendron, 54, 55 Ribbon forest, 51,68, 106 Rime ice, 30 Riparian species, 202 Roan Mountain, 53 Rocky Mountains, 7,21,35,47-8,57-
75,78-80,83,88-9,97, 104, 109, 125,332,343
Rocky Mountain juniper, 68 Root depth, 153, 250, 258-63, 271, 283 Root growth, 124, 186, 193, 202, 204,
220-1,225,251,258,265-71,279, 283
Root hairs, 202, 270, 274 Root hydraulic conductance, 273 Root initiation, 268 Root length density, 258, 260-3, 272-3 Root phenology, 268
372
Root systems, 164, 191, 199,202,258-9,263-8,273,280-3
Root zone, 19, 100 Ruby Mountains, 4, 5, 34, 65, 74-75,
83 Runoff, II, 12, 26, 49, 248, 250, 252,
257-8, 271, 282, 334-5 Russian thistle, 260 Sacramento Mountains, 72 Sacramento Valley, 76,79 Sagebrush, 2,3,6,31,57,67-8,75-6,
79,83, 143-5, 149-55, 161, 167, 181,187-91,209-15,220-5,250, 252-3,256,261-3,270-81,329-30
Salinity, 13, 206, 225, 245-6, 277, 282 Salt flats, 6, 179 Salt glands, 207 Saltbush, 187-90,214,221,262,276 Saltcedar, 188 San Bernardino Mountains, 49, 77, 80 San Francisco Mountain, 49-50, 72 San Gabriel Mountain, 49, 77, 80 San Jacinto Mountain, 77, 80 San Juan Mountains, 72 Sand dunes, 25, 27 Sangre de Cristo, 68, 70 Santa Lucia fir, 80 Santa Lucia Mountains, 80 Santa Rosa Mountains, 4 Savannas, 293-4, 308-9, 312 Scale problems, 1,10,21,27,32-3,90,
212,251-2,276,324,354 Schell Creek Range, 4 Sclerophyllous leaves, 170 Seasonal precipitation, 182, 342 Sedimentary rocks, 64, 65, 66, 186 Sediments, I, 244, 246, 248-50, 258,
282,327,340 Seedling establishment, 36, 132, 158,
161,199,226,310,311 Seedlings, 94, 132, 147, 154, 158-62,
169,191,199,253-4,269,279, 310
Serpentine communities, 150 Sevier Lake and River, 5 Sex and plant distribution, 206 Shade acclimation and tolerance, 117,
215 Shadscale, 181,187-8,250,262-71,
275-6 Sheep Mountain, 66
Index
Sheep Range, 4 Shell Creek, 74 Sherman Formation, 66 Shoshone Range, 4, 74 Shrub die-off, 276-7 Shrubs, 7,10, 14,56,57,79,99,111,
129,145-7,151-65,169-73, 181, 184,187,190-95,204-7,211,225, 251,257,260-5,270-1,274-7, 280-1,301-2,308,311-2,343
Sierra Madre, 58, 72, 162 Sierra Nevada, 2-3,6-7,13,25,27,29,
31,34-35,39-42,47-8,62,72-83, 88-9, 109, 143-73, 179, 183,202, 221,243,325-6,334,337,343
Sierran uplift, 3 Silhouette-to-totalleaf area, 123 Silver fir, 82 Silverbell, 55 Single-needle pinyon, 74 Siskiyou Mountains, 81 Smog, 30, 70, 76, 80 Snake Range, 4, 27, 74, 75 Snake River, 5, 57, 80, 325 SNOTEL, 36,328,339 Snow abrasion, 90, 105 Snow drifts, 26, 49, 71, 83 Snowpack, 35,78,83,96-100, 104,
106,112,114,126,247 Snowstorms, 22, 34 S02, 36-38 Soil biological system, 41 Soil carbonate, 303, 308 Soil chemistry, 145, 149 Soil cracks, 251 Soil crust, 243, 256 Soil horizons, 307 Soil hydrologic properties, 251 Soil moisture, 31,71,89,151, 153-4,
160-1, 173, 193-4, 198-207,210-14,226,256,258,262,265,271, 278,282-3,299,343-7
Soil organic matter, 294,303-8,312-16
Soil oxygen, 186 Soil profile, 202,210-12,217,259,
271,275,304 Soil structural characteristics, 200,
253 Soil surface evaporation, 256 Soil surface saturation, 253
Soil surface types, 251 Soil temperature, 36,50,71,89, 101-
3, 112-4, 126, 165, 184-5, 193, 209,220,222,268-9,283
Soil water extraction, 202,210-11, 278-9
Soil water status, 115, 130,209,214-15,274,278
Soils, 10,42,56,65,69,90,96, 143, 145,149, 150, 153-4, 160-1, 165, 169, 182, 184-88,201-2,206-7, 214,251-4,257,263,265-71,275, 276-83,305,311-14,327
Solar radiation, 18,36,48, 78, 87, 90-1, 108, 112-14, 121-3, 185, 195, 207,212-13,257,324
Solar tracking, 213 Sonoran Desert, 181, 194, 198,200,
204 Spatial distribution patterns, 189 Spatial variability, 18,251 Specialized root systems, 259 Specific absorption rate, 169 Specific leaf area, 104 Speleothems, 335 Spiny hopsage, 262, 276 Splash erosion, 254-5 Spruce, 4, 49, 53-63, 66-73, 80-83, 94,
100, 106,342 Squirrel tail, 253, 254, 259 Stable isotopes, 106, 160,294-5,316 Stable isotopic composition, 106, 160,
218, 304, 334-5 Stand architecture, 103 Stansbury Mountains, 4 Steens Mountains, 4, 329, 330 Stem photosynthesis, 217 Stillwater Range, 4 Stomatal conductance of stems, 207 Stomatal conductance, 91,95, 101-3,
108-9,111-120,123,127-8,154-6, 160,164,171,207-12,217,297
Stomatal density, 93, 109 Stomatal threshold, 117,156,198,257 Streambank wheatgrass, 207,211,259 Streamflow, 248, 282, 334, 344 Subalpine fir, 62-70,74,83, 104 Subalpine conifer forest, 61 Subalpine conifer woodland, 330, 332 Subalpine forests, 30,47,56,59-64,
70-5, 79-83, 94, 100-5, 125
Index
Subalpine meadows, 57, 79 Subsurface flow, 248, 262 Successional change, 186 Succulents, 191-2 Sugar pine, 81 Sulfuric acid, 19,36,37, 145
373
Sulfur and nitrogen oxides, 19,42 Summer drought, 87, 225, 275 Summer growth period, 93, 96, 100,
112, 126 Summer Lake, 5 Summit Lake, 61 Sunflecks/ sunpatches, 94-5, 98, 129 Sunlight penetration, 87, 94-5, 125 Surface albedo, 123 Survival, 13, 87, 90, 96, 98, 105, 181,
184,189,226,260,276,278 Sweet buckeye, 55 Sweetwater Mountains, 4, 75, 78 Synoptic scale climate, 21,264,336
Tahoe Basin, 73,79,81 Taiga, 52-3, 58-60, 83 Tamaulipan Biotic Province, 308 Tanana lowlands, 60 Tehachapi Pass, 77 Temperature optima, 108, 111,209,
213,300 Temperature acclimation, 213 Temperature tolerance of
photosynthesis, 195 Tephra, 335 Tertiary, 6, 66, 80 Terminal moraines, 54 Terrestrial radiation, 28 Tetons, 51,57,64, 74 Thermal forcing, 27 Thorn woodland, 308 Thunderstorms, 22, 65-6, 78, 244 Timberline, 27,48,50-4,60-70,79-83,
87,96,98,102-6,111,118,131 Toana Mountain, 4 Toiyabe Range, 4, 76 Tonopah Lows, 34 Topography, 20,27,49,54,93-4,98,
131,181,184,246-7 Toquima Range, 4 Tornados, 22 Torrey seepweed, 250
374
Transpiration, 89-94, 108-9, 115, 121, 125-6, 154, 158, 171, 197,202, 207,210,212,218,224,257-8, 272-4
Tree islands, 143, 150, 161 Tree-ring analysis, 327 Trinity Alps, 80 Truchas Peak, 70 Truckee discharge, 353 Truckee River, 5 Tule Springs, 327,330 Tulip tree, 54, 55 Tundra, 49, 51, 71 Turgor, 117, 164,204,225 Tussock grass, 259,277,278,280
Uintas, 58, 65 Ultisols, 42 Unakas, 56 Unsuberized roots, 276 Utah juniper, 74, 331 Utah Lake, 5-6 Utah serviceberry, 262 UV-B radiation, 123,124
Variability in precipitation, 32,247, 343
Vegetational zonation, 13,48,50-53, 59,63,67,69,72-7,81
Vesicle formation mechanisms, 252 Vesicular horizons, 252-3,256 Vesicular porosity, 251-3,282 Virga, 33 Virginia Mountains, 74-5, 78, 145,
147,152-3 Visibility, 17,30,31 Volcanic activity, 3, 18, 31, 58, 81,
154,186,331,335
Wah Wah Range, 4 Walker Lake, 5, 192,244,340 Warm precipitation, 334 Warm storms, 34 Wasatch Range, 2,3,58,72-73,247,
325 Wassuk Mountains, 4
Index
Water availability, 115, 117, 120, 153-4,160,165,204,206,209-10,215, 221,249,262,299,334,353
Water leakage from roots, 273 Water potential, 94, 102, 130, 152-9,
173, 194-7,200,203-5,225,272, 274-5,277
Water relations, 97, 99, 106, 112, 114, 118-9, 125-6, 129, 151, 181, 186, 200,204-7,225,273,275
Water storage capacity, 102, 153, 247 Water stress, 93, 95, 97, 102, 108-9,
116, 118, 129, 132, 158, 191,204-5,209-10,215,274,297,299,300
Water uptake and transport, 271-3, 278
Water uptake effectiveness, 273, 283 Water vapor gradients, 159, 207, 209,
210,213 Water-use efficiency, 115, 123, 125,
128-9, 151, 158-9, 161, 171-3, 217,223,225-6,294,296,299
Water-use strategy, 129 Waterlogging, 276 Welded tuff, 331 Westerlies, 22, 25 Western hemlock, 62, 82, 83 Western larch, 83 Western Pluvial Lakes Tradition, 11 Western red cedar, 62, 82 Western wheatgrass, 314 Wet deposition, 37, 38, 39, 42 Wettable leaf surfaces, 93 Wheatgrasses, 266, 268, 273, 280, 301 Wheeler Peak, 27 White fir, 70, 75 White Mountain Peak, 28 White Mountains, 28,51,53,56,60,
75,77,104 White Pine, 4, 52, 54, 74, 79, 332 White spruce, 52, 59-62 Whitebark pine, 62-5, 74, 79, 83 Wild cherry, 55 Wild game, 12 Wildfires, 191 Wildhorse Lakes, 330 Willow, 188 Wilsons Creek Range, 4 Wilting, 97, 129 Wind penetration, 94 Wind River, 57, 65

Wind stress, 27,50 Wind-sheltering, 98 Winter desiccation tolerance, 97 Winter dormancy, 111, 225 Winter drought, 87 Winter root growth, 269 Winter-green leaves, 218-9 Winterfat, 262, 265, 270-1, 276, 305 Wisconsinan, 47,54 Woodrat middens, 328,331,337-8 Woody perennials, 161, 199,204,294 Woolly aphid, 56
Xylem pressure potential, 97, tOO, 102, 116-8, 128
Yellowstone, 64
Index 375
Related Documents