Coordinated Public Transit-Human Services Transportation Plan for NYMTC Region Final NEW YORK METROPOLITAN TRANSPORTATION COUNCIL LOWER HUDSON VALLEY Page 5-1 Chapter 5. Demographic Profile Lower Hudson Valley North of New York City, the Lower Hudson Valley (LHV) subregion of Rockland, Westchester, and Putnam counties straddles the Hudson River. Rockland borders New Jersey, while Westchester’s south border touches the Bronx. Population – This subregion has the lowest population of the three subregions at 1.3 million, and covers a total area of 838 square miles. The area grew by 3.2 percent from 2000 to 2007, just a tenth of a percentage slower than NYC’s growth. The subregion contains six cities, all of which are located in Westchester, in addition to 30 towns and 50 villages. Changes in Population – In the year 1900, the LHV contained approximately 236,300 people – greater than the combined populations of Queens and Staten Island at the time. The region grew by 48 percent from 1920 to 1930, surpassing the half million mark, and reached 1 million residents by 1970. Growth then slowed considerably during the next few decades. Figure 5-1 Population Change by County – LHV 2000 2007 Change % Change Putnam 95,745 99,489 3,744 3.8% Rockland 286,753 296,483 9,730 3.3% Westchester 923,459 951,325 27,866 2.9% LHV 1,305,957 1,347,297 41,340 3.1% Source: Census 2000 Population Density –LHV has the lowest population density of the three subregions, at 1,608 persons per square mile in 2007, based on the subregion’s 838 square miles of land. This is still substantially higher than New York State’s population density of 409. Population Age – At 37.5 years, the LHV’s median age is three years higher than NYC’s and 1.6 years higher than New York State’s median. Older adults make up 13 percent of the population and 18-64 year-olds, 61 percent. Income – With a median income of $67,944, the LHV surpasses the state average by more than $24,500. The subregion contains nearly 173,000 persons with low income, comprising 13 percent of the population. In comparison, the nation as a whole has 20 percent low income residents and NYC has 30 percent. Employment – Nearly 50 percent of the subregion’s citizens are in the labor force, which is comparable to state and national numbers. The area has the highest percentage of people working in management, professional, and related occupations at 45 percent. Sales and office jobs employ 26 percent of residents and the service industry, 14 percent. Administrative Divisions – New York State has a unique method for dividing up its counties into municipalities. Within each county, residents may live in a city, town, or village. Instead of

Welcome message from author
This document is posted to help you gain knowledge. Please leave a comment to let me know what you think about it! Share it to your friends and learn new things together.
Transcript
Coordinated Public Transit-Human Services Transportation Plan for NYMTC Region Final
N E W Y O R K M E T R O P O L I T A N T R A N S P O R T A T I O N C O U N C I L L O W E R H U D S O N V A L L E Y
Page 5-1
Chapter 5. Demographic Profile Lower Hudson Valley North of New York City, the Lower Hudson Valley (LHV) subregion of Rockland, Westchester, and Putnam counties straddles the Hudson River. Rockland borders New Jersey, while Westchester’s south border touches the Bronx.
Population – This subregion has the lowest population of the three subregions at 1.3 million, and covers a total area of 838 square miles. The area grew by 3.2 percent from 2000 to 2007, just a tenth of a percentage slower than NYC’s growth. The subregion contains six cities, all of which are located in Westchester, in addition to 30 towns and 50 villages.
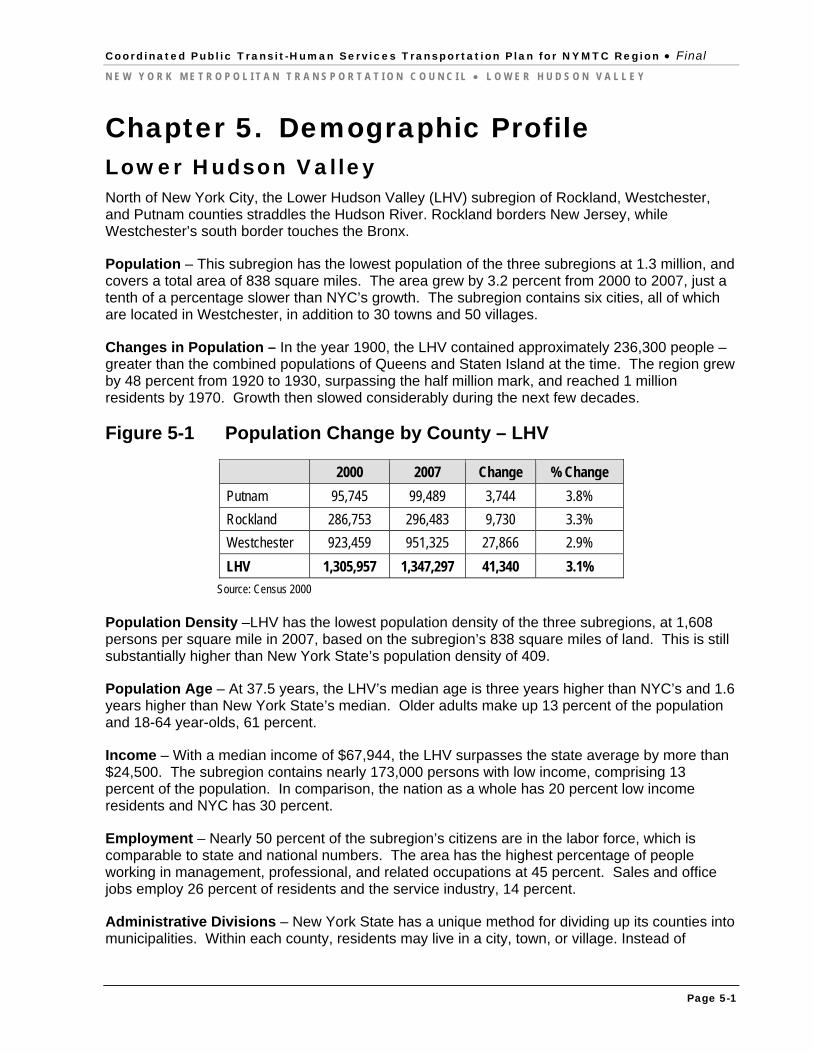
Changes in Population – In the year 1900, the LHV contained approximately 236,300 people – greater than the combined populations of Queens and Staten Island at the time. The region grew by 48 percent from 1920 to 1930, surpassing the half million mark, and reached 1 million residents by 1970. Growth then slowed considerably during the next few decades.
Figure 5-1 Population Change by County – LHV
2000 2007 Change % Change
Putnam 95,745 99,489 3,744 3.8%
Rockland 286,753 296,483 9,730 3.3%
Westchester 923,459 951,325 27,866 2.9%
LHV 1,305,957 1,347,297 41,340 3.1%
Source: Census 2000
Population Density –LHV has the lowest population density of the three subregions, at 1,608 persons per square mile in 2007, based on the subregion’s 838 square miles of land. This is still substantially higher than New York State’s population density of 409.
Population Age – At 37.5 years, the LHV’s median age is three years higher than NYC’s and 1.6 years higher than New York State’s median. Older adults make up 13 percent of the population and 18-64 year-olds, 61 percent.
Income – With a median income of $67,944, the LHV surpasses the state average by more than $24,500. The subregion contains nearly 173,000 persons with low income, comprising 13 percent of the population. In comparison, the nation as a whole has 20 percent low income residents and NYC has 30 percent.
Employment – Nearly 50 percent of the subregion’s citizens are in the labor force, which is comparable to state and national numbers. The area has the highest percentage of people working in management, professional, and related occupations at 45 percent. Sales and office jobs employ 26 percent of residents and the service industry, 14 percent.
Administrative Divisions – New York State has a unique method for dividing up its counties into municipalities. Within each county, residents may live in a city, town, or village. Instead of
Coordinated Public Transit-Human Services Transportation Plan for NYMTC Region Final
N E W Y O R K M E T R O P O L I T A N T R A N S P O R T A T I O N C O U N C I L L O W E R H U D S O N V A L L E Y
Page 5-2
classifying land areas based on their population or geographic size, in New York State the citizens decide what type of government they want, which then must be approved by the state legislature. Thus in many cases cities have a population smaller than the largest village, and 150 of the state’s 662 villages have population higher than the smallest city. Cities have the most autonomy, providing all of their own services to residents, while towns have a town board rather than an executive branch. City and town boundaries do not cross one another, nor do towns or cities ever cross county boundaries. Villages, on the other hand, may be wholly contained within a town or may cross town boundaries. In addition, hamlets consist of unincorporated areas that are not part of a village and have no legal status.1
Therefore, subsequent analysis utilized two methods to understand target populations in the LHV. The maps show population number and density by town and city. Accompanying tables show the top density and number for each target population by town/city and by village. Since villages occur within towns and sometimes cross town boundaries, these numbers tell different stories of the population distribution. In a few cases, like Scarsdale, the town and village boundaries are the same. Other times, villages like Briarcliff Manor straddle two towns – Ossining and Mount Pleasant. The overall LHV needs for all three counties are shown in two maps: the first at the town and city level, and the second at the village level. Village boundaries are shown in Figure 5-2 below.
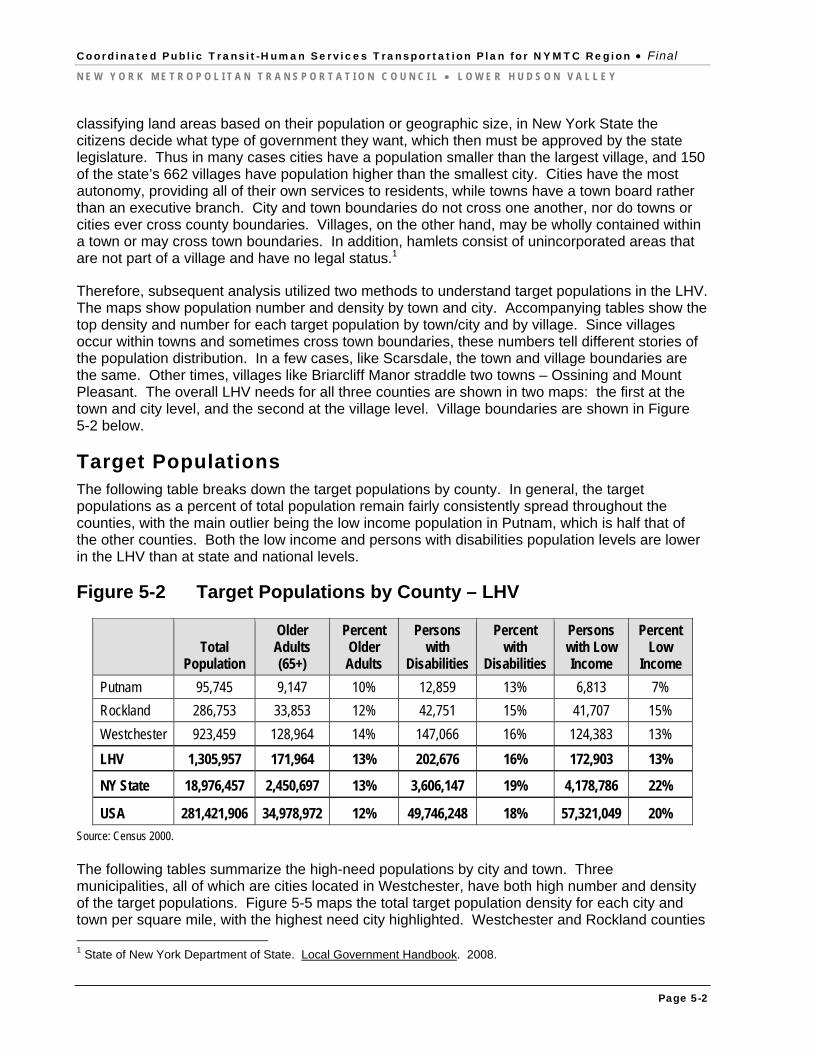
Target Populations The following table breaks down the target populations by county. In general, the target populations as a percent of total population remain fairly consistently spread throughout the counties, with the main outlier being the low income population in Putnam, which is half that of the other counties. Both the low income and persons with disabilities population levels are lower in the LHV than at state and national levels.
Figure 5-2 Target Populations by County – LHV
Total
Population
Older Adults (65+)
Percent Older Adults
Persons with
Disabilities
Percent with
Disabilities
Persons with Low Income
Percent Low
Income
Putnam 95,745 9,147 10% 12,859 13% 6,813 7%
Rockland 286,753 33,853 12% 42,751 15% 41,707 15%
Westchester 923,459 128,964 14% 147,066 16% 124,383 13%
LHV 1,305,957 171,964 13% 202,676 16% 172,903 13%
NY State 18,976,457 2,450,697 13% 3,606,147 19% 4,178,786 22%
USA 281,421,906 34,978,972 12% 49,746,248 18% 57,321,049 20%
Source: Census 2000.
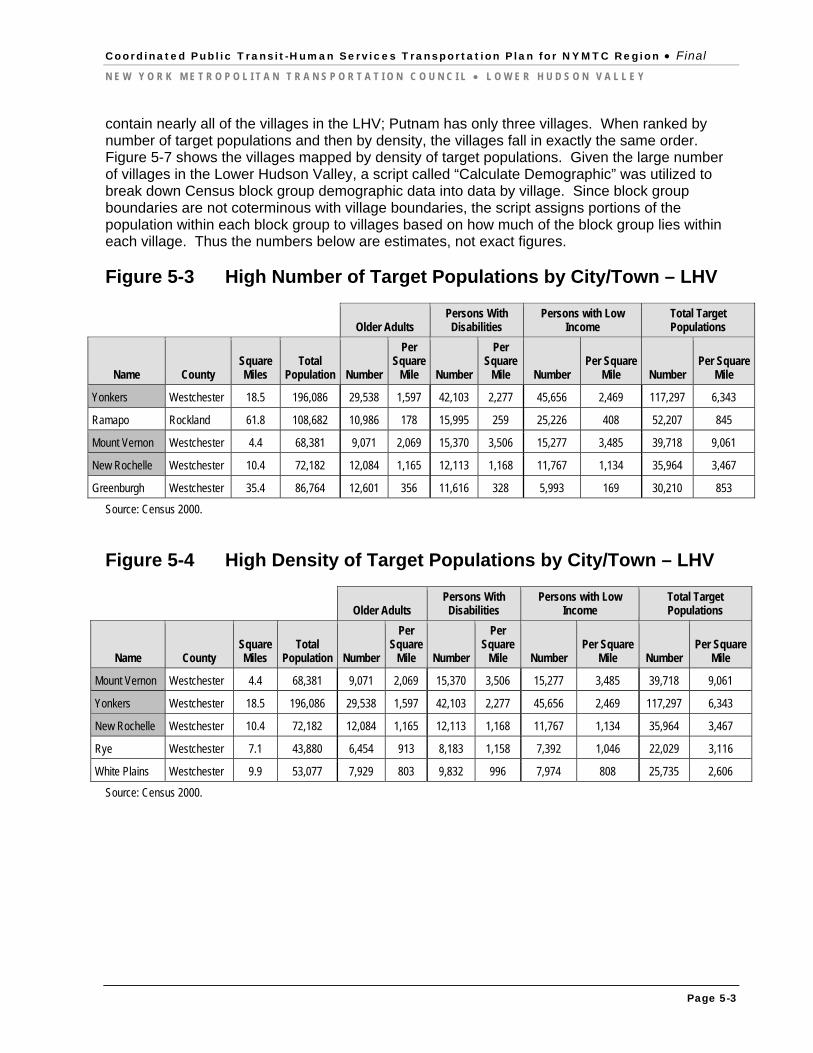
The following tables summarize the high-need populations by city and town. Three municipalities, all of which are cities located in Westchester, have both high number and density of the target populations. Figure 5-5 maps the total target population density for each city and town per square mile, with the highest need city highlighted. Westchester and Rockland counties 1 State of New York Department of State. Local Government Handbook. 2008.
Coordinated Public Transit-Human Services Transportation Plan for NYMTC Region Final
N E W Y O R K M E T R O P O L I T A N T R A N S P O R T A T I O N C O U N C I L L O W E R H U D S O N V A L L E Y
Page 5-3
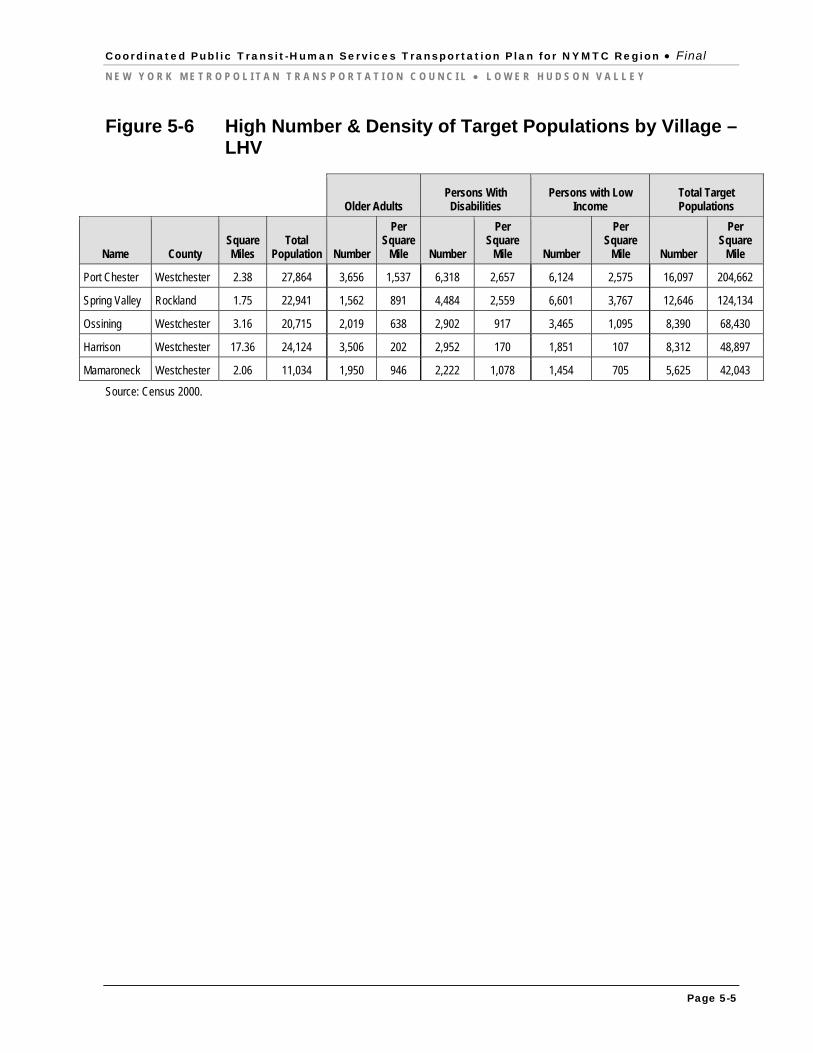
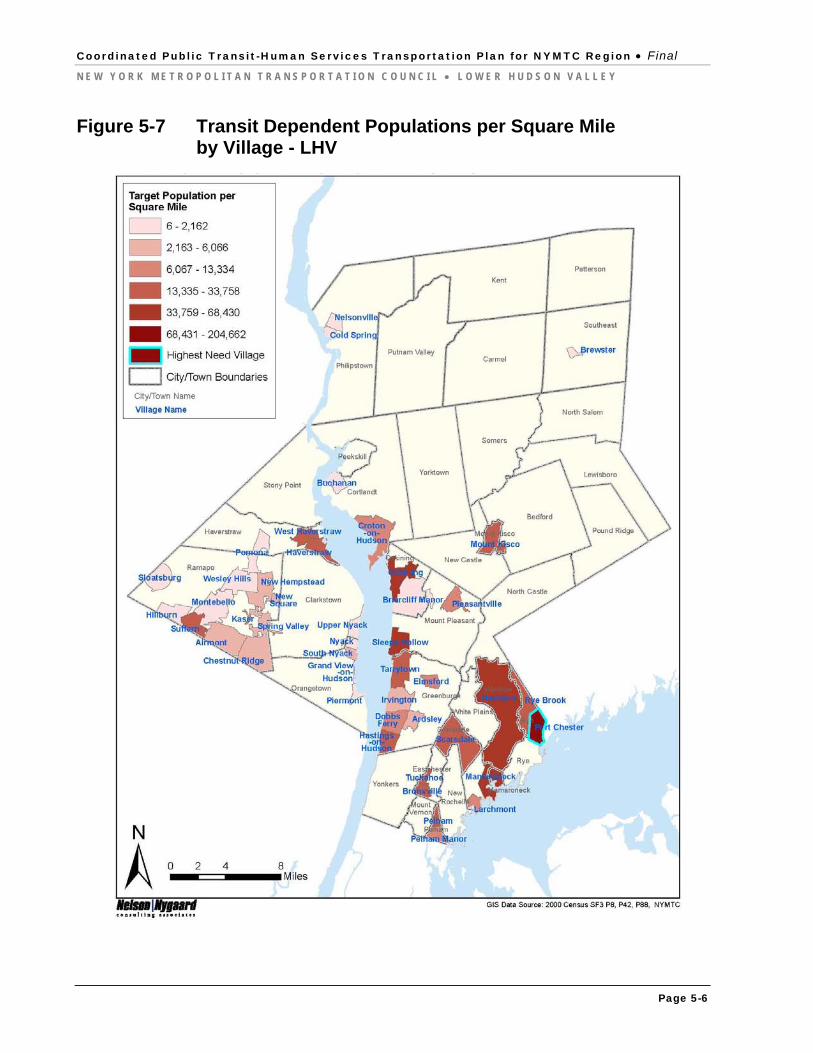
contain nearly all of the villages in the LHV; Putnam has only three villages. When ranked by number of target populations and then by density, the villages fall in exactly the same order. Figure 5-7 shows the villages mapped by density of target populations. Given the large number of villages in the Lower Hudson Valley, a script called “Calculate Demographic” was utilized to break down Census block group demographic data into data by village. Since block group boundaries are not coterminous with village boundaries, the script assigns portions of the population within each block group to villages based on how much of the block group lies within each village. Thus the numbers below are estimates, not exact figures.
Figure 5-3 High Number of Target Populations by City/Town – LHV
Older Adults Persons With Disabilities
Persons with Low Income
Total Target Populations
Name County Square Miles
Total Population Number
Per Square
Mile Number
Per Square
Mile Number Per Square
Mile Number Per Square
Mile
Yonkers Westchester 18.5 196,086 29,538 1,597 42,103 2,277 45,656 2,469 117,297 6,343
Ramapo Rockland 61.8 108,682 10,986 178 15,995 259 25,226 408 52,207 845
Mount Vernon Westchester 4.4 68,381 9,071 2,069 15,370 3,506 15,277 3,485 39,718 9,061
New Rochelle Westchester 10.4 72,182 12,084 1,165 12,113 1,168 11,767 1,134 35,964 3,467
Greenburgh Westchester 35.4 86,764 12,601 356 11,616 328 5,993 169 30,210 853
Source: Census 2000.
Figure 5-4 High Density of Target Populations by City/Town – LHV
Older Adults Persons With Disabilities
Persons with Low Income
Total Target Populations
Name County Square Miles
Total Population Number
Per Square
Mile Number
Per Square
Mile Number Per Square
Mile Number Per Square
Mile
Mount Vernon Westchester 4.4 68,381 9,071 2,069 15,370 3,506 15,277 3,485 39,718 9,061
Yonkers Westchester 18.5 196,086 29,538 1,597 42,103 2,277 45,656 2,469 117,297 6,343
New Rochelle Westchester 10.4 72,182 12,084 1,165 12,113 1,168 11,767 1,134 35,964 3,467
Rye Westchester 7.1 43,880 6,454 913 8,183 1,158 7,392 1,046 22,029 3,116
White Plains Westchester 9.9 53,077 7,929 803 9,832 996 7,974 808 25,735 2,606
Source: Census 2000.

Coordinated Public Transit-Human Services Transportation Plan for NYMTC Region Final
N E W Y O R K M E T R O P O L I T A N T R A N S P O R T A T I O N C O U N C I L L O W E R H U D S O N V A L L E Y
Page 5-4
Figure 5-5 Transit Dependent Populations per Square Mile by City/Town - LHV
Coordinated Public Transit-Human Services Transportation Plan for NYMTC Region Final
N E W Y O R K M E T R O P O L I T A N T R A N S P O R T A T I O N C O U N C I L L O W E R H U D S O N V A L L E Y
Page 5-5
Figure 5-6 High Number & Density of Target Populations by Village – LHV
Older Adults Persons With Disabilities
Persons with Low Income
Total Target Populations
Name County Square Miles
Total Population Number
Per Square
Mile Number
Per Square
Mile Number
Per Square
Mile Number
Per Square
Mile
Port Chester Westchester 2.38 27,864 3,656 1,537 6,318 2,657 6,124 2,575 16,097 204,662
Spring Valley Rockland 1.75 22,941 1,562 891 4,484 2,559 6,601 3,767 12,646 124,134
Ossining Westchester 3.16 20,715 2,019 638 2,902 917 3,465 1,095 8,390 68,430
Harrison Westchester 17.36 24,124 3,506 202 2,952 170 1,851 107 8,312 48,897
Mamaroneck Westchester 2.06 11,034 1,950 946 2,222 1,078 1,454 705 5,625 42,043
Source: Census 2000.
Coordinated Public Transit-Human Services Transportation Plan for NYMTC Region Final
N E W Y O R K M E T R O P O L I T A N T R A N S P O R T A T I O N C O U N C I L L O W E R H U D S O N V A L L E Y
Page 5-6
Figure 5-7 Transit Dependent Populations per Square Mile by Village - LHV
Coordinated Public Transit-Human Services Transportation Plan for NYMTC Region Final
N E W Y O R K M E T R O P O L I T A N T R A N S P O R T A T I O N C O U N C I L L O W E R H U D S O N V A L L E Y
Page 5-7
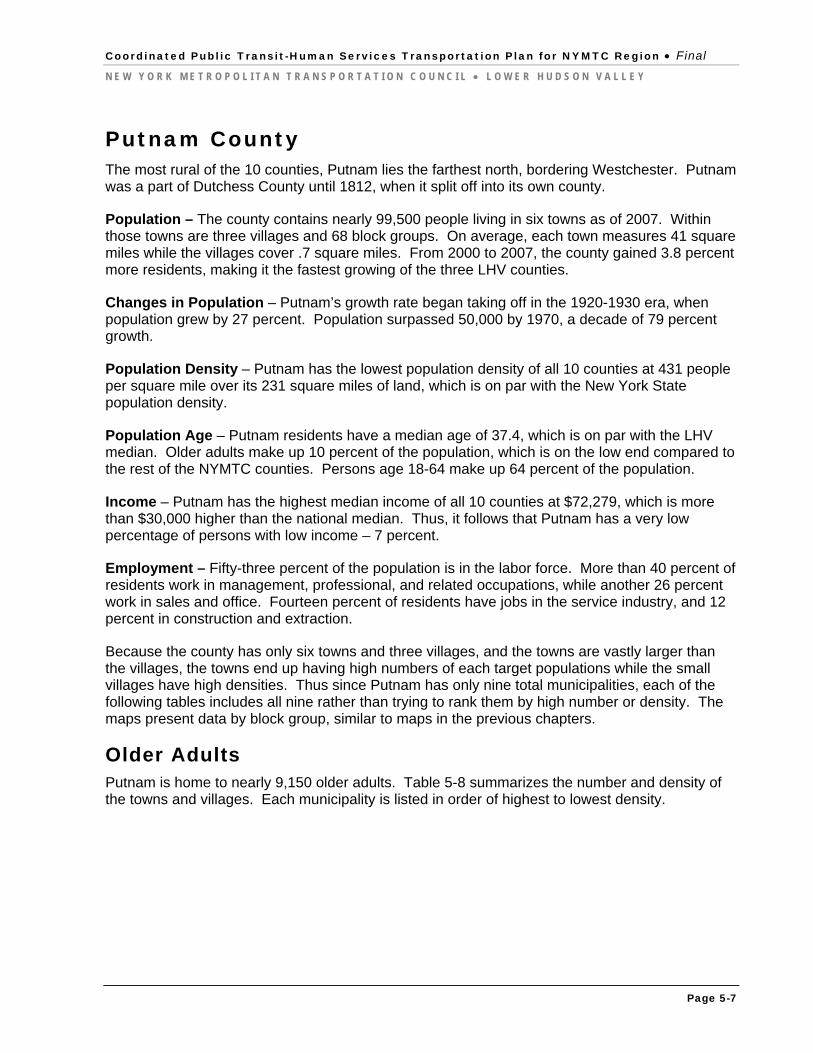
Putnam County The most rural of the 10 counties, Putnam lies the farthest north, bordering Westchester. Putnam was a part of Dutchess County until 1812, when it split off into its own county.
Population – The county contains nearly 99,500 people living in six towns as of 2007. Within those towns are three villages and 68 block groups. On average, each town measures 41 square miles while the villages cover .7 square miles. From 2000 to 2007, the county gained 3.8 percent more residents, making it the fastest growing of the three LHV counties.
Changes in Population – Putnam’s growth rate began taking off in the 1920-1930 era, when population grew by 27 percent. Population surpassed 50,000 by 1970, a decade of 79 percent growth.
Population Density – Putnam has the lowest population density of all 10 counties at 431 people per square mile over its 231 square miles of land, which is on par with the New York State population density.
Population Age – Putnam residents have a median age of 37.4, which is on par with the LHV median. Older adults make up 10 percent of the population, which is on the low end compared to the rest of the NYMTC counties. Persons age 18-64 make up 64 percent of the population.
Income – Putnam has the highest median income of all 10 counties at $72,279, which is more than $30,000 higher than the national median. Thus, it follows that Putnam has a very low percentage of persons with low income – 7 percent.
Employment – Fifty-three percent of the population is in the labor force. More than 40 percent of residents work in management, professional, and related occupations, while another 26 percent work in sales and office. Fourteen percent of residents have jobs in the service industry, and 12 percent in construction and extraction.
Because the county has only six towns and three villages, and the towns are vastly larger than the villages, the towns end up having high numbers of each target populations while the small villages have high densities. Thus since Putnam has only nine total municipalities, each of the following tables includes all nine rather than trying to rank them by high number or density. The maps present data by block group, similar to maps in the previous chapters.
Older Adults Putnam is home to nearly 9,150 older adults. Table 5-8 summarizes the number and density of the towns and villages. Each municipality is listed in order of highest to lowest density.
Coordinated Public Transit-Human Services Transportation Plan for NYMTC Region Final
N E W Y O R K M E T R O P O L I T A N T R A N S P O R T A T I O N C O U N C I L L O W E R H U D S O N V A L L E Y
Page 5-8
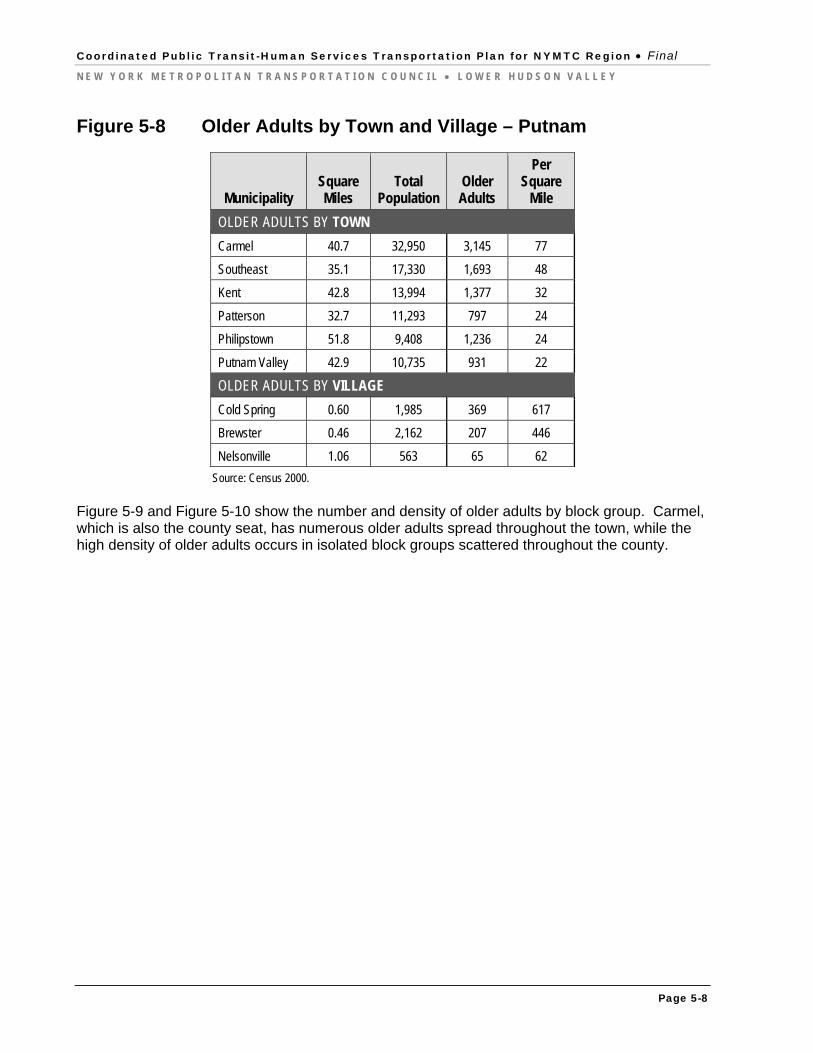
Figure 5-8 Older Adults by Town and Village – Putnam
Municipality Square Miles
Total Population
Older Adults
Per Square
Mile
OLDER ADULTS BY TOWN
Carmel 40.7 32,950 3,145 77
Southeast 35.1 17,330 1,693 48
Kent 42.8 13,994 1,377 32
Patterson 32.7 11,293 797 24
Philipstown 51.8 9,408 1,236 24
Putnam Valley 42.9 10,735 931 22
OLDER ADULTS BY VILLAGE
Cold Spring 0.60 1,985 369 617
Brewster 0.46 2,162 207 446
Nelsonville 1.06 563 65 62
Source: Census 2000.
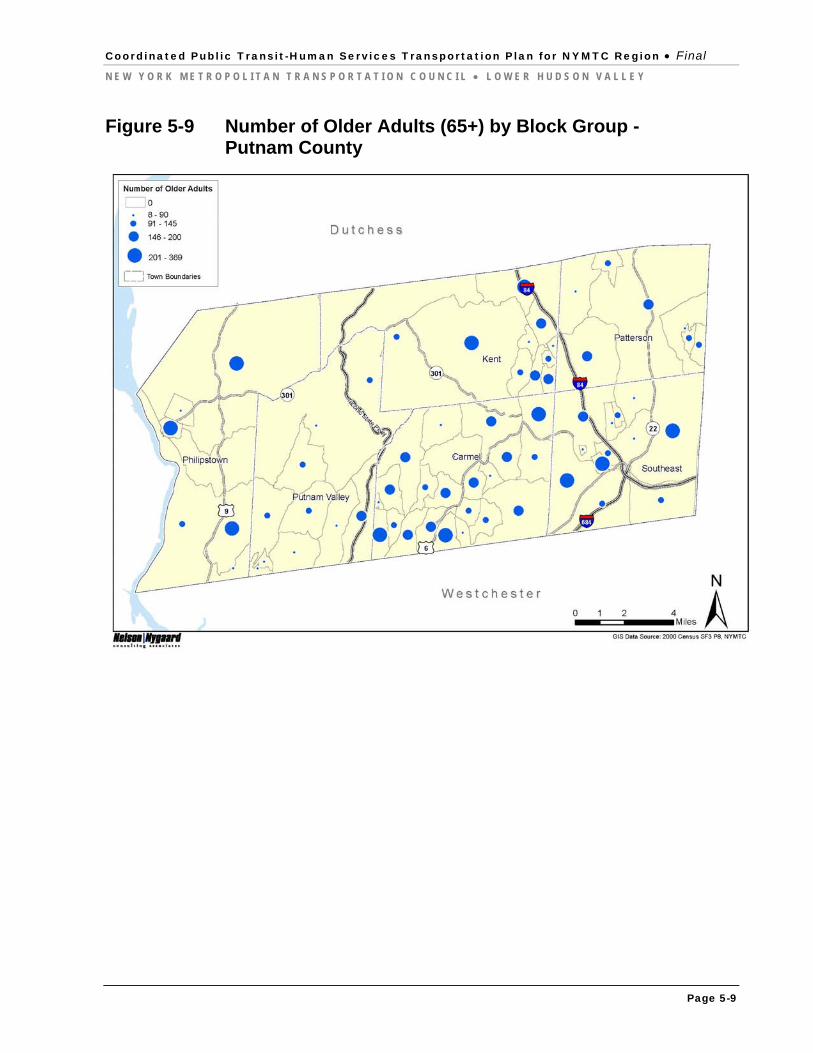
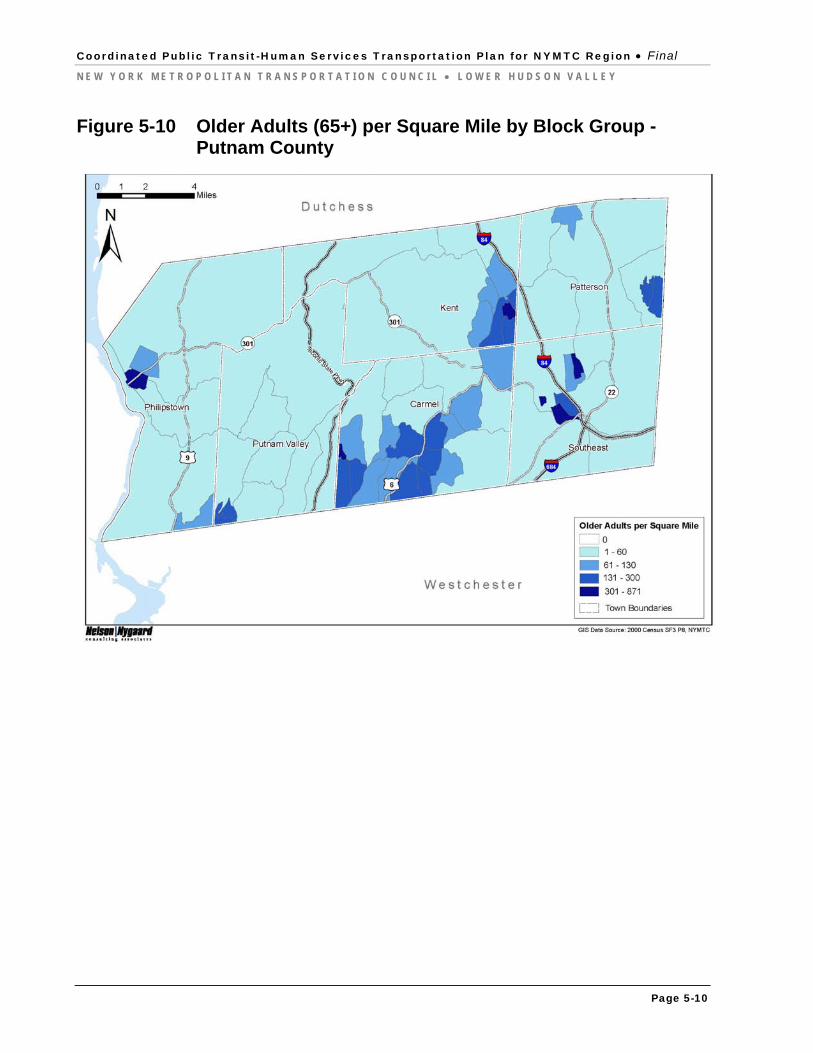
Figure 5-9 and Figure 5-10 show the number and density of older adults by block group. Carmel, which is also the county seat, has numerous older adults spread throughout the town, while the high density of older adults occurs in isolated block groups scattered throughout the county.
Coordinated Public Transit-Human Services Transportation Plan for NYMTC Region Final
N E W Y O R K M E T R O P O L I T A N T R A N S P O R T A T I O N C O U N C I L L O W E R H U D S O N V A L L E Y
Page 5-9
Figure 5-9 Number of Older Adults (65+) by Block Group - Putnam County
Coordinated Public Transit-Human Services Transportation Plan for NYMTC Region Final
N E W Y O R K M E T R O P O L I T A N T R A N S P O R T A T I O N C O U N C I L L O W E R H U D S O N V A L L E Y
Page 5-10
Figure 5-10 Older Adults (65+) per Square Mile by Block Group - Putnam County
Coordinated Public Transit-Human Services Transportation Plan for NYMTC Region Final
N E W Y O R K M E T R O P O L I T A N T R A N S P O R T A T I O N C O U N C I L L O W E R H U D S O N V A L L E Y
Page 5-11
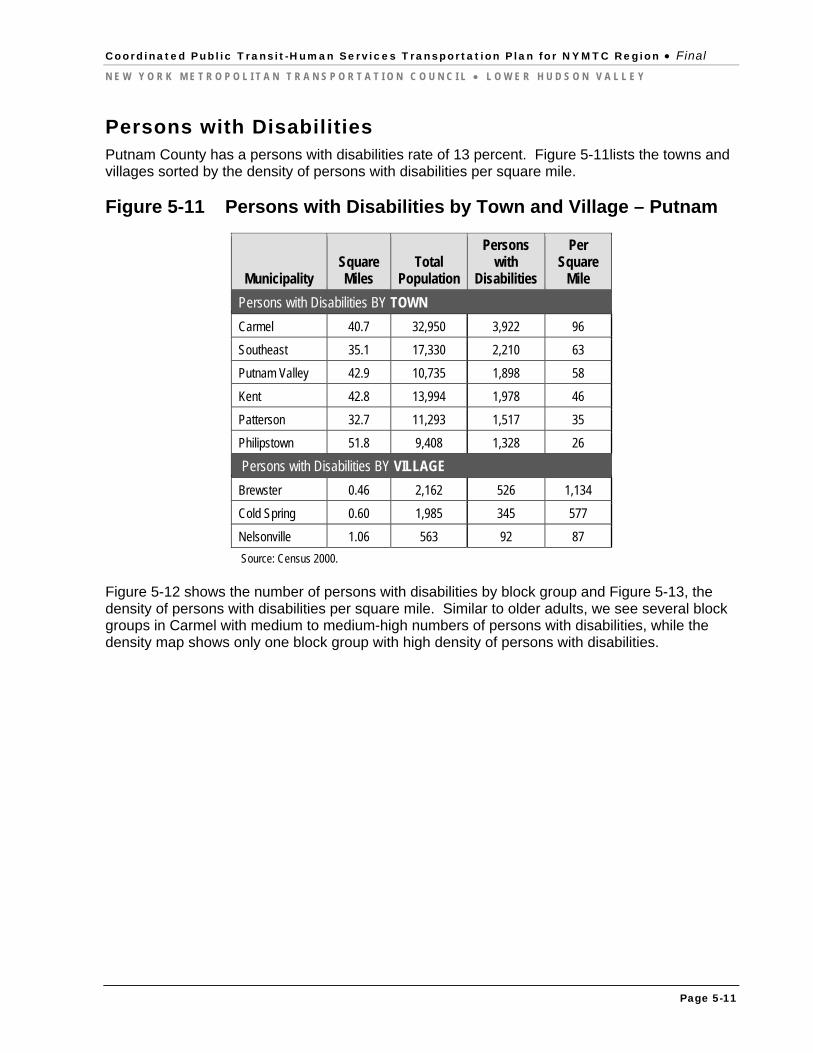
Persons with Disabilities Putnam County has a persons with disabilities rate of 13 percent. Figure 5-11lists the towns and villages sorted by the density of persons with disabilities per square mile.
Figure 5-11 Persons with Disabilities by Town and Village – Putnam
Municipality Square Miles
Total Population
Persons with
Disabilities
Per Square
Mile
Persons with Disabilities BY TOWN
Carmel 40.7 32,950 3,922 96
Southeast 35.1 17,330 2,210 63
Putnam Valley 42.9 10,735 1,898 58
Kent 42.8 13,994 1,978 46
Patterson 32.7 11,293 1,517 35
Philipstown 51.8 9,408 1,328 26
Persons with Disabilities BY VILLAGE
Brewster 0.46 2,162 526 1,134
Cold Spring 0.60 1,985 345 577
Nelsonville 1.06 563 92 87
Source: Census 2000.
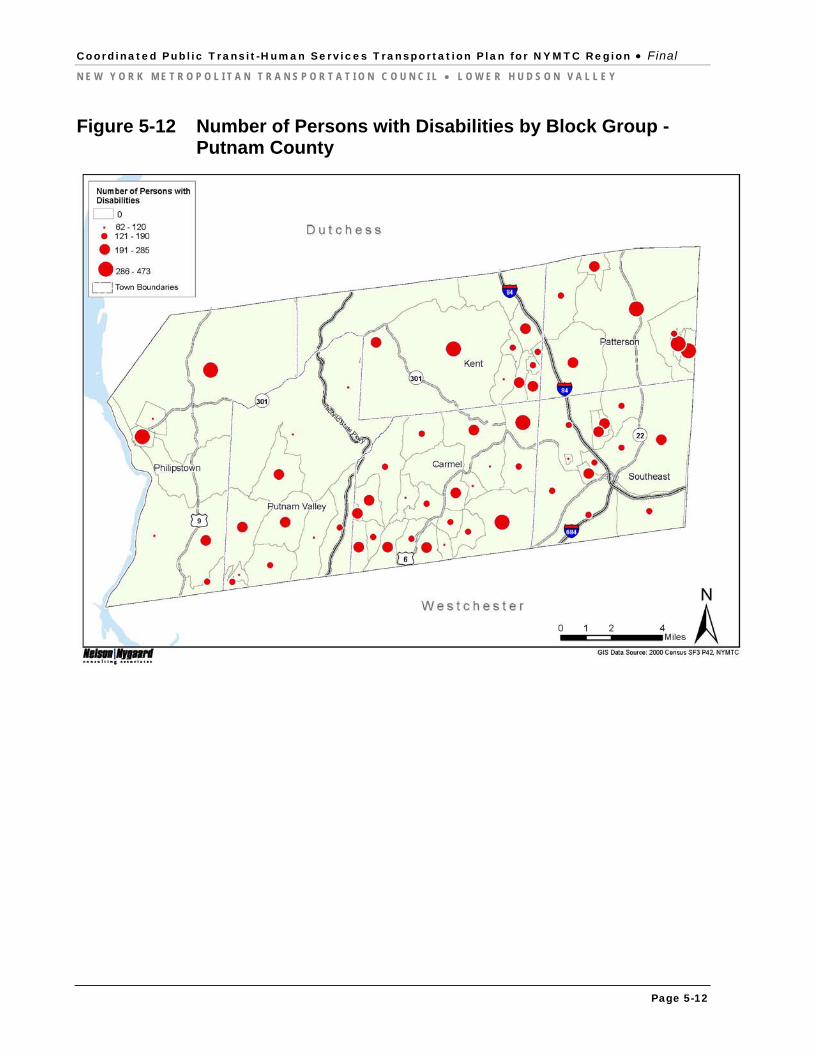
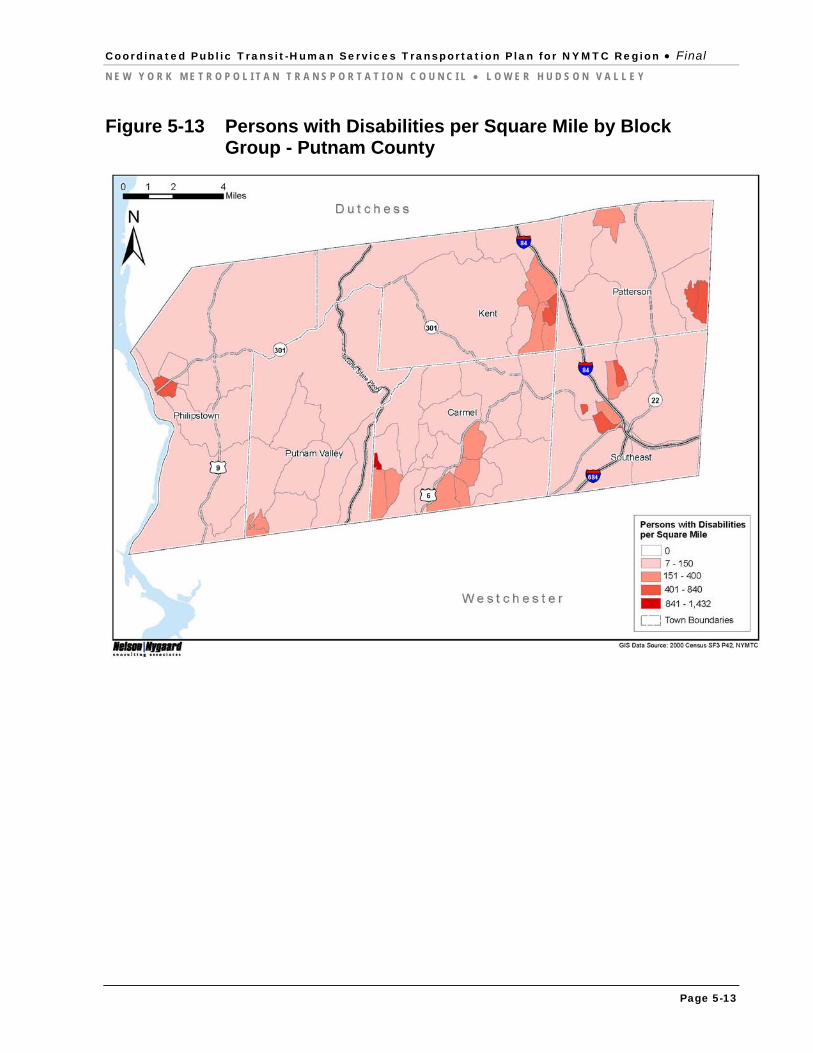
Figure 5-12 shows the number of persons with disabilities by block group and Figure 5-13, the density of persons with disabilities per square mile. Similar to older adults, we see several block groups in Carmel with medium to medium-high numbers of persons with disabilities, while the density map shows only one block group with high density of persons with disabilities.
Coordinated Public Transit-Human Services Transportation Plan for NYMTC Region Final
N E W Y O R K M E T R O P O L I T A N T R A N S P O R T A T I O N C O U N C I L L O W E R H U D S O N V A L L E Y
Page 5-12
Figure 5-12 Number of Persons with Disabilities by Block Group - Putnam County
Coordinated Public Transit-Human Services Transportation Plan for NYMTC Region Final
N E W Y O R K M E T R O P O L I T A N T R A N S P O R T A T I O N C O U N C I L L O W E R H U D S O N V A L L E Y
Page 5-13
Figure 5-13 Persons with Disabilities per Square Mile by Block Group - Putnam County
Coordinated Public Transit-Human Services Transportation Plan for NYMTC Region Final
N E W Y O R K M E T R O P O L I T A N T R A N S P O R T A T I O N C O U N C I L L O W E R H U D S O N V A L L E Y
Page 5-14
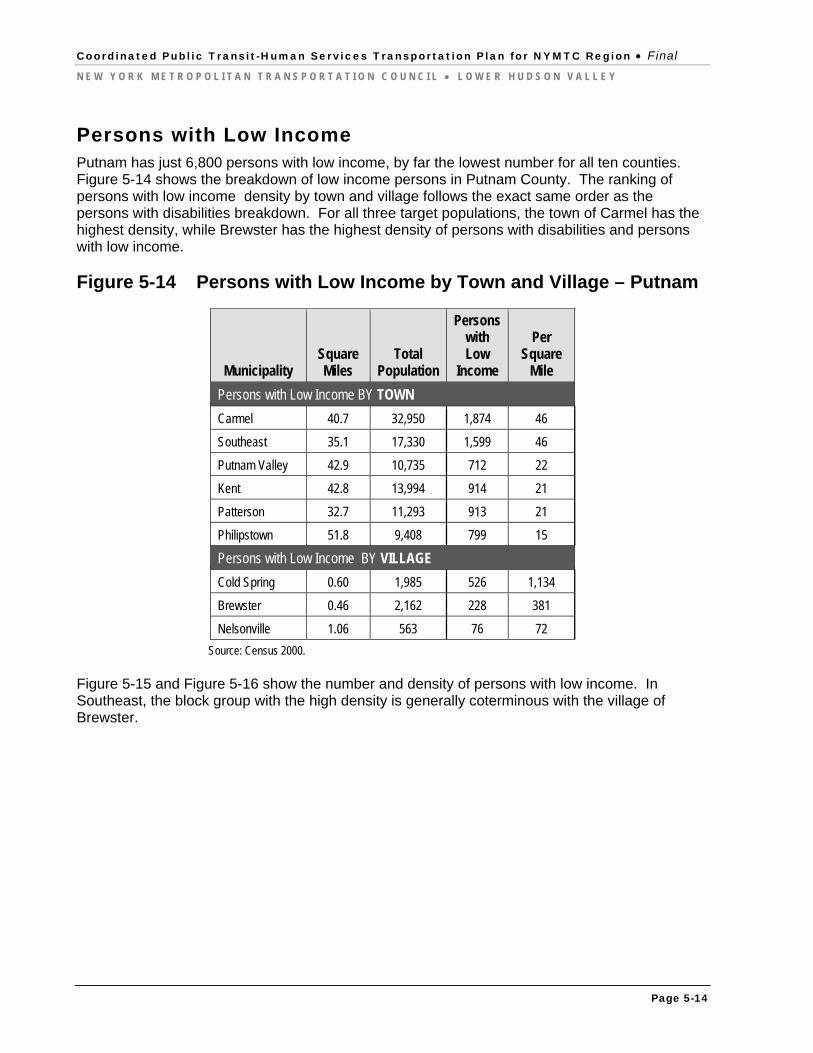
Persons with Low Income Putnam has just 6,800 persons with low income, by far the lowest number for all ten counties. Figure 5-14 shows the breakdown of low income persons in Putnam County. The ranking of persons with low income density by town and village follows the exact same order as the persons with disabilities breakdown. For all three target populations, the town of Carmel has the highest density, while Brewster has the highest density of persons with disabilities and persons with low income.
Figure 5-14 Persons with Low Income by Town and Village – Putnam
Municipality Square Miles
Total Population
Persons with Low
Income
Per Square
Mile
Persons with Low Income BY TOWN
Carmel 40.7 32,950 1,874 46
Southeast 35.1 17,330 1,599 46
Putnam Valley 42.9 10,735 712 22
Kent 42.8 13,994 914 21
Patterson 32.7 11,293 913 21
Philipstown 51.8 9,408 799 15
Persons with Low Income BY VILLAGE
Cold Spring 0.60 1,985 526 1,134
Brewster 0.46 2,162 228 381
Nelsonville 1.06 563 76 72
Source: Census 2000.
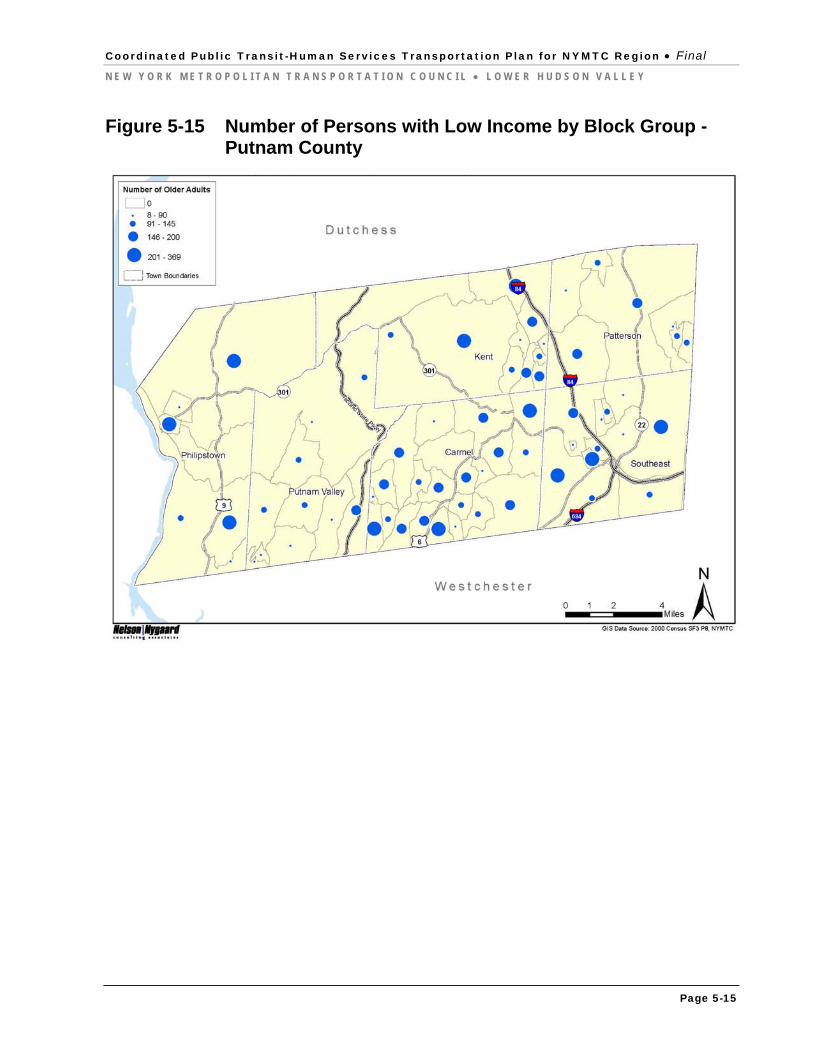
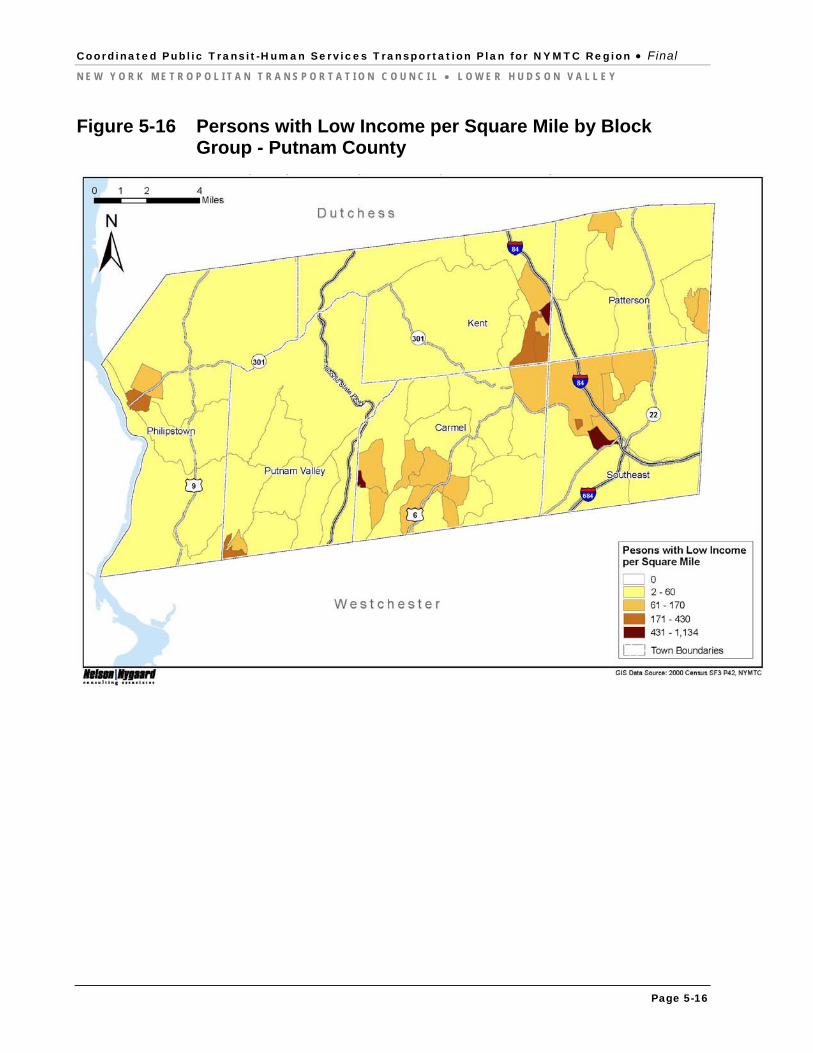
Figure 5-15 and Figure 5-16 show the number and density of persons with low income. In Southeast, the block group with the high density is generally coterminous with the village of Brewster.
Coordinated Public Transit-Human Services Transportation Plan for NYMTC Region Final
N E W Y O R K M E T R O P O L I T A N T R A N S P O R T A T I O N C O U N C I L L O W E R H U D S O N V A L L E Y
Page 5-15
Figure 5-15 Number of Persons with Low Income by Block Group - Putnam County
Coordinated Public Transit-Human Services Transportation Plan for NYMTC Region Final
N E W Y O R K M E T R O P O L I T A N T R A N S P O R T A T I O N C O U N C I L L O W E R H U D S O N V A L L E Y
Page 5-16
Figure 5-16 Persons with Low Income per Square Mile by Block Group - Putnam County
Coordinated Public Transit-Human Services Transportation Plan for NYMTC Region Final
N E W Y O R K M E T R O P O L I T A N T R A N S P O R T A T I O N C O U N C I L L O W E R H U D S O N V A L L E Y
Page 5-17
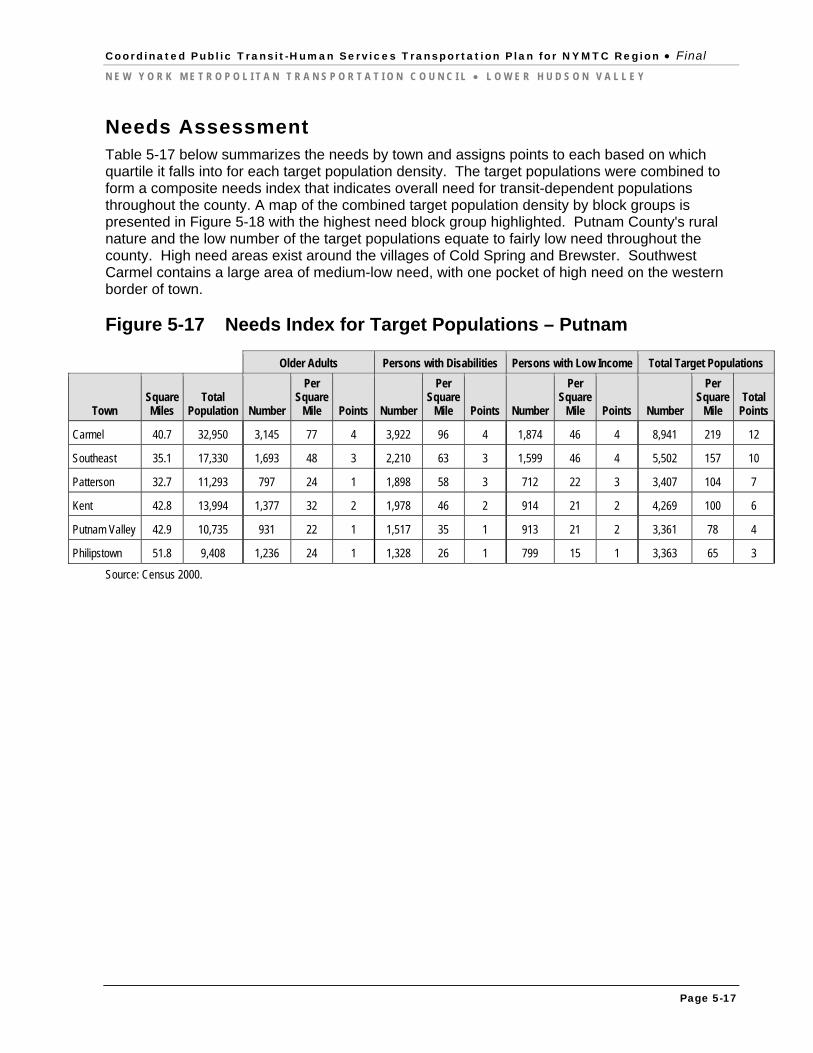
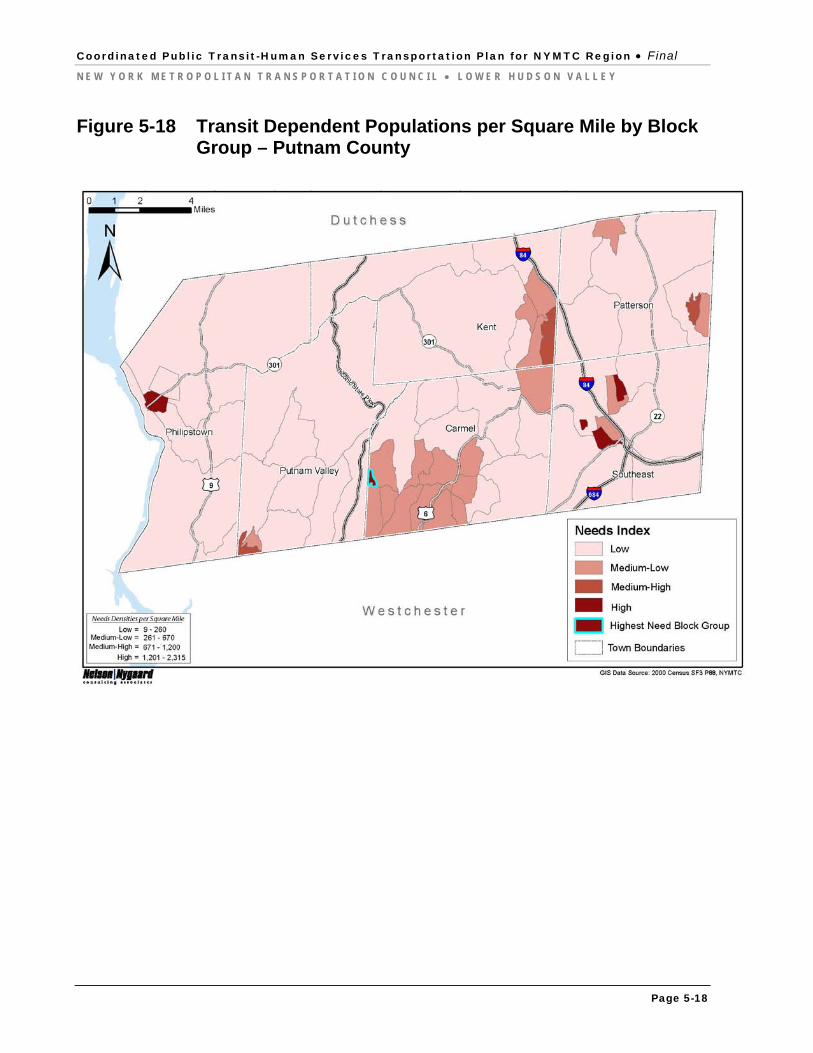
Needs Assessment Table 5-17 below summarizes the needs by town and assigns points to each based on which quartile it falls into for each target population density. The target populations were combined to form a composite needs index that indicates overall need for transit-dependent populations throughout the county. A map of the combined target population density by block groups is presented in Figure 5-18 with the highest need block group highlighted. Putnam County's rural nature and the low number of the target populations equate to fairly low need throughout the county. High need areas exist around the villages of Cold Spring and Brewster. Southwest Carmel contains a large area of medium-low need, with one pocket of high need on the western border of town.
Figure 5-17 Needs Index for Target Populations – Putnam
Older Adults Persons with Disabilities Persons with Low Income Total Target Populations
Town Square Miles
Total Population Number
Per Square
Mile Points Number
Per Square
Mile Points Number
Per Square
Mile Points Number
Per Square
Mile Total
Points
Carmel 40.7 32,950 3,145 77 4 3,922 96 4 1,874 46 4 8,941 219 12
Southeast 35.1 17,330 1,693 48 3 2,210 63 3 1,599 46 4 5,502 157 10
Patterson 32.7 11,293 797 24 1 1,898 58 3 712 22 3 3,407 104 7
Kent 42.8 13,994 1,377 32 2 1,978 46 2 914 21 2 4,269 100 6
Putnam Valley 42.9 10,735 931 22 1 1,517 35 1 913 21 2 3,361 78 4
Philipstown 51.8 9,408 1,236 24 1 1,328 26 1 799 15 1 3,363 65 3
Source: Census 2000.
Coordinated Public Transit-Human Services Transportation Plan for NYMTC Region Final
N E W Y O R K M E T R O P O L I T A N T R A N S P O R T A T I O N C O U N C I L L O W E R H U D S O N V A L L E Y
Page 5-18
Figure 5-18 Transit Dependent Populations per Square Mile by Block Group – Putnam County

Coordinated Public Transit-Human Services Transportation Plan for NYMTC Region Final
N E W Y O R K M E T R O P O L I T A N T R A N S P O R T A T I O N C O U N C I L L O W E R H U D S O N V A L L E Y
Page 5-19
Rockland County The only NYMTC county west of the Hudson River, Rockland shares a southern border with New Jersey.
Population – The county’s population neared 300,000 by 2007, with a 3.4 percent population growth since 2000. Rockland contains 196 block groups divided among five towns. The county has 19 villages, more than half of which are located in the town of Ramapo. On average, the towns cover 40 square miles and the villages, 1.8 square miles.
Changes in Population – In the year 1900, Rockland was home to nearly 38,300 people. The area grew steadily along with the rest of the LHV, surpassing the 100,000 mark by 1960. Population jumped up by 68 percent from 1960 to 1970, then slowed down, reaching 286,753 by 2000.
Population Density – At 174 square miles of land, Rockland covers the smallest area of the three LHV counties; it is approximately three times larger than Staten Island. The county has a population density of 1,704 people per square mile as of 2007.
Population Age – Rockland’s median age is nearly the same as that of New York State at 36.2 years. Twelve percent of the population is 65 years of age or older, and 60 percent fall between 18-64 years of age.
Income – Persons with low income make up 15 percent of Rockland’s population, which is the highest percent for LHV counties. The population earns a median income of $67,971.
Employment – Just under half of the population is in the labor force. The biggest employment category is management, professional, and related occupations at 44 percent of the population, 10 percent higher than the national percent. Another 26 percent work in sales and office, and 15 percent work in the service industries.
Older Adults Rockland is home to more than 33,800 older adults. The following table lists the older adult population by highest population density by town as well as the five villages with high densities of older adults. Since Rockland only contains five towns, the tables by target population include all five towns and the five villages with the highest densities of each population.
Coordinated Public Transit-Human Services Transportation Plan for NYMTC Region Final
N E W Y O R K M E T R O P O L I T A N T R A N S P O R T A T I O N C O U N C I L L O W E R H U D S O N V A L L E Y
Page 5-20
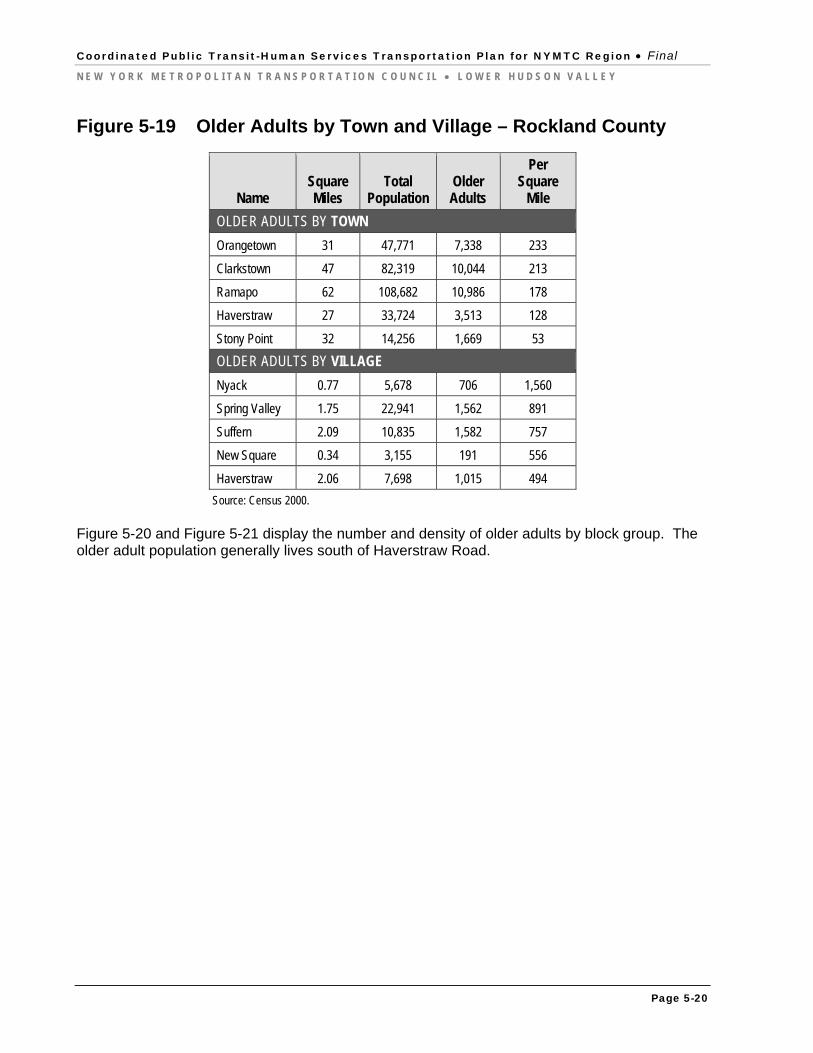
Figure 5-19 Older Adults by Town and Village – Rockland County
Name Square Miles
Total Population
Older Adults
Per Square
Mile
OLDER ADULTS BY TOWN
Orangetown 31 47,771 7,338 233
Clarkstown 47 82,319 10,044 213
Ramapo 62 108,682 10,986 178
Haverstraw 27 33,724 3,513 128
Stony Point 32 14,256 1,669 53
OLDER ADULTS BY VILLAGE
Nyack 0.77 5,678 706 1,560
Spring Valley 1.75 22,941 1,562 891
Suffern 2.09 10,835 1,582 757
New Square 0.34 3,155 191 556
Haverstraw 2.06 7,698 1,015 494
Source: Census 2000.
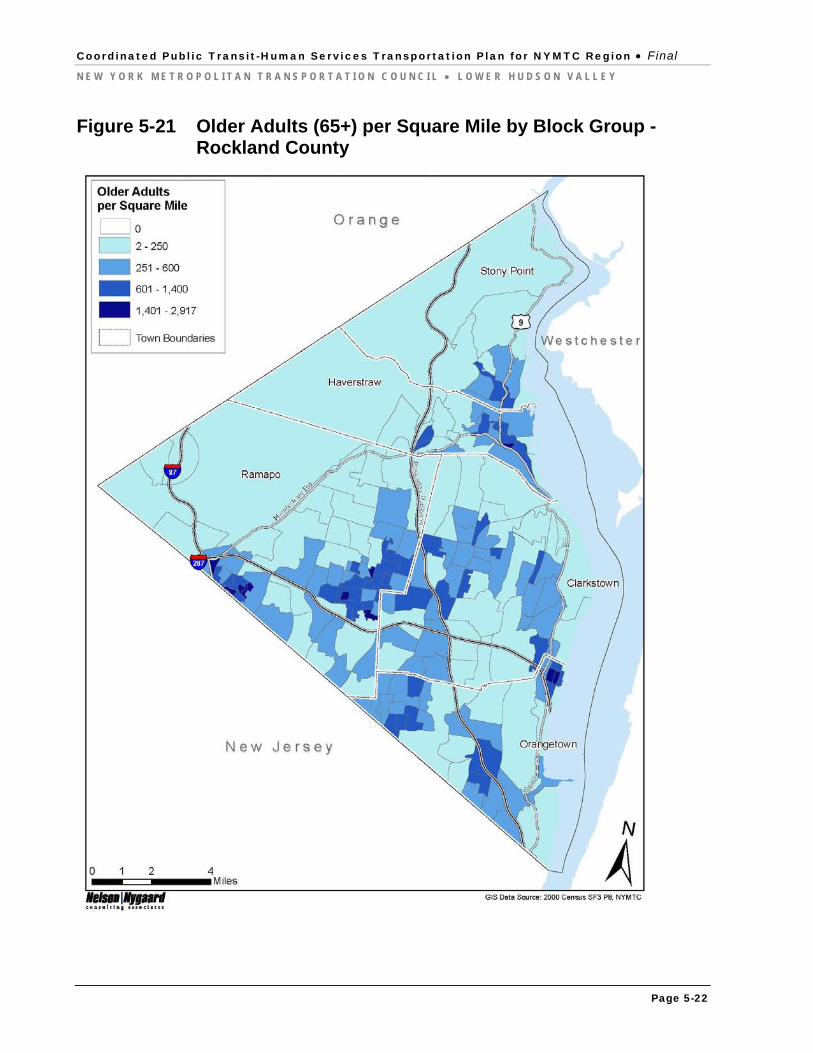
Figure 5-20 and Figure 5-21 display the number and density of older adults by block group. The older adult population generally lives south of Haverstraw Road.

Coordinated Public Transit-Human Services Transportation Plan for NYMTC Region Final
N E W Y O R K M E T R O P O L I T A N T R A N S P O R T A T I O N C O U N C I L L O W E R H U D S O N V A L L E Y
Page 5-21
Figure 5-20 Number of Older Adults (65+) by Block Group - Rockland County
Coordinated Public Transit-Human Services Transportation Plan for NYMTC Region Final
N E W Y O R K M E T R O P O L I T A N T R A N S P O R T A T I O N C O U N C I L L O W E R H U D S O N V A L L E Y
Page 5-22
Figure 5-21 Older Adults (65+) per Square Mile by Block Group - Rockland County
Coordinated Public Transit-Human Services Transportation Plan for NYMTC Region Final
N E W Y O R K M E T R O P O L I T A N T R A N S P O R T A T I O N C O U N C I L L O W E R H U D S O N V A L L E Y
Page 5-23
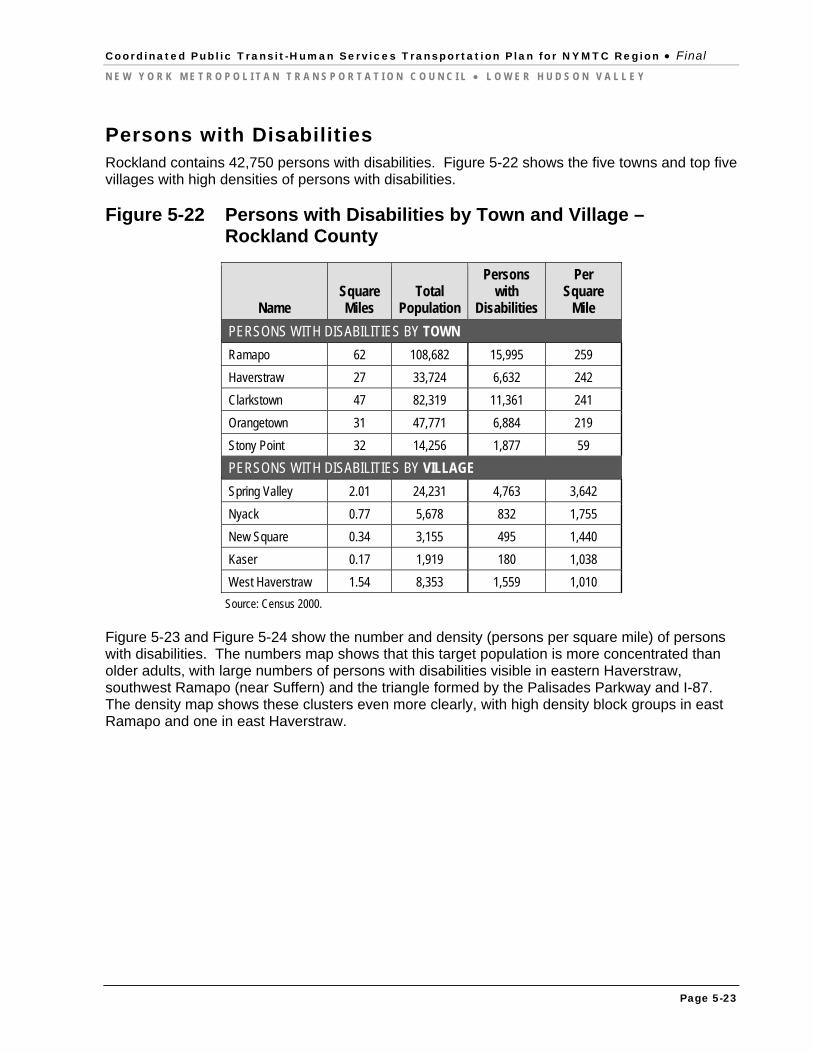
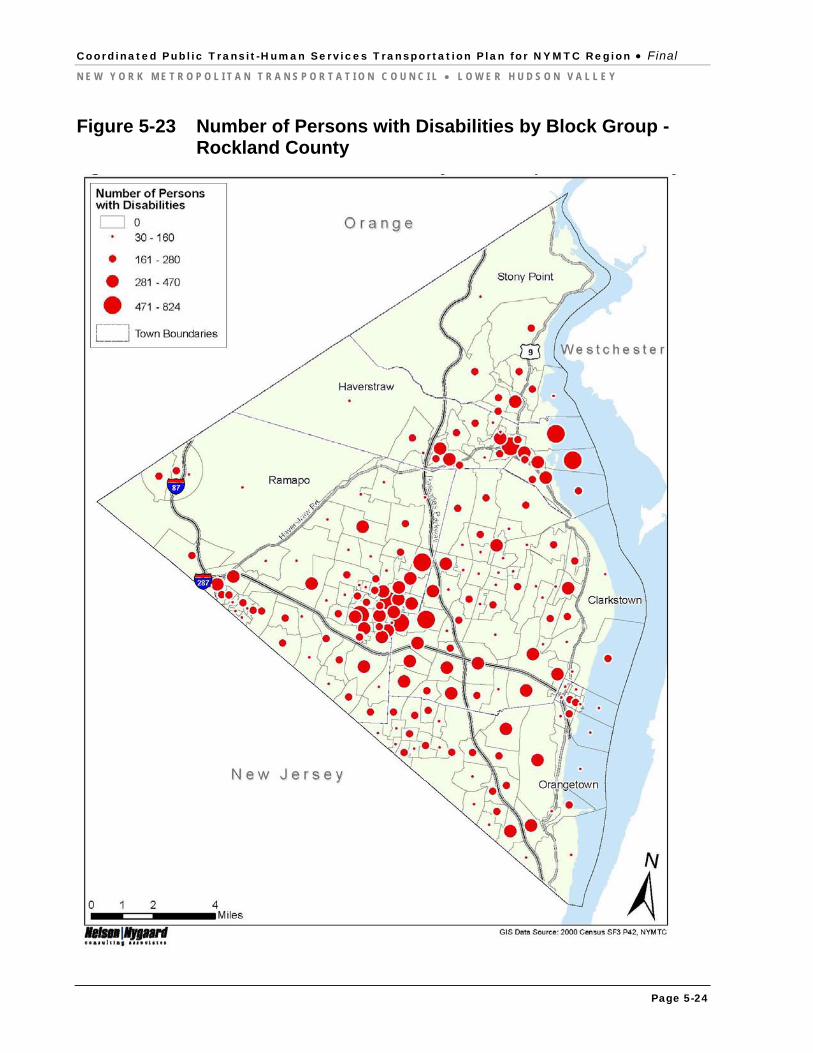
Persons with Disabilities Rockland contains 42,750 persons with disabilities. Figure 5-22 shows the five towns and top five villages with high densities of persons with disabilities.
Figure 5-22 Persons with Disabilities by Town and Village – Rockland County
Name Square Miles
Total Population
Persons with
Disabilities
Per Square
Mile
PERSONS WITH DISABILITIES BY TOWN
Ramapo 62 108,682 15,995 259
Haverstraw 27 33,724 6,632 242
Clarkstown 47 82,319 11,361 241
Orangetown 31 47,771 6,884 219
Stony Point 32 14,256 1,877 59
PERSONS WITH DISABILITIES BY VILLAGE
Spring Valley 2.01 24,231 4,763 3,642
Nyack 0.77 5,678 832 1,755
New Square 0.34 3,155 495 1,440
Kaser 0.17 1,919 180 1,038
West Haverstraw 1.54 8,353 1,559 1,010
Source: Census 2000.
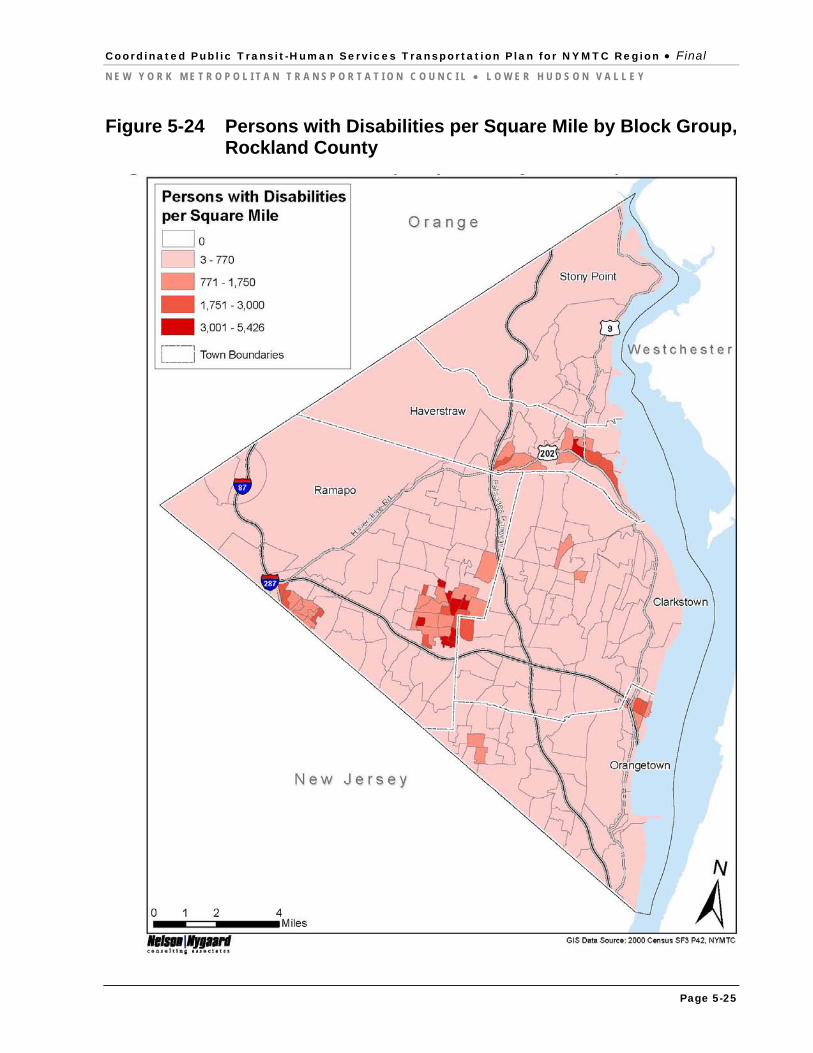
Figure 5-23 and Figure 5-24 show the number and density (persons per square mile) of persons with disabilities. The numbers map shows that this target population is more concentrated than older adults, with large numbers of persons with disabilities visible in eastern Haverstraw, southwest Ramapo (near Suffern) and the triangle formed by the Palisades Parkway and I-87. The density map shows these clusters even more clearly, with high density block groups in east Ramapo and one in east Haverstraw.
Coordinated Public Transit-Human Services Transportation Plan for NYMTC Region Final
N E W Y O R K M E T R O P O L I T A N T R A N S P O R T A T I O N C O U N C I L L O W E R H U D S O N V A L L E Y
Page 5-24
Figure 5-23 Number of Persons with Disabilities by Block Group - Rockland County
Coordinated Public Transit-Human Services Transportation Plan for NYMTC Region Final
N E W Y O R K M E T R O P O L I T A N T R A N S P O R T A T I O N C O U N C I L L O W E R H U D S O N V A L L E Y
Page 5-25
Figure 5-24 Persons with Disabilities per Square Mile by Block Group, Rockland County

Coordinated Public Transit-Human Services Transportation Plan for NYMTC Region Final
N E W Y O R K M E T R O P O L I T A N T R A N S P O R T A T I O N C O U N C I L L O W E R H U D S O N V A L L E Y
Page 5-26
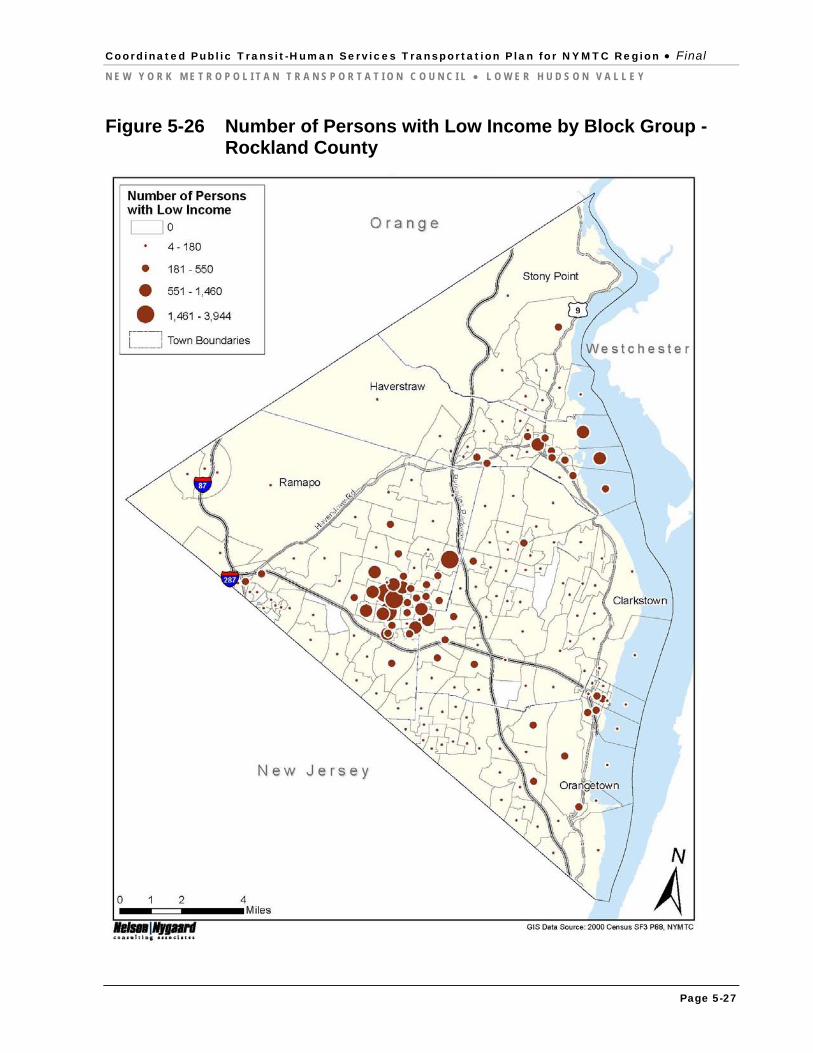
Persons with Low Income Rockland has nearly the same number of low income residents – 41,700 – as it has persons with disabilities. As shown in Figure 5-25 the densities of persons with low income are higher than persons with disabilities.
Figure 5-25 Persons with Low Income by Town and Village – Rockland County
Name Square Miles
Total Population
Persons with Low
Income
Per Square
Mile
PERSONS WITH LOW INCOME BY TOWN
Ramapo 62 108,682 25,226 408
Haverstraw 27 33,724 5,839 213
Orangetown 31 47,771 4,226 134
Clarkstown 47 82,319 5,277 112
Stony Point 32 14,256 1,139 36
PERSONS WITH LOW INCOME BY VILLAGE
Kaser 0.17 1,919 1,272 7,332
New Square 0.34 3,155 2,370 6,895
Spring Valley 2.01 24,231 6,879 4,846
Nyack 0.77 5,678 819 1,400
South Nyack 0.61 2,653 606 989
Source: Census 2000.
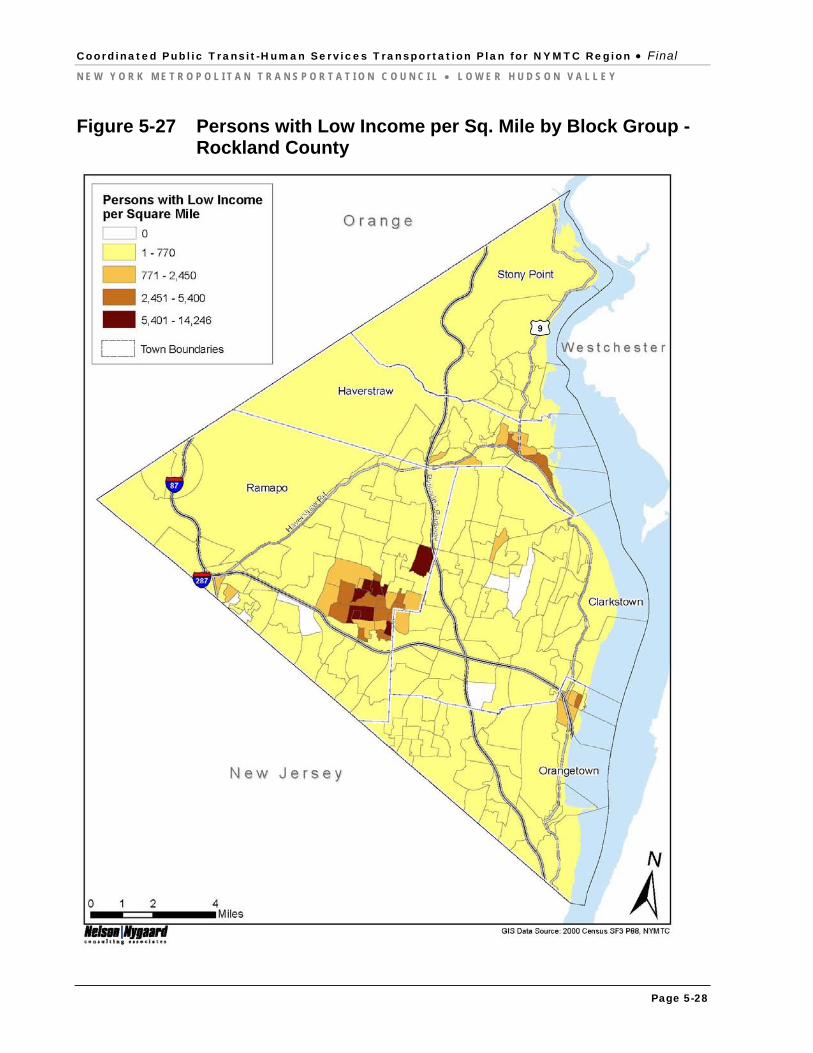
Figure 5-26 shows the number of persons with low income per block group and Figure 5-27 the density of persons with low income. The highest density of persons with low income can be found in eastern Ramapo, similar to the distribution of persons with disabilities. The number map shows that eastern Haverstraw also contains many people with low income.
Coordinated Public Transit-Human Services Transportation Plan for NYMTC Region Final
N E W Y O R K M E T R O P O L I T A N T R A N S P O R T A T I O N C O U N C I L L O W E R H U D S O N V A L L E Y
Page 5-27
Figure 5-26 Number of Persons with Low Income by Block Group - Rockland County
Coordinated Public Transit-Human Services Transportation Plan for NYMTC Region Final
N E W Y O R K M E T R O P O L I T A N T R A N S P O R T A T I O N C O U N C I L L O W E R H U D S O N V A L L E Y
Page 5-28
Figure 5-27 Persons with Low Income per Sq. Mile by Block Group - Rockland County
Coordinated Public Transit-Human Services Transportation Plan for NYMTC Region Final
N E W Y O R K M E T R O P O L I T A N T R A N S P O R T A T I O N C O U N C I L L O W E R H U D S O N V A L L E Y
Page 5-29
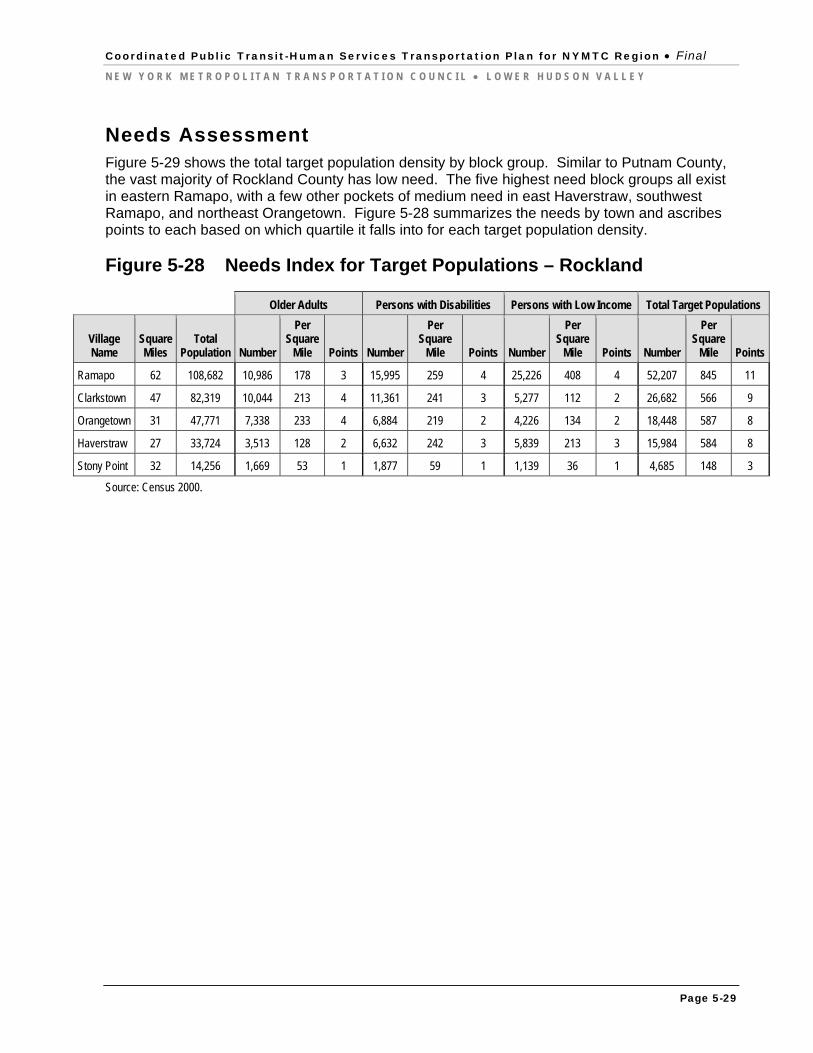
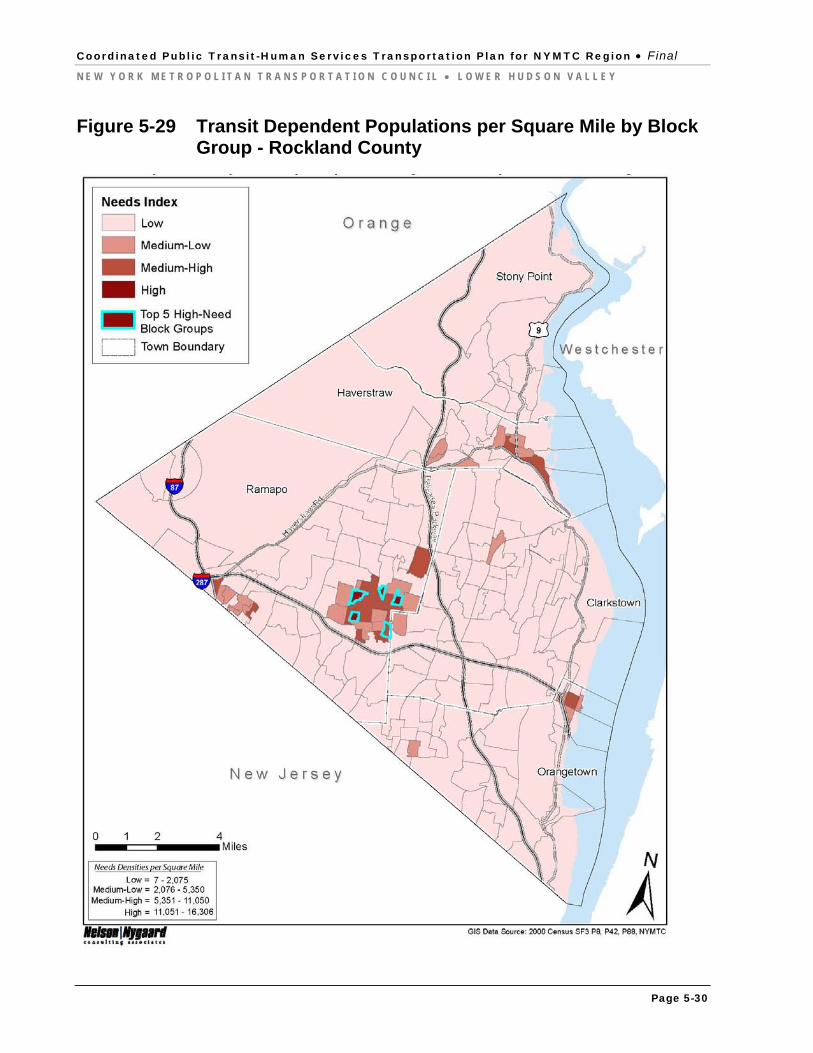
Needs Assessment Figure 5-29 shows the total target population density by block group. Similar to Putnam County, the vast majority of Rockland County has low need. The five highest need block groups all exist in eastern Ramapo, with a few other pockets of medium need in east Haverstraw, southwest Ramapo, and northeast Orangetown. Figure 5-28 summarizes the needs by town and ascribes points to each based on which quartile it falls into for each target population density.
Figure 5-28 Needs Index for Target Populations – Rockland
Older Adults Persons with Disabilities Persons with Low Income Total Target Populations
Village Name
Square Miles
Total Population Number
Per Square
Mile Points Number
Per Square
Mile Points Number
Per Square
Mile Points Number
Per Square
Mile Points
Ramapo 62 108,682 10,986 178 3 15,995 259 4 25,226 408 4 52,207 845 11
Clarkstown 47 82,319 10,044 213 4 11,361 241 3 5,277 112 2 26,682 566 9
Orangetown 31 47,771 7,338 233 4 6,884 219 2 4,226 134 2 18,448 587 8
Haverstraw 27 33,724 3,513 128 2 6,632 242 3 5,839 213 3 15,984 584 8
Stony Point 32 14,256 1,669 53 1 1,877 59 1 1,139 36 1 4,685 148 3
Source: Census 2000.
Coordinated Public Transit-Human Services Transportation Plan for NYMTC Region Final
N E W Y O R K M E T R O P O L I T A N T R A N S P O R T A T I O N C O U N C I L L O W E R H U D S O N V A L L E Y
Page 5-30
Figure 5-29 Transit Dependent Populations per Square Mile by Block Group - Rockland County
Coordinated Public Transit-Human Services Transportation Plan for NYMTC Region Final
N E W Y O R K M E T R O P O L I T A N T R A N S P O R T A T I O N C O U N C I L L O W E R H U D S O N V A L L E Y
Page 5-31
Westchester County Westchester borders the Bronx to the south and Connecticut to the east. The southern portion of the county has a high population density, which lessens farther north toward the Putnam County border.
Population – Westchester contains approximately 950,000 people, making it by far the most populous county in the LHV. It experienced the least population growth from 2000 to 2007 – 3 percent – but this is still a larger increase than the state as a whole. The county contains six cities and 19 towns, spread over 858 block groups. In addition, the county has 23 villages. On average, each city and town measure 19 square miles while villages are 3.4 square miles.
Changes in Population – Early on, Westchester had a fairly high population. In the year 1900, 184,257 people lived in the county, more than Queens’ 1900 population. In the meantime, Rockland held approximately 18,300 residents and Putnam, just 13,800. Growth in Westchester slowed by around 1940, while Rockland and Putnam began expanding more rapidly. County population dropped 3 percent from 1970 to 1980, then began increasing again.
Population Density – Westchester has the second largest land area in the NYMTC region at 433 square miles. The county has a population density of 2,197 people per square mile in 2007.
Population Age – The median age in Westchester is 37.6 years, which is almost two years higher than the state median. More than 60 percent of the county’s population falls in the 18-64 age range, while older adults account for 14 percent.
Income – Westchester has the lowest median household income of the three LHV counties at $63,582. The county has nearly 125,000 low income residents.
Employment – After Manhattan, Westchester has the highest percentage of residents who work in management, professional, and related occupations at 46 percent. Twenty-six percent work in sales and office and another 14 percent, in the service industries.
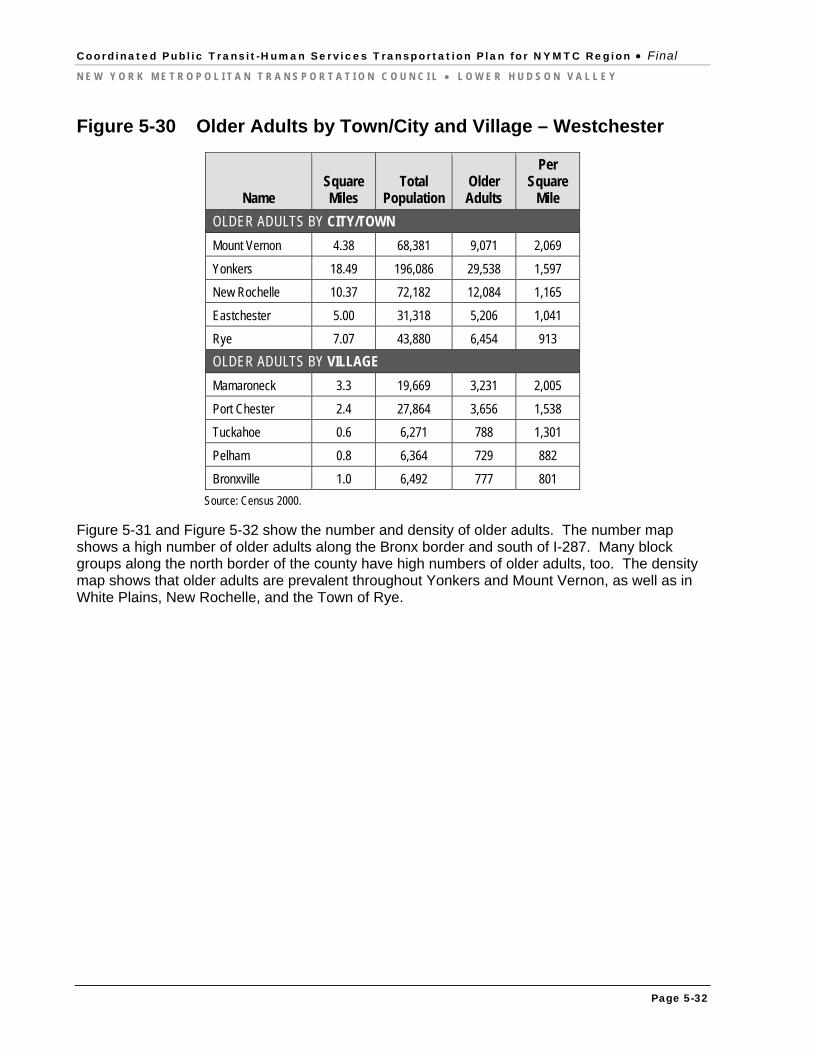
Older Adults Westchester has nearly 129,000 older adults. Figure 5-30 shows the density (persons per square mile) of older adults. The following table displays the five cities and towns and the five villages with the highest density of each target population.
Coordinated Public Transit-Human Services Transportation Plan for NYMTC Region Final
N E W Y O R K M E T R O P O L I T A N T R A N S P O R T A T I O N C O U N C I L L O W E R H U D S O N V A L L E Y
Page 5-32
Figure 5-30 Older Adults by Town/City and Village – Westchester
Name Square Miles
Total Population
Older Adults
Per Square
Mile
OLDER ADULTS BY CITY/TOWN
Mount Vernon 4.38 68,381 9,071 2,069
Yonkers 18.49 196,086 29,538 1,597
New Rochelle 10.37 72,182 12,084 1,165
Eastchester 5.00 31,318 5,206 1,041
Rye 7.07 43,880 6,454 913
OLDER ADULTS BY VILLAGE
Mamaroneck 3.3 19,669 3,231 2,005
Port Chester 2.4 27,864 3,656 1,538
Tuckahoe 0.6 6,271 788 1,301
Pelham 0.8 6,364 729 882
Bronxville 1.0 6,492 777 801
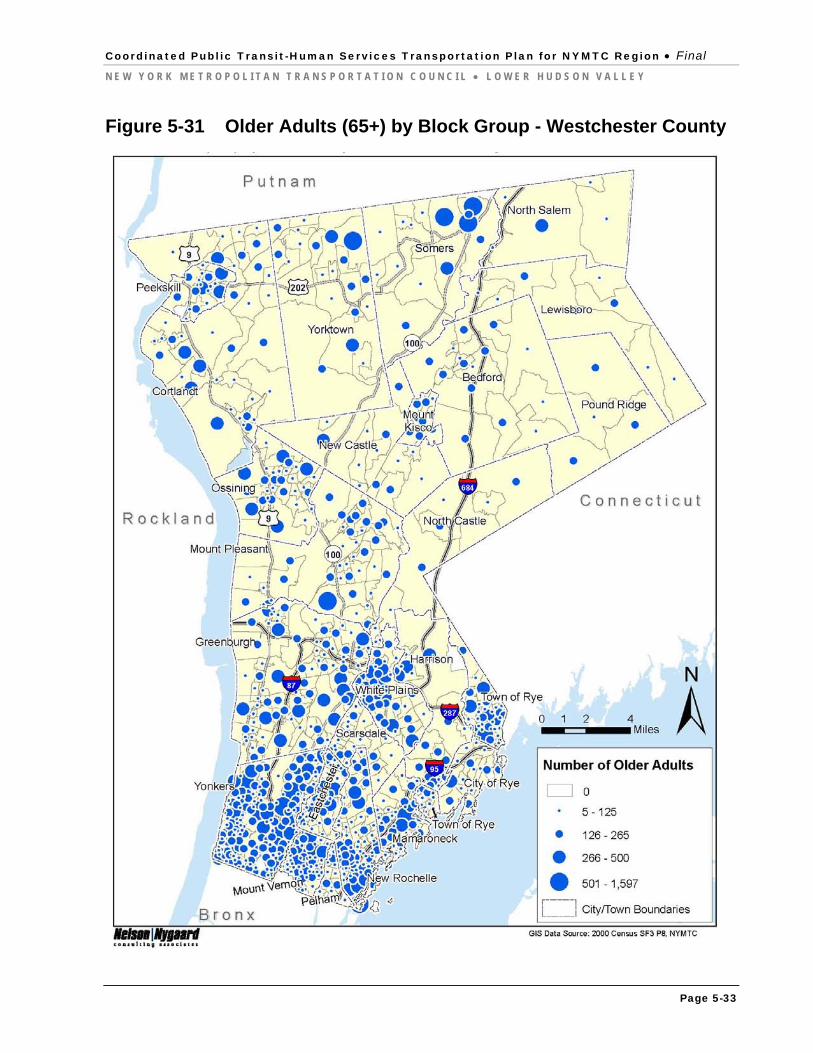
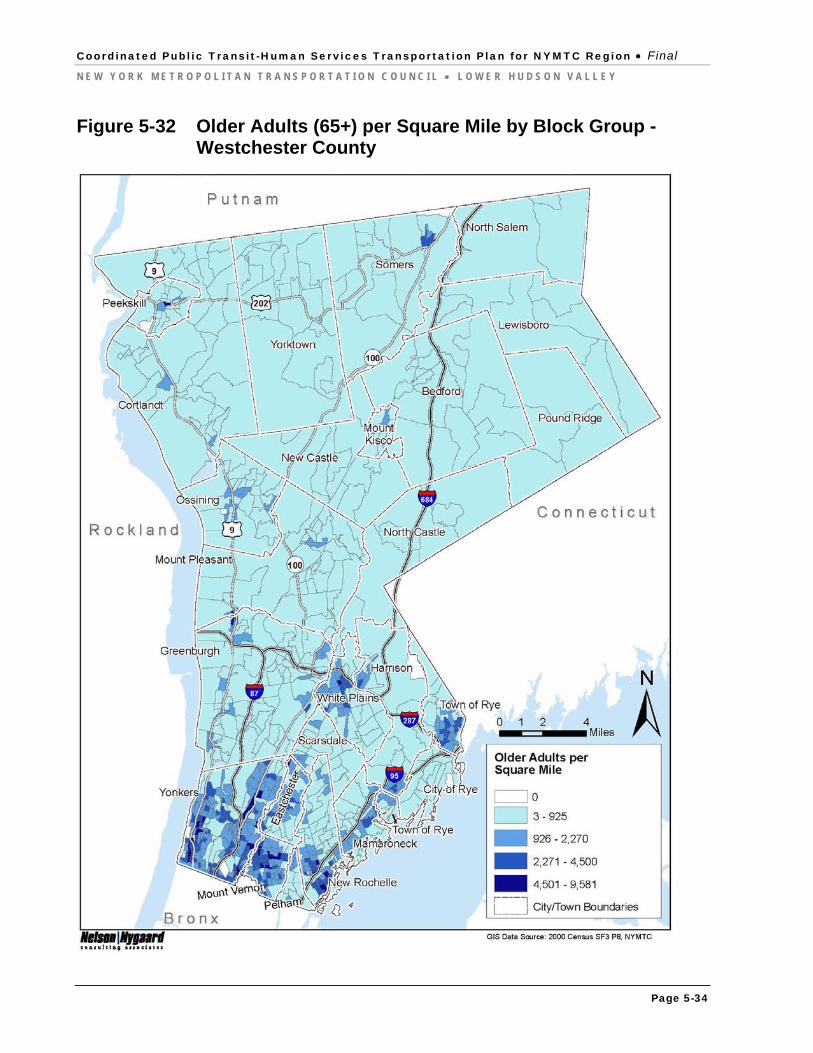
Source: Census 2000. Figure 5-31 and Figure 5-32 show the number and density of older adults. The number map shows a high number of older adults along the Bronx border and south of I-287. Many block groups along the north border of the county have high numbers of older adults, too. The density map shows that older adults are prevalent throughout Yonkers and Mount Vernon, as well as in White Plains, New Rochelle, and the Town of Rye.
Coordinated Public Transit-Human Services Transportation Plan for NYMTC Region Final
N E W Y O R K M E T R O P O L I T A N T R A N S P O R T A T I O N C O U N C I L L O W E R H U D S O N V A L L E Y
Page 5-33
Figure 5-31 Older Adults (65+) by Block Group - Westchester County
Coordinated Public Transit-Human Services Transportation Plan for NYMTC Region Final
N E W Y O R K M E T R O P O L I T A N T R A N S P O R T A T I O N C O U N C I L L O W E R H U D S O N V A L L E Y
Page 5-34
Figure 5-32 Older Adults (65+) per Square Mile by Block Group - Westchester County
Coordinated Public Transit-Human Services Transportation Plan for NYMTC Region Final
N E W Y O R K M E T R O P O L I T A N T R A N S P O R T A T I O N C O U N C I L L O W E R H U D S O N V A L L E Y
Page 5-35
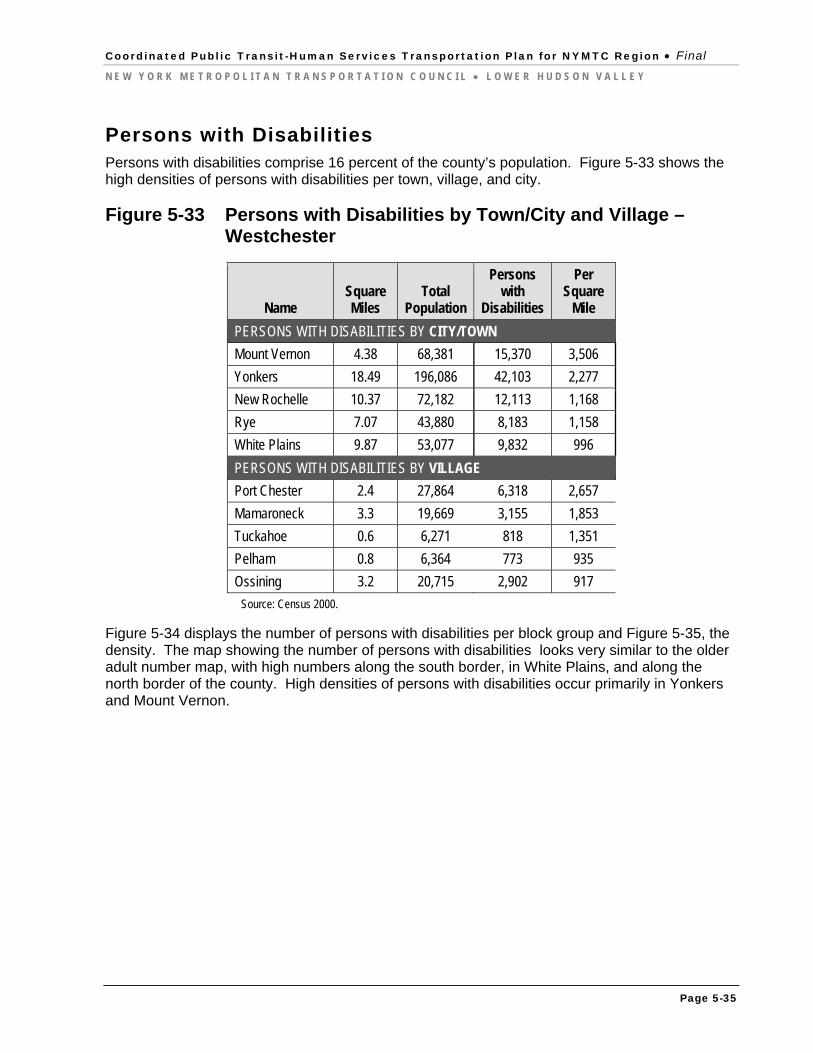
Persons with Disabilities Persons with disabilities comprise 16 percent of the county’s population. Figure 5-33 shows the high densities of persons with disabilities per town, village, and city.
Figure 5-33 Persons with Disabilities by Town/City and Village – Westchester
Name Square Miles
Total Population
Persons with
Disabilities
Per Square
Mile
PERSONS WITH DISABILITIES BY CITY/TOWN
Mount Vernon 4.38 68,381 15,370 3,506
Yonkers 18.49 196,086 42,103 2,277
New Rochelle 10.37 72,182 12,113 1,168
Rye 7.07 43,880 8,183 1,158
White Plains 9.87 53,077 9,832 996
PERSONS WITH DISABILITIES BY VILLAGE
Port Chester 2.4 27,864 6,318 2,657
Mamaroneck 3.3 19,669 3,155 1,853
Tuckahoe 0.6 6,271 818 1,351
Pelham 0.8 6,364 773 935
Ossining 3.2 20,715 2,902 917
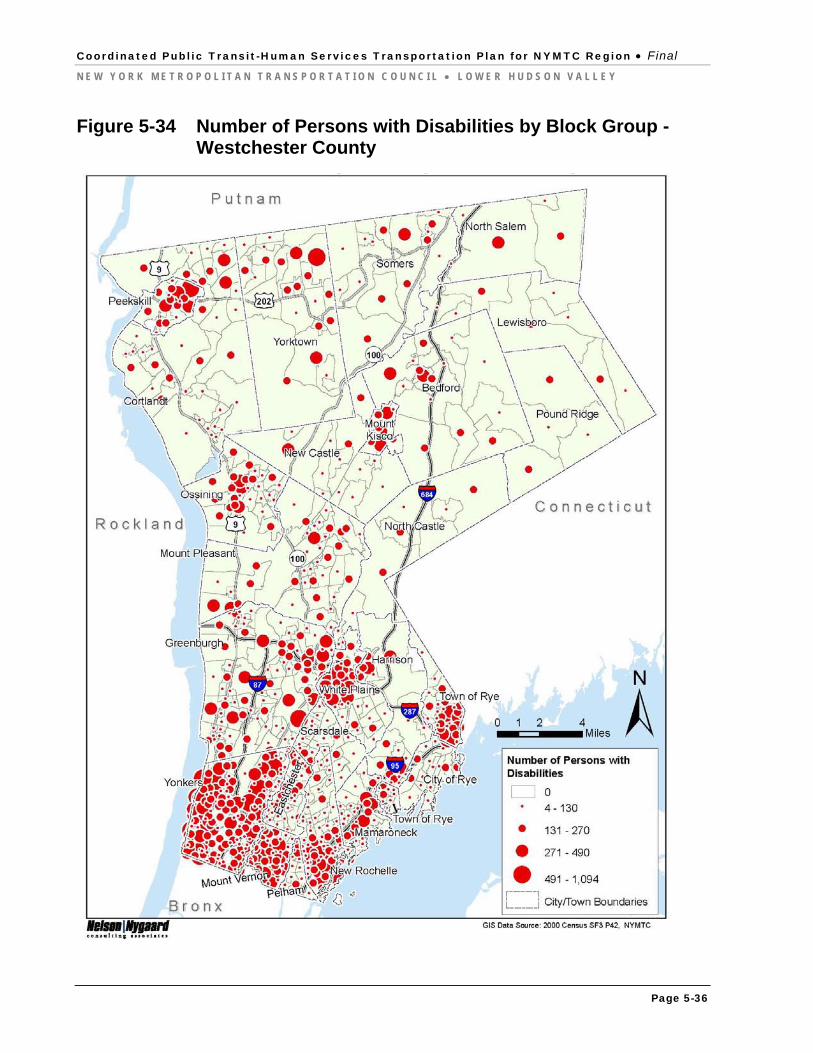
Source: Census 2000. Figure 5-34 displays the number of persons with disabilities per block group and Figure 5-35, the density. The map showing the number of persons with disabilities looks very similar to the older adult number map, with high numbers along the south border, in White Plains, and along the north border of the county. High densities of persons with disabilities occur primarily in Yonkers and Mount Vernon.
Coordinated Public Transit-Human Services Transportation Plan for NYMTC Region Final
N E W Y O R K M E T R O P O L I T A N T R A N S P O R T A T I O N C O U N C I L L O W E R H U D S O N V A L L E Y
Page 5-36
Figure 5-34 Number of Persons with Disabilities by Block Group - Westchester County
Coordinated Public Transit-Human Services Transportation Plan for NYMTC Region Final
N E W Y O R K M E T R O P O L I T A N T R A N S P O R T A T I O N C O U N C I L L O W E R H U D S O N V A L L E Y
Page 5-37
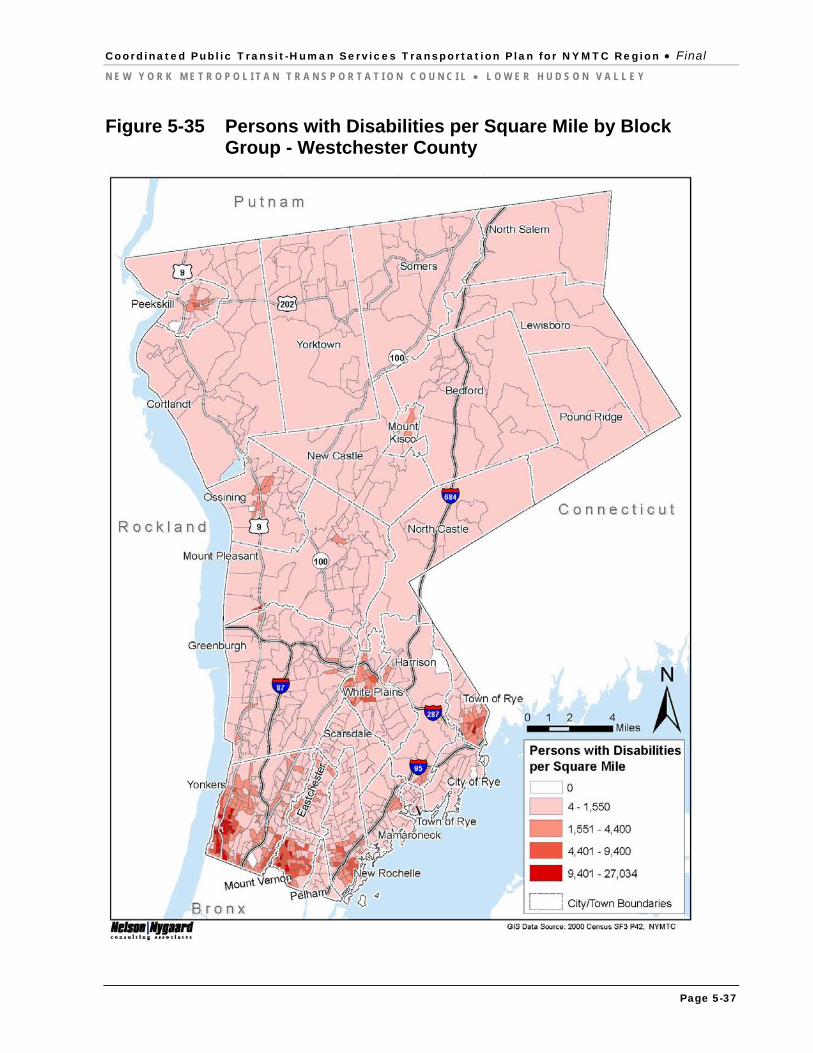
Figure 5-35 Persons with Disabilities per Square Mile by Block Group - Westchester County
Coordinated Public Transit-Human Services Transportation Plan for NYMTC Region Final
N E W Y O R K M E T R O P O L I T A N T R A N S P O R T A T I O N C O U N C I L L O W E R H U D S O N V A L L E Y
Page 5-38
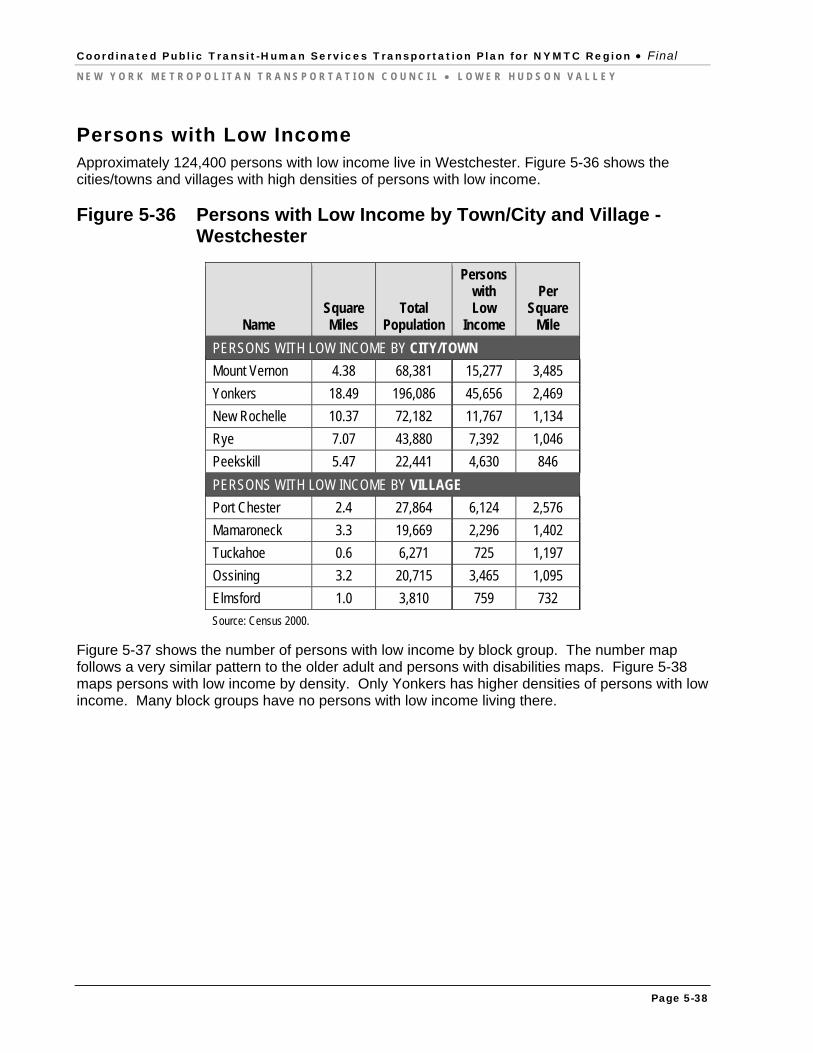
Persons with Low Income Approximately 124,400 persons with low income live in Westchester. Figure 5-36 shows the cities/towns and villages with high densities of persons with low income.
Figure 5-36 Persons with Low Income by Town/City and Village - Westchester
Name Square Miles
Total Population
Persons with Low
Income
Per Square
Mile
PERSONS WITH LOW INCOME BY CITY/TOWN
Mount Vernon 4.38 68,381 15,277 3,485
Yonkers 18.49 196,086 45,656 2,469
New Rochelle 10.37 72,182 11,767 1,134
Rye 7.07 43,880 7,392 1,046
Peekskill 5.47 22,441 4,630 846
PERSONS WITH LOW INCOME BY VILLAGE
Port Chester 2.4 27,864 6,124 2,576
Mamaroneck 3.3 19,669 2,296 1,402
Tuckahoe 0.6 6,271 725 1,197
Ossining 3.2 20,715 3,465 1,095
Elmsford 1.0 3,810 759 732
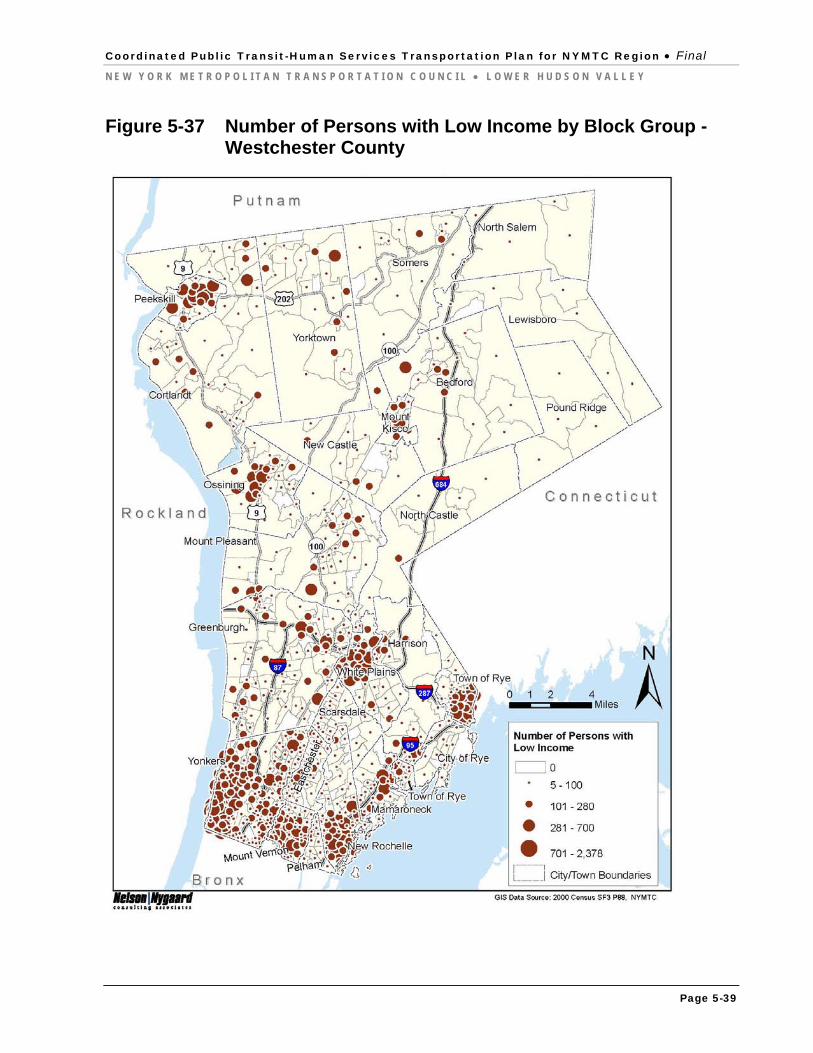
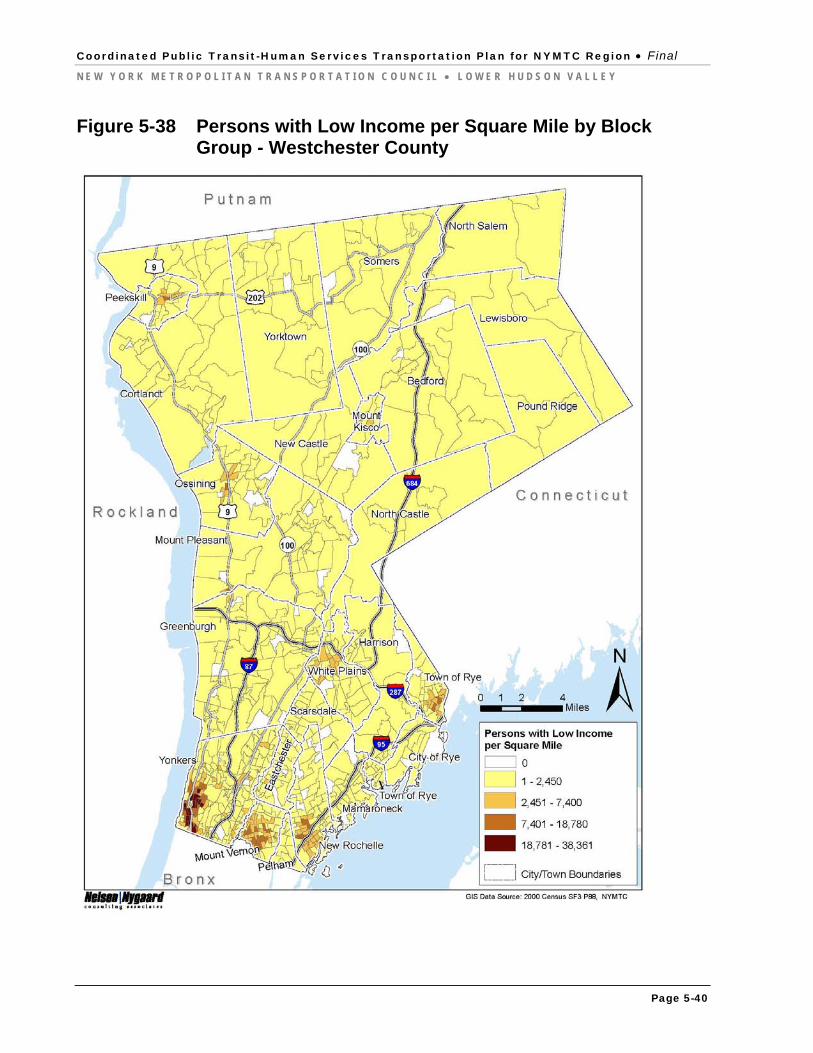
Source: Census 2000. Figure 5-37 shows the number of persons with low income by block group. The number map follows a very similar pattern to the older adult and persons with disabilities maps. Figure 5-38 maps persons with low income by density. Only Yonkers has higher densities of persons with low income. Many block groups have no persons with low income living there.
Coordinated Public Transit-Human Services Transportation Plan for NYMTC Region Final
N E W Y O R K M E T R O P O L I T A N T R A N S P O R T A T I O N C O U N C I L L O W E R H U D S O N V A L L E Y
Page 5-39
Figure 5-37 Number of Persons with Low Income by Block Group - Westchester County
Coordinated Public Transit-Human Services Transportation Plan for NYMTC Region Final
N E W Y O R K M E T R O P O L I T A N T R A N S P O R T A T I O N C O U N C I L L O W E R H U D S O N V A L L E Y
Page 5-40
Figure 5-38 Persons with Low Income per Square Mile by Block Group - Westchester County
Coordinated Public Transit-Human Services Transportation Plan for NYMTC Region Final
N E W Y O R K M E T R O P O L I T A N T R A N S P O R T A T I O N C O U N C I L L O W E R H U D S O N V A L L E Y
Page 5-41
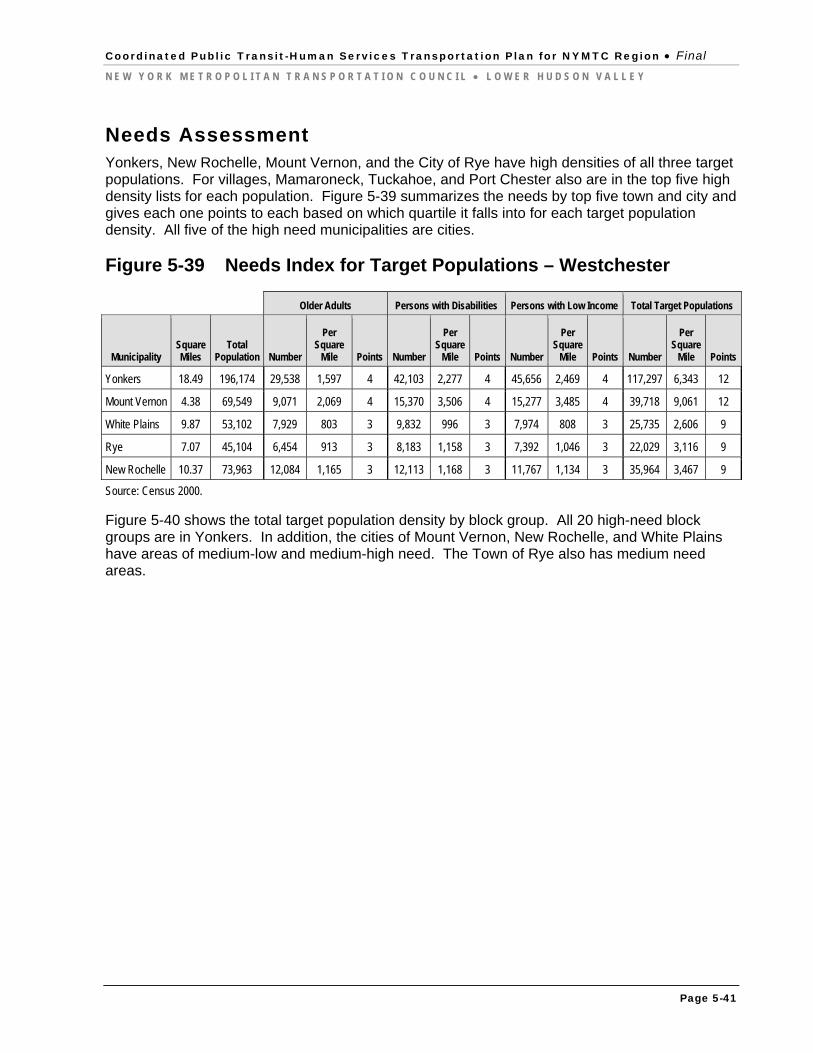
Needs Assessment Yonkers, New Rochelle, Mount Vernon, and the City of Rye have high densities of all three target populations. For villages, Mamaroneck, Tuckahoe, and Port Chester also are in the top five high density lists for each population. Figure 5-39 summarizes the needs by top five town and city and gives each one points to each based on which quartile it falls into for each target population density. All five of the high need municipalities are cities.
Figure 5-39 Needs Index for Target Populations – Westchester
Older Adults Persons with Disabilities Persons with Low Income Total Target Populations
Municipality Square Miles
Total Population Number
Per Square
Mile Points Number
Per Square
Mile Points Number
Per Square
Mile Points Number
Per Square
Mile Points
Yonkers 18.49 196,174 29,538 1,597 4 42,103 2,277 4 45,656 2,469 4 117,297 6,343 12
Mount Vernon 4.38 69,549 9,071 2,069 4 15,370 3,506 4 15,277 3,485 4 39,718 9,061 12
White Plains 9.87 53,102 7,929 803 3 9,832 996 3 7,974 808 3 25,735 2,606 9
Rye 7.07 45,104 6,454 913 3 8,183 1,158 3 7,392 1,046 3 22,029 3,116 9
New Rochelle 10.37 73,963 12,084 1,165 3 12,113 1,168 3 11,767 1,134 3 35,964 3,467 9
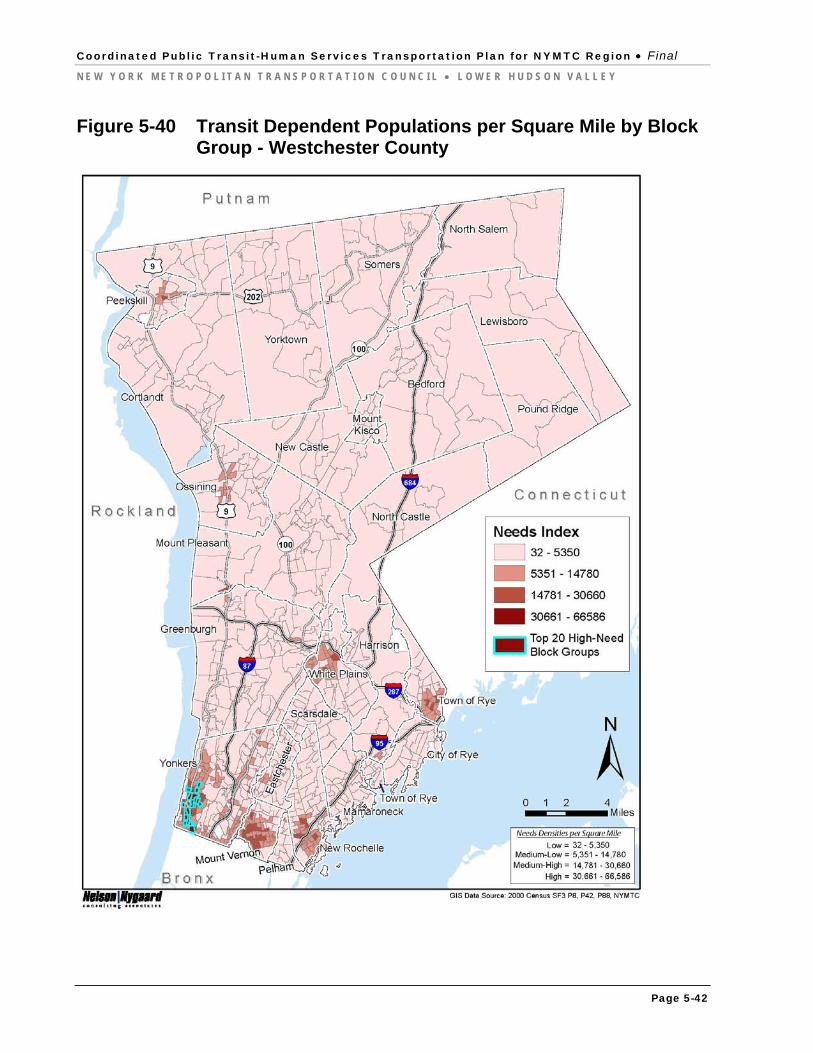
Source: Census 2000. Figure 5-40 shows the total target population density by block group. All 20 high-need block groups are in Yonkers. In addition, the cities of Mount Vernon, New Rochelle, and White Plains have areas of medium-low and medium-high need. The Town of Rye also has medium need areas.
Coordinated Public Transit-Human Services Transportation Plan for NYMTC Region Final
N E W Y O R K M E T R O P O L I T A N T R A N S P O R T A T I O N C O U N C I L L O W E R H U D S O N V A L L E Y
Page 5-42
Figure 5-40 Transit Dependent Populations per Square Mile by Block Group - Westchester County
Related Documents