Compelling Interest – Prepublication Draft _______________________________________ Chapter 4 / Page 1 Chapter 4 Standardized Testing and Equal Access: A Tutorial by Linda F. Wightman University of North Carolina--Greensboro Introduction Standardized testing has played an increasingly prominent role in higher education admission decisions, particularly during the latter half of the twentieth century. Simultaneously, it has also played an increasingly prominent role in the threat to diversity in higher education in an era of rising opposition to affirmation action policies and practices. This latter role for admission testing is primarily a result of the way that test scores are used and interpreted; it is not the tests themselves that create the problem. Substantial research evidence supports the validity of standardized admission tests as one factor in the admission process. Evidence of test score misuse also exists. One example of score misuse is over-reliance on standardized test scores for higher education admission decisions, ignoring a solid research base demonstrating their limitations. Related problems include viewing a test score as a comprehensive and objective measure of merit in selecting applicants, and using scores of admitted applicants to assess the quality of an academic institution. Such misuses of admission test scores result in systematic adverse impact on minority applicants to higher education; they also mask the value of these instruments when they are used for the purposes for which they were intended. Yet, despite the available data, there has been increasing call, particularly among the media and politicians most recently, to use test scores beyond the uses for which they were validated. Adding to the problem of inappropriate use of standardized tests in the complex admission process are several assumptions and suppositions about those tests for which little or no research support exists. One goal of this chapter is to identify critical issues that must be evaluated when test scores are included among the factors considered in higher education admission decisions. Other goals are to bring to bear on those issues a compilation of relevant research and to identify critical areas in which supporting research is outdated, insufficient, or non-existent.

Welcome message from author
This document is posted to help you gain knowledge. Please leave a comment to let me know what you think about it! Share it to your friends and learn new things together.
Transcript
Compelling Interest – Prepublication Draft_______________________________________
Chapter 4 / Page 1
Chapter 4
Standardized Testing and Equal Access:A Tutorialby Linda F. Wightman
University of North Carolina--Greensboro
Introduction
Standardized testing has played an increasingly prominent role in higher educationadmission decisions, particularly during the latter half of the twentieth century. Simultaneously,it has also played an increasingly prominent role in the threat to diversity in higher education inan era of rising opposition to affirmation action policies and practices. This latter role foradmission testing is primarily a result of the way that test scores are used and interpreted; it isnot the tests themselves that create the problem.
Substantial research evidence supports the validity of standardized admission tests asone factor in the admission process. Evidence of test score misuse also exists. One exampleof score misuse is over-reliance on standardized test scores for higher education admissiondecisions, ignoring a solid research base demonstrating their limitations. Related problemsinclude viewing a test score as a comprehensive and objective measure of merit in selectingapplicants, and using scores of admitted applicants to assess the quality of an academicinstitution. Such misuses of admission test scores result in systematic adverse impact onminority applicants to higher education; they also mask the value of these instruments when theyare used for the purposes for which they were intended. Yet, despite the available data, there hasbeen increasing call, particularly among the media and politicians most recently, to use testscores beyond the uses for which they were validated.
Adding to the problem of inappropriate use of standardized tests in the complexadmission process are several assumptions and suppositions about those tests for which littleor no research support exists. One goal of this chapter is to identify critical issues that must beevaluated when test scores are included among the factors considered in higher educationadmission decisions. Other goals are to bring to bear on those issues a compilation of relevantresearch and to identify critical areas in which supporting research is outdated, insufficient, ornon-existent.
Compelling Interest – Prepublication Draft___________________________________
Chapter 4 / Page 2
An Historical Perspective on the Use of Standardized Testsin the Higher Education Admission Process
The enthusiasm with which standardized tests were embraced in the era followingWorld War II was partly an expedient response to the substantial increase in the number ofcollege applications that needed to be reviewed and partly a consequence of the perception oftests as neutral arbiters of academic credentials. The college opportunities afforded through theGI Bill resulted in an influx of college applicants who were not products of the socially eliteprivate education system. Standardized test scores were viewed as a mechanism for admissioncommittees to evaluate grades and courses from schools with which they were not familiar. Thus, an anticipated consequence of the early employment of standardized higher educationadmission tests was to open the doors of educational opportunity to a broad range of studentswho were not part of the traditional privileged college-going population, particularly doors to theelite schools in the northeast.
Over the years, the perception of standardized admission tests has changed from oneof inclusion to one of exclusion, often viewed as a mechanism to deny access to increasinglyscarce educational opportunities, especially at the most selective institutions where the numberof applicants substantially exceeds the number of available places. This section will explore thehistory of standardized testing in higher education admissions, and will also trace changes in thedemographics of the college applicant population, to provide a perspective on where we are andhow we got here.
The Development and Growth of Admission TestsThe introduction of a common admission test that could be used as part of the
admission criteria across multiple colleges was first introduced in the U.S. in 1900. Prior to thattime, each college that chose to use an entrance examination administered its own. Primarilyprivate colleges in the northeast used entrance examinations. Those examinations were designedby each college to assure that its admittees had acquired an adequate foundation in coreacademic courses and that they were prepared to undertake rigorous college work. The contentof the examinations varied from one college to the next. From the perspective of secondaryschool headmasters, one problem with these examinations was that the secondary school neededto prepare multiple curricula for their students in order to assure that they would receiveinstruction in the subject areas deemed important by the college(s) to which they applied. Asecond problem was that students applying to several colleges needed to prepare for and sit forseveral examinations. The urging from secondary school headmasters prompted theconsideration of a common examination by a small group of colleges in the northeast. Duringthe first half of the twentieth century, that initial consideration evolved into formal extensivenation-wide testing of undergraduate, graduate, and professional school applicants as part of thehigher education application and admission process. The chronology of key events in thedevelopment of the major standardized admission tests used by higher education is summarizedin Table 1.
Hanford (1991) provides a comprehensive and detailed history of the development ofcollege admission testing programs. The following descriptions of the development of the SATand the founding of ETS are summaries of selected highlights from that history.
In 1900, a small group of influential colleges in the Northeast first agreed on coresubject areas that would be included in the entrance examination process, and then agreed toadminister a common examination to all their applicants. This group of colleges established the
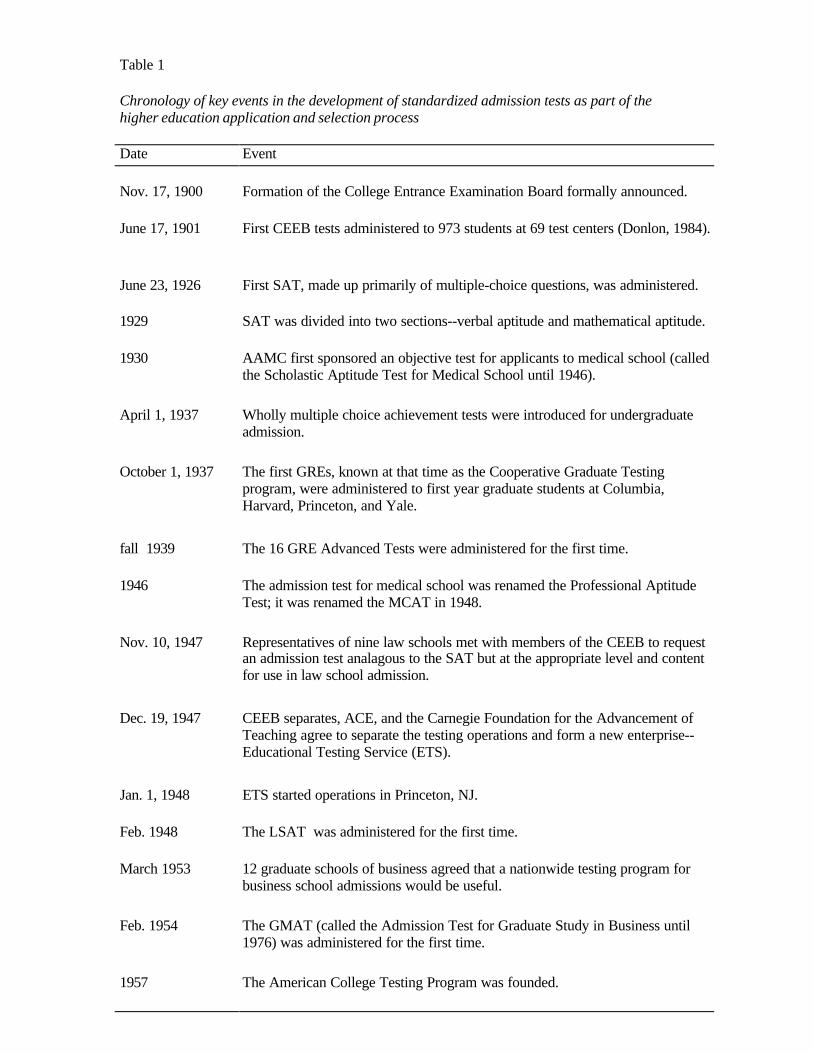
Table 1
Chronology of key events in the development of standardized admission tests as part of the higher education application and selection process
Date Event
Nov. 17, 1900 Formation of the College Entrance Examination Board formally announced.
June 17, 1901 First CEEB tests administered to 973 students at 69 test centers (Donlon, 1984).
June 23, 1926 First SAT, made up primarily of multiple-choice questions, was administered.
1929 SAT was divided into two sections--verbal aptitude and mathematical aptitude.
1930 AAMC first sponsored an objective test for applicants to medical school (calledthe Scholastic Aptitude Test for Medical School until 1946).
April 1, 1937 Wholly multiple choice achievement tests were introduced for undergraduateadmission.
October 1, 1937 The first GREs, known at that time as the Cooperative Graduate Testingprogram, were administered to first year graduate students at Columbia,Harvard, Princeton, and Yale.
fall 1939 The 16 GRE Advanced Tests were administered for the first time.
1946 The admission test for medical school was renamed the Professional AptitudeTest; it was renamed the MCAT in 1948.
Nov. 10, 1947 Representatives of nine law schools met with members of the CEEB to requestan admission test analagous to the SAT but at the appropriate level and contentfor use in law school admission.
Dec. 19, 1947 CEEB separates, ACE, and the Carnegie Foundation for the Advancement ofTeaching agree to separate the testing operations and form a new enterprise--Educational Testing Service (ETS).
Jan. 1, 1948 ETS started operations in Princeton, NJ.
Feb. 1948 The LSAT was administered for the first time.
March 1953 12 graduate schools of business agreed that a nationwide testing program forbusiness school admissions would be useful.
Feb. 1954 The GMAT (called the Admission Test for Graduate Study in Business until1976) was administered for the first time.
1957 The American College Testing Program was founded.

Compelling Interest – Prepublication Draft___________________________________
Chapter 4 / Page 3
College Entrance Examination Board (CEEB) to prepare and administer the new examinationson their behalf. The CEEB was initially located on the Columbia University campus in New YorkCity. The first examinations developed by the CEEB were essay examinations, not multiplechoice, and were subject matter specific. Preparatory school headmasters welcomed the newexaminations, primarily because the content of the new examinations provided a detaileddescription of the secondary school curriculum that was valued by the group of colleges towhich their students aspired. This common essay examination system worked efficiently duringthe period in which the original participating colleges obtained their new students from thenarrow pool of U.S. preparatory schools in the northeast. Shortly after World War I, several ofthose colleges began expanding the geographic area from which they recruited their potentialstudents, with thoughts of becoming national rather than local colleges and universities. Whentheir recruitment goals incorporated attracting academically able applicants from beyond theconfines of the elite northeast preparatory schools with which they were familiar, the collegesrequested that the CEEB revise the test content to make it more comprehensive and lessprescriptive. Simultaneous with (and at least partly a consequence of) the request for a shift inexamination emphasis from the highly specific to a more general content, the CEEB began itsfirst experimentation with the use of the multiple choice item format. Because multiple choicequestions could be answered so much more quickly than essay questions, they were seen as avehicle for more broadly sampling applicants’ abilities and subject-matter knowledge.
At the request of the CEEB, Carl Brigham, a psychology professor from PrincetonUniversity, developed a battery of multiple choice questions to be used as an alternative to theoriginal College Board essay examinations. He used the Army Alpha Test of general abilities,developed during World War I by the U.S. army to sort recruits into appropriate assignments,as a model. CEEB administered the first multiple choice SAT in June, 1926. Brigham alsodeveloped a multiple-choice version of examinations designed to assess subject specificknowledge to be used in conjunction with the general aptitude assessment of the SAT. Initially,the participating colleges were uncertain about the utility and the validity of the multiple-choiceformat. It was not long before they accepted that the new item format provided them withuseful information about the academic preparation and potential of their applicants. Even so, itwasn’t until the start of World War II that the multiple-choice examination fully replaced theessay examinations. The replacement was primarily a practical consequence of the travelrestrictions related to the war. That is, the professors and secondary school teachers whotraditionally graded the essays were unable to travel to NYC in order to grade the essays. By thetime the war ended and the travel restrictions were lifted, the volume of new college applicantsresulting from the GI bill made it impractical to return to the old free response essayexaminations. Additionally, colleges had become comfortable with the new test content andscoring, and so the multiple-choice format of the SAT became firmly entrenched.
The CEEB’s success with the SAT aroused the interest of both graduate andprofessional schools. By the end of World War II, the CEEB was also administering the MedicalCollege Admission Test (MCAT) and the Graduate Record Examinations (GRE), and developingthe Law School Admission Test (LSAT). The expanding testing activities required expandingresources—resources beyond those anticipated and available under the then current structure.In response, the College Board, along with two other enterprises that were engaged in testingactivities (the American Council on Education and the Carnegie Foundation for the Advancementof Teaching) decided to consolidate test development, test administration, and test-relatedresearch into an independent organization. In 1947, the New York Board of Regents granted acharter to the newly formed Educational Testing Service. From its inception, ETS was an
Compelling Interest – Prepublication Draft___________________________________
Chapter 4 / Page 4
organization separate from CEEB, with ETS serving as the test-maker, but CEEB owning theSAT and maintaining policy control over it. The College Board, first alone and then with ETS,held a monopoly in the college admission testing business from its establishment in 1900 until1959, when the American College Testing Program (ACT) was founded by E. F. Lindquist.
ACT was founded in response to a conception by Lindquist of the purpose for collegeentrance examinations that was different from that of ETS and the College Board. Specifically,Lindquist argued that a college entrance examination should predict college success but shouldalso serve other educational purposes. The test envisioned by Lindquist would be "useful to highschool counselors in advising students on their educational and vocational careers, or on theirchoice of type of college" (Lindquist, 1958, p. 106.) It also would be useful to high schoolteachers in "adapting instruction to individual differences, and to high school administrators inevaluating the entire educational offering of the school. Likewise, the same test battery mightbe useful to the college authorities for placement purposes, or for purposes of counseling andguidance, or to help them better define the college's task by more adequately describing thestatus and needs of their entering student body" (Lindquist, 1958, p. 106-107.) The first ACTwas administered in the fall of 1959.
The differences in purpose between the ACT and the SAT articulated by Lindquist morethan 40 years ago continue to define the primary distinctions between the two testing programstoday. When the ACT was first introduced, it was utilized primarily in the Midwest, while theSAT was the examination of choice on the east and west coasts. Over the years, partly as aconsequence of national marketing efforts by both organizations, and partly as a consequenceof changing needs among colleges, many colleges and universities today accept either ACT orSAT scores from their applicants.
The Changing Face of the Applicant PoolDuring the period in which the new tests where taking their place in the college
admissions process, both the number and the demographic characteristics of students enteringhigher education were undergoing change. The changes in the applicant pool were veryinstrumental in establishing the place of the SAT and ACT at the undergraduate level and theGRE, LSAT, GMAT, and MCAT at the graduate and professional school level. The search forapplicants from a more national pool beginning around 1930 initiated the increase in the applicantpopulation; the number of college aspirants increased more significantly following World WarII, primarily as a consequence of new government support for education. Even so, the ethnicdiversity of those seeking college admission did not increase noticeably until the late sixties andearly seventies.
Ethnic and Gender Diversity in the Applicant PoolIn 1954 a statement defining the right of minorities to have access to higher education
was clearly articulated by the U.S. Supreme Court in the important civil rights case known asBrown v. Board of Education. One of the most noteworthy outcomes of that case was theSupreme Court’s explicit position that admission to publicly supported colleges and universitiescould not be denied on the basis of race. The decision in Brown struck down the practice of"separate but equal" in education. Several earlier cases pave the way for this landmark decision.These include Missouri ex rel. Gaines vs. Canada (305 US 337, 1938)1; Sipeil vs. Board of
1 In Missouri ex rel. Gaines vs. Canada, the Supreme Court determined that the University ofMissouri could not deny admission to a black student, despite the University’s willingness to send
Compelling Interest – Prepublication Draft___________________________________
Chapter 4 / Page 5
Regents of the University of Oklahoma (332 US 631, 1948),2; Sweatt and Painter vs. Universityof Texas Law School (339 US 629, 1950) and McLaurin vs. Oklahoma State University (339US 637, 1950)3. Despite the clear position of the Supreme Court, states resisted. Thus, therulings by themselves failed to produce a large influx of minority students into higher education.Both the Civil Rights Act of 1964 and subsequent efforts by civil rights groups to assure thatthe Act was enforced were required before evidence of increased access was seen in enrollmentstatistics. A variety of additional factors contributed to the change in the demographic makeupof the higher education population. These included “the infusion of federal funds into institutionsof higher education and the resulting “greater autonomy in decision on admissions” (Karen,1990, p.230); the implementation of ‘need-blind’ admission practices in the mid-1960s by mostelite colleges, assuring that no applicants would be denied admission because of financial neednor denied financial aid after they were admitted; and the introduction of affirmative actionprograms for women and minorities in the late 1960s.
Availability of DataData about minority enrollment in higher education prior to the early 1970's is both
scare and constrained. Information about changes in minority enrollment from the mid-1950sto the mid-1970s is limited by the lack of systematic data collection during that period. The U.S.Census Bureau was the primary source of data about minority enrollment during much of thatperiod, and the accuracy of some of that data, which was extrapolated from interviews of only50,000 households, is questionable (Abramowitz, 1976). Another source of data was the Officeof Civil Rights, which collected data through biennial surveys. Its early surveys lackedcontinuity, omitted certain ethnic groups, and covered only full-time students (National AdvisoryCommittee on Black Higher Education and Black Colleges and Universities, 1979, p.10). In 1976,the Office of Civil Rights and the National Center for Education Statistics (NCES) beganworking collaboratively on data collection and compilation, resulting in increased quality andconsistency of data. Despite their limitations, the available data provide some indication of theshifting demographics during a critical time period in higher education. These data are especiallyimportant because they demonstrate how small the presence of minority college applicants andstudents was in higher education during the development and norming of standardized tests usedfor admission to undergraduate, graduate and professional schools.
Trends in the DataThe available data demonstrate gains in enrollment for ethnic minority groups over the
past 30 years, particularly in the early years following the Civil Rights Act. Information aboutblack students was recorded earlier than was information about other minority groups. Those
the student to any of the four adjoining states that would admit him.
2 In this case, the Supreme Court responded to the University’s refusal to admit black students bydemanding that it provide a law school education to qualified applicants regardless of race.
3 The rulings in, Sweatt and Painter vs. University of Texas Law School and McLaurin vs.Oklahoma State University came down on the same day in 1950. In each of those rulings, the courtagain confirmed that students could not be excluded from educational opportunity based on race.It further demanded that physically separating black students from white students after admittingthem to the program did not provide equal educational opportunity and was not acceptable.
Compelling Interest – Prepublication Draft___________________________________
Chapter 4 / Page 6
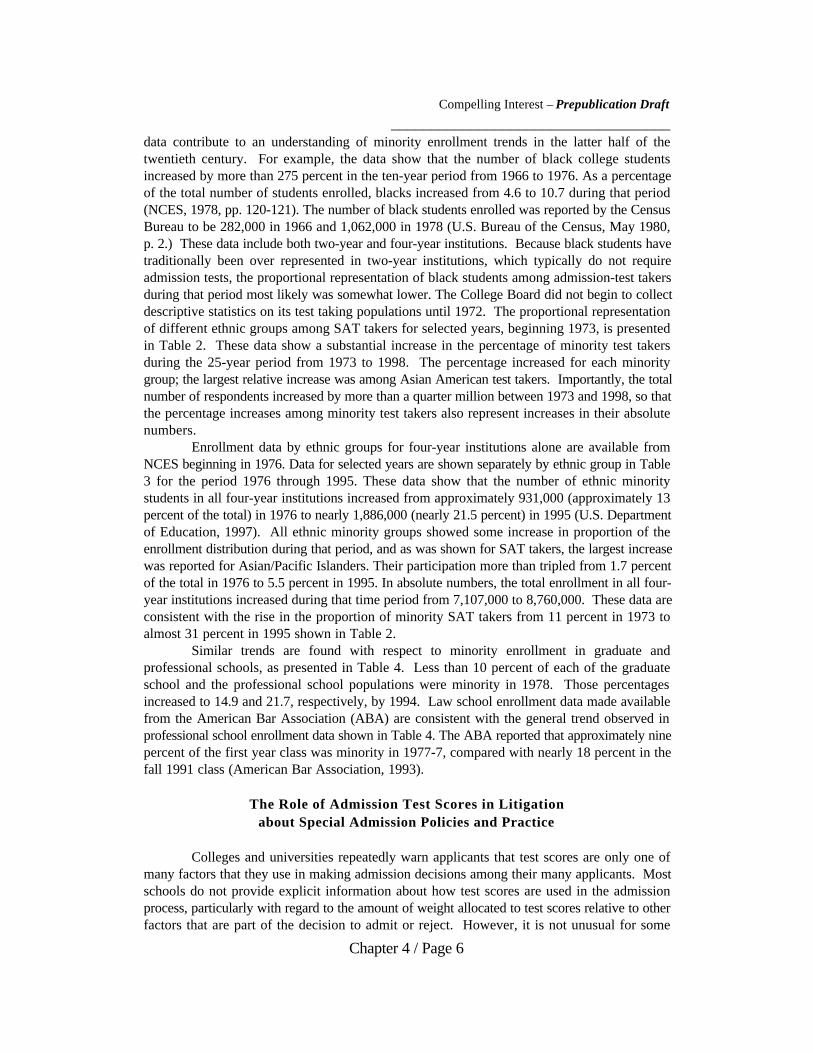
data contribute to an understanding of minority enrollment trends in the latter half of thetwentieth century. For example, the data show that the number of black college studentsincreased by more than 275 percent in the ten-year period from 1966 to 1976. As a percentageof the total number of students enrolled, blacks increased from 4.6 to 10.7 during that period(NCES, 1978, pp. 120-121). The number of black students enrolled was reported by the CensusBureau to be 282,000 in 1966 and 1,062,000 in 1978 (U.S. Bureau of the Census, May 1980,p. 2.) These data include both two-year and four-year institutions. Because black students havetraditionally been over represented in two-year institutions, which typically do not requireadmission tests, the proportional representation of black students among admission-test takersduring that period most likely was somewhat lower. The College Board did not begin to collectdescriptive statistics on its test taking populations until 1972. The proportional representationof different ethnic groups among SAT takers for selected years, beginning 1973, is presentedin Table 2. These data show a substantial increase in the percentage of minority test takersduring the 25-year period from 1973 to 1998. The percentage increased for each minoritygroup; the largest relative increase was among Asian American test takers. Importantly, the totalnumber of respondents increased by more than a quarter million between 1973 and 1998, so thatthe percentage increases among minority test takers also represent increases in their absolutenumbers.
Enrollment data by ethnic groups for four-year institutions alone are available fromNCES beginning in 1976. Data for selected years are shown separately by ethnic group in Table3 for the period 1976 through 1995. These data show that the number of ethnic minoritystudents in all four-year institutions increased from approximately 931,000 (approximately 13percent of the total) in 1976 to nearly 1,886,000 (nearly 21.5 percent) in 1995 (U.S. Departmentof Education, 1997). All ethnic minority groups showed some increase in proportion of theenrollment distribution during that period, and as was shown for SAT takers, the largest increasewas reported for Asian/Pacific Islanders. Their participation more than tripled from 1.7 percentof the total in 1976 to 5.5 percent in 1995. In absolute numbers, the total enrollment in all four-year institutions increased during that time period from 7,107,000 to 8,760,000. These data areconsistent with the rise in the proportion of minority SAT takers from 11 percent in 1973 toalmost 31 percent in 1995 shown in Table 2.
Similar trends are found with respect to minority enrollment in graduate andprofessional schools, as presented in Table 4. Less than 10 percent of each of the graduateschool and the professional school populations were minority in 1978. Those percentagesincreased to 14.9 and 21.7, respectively, by 1994. Law school enrollment data made availablefrom the American Bar Association (ABA) are consistent with the general trend observed inprofessional school enrollment data shown in Table 4. The ABA reported that approximately ninepercent of the first year class was minority in 1977-7, compared with nearly 18 percent in thefall 1991 class (American Bar Association, 1993).
The Role of Admission Test Scores in Litigationabout Special Admission Policies and Practice
Colleges and universities repeatedly warn applicants that test scores are only one ofmany factors that they use in making admission decisions among their many applicants. Mostschools do not provide explicit information about how test scores are used in the admissionprocess, particularly with regard to the amount of weight allocated to test scores relative to otherfactors that are part of the decision to admit or reject. However, it is not unusual for some
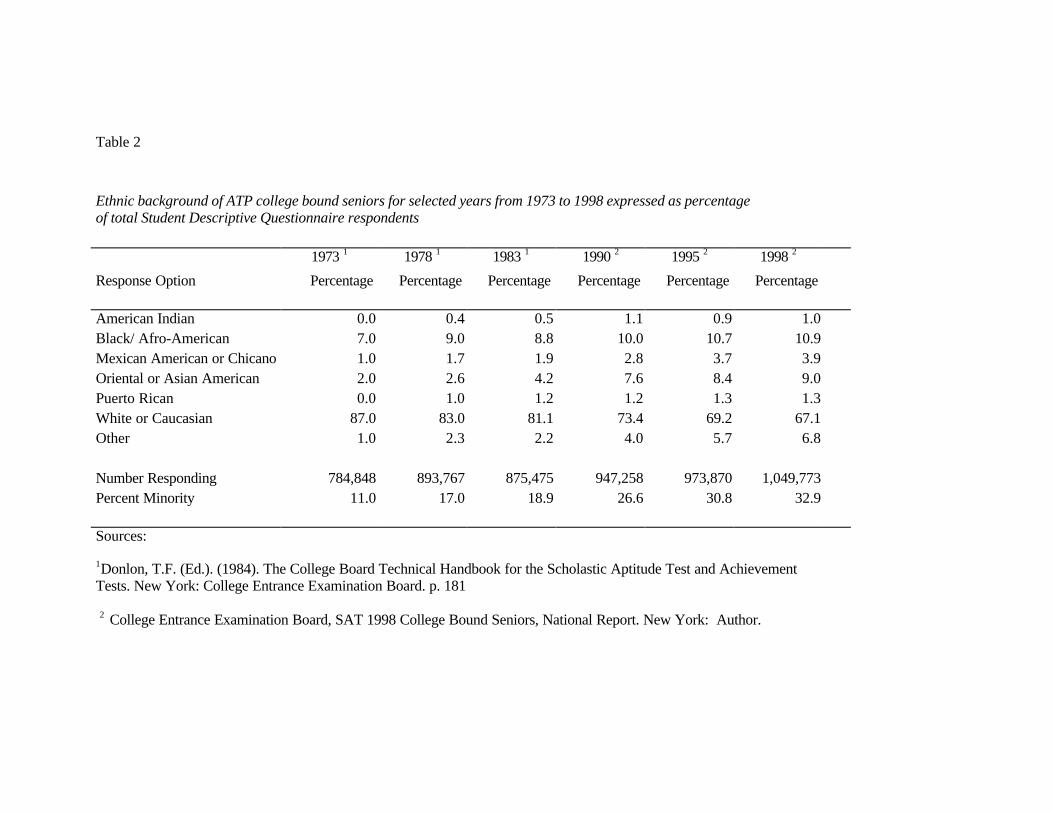
Table 2
Ethnic background of ATP college bound seniors for selected years from 1973 to 1998 expressed as percentageof total Student Descriptive Questionnaire respondents
1973 1 1978 1 1983 1 1990 2 1995 2 1998 2
Response Option Percentage Percentage Percentage Percentage Percentage Percentage
American Indian 0.0 0.4 0.5 1.1 0.9 1.0Black/ Afro-American 7.0 9.0 8.8 10.0 10.7 10.9Mexican American or Chicano 1.0 1.7 1.9 2.8 3.7 3.9Oriental or Asian American 2.0 2.6 4.2 7.6 8.4 9.0Puerto Rican 0.0 1.0 1.2 1.2 1.3 1.3White or Caucasian 87.0 83.0 81.1 73.4 69.2 67.1Other 1.0 2.3 2.2 4.0 5.7 6.8
Number Responding 784,848 893,767 875,475 947,258 973,870 1,049,773Percent Minority 11.0 17.0 18.9 26.6 30.8 32.9
Sources:
1Donlon, T.F. (Ed.). (1984). The College Board Technical Handbook for the Scholastic Aptitude Test and AchievementTests. New York: College Entrance Examination Board. p. 181
2 College Entrance Examination Board, SAT 1998 College Bound Seniors, National Report. New York: Author.
Table 3
Total enrollment in four-year institutions of higher education, by race/ethnicity of student, for selected years from fall 1976 to fall 1995 (Numbers in thousands)
Race/ethnicity 1976 1980 1990 1993 1995
Total 7,107 7,565 8,579 8,739 8,760
White 5,999 6,275 6,768 6,639 6,517
Total Minority 931 1,050 1,486 1,734 1,886
American Indian/Alaskan Native
35 37 48 59 66
Asian American 119 162 357 429 482
Black 604 634 723 814 852
Hispanic 173 217 358 432 486
Source: US Department of Education, NCES, Digest of Educational Statistics, 1997.

Table 4
Graduate and professional school enrollment by race/ethnicity for selected years fromfall 1978 to fall 1994 (Numbers in thousands)
Race/ethnicity 1978 1982 1988 1994
GRADUATE SCHOOL ENROLLMENT
Total 1,219 1,235 1,472 1,722
White, non-Hispanic 1,019 1,002 1,153 1,287
Total Minority 120 123 167 256
Asian American 24 30 46 73
Black, non-Hispanic 68 61 76 111
Hispanic 24 27 39 64
PROFESSIONAL SCHOOL ENROLLMENT
Total 255 278 267 295
White, non-Hispanic 229 246 223 224
Total Minority 22 29 39 64
Asian American 5 8 14 28
Black, non-Hispanic 11 13 14 21
Hispanic 5 7 9 13
Sources: US Department of Education, NCES, Trends in racial/ethnic enrollment: Fall 1978through 1988. Washington, DC: U.S. Government Printing Office, June, 1990.US Bureau of the Census, Statistical abstract of the United States: 1997.Washington,DC, 1997.
Compelling Interest – Prepublication Draft___________________________________
Chapter 4 / Page 7
applicants who were denied admission, particularly to more highly competitive schools, to havehigher test scores than many applicants who were admitted. And yet, denial of admission towhite applicants who earned higher standardized test scores than did applicants of color whogained admission has repeatedly served as the trigger to litigation in the area of affirmative actionadmissions in higher education. This section will explore the past, present, and future ofaffirmative action litigation from the narrow perspective of the role of test scores in shaping thecomplaints, the defenses, and the rulings.
Affirmative action programs were introduced in higher education systems in the late1960s with a stated goal of increasing and encouraging minority participation in highereducation. The ways in which colleges implemented those programs have been the subject oflitigation over the past twenty years. Most legal challenges to affirmative action admissionpractice have been predicated on interpretation of the fourteenth amendment to the U.S.Constitution. The fourteenth amendment provides that “No State shall make or enforce any lawwhich shall...deny to any person within its jurisdiction the equal protection of the laws.” Itsoriginal purpose was to assure that newly freed slaves were treated fairly by state law. Inaffirmative action litigation, the clause has been subject to varying interpretations. Thus far, theSupreme Court has been supportive of programs developed by colleges and universities designedto remedy past discrimination or to achieve diversity, but it also has imposed limits on thoseprograms to prevent misuse or abuse. Key among those limits are that race-based affirmativeaction programs must be subjected to strict scrutiny and that the use of inflexible quotas,especially using race as the only factor for selection is prohibited. The Supreme Court’s mostextensive explication of the limitations of race conscious admission practices came in its rulingon a landmark case, the Regents of the University of California vs. Bakke, in 1978,in whichdifferential use of test scores was challenged under the fourteenth amendment.
An Overview of BakkeAlan Bakke applied for admission to the University of California—Davis Medical School
during two different admission cycles and was denied both times. At the time he applied, themedical school used two separate admission standards—one for regular admissions and theother for a special program. The special admission program was designed to provide applicantsfrom economically or educationally disadvantaged backgrounds the opportunity to be admittedwhen they otherwise would not because their applications did not meet traditional academicrequirements. The school reserved 16 of its 100 seats exclusively for applicants accepted underthat program. Applicants checked a box on their application if they wanted to be consideredunder the special program. The practice at the medical school at the time Bakke was anapplicant was to automatically reject applicants to the regular admission program if their testscores and grades were below a certain cut-off point. In contrast, applicants to the specialprogram were not automatically rejected because of low test scores or low grades. Further, theadmission committee did not rank their test scores against those of applicants in the regularadmission pool.
White applicants were eligible to request consideration under the special admissionprogram, but, at the time of Bakke’s complaint, none had ever been admitted under it. In fact,several of the 16 seats reserved for the special admission program remained unfilled in each ofthe years that Bakke was denied and he was not considered for any of them. A primary factorin his complaint was that he had presented higher test scores and grades than did applicants whowere admitted under the special program. The basis of his suit was that he was excluded fromconsideration for admission under the special admission program based exclusively on his race,
Compelling Interest – Prepublication Draft___________________________________
Chapter 4 / Page 8
violating his constitutional right to equal protection under the Fourteenth Amendment. Eventhough the school argued that he did not meet the criteria of educational or economicdisadvantage, the court agreed with Bakke that race was the only factor that determined whowould be admitted under the special program. On that basis, the Supreme Court found thatUC—Davis’ special admission program violated the U.S. Constitution. From the perspective ofaffirmative action practices, the importance of Bakke was not in the Court’s finding withrespect to the special program at UC—Davis. Rather, it was in the opinion of a majority ofjustices that while race could not be used as the sole factor for admission, race could beconsidered as a factor in order to remedy past discrimination. This endorsement is found inJustice Powell’s declaration that “race or ethnic background may be deemed a ‘plus’ in aparticular applicant’s file, [so long as the applicant’s race] does not insulate the individual fromcomparison with all other candidates for the available seats.” Since the Bakke ruling, highereducation has acted under the proposition that when the goal of its admission practice is toestablish or maintain diversity, race could be a factor in the admission process under twoprovisos. One proviso is that diversity is not defined exclusively in racial terms; the other is thatrace is only one of many factors used to admit a diverse class. The court did not define whatthose other factors should be. But, neither did it suggest that having test scores and grades thatwere higher than those of other applicants who were admitted should in itself constitute groundsfor a legal complaint against an institution by an applicant who was denied. Even so, subsequentchallenges to affirmative action practices in admissions to higher education triggered by evidenceor perception of differential use of test scores in the admission process have been raised.
An Overview of HopwoodApproximately 15 years after Bakke, four white applicants to the University of Texas
School of law instigated Hopwood vs. the State of Texas. In 1994, Cheryl Hopwood and thethree other plaintiffs claimed that they were denied admission to the law school while black andMexican American applicants with lower Law School Admission Test (LSAT) scores and lowerundergraduate grade point averages were accepted. At the time that the plaintiffs applied foradmission, UT School of Law had an affirmative action admission program in place that did notdiffer in several respects from the UC-Davis Medical School program that the Supreme Courthad rejected. That is, the school reserved approximately 10% of its places for Mexican Americanapplicants and 5% for black applicants. Additionally, separate admission committees were usedto review minority and non-minority applicants. Thus, minority applicants were not compareddirectly with white applicants. Of relevance to the current discussion, UT relied heavily onLSAT scores and UGPAs in making all its admission decisions. The university claimed to useother factors including undergraduate major, increasing or decreasing grade trends, gradeinflation, personal perspective, life experiences, and state of residency, but admitted to using agross quantitative index, based only on test scores and grades, to initially sort its large volumeof applications. Specifically, the school created an index score by weighting the LSAT score60% and the UGPA 40%. The index score was used to sort applicants into three categories:presumptive admit, discretionary zone, and presumptive deny. The law school offeredadmissions to most but not all applicants in the presumptive admit category and denied admissionto most but not all applicants in the presumptive deny category. Under the affirmative actionadmission program in place at the time, an index value of 199 was required for non-preferredapplicants to be presumptively admitted, while a value of 189 was required for black andMexican American applicants. At the other end of the scale, an index score of 192 or lowerplaced non-preferred applicants in the presumptive deny category, while a 179 or lower placed
Compelling Interest – Prepublication Draft___________________________________
Chapter 4 / Page 9
black or Mexican American applicants in that category. Striking in these figures is the fact thata black or Mexican American applicant was placed in the presumptive admit category with anindex value that was three points lower than the value at which other applicants were placed inthe presumptive deny category. These are the kinds of test and grade data that can leadopponents of affirmative action programs to conclude that a necessary consequence of theseprograms is a compromise of merit and academic standards.
When Hopwood was heard, the district court found that the school’s affirmative actionpractice was in violation of the constitution because it used separate admission committees forminority and majority applicants. However, it did not object to the lower index score requirementfor Black and Mexican American applicants. The court also used information about test scoresand grades to determine that the plaintiffs were not denied admission as a consequence of theschool’s affirmative action program. The data showed that 109 resident white applicants withindex scores lower than Cheryl Hopwood’s had been admitted to the school. Further, 67 residentwhite applicants with index scores lower than the other three plaintiffs had been admitted(Hopwood 861, F. Supp. at 581). The plaintiffs appealed the district court’s decision and theFifth Circuit Court disagreed with the district court about the use of index scores. Moreimportantly, the Fifth Circuit Court held that diversity could never be a compelling governmentalinterest in a public school of higher education. In other words, contrary to the Bakke ruling thatrace could not be used as the sole factor for admission, the Fifth Circuit ruled that thegovernment could never consider race as a factor in college admission decisions. The FifthCircuit ruling applies in the states under its jurisdiction—Texas, Louisiana and Mississippi. TheSupreme Court denied a petition by the University of Texas to review the case.
Further Litigation IssuesBecause the Supreme Court refused to hear an appeal of the Fifth Circuit’s ruling in
Hopwood, its long-term implications remain unresolved. In the meantime, challenges based onsimilar premises, that is, one or more white applicants were denied admission while minorityapplicants with lower test scores and/or grades were accepted, continue to mount. Two lawsuitsfiled against the University of Michigan—one by white students rejected for admission to itsundergraduate program and the other by white students rejected by its Law School—and onelawsuit filed by a white student rejected by the University of Washington School of Law are stillunresolved at the time of this writing.
A common theme across these cases is the use of the quantifiable variables of testscores and prior grades in making admission decisions. The complaints, alleging violations ofthe fourteenth amendment, arose from actual or perceived differential treatment of scores andgrades between white applicants and minority applicants. Courts have found using race as adeterminative criterion in college admissions is a violation of the Fourteenth Amendment. Unfortunately, in the emotions of the debate, test scores and prior grades have taken on meaningand significance beyond their actual value or intended use. Among opponents of affirmativeaction, test scores and grades have become a surrogate for merit, while among proponents, theyrepresent a barrier to equal opportunity.
Some admission programs aimed at increasing diversity in their schools have becomevulnerable to legal challenges, at least partly as a consequence of over-reliance on test scoresand grades. This over-reliance has also fueled the efforts of the popular press to turn the debatefrom one of equal opportunity to one of abandoning merit and academic standards. Test scoresand grades are portrayed as seemingly objective measures that reflect some combination of hardwork and achievement. Their limitations for such use are either misunderstood or purposely

Compelling Interest – Prepublication Draft___________________________________
Chapter 4 / Page 10
ignored. Changing societal perspectives made the time right in 1954 for both the courts and thepublic to re-examine the doctrine of separate but equal (which it did in response to Brown vs.Board of Education). Similarly, the mood of society in the 90s reflects near obsession with theconcept that meritocracy, academic standards and fairness are compromised when racebecomes a factor in admission decisions. Additional research and scholarly analysis would behelpful in refuting the notion that tests alone provide a reliable and precise measure of eithermerit or academic standards. Such work would include, but not be limited to, gathering andcommunicating data for the purpose of demonstrating (1) the legitimate uses of tests, (2) thelimitations of tests even when used legitimately, and (3) the deleterious consequences of usingthem for purposes for which they are not valid. It also should include broader definitions ofmerit as well as empirical links between those definitions and outcome measures such asacademic success, professional contributions, and societal benefits.
Technical Issues in Equity and AssessmentLarge differences in average performance on standardized admission tests between
white test takers and test takers from some minority groups, especially those from black,Hispanic, and American Indian groups, have been widely documented across the spectrum ofundergraduate and graduate admission testing programs. The largest differences tend to bebetween black and white test takers. Those differences are of a magnitude of approximately onestandard deviation in each of the admission testing programs. The average score differencesbetween white students and minority students have led to heated debates about the validity andutility of the tests, particularly with regard to admission decisions for minority group applicants.Other key technical testing issues related to the general questions about test validity are questionsabout test bias and questions about susceptibility of test scores to coaching.
Concerns about these issues are often articulated by testing critics in the following threestatements about the role of testing in the higher education admission process.
• Standardized admission test scores do not add any useful information to the highereducation admission process.
• Admission tests are biased against test takers who are not white and not male.• Admission tests are highly susceptible to coaching, thus undermining their validity
and adding to the test bias issue because test preparation is not as available toeconomically disadvantaged test takers as it is to others.
Empirical research generally does not support these statements. The extensive base of researchon test validity typically concludes that the major higher education admission tests are valid forthe limited purposes for which they were developed. The primary purpose of those tests is tomeasure selected "developed reasoning abilities" that are important to achieving academicsuccess.
Research findings generally refute suppositions both that test bias provides the primaryexplanation for the observed performance differences among test takers from different ethnicgroups and that the tests systematically disadvantage minority applicants to higher educationinstitutions by under-predicting their subsequent academic performance. The data also show thatthe gains realized from test preparation are modest; they fail to show that test taker participationin test preparation activities lowers the predictive validity of the tests. This section willsummarize the existing body of research in the area of test validity and its related issues, and alsowill point to limitations in that research and suggest important issues in need of further research.
Compelling Interest – Prepublication Draft___________________________________
Chapter 4 / Page 11
Predictive ValidityThe application requirements of the vast majority of undergraduate, graduate, and first
professional school programs include scores on one or more of the standardized admission testspreviously described. Admission committees typically use those scores to draw inferences aboutapplicants’ future academic performance, usually first year grades. The usefulness of test scoresfor that purpose is at the heart of the debate about test score validity. The term validity is usedto describe the accumulated evidence to support the inferences that are made from the testscore(s). One form of that evidence, referred to as predictive validity, is demonstrated when astatistical relationship between test scores and subsequent academic performance is established.The measure of academic success most often employed in predictive validity studies is first yeargrades. First year grades are not the only criteria that could be used to establish predictivevalidity evidence, but they are a popular choice for several reasons. First year grades becomeavailable within a year of the start of school, while other criteria may require two or more yearsbefore a study could be conducted. Additionally, first year grades are based on a composite ofacademic performance accumulated over a year of school, thus allowing differences in coursedifficulty and grader stringency to average out. Finally, because many core courses are takenduring the first year of school, the content on which the grade point average is based tends tobe more consistent across students than it is at any later time.
Evidence to support the validity of the frequently used higher education admission testshas been fairly well established. Most major testing programs provide a free validity studyservice for schools using their tests, and hundreds of schools participate each year. The dataanalysis options vary somewhat from program to program, but all provide at least a correlationbetween first year grades as the criterion and each of the following: test score, prior academicgrades (either high school grades or undergraduate grades, depending on whether the criteriongrades are for undergraduate or for graduate or professional school), and the combination of thetwo. The results of those studies are relatively consistent across testing programs. The meanof the correlations obtained across hundreds of studies conducted for individual colleges isapproximately .42 for Verbal and Mathematical SAT scores used together to predict first yeargrades in college (Donlon, 1984, p. 142). Among 685 colleges predicting freshman GPA usingSAT-Verbal and SAT-Mathematics scores during the period 1964 to 1981, 75 percent of thecorrelations exceeded .34 and 90 percent exceeded .27(Donlon, 1984). Among more than 500colleges using the ACT during 1989-90, the median correlation between first year grades incollege and the four ACT scores is .45 (American College Testing Programs, 1991, p. 17).Similarly, the 1993-94 data, based on 361 participating institutions, produced a median multiplecorrelation between college grade average and the four ACT Assessment scores of .43(American College Testing Programs, 1997, p. 56).
The correlations of test scores with first year grades in graduate and professionalschools tend to be as higher or higher. Median correlations between .21 and .41 have beenreported for the GMAT, LSAT, MCAT, and GRE General Test (Livingston & Turner, 1982;Wightman, 1993; Wightman & Leary, 1985). In addition to the routine testing-program-sponsored validity studies, many independent studies validating the tests used in admissiondecisions have been reported in the literature (see, for example, Kramer & Johnston, 1997; Pharret al, 1993; Zwick, 1993). The results from independent studies are consistent with thosereported by the testing programs.
The correlation coefficients provide evidence of the validity of the tests, but themeaning of the correlation coefficient is sometimes misunderstood by consumers and test score
Compelling Interest – Prepublication Draft___________________________________
Chapter 4 / Page 12
users who have no training in basic statistics. That misunderstanding at least partly explains whysome continue to raise questions about the predictive validity of admission tests despite theextensive research supporting it. It may also explain why others respond to claims of substantialvalidity evidence by calling on test scores to do more than they were ever intended to do. A briefexplanation and illustration of correlation coefficients as they are used to evaluate the predictivevalidity of admission tests follows in order to help explicate their use and interpretation.
When a test score is used to predict subsequent academic performance (e.g., first yeargrades), a prediction equation that quantifies the relationship between test score and FYA isdeveloped. The prediction equation can be represented by a straight line on a graph that showsfor every student a single point that is determined by the student’s (1) score on the predictor(e.g., the test score) and (2) score on the criterion (e.g., FYA). The exact position of the lineon the graph is calculated so as to minimize the (squared) distance of every test/FYA-point fromthe line. The correlation coefficient is an indicator of how well the line represents the points onthe graph. Correlations can take on values from zero—meaning there is no relationship betweentwo variables—to one—meaning there is a perfect one-to-one correspondence between twovariables. That is, when the correlation coefficient is 0, there is no relationship between the twovariables depicted on the graph. The closer the correlation is to 1, the closer the points are tothe line. And, the closer the points are to the line, the more accurately the predictor (e.g., testscores) predicts the criterion score (e.g., FYA). Figure 1 illustrates the relative meaning ofcorrelations of different magnitudes. It presents three examples of data points and best fittingprediction lines for hypothetical samples of 100 students who have both test score data and firstyear grades. In each example, test score is the predictor and FYA is the criterion. The testscores are reported on a scale of 200 to 800, with a mean of 500 and a standard deviation of100. First year grades are reported on a scale of 1 to 4 with a mean of 3.0 and a standarddeviation of .45. Three different correlations coefficients (r) are represented in the illustrations--0.0, 0.4, and 0.6. A correlation value of 0.4 was selected for illustration because it is close tothe median correlation reported by most higher education admission testing programs. A valueof 0.6 is included because it represents the upper end of individual school correlations reportedamong the different testing programs. A value of 0.0 provides a baseline against which toexamine the other relationships.
Notice that when the correlation is equal to zero, the prediction line is parallel to the X-axis (the axis on which the test scores are denoted) and crosses the Y-axis (the axis where firstyear grades are denoted) at the value equal to the average FYA. That is, if there were norelationship between test scores and grades, the prediction line would predict the mean FYA forevery student, regardless of test score. When the correlations increase, the line slopes upward,so that students with higher test scores are predicted to earn FYAs higher than the mean FYA,and students with lower test scores are predicted to earn FYAs lower than the mean FYA.Notice also how much the points are scattered around the prediction line in both the second andthe third illustration relative to the scatter in the illustration in which the correlation is zero. Eachpoint above the line represents a student whose FYA is higher than was predicted by her testscore. Each point below the line represents an FYA lower than predicted. The closer the pointsare to the prediction line, the more accurate the prediction of FYA based on test score. The datapresented in Figure 1 illustrate the accuracy with which test scores predict subsequent academicperformance when correlations are of the magnitude typically reported by higher educationadmission testing programs. The figures clearly show that prediction based on test scores issuperior to simply predicting the average FYA for every applicant (the best alternative if therewere no relationship between the two.) The figures also illustrate the lack of precision for an
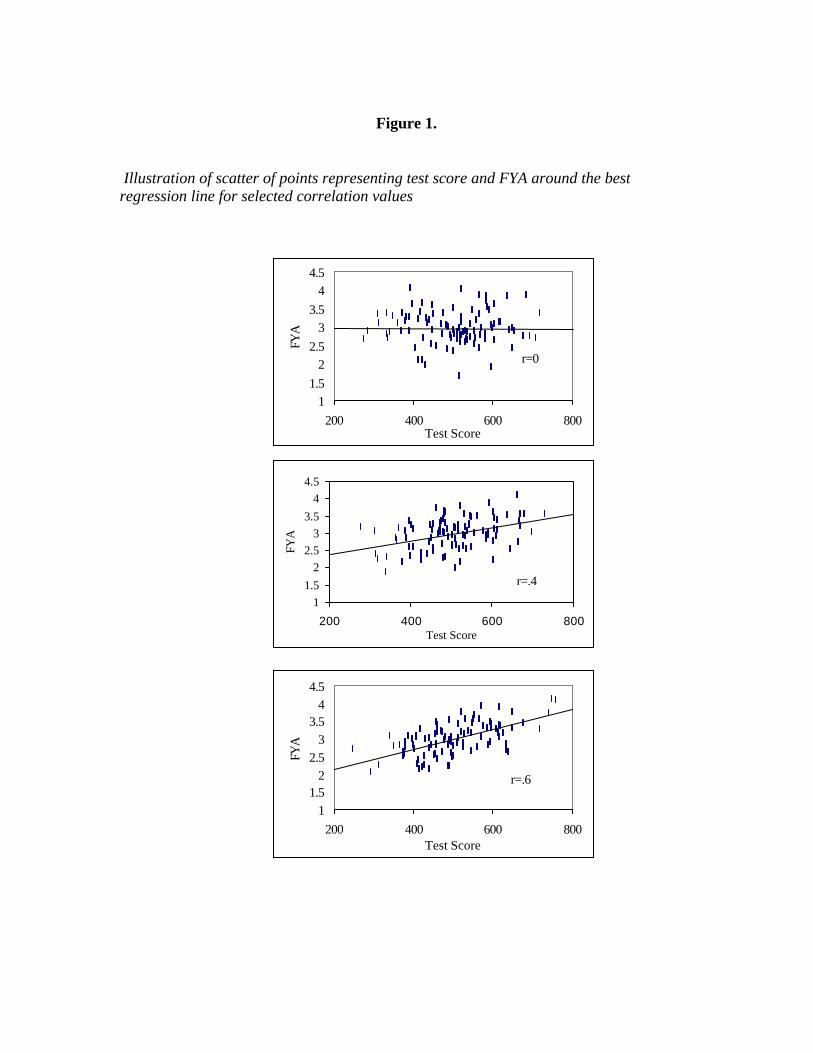
Figure 1.
Illustration of scatter of points representing test score and FYA around the bestregression line for selected correlation values
11.5
22.5
33.5
44.5
200 400 600 800Test Score
FYA
r=.4
11.5
22.5
33.5
44.5
200 400 600 800Test Score
FYA
r=0
11.5
22.5
33.5
44.5
200 400 600 800Test Score
FYA
r=.6

Compelling Interest – Prepublication Draft___________________________________
Chapter 4 / Page 13
individual applicant. The plots include many points for which lower test scores are associatedwith higher FYAs and higher scores are associated with lower FYAs. That is partly why theproducers of the tests issue warnings that test scores should not be used in isolation to makeadmission decisions. It is also partly why college application materials advise applicants thatadmission decisions are based on a variety of criteria, only one of which is the test score.
An alternative way to use and interpret the correlation coefficient is to square it.Squaring the correlation provides a description of the amount of the variability in the criterionscore (e.g., first year average) that can be attributed to the predictor (e.g., test score). Themeaning of the squared correlation is difficult to grasp and one that has often misinterpreted.The squared correlation (technically referred to as the coefficient of determination) does notdescribe the percentage of students whose grades are accurately predicted. The Nairn/Naderreport (1980) is one example of this type of misinterpretation of the squared correlation. Thefollowing example may help clarify this concept. If the correlation between SAT scores andFYA (or ACT scores and FYA) is 0.4, then 16 percent (i.e., 0.4 squared) of the variance in FYAis accounted for by the variance in SAT (or ACT) scores. A way to interpret the meaning of thesquared correlation coefficient is to imagine a situation in which there was no variability in thetest score. For example, if a sample of students who all had the same test score were selectedfrom the total population of students, the variance in FYA for that sample would be expectedto be 16 percent smaller than the variance for the total population of students.
Testing specialists have long agreed that the squared correlation is of limited value ininterpreting the usefulness of admission tests for selection purposes (see, for example, Brogden,1946 and Chronbach and Gleser, 1965). This is because the correlations need to be interpretedwithin the framework of the limitations of the data from which they were computed. Thus, eventhough from a purely statistical perspective, correlations of the magnitude found between testscores and first-year grades are somewhat modest, they should not be dismissed off-handedly.The correlations reported in typical predictive validity studies are actually a reduced estimate ofthe true relationship between test scores and subsequent academic performance. The reductionis a statistical consequence of using the test score as a predictor when it also was a factor onwhich selection of the students was based. This phenomenon is known as range restriction. The correlation coefficient is related to the amount of variability (or roughly, the range of testscores) among students in the validity study sample. When test scores are used to help selectapplicants for admission, the range of test scores among first year students (those who haveattended the school and earned a GPA to be correlated with the test score) is less than the rangeamong all of the applicants. The more selective the school is and the greater the emphasis on testscores in the admission process, the larger the under-estimate of the correlation.
Critics of the use of test scores in the admission process often note that even thoughthe median correlation between test score and subsequent grades are positive across all thetesting programs, there is a substantial amount of variability from school to school. In fact, ahandful of schools in almost every testing program’s summary report show zero or slightlynegative correlations. Those critics use the variation in correlations among different schools toquestion the accuracy of the claims of test validity. However, an alternative explanation for theobserved variability in validity estimates is statistical artifact. The variability is at least partlyattributable to the range restriction found within different schools. A second statistical artifact,sampling fluctuation, also accounts for a substantial proportion of the variability in validityestimates obtained among different schools (Linn, Harnisch, & Dunbar, 1981). Anotherstatistical artifact contributing to low and negative correlations is the use of a compensatorymodel in selection (i.e. letting either high test scores compensate for low grades or high grades
Compelling Interest – Prepublication Draft___________________________________
Chapter 4 / Page 14
compensate for low test scores). See, for example, Wightman (1993) demonstrating the impactof the compensatory model on the validity of LSAT scores.
Despite the existence of literally thousands of studies of the nature described above,which support the validity of standardized admission tests as predictive measures of first yeargrades, their utility should not simply be accepted without question. The technical question ofwhether test scores are statistically related to an outcome of interest (e.g., first year grades) isnot sufficient to determine how the test should be used in the admission process. Individualschools need to evaluate (1) the importance of the validity study criterion in their selectionprocess; (2) whether there are other factors that predict the criterion as well or better than testscores; and (3) what impact using the test score might have on their ability to attract the kindsof students they seek as well as to fairly select among those who apply. Consider someexamples.
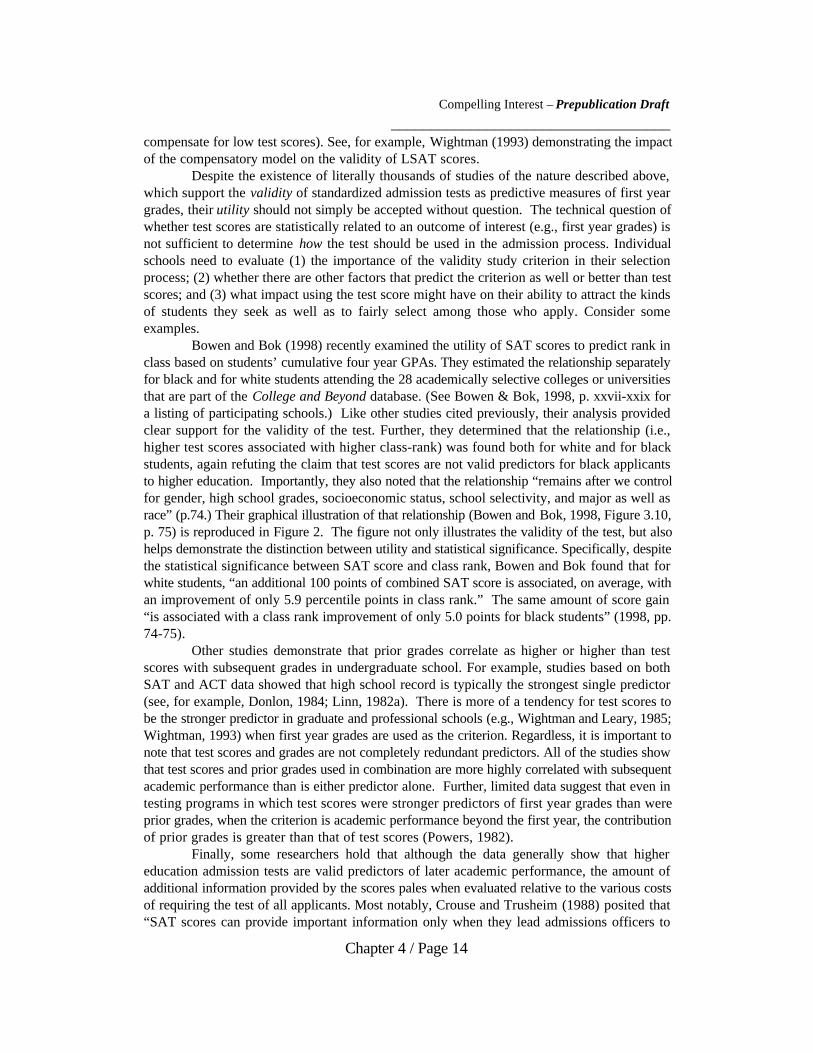
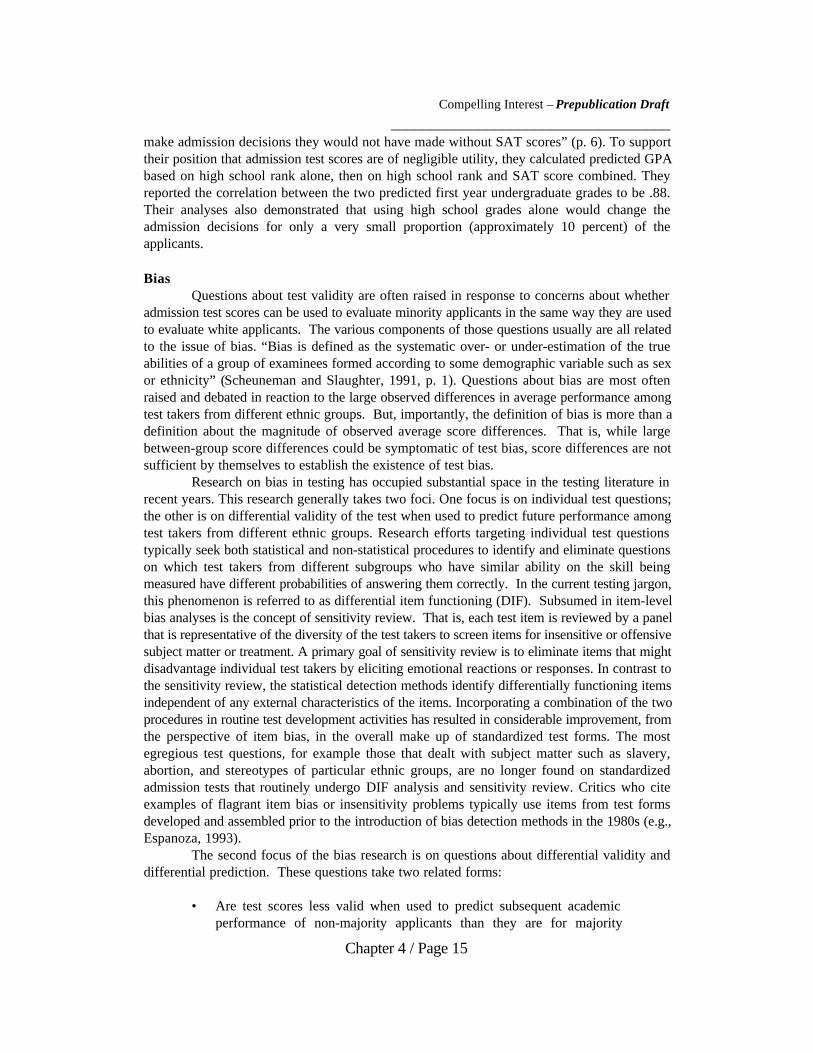
Bowen and Bok (1998) recently examined the utility of SAT scores to predict rank inclass based on students’ cumulative four year GPAs. They estimated the relationship separatelyfor black and for white students attending the 28 academically selective colleges or universitiesthat are part of the College and Beyond database. (See Bowen & Bok, 1998, p. xxvii-xxix fora listing of participating schools.) Like other studies cited previously, their analysis providedclear support for the validity of the test. Further, they determined that the relationship (i.e.,higher test scores associated with higher class-rank) was found both for white and for blackstudents, again refuting the claim that test scores are not valid predictors for black applicantsto higher education. Importantly, they also noted that the relationship “remains after we controlfor gender, high school grades, socioeconomic status, school selectivity, and major as well asrace” (p.74.) Their graphical illustration of that relationship (Bowen and Bok, 1998, Figure 3.10,p. 75) is reproduced in Figure 2. The figure not only illustrates the validity of the test, but alsohelps demonstrate the distinction between utility and statistical significance. Specifically, despitethe statistical significance between SAT score and class rank, Bowen and Bok found that forwhite students, “an additional 100 points of combined SAT score is associated, on average, withan improvement of only 5.9 percentile points in class rank.” The same amount of score gain“is associated with a class rank improvement of only 5.0 points for black students” (1998, pp.74-75).
Other studies demonstrate that prior grades correlate as higher or higher than testscores with subsequent grades in undergraduate school. For example, studies based on bothSAT and ACT data showed that high school record is typically the strongest single predictor(see, for example, Donlon, 1984; Linn, 1982a). There is more of a tendency for test scores tobe the stronger predictor in graduate and professional schools (e.g., Wightman and Leary, 1985;Wightman, 1993) when first year grades are used as the criterion. Regardless, it is important tonote that test scores and grades are not completely redundant predictors. All of the studies showthat test scores and prior grades used in combination are more highly correlated with subsequentacademic performance than is either predictor alone. Further, limited data suggest that even intesting programs in which test scores were stronger predictors of first year grades than wereprior grades, when the criterion is academic performance beyond the first year, the contributionof prior grades is greater than that of test scores (Powers, 1982).
Finally, some researchers hold that although the data generally show that highereducation admission tests are valid predictors of later academic performance, the amount ofadditional information provided by the scores pales when evaluated relative to the various costsof requiring the test of all applicants. Most notably, Crouse and Trusheim (1988) posited that“SAT scores can provide important information only when they lead admissions officers to
Figure 2.
Mean percentile rank in class, by combined SAT score and race, 1989 entering cohort.
Note. From The Shape of the River: Long term consequences of considering race in college anduniversity admissions (p.75), by W.G. Bowen and D. Bok, 1998. Princeton, NJ: PrincetonUniversity Press.Copyright 1998 by Princeton University Press.Reprinted with permission.
Compelling Interest – Prepublication Draft___________________________________
Chapter 4 / Page 15
make admission decisions they would not have made without SAT scores” (p. 6). To supporttheir position that admission test scores are of negligible utility, they calculated predicted GPAbased on high school rank alone, then on high school rank and SAT score combined. Theyreported the correlation between the two predicted first year undergraduate grades to be .88.Their analyses also demonstrated that using high school grades alone would change theadmission decisions for only a very small proportion (approximately 10 percent) of theapplicants.
BiasQuestions about test validity are often raised in response to concerns about whether
admission test scores can be used to evaluate minority applicants in the same way they are usedto evaluate white applicants. The various components of those questions usually are all relatedto the issue of bias. “Bias is defined as the systematic over- or under-estimation of the trueabilities of a group of examinees formed according to some demographic variable such as sexor ethnicity” (Scheuneman and Slaughter, 1991, p. 1). Questions about bias are most oftenraised and debated in reaction to the large observed differences in average performance amongtest takers from different ethnic groups. But, importantly, the definition of bias is more than adefinition about the magnitude of observed average score differences. That is, while largebetween-group score differences could be symptomatic of test bias, score differences are notsufficient by themselves to establish the existence of test bias.
Research on bias in testing has occupied substantial space in the testing literature inrecent years. This research generally takes two foci. One focus is on individual test questions;the other is on differential validity of the test when used to predict future performance amongtest takers from different ethnic groups. Research efforts targeting individual test questionstypically seek both statistical and non-statistical procedures to identify and eliminate questionson which test takers from different subgroups who have similar ability on the skill beingmeasured have different probabilities of answering them correctly. In the current testing jargon,this phenomenon is referred to as differential item functioning (DIF). Subsumed in item-levelbias analyses is the concept of sensitivity review. That is, each test item is reviewed by a panelthat is representative of the diversity of the test takers to screen items for insensitive or offensivesubject matter or treatment. A primary goal of sensitivity review is to eliminate items that mightdisadvantage individual test takers by eliciting emotional reactions or responses. In contrast tothe sensitivity review, the statistical detection methods identify differentially functioning itemsindependent of any external characteristics of the items. Incorporating a combination of the twoprocedures in routine test development activities has resulted in considerable improvement, fromthe perspective of item bias, in the overall make up of standardized test forms. The mostegregious test questions, for example those that dealt with subject matter such as slavery,abortion, and stereotypes of particular ethnic groups, are no longer found on standardizedadmission tests that routinely undergo DIF analysis and sensitivity review. Critics who citeexamples of flagrant item bias or insensitivity problems typically use items from test formsdeveloped and assembled prior to the introduction of bias detection methods in the 1980s (e.g.,Espanoza, 1993).
The second focus of the bias research is on questions about differential validity anddifferential prediction. These questions take two related forms:
• Are test scores less valid when used to predict subsequent academicperformance of non-majority applicants than they are for majority
Compelling Interest – Prepublication Draft___________________________________
Chapter 4 / Page 16
applicants? For example, is the correlation between test scores and firstyear performance in undergraduate or graduate/first professional schooldifferent for different identifiable groups of students?
• Are test sores systematically unfair to non-majority applicants? That is, do somegroups systematically perform better than they are predicted to by the tests?
There is a fairly extensive literature on this topic, although some of the work is dated and needsto be updated or at least replicated. Overall, the research in this area suggests that test scoresand previous grades are valid for black and Hispanic test takers. But there also is some evidenceof differences in the magnitude of those validities both across testing programs and acrossdifferent types of schools within testing programs.
Research in the area of differential validity and differential prediction often reports thatthe admission test over predicts for minority test takers. Over-prediction refers to thecomparison of the FYA predicted by the test compared with the observed FYA. That is, whenthe test over-predicts, actual first year grades earned by the test takers tend are lower than theFYAs predicted by their test scores. If the relatively lower average test scores earned byminority examinees were simply a result of test bias, then under prediction, i.e., actual FYAs thatwere higher than the FYAs predicted by the test scores, would be an expected outcome.Explanations of the findings of over prediction must not mask the important distinction betweenaverage results and individual results. Specifically, while most research shows that on averagetest scores tend to over predict future FYAs for black test takers, this finding does not implythat test scores over predict performance for each individual black test taker. See Wightman(1998) for graphic representations of the black and white law school students whose actual firstyear performance in law school exceeded their predicted performance.
In a comprehensive review of the literature on differential validity and differentialprediction, Linn (1990, p. 310) provided the following references, summaries, andgeneralizations about research findings with regard to minority and majority groups:
"1.Predictive validities (American College Testing Program, 1973; Breland, 1979;Duran, 1983; Linn, 1982a; Ramist, 1984)
(a) tests and previous grades have useful degree of validity forBlack
and Hispanic as well as White students(b)typically lower for Black than for White students at predominantly
White colleges(c)at predominantly Black colleges validities are comparable to those
[for freshmen in general] at predominantly Whitecolleges
(d)typically slightly lower for Hispanic than for White students2.Differential prediction (American College Testing Program, 1973; Breland,
1979; Duran, 1983; Linn, 1982a; Ramist, 1984)(a)freshman GPA typically over-predicted for Black students(b)over prediction usually greatest for Black students with above
average scores on predictors and negligible forstudents with below average scores on predictors
(c)over prediction found for Hispanic students, but lessconsistently and by smaller amount
Compelling Interest – Prepublication Draft___________________________________
Chapter 4 / Page 17
3.Statistical artifacts may contribute to over prediction (Linn, 1983).4.Differential course taking patterns may mask the amount of over prediction
to some extent and partially account for the lower validities found forminority students (Elliott & Strenta, undated).
5.Inferences about bias based on differential validity or prediction findingsrequire assumptions that grades are themselves unbiased measures.
6.Results for graduate and professional schools, while more limited, aregenerally consistent with those at the undergraduate level except that thereis less indication that predictive validities are lower for minority groupstudents (Braun and Jones, 1981; Powers, 1977; Linn, 1982a)."
Studies more recent than those reviewed by Linn, though limited in number, continue to confirmthe earlier findings about differential predictive validity. For example, Young (1994) confirmedthat the phenomenon still existed for a sample of 3,703 college students. He concluded that forwomen, but not for minorities, the difference in predictive validity appeared to be related tocourse selection. Similarly, Noble (1996) showed that both ACT scores and high school gradepoint averages slightly over predicted success in standard freshmen courses for black studentsrelative to white students and for men relative to women. Wightman and Muller’s (1990)analysis of data from law school students found no differences in validity for black, MexicanAmerican or other Hispanic students compared with white students. Their data also continuedto demonstrate that on average, LSAT scores, used alone or in combination with UGPA, slightlyover-predicted first year averages in law school for black, Mexican American, or other Hispanicstudents.
Implicit in the analyses of differential validity and differential prediction described in thissection is the assumption that the criterion (typically first year grades) is unbiased. Currently,research to test the accuracy and the impact of that assumption is lacking. A key factor thatis not explained by any of the studies of differential prediction is the cause for the overprediction. Linn (1990) ascertains that “it seems likely, however, that the result is due to manyfactors, including both statistical artifacts and educationally relevant factors.” Testingorganizations and testing professionals have focussed much attention on uncovering andunderstanding the statistical artifacts, as evidenced in the research cited in this section. Thegreatest shortage of current research seems to be in the areas of how to remedy theeducationally relevant factors and how to integrate information about remedies with the testdevelopment efforts in order to provide new and more meaningful assessment options.
Another important consideration in dealing with question of bias in standardized testingis the bias in selection that results from over-reliance on test scores in the admission processeven if there is no bias in the test scores themselves. Linn (1990, p. 320) emphasizes that“because the predictive validity of test scores and previous academic records are modest andthe group differences in average scores are large, selection based solely on the basis of thesequantitative predictors would have substantial adverse impact for Black and Hispanic applicantsand exclude many minority students who would succeed if given an opportunity.” Research thatexamined Linn’s hypothesis is reviewed in the section on the consequential basis of test validity.
CoachingThe general topic of test validity is also related to the topic of test preparation or
coaching. Coaching is used as a generic term here to refer to any of a broad number of activitiesranging from relatively short-term review of test familiarization materials to extensive long-term

Compelling Interest – Prepublication Draft___________________________________
Chapter 4 / Page 18
instruction in the subject matter covered on the admission test. Research suggests importantdistinctions between the two extremes not only with respect to their effect on subsequent testperformance but also their relationship with later academic achievement.
Virtually all of the higher education admissions testing programs provide some testfamiliarization materials free of charge to prospective test takers. They also market a wide arrayof test preparation materials, ranging from previously used intact test forms to computer-basedinstructional material. Printed and computer-based test preparation materials are also offeredby commercial organizations that are independent from the organizations that produce the tests.In addition, a number of not for profit as well as commercial test preparation courses areoffered. The cost of the available test preparation materials and services range from only a fewdollars for the purchase of a previously used test form to nearly $1000 for enrollment in somecommercial test preparation courses. One consequence of the differential costs associated withtest preparation options is that various options are not equally available to students with differentfinancial resources. As important, there is some evidence to suggest that students from differentethnic/racial groups do not equally understand the value of test preparation. For example,McKinley (1993) found that white LSAT takers tended to use the free and low-cost testpreparation materials offered by the test publisher more than black, Mexican American, orPuerto Rican test takers used them. He also found that white test takers tended to use a largernumber of different methods of test preparation than did test takers from other subgroups.
The import of differential access to and use of test preparation opportunities is primarilyrelated to the possible positive effect of test preparation on subsequent test performance. Twometa-analyses of the large number of studies dealing with the effect of test preparation onsubsequent test performance (Messick & Jungeblut, 1981; Powers, 1993) both agree that testscores have been improved as a consequence of engaging in focussed test preparation, but thatthe average gains are generally modest. Messick and Jungeblut estimated that the first 20 hoursof coaching were associated with an increase of approximately one fifth of a standard deviation(19.2 points) on the SAT mathematics score. The same amount of coaching time wasassociated with an increase of less than one tenth of a standard deviation (8.9 points) on theSAT verbal score. A study of the effects of professional coaching for African-Americanstudents on the ACT showed similarly modest gains (Moss, 1995.) That is, following a six-weekcoaching course, the average increase among the study participants was 1.34 points. Whethergains of these magnitudes are worth the cost and the amount of preparation time required inorder to achieve them is an individual decision.
A related question of interest is whether test takers from different ethnic groups benefitdifferently from exposure to short-term or moderate-term coaching. The limited availableresearch that specifically compared test score gain across different ethnic groups revealed littledifference among ethnic groups in the benefits, as measured by test performance, realized fromengaging in test preparation activities (Messick, 1980; Leary and Wightman, 1983; Powers,1987.) In a study that looked exclusively at black students, Johnson (1984) evaluated resultsfrom a test preparation program sponsored by the National Association for the Advancement ofColored People. The program’s purpose was to increase the number of eligible black collegeapplicants by raising their SAT scores. The evaluation report’s conclusions—that overall theprogram was effective, but the gains were modest—are consistent with other coachingresearch. Additionally, the results reported by Johnson were mixed across clinics. Students fromSan Francisco and Atlanta showed statistically significant increases in test scores, whileincreases of approximately the same magnitude among students from New York were notstatistically significant.
Compelling Interest – Prepublication Draft___________________________________
Chapter 4 / Page 19
Several researchers have raised concerns that even the modest score increases associatedwith short-term test preparation are a potential threat to the validity of the use of these tests foradmission decisions (see, for example, Messick & Jungeblut, 1981;Linn, 1982b; Bond, 1989). An early study that addressed this issue (Marron, 1965) found that coaching led to an overprediction of academic performance. However, Marron’s results have been questioned,primarily due to the lack of statistical rigor in his design and analysis. Several subsequent studies(Powers, 1985; Jones, 1986; Baydar, 1990; Allaouf & Ben-Shakhar, 1998) suggest either thattest preparation may enhance rather than undermine predictive validity or that coaching had nonegative impact on the predictive validity of the admission test.
Test preparation questions that focus on long-term academic preparation are distinct fromquestions about short-term or moderate-term coaching. The admission tests are designed tomeasure academic skills acquired over an extended period of time. If the tests are valid for thatpurpose, examinees who did not enroll in or do well in rigorous academic courses that providethe fundamental preparation for a college education should be expected to earn lower test scoresthan do examinees who engaged in adequate academic preparation. Addressing problems ofinadequate long-term academic preparation may be more difficult and elusive than are providingshort-term coaching solutions, but defining the relationships between academic preparation andsubsequent test performance, and developing appropriate intervention may also provide morelasting positive outcomes. In cases where shorter term coaching—particularly coaching thatfocuses on test taking strategies rather than underlying skills—results in score increases,Johnson’s questions (1984) about whether improved SAT performance results in strongercollege performance are central to concerns about coaching, test validity, and equity and fairnessin the admission process.
There is research evidence to support the intuitive relationship between inadequateacademic preparation and poor test performance (e.g., Chenowith, 1996; Pennock-Roman,1988). There also is research demonstrating increased test performance among minoritystudents who are appropriately guided into academic programs or courses that provide thenecessary long-term academic preparation. For example, in her study of Hispanic students inpost secondary education, Pennock-Roman (1988) not only found large differences in SATscores between Hispanic and non-Hispanic white students, but also found that those differenceswere associated with the type of academic courses taken. She concluded that the adequacy ofHispanic students’ test preparation was one of the important factors in their relatively poor testperformance. More directly relevant to improving test performance are the results fromevaluations of the Equity 2000 program. A primary goal of that program is to encourage schoolsystems to direct their minority students into college preparatory mathematics courses. Ademonstration project supported by Prince George’s County, Maryland, showed that successfulcompletion of high school algebra and geometry was an important predictor of achieving SATscores that qualified students for college admission (Fields, 1997). The study indicated thatprograms like the one in Prince George’s County are difficult to implement, but also that theypromise results that justify the extra effort.
Consequential Basis of Test ValidityIn his seminal work on test score validity, Messick (1989) explained the need to
incorporate the value implications and social consequences of interpreting and using test scoresinto the overall concept of test validity. Messick suggested that this could be accomplished by“scrutinizing not only the intended outcomes but also unintended side effects—in particular,evaluate the extent to which (or, preferably, discount the possibility that) any adverse
Compelling Interest – Prepublication Draft___________________________________
Chapter 4 / Page 20
consequences of the testing derive from sources of score invalidity such as construct-irrelevanttest variance” (Messick, 1994, p. 3). Construct-irrelevant test variance refers to score variabilitythat results from differences on factors that the test does not intend to measure. Culturaldifferences, language differences, and differential opportunity to learn (particularly in highereducation admission tests that aim to assess skills that are independent of specific curriculum)could potentially contribute to producing construct irrelevant variance. A simple example of thisconcept would be a test intended to measure mathematics computation skills that is administeredto examinees for whom English is a second language. If the task is presented through "wordproblems" or if the instructions are presented in language that is complex, low scores mayreflect language limitations rather than low proficiency in the computational skills of interest.
The consequential basis of test validity is an issue for standardized higher educationadmission tests partly because the major tests used for admission purposes are “indeed culturedependent” (Linn, 1982b, p. 285). Messick’s depiction of social consequences as a validityissue has been a topic of controversy and debate within the measurement community (see forexample, Linn, 1997; Mehrens, 1997; Popham, 1997; Shepard, 1997). The basis of thedisagreement is whether the social consequences of test use fit appropriately under the validityumbrella; there is not disagreement that social consequences are an area that should be ofconcern to both test developers and test score users. Regardless of an individual’s positionabout its place within the validity construct, Messick’s representation has resulted in heightenedattention to the issue of social consequences associated with test score use.
The consequences of over-reliance on test scores from the perspectives of achievingdiversity in higher education and affording educational opportunity for economicallydisadvantaged applicants has been well documented. For example, Willingham & Breland (1977)maintained that strict reliance on standard numerical indicators would have an adverse impacton several minority groups. Evans (1977) provided empirical evidence to demonstrate thatbelow the very top of the LSAT score range, the proportion of black law school applicants whowere accepted exceeded the proportion of white applicants with the same scores. Morerecently, Wightman (1997) used law school application and admission decision data todemonstrate that basing admission decisions exclusively on numerical indicators (i.e., test scoresand prior grade point averages) would substantially reduce the proportion of admitted applicantsfrom selected minority groups. More importantly, the law school data showed that the majorityof minority students who would have been excluded from law school succeeded when theywere given an opportunity. That is, based on data from the fall 1991 entering class, nosignificant differences in graduation rate were found, within any of the racial/ethnic groupsstudied, between those who would have been admitted under the numerical model and thosewho would have been denied. The data on bar passage outcomes showed small differencesbetween those who would have been admitted and those who would not within some, but notall, ethnic groups. The most compelling aspect of the bar admission data is that between 88 and72 percent of minority law school students who would have been denied opportunity to enterlaw school under a numbers-only admission model were able to successfully pass the bar andenter the profession. Similar studies in other educational settings should be undertaken to helpput the impact of selection based disproportionately on test score results into perspective.
Other social consequences resulting from heavy reliance on test scores in the admissionprocess are less well researched. For example, little is known about the effect of lower testscores on decisions among tests takers with respect to whether to continue with the collegeapplication process as well as which schools to apply to. More research is required in severalareas related to the social consequences resulting from test score use in higher education
Compelling Interest – Prepublication Draft___________________________________
Chapter 4 / Page 21
admissions. Such research should distinguish between issues of distributive justice and truesources of invalidity in order to guide potential remedies that might be proposed in response toresearch results. Messick (1994) pointed out that “it is not that adverse social consequencesof test use render the use invalid but, rather, that adverse social consequences should not beattributable to any source of test invalidity such as construct under-representation or construct-irrelevant variance” (p. 8). For example, to the extent that differences in test scores amongmembers of different ethnic groups represent true differences in educational opportunity, heavyreliance on test scores would have adverse social consequences that are questions of distributivejustice, but are not sources of invalidity within the test. Alternatively, to the extent that scoredifferences are attributable to factors such as different tendencies to guess on multiple choicequestions or to speededness factors on tests designed to be power tests, there exist sources ofconstruct-irrelevant variance that impact the validity of the test.
Use and Misuse of Admission Test Scores in Higher EducationThe majority of testing programs provide advice and warning to both test takers and
score users about appropriate score use, emphasizing the limitations of those scores. Even so,there is concern about over-reliance on test scores in the admission process. The potential formisuse of test scores has been exacerbated by recent moves to pit concepts of merit andacademic standards against the benefits of diversity and educational opportunity offered throughaffirmative action programs. Despite extensive evidence to the contrary, test scores are beingportrayed as an accurate, objective indicator of merit. This section will review relevant researchon appropriate and inappropriate use of test scores and other indicators of academic achievementin the admission process, and will examine the changing public attitude about test score use.
Reliance and Over reliance on Test Scores in Making Selection DecisionsThe amount to which admission decisions rely or overly rely on test scores varies from
institution to institution and also varies across undergraduate, graduate, and professional schools.University of Virginia’s Dean of Admission in 1997, John Blackburn, claims that “we see theSAT, and I think most colleges and universities see the SAT, as one factor among many thatwould be important in making decisions about students” (US News Online, 1997). Consistentwith his assessment, national survey data confirm that admission test scores were not the onlyor even the primary factor that schools claimed influence their admission decisions in a nationalsurvey of admission practices. The major factors identified by schools and the importanceattached to them are identified in Table 5. Grades in college preparatory courses received thehighest percentage of ratings of ‘considerable importance’. These findings are consistent withthe validity data previously reported, showing that high school grades are slightly betterpredictors of college performance than are test scores for most undergraduate schools. Only47 percent of the respondents rated the importance of admission test scores as ‘considerable’although another 38 percent rated their importance as ‘moderate’.
Despite statements by schools describing the way that test scores are used in theselection process, there is at least some empirical data suggesting the relationship between testscores and admission decisions might be stronger than is suggested above. A now well-knownexample is the documented account of the way that the University of Texas School of Law usedLSAT scores and grades as reported in Hopwood (see page xx). There also are correlational datasuggesting a strong relationship between test scores and admission decisions. Willingham(1988) reported a correlation of .37 between SAT score and undergraduate admission decisionsand .36 between high school grade point average score and undergraduate admission decisions.

Table 5
Admission trends 1995: Factors influencing admission decisions
Considerable Moderate LimitedImportance Importance Importance None
Grades in College Prep. Courses 80% 10% 7% 3%
Admission Test Scores 47% 38% 9% 6%
Grades in All Subjects 41% 40% 14% 5%
Class Rank 39% 33% 19% 9%
Essay/Writing Sample 21% 34% 24% 21%
Counselor Recommendations 19% 48% 23% 10%
Teacher Recommendations 18% 46% 23% 13%
Interview 15% 30% 34% 22%
Work/ ExtracurricularExperiences
7% 35% 40% 17%
Ability to Pay 3% 7% 16% 73%
Personal Recognition Programs 1% 12% 41% 45%
Source: National Association for College Admission Counseling Admission Trends Survey, 1995
Compelling Interest – Prepublication Draft___________________________________
Chapter 4 / Page 22
Wightman (1997) reported a correlation of .33 between LSAT score and law school admissiondecisions and .28 between undergraduate grade point average score and law school decisions.When the two variables were considered simultaneously, in a logistic regression predictionmodel, Wightman (1997) reported a correlation of .78 between predicted and actual admissiondecisions for white law school applicants. In other words, LSAT score and UGPA togetheraccounted for approximately half of the variance in law school admission decisions. Thecorrelations between predicted and actual admission decisions were substantially lower for otherracial ethnic groups, suggesting that test scores and grades were less important to admissiondecisions for minority applicants than they were for white applicants. Even when the correlationdata confirm a very strong relationship, correlations alone are not sufficient to determinewhether scores are much more important factors than they are acknowledged to be or whetherthey are simply very highly correlated with the several other factors that were also taken intoconsideration. Another consideration that is related to the importance of test scores and gradesis the number of applicants relative to the number of available places. Test scores most likelyplay a larger role in decisions within those schools that are the most competitive. Moresystematic research across a variety of schools and applicant populations would be required toempirically address those kinds of issues of use and over use of test scores in admissiondecisions.
Prior Grades as Alternatives to Test ScoresThere is some information in the available research to suggest that test scores could be
eliminated from the admission process. Predictive validity data presented earlier show that highschool grades tend to be better predictors of subsequent college academic performance than doSAT or ACT scores. Further, data showed that although adding test scores to the predictionmodel improved prediction over grades alone, doing so had little effect with respect to changingthe admission decision that would be made for individual applicants. But, in order to evaluatethe consequences of abandoning the use of test scores in the admission process, some of theproblems inherent in the use of grades alone also need to be considered.Course grades are not always reflective of the skills, abilities, or knowledge of individualstudents. They can depend, at least partly, on the expectations of the instructors, the abilities ofother students in the class, and the style and personality fit between student and teacher. Gradesare frequently inflated, especially in schools at which a large proportion of students aspires toachieving admission to competitive institutions. Also, grades frequently are interpreted withrespect to the academic reputation of the school at which they were earned. In a discussion ofthis topic, Linn (1982a) correctly points out that “the lack of comparability of grades from oneschool to another, from one curriculum to another, or from one college to another is a potentiallyimportant source of unfairness. The student who attends a school with less demandingstandards for grades is given an advantage relative to his or her counterpart attending a schoolwith more demanding standards” (p. 284). One way that schools have dealt with grades fromdifferentially demanding schools is to use a school-based adjustment to an individual’s grades.The problem with that approach is that the student from a disadvantaged background whoattended a high school or undergraduate school where students typically do not excel ispenalized, thus reducing the value of his or her demonstrated achievements. Some research hassought to analyze the disadvantage to middle and lower middle class students that would arisefrom eliminating test scores from the admission process. Stanley (1977-78) remarked that theSAT had “a decidedly democratizing effect on certain kinds of selective colleges that, before the
Compelling Interest – Prepublication Draft___________________________________
Chapter 4 / Page 23
advent of the SAT, tended to rely heavily for their students on high status private schools andthe most academically prestigious public schools” (pp. 31-32).
Finally, data suggest that test scores are not so much the barriers to admission thatmany believe them to be. Analysis of law school data investigated the decision outcomes of a‘numbers-only’ admission process. The data showed that, regardless of whether the processwas modeled by UGPA and LSAT combined or by UGPA only, the consequence would havebeen a substantial reduction in the overall number of minority applicants who were offeredadmission to ABA-approved law schools (Wightman, 1997). Those results are consistent withthe Crouse and Trusheim (1988) findings that an admission policy that rejected applicants withpredicted grades below some predetermined level would lead to the same admission decision formost applicants regardless of whether high school grades were used alone or in combinationwith SAT scores.
Using Test Scores to Define MeritIt was not that long ago that public sentiment about testing focussed on its limitations
and its overuse—particularly for purposes for which tests were not intended and were notvalidated. One example is the Nairn/Nader report (1980), which presented a major public-relations attack not only on the standardized tests used in higher education admissions, but alsoon the Educational Testing Service, as the maker and administrator of the majority of those tests. A variety of position papers were prepared among measurement professionals defending bothtests and their appropriate use against Nairn/Nader's and other earlier attacks against them. (Seefor example, Cronbach, 1975; Astin, 1979, Linn, 1982b).
The public mood about the role of standardized testing has shifted during the mid1990s. Performance on standardized tests is now often portrayed as an impartial demonstrationof academic merit (or lack thereof.) This shift in perception about standardized testing was atleast partly fueled by the on-going debate about affirmative action and the ruling by the FifthCircuit in Hopwood. The tension in American ideology between the concept of merit and theconcept of distributive justice (or equality of outcomes) predates the Hopwood ruling. To mostAmericans, the concept of merit implies that people should succeed as a consequence of abilityand hard work, not as a consequence of who they are or whom they know (Kleugel & Smith,1986). In the abstract, this definition of merit frames it as a neutral concept that is independentof the emotional or political debate of affirmative action. During much of the affirmative actiondebate, little attention was paid to developing a definition of merit that could be embraced by thegeneral public. The Hopwood ruling, and the media reporting of it, have had a role in formulatingsuch a definition for the public. That is, the form of the complaint, the court’s response to it,and the media’s representation of the court’s decision imply that test scores and grades are theover-riding determinants of who is ‘entitled’ to the limited resources in higher education. Opponents of affirmative action have seized this definition with zeal. Columnist John Leo (1997)lamented examples of admission procedures based on practice other than ranking applicants bytest scores and grades as signs of “the gathering assault on good grades, test scores, and nearlyall known indicators of merit and academic achievement” (p. 22). He goes on to attribute effortsto reduce the emphasis on test scores in the admission process as “drummed up to protect theexcess of an affirmative action movement in deep trouble with the courts and the Americanpeople.” With an opposing view, Harvard law professor Christopher Edley Jr. chides critics ofaffirmative action for treating “paper and pencil tests as if they were complete and accuratemeasures of merit” as well as for “speak[ing] of preferences with robotic regularity becausepolling shows that the public generally supports affirmative action while opposing preferences”
Compelling Interest – Prepublication Draft___________________________________
Chapter 4 / Page 24
(December 7, 1997, Final Edition).The measurement community has never suggested that test scores could or should
serve as a surrogate for merit. As noted previously, that community has been both clear andforthcoming with regard to the limitations of test scores and to the necessity of looking at avariety of factors in making admission decisions. Proponents of using test scores as indicatorsof merit ignore important contributions that diversity among the student body makes to theeducational experience of all students. Consequently, they fail to identify potential to bringdiverse perspectives and experiences to the educational setting as a characteristic ‘meriting’admission. In responding to Initiative 200—an anti-affirmative action initiative in the state ofWashington—the regents there unanimously approved a statement that included the following:“Among the educational resources the university has to offer, is a diverse student body”(Carson, the News Tribune, January 18, 1998). Although many educators agree that a diversestudent body enhances educational experiences by sharing broader perspectives and challengingassumptions, there is limited formal research to support these conclusions. See Chapter x fora review of literature and discussion of the existing research. More systematic objective workis needed to define and document the concept of merit beyond the narrow confines of testscores and grades.
The Future of Admission Testing in Higher Education
Particularly in the wake of Hopwood and California's Proposition 209, the current useof standardized test scores in the admission process needs to be examined against a variety ofalternatives. These alternatives range from eliminating the use of scores altogether to a majorreconstitution of the content and format of admission tests and to the way that scores fromthose tests are developed and reported. This section will identify various options to routinelyrelying on scores on traditional multiple-choice paper and pencil admission tests as well assummarize and synthesize current and on-going research that evaluates these alternatives.
Eliminating the Use of Test Scores in the Admission ProcessOver-reliance on standardized tests, as well as potential negative consequences of test
scores on applicants' decisions about if and where to apply to college or graduate school,became a concern to higher education long before the current political anti-affirmative actionclimate emerged. In the mid 1980s, Bates College, Union College, and Middlebury collegeretracted their requirement that applicants submit SAT scores as part of the application process,allowing them to substitute alternative achievement test scores including the ACT. Following thatdecision, Bates undertook a five-year study comparing Bates GPAs of students who submittedSAT scores with the GPAs of students who did not. They found no difference in GPA at Batesas well as slightly lower attrition rates for non-submitters compared with submitters (BatesCollege, 1998). So, in 1990, Bates further revised its policy to make the submission of anyadmission test scores optional for their applicants. Bates faculty cite the following reasons forthe decision: inconsistent prediction of academic performance by test scores; inflatedperceptions about the importance of test scores in the selection process; and two ethical issuesrelated to the use of test scores--the possibility that test scores place students from multicultural,rural, or financially depressed backgrounds at a disadvantage and the misdirected energies ofteachers and students to the activities of test preparation (Bates College, 1998). Research relatedto each of their concerns was reviewed in earlier sections of this chapter.
Compelling Interest – Prepublication Draft___________________________________
Chapter 4 / Page 25
The decision by Bates College did not result in widespread adoption of optional testscore policies among other colleges. Only about 200 colleges and universities no longer rely onstandardized testing for their admission criteria (Rodriguez, 1996). The sheer volume ofapplications to be processed, particularly at large state universities, is one reason for thecontinued use of standardized test scores. For example, Dr. Ricardo Romo, Vice Provost, UTAustin, in a discussion about schools that have abandoned use of standardized tests as anadmission criterion noted that most of them are smaller colleges and universities. At UT, whichreceives 20,000 applications per year, test scores have served as “another benchmark” (Rodriguez, 1996). Another reason for continued use is the utility of the scores when they areused appropriately. John Blackburn, Dean of Admissions at the University of Virginia, reportedthat the SAT is “a measure that shows us how students can solve problems in quantitative ormathematical areas on one section, and then how well they use the language in English.” Heacknowledged that “we at the University of Virginia have never discussed eliminating therequirement or making it optional” (U.S. News Online, 1997)
Recent developments in California as well as in the Fifth Circuit may bring some changein the number of schools requiring applicants to submit test scores as well as in the way testscores are used in many selection processes. For example, a recommendation to eliminate theuse of the SAT as an entrance requirement was included in the recent report of the Universityof California’s Latino Eligibility Task Force. In Texas, some schools already have reconsideredtheir use of standardized test scores, often substituting the practice of basing admission on testscores with the policy of automatically admitting the top 10 percent from each high school. Infall 1997, the University of Texas completely abandoned its policy of automatically admittingstudents based only on their test scores. Previously, a score of 1250 or higher on the SATresulted in automatic admission (Rodriguez, 1996).
Alternatives to multiple-choice standardized paper and pencil assessmentThe key factors that influenced the growth of the college admission-testing program
at the beginning of the twentieth century remain factors in their use today. Specifically,curriculums vary substantially among different secondary schools and grading standards areinconsistent and can be unreliable. Among the most rigorous and competitive colleges anduniversities, selection committees seek indicators to help assure that applicants are properlyprepared to undertake the required work. They also seek measures of relative academic potentialas one factor to help them choose among a pool of qualified applicants whose number exceedsthe available places in the class. While one possibility might be to eliminate the use ofstandardized tests altogether, forcing schools to explore other options to fairly and reliablyindicate the student characteristics they seek, another would be to develop assessmentalternatives to replace or supplement the traditional multiple-choice standardized paper and penciltest.
Alternatives that take the form of changes in test format, content, and mode ofpresentation have been proposed as possible revisions or extensions to reliance on standardizedmultiple-choice higher education admission tests that began more than a half century ago. Considering alternatives is especially appealing in response both to the expansion of educationalopportunity nationwide that has occurred over the past 50 years and to the increasinglymulticultural society that is currently served by higher education. Sedlacek and Kim (1995) notedthat “if different people have different cultural and racial experiences and present their abilitiesdifferently, it is unlikely that a single measure could be developed that would work equally wellfor all” (p. 1).
Compelling Interest – Prepublication Draft___________________________________
Chapter 4 / Page 26
An alternative to the multiple-choice format that has received substantial attention fromboth the testing community and the educational community in recent years is performance-basedassessment. The National Center for Fair and Open Testing (a.k.a. FairTest) has long been anadvocate of replacing the SAT, ACT, and similarly structured graduate and professionaladmission tests with “performance based assessments, such as teacher observations, essays,portfolios, and open ended questions that encourage real thought” (Natale, 1990). Inperformance assessment, judgments are made about test takers’ knowledge and skills fromdirect observation of their performing the tasks to be assessed or from inspection by trainedevaluators of their work products. Proponents of performance assessment expected that thisassessment alternative would be devoid of the bias believed to be manifest in the traditionalmultiple choice test format. Unfortunately, the research results do not suggest that between-group performance differences disappear when performance assessment tools are used toevaluate academic skills and accomplishments (Linn, Baker, & Dunbar, 1991). Adding aperformance based component to traditional assessments also failed to reduce group differencesin observed scores. For example, an Analytical Writing Assessment component was recentlyadded to the GMAT. Simulations to determine which applicants would be offered admissionsuggested that the addition of the Analytical Writing Assessment score would noticeably increasethe number of women who would be offered admission, but would have no impact on thenumber of minority applicants (Bridgeman & McHale, 1996). Adopting performanceassessments also introduces a series of practical and psychometric issues that have not beenresolved. These include the time and resources needed to evaluate a tremendous volume ofpotential test takers (the College Board alone currently administers more than two million SATsper year). They also include issues of test score generalizability because in most situations,performance assessment is based on a very small sample of test taker performance (Linn, 1994).
Another alternative to current admission testing practice is to incorporate noncognitivemeasures into the assessment package. Much promising work in this area has been reported inthe literature. Tracey and Sedlacek (1984) measured eight noncognitive variables using theNoncognitive Questionnaire (NCQ). The NCQ includes the following variables: positive selfconcept or confidence; realistic self-appraisal, especially academic; an understanding of racismand an ability to deal with it; preference for long-term over short term goals; availability of astrong support person to whom to turn in crisis; successful leadership experience; demonstratedcommunity service; and knowledge acquired in a non-traditional field. Tracey and Sedlacek(1984) have demonstrated the reliability, construct validity and predictive validity of thisinstrument. Specifically, they showed that the correlation between scores on the NCQ andcollege grades was approximately the same as the correlation between SAT scores and collegegrades for both black and white students. In addition, the multiple correlation of both the SATand NCQ with college grades exceeded the correlation of either predictor alone. Their data alsoshowed that the NCQ significantly predicted persistence for blacks, but not for whites. Thesignificant relationships between the NCQ and academic performance has been replicated withother samples of black students (see for example, Rogers, 1984; Tracey & Sedlacek, 1985,1987a, 1987b) as well as with a sample of specially admitted students (White & Sedlacek,1986). The significant role of noncognitive factors has also been shown using instruments otherthan the NCQ (see for example, Pickering et al, 1992.) However, the results have not alwaysbeen consistent. Some researchers failed to replicate the findings of Sedlacek and his colleagueswith different samples of black undergraduates (Arbona and Novy, 1990; Hood, 1992). Fuertesand Sedlacek (1995) found that only one of the noncognitive measures—an understanding ofracism and an ability to deal with it—was a significant predictor of academic performance for
Compelling Interest – Prepublication Draft___________________________________
Chapter 4 / Page 27
Hispanic undergraduates and none were predictive of Hispanic student retention over a nine-semester period. And, Williams & Leonard (1988) found cognitive measures to be moreimportant than noncognitive indicators for black undergraduates in technical programs (e.g.,computer science and engineering.) The importance of the potential role of noncognitive factorsin identifying academic success of students independent of traditional cognitive assessments,coupled with the unresolved inconsistencies in previous research, make this an area in need ofcontinued investigation and refinement.
Recent advances in technology may hold the most promise for spawning assessmentalternatives that will better serve the admission goals of colleges and universities both to assureacademic standards and to provide equal access and opportunity. Several major testingprograms, including the GRE, the GMAT, and Teacher Testing Programs, already havesuccessfully implemented national computer administered testing programs. The benefit fromcomputerized testing is not in the change from paper and pencil to computer administration perse, but rather in the potential for new definitions of what is tested and how test scores andancillary information about applicants are reported. For example, the power of computeradministered tests have the potential to help move assessment instruments away from multiplechoice item formats without the loss of processing speed and reliability in scoring that wereproblematic in the early days of essay type admission tests. Testing programs already have madesome progress in designing computer scored open-ended items to replace traditional multiple-choice item types. There are several documented examples. Plumer (1997) illustrated non-multiple choice item types that are under development for the LSAT. Bennett (1994) describedan electronic infrastructure under development at ETS that would allow future tests to measureconstructs not currently measured and not redundant with those that are currently measured.One example would be a measure of how effectively potential students might profit frominstruction. “The general method for measuring this construct, known as ‘dynamic assessment,’involves presenting the student with a task just above that individual’s level, providing hints orother instruction and retesting performance” (p. 11). Another example provided by Bennett wasa measure of the ability to generate explanations. Powers and Enright (1987) demonstrated thevalue of this skill for graduate students, but routine assessment of the skill was prohibitivelyexpensive at that time. Bennett suggested that technology under development could make thescoring cost effective.
Much work remains to be done in this area, particularly with respect to evaluatingdifferential performance on the revised item formats among members of different ethnic groups.The related research on performance assessment, referenced earlier, raises a caution that testdevelopment efforts focussed simply on changing the question format in a computeradministered testing mode may do little or nothing to change the performance gap between whiteand nonwhite test takers.
One of the benefits of computer adaptive test (CAT) methodology is the opportunityto somewhat reduce the number of items administered to a test taker without loss of accuracyof measurement. One potential gain to be realized from this reduction is to retain the base testingtime but use that time to offer multiple formats to assess the same constructs, allowing testtakers multiple opportunities to demonstrate their abilities. A second is to assess an increasednumber of factors for each test taker within the same amount of testing time. The latter couldallow the assessment process to move away from the single admission test score toward acomprehensive assessment system. Such a system could assess a variety of cognitive andnoncognitive constructs, could be formative as well as summative, and could present a profileof each applicant across a variety of dimensions that were important to an admitting institution.
Compelling Interest – Prepublication Draft___________________________________
Chapter 4 / Page 28
Such a system could provide a viable alternative to the impossible task of attempting to developa single test that could fairly assess the academic potential of students from a broad range ofcultures, backgrounds, and talents. It also could help meet the concerns of public institutionsrequired to treat all applicants similarly as well as help meet the needs of all institutions to clearlydefine in advance the criteria that they would consider in the selection process.
Summary and Highlights
A primary objective of this chapter was to identify the issues that must be evaluatedwhen the utility and consequences of using test scores in the admission process are consideredfrom the perspectives of academic standards, equity, and access. Related objectives were tobring to one place the research evidence that supports or refutes beliefs about standardizedtesting and equal access, and to identify gaps in the existing research.
A history of the development of standardized testing and its use in a higher educationsystem with changing demographics and changing societal expectations provided the backdropagainst which to examine technical questions about standardized testing. A review of past andon-going litigation stemming from issues related to equal access and use of test scores providedinsight both to how tests can be used in making admission decisions and how litigation hashelped frame public perception of the issues.The majority of the questions that are asked about the use of standardized tests in the admissionprocess fall under the general category of 'validity'. The core question is:
• Do test scores add any useful information to the admission process?
But it takes on many forms such as
§ Do test scores predict future academic performance?§ Do they predict academic performance beyond the first year?§ Do they predict any outcomes other than GPAs?§ Are they biased?§ Do they predict differently for non-majority than for majority test takers?§ Does differential prediction deny opportunity to some groups of test takers?§ Can students "in-the-know" beat the test by learning a set of tricks?§ Does expensive short-term coaching raise test scores, thus undermining the validity of the
test and increasing the score gap between rich and poor?§ What are the social consequences of heavy reliance on test scores in making admission
decisions? Do those consequences derive from sources of test score invalidity?
A substantial body of research has been conducted by social scientists to address thesequestions. That research was cited and summarized in this chapter. Overall, the researchprovided strong evidence in support of the validity of standardized admission tests as one factorin the admission process. The research also found that the commonly used standardizedadmission tests are valid for members of different racial/ethnic groups, refuting the oftenexpressed concern that test scores are valid only for middle-class white applicants. Despite theimpressive amount of research designed to address questions like those posed above, additionalwork is required. Some of the existing research is dated and needs to be repeated using currenttest forms and current test taking populations; some needs to be extended to other testing
Compelling Interest – Prepublication Draft___________________________________
Chapter 4 / Page 29
programs and/or test taker populations; and some new or still unanswered questions need to beaddressed. A variety of research issues needing additional work are presented in discussionsthroughout the chapter and are extracted here. They include the following observations andrecommendations.
• Much of the differential validity research is dated and needs to be replicated or updated.• Test bias research that examines the predictive accuracy of the test for different groups
typically is based on the assumption that the outcome variable (e.g., FYA) is not biased.Research to test the accuracy of that assumption is lacking.
• Many studies found that test scores over-predicted academic performance for some ethnicgroups. There is a dearth of research focussed on explaining that finding.
• Many questions about the social consequences of heavy reliance on test scores in theadmission process are not well researched. New work needs to distinguish between issuesof distributive justice and sources of invalidity in order to guide potential remedies.
The discussion of appropriate test use distinguishes between statistical evidence ofpredictive validity and practical evidence of utility. Research highlighting the small differencesin outcomes such as class rank or GPA that are associated with differences in test scores, aswell as research demonstrating academic and professional success among applicants with thelowest test scores are presented within the context of the discussion of test utility.
A review of the available evidence about test score use leads to the conclusion that testscores can make important contributions to fair and equitable admission practice when used asone of several factors in making decisions. This is especially true when they are used as a toolto help interpret other academic indices such as prior grades. However, the summary of thedebate on using test scores to define merit shows how misuse or over-use of test scores canbe a disservice both to standardized testing and to higher education. Empirical research thatwould help define merit beyond the confines of test scores and grades is lacking and greatlyneeded.
Finally, possible alternatives for the future of admission testing were explored along acontinuum ranging from eliminating the use of tests altogether to expanding the role of testingby expanding both the constructs measured and the form and format through which themeasurement is accomplished. Technological advances are paving the way for the latter.Significant research is in progress, but much work needs to be done before the potential benefitsmight be realized.
Compelling Interest – Prepublication Draft___________________________________
Chapter 4 / Page 30
References
Abramowitz, E., (Ed.) (1976). Proceedings from the national invitational conference on racial andethic data. Washington, D.C.: Institute for the Study of Educational Policy.
Allalouf, A. & Ben-Shakhar, G. (1998). The effect of coaching on the predictive validity of scholasticaptitude tests. Journal of Educational Measurement, 35, 35-47.
American Bar Association, Section of Legal Education and Admission to the Bar. (1993). A Review ofLegal Education in the United States: Fall 1992 Law Schools and Bar AdmissionRequirements. Chicago: Author.
American College Testing Program (1973). Assessing students on the way to college: Technical reportfor the ACT Assessment Program. Iowa City, Iowa: Author.
American College Testing Program (1991). Supplement to the preliminary technical manual for theEnhanced ACT Assessment. Iowa City, Iowa: Author.
ACT (1997). ACT Assessment Technical Manual. Iowa City, IA: Author.Arbona, C. & Novy, D. (1990). Noncognitive dimensions as predictors of college success among black,
Mexican-American, and White students. Journal of College Development, 31, 415-422.Astin, A. W. (1979). Testing in post secondary education: Some unresolved issues . Educational
Evaluation and Policy Analysis, 1 (6), 21-28.Bates College (1998). In Bates College Online / Admissions [On-line]. Available:
www.bates.edu/admissions/optional-testing.htmlBaydar, N. (1990). Effects of coaching on the validity of the SAT: Results of a simulation study. In W,
W, Willingham, C. Lewis, R. Morgan, & L. Ramist (Eds.), Predicting college grades: Ananalysis of institutional trends over two decades (pp. 213-224). Princeton, NJ: EducationalTesting Service.
Bennett, R. E. (1994). An electronic infrastructure for a future generation of tests. Educational TestingService (RR-94-61). Princeton, NJ: Educational Testing Service.
Bowen, W. G., & Bok, D. (1998). The shape of the river: Long-term consequences of considering racein college and university admissions. Princeton, NJ: Princeton University Press.
Bond, L. (1980). The effects of special preparation on measures of scholastic ability. In R. L. Linn (Ed.),Educational measurement (3rd ed., pp. 429-444). New York: Macmillan.
Braun, H., & Jones, D. (1981). The Graduate Management Admission Test prediction bias study(Graduate Management Admission Council, Report No. 81-04, and Educational TestingService, RR-81-25). Princeton, NJ: Educational Testing Service.
Breland, H. M. (1979). Population validity and college entrance measures (College Board ResearchMonograph No. 8). New York: College Entrance Examination Board.
Bridgeman, B. & McHale, F. (1996). Gender and ethnic group differences on the GMAT AnalyticalWriting Assessment (Graduate Management Admission Council, Report No. 96-02, andEducational Testing Service, RR-96-02). Princeton, NJ: Educational Testing Service.
Brogden, H. E. (1946). On the interpretation of the correlation coefficient as a measure of predictiveefficiency. Journal of Educational Psychology, 37, 65-76.
Carson, R. (1998, January 18). UW Regents show their displeasure with I-200; Unanimous statementissued after hearing supports ‘Diverse Student Body’. The News Tribune.
Chenoweth, K. (1996). SAT, ACT scores increase: Higher scores attributed to more rigorouscoursework. Black Issues in Higher Education, 13(14), 6-8.
College Entrance Examination Board (1998). SAT 1998 College Bound Seniors: National Report. NewYork: Author.
Cronbach, L. J. (1975). Five decades of public controversy over mental testing. American Psychologist,30, 1-14.
Cronbach, L. J. & Gleser, G. C. (1965). Psychological tests and personnel decisions (2nd ed.). Urbana:University of Illinois Press.
Compelling Interest – Prepublication Draft___________________________________
Chapter 4 / Page 31
Crouse, J., & Trusheim, D. (1988). The case against the SAT. Chicago: University of Chicago Press.Donlon, T. (Ed.), (1984). The College Board Technical Handbook for the Scholastic Aptitude Test and
Achievement Tests. New York: College Entrance Examination Board.Duran, R. P. (1983). Hispanics’ education and background: Predictors of college achievement. New
York: College Entrance Examination Board.Edley, C. Jr. (1997, December 7). Why talk about race? President Clinton’s initiative is more than a
gabfest. The Washington Post, Final Edition.Elliot, R., & Strenta, A. C. (undated). Effects of improving the reliability of the GPA on prediction
generally and on the comparative predictions for gender and race particularly.Unpublished manuscript, Dartmouth College, Hanover, NH.
Espanoza, L. G. (1993). The LSAT: Narratives and bias. Journal of Gender & the Law, 1, 121-164.Evans, F. R. (1977). Applications and admission to ABA accredited law schools: An analysis of
national data for the class entering in the fall of 1976 (Rep. LSAC-77-1). In Law SchoolAdmission Council (Ed.), Reports of LSAC sponsored research: 1975-1977 (Vol. 3),Princeton, NJ: Law School Admission Council.
Fields, C. D. (1997). An equation for equality: Maryland’s Prince George’s County puts Equity 2000to the test. Black Issues in Higher Education, 13(26), 24-30.
Fuertes, J. N. & Sedlacek, W. E. (1995). Using noncognitive variables to predict the grades andretention of Hispanic students. College Student Affairs Journal, 14 (2), 30-36.
Hanford, G. H. (1991). Life with the SAT: Assessing our young people and our times . New York: CollegeEntrance Examination Board.
Hood, D. W. (1992). Academic and noncognitive factors affecting the retention of black men at apredominantly white university. Journal of Negro Education, 61 (1), 12-23.
Johnson, S. T. (1984). Preparing black students for the SAT: Does it make a difference? An evaluationreport for the NAAP test preparation project. 40 p., June 1984. Eric No.ED247350.Washington, D.C.: Howard University, School of Education.
Jones, R. F. (1986). A comparison of the predictive validity of the MCAT for coached and uncoachedstudents. Journal of Medical Education, 61, 325-338.
Karen, D. (1990). Toward a political-organizational model of gate keeping: The case of elite colleges.Sociology of Education, 63 (October) , 227-240.
Kleugel J. R. & Smith, E. R. (1986). Beliefs about inequality. New York: Aldine De Gruyter.Kramer, G. A. & Johnston, J. (1997). Validity of the optometry admission test in predicting performance
in schools and colleges of optometry. Optometric Education, 22 (2), 53-59.Leary, L. F. & Wightman, L. E. (1983). Estimating the relationship between use of test-preparation
methods and scores on the Graduate Management Admission Test (GMAC Research Report83-1, ETS Research Report RR-83-22). Princeton, NJ: Educational Testing Service.
Leo, J. (1997, November 24). Let’s attack merit. U.S. News & World Report, p. 22.Lindquist, E.F. (1958). The Nature of the Problem of Improving Scholarship and College Entrance
Examinations. 1958 Invitational Conference on Testing Problems. Princeton, NJ: Educational Testing Service.
Linn, R. L. (1982a). Ability testing: Individual differences and differential prediction. In A. K. Wigdor& W. R. Garner (Eds.), Ability testing: Uses, consequences, and controversies, Part II, pp.335-388. Washington, DC: National Academy Press.
Linn, R. L. (1982b). Admissions testing on trial. American Psychologist, 37 (3), 279-291.Linn, R. L. (1983). Predictive bias as an artifact of selection procedures. In H. Wainer & S. Messick
(Eds.), Principals of modern psychological measurement: A Festschrift for Frederic M. Lord(pp. 27-40). Hillsdale, NJ: Lawrence Erlbaum Associates, Inc.
Linn, R. L. (1990). Admissions testing: Recommended uses, validity, differential prediction, andcoaching. Applied Measurement in Education, 3 (4), 297-318.
Linn, R. L. (1994). Performance assessment: Policy promises and technical measurement standards.
Compelling Interest – Prepublication Draft___________________________________
Chapter 4 / Page 32
Educational Researcher, 23 (9), 4-14.Linn, R. L. (1997). Evaluating the validity of assessments: The consequences of use. Educational
Measurement: Issues and Practice, 16 (2), 14-16.Linn, R. L., Baker, E.L. & Dunbar, S. B. (1991). Complex, performance-based assessment: Expectations
and validation criteria. Educational Researcher, 20 (8), 15-21.Linn, R. L., Harnish, D. L., & Dunbar, S. B. (1981). Validity generalization and situation specificity: An
analysis of the prediction of first year grades in law school. Applied PsychologicalMeasurement, 5, 281-289.
Livingston, S. A., & Turner, N. J. (1982). Effectiveness of the Graduate Record Examinations forpredicting first-year grades: 1980-81 summary report of the Graduate Record ExaminationsValidity Study Service. Princeton, NJ: Educational Testing Service.
Marron, J. E. (1965). Preparatory school test preparation: Special test preparation, its effect onCollege Board scores and the relationship of affected scores to subsequent collegeperformance. West Point, NY: United States Military Academy.
McKinley, R. (1993). Summary of self-reported methods of test preparation by LSAT takers for 1990-91 testing year (Research Report 93-02). Newtown, PA: Law School Admission Council.
Mehrens, W. A. (1997). The consequences of consequential validity. Educational Measurement:Issues and Practice, 16 (2), 16-18.
Messick, S. (1980). The effectiveness of coaching for the SAT: A review and reanalysis of research fromthe fifties to the FTC . Princeton, NJ: Educational Testing Service.
Messick, S. (1989). Validity. . In R. L. Linn (Ed.), Educational measurement (3rd ed., pp. 13-103). NewYork: Macmillan.
Messick, S. (1994). Foundations of validity: Meaning and consequence in psychological assessment.European Journal of Psychological Assessment 10 (1), 1-9.
Messick, S., & Jungeblut, A. (1981). Time and method in coaching for the SAT. PsychologicalBulletin, 89, 191-216.
Moss, G. (1995, April) The effects of coaching on the ACT scores of African-American students. Paperpresented at the Annual Meeting of the American Educational Research Association, SanFrancisco, CA, 1995.
Nairn, A., & Associates. (1980). The reign of ETS: The corporation that makes up minds. Washington,D. C.: Ralph Nader.
Natale, J. (1990). If not the SAT, What? The search is on. American School Board Journal, 177 (6),32.
National Advisory Committee on Black Higher Education and Black Colleges and Universities. (1979).Access of black Americans to higher education: How open is the door? Washington, D.C.:Government Printing Office.
National Center for Education Statistics. (1978). The condition of education. Washington, D.C.:Government Printing Office.
Noble, J. (1996). Differential prediction/impact in course placement for ethnic and gender groups(ACT Research Report Series 96-8). Iowa City, Iowa: ACT.
Pennock-Roman, M. (1988, February 26). The status of research on the Scholastic Aptitude Test (SAT)and Hispanic students in post secondary education. Paper presented at a meeting organizedby the Intercultural Development Research Association for the National Commission onTesting and Public Policy, San Antonio, TX.
Pharr, S., Bailey, J., & Dangerfield, B. (1993). Admission/continuance standards as predictors ofacademic performance of business students. Journal of Education for Business, 69 (2), 69-74.
Pickering, J. W., Calliotte, J. A., & McAuliffe, G. J. (1992). The effect of noncognitive factors onfreshman academic performance and retention. Journal of the Freshman Year Experience,4 (2), 7-30.
Compelling Interest – Prepublication Draft___________________________________
Chapter 4 / Page 33
Plumer, G. (1997). A review of the LSAT using literature on legal reasoning (LSAC Research Report).Newtown, PA: Law School Admission Council.
Popham, W. J. (1997). Consequential validity: Right concern−wrong concept. EducationalMeasurement: Issues and Practice, 16 (2), 9-13.
Powers, D. E. (1977). Comparing predictions of law school performance for black, Chicano, andwhite law students (Report No. LSAC-77-3). Newtown, PA: Law Schools Admission Services,Inc.
Powers, D. E. (1982). Long-term predictive and construct validity of two traditional predictors of lawschool performance. Journal of Educational Psychology, 74 (4), 568-576.
Powers, D. E. (1985). Effects of test preparation on the validity of a graduate admissions test. AppliedPsychological Measurement, 9 (2). 179-190.
Powers, D. E. (1987). Who benefits most from preparing from a “coachable” admissions test? Journalof Educational Measurement, 24 (3), 247-262.
Powers, D. E. (1993). Coaching for the SAT: Summary of the summaries and an update. EducationalMeasurement: Issues and Practice, 12 (2), 24-30.
Powers, D. E. & Enright, M. K. (1987). Analytical reasoning skills in graduate study: Perceptions offaculty in six fields. Journal of Higher Education, 58, 658-682.
Ramist, L. (1984). Predictive validity of the ATP tests. In T. F. Donlon (Ed.), The College BoardTechnical Handbook for the Scholastic Aptitude Test and Achievement Tests. New York:College Entrance Examination Board.
Rodriguez, R. (1996). Life after Hopwood: Standardized tests may be the first to go. Black Issues inHigher Education, 13 (12), 8-10.
Rogers, B. H. (1984, October 24-26). The use of non-cognitive variables in the prediction of blackfreshmen’s academic performance. Paper presented at the Annual Meeting of the SouthernAssociation for Institutional Research, Little Rock, AR.
Sedlacek, W. E. & Kim, S. H. (1995, January 30). Multicultural assessment [ERIC Digest]. ERICDocument Reproduction Service. Number ED391112.
Scheuneman, J. D. & Slaughter, C. (1991). Issues of test bias, item bias, and group differences and whatto do while waiting for the answers [ERIC]. ERIC Number ED400294.
Shepard, L. S. (1997). The centrality of test use and consequences for test validity. EducationalMeasurement: Issues and Practice, 16 (2), 5-8, 13.
Stanley, J. C. (1977-78). The predictive value of the SAT for brilliant seventh- and eighth-graders. TheCollege Board Review, 106, 31-37.
Tracey, T. J. & Sedlacek, W. E. (1984). Noncognitive variables in predicting academic success by race.Measurement and Evaluation in Guidance, 16 (4), 171-178.
Tracey, T. J. & Sedlacek, W. E. (1985). The relationship of noncognitive variables to academic success:A longitudinal comparison by race. Journal of College Student Personnel, 26 (5), 405-410.
Tracey, T. J. & Sedlacek, W. E. (1987a). Prediction of college graduation using noncognitive variablesby race. Measurement and Evaluation in Counseling and Development, 19 (4), 177-84.
Tracey, T. J. & Sedlacek, W. E. (1987b). A comparison of white and black student academic successusing noncognitive variables: A LISREL analysis. Research in Higher Education, 27 (4), 333-348.
U.S. Bureau of the Census. (1980, May). Major Field of Study of College Students: October 1978(Current Population Reports, Series P-20, No. 351). Washington, D.C.: Government PrintingOffice.
U.S. Bureau of the Census. (1997). Statistical Abstract of the United States: 1997 (11th edition).Washington, D.C.: Government Printing Office.
U.S. Department of Education, National Center for Educational Statistics (1997). Digest of EducationStatistics, 1997, Table 206.
U.S. News Online. (1997). How important is the SAT? Interview with William Hiss and John
Compelling Interest – Prepublication Draft___________________________________
Chapter 4 / Page 34
Blackburn [On-line]. Available: www.usnews.com/ usnews/eduWhite, T. J. & Sedlacek, W. E. (1986). Noncognitive predictors: Grades and retention of specially-
admitted students. Journal of College Admissions, 111, 20-23.Wightman, L. F. (1993). Predictive validity of the LSAT: A national summary of the 1990-92
correlation studies (Research Report 93-05). Newtown, PA: Law School Admission Council.Wightman, L. F. (1997). The threat to diversity in legal education: An empirical investigation. New
York University Law Review, 72 (1), 1-53.Wightman, L. F. (1998). Are other things essentially equal? An empirical investigation of the
consequences of including race as a factor in law school admission decisions. SouthwesternLaw Review, 28(1), p. 1-43.
Wightman, L. E. & Leary, L. F. (1985). GMAC Validity Study Service: A three-year summary. Princeton,NJ: Graduate Management Admission Council.
Wightman, L.F. & Muller, D. G. (1990). An analysis of differential validity and differential predictionfor black, Mexican American, Hispanic, and white law school students (Research Report 90-03). Newtown, PA: Law School Admission Council.
Williams, T. M. & Leonard, M. M. (1988). Graduating black undergraduates: The step beyond retention.Journal of College Student Development, 29 (1), 69-75.
Willingham, W. W. (1988). Admission Decisions. In W. W. Willingham, M. Ragosta, R.E. Bennett, H.Braun, D.A. Rock, & D.E. Powers (Eds.), Testing Handicapped People (pp. 71-81) Boston,MA: Allyn and Bacon, Inc.
Willingham, W. W., & Breland, H. M. (1977). The status of selective admissions. In Carnegie Councilon Policy Studies in Higher Education (Ed.), Selective admissions in higher education. SanFrancisco: Jossey-Bass.
Young, J. W. (1994). Differential prediction of college grades by gender and ethnicity: A replicationstudy. Educational and Psychological Measurement, 54 (4), 1022-1029.
Zwick, R. (1993) The validity of the GMAT for the prediction of grades in doctoral study in businessand management: An empirical Bayes approach. Journal of Educational Statistics, 18 (1),91-10.
Related Documents