65 CHAPTER 4 Conceptualization and Measurement Research Question: What Do We Mean by “At Risk”? Chapter Contents “ A t-risk” students are an educational concern of large proportions. By one definition, 46% of U.S. children are at risk for one reason or another (Kominski, Jamieson, & Martinez, 2001, p. 4). Compared to other students, at-risk students can be in greater danger of having low academic performance, dropping out of school, abusing drugs or alcohol, and displaying antisocial behavior such as participation in gangs. Teachers, counselors, administrators, coaches—practically anyone involved in education—work with at-risk students at some point. They often find they need to learn more about at-risk students by reading the research or perhaps even conducting research of their own. To read intelligently or to design a study, one must answer two questions: “What is meant by at risk in this research?” (the conceptualization issue) and “How was at-riskness measured?” (the operationalization issue). Both types of questions must be answered when we evaluate prior research, and both types of questions must be kept in the forefront when we design new research. It is only when we conclude that a study used valid measures of its key concepts that we can have some hope that its conclusions are valid. In this chapter, we first address the issue of conceptualization, using at-riskness and related concepts as examples. We then focus on measurement, reviewing first how measures of at risk have been constructed using operations such as available data, questions, observations, and less direct and obtrusive measures. Concepts Measurement Operations Levels of Measurement Evaluating Measures Copyright ©2020 by SAGE Publications, Inc. This work may not be reproduced or distributed in any form or by any means without express written permission of the publisher. Do not copy, post, or distribute

Welcome message from author
This document is posted to help you gain knowledge. Please leave a comment to let me know what you think about it! Share it to your friends and learn new things together.
Transcript
65
C H A P T E R 4
Conceptualization and Measurement
Research Question: What Do We Mean by “At Risk”?
Chapter Contents
“At-risk” students are an educational concern of large proportions. By one definition, 46% of U.S. children are at risk for one reason or another (Kominski, Jamieson, & Martinez, 2001, p. 4). Compared to other students, at-risk students can be in greater danger of having low academic performance, dropping out of school, abusing drugs or alcohol, and displaying antisocial
behavior such as participation in gangs.Teachers, counselors, administrators, coaches—practically anyone involved in education—work with
at-risk students at some point. They often find they need to learn more about at-risk students by reading the research or perhaps even conducting research of their own. To read intelligently or to design a study, one must answer two questions: “What is meant by at risk in this research?” (the conceptualization issue) and “How was at-riskness measured?” (the operationalization issue). Both types of questions must be answered when we evaluate prior research, and both types of questions must be kept in the forefront when we design new research. It is only when we conclude that a study used valid measures of its key concepts that we can have some hope that its conclusions are valid.
In this chapter, we first address the issue of conceptualization, using at-riskness and related concepts as examples. We then focus on measurement, reviewing first how measures of at risk have been constructed using operations such as available data, questions, observations, and less direct and obtrusive measures.
Concepts
Measurement Operations
Levels of Measurement
Evaluating Measures
Copyright ©2020 by SAGE Publications, Inc. This work may not be reproduced or distributed in any form or by any means without express written permission of the publisher.
Do not
copy
, pos
t, or d
istrib
ute
Part I Foundations of Research66
We then discuss the different possible levels of measurement and methods for assessing the validity and reli-ability of measures. The final topic is to consider the unique insights that qualitative methods can add to the measurement process. By the chapter’s end, you should have a good understanding of measurement, the first of the three legs on which a research project’s validity rests.
22 Concepts
Although the statistics on at-risk students sound scary, we need to be clear about what they mean before we jump in and try to solve the problem. Here are three different definitions of at risk:
1. Researchers often use the socioeconomic status of students’ homes and of the schools they attend as an indicator of academic risk. Using this definition, in addition to low economic status, students iden-tified as most at risk in a study by Finn (2006, pp. iii–iv) shared these characteristics: were minority status, attended urban or rural public schools, were from non-English-speaking homes, and were not living with both biological parents.
2. The federal government’s Educational Resources Information Clearinghouse (ERIC, 2008) defines at-risk students as “students considered in danger of not graduating, being promoted, or meeting other education-related goals. Risk factors may include, but are not limited to, socioeconomic status; aca-demic background; behavior, cognitive, or physical problems; family or community environment; and school capacity to meet student needs.”
3. The U.S. Department of Education’s National Institute on the Education of At-Risk Students (2002) states that its mission is “to improve the education of students at risk of educational failure because of limited English proficiency, poverty, race, geographic location, or economic disadvantage.”
Notice that these definitions largely overlap but that each contains at least one element that is not included in the other two. The first definition includes minority status; the second contains specific mention of behavior, cognitive, or physical problems; and the third mentions geographic location. There is no single definition that everyone agrees with. This means that “at risk” is a concept—a mental image that summarizes a set of similar observations, feelings, or ideas. To make that concept useful in research (and even in ordinary discourse), we have to define it.
This will become obvious once you realize that many concepts are used without consistent definition, that definitions are themselves often the object of intense debate, and that the meanings of concepts may change over time.
Concepts such as “at risk,” “behavior problem,” and “poverty” require an explicit definition before they are used in research because we cannot be certain that all readers will share a particular definition or that the current meaning of the concept is the same as it was when previous research was published. It is especially important to define clearly concepts that are abstract or unfamiliar. When we refer to concepts such as “at risk,” “behavior problem,” or “poverty,” we cannot count on others knowing exactly what we mean. Even experts may disagree about the meaning of frequently used concepts if they base their conceptualizations on different theories. That’s okay. The point is not that there can be only one definition of a concept but that we have to specify clearly what we mean when we use a concept, and we must expect others to do the same.
Conceptualization: The process of specifying what we mean by a term. In deductive research, conceptualization helps to translate portions of an abstract theory into specific variables that can be used in testable hypotheses. In inductive research, conceptualization is an important part of the process used to make sense of related observations.
Copyright ©2020 by SAGE Publications, Inc. This work may not be reproduced or distributed in any form or by any means without express written permission of the publisher.
Do not
copy
, pos
t, or d
istrib
ute
Chapter 4 Conceptualization and Measurement 67
Conceptualization in Practice
If we are to do an adequate job of conceptualizing, we must do more than just think up some definition, any definition, for our concepts. We have to turn to educational theory and prior research to review appropriate definitions. We may need to distinguish subconcepts, or dimensions, of the concept. We should understand how the definition we choose fits within the theoretical framework guiding the research and what assump-tions underlie this framework.
At-Risk Students
What observations or images should we associate with the concept “at risk”? A 10th grader giving up on a state assessment test because he knows he’ll fail? A middle school student passing out on Saturday night from too much to drink? A high school freshman constantly suspended for acting out and not paying attention? Do all of these images share something in common that we should define as “at-riskness” for the purposes of a particu-lar research study? Should we take into account cultural and linguistic differences? Social situations? Medical conditions?
Many researchers would agree with the North Central Regional Educational Laboratory (1996):
The question of what it means to be “at risk” is controversial. When children do not succeed in school, educators and others disagree about who or what is to blame. Because learning is a process that takes place both inside and outside school, an ecological approach offers a working description of the term at risk. In this view, inadequacies in any arena of life—the school, the home, or the community—can contribute to academic failure when not compensated for in another arena.
We should recognize that this definition ref lects a particular theoretical orientation, the “ecological approach.” The ecological approach emphasizes an all-around view that looks not just at what happens to the student in school but at the home and the community as well. How we conceptualize reflects how we theorize.
Just as we can connect concepts to theory, we also can connect them to other concepts. What this means is that the definition of any one concept rests on a shared understanding of the other terms used in the definition. So if our audience does not already have a shared understanding of a term such as academic failure, we must also define that term before we are finished with the process of defining at-riskness.
Poverty
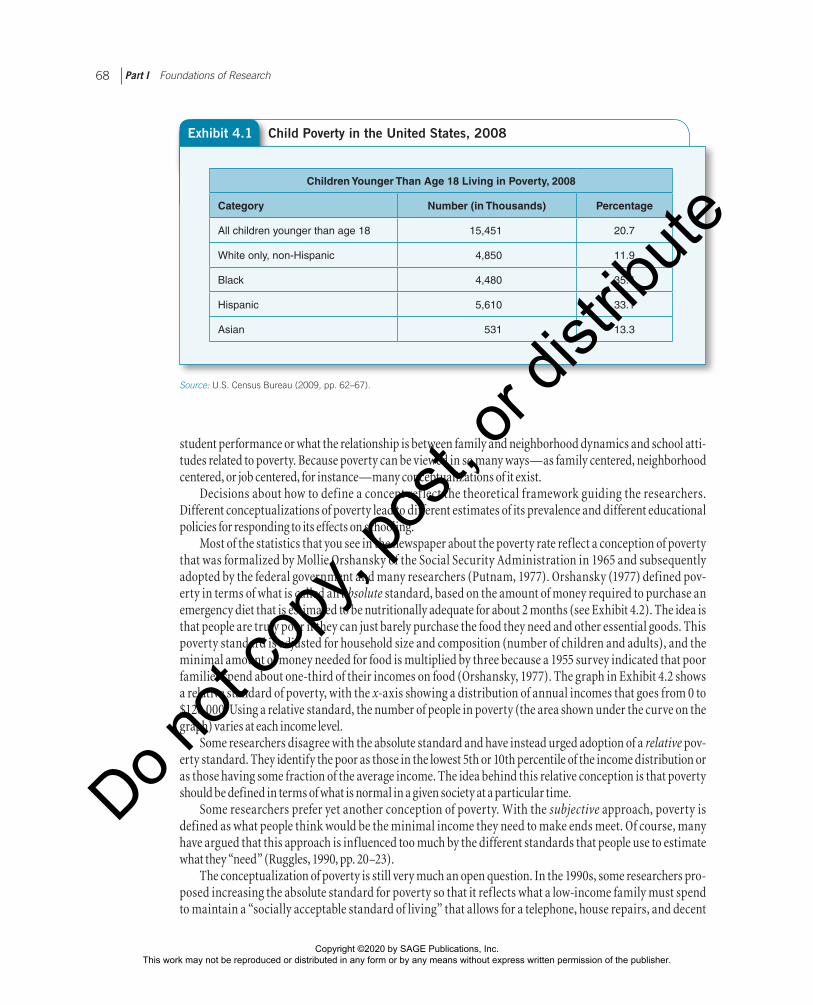
One factor closely associated with at-riskness is poverty. But what exactly does this mean? What is the effect of poverty on America’s schoolchildren? We know that “children represent a disproportionate share of the poor in the United States; they are 25 percent of the total population, but 35 percent of the poor population. In 2008, 15.45 million children, or 20.7 percent, were poor.” (National Poverty Center, 2009). We also know that child poverty rates vary widely depending on race and ethnicity (see Exhibit 4. 1).
By any definition, family poverty is an academic risk factor: A correlation between poverty and school per-formance has long been accepted as fact. But there are various ways to define and calculate poverty, each with its own consequences. Exhibit 4.1 gives the results of the standard method used by the U.S. Census Bureau. But in education, “School poverty rates are defined as the percentage of students eligible to receive free or reduced-price lunches” (Roosa, Deng, Nair, & Burrell, 2005, p. 971). This conception makes it fairly simple to calculate whether a school is “high poverty” or not, an important factor in federal reimbursement formulas. High-poverty schools are more likely to have negative characteristics such as fewer resources, less qualified teachers, and lower academic achievement even among students who have a family income above the poverty line. But the “free or reduced-lunch” definition does little to explain the mechanisms by which poverty affects
Copyright ©2020 by SAGE Publications, Inc. This work may not be reproduced or distributed in any form or by any means without express written permission of the publisher.
Do not
copy
, pos
t, or d
istrib
ute
Part I Foundations of Research68
student performance or what the relationship is between family and neighborhood dynamics and school atti-tudes related to poverty. Because poverty can be viewed in so many ways—as family centered, neighborhood centered, or job centered, for instance—many conceptualizations of it exist.
Decisions about how to define a concept ref lect the theoretical framework guiding the researchers. Different conceptualizations of poverty lead to different estimates of its prevalence and different educational policies for responding to its effects on schooling.
Most of the statistics that you see in the newspaper about the poverty rate reflect a conception of poverty that was formalized by Mollie Orshansky of the Social Security Administration in 1965 and subsequently adopted by the federal government and many researchers (Putnam, 1977). Orshansky (1977) defined pov-erty in terms of what is called an absolute standard, based on the amount of money required to purchase an emergency diet that is estimated to be nutritionally adequate for about 2 months (see Exhibit 4.2). The idea is that people are truly poor if they can just barely purchase the food they need and other essential goods. This poverty standard is adjusted for household size and composition (number of children and adults), and the minimal amount of money needed for food is multiplied by three because a 1955 survey indicated that poor families spend about one-third of their incomes on food (Orshansky, 1977). The graph in Exhibit 4.2 shows a relative standard of poverty, with the x-axis showing a distribution of annual incomes that goes from 0 to $120,000. Using a relative standard, the number of people in poverty (the area shown under the curve on the graph) varies at each income level.
Some researchers disagree with the absolute standard and have instead urged adoption of a relative pov-erty standard. They identify the poor as those in the lowest 5th or 10th percentile of the income distribution or as those having some fraction of the average income. The idea behind this relative conception is that poverty should be defined in terms of what is normal in a given society at a particular time.
Some researchers prefer yet another conception of poverty. With the subjective approach, poverty is defined as what people think would be the minimal income they need to make ends meet. Of course, many have argued that this approach is influenced too much by the different standards that people use to estimate what they “need” (Ruggles, 1990, pp. 20–23).
The conceptualization of poverty is still very much an open question. In the 1990s, some researchers pro-posed increasing the absolute standard for poverty so that it reflects what a low-income family must spend to maintain a “socially acceptable standard of living” that allows for a telephone, house repairs, and decent
Exhibit 4.1 Child Poverty in the United States, 2008
Children Younger Than Age 18 Living in Poverty, 2008
Category Number (in Thousands) Percentage
All children younger than age 18 15,451 20.7
White only, non-Hispanic 4,850 11.9
Black 4,480 35.4
Hispanic 5,610 33.1
Asian 531 13.3
Source: U.S. Census Bureau (2009, pp. 62–67).
Copyright ©2020 by SAGE Publications, Inc. This work may not be reproduced or distributed in any form or by any means without express written permission of the publisher.
Do not
copy
, pos
t, or d
istrib
ute

Chapter 4 Conceptualization and Measurement 69
clothes (Uchitelle, 1999). In 2009, in response to perceived limitations in the official measure, the U.S. Census Bureau began developing the Supplemental Poverty Measure, an experimental alternative method of calculat-ing poverty (Short, 2011).
Exhibit 4.2 Absolute, Relative, and Subjective Poverty Standards
Source: Schutt (2012).
$200,000
$180,000
$160,000
$140,000
$120,000
$100,000
$80,000
$60,000
$40,000
$20,000
$0
1967
1970
1973
1976
1979
1982
1985
1988
1991
1994
1997
2000
2003
2006
2009
$170,844
$78,694
$49,534
$29,257
$11,552
Highest fifth Fourth fifth Third fifth Second fifth Lowest fifth
Absolute Standard Subjective Standard
Relative Standard
Mean Household Income by Quartile: 1967 to 2009
Copyright ©2020 by SAGE Publications, Inc. This work may not be reproduced or distributed in any form or by any means without express written permission of the publisher.
Do not
copy
, pos
t, or d
istrib
ute
Part I Foundations of Research70
Which do you think is a more reasonable approach to defining poverty: some type of absolute stan-dard, a relative standard, or a subjective standard? Be careful here: Conceptualization has consequences! Research using the standard absolute concept of poverty indicated that the percentage of Americans in poverty declined by 1.7% in the 1990s, but use of a relative concept of poverty led to the conclusion that poverty increased by 2.7% (Mayrl et al., 2004, p. 10). No matter which conceptualization we decide to adopt, our understanding of the concept of poverty will be sharpened after we consider these alternative definitions.
From Concepts to Observations
Identifying the concepts we will study, specifying dimensions of these concepts, and defining their meaning only begins the process of connecting our ideas to concrete observations. If we are to conduct empirical research involving a concept, we must be able to distinguish it in the world around us and determine how it may change over time or differ between persons or locations. Operationalization is
the process of connecting concepts to observations. You can think of it as the empirical counterpart of the process of conceptualization. When we conceptualize, we specify what we mean by a term (see Exhibit 4.3). When we operationalize, we identify specific observations that we will take to indicate that concept in empirical reality.
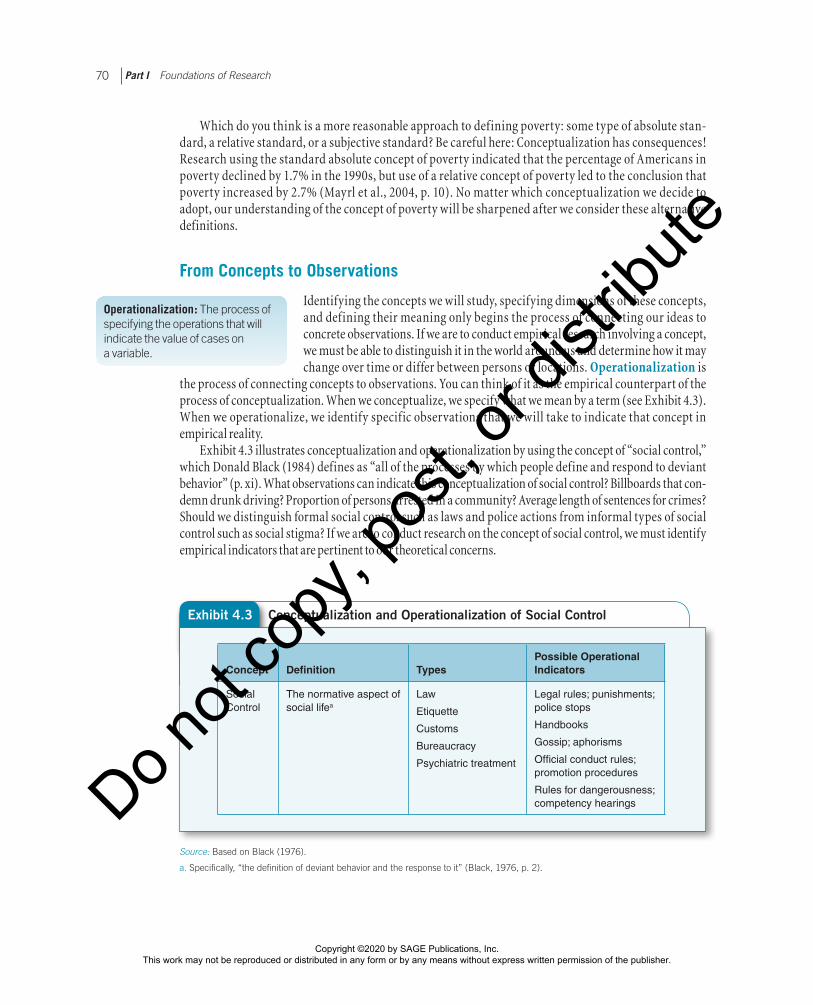
Exhibit 4.3 illustrates conceptualization and operationalization by using the concept of “social control,” which Donald Black (1984) defines as “all of the processes by which people define and respond to deviant behavior” (p. xi). What observations can indicate this conceptualization of social control? Billboards that con-demn drunk driving? Proportion of persons arrested in a community? Average length of sentences for crimes? Should we distinguish formal social control such as laws and police actions from informal types of social control such as social stigma? If we are to conduct research on the concept of social control, we must identify empirical indicators that are pertinent to our theoretical concerns.
Operationalization: The process of specifying the operations that will indicate the value of cases on a variable.
Exhibit 4.3 Conceptualization and Operationalization of Social Control
Concept
Definition
Types
Possible Operational Indicators
Social Control
The normative aspect of social lifea
Law
Etiquette
Customs
Bureaucracy
Psychiatric treatment
Legal rules; punishments; police stops
Handbooks
Gossip; aphorisms
Official conduct rules; promotion procedures
Rules for dangerousness; competency hearings
Source: Based on Black (1976).
a. Specifically, “the definition of deviant behavior and the response to it” (Black, 1976, p. 2).
Copyright ©2020 by SAGE Publications, Inc. This work may not be reproduced or distributed in any form or by any means without express written permission of the publisher.
Do not
copy
, pos
t, or d
istrib
ute
Chapter 4 Conceptualization and Measurement 71
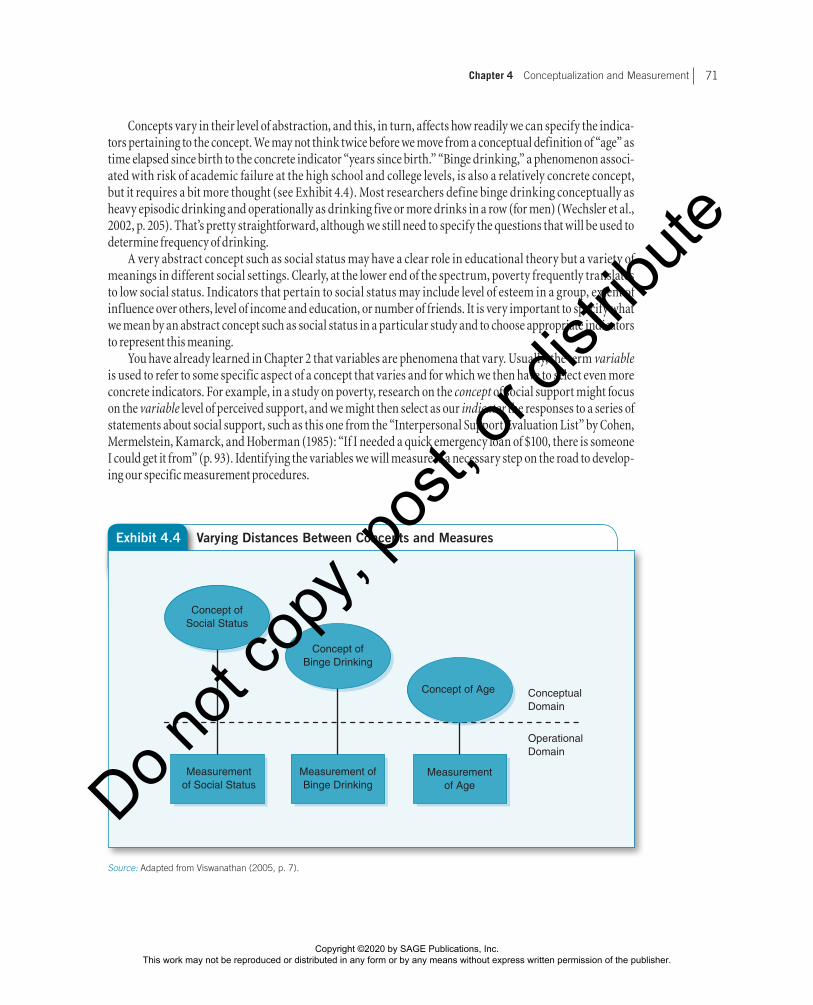
Concepts vary in their level of abstraction, and this, in turn, affects how readily we can specify the indica-tors pertaining to the concept. We may not think twice before we move from a conceptual definition of “age” as time elapsed since birth to the concrete indicator “years since birth.” “Binge drinking,” a phenomenon associ-ated with risk of academic failure at the high school and college levels, is also a relatively concrete concept, but it requires a bit more thought (see Exhibit 4.4). Most researchers define binge drinking conceptually as heavy episodic drinking and operationally as drinking five or more drinks in a row (for men) (Wechsler et al., 2002, p. 205). That’s pretty straightforward, although we still need to specify the questions that will be used to determine frequency of drinking.
A very abstract concept such as social status may have a clear role in educational theory but a variety of meanings in different social settings. Clearly, at the lower end of the spectrum, poverty frequently translates to low social status. Indicators that pertain to social status may include level of esteem in a group, extent of influence over others, level of income and education, or number of friends. It is very important to specify what we mean by an abstract concept such as social status in a particular study and to choose appropriate indicators to represent this meaning.
You have already learned in Chapter 2 that variables are phenomena that vary. Usually, the term variable is used to refer to some specific aspect of a concept that varies and for which we then have to select even more concrete indicators. For example, in a study on poverty, research on the concept of social support might focus on the variable level of perceived support, and we might then select as our indicator the responses to a series of statements about social support, such as this one from the “Interpersonal Support Evaluation List” by Cohen, Mermelstein, Kamarck, and Hoberman (1985): “If I needed a quick emergency loan of $100, there is someone I could get it from” (p. 93). Identifying the variables we will measure is a necessary step on the road to develop-ing our specific measurement procedures.
Source: Adapted from Viswanathan (2005, p. 7).
Exhibit 4.4 Varying Distances Between Concepts and Measures
Measurementof Social Status
Measurement ofBinge Drinking
Measurementof Age
ConceptualDomain
OperationalDomain
Concept ofSocial Status
Concept ofBinge Drinking
Concept of Age
Copyright ©2020 by SAGE Publications, Inc. This work may not be reproduced or distributed in any form or by any means without express written permission of the publisher.
Do not
copy
, pos
t, or d
istrib
ute
Part I Foundations of Research72
Bear in mind that concepts don’t necessarily vary. For example, gender may be an important concept in a study of influences on school attendance, but it isn’t a variable in a study of students on the boys’ volleyball team. When we explain school attendance patterns for the team, we might attach great importance to the all-male team subculture. However, because gender doesn’t vary in this setting, we won’t be able to study differ-ences in attendance between male and female students. So, gender will be a constant, not a variable, in this study (unless we expand our sample to include both the boys’ volleyball and girls’ volleyball teams).
How do we know what concepts to consider and then which variables to include in a study? It’s very tempt-ing to simply try to measure everything by including in a study every variable we can think of that might have something to do with our research question. This haphazard approach will inevitably result in the collection of some data that are useless and the failure to collect some data that are important. Instead, a careful researcher will examine relevant theories to identify key concepts, review prior research to learn how useful different indicators have been, and assess the resources available for measuring adequately variables in the specific set-ting to be studied.
From Observations to Concepts
Qualitative research projects usually take an inductive approach to the process of conceptualization. In an inductive approach, concepts emerge from the process of thinking about what has been observed, as com-pared to the deductive approach that just described, in which we develop concepts on the basis of theory and then decide what should be observed to indicate that concept. So instead of deciding in advance which con-cepts are important for a study, what these concepts mean, and how they should be measured, if you take an inductive approach, you will begin by recording verbatim what you hear in intensive interviews or see during observational sessions. You will then review this material to identify important concepts and their meaning for participants. At this point, you may identify relevant variables and develop procedures for indicating varia-tion between participants and settings or variation over time.
Qualitative researchers often develop key concepts inductively, in the course of the research, and continue to refine and evaluate the concepts throughout the research. Conceptualization, operationalization, and vali-dation are ongoing and interrelated processes. You will learn more about qualitative research in Chapter 9.
22 Measurement Operations
The deductive researcher proceeds from defining concepts in the abstract (con-ceptualizing) to identifying variables to measure and finally to developing specific measurement procedures. Measurement is the “process of linking abstract con-cepts to empirical indicants” (Carmines & Zeller, 1979, p. 10). The goal is to achieve
measurement validity, so the measurement operations must actually measure the variables they are intended to measure.
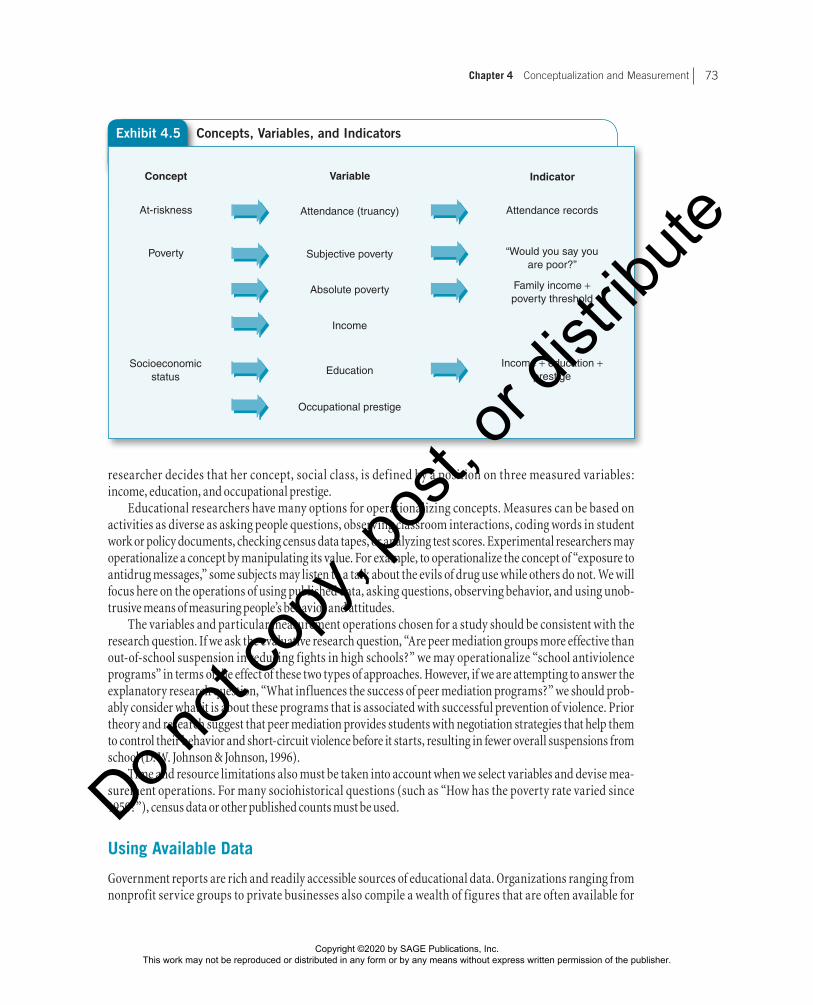
Exhibit 4.5 represents the operationalization process in three hypothetical studies. The first researcher defines his or her concept, at-riskness, and chooses one variable—attendance (truancy)—to represent it. This variable is then measured with a single indicator: school attendance records. The second researcher defines his or her concept, poverty, as having two aspects or dimensions: subjective poverty and absolute poverty. Subjective poverty is measured with responses to a survey question: “Would you say that you are poor?” Absolute poverty is measured by comparing family income to the poverty threshold. The third
Operation: A procedure for identifying or indicating the value of cases on a variable.
Copyright ©2020 by SAGE Publications, Inc. This work may not be reproduced or distributed in any form or by any means without express written permission of the publisher.
Do not
copy
, pos
t, or d
istrib
ute
Chapter 4 Conceptualization and Measurement 73
researcher decides that her concept, social class, is defined by a position on three measured variables: income, education, and occupational prestige.
Educational researchers have many options for operationalizing concepts. Measures can be based on activities as diverse as asking people questions, observing classroom interactions, coding words in student work or policy documents, checking census data tapes, or analyzing test scores. Experimental researchers may operationalize a concept by manipulating its value. For example, to operationalize the concept of “exposure to antidrug messages,” some subjects may listen to a talk about the evils of drug use while others do not. We will focus here on the operations of using published data, asking questions, observing behavior, and using unob-trusive means of measuring people’s behavior and attitudes.
The variables and particular measurement operations chosen for a study should be consistent with the research question. If we ask the evaluative research question, “Are peer mediation groups more effective than out-of-school suspension in reducing fights in high schools?” we may operationalize “school antiviolence programs” in terms of the effect of these two types of approaches. However, if we are attempting to answer the explanatory research question, “What influences the success of peer mediation programs?” we should prob-ably consider what it is about these programs that is associated with successful prevention of violence. Prior theory and research suggest that peer mediation provides students with negotiation strategies that help them to control their behavior and short-circuit violence before it starts, resulting in fewer overall suspensions from school (D. W. Johnson & Johnson, 1996).
Time and resource limitations also must be taken into account when we select variables and devise mea-surement operations. For many sociohistorical questions (such as “How has the poverty rate varied since 1950?”), census data or other published counts must be used.
Using Available Data
Government reports are rich and readily accessible sources of educational data. Organizations ranging from nonprofit service groups to private businesses also compile a wealth of figures that are often available for
Exhibit 4.5 Concepts, Variables, and Indicators
Concept Variable Indicator
At-riskness Attendance (truancy) Attendance records
Socioeconomic status
Education
Occupational prestige
Income + education + prestige
Poverty Subjective poverty
Absolute poverty
Income
“Would you say you are poor?”
Family income + poverty threshold
Copyright ©2020 by SAGE Publications, Inc. This work may not be reproduced or distributed in any form or by any means without express written permission of the publisher.
Do not
copy
, pos
t, or d
istrib
ute
Part I Foundations of Research74
research purposes. In addition, the data collected in many educational evaluations and surveys, such as the National Assessment of Educational Progress (NAEP), are archived and made available for researchers who were not involved in the original assessment or survey project.
Before we assume that available data will be useful, we must consider how appropriate they are for our concepts of interest. We may conclude that some other measure would provide a better fit with a concept or that a particular concept simply cannot adequately be operationalized with the available data. For example, family poverty is an important component of at-riskness. But definitions and methods for measuring poverty vary widely. One study of this definitional problem concluded that “most family scholars take the concept of poverty for granted. [But] the variety of ways people have chosen to measure this concept . . . makes it difficult to interpret or compare research results” (Roosa et al., 2005, p. 971).
We also cannot assume that available data are accurate, even when they appear to measure the concept in which we are interested in a way that is consistent across communities. “Official” counts of school dropouts at the local and state levels over time may be less than accurate because school systems can change the way they measure “dropping out” from year to year. This makes cross-state comparisons unreliable (P. Kaufman, Alt, & Chapman, 2001).
Online resources such as the Basic Family Budget Calculator of the Economic Policy Institute (http://www.epi.org/content/budget_calculator/) and the Kids Count Online Data Snapshot Series of the Annie E. Casey Foundation (http://www.aecf.org/kidscount/ ) present public statistics from a variety of state and fed-eral sources in highly accessible, user-configurable formats. Poverty rates, relative family income measures, childhood obesity statistics, and a plethora of other information on the well-being of children and families are instantly available on these and other websites.
Constructing Questions
Asking people questions is the most common and probably the most versatile operation for measuring edu-cational variables. Most concepts about individuals can be defined in such a way that measurement with one or more questions becomes an option. We associate questions with survey research, but questions are also often the basis of measures used in educational experiments and in qualitative research. In this section, we’ll introduce some options for writing single questions; in Chapter 8, we’ll explain why single questions can be inadequate measures of some concepts, and then we’ll examine measurement approaches that rely on multiple questions to measure a concept.
In practice, questions can sometimes yield misleading or inappropriate answers. Memories and percep-tions of events can be limited, and some respondents may intentionally give misleading answers. All questions proposed for a study must be screened carefully for their adherence to basic guidelines and then tested and revised until the researcher feels some confidence that they will be clear to the intended respondents and likely to measure the intended concept (Fowler, 1995). Specific guidelines for reviewing questions are presented in Chapter 9; here our focus is on the different types of questions used in educational research.
Measuring variables with single questions is very popular. Public opinion polls based on answers to single questions are reported frequently in newspaper articles and TV newscasts: “Do you favor or oppose U.S. policy in. . . ?” “If you had to vote today, for which candidate would you vote?” Educational research surveys also rely on single questions to measure many variables: “Overall, how satisfied are you with teaching as a career?” “How would you rate your current principal?”
Single questions can be designed with or without explicit response choices. The question that follows is a closed-ended (fixed-choice) question because respondents are offered explicit responses to choose from. It deals with an important educational and personal risk factor for college students, alcohol abuse. It has been selected from the Core Alcohol and Drug Survey distributed by the Core Institute, Southern Illinois University, for the Fund for the Improvement of Postsecondary Education (FIPSE) Core Analysis Grantee Group (Presley, Meilman, & Lyerla, 1994).
Copyright ©2020 by SAGE Publications, Inc. This work may not be reproduced or distributed in any form or by any means without express written permission of the publisher.
Do not
copy
, pos
t, or d
istrib
ute
Chapter 4 Conceptualization and Measurement 75
Compared to other campuses with which you are familiar, this campus’s use of alcohol is . . . (Mark one)
___ Greater than other campuses
___ Less than other campuses
___ About the same as other campuses
Most surveys of a large number of people contain primarily fixed-choice questions, which are easy to pro-cess with computers and analyze with statistics. With fixed-choice questions, respondents are also more likely to answer the question that the researcher really wants them to answer. Including response choices reduces ambiguity and makes it easier for respondents to answer. However, fixed-response choices can obscure what people really think if the choices do not match the range of possible responses to the question; many studies show that some respondents will choose response choices that do not apply to them simply to give some sort of answer (Peterson, 2000, p. 39).
Most important, response choices should be mutually exclusive and exhaustive, so that every respondent can find one and only one choice that applies to him or her (unless the question is of the “Check all that apply” format). To make response choices exhaustive, researchers may need to offer at least one option with room for ambiguity. For example, a questionnaire asking college students to indicate their school status should not use freshman, sophomore, junior, senior, and graduate student as the only response choices. Most campuses also have students in a “special” category, so you might add “Other (please specify)” to the five fixed responses to this question. If respondents do not find a response option that corresponds to their answer to the ques-tion, they may skip the question entirely or choose a response option that does not indicate what they are really thinking.
Researchers who study small numbers of people often use open-ended questions, which don’t have explicit response choices and allow respondents to write in their answers. The next question is an open-ended version of the earlier fixed-choice question:
How would you say alcohol use on this campus compares to that on other campuses?
An open-ended format is preferable when the full range of responses cannot be anticipated, especially when questions have not been used previously in surveys or when questions are asked of new groups. Open-ended questions also can allow clear answers when questions involve complex concepts. In the previous ques-tion, for instance, “alcohol use” may cover how many students drink, how heavily they drink, if they drink in public or not, if drinking affects levels of violence on campus, and so on.
Just like fixed-choice questions, open-ended questions should be reviewed carefully for clarity before they are used. For example, if respondents are just asked, “When did you move to Boston?” they might respond with a wide range of answers: “In 1944,” “After I had my first child,” “When I was 10,” “20 years ago.” Such answers would be very hard to compile. A careful review should identify potential ambiguity. To avoid it, rephrase the question to guide the answer in a certain direction, such as, “In what year did you move to Boston?” or provide explicit response choices (Center for Survey Research, 1987).
Making Observations
Observations can be used to measure characteristics of individuals, events, and places. The observations may be the primary form of measurement in a study, or they may supplement measures obtained through questioning.
Direct observations can be used as indicators of some concepts, such as disability. For example, you may recall the study cited in Chapter 1, in which Erwin et al. (1999) studied interactions between 3-year-old Ryan,
Copyright ©2020 by SAGE Publications, Inc. This work may not be reproduced or distributed in any form or by any means without express written permission of the publisher.
Do not
copy
, pos
t, or d
istrib
ute
Part I Foundations of Research76
a physically disabled student, and his classmates. The research team observed the classroom once a month for a full year, developing a coding form with notations for frequently observed behaviors such as how many contacts occurred between Ryan and other students, who initiated the contacts, and whether they were verbal, physical, or both.
Observations may also supplement data collected in an interview study. This approach was used in a study of school satisfaction among 61 poor, at-risk African American third- through fifth-grade students in a large urban district in the southeast United States (Baker, 1999). Each student filled out a self-report survey and participated in a 15-minute structured interview by a trained researcher to try to judge their satisfaction with the school. The same researcher then observed the students in a classroom setting, coding teacher-student interaction into four categories: (1) student initiated contact regarding academic work, (2) teacher initi-ated contact regarding academic work, (3) teacher-initiated contact regarding behavior, and (4) procedural contact (Baker, 1999). The researcher concluded that the findings indicated that “although much previous research has focused on adolescents, in this study clear distinctions were evident in school satisfaction by third grade” (p. 67).
Direct observation is often the method of choice for measuring behavior in natural settings, as long as it is possible to make the requisite observations. Direct observation avoids the problems of poor recall and self-serving distortions that can occur with answers to survey questions. It also allows measurement in a context that is more natural than an interview. But observations can be distorted, too. Observers do not see or hear everything, and what they do see is filtered by their own senses and perspectives. When the goal is to observe behavior, measurement can be distorted because the presence of an observer may cause people to act differently from the way they would otherwise (Emerson, 1983). We will discuss these issues in more depth in Chapter 9, but it is important to consider them whenever you read about observational measures.
Collecting Unobtrusive Measures
Unobtrusive measures allow us to collect data about individuals or groups without their direct knowledge or participation. In their classic book (now revised), Webb, Campbell, Schwartz, and Sechrest (2000) identified four types of unobtrusive measures: physical trace evidence, archives (available data), simple observation, and contrived observation (using hidden recording hardware or manipulation to elicit a response). These measures can provide valuable supplements or alternatives to more standard, survey-based measures because they lessen the possibility that respondents will make different statements to an interviewer than when they are not being studied and because they are unaffected by an interviewer’s appearance or how he or she asks questions. We have already considered some types of archival data and observational data, so we will focus here on other approaches suggested by Webb et al.
The physical traces of past behavior are one type of unobtrusive measure that is most useful when the behavior of interest cannot be directly observed (perhaps because it is hidden or occurred in the past) and has not been recorded in a source of available data. To measure the prevalence of drinking in college dorms or fraternity houses, we might count the number of empty bottles of alcoholic beverages in the surrounding dumpsters. Student interest in the college courses they are taking might be measured by counting the number of times that books left on reserve as optional reading are checked out or by the number of class handouts left in trash barrels outside a lecture hall.
Unobtrusive measures can also be created from such diverse forms of media as newspaper archives or magazine articles, historical documents, policy reports, or e-mail messages. Qualitative researchers may read and evaluate text. Quantitative researchers use content analysis to measure aspects of media such as the fre-quency of using particular words or ideas or the consistency with which authors convey a particular message in their stories.
Copyright ©2020 by SAGE Publications, Inc. This work may not be reproduced or distributed in any form or by any means without express written permission of the publisher.
Do not
copy
, pos
t, or d
istrib
ute
Chapter 4 Conceptualization and Measurement 77
Combining Measurement Operations
Using available data, asking questions, making observations, and using unobtrusive indicators are interre-lated measurement tools, each of which may include or be supplemented by the others. The choice of a particu-lar measurement method is often determined by available resources and opportunities, but measurement is improved if this choice also takes into account the particular concept or concepts to be measured. Responses to questions such as, “How engaged are you in class?” or “How many days were you absent last year?” are unlikely to provide information as valid as, respectively, direct observation or school records. On the other hand, observations in class may not answer our questions about why some students do not participate; we may have to ask them. However, questioning can be a particularly poor approach for measuring behaviors that are very socially desirable, such as voting or attending church, or that are socially stigmatized or illegal, such as abusing alcohol or drugs.
Triangulation—the use of two or more different measures of the same variable—can strengthen mea-surement considerably (Brewer & Hunter, 1989, p. 17). We will see several school-based examples of triangula-tion used by teacher researchers in Chapter 12. When we achieve similar results with different measures of the same variable, particularly when they are based on such different methods as survey questions and field-based observations, we can be more confident in the validity of each measure. If results diverge with different measures, it may indicate that one or more of these measures are influenced by more measurement error than we can tolerate. Divergence between measures could also indicate that they actually operationalize different concepts.
22 Levels of Measurement
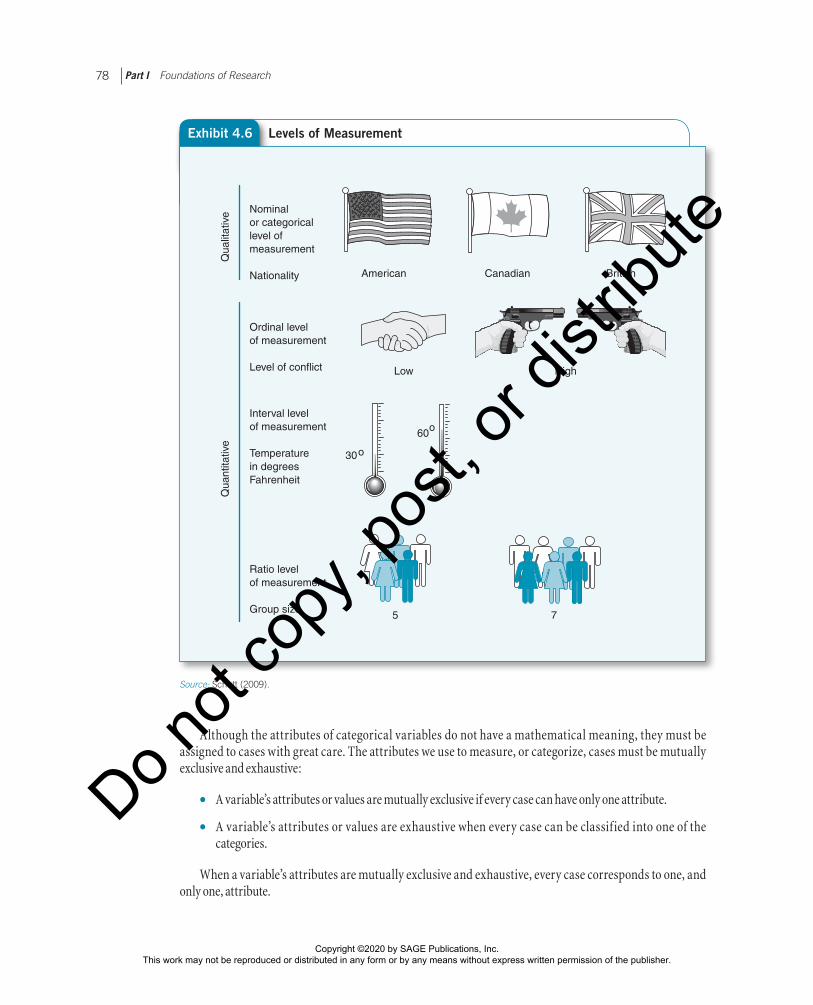
When we know a variable’s level of measurement, we can better understand how cases vary on that variable and so understand more fully what we have measured. Level of measurement also has important implications for the type of statistics that can be used with the variable, as you will learn in Chapter 13. There are four levels of measurement: nominal, ordinal, interval, and ratio. Exhibit 4.6 depicts the differ-ences among these four levels.
Nominal Level of Measurement
The nominal level of measurement (also called the categorical or qualitative level) identifies variables whose values have no mathematical interpretation; they vary in kind or quality but not in amount. In fact, it is con-ventional to refer to the values of nominal variables as “attributes” instead of values. “State” (referring to the United States) is one example. The variable has 50 attributes (or categories or qualities). We might indicate specific states with numbers, so that California might be represented by the value 1 and Oregon with the value 2 and so on, but these numbers do not tell us anything about the difference between the states except that they are different. California is not one unit more of “state” than Oregon, nor is it twice as much “state.” Nationality, occupation, religious affiliation, and region of the country are also measured at the nominal level. A person may be Spanish or Portuguese, but one nationality does not represent more nationality than another—just a different nationality (see Exhibit 4.6). A person may be a doctor or a truck driver, but one does not represent three units more occupation than the other.
Level of measurement: The mathematical precision with which the values of a variable can be expressed. The nominal level of measurement, which is qualitative, has no mathematical interpretation; the quantitative levels of measurement—ordinal, interval, and ratio—are progressively more precise mathematically.
Copyright ©2020 by SAGE Publications, Inc. This work may not be reproduced or distributed in any form or by any means without express written permission of the publisher.
Do not
copy
, pos
t, or d
istrib
ute
Part I Foundations of Research78
Although the attributes of categorical variables do not have a mathematical meaning, they must be assigned to cases with great care. The attributes we use to measure, or categorize, cases must be mutually exclusive and exhaustive:
•• A variable’s attributes or values are mutually exclusive if every case can have only one attribute.
•• A variable’s attributes or values are exhaustive when every case can be classified into one of the categories.
When a variable’s attributes are mutually exclusive and exhaustive, every case corresponds to one, and only one, attribute.
Exhibit 4.6 Levels of Measurement
Qua
litat
ive Nominal
or categoricallevel ofmeasurement
Nationality American Canadian British
Qua
ntita
tive
Low High
Interval levelof measurement
Temperaturein degreesFahrenheit
o30
60o
Ratio levelof measurement
Group size 5 7
Ordinal levelof measurement
Level of conflict
Source: Schutt (2009).
Copyright ©2020 by SAGE Publications, Inc. This work may not be reproduced or distributed in any form or by any means without express written permission of the publisher.
Do not
copy
, pos
t, or d
istrib
ute
Chapter 4 Conceptualization and Measurement 79
Ordinal Level of Measurement
The first of the three quantitative levels is the ordinal level of measurement. At this level, you specify only the order of the cases in “greater than” and “less than” distinctions. At the coffee shop, for example, you might choose between a small, medium, or large cup of decaf—that’s ordinal measurement.
The properties of variables measured at the ordinal level are illustrated in Exhibit 4.6 by the contrast in the level of conflict in two groups. The first group, symbolized by the people shaking hands, has a low level of conflict. The second group, symbolized by two people pointing guns at each other, has a high level of conf lict. To measure conf lict, we could put the groups “in order” by assigning 1 to the low-conf lict group and 2 to the high-conflict group, but the numbers would indicate only the relative position, or order, of the cases.
As with nominal variables, the different values of ordinal variables must be mutually exclusive and exhaustive. They must cover the range of observed values and allow each case to be assigned no more than one value.
Interval Level of Measurement
At the interval level of measurement, numbers represent fixed measurement units but have no absolute zero point. This level of measurement is represented in Exhibit 4.6 by the difference between two Fahrenheit tem-peratures. Note, for example, that 60 degrees is 30 degrees hotter than 30 degrees, but 60 is not “twice as hot” as 30. Why not? Because heat does not “begin” at 0 degrees on the Fahrenheit scale. The numbers can therefore be added and subtracted, but ratios of them (2 to 1 or “twice as much”) are not meaningful.
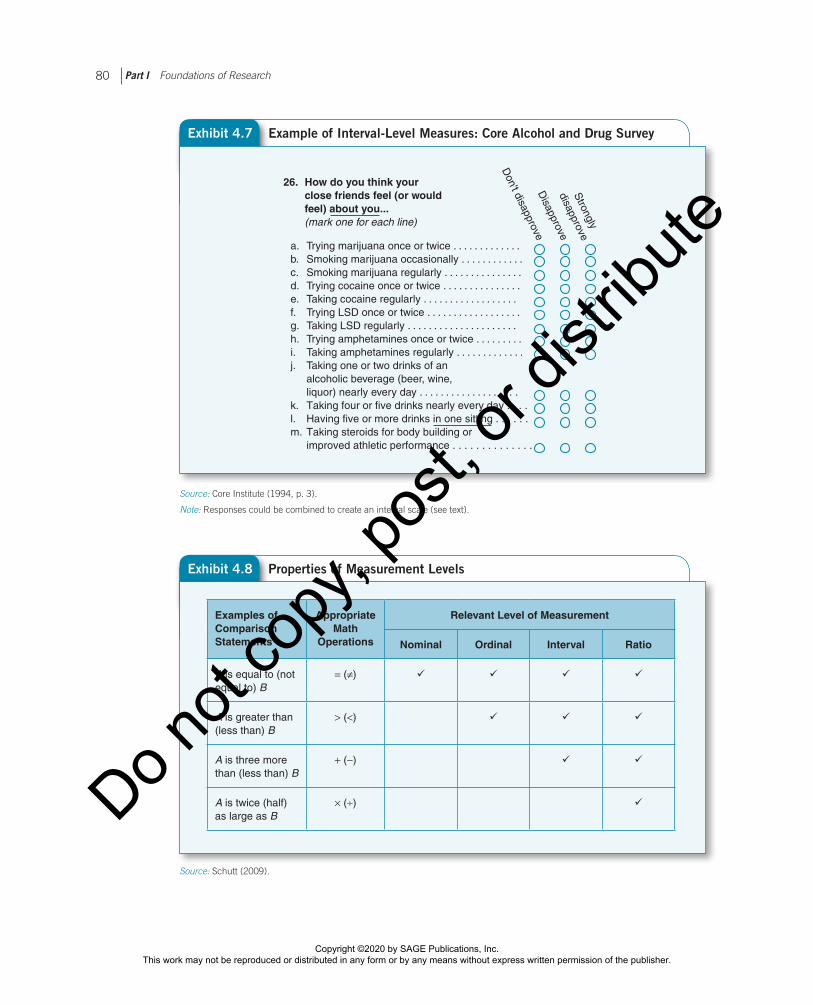
Sometimes, though, researchers will create indexes by combining responses to a series of variables measured at the ordinal level and then treat these indexes as interval-level measures. An index of this sort could be created with responses to the Core Institute’s (1994) questions about friends’ disapproval of substance use (see Exhibit 4.7). The survey has 13 questions on the topic, each of which has the same three response choices. If “Don’t disapprove” is valued at 1, “Disapprove” is valued at 2, and “Strongly dis-approve” is valued at 3, the summed index of disapproval would range from 12 to 36. A score of 20 could be treated as if it were four more units than a score of 16. Or the responses could be averaged to retain the original 1 to 3 range.
Ratio Level of Measurement
A ratio level of measurement represents fixed measuring units and an absolute zero point. Zero, in this situation, means absolutely no amount of whatever the variable indicates. On a ratio scale, 10 is 2 points higher than 8 and is also 2 times as great as 5. Ratio numbers can be added and subtracted, and because the numbers begin at an absolute zero point, they can be multiplied and divided (so ratios can be formed between the numbers). For example, people’s ages can be represented by values ranging from 0 years (or some fraction of a year) to 120 or more. A person who is 30 years old is 15 years older than someone who is 15 years old (30 – 15 = 15) and is also twice as old as that person (30/15 = 2). Of course, the numbers also are mutually exclusive and exhaustive, so that every case can be assigned one and only one value. Age (in years) is clearly a ratio-level measure.
Exhibit 4.6 displays an example of a variable measured at the ratio level. The number of people in the first group is 5, and the number in the second group is 7. The ratio of the two groups’ sizes is then 1.4, a number that mirrors the relationship between the sizes of the groups. Note that there does not actually have to be any group with a size of 0; what is important is that the numbering scheme begins at an absolute zero—in this case, the absence of any people.
Copyright ©2020 by SAGE Publications, Inc. This work may not be reproduced or distributed in any form or by any means without express written permission of the publisher.
Do not
copy
, pos
t, or d
istrib
ute
Part I Foundations of Research80
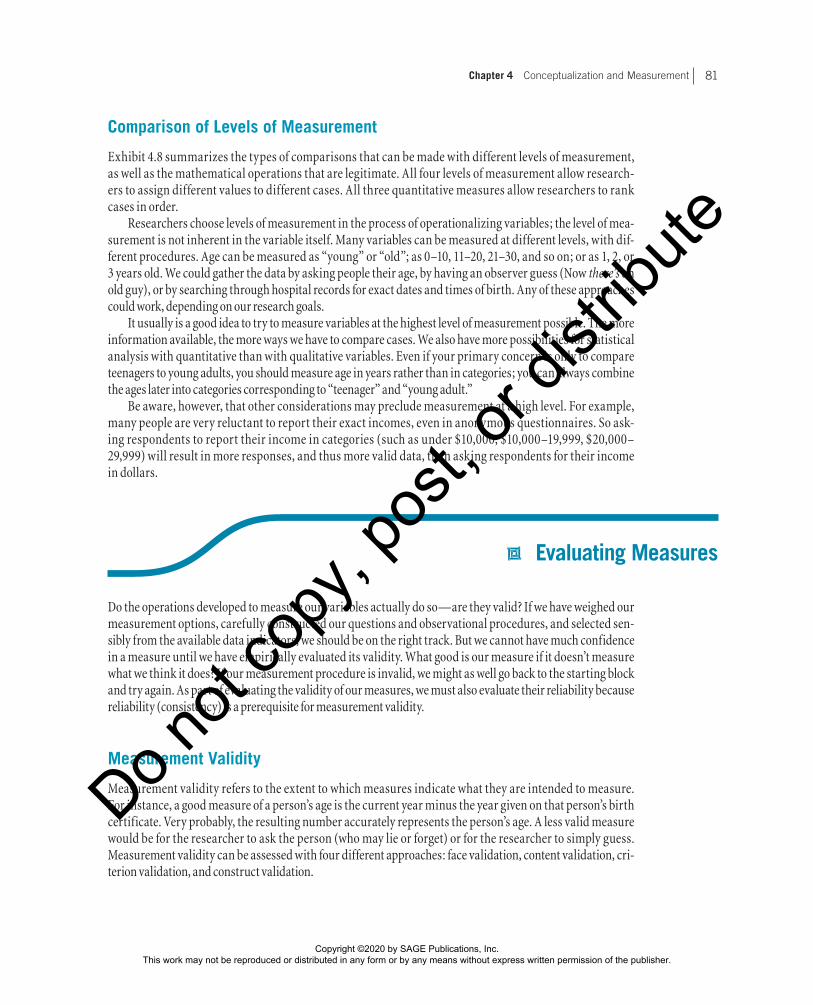
Exhibit 4.8 Properties of Measurement Levels
Examples of Comparison Statements
Appropriate Math
Operations
Relevant Level of Measurement
Nominal Ordinal Interval Ratio
A is equal to (not equal to) B
= (≠)
A is greater than (less than) B
> (<)
A is three more than (less than) B
+ (−)
A is twice (half) as large as B
× (÷)
Source: Schutt (2009).
Exhibit 4.7 Example of Interval-Level Measures: Core Alcohol and Drug Survey
26. How do you think your close friends feel (or would feel) about you... (mark one for each line)
a. Trying marijuana once or twice . . . . . . . . . . . . .b. Smoking marijuana occasionally . . . . . . . . . . . .c. Smoking marijuana regularly . . . . . . . . . . . . . . .d. Trying cocaine once or twice . . . . . . . . . . . . . . .e. Taking cocaine regularly . . . . . . . . . . . . . . . . . . f. Trying LSD once or twice . . . . . . . . . . . . . . . . . .g. Taking LSD regularly . . . . . . . . . . . . . . . . . . . . .h. Trying amphetamines once or twice . . . . . . . . .i. Taking amphetamines regularly . . . . . . . . . . . . .j. Taking one or two drinks of an alcoholic beverage (beer, wine, liquor) nearly every day . . . . . . . . . . . . . . . . . . .k. Taking four or five drinks nearly every day . . . .l. Having five or more drinks in one sitting . . . . . .m. Taking steroids for body building or improved athletic performance . . . . . . . . . . . . . .
Disapprove
Strongly
disapprove
Don't disapprove
Source: Core Institute (1994, p. 3).
Note: Responses could be combined to create an interval scale (see text).
Copyright ©2020 by SAGE Publications, Inc. This work may not be reproduced or distributed in any form or by any means without express written permission of the publisher.
Do not
copy
, pos
t, or d
istrib
ute
Chapter 4 Conceptualization and Measurement 81
Comparison of Levels of Measurement
Exhibit 4.8 summarizes the types of comparisons that can be made with different levels of measurement, as well as the mathematical operations that are legitimate. All four levels of measurement allow research-ers to assign different values to different cases. All three quantitative measures allow researchers to rank cases in order.
Researchers choose levels of measurement in the process of operationalizing variables; the level of mea-surement is not inherent in the variable itself. Many variables can be measured at different levels, with dif-ferent procedures. Age can be measured as “young” or “old”; as 0–10, 11–20, 21–30, and so on; or as 1, 2, or 3 years old. We could gather the data by asking people their age, by having an observer guess (Now there’s an old guy), or by searching through hospital records for exact dates and times of birth. Any of these approaches could work, depending on our research goals.
It usually is a good idea to try to measure variables at the highest level of measurement possible. The more information available, the more ways we have to compare cases. We also have more possibilities for statistical analysis with quantitative than with qualitative variables. Even if your primary concern is only to compare teenagers to young adults, you should measure age in years rather than in categories; you can always combine the ages later into categories corresponding to “teenager” and “young adult.”
Be aware, however, that other considerations may preclude measurement at a high level. For example, many people are very reluctant to report their exact incomes, even in anonymous questionnaires. So ask-ing respondents to report their income in categories (such as under $10,000, $10,000–19,999, $20,000–29,999) will result in more responses, and thus more valid data, than asking respondents for their income in dollars.
22 Evaluating Measures
Do the operations developed to measure our variables actually do so—are they valid? If we have weighed our measurement options, carefully constructed our questions and observational procedures, and selected sen-sibly from the available data indicators, we should be on the right track. But we cannot have much confidence in a measure until we have empirically evaluated its validity. What good is our measure if it doesn’t measure what we think it does? If our measurement procedure is invalid, we might as well go back to the starting block and try again. As part of evaluating the validity of our measures, we must also evaluate their reliability because reliability (consistency) is a prerequisite for measurement validity.
Measurement Validity
Measurement validity refers to the extent to which measures indicate what they are intended to measure. For instance, a good measure of a person’s age is the current year minus the year given on that person’s birth certificate. Very probably, the resulting number accurately represents the person’s age. A less valid measure would be for the researcher to ask the person (who may lie or forget) or for the researcher to simply guess. Measurement validity can be assessed with four different approaches: face validation, content validation, cri-terion validation, and construct validation.
Copyright ©2020 by SAGE Publications, Inc. This work may not be reproduced or distributed in any form or by any means without express written permission of the publisher.
Do not
copy
, pos
t, or d
istrib
ute
Part I Foundations of Research82
Face Validity
Researchers apply the term face validity to the confidence gained from careful inspection of a concept to see if it is appropriate “on its face.” More precisely, we can say that a measure is face valid if it obviously pertains to the meaning of the concept being measured more than to other concepts (Brewer & Hunter, 1989, p. 131). For example, a count of the number of drinks people had consumed in the past week would be a face-valid measure of their alcohol consumption.
Although every measure should be inspected in this way, face validation in itself does not provide convinc-ing evidence of measurement validity. The question “How much beer or wine did you have to drink last week?” looks valid on its face as a measure of frequency of drinking, but people who drink heavily tend to underreport the amount they drink. So the question would be an invalid measure, at least in a study of heavy drinkers.
Content Validity
Content validity establishes that the measure covers the full range of the concept’s meaning. To determine that range of meaning, the researcher may solicit the opinions of experts and review literature that identifies the different aspects, or dimensions, of the concept.
Criterion Validity
Criterion validity is established when the scores obtained on one measure can be accurately compared to those obtained with a more direct or already validated measure of the same phenomenon (the “criterion”). A measure of blood alcohol concentration, for instance, could be the criterion for validating a self-report mea-sure of drinking. In other words, if Jason says he hasn’t been drinking, we establish criterion validity by giving him a “breathalyzer” test. Observations of drinking by friends or relatives could also, in some limited circum-stances, serve as a criterion for validating a self-report.
The criterion that researchers select can be measured either at the same time as the variable to be validated or after that time. Concurrent validity exists when a measure yields scores that are closely related to scores on a criterion measured at the same time. A store might validate a test of sales ability by administering it to sales personnel who are already employed and then comparing their test scores to their sales performance. Or a measure of walking speed based on mental counting might be validated concurrently with a stopwatch. With predictive validity, a measure is validated by predicting scores on a criterion measured in the future—for instance, SAT scores are validated when they predict a student’s college grades.
Criterion validation greatly increases our confidence that a measure works, but for many concepts of inter-est to educational researchers, it’s difficult to find a criterion. If we are measuring subjective states, such as feelings of loneliness, what direct indicator could serve as a criterion? How do you know he or she is lonely? Even with variables for which a reasonable criterion exists, the researcher may not be able to gain access to the criterion—as would be the case with a tax return or employer document that we might wish we could use as a criterion for self-reported income.
Construct Validity
Measurement validity can also be established by showing that a measure is related to a variety of other mea-sures as specified in a theory. This validation approach, known as construct validity, is commonly used in social and educational research when no clear criterion exists for validation purposes. For example, in one study of the validity of the Addiction Severity Index (ASI), A. Thomas McLellan and his associates (1985) com-pared subject scores on the ASI to a number of indicators that they felt, from prior research, should be related to substance abuse: medical problems, employment problems, legal problems, family problems, and psychiatric
Copyright ©2020 by SAGE Publications, Inc. This work may not be reproduced or distributed in any form or by any means without express written permission of the publisher.
Do not
copy
, pos
t, or d
istrib
ute
Chapter 4 Conceptualization and Measurement 83
problems. They could not use a criterion validation approach because they did not have a more direct measure of abuse, such as laboratory test scores or observer reports. However, their extensive research on the subject had given them confidence that these sorts of problems were all related to substance abuse, and, indeed, they found that individuals with higher ASI ratings tended to have more problems in each of these areas.
Two other approaches to construct validation are convergent validation and discriminant valida-tion. Convergent validity is achieved when one measure of a concept is associated with different types of measures of the same concept (this relies on the same type of logic as measurement triangulation). Discriminant validity is a complementary approach to construct validation. In this approach, scores on the measure to be validated are compared to scores on measures of different but related concepts. Discriminant validity is achieved if the measure to be validated is not associated strongly with the mea-sures of different concepts.
The distinction between criterion validation and construct validation is not always clear. Opinions can differ about whether a particular indicator is indeed a criterion for the concept that is to be measured. What both construct validation and criterion validation have in common is the comparison of scores on one mea-sure to scores on other measures that are predicted to be related. It is not so important that researchers agree that a particular comparison measure is a criterion rather than a related construct. But it is very important to think critically about the quality of the comparison measure and whether it actually represents a differ-ent view of the same phenomenon. For example, correspondence between scores on two different self-report measures of alcohol use is a much weaker indicator of measurement validity than the correspondence of a self-report measure with an observer-based measure of substance use.
Reliability
Reliability means that a measurement procedure yields consistent scores (or that the scores change only to reflect actual changes in the phenomenon). If a measure is reliable, it is affected less by random error, or chance variation, than if it is unreliable. Reliability is a prerequisite for measurement validity: We cannot really measure a phenomenon if the measure we are using gives inconsistent results. Let’s say, for example, that you would like to know your weight and have decided on two different measures: the scale in the bath-room and your best friend’s estimate. Clearly, the scale is more reliable, in the sense that it will show pretty much the same thing from one day to the next unless your weight actually changes. But your best friend may say, “You’re so skinny!” on Sunday, but on Monday, when he or she is in a bad mood, say “You look terrible! Have you gained weight?” Your friend’s estimates may bounce around quite a bit. The bathroom scale is not so fickle; it is reliable.
This doesn’t mean that the weight given by the scale is valid—in fact, if the scale is spring-operated and old, it might be off by quite a few pounds. But it will be off by the same amount every day—hence not valid but reliable nevertheless.
There are four possible indications of unreliability. For example, a test of your knowledge of research methods would be unreliable if every time you took it, you received a different score even though your knowl-edge of research methods had not changed in the interim, not even as a result of taking the test more than once. This is test-retest reliability. Similarly, an index composed of questions to measure knowledge of research methods would be unreliable if respondents’ answers to each question were totally independent of their answers to the others. The index has interitem reliability if the component items are closely related. A measure also would be unreliable if slightly different versions of it resulted in markedly different responses (it would not achieve alternate-forms reliability). Finally, an assessment of the level of at-riskness in a group of students would be unreliable if ratings of the level of at-riskness by two observers were not related to each other (it would then lack interobserver reliability).
Copyright ©2020 by SAGE Publications, Inc. This work may not be reproduced or distributed in any form or by any means without express written permission of the publisher.
Do not
copy
, pos
t, or d
istrib
ute
Part I Foundations of Research84
Test-Retest Reliability
When researchers measure an unchanging phenomenon at two different times, the degree to which the two mea-surements are related to each other is the test-retest reliability of the measure. If you take a test of your math ability and then retake the test 2 months later, the test is reliable if you receive a similar score both times—presuming that your math ability stayed constant. Of course, if events between the test and the retest have changed the variable being measured, then the difference between the test and retest scores should reflect that change.
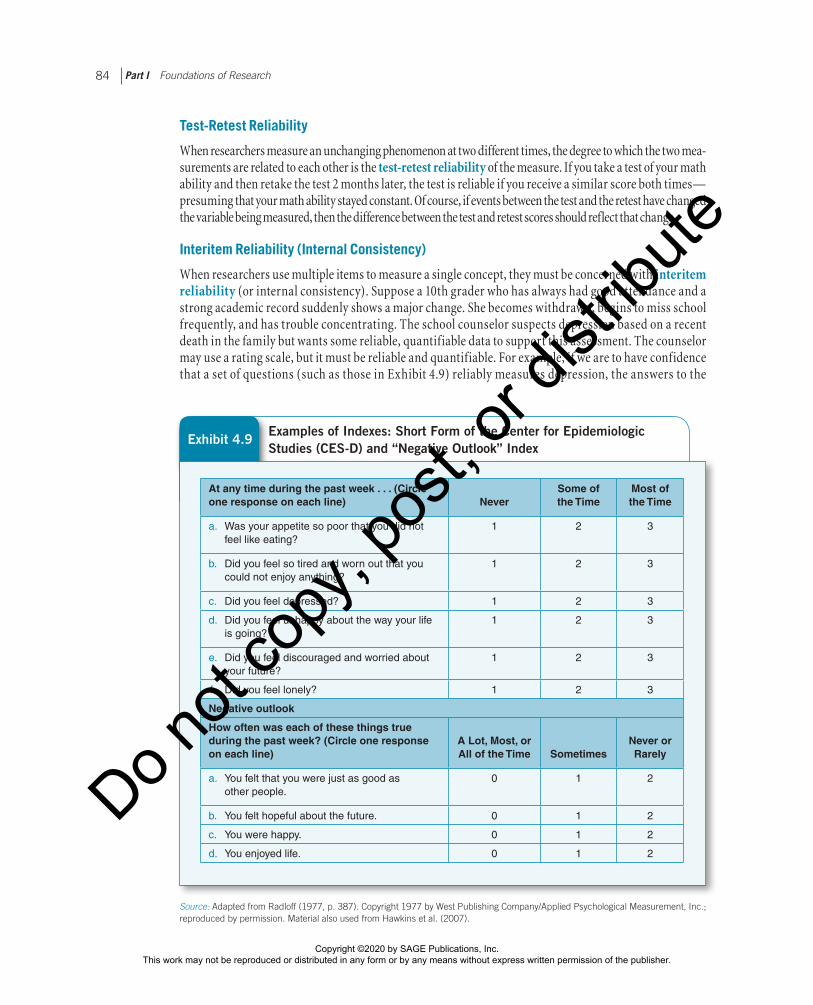
Interitem Reliability (Internal Consistency)
When researchers use multiple items to measure a single concept, they must be concerned with interitem reliability (or internal consistency). Suppose a 10th grader who has always had good attendance and a strong academic record suddenly shows a major change. She becomes withdrawn, begins to miss school frequently, and has trouble concentrating. The school counselor suspects depression based on a recent death in the family but wants some reliable, quantifiable data to support this assessment. The counselor may use a rating scale, but it must be reliable and quantifiable. For example, if we are to have confidence that a set of questions (such as those in Exhibit 4.9) reliably measures depression, the answers to the
Source: Adapted from Radloff (1977, p. 387). Copyright 1977 by West Publishing Company/Applied Psychological Measurement, Inc.; reproduced by permission. Material also used from Hawkins et al. (2007).
Exhibit 4.9Examples of Indexes: Short Form of the Center for Epidemiologic Studies (CES-D) and “Negative Outlook” Index
At any time during the past week . . . (Circle one response on each line)
Never
Some of the Time
Most of the Time
a. Was your appetite so poor that you did not feel like eating?
1 2 3
b. Did you feel so tired and worn out that you could not enjoy anything?
1 2 3
c. Did you feel depressed? 1 2 3
d. Did you feel unhappy about the way your life is going?
1 2 3
e. Did you feel discouraged and worried about your future?
1 2 3
f. Did you feel lonely? 1 2 3
Negative outlook
How often was each of these things true during the past week? (Circle one response on each line)
A Lot, Most, or All of the Time
Sometimes
Never or Rarely
a. You felt that you were just as good as other people.
0 1 2
b. You felt hopeful about the future. 0 1 2
c. You were happy. 0 1 2
d. You enjoyed life. 0 1 2
Copyright ©2020 by SAGE Publications, Inc. This work may not be reproduced or distributed in any form or by any means without express written permission of the publisher.
Do not
copy
, pos
t, or d
istrib
ute
Chapter 4 Conceptualization and Measurement 85
questions should be highly associated with one another. The stronger the association is among the indi-vidual items and the more items that are included, the higher the reliability of the index will be.
Alternate-Forms Reliability
When researchers compare subjects’ answers to slightly different versions of survey questions, they are test-ing alternate-forms reliability (Litwin, 1995, pp. 13–21). A researcher may reverse the order of the response choices in an index or modify the question wording in minor ways and then readminister that index to sub-jects. If the two sets of responses are not too different, alternate-forms reliability is established.
A related test of reliability is the split-halves reliability approach. A survey sample is divided in two by flipping a coin or using some other random assignment method. These two halves of the sample are then administered the two forms of the questions. If the responses of the two halves of the sample are about the same, the measure’s reliability is established.
Interobserver Reliability
When researchers use more than one observer to rate the same people, events, or places, interobserver reli-ability is their goal. If observers are using the same instrument to rate the same thing, their ratings should be very similar. If they are similar, we can have much more confidence that the ratings reflect the phenomenon being assessed rather than the orientations of the observers.
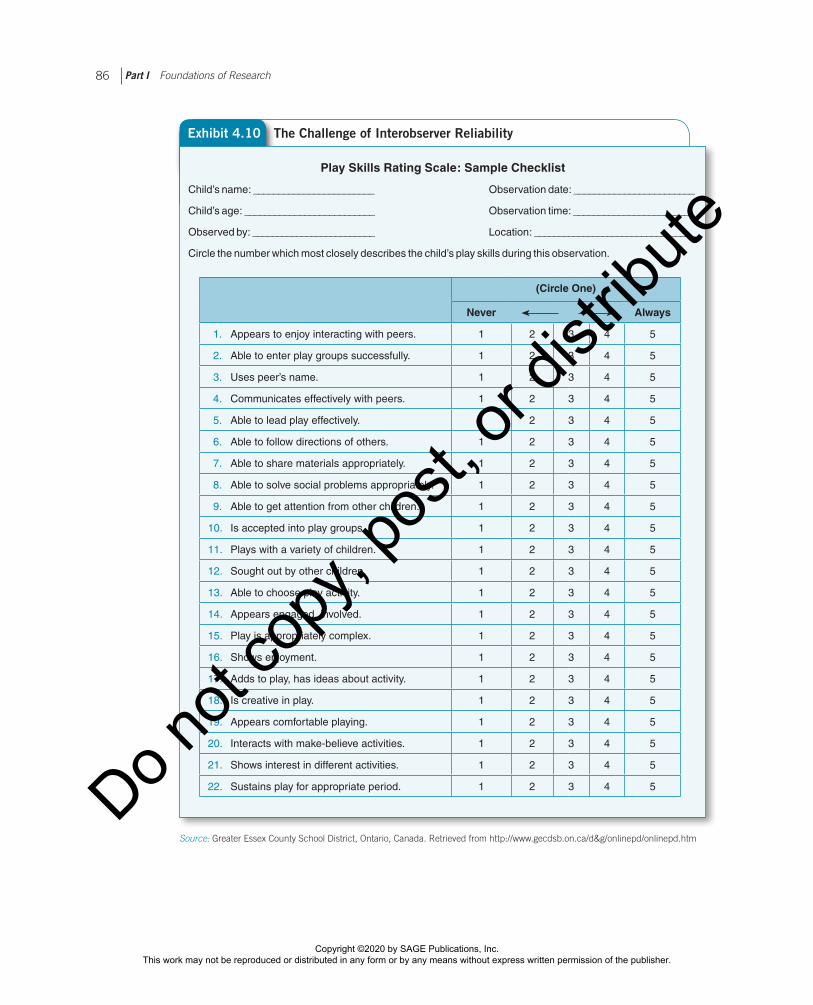
Assessing interobserver reliability is most important when the rating task is complex. Consider the observation-of-play scale shown in Exhibit 4.10. The rating task seems straightforward, with clear descriptions of the sub-ject characteristics that are supposed to lead to high or low scores. However, the judgments that the rater must make while using this scale are complex. They are affected by a wide range of subject characteristics, attitudes, and behaviors as well as by the rater’s reactions. As a result, interobserver agreement can be low on complex scales, unless the raters are trained carefully.
22 Can We Achieve Both Reliability and Validity?
The reliability and validity of measures in any study must be tested after the fact to assess the quality of the information obtained. But then, if it turns out that a measure cannot be considered reliable and valid, little can be done to save the study. Hence, it is supremely important to select, in the first place, measures that are likely to be reliable and valid.
Finding methods that are both reliable and valid can be challenging. Don’t just choose the first measure you find or can think of: Consider the different strengths of different measures and their appropriateness to your study. Conduct a pretest in which you use the measure with a small sample, and check its reliability. Provide careful training to ensure a consistent approach if interviewers or observers will administer the measures. In most cases, however, the best strategy is to use measures that have been used before and whose reliability and validity have been established in other contexts. But the selection of “tried-and-true” measures still does not absolve researchers from the responsibility of testing the reliability and validity of the measure in their own studies.
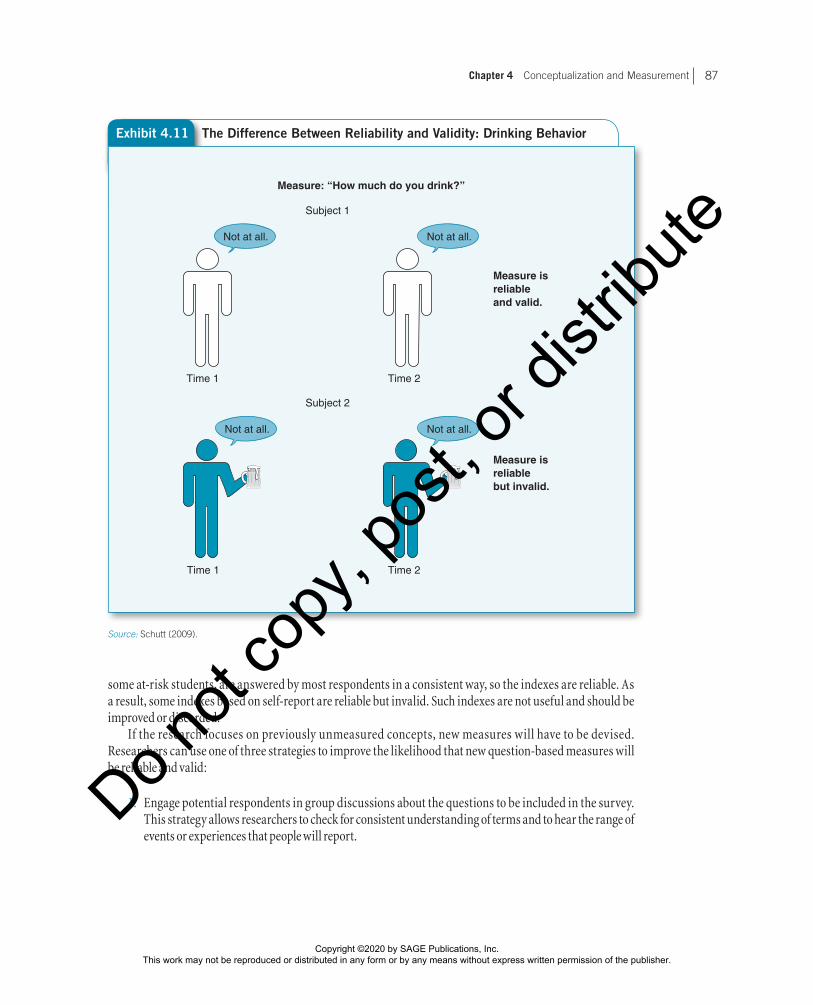
Remember that a reliable measure is not necessarily a valid measure, as Exhibit 4.11 illustrates. This dis-crepancy is a common flaw of self-report measures of substance abuse. People’s answers to the questions are consistent, but they are consistently misleading. A number of respondents will not admit to drinking, even though they drink a lot. The multiple questions in self-report indexes of substance abuse, a crucial issue for
Copyright ©2020 by SAGE Publications, Inc. This work may not be reproduced or distributed in any form or by any means without express written permission of the publisher.
Do not
copy
, pos
t, or d
istrib
ute
Part I Foundations of Research86
Source: Greater Essex County School District, Ontario, Canada. Retrieved from http://www.gecdsb.on.ca/d&g/onlinepd/onlinepd.htm
Exhibit 4.10 The Challenge of Interobserver Reliability
Play Skills Rating Scale: Sample Checklist
Child’s name: ________________________ Observation date: ________________________
Child’s age: __________________________ Observation time: ________________________
Observed by: _________________________ Location: _________________________________
Circle the number which most closely describes the child’s play skills during this observation.
(Circle One)
Never Always
1. Appears to enjoy interacting with peers. 1 2 3 4 5
2. Able to enter play groups successfully. 1 2 3 4 5
3. Uses peer’s name. 1 2 3 4 5
4. Communicates effectively with peers. 1 2 3 4 5
5. Able to lead play effectively. 1 2 3 4 5
6. Able to follow directions of others. 1 2 3 4 5
7. Able to share materials appropriately. 1 2 3 4 5
8. Able to solve social problems appropriately. 1 2 3 4 5
9. Able to get attention from other children. 1 2 3 4 5
10. Is accepted into play groups. 1 2 3 4 5
11. Plays with a variety of children. 1 2 3 4 5
12. Sought out by other children. 1 2 3 4 5
13. Able to choose play activity. 1 2 3 4 5
14. Appears engaged, involved. 1 2 3 4 5
15. Play is appropriately complex. 1 2 3 4 5
16. Shows enjoyment. 1 2 3 4 5
17. Adds to play, has ideas about activity. 1 2 3 4 5
18. Is creative in play. 1 2 3 4 5
19. Appears comfortable playing. 1 2 3 4 5
20. Interacts with make-believe activities. 1 2 3 4 5
21. Shows interest in different activities. 1 2 3 4 5
22. Sustains play for appropriate period. 1 2 3 4 5
Copyright ©2020 by SAGE Publications, Inc. This work may not be reproduced or distributed in any form or by any means without express written permission of the publisher.
Do not
copy
, pos
t, or d
istrib
ute
Chapter 4 Conceptualization and Measurement 87
Exhibit 4.11 The Difference Between Reliability and Validity: Drinking Behavior
Subject 1
Time 1
Time 2
Subject 2
Time 1
Time 2
Measure isreliableand valid.
Measure isreliablebut invalid.
Not at all. Not at all.
Not at all. Not at all.
Measure: “How much do you drink?”
Source: Schutt (2009).
some at-risk students, are answered by most respondents in a consistent way, so the indexes are reliable. As a result, some indexes based on self-report are reliable but invalid. Such indexes are not useful and should be improved or discarded.
If the research focuses on previously unmeasured concepts, new measures will have to be devised. Researchers can use one of three strategies to improve the likelihood that new question-based measures will be reliable and valid:
1. Engage potential respondents in group discussions about the questions to be included in the survey. This strategy allows researchers to check for consistent understanding of terms and to hear the range of events or experiences that people will report.
Copyright ©2020 by SAGE Publications, Inc. This work may not be reproduced or distributed in any form or by any means without express written permission of the publisher.
Do not
copy
, pos
t, or d
istrib
ute
Part I Foundations of Research88
2. Conduct cognitive interviews. Ask people a test question, then probe with follow-up questions about how they understood the question and what their answer meant.
3. Record, using either audio or video, test interviews during the pretest phase of a survey. The research-ers then review these recordings and systematically code them to identify problems in question word-ing or delivery (Fowler, 1995, pp. 104–129).
In these ways, qualitative methods help to improve the validity of the fixed-response questions used in quantitative surveys.
22 Conclusions
We began this chapter by asking, “What do we mean by ‘at risk’?” The three conceptualizations of “at-riskness” introduced demonstrated the importance of defining the concepts we use. Definition often requires subconcepts, and we examined several definitions of “poverty,” a concept in its own right but also a subconcept in definitions of at-riskness. The methods for defining poverty led us to the issue of opera-tionalization, “the process of specifying the operations that will indicate the value of cases on a variable.” Operationalization is the necessary link between conceptualization and measurement. Only when we know how a concept or subconcept is operationalized can we begin figuring out a valid way to measure it. Remember always that measurement validity is a necessary foundation for educational research. Gather-ing data without careful conceptualization or conscientious efforts to operationalize key concepts often is a wasted effort.
The difficulties of achieving valid measurement vary with the concept being operationalized and the cir-cumstances of the particular study. The examples in this chapter of difficulties in achieving valid measures of at-risk behavior and associated concepts and subconcepts (poverty, social status, drug and alcohol abuse, depression) should sensitize you to the need for caution.
Planning ahead is the key to achieving valid measurement in your own research; careful evaluation is the key to sound decisions about the validity of measures in others’ research. Statistical tests can help to determine whether a given measure is valid after data have been collected, but if it appears after the fact that a measure is invalid, little can be done to correct the situation. If you cannot tell how key concepts were operationalized when you read a research report, don’t trust the findings. And if a researcher does not indicate the results of tests used to establish the reliability and validity of key measures, remain skeptical.
Key Terms
Closed-ended (fixed-choice) question 74
Conceptualization 65Constant 72Construct validity 82Content validity 82Convergent validity 83
Criterion validity 82Face validity 82Idiosyncratic errors 89Index 79Interitem reliability 84Interobserver reliability 85Interval level of measurement 79
Level of measurement 77Measurement 72Mutually exclusive 75Nominal level of measurement 77Open-ended question 75Operation 72Operationalization 70
Copyright ©2020 by SAGE Publications, Inc. This work may not be reproduced or distributed in any form or by any means without express written permission of the publisher.
Do not
copy
, pos
t, or d
istrib
ute
Chapter 4 Conceptualization and Measurement 89
Ordinal level of measurement 79Ratio level of measurement 79Reliability 83
Split-halves reliability 85Test-retest reliability 84
Triangulation 77Unobtrusive measure 76
Highlights
•• Conceptualization plays a critical role in research. In deductive research, conceptualization guides the operationalization of specific variables; in inductive research, it guides efforts to make sense of related observations.
•• Concepts may refer to either constant or variable phenomena. Concepts that refer to variable phenomena may be very similar to the actual variables used in a study, or they may be much more abstract.
•• Concepts are operationalized in research by one or more indicators, or measures, which may derive from observation, self-report, available records or statistics, books and other writ-ten documents, clinical indicators, discarded materials, or some combination of these.
•• Indexes and scales measure a concept by combining answers to several questions and thus reducing idiosyncratic error variation. Several issues should be explored with every intended index: Does each question actually measure the same concept? Does combining items in an index obscure important relation-ships between individual questions and other variables? Is the index multidimensional?
•• If differential weighting is used in the calculation of index scores, then we say that it is a scale.
•• Level of measurement indicates the type of information obtained about a variable and the type of statistics that can be used to describe its variation. The four levels of measurement can be ordered by complexity of the mathematical operations they permit: nominal (least complex), ordinal, interval, and ratio (most complex). The measurement level of a variable is deter-mined by how the variable is operationalized.
•• The validity of measures should always be tested. There are four basic approaches: face validation, content validation, criterion validation (either predictive or concurrent), and construct validation. Criterion validation provides the strongest evidence of measurement validity, but there often is no criterion to use in validating social science measures.
•• Measurement reliability is a prerequisite for measurement validity, although reliable measures are not necessarily valid. Reliability can be assessed through a test-retest procedure, in terms of interitem consistency, through a comparison of responses to alternate forms of the test, or in terms of consis-tency among observers.
Student Study Site
To assist in completing the web exercises, please access the study site at www.sagepub.com/check, where you will find the web exercise with accompanying links. You’ll find other useful study
materials such as self-quizzes and e-flashcards for each chapter, along with a group of carefully selected articles from research journals that illustrate the major concepts and techniques.
Discussion Questions
1. If you were given a questionnaire right now that asked you about your use of alcohol and illicit drugs in the past year, would you answer truthfully and disclose details fully? How do you think others would respond? What if the question-naire were anonymous? What if there was a confidential ID number on the questionnaire so that the researcher could keep track of who responded?
2. Are important concepts in educational research always defined clearly? Are they defined consistently? Search the literature for four to six educational research articles that focus on “at-riskness,” “poverty,” or some other concept suggested by your instructor. Is the concept defined clearly in each article? How similar are the definitions?
Copyright ©2020 by SAGE Publications, Inc. This work may not be reproduced or distributed in any form or by any means without express written permission of the publisher.
Do not
copy
, pos
t, or d
istrib
ute
Part I Foundations of Research90
Practice Exercises
1. Now it’s time to try your hand at operationalization with survey-based measures. Formulate a few fixed-choice ques-tions to measure variables pertaining to one or more of the concepts in this chapter, such as what factors place students at risk, how poverty should be defined, or what effects drug or alcohol abuse has on school attendance and performance. Arrange to interview one or two other students with the questions you have developed. Ask one fixed-choice ques-tion at a time, record your interviewee’s answer, and then probe for additional comments and clarifications. Your goal is to discover what respondents take to be the meaning of the concept you used in the question and what additional issues shape their response to it.
When you have f inished the interviews, analyze your experience: Did the interviewees interpret the fixed-choice
questions and response choices as you intended? Did you learn more about the concepts you were working on? Should your conceptual definition be refined? Should the ques-tions be rewritten, or would more fixed-choice questions be necessary to capture adequately the variation among respondents?
2. Now try index construction. You might begin with some of the questions you wrote for Practice Exercise 1. Try to write about four or five fixed-choice questions that each measures the same concept. Write each question so it has the same response choices. Now conduct a literature search to iden-tify an index that another researcher used to measure your concept or a similar concept. Compare your index to the published index. Which seems preferable to you? Why?
Web Exercises
1. What are some of the research questions you could attempt to answer with available statistical data? Visit your library and ask for an introduction to the government documents collec-tion. Inspect the U.S. Census Bureau website (http://www.census.gov) and find the population figures broken down by city and state. List five questions you could explore with such data. Identify four variables implied by these research ques-tions that you could operationalize with the available data.
2. Using ERIC, Google Scholar, and Google, find at least three reports or scholarly articles on the Web that you could use to educate a school faculty about the effects of poverty on stu-dent learning. Write a brief summary for the faculty based on these sources. Start with the website of the National Pov-erty Center at the University of Michigan: http://www.npc .umich.edu/.
Developing a Research Proposal
At this point, you can begin the processes of conceptualization and operationalization. You’ll need to assume that your pri-mary research method will be conducting a survey.
1. List at least 10 variables that will be measured in your research. No more than two of these should be sociode-mographic indicators such as race or age. The inclusion of each variable should be justified in terms of theory or prior research that suggests it would be an appropriate independent or dependent variable or will have some relation to either of these.s
2. Write a conceptual definition for each variable. When-ever possible, this definition should come from the existing
literature—either a book you have read for a course or the research literature that you have been searching. Ask two class members for feedback on your definitions.
3. Develop measurement procedures for each variable. Several measures should be single questions and indexes that were used in prior research (search the Web and the journal literature in ERIC, JSTOR, Google Scholar, or some other database of scholarly articles). Make up a few ques-tions and one index yourself. Ask classmates to answer these questions and give you feedback on their clarity.
4. Propose tests of reliability and validity for four of the measures.
Copyright ©2020 by SAGE Publications, Inc. This work may not be reproduced or distributed in any form or by any means without express written permission of the publisher.
Do not
copy
, pos
t, or d
istrib
ute
Related Documents