Chapter 4 Results and Discussion The purpose of computing is insight, not numbers. Richard W. Hamming In this chapter we discuss the results obtained by the proposed CBIR system. The results obtained are compared with the existing methods in terms of precision, time and space complexities. The results obtained by the Haar wavelet, multiresolution with the statistical feature method and wavelet based orthogonal polynomial are presented the proceeding sections. 4.1 Haar Wavelet Based Image Feature In order to implement the proposed framework CBIR system, the image database discussed in the previous chapter is considered. The Haar wavelet method decomposes the image into a pyramid like multiresolution structure is discussed in section 2.3 of Chapter 2. Subsequently, the proposed system determines the optimum level of the pyramid structure which is presented in section 2.2.2. The features such as spectrum of energy, and spatial relationship between the pixels extracted using the expression in Eqs. (2.3.3) and (2.3.4). Based on these features, a feature vector space is constructed. The Bhattacharyya distance method and orthogonal based Cosine distance method are employed to find the distance between the query and the target images, and then obtained distance values are arranged in ascending order, which is discussed in section 2.3.3. The empirical distance values between the query image and target image in the

Welcome message from author
This document is posted to help you gain knowledge. Please leave a comment to let me know what you think about it! Share it to your friends and learn new things together.
Transcript
� �Chapter 4
Results and Discussion
The purpose of computing is insight, not numbers.
Richard W. Hamming
In this chapter we discuss the results obtained by the proposed CBIR
system. The results obtained are compared with the existing methods in
terms of precision, time and space complexities. The results obtained by the
Haar wavelet, multiresolution with the statistical feature method and
wavelet based orthogonal polynomial are presented the proceeding sections.
4.1 Haar Wavelet Based Image Feature
In order to implement the proposed framework CBIR system, the image
database discussed in the previous chapter is considered. The Haar wavelet
method decomposes the image into a pyramid like multiresolution structure
is discussed in section 2.3 of Chapter 2. Subsequently, the proposed
system determines the optimum level of the pyramid structure which is
presented in section 2.2.2. The features such as spectrum of energy, and
spatial relationship between the pixels extracted using the expression in
Eqs. (2.3.3) and (2.3.4). Based on these features, a feature vector space is
constructed. The Bhattacharyya distance method and orthogonal based
Cosine distance method are employed to find the distance between the
query and the target images, and then obtained distance values are
arranged in ascending order, which is discussed in section 2.3.3. The
empirical distance values between the query image and target image in the
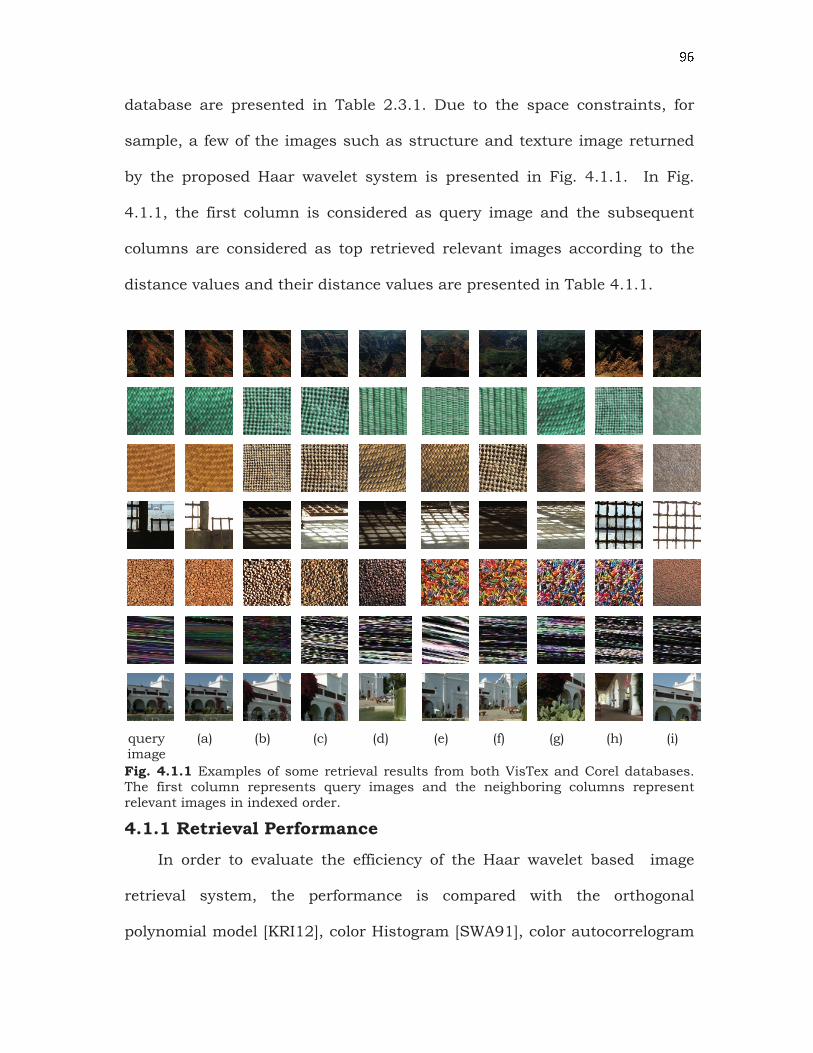
� �database are presented in Table 2.3.1. Due to the space constraints, for
sample, a few of the images such as structure and texture image returned
by the proposed Haar wavelet system is presented in Fig. 4.1.1. In Fig.
4.1.1, the first column is considered as query image and the subsequent
columns are considered as top retrieved relevant images according to the
distance values and their distance values are presented in Table 4.1.1.
query image
(a) (b) (c) (d) (e) (f) (g) (h) (i)
Fig. 4.1.1 Examples of some retrieval results from both VisTex and Corel databases. The first column represents query images and the neighboring columns represent relevant images in indexed order.
4.1.1 Retrieval Performance
In order to evaluate the efficiency of the Haar wavelet based image
retrieval system, the performance is compared with the orthogonal
polynomial model [KRI12], color Histogram [SWA91], color autocorrelogram
� �[HUA97], Wavelet moment[SMI94], BDIP+BVLC [YOU08] and CSD [MAN02].
Of the above mentioned methods, the orthogonal polynomial model extracts
41 texture features, and the color Histogram, color autocorrelogram, and
CSD models extract 128 features, while the Wavelet method and
BDIP+BVLC method extract as low as 96 features, and Multiresolution with
BDIP+BVLC extract 92 features. But the proposed method extracts only 12
features such as mean vector, and variance and covariance matrix. The
mean vector represents a spectrum of the energy of each color and
covariance represents the relationship among the color pixels. A
comparative study is performed between the proposed system and the
existing systems, and the obtained results are tabulated in Table 4.1.2. The
proposed method requires only 192 bits to store a vector feature, which is
less when compared to that of the existing systems. The obtained results
are presented in Table 4.1.3.
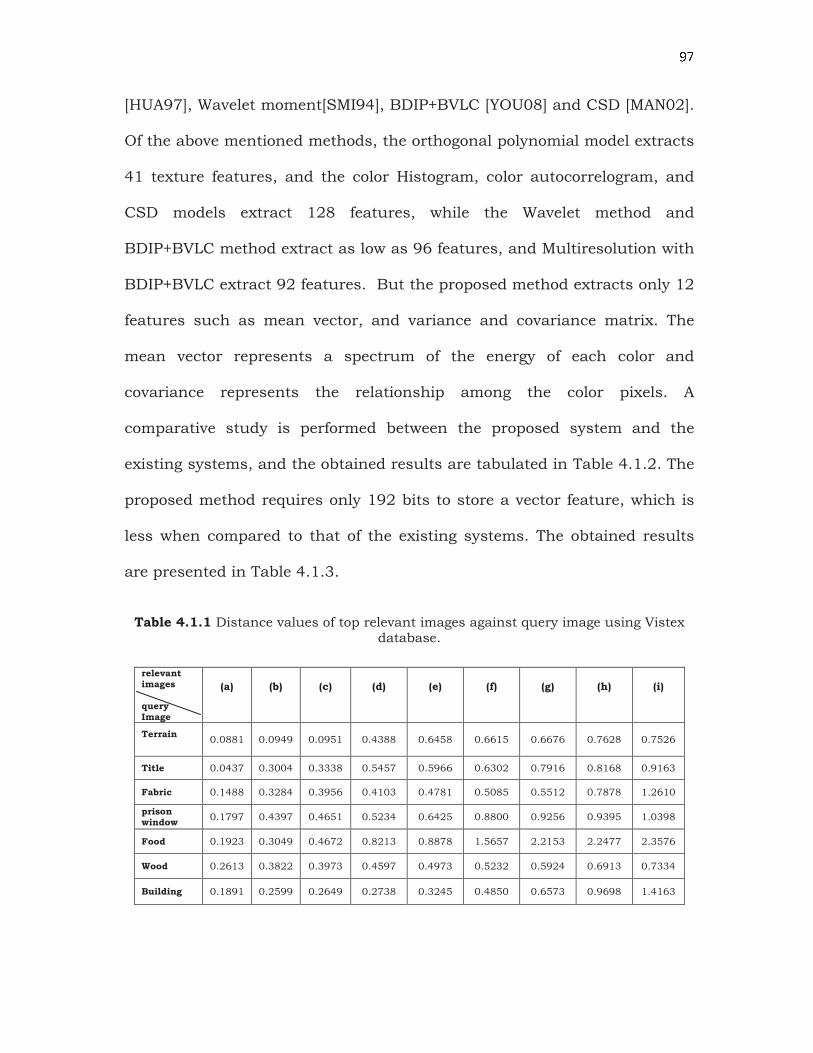
Table 4.1.1 Distance values of top relevant images against query image using Vistex database.
relevant images query Image
(a)
(b)
(c)
(d)
(e)
(f)
(g)
(h)
(i)
Terrain
0.0881 0.0949 0.0951 0.4388 0.6458 0.6615 0.6676 0.7628 0.7526
Title 0.0437 0.3004 0.3338 0.5457 0.5966 0.6302 0.7916 0.8168 0.9163
Fabric 0.1488 0.3284 0.3956 0.4103 0.4781 0.5085 0.5512 0.7878 1.2610
prison window
0.1797 0.4397 0.4651 0.5234 0.6425 0.8800 0.9256 0.9395 1.0398
Food 0.1923 0.3049 0.4672 0.8213 0.8878 1.5657 2.2153 2.2477 2.3576
Wood 0.2613 0.3822 0.3973 0.4597 0.4973 0.5232 0.5924 0.6913 0.7334
Building 0.1891 0.2599 0.2649 0.2738 0.3245 0.4850 0.6573 0.9698 1.4163

� �Table 4.1.2 Feature vector dimension and its space of the retrieval methods
Table 4.1.3 Target Feature Vector Dimension of the Retrieval Methods
Specification
Methods Color space
Dimension Remarks
Color Histogram RGB 128 number of quantization
levels: 8 in R,4 in G,4 in B
Color
autocorrelogram
HSV 128 number of quantization
levels: 8 in R,4 in G,4 in B
Wavelet
moment
RGB 96 number of decomposition levels: 8
BDIP-BVLC RGB 96 -
Multi-resolution with BDIP+BVLC
HSV 92(60+32) number of decomposition levels: 2
CSD
HMMD 128 -
Orthogonal polynomial mode
- 41 number of decomposition
levels: 3
Proposed method(Image pyramid)
RGB 12 number of decomposition
levels: 5
Methods
Target feature vector size in bits
Remarks
Color Histogram 1024 number of quantization level: 8 in R, 4 in G, 4 in B. number of features: 128
Wavelet moment 768 number of decomposition levels: 8; number of features: 96
Multi-resolution with BDIP+BVLC
736 decomposition level 2; number features: 92
Orthogonal polynomial mode
328 decomposition level 3 features:41
The proposed method
192 optimum level:5; number features:12
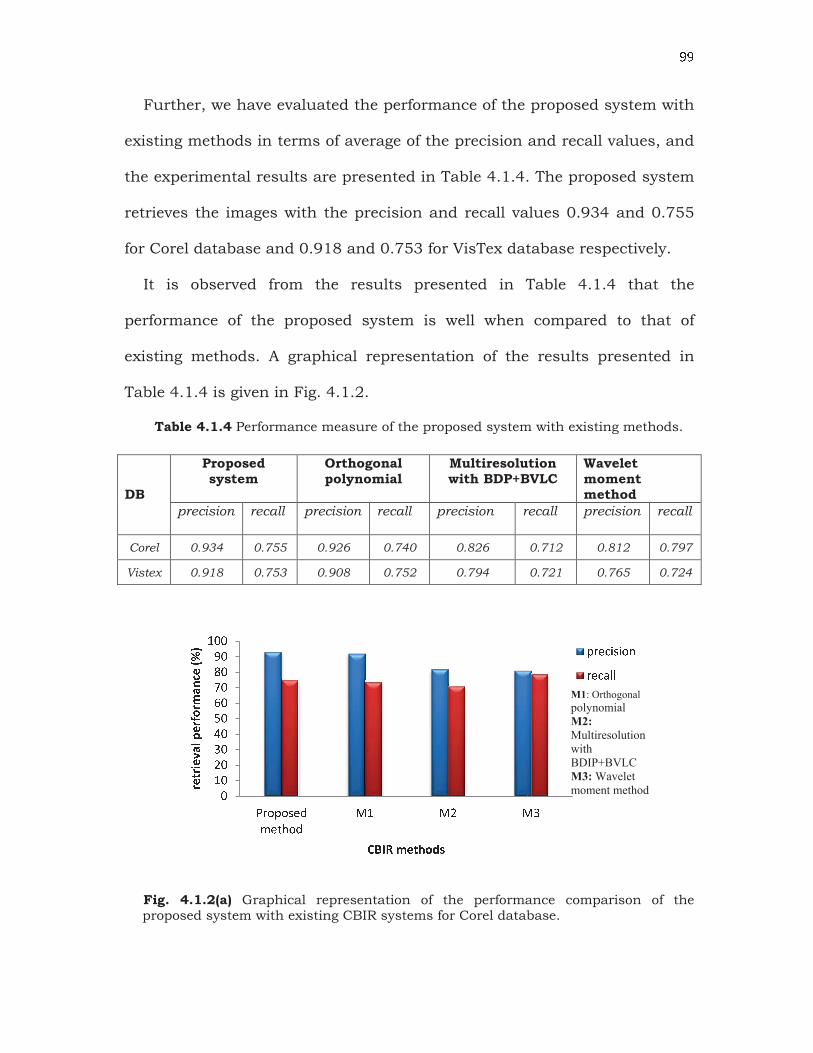
� �Further, we have evaluated the performance of the proposed system with
existing methods in terms of average of the precision and recall values, and
the experimental results are presented in Table 4.1.4. The proposed system
retrieves the images with the precision and recall values 0.934 and 0.755
for Corel database and 0.918 and 0.753 for VisTex database respectively.
It is observed from the results presented in Table 4.1.4 that the
performance of the proposed system is well when compared to that of
existing methods. A graphical representation of the results presented in
Table 4.1.4 is given in Fig. 4.1.2.
Table 4.1.4 Performance measure of the proposed system with existing methods.
DB
Proposed system
Orthogonal polynomial
Multiresolution with BDP+BVLC
Wavelet moment method
precision recall precision recall precision recall precision recall
Corel 0.934 0.755 0.926 0.740 0.826 0.712 0.812 0.797
Vistex 0.918 0.753 0.908 0.752 0.794 0.721 0.765 0.724
Fig. 4.1.2(a) Graphical representation of the performance comparison of the proposed system with existing CBIR systems for Corel database.
�� �� �� � � �� �� � �� �� � �� � � � � � � �� � � � � � � � � � � ���� �� ��� !��" #�$�%&�'()
* + , - . / 0 1 2 3 4� � � 5 6 � 6 � 7� � 5 8 9 9
M1: Orthogonal
polynomial
M2:
Multiresolution
with
BDIP+BVLC
M3: Wavelet
moment method
: ; ;
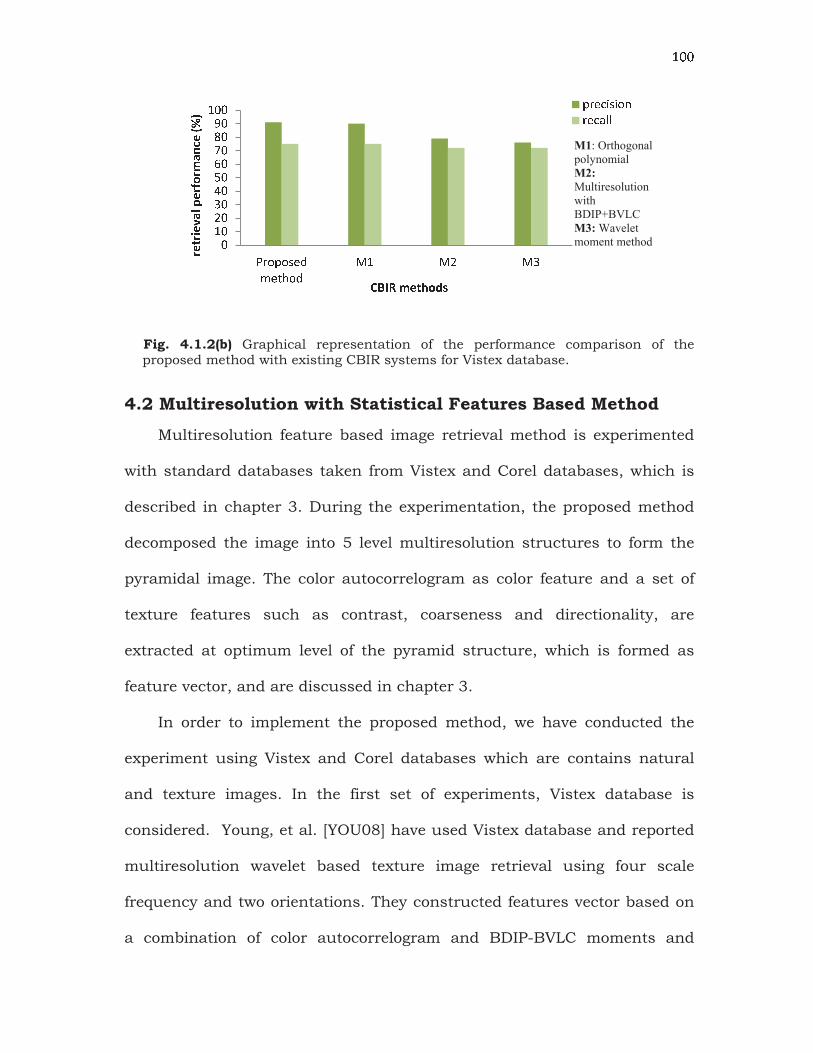
Fig. 4.1.2(b) Graphical representation of the performance comparison of the proposed method with existing CBIR systems for Vistex database.
4.2 Multiresolution with Statistical Features Based Method
Multiresolution feature based image retrieval method is experimented
with standard databases taken from Vistex and Corel databases, which is
described in chapter 3. During the experimentation, the proposed method
decomposed the image into 5 level multiresolution structures to form the
pyramidal image. The color autocorrelogram as color feature and a set of
texture features such as contrast, coarseness and directionality, are
extracted at optimum level of the pyramid structure, which is formed as
feature vector, and are discussed in chapter 3.
In order to implement the proposed method, we have conducted the
experiment using Vistex and Corel databases which are contains natural
and texture images. In the first set of experiments, Vistex database is
considered. Young, et al. [YOU08] have used Vistex database and reported
multiresolution wavelet based texture image retrieval using four scale
frequency and two orientations. They constructed features vector based on
a combination of color autocorrelogram and BDIP-BVLC moments and
�� �� �� � � �� �� � �� �� � �� � � � � � � �� � � � � � � � � � � ���� �� ��� !��" #�$�%&�'()
* + , - . / 0 1 2 3 4� � � 5 6 � 6 � 7� � 5 8 9 9
M1: Orthogonal
polynomial
M2:
Multiresolution
with
BDIP+BVLC
M3: Wavelet
moment method
: ; :Minkowski-form distance method is used to find the distance between
query and target images. As a result, the dimension of the color and texture
feature vector size is 92. Kavitha, et al., [KAV11] have also used VisTex
database to propose a texture image retrieval method based on color and
texture features. They have divided the images into sub-blocks of equal
sizes and then the color features are extracted using color histogram and
texture features using GLCM in each sub-block to form the feature vector.
The results of the proposed method are compared with the above said
methods and the results are tabulated in Table 4.2.1.
In the second set of experiments, Corel database is used.
Krishnamoorthy, et al. [KRI12] have used Corel database and have
proposed multiresolution approach for rotation invariant texture image
retrieval, based on orthogonal polynomial model. The orthogonal polynomial
model coefficients are reordered into a multiresolution subband like
structures. Simple statistical and perceptual properties are derived from
each subband of 3-level multiresolution structure to represent the texture
features which is turned as feature vectors. In this experiment, the results
of the proposed method are compared with the methods proposed by
Krishnamoorthy, et al. [KRI12] and Kavitha, et al. [KAV11]. Former method
describes the directional features are combined with mean, standard
deviation, energy and perceptual property at all decomposition levels for
computing the average recognition rate. But the method proposed in this
thesis characterizes both color and texture feature at optimum level only,
and has a short span of feature vectors. Since the proposed system reduces
: ; <time and space complexities, it increases the retrieval recognition rate when
compared to the orthogonal polynomial model [KRI12]. The method
proposed in [KAV11], characterize both color and texture feature in order to
combine the feature vector space, and partition the image into 6 equal parts
and characterize color feature using color histogram and texture features
described in terms of GLCM. The result of the normalized feature vector size
is 74, whereas the proposed method yields 67 features at optimum level to
form the feature vector and also gives a better retrieval performance. In
addition, our method may be considered for online image retrieval and
medical image retrieval oriented applications, since online image retrieval
requires compact feature vector dimension and less computation overhead.
4.2.1 Retrieval Performance
The retrieval performance of the proposed method is evaluated based
on the precision and recall methods. We obtain the average of the precision
and recall values with 0.940 and 0.759 for Vistex database, and 0.921 and
0.762 for Corel database respectively, and the result obtained are compared
with other existing methods, which are presented in Table 4.2.1. A
graphical representation of the results presented in Table 4.2.1 is given in
Fig. 4.2.1.
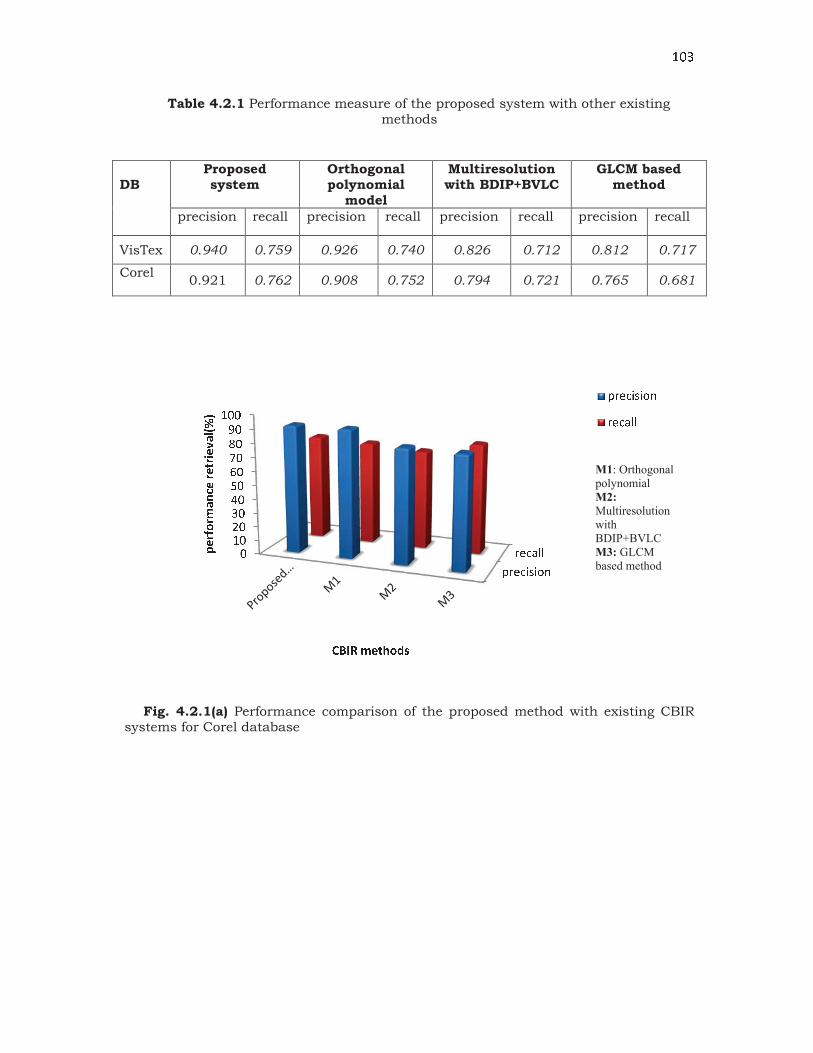
: ; =Table 4.2.1 Performance measure of the proposed system with other existing
methods
DB
Proposed system
Orthogonal polynomial
model
Multiresolution with BDIP+BVLC
GLCM based method
precision recall precision recall precision recall precision recall
VisTex 0.940 0.759 0.926 0.740 0.826 0.712 0.812 0.717
Corel
0.921 0.762 0.908 0.752 0.794 0.721 0.765 0.681
Fig. 4.2.1(a) Performance comparison of the proposed method with existing CBIR systems for Corel database
� � � 5 6 � 6 � 7� � 5 8 9 9�� �� �� � � �� �� � �� �� � �!��" #�$�%&���� �� ��� '()
* + , - . / 0 1 2 3 4
� � � 5 6 � 6 � 7� � 5 8 9 9M1: Orthogonal
polynomial
M2:
Multiresolution
with
BDIP+BVLC
M3: GLCM
based method
: ; >
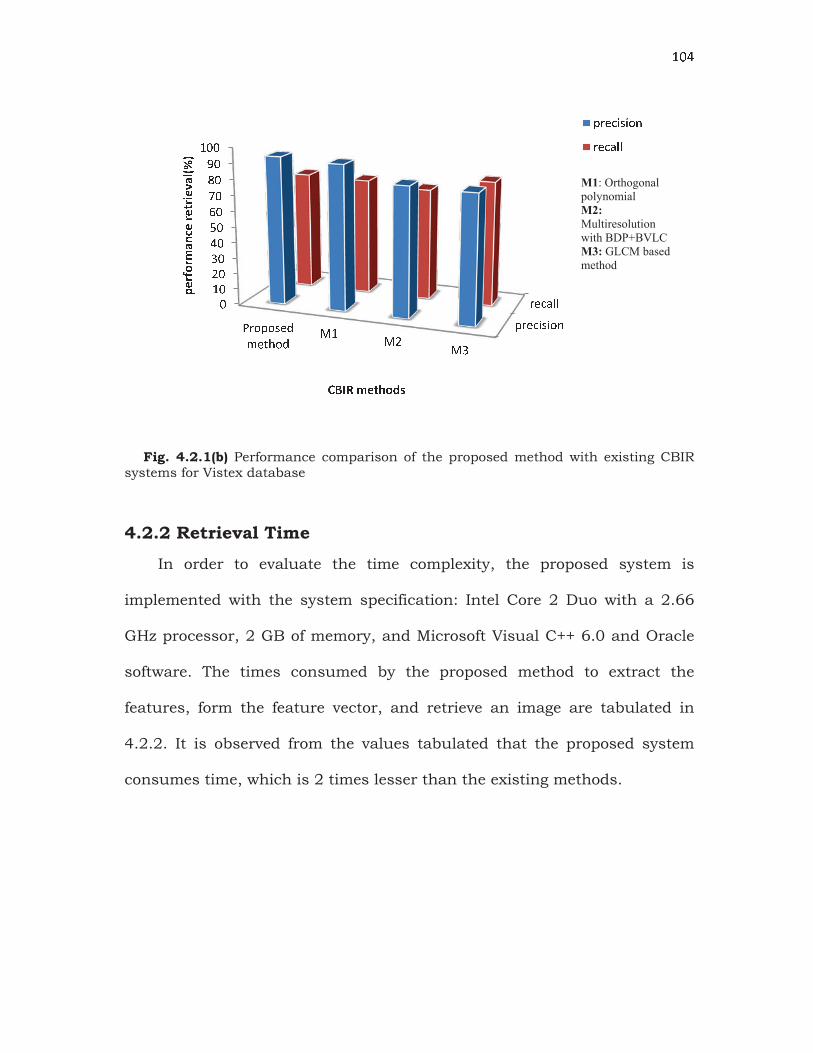
Fig. 4.2.1(b) Performance comparison of the proposed method with existing CBIR systems for Vistex database
4.2.2 Retrieval Time
In order to evaluate the time complexity, the proposed system is
implemented with the system specification: Intel Core 2 Duo with a 2.66
GHz processor, 2 GB of memory, and Microsoft Visual C++ 6.0 and Oracle
software. The times consumed by the proposed method to extract the
features, form the feature vector, and retrieve an image are tabulated in
4.2.2. It is observed from the values tabulated that the proposed system
consumes time, which is 2 times lesser than the existing methods.
� � � 5 6 � 6 � 7� � 5 8 9 9�� �� �� � � �� �� � �� �� � �� � � � � � � �� � � � � � � � � � � �!��" #�$�%&���� �� ��� '()
* + , - . / 0 1 2 3 4
� � � 5 6 � 6 � 7� � 5 8 9 9M1: Orthogonal
polynomial
M2:
Multiresolution
with BDP+BVLC
M3: GLCM based
method
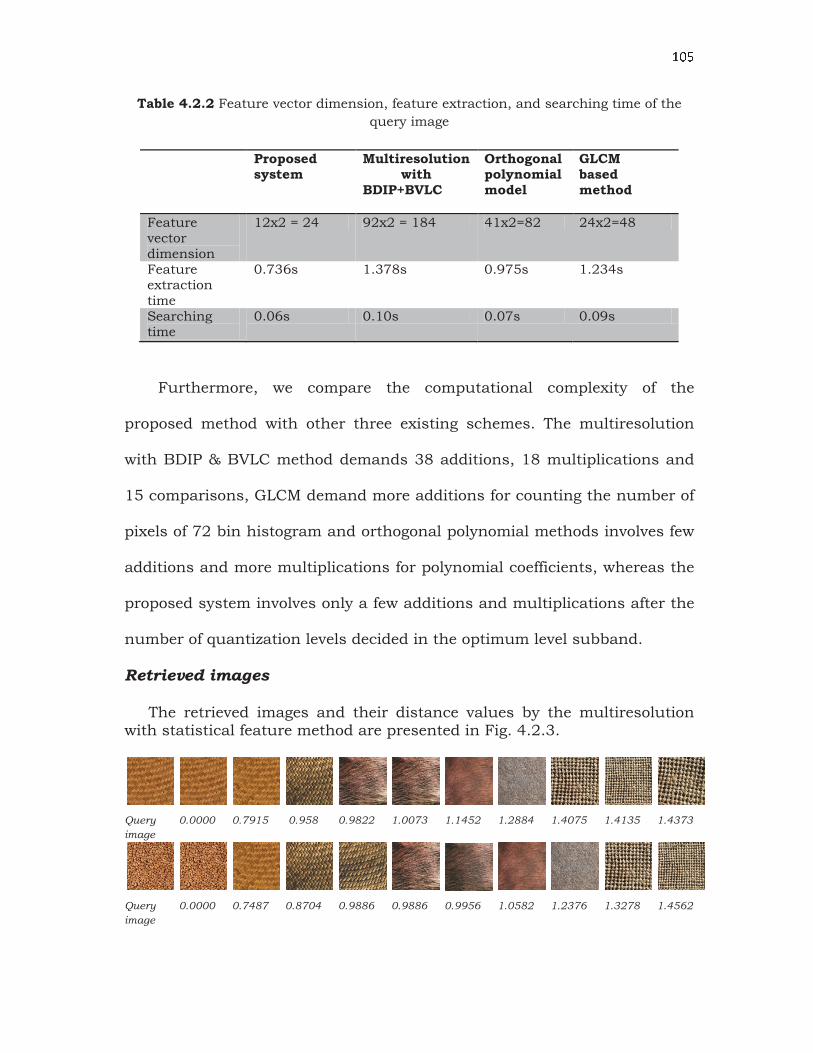
: ; �Table 4.2.2 Feature vector dimension, feature extraction, and searching time of the
query image
Proposed system
Multiresolution with
BDIP+BVLC
Orthogonal polynomial model
GLCM based method
Feature vector dimension
12x2 = 24 92x2 = 184 41x2=82 24x2=48
Feature extraction time
0.736s 1.378s 0.975s 1.234s
Searching time
0.06s 0.10s 0.07s 0.09s
Furthermore, we compare the computational complexity of the
proposed method with other three existing schemes. The multiresolution
with BDIP & BVLC method demands 38 additions, 18 multiplications and
15 comparisons, GLCM demand more additions for counting the number of
pixels of 72 bin histogram and orthogonal polynomial methods involves few
additions and more multiplications for polynomial coefficients, whereas the
proposed system involves only a few additions and multiplications after the
number of quantization levels decided in the optimum level subband.
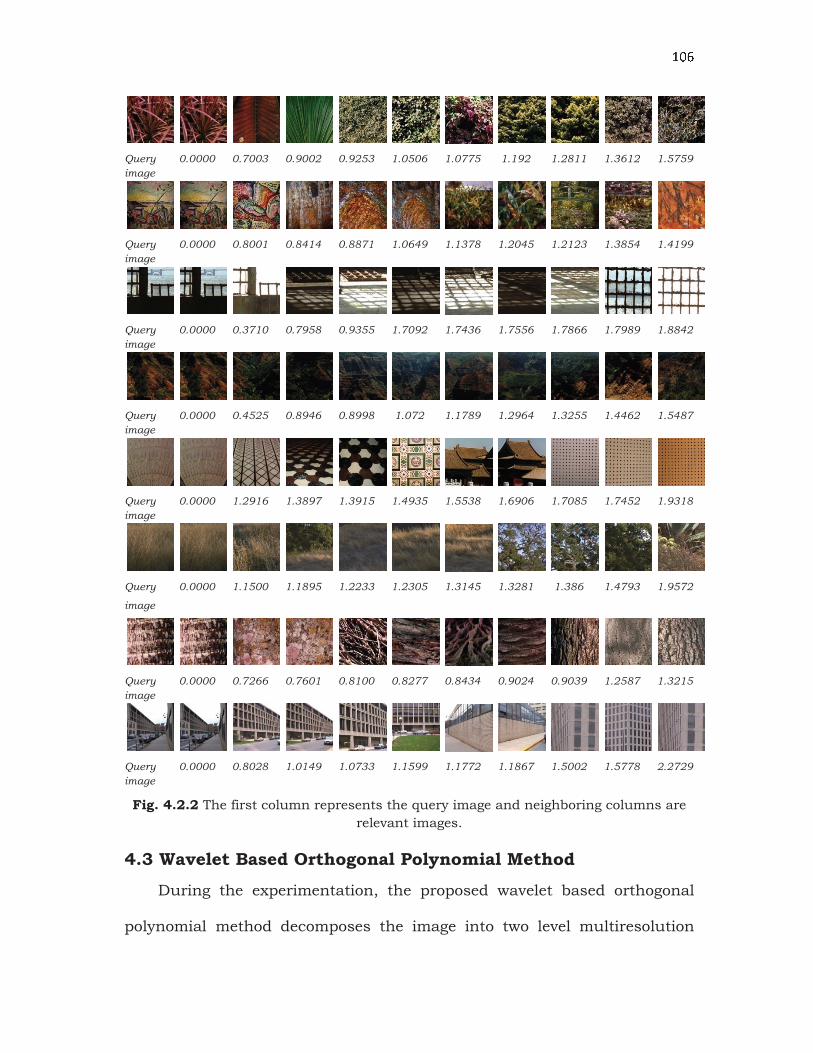
Retrieved images
The retrieved images and their distance values by the multiresolution with statistical feature method are presented in Fig. 4.2.3.
Query
image
0.0000 0.7915 0.958 0.9822 1.0073 1.1452 1.2884 1.4075 1.4135 1.4373
Query
image
0.0000 0.7487 0.8704 0.9886 0.9886 0.9956 1.0582 1.2376 1.3278 1.4562
: ; �Query
image
0.0000 0.7003 0.9002 0.9253 1.0506 1.0775 1.192 1.2811 1.3612 1.5759
Query
image
0.0000 0.8001 0.8414 0.8871 1.0649 1.1378 1.2045 1.2123 1.3854 1.4199
Query
image
0.0000 0.3710 0.7958 0.9355 1.7092 1.7436 1.7556 1.7866 1.7989 1.8842
Query
image
0.0000 0.4525 0.8946 0.8998 1.072 1.1789 1.2964 1.3255 1.4462 1.5487
Query
image
0.0000 1.2916 1.3897 1.3915 1.4935 1.5538 1.6906 1.7085 1.7452 1.9318
Query
image
0.0000 1.1500 1.1895 1.2233 1.2305 1.3145 1.3281 1.386 1.4793 1.9572
Query
image
0.0000 0.7266 0.7601 0.8100 0.8277 0.8434 0.9024 0.9039 1.2587 1.3215
Query
image
0.0000 0.8028 1.0149 1.0733 1.1599 1.1772 1.1867 1.5002 1.5778 2.2729
Fig. 4.2.2 The first column represents the query image and neighboring columns are
relevant images.
4.3 Wavelet Based Orthogonal Polynomial Method
During the experimentation, the proposed wavelet based orthogonal
polynomial method decomposes the image into two level multiresolution
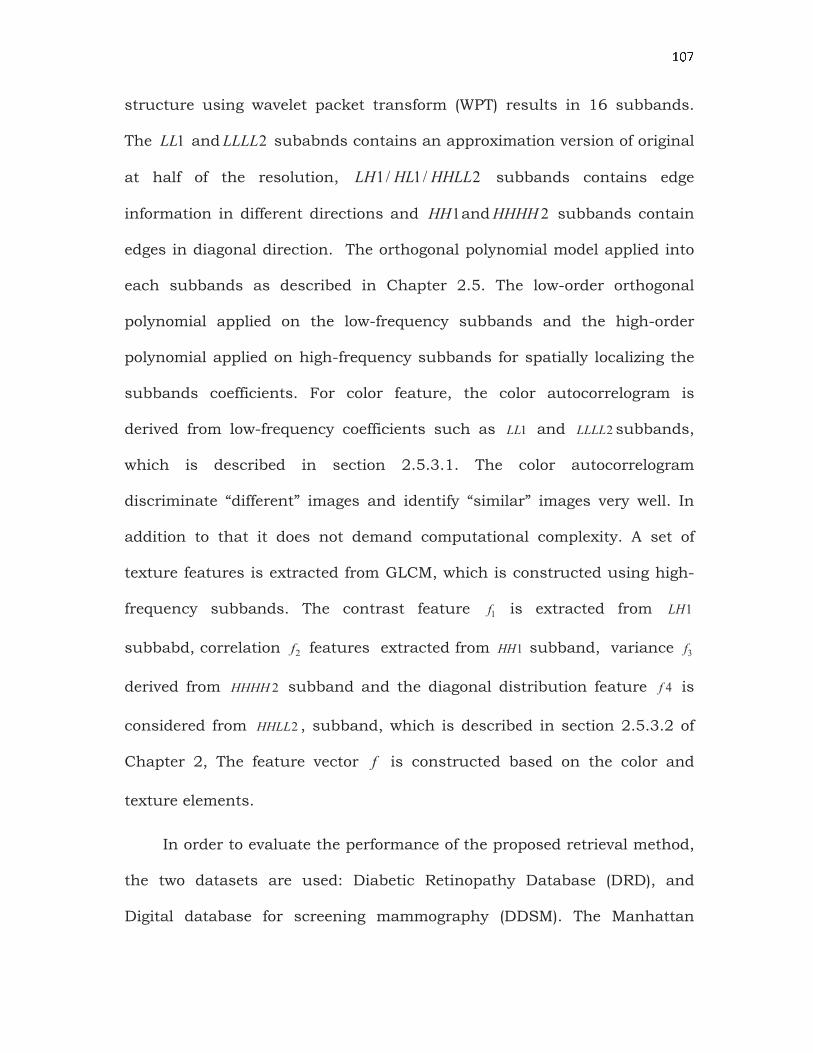
: ; �structure using wavelet packet transform (WPT) results in 16 subbands.
The 1LL and 2LLLL subabnds contains an approximation version of original
at half of the resolution, 1/ 1/ 2LH HL HHLL subbands contains edge
information in different directions and 1HH and 2HHHH subbands contain
edges in diagonal direction. The orthogonal polynomial model applied into
each subbands as described in Chapter 2.5. The low-order orthogonal
polynomial applied on the low-frequency subbands and the high-order
polynomial applied on high-frequency subbands for spatially localizing the
subbands coefficients. For color feature, the color autocorrelogram is
derived from low-frequency coefficients such as 1LL and 2LLLL subbands,
which is described in section 2.5.3.1. The color autocorrelogram
discriminate “different” images and identify “similar” images very well. In
addition to that it does not demand computational complexity. A set of
texture features is extracted from GLCM, which is constructed using high-
frequency subbands. The contrast feature 1f is extracted from 1LH
subbabd, correlation 2f features extracted from 1HH subband, variance 3f
derived from 2HHHH subband and the diagonal distribution feature 4f is
considered from 2HHLL , subband, which is described in section 2.5.3.2 of
Chapter 2, The feature vector f is constructed based on the color and
texture elements.
In order to evaluate the performance of the proposed retrieval method,
the two datasets are used: Diabetic Retinopathy Database (DRD), and
Digital database for screening mammography (DDSM). The Manhattan
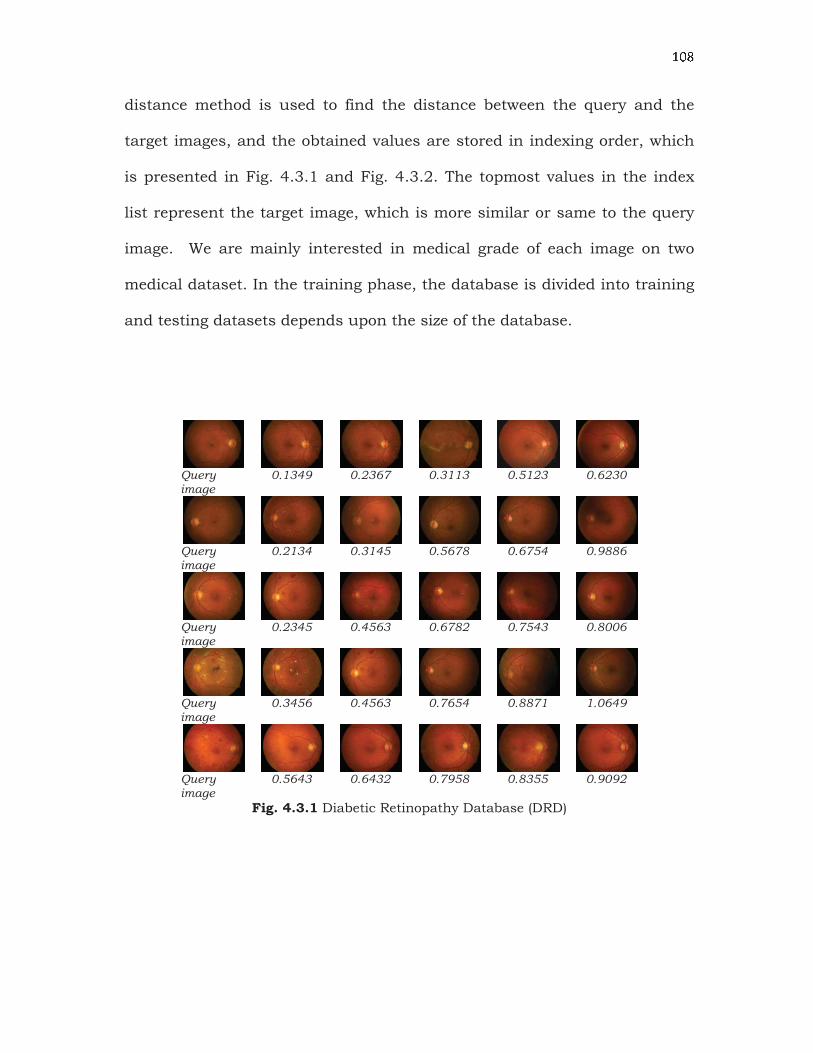
? @ Adistance method is used to find the distance between the query and the
target images, and the obtained values are stored in indexing order, which
is presented in Fig. 4.3.1 and Fig. 4.3.2. The topmost values in the index
list represent the target image, which is more similar or same to the query
image. We are mainly interested in medical grade of each image on two
medical dataset. In the training phase, the database is divided into training
and testing datasets depends upon the size of the database.
Query image
0.1349 0.2367 0.3113 0.5123 0.6230
Query image
0.2134 0.3145 0.5678 0.6754 0.9886
Query image
0.2345 0.4563 0.6782 0.7543 0.8006
Query image
0.3456 0.4563 0.7654 0.8871 1.0649
Query image
0.5643 0.6432 0.7958 0.8355 0.9092
Fig. 4.3.1 Diabetic Retinopathy Database (DRD)
? @ B
Query image
0.3421 0.4321 0.5643 0.7651 1.0073
Query image
0.1432 0.2341 0.8704 0.9886 0.9886
Query image
0.2314 0.7433 0.8012 0.9253 1.0506
Query image
0.3421 0.4531 0.8414 0.9871 1.0649
Query image
0.5431 0.5467 0.7958 0.8761 1.1510
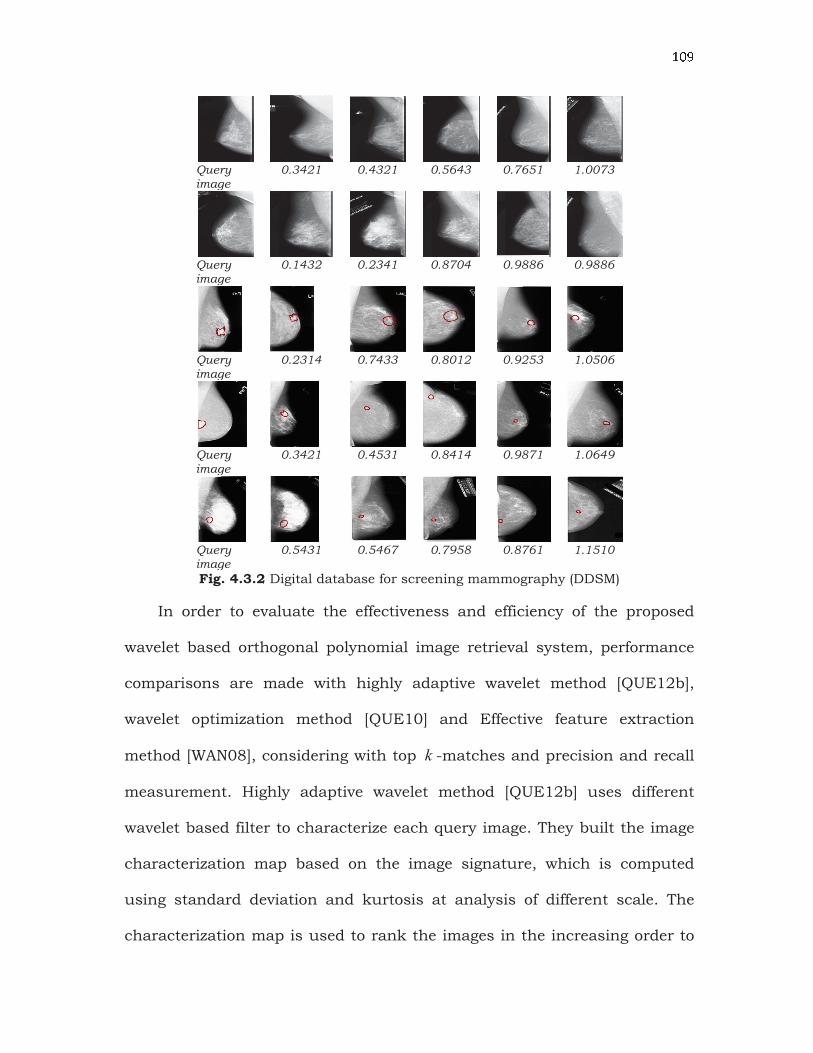
Fig. 4.3.2 Digital database for screening mammography (DDSM)
In order to evaluate the effectiveness and efficiency of the proposed
wavelet based orthogonal polynomial image retrieval system, performance
comparisons are made with highly adaptive wavelet method [QUE12b],
wavelet optimization method [QUE10] and Effective feature extraction
method [WAN08], considering with top k -matches and precision and recall
measurement. Highly adaptive wavelet method [QUE12b] uses different
wavelet based filter to characterize each query image. They built the image
characterization map based on the image signature, which is computed
using standard deviation and kurtosis at analysis of different scale. The
characterization map is used to rank the images in the increasing order to
? ? @query image. Wavelet optimization method [QUE10] uses two kinds of
generic wavelet based image signature to characterize each subband of the
decomposed image. The wavelet transform with the lifting scheme
framework is used to decompose the image. A distance method is applied to
compute the distance between the two image signatures in order to obtain
relevant images from the image database. Wan Ahmad et al. proposed a
technique [WAN08] for CBIR are identified by comparing different
techniques with various features. They used Gabor and Discrete wavelet
transforms for texture feature extraction, Hu moment invariants and
Fourier descriptor for shape feature, and gray-level histogram and gray-
level coherence vector for intensity. The standalone and combined feature
vectors are generated using feature extraction techniques with CT brain
image data set. These vectors are stored in separate feature vector
databases. Distance metric is used to compute similarity between the
query image and feature vectors of database image. They have reported that
the Discrete Wavelet Frame (DWF) yields good results for texture images;
Gray Level Histogram (GLH) method obtains better results for the Gray-level
images; Fourier Descriptor (FD) method yields good results for shape
feature. The combination of DWF + FD produces remarkable results for
medical images.
The existing methods are considered with different modalities to
capture the relevant image. For fair comparison, we have considered the
important influence factors of CBIR such as color and texture, feature
extraction tool, size of feature vector and distance method. We have
? ? ?evaluated the existing methods with these techniques and features using
the above mentioned database. As a result, the proposed system performs
equally well when compared to that of the highly adaptive wavelet method
[QUE12b], in which the different bases functions with given support is used
to characterize the each query image. Moreover, the proposed system
obtained better performance when compared to that of the optimization
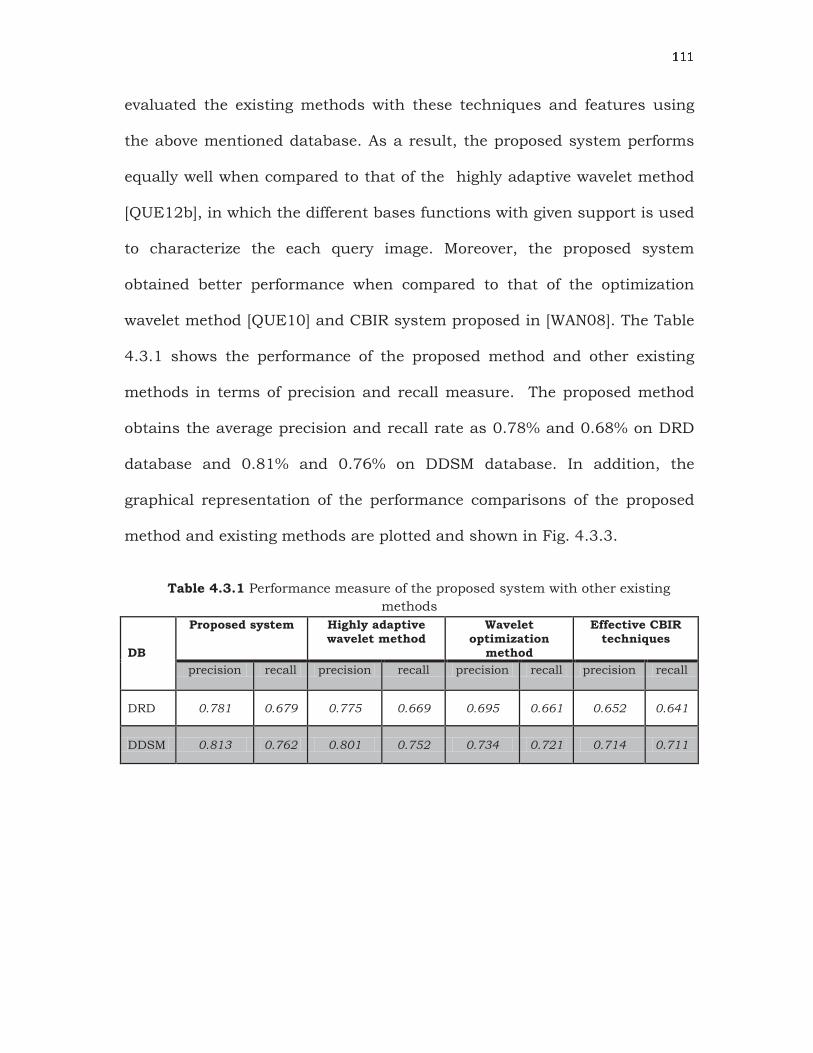
wavelet method [QUE10] and CBIR system proposed in [WAN08]. The Table
4.3.1 shows the performance of the proposed method and other existing
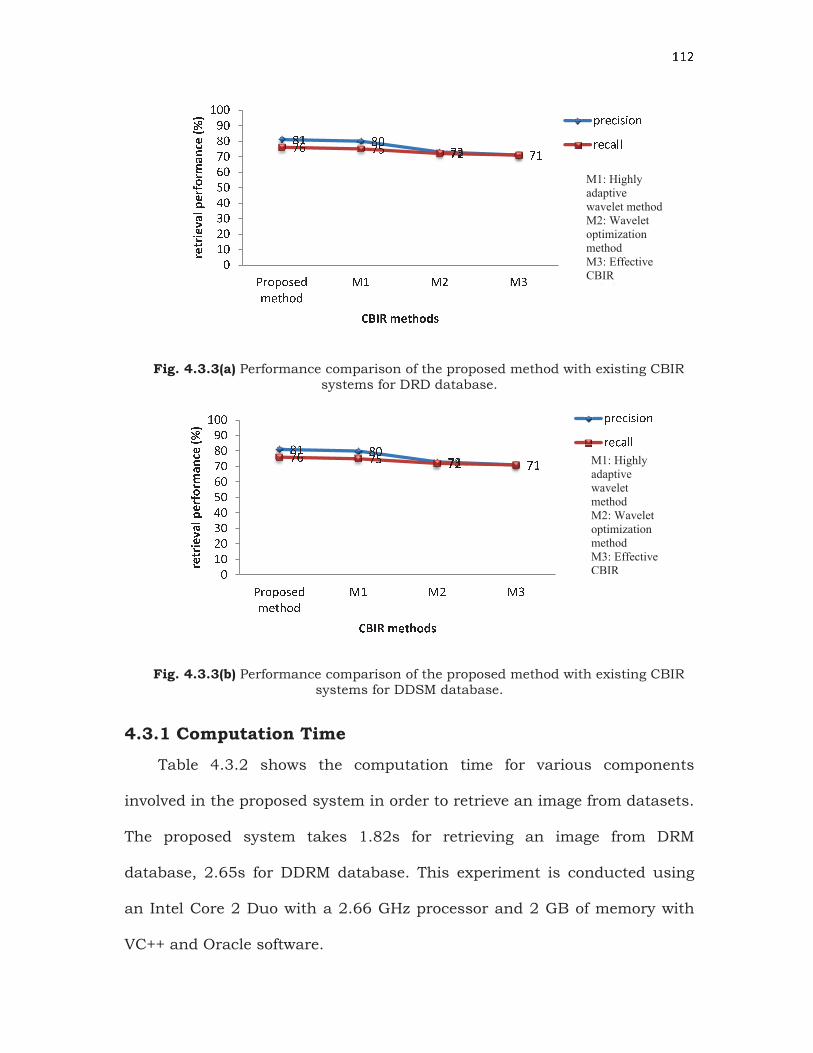
methods in terms of precision and recall measure. The proposed method
obtains the average precision and recall rate as 0.78% and 0.68% on DRD
database and 0.81% and 0.76% on DDSM database. In addition, the
graphical representation of the performance comparisons of the proposed
method and existing methods are plotted and shown in Fig. 4.3.3.
Table 4.3.1 Performance measure of the proposed system with other existing
methods
DB
Proposed system Highly adaptive wavelet method
Wavelet optimization
method
Effective CBIR techniques
precision recall precision recall precision recall precision recall
DRD 0.781 0.679 0.775 0.669 0.695 0.661 0.652 0.641
DDSM 0.813 0.762 0.801 0.752 0.734 0.721 0.714 0.711
? ? C
Fig. 4.3.3(a) Performance comparison of the proposed method with existing CBIR systems for DRD database.
Fig. 4.3.3(b) Performance comparison of the proposed method with existing CBIR systems for DDSM database.
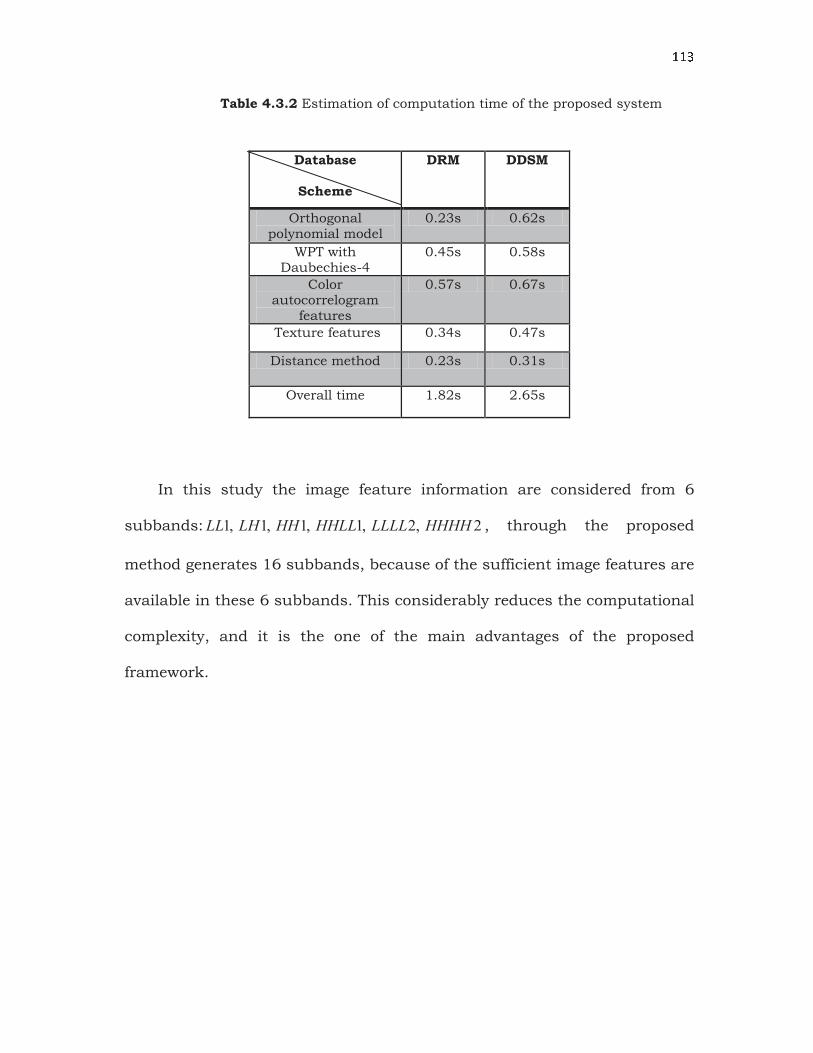
4.3.1 Computation Time
Table 4.3.2 shows the computation time for various components
involved in the proposed system in order to retrieve an image from datasets.
The proposed system takes 1.82s for retrieving an image from DRM
database, 2.65s for DDRM database. This experiment is conducted using
an Intel Core 2 Duo with a 2.66 GHz processor and 2 GB of memory with
VC++ and Oracle software.
D E D F G H G EG I G J G K G EFE FK FH FL FJ FI FG FD FM FE F F
N O P Q P R S TU S V W P T X E X K X HYZ[ Y\ Z]_ ZYa bYcdeZfghi j k l m n o p q r s
Q O S t u R u P vO S t w x x
D E D F G H G EG I G J G K G EFE FK FH FL FJ FI FG FD FM FE F F
N O P Q P R S TU S V W P T X E X K X HYZ[ Y\ Z]_ ZYa bYcdeZfghi j k l m n o p q r s
Q O S t u R u P vO S t w x x
M1: Highly
adaptive
wavelet method
M2: Wavelet
optimization
method
M3: Effective
CBIR
h i
M1: Highly
adaptive
wavelet
method
M2: Wavelet
optimization
method
M3: Effective
CBIR
? ? y Table 4.3.2 Estimation of computation time of the proposed system
Database
Scheme
DRM DDSM
Orthogonal polynomial model
0.23s 0.62s
WPT with Daubechies-4
0.45s 0.58s
Color autocorrelogram
features
0.57s 0.67s
Texture features 0.34s 0.47s
Distance method 0.23s 0.31s
Overall time 1.82s 2.65s
In this study the image feature information are considered from 6
subbands: 1, 1, 1, 1, 2, 2LL LH HH HHLL LLLL HHHH , through the proposed
method generates 16 subbands, because of the sufficient image features are
available in these 6 subbands. This considerably reduces the computational
complexity, and it is the one of the main advantages of the proposed
framework.
Related Documents