Chapter 4: Development of Functional Coatings on Porous Alumina and Glass Substrate 4.1 Development of Ultra Filtration Membrane on Porous Alumina Substrate 4.1.1 Abstract Ceramic membranes are of interest because oftheir higher chemical. thermal and mechanical stability than all other membrane materials. These membranes allow filtration under extreme conditions, like high temperature and extreme pll. In this chapter the fabrication of alumina-titania multilayer ceramic membrane layers on porous alumina support is described. The coating precursor is made from boehmite and titania sols, which is prepared through aqueous sol-gel route. Different compositions of coating solutions are prepared using boehmite and titania sols with hydroxycthyl cellulose (HEC) as binder. The various coating compositions prepared were characterised by viscosity measurements, TGA and DTA. Unsupported membranes were first prepared to check crack free drying and to study the porosity features of the membranes. The compositions corresponding to crack-free and thin membranes were chosen for coating on porous alumina substrates. Thus the one containing 1.5% l~lEC and 0.4% boehmite was coated as an intermediate layer. The top layer was fomted with the composition containing l%llEC and 0.2% titania. The membranes were characterised by XRD, FTIR and surface area measurements. The morphological features of coated layer were studied using scanning electron microscope. The filtration property of the membrane has been examined by cross-flow filtration method using a colouring agent such as congo red which is a red coloured dye. About 99.3% rejection of congo red was observed. I06

Welcome message from author
This document is posted to help you gain knowledge. Please leave a comment to let me know what you think about it! Share it to your friends and learn new things together.
Transcript

Chapter 4: Development of Functional Coatings on PorousAlumina and Glass Substrate
4.1 Development of Ultra Filtration Membrane on Porous AluminaSubstrate
4.1.1 Abstract
Ceramic membranes are of interest because oftheir higher chemical. thermal and
mechanical stability than all other membrane materials. These membranes allow filtration
under extreme conditions, like high temperature and extreme pll. In this chapter the
fabrication of alumina-titania multilayer ceramic membrane layers on porous alumina
support is described. The coating precursor is made from boehmite and titania sols, which
is prepared through aqueous sol-gel route. Different compositions of coating solutions are
prepared using boehmite and titania sols with hydroxycthyl cellulose (HEC) as binder.
The various coating compositions prepared were characterised by viscosity
measurements, TGA and DTA. Unsupported membranes were first prepared to check
crack free drying and to study the porosity features of the membranes. The compositions
corresponding to crack-free and thin membranes were chosen for coating on porous
alumina substrates. Thus the one containing 1.5% l~lEC and 0.4% boehmite was coated as
an intermediate layer. The top layer was fomted with the composition containing l%llEC
and 0.2% titania. The membranes were characterised by XRD, FTIR and surface area
measurements. The morphological features of coated layer were studied using scanning
electron microscope. The filtration property of the membrane has been examined by
cross-flow filtration method using a colouring agent such as congo red which is a red
coloured dye. About 99.3% rejection of congo red was observed.
I06

Chapter I V
4.1.2 Introduction
Ceramic membranes are a class of engineering ceramic systems having great
potential for application in the field of water desalination, ultrafiltration and separation of
gas mixtures. They are also projected as potential candidates for catalytically active and
carrier membranes. Ceramic membranes are thin (few nanometers to few micrometres
thick) planar structures formed, either as supported or as unsupported configuration by
the regular packing of fine ceramic particles (2 to l nm) or inorganic polymer clusters.
The first ever application of ceramic membranes dates back to the l940’s, after the
second World war. They were used for the enrichment of U235.In that process, UBSF6 was
separated from a mixture of UBBF6 and U235F6 using a supported membrane in a tubular
configuration. Commonly used materials for making ceramic membranes are A1203,
TiO;, SiO2, ZrO; or a combinations of these materials. Aluminium, titanium and
zirconium are considered as the three most common porous membrane materials. There
are also reports on oxide membranes with minor amounts of dopants to improve the
thermal and chemical stability.‘ Doping and surface modification can also improve the
catalytic performance of the membranes? There are many reports for the preparation of
membranes employing solid state-particle-sintering,3‘4 sol-gel,5‘ 6 anodic oxidation,7’8'9
chemical vapour deposition '°""‘2 phase separation and leaching Band the reverse
micelle method.'4’ '5 Out of these methods, solid state—particle-sintering and sol-gel
process are considered to be the practical methods. Usually ceramic microfiltration
membranes are prepared by solid state-particle-sintering method in which the membranes
are fabricated with particles by coating the support and then sintering to form a
membrane skin which is chemically attached to the support. Pore size obtained by this
107

Chapter IV
method varies from 0.1 to lum and the porosity of the ceramic membranes is in the range
of 30-50%. Ceramic ultra filtration membranes are generally prepared by the sol-gel
methods. By sol-gel method, the mean membrane pore size mainly assembles between 2
and 20 nm.'6 The sol-gel process involves the hydrolysis and condensation of various
metal alkoxide molecules under controlled conditions to form metal-oxygen-metal
bridging units.'7' 18 Microporous alumina membranes are used for separation of microbes
from drinking water, concentration of fruit juices in food industry and filtration of
beverages for their clarification and sterilization. They also find application as substrate
for nanofiltration, ultrafiltration and reverse osmosis membranes.'9'23
4.1.2.1 Structural features of supported ceramic membranes
Supported ceramic membranes consist of a macroporous support which is a few
millimeters thick (Figure 4.1.1) with an average pore diameter of 1 to 15pm and with a
porous intermediate layer of 10 to l00|.lm thick. The average pore diameter of the porous
intermediate layer is 100-1500 nm. The third top layer, which is the functional membrane
layer, usually has a thickness of 0.1 to 10pm with an average pore diameter in the range
of 1-100 nm (Table 4.1.1).“
108

Chapter I V
Flgure 4.1.1 (A) SEM photo and (B) a schemauc representatlon of an asymmetnc
composite membrane (C) Cross sectlonal vlew of porous membrane support tube
Table 4.1.1 Properties of membrane layers
Layer
at-A1203-support
0.-A1203 —1\’IF
Coarse ZrO2-UF
Coarse Ti(b);-UF
Fillfi ZI02-UF
Fine Tio,-UP“
“ ZrO;-NF
TiO2-NF
surface
r"'wp"Y97\\‘into edla!
law?" 3% 0 .¢:3: "IQ‘Q 01.! Ottpo __
5'-W°|t“*\‘{r__\_»».t_.l‘s<L.. M, M.
Uw-J
Thl¢kl'l€SS Average pore dlameter1 4pm
20 25 pm 0 18pm10 pm 60mn
_ l0u_nT_ _ — 50nm100 200nm 23mn500mn 10mn
_ <5Omn 125m‘ <5o5m _ l2nm
Chapter 1 V
4.1.2.2 Formation steps of ceramic membranes
The important step in the preparation of sol-gel derived ceramic membranes is the
preparation of a stable colloidal sol. The size and nature of the agglomerates in the sol is
very important because they affect the ease of fonnation and the final nano structure of
the membranes. The exact role of the agglomerates is that they influence the top-layer
growth kinetics. In fact, the agglomerates must be weak and below a certain size in order
to give small pores and a narrow pore size distribution.” In general, a colloidal sol yields
a membrane with pore size in the mesopore range while inorganic polymer solutions
yield microporous membranes.
The next step is to apply the sol / solution (dip solution) on a porous support by
bringing one side of the support (in the case of flat plate supports) in contact with the dip
solution. An alcogel or a hydrogel layer will be formed on the support and the layer
formation mechanism can be film coating or a combination of slip-casting and film
coating.26 The film coating process depends on the viscosity of the dip-solution and the
pulling speed of the support from the dip-solution. On the other hand, the slip-casting
process depends on the pore characteristics of the support as well as on the viscosity and
the surface tension of the dip-solution. After forming an alcogel or a hydrogel layer, the
membrane-support system is dried at controlled temperature and relative humidity.
The dipping stage is absent in the preparation of imsupported membranes. They are
formed simply by pouring the dip-solution into a glass or a polyethylene petri dish and
dried directly to get the xerogel. Drying is one of the most important steps in the
preparation of ceramic membranes. During drying, large stresses develop due to the
110

Chapter I V
capillary tension of the pore fluid and these stresses are not relaxed by shrinkage because
of the presence of rigid support.
I Synthesis of Sol I
i Porous support isPreparation of the Dip-Solution ‘ prepared by dry pressing
i (Sol+ Additives) and calcination. SurfaceE was polished and cleanedl
For making unsupported . Dipping: Layer formation bymembranes the ‘Dip- ‘ bringing one side of the support in
Solution’ is poured into a contact with the ‘Dip-Solution’i glass/Plastic ‘Petri dish’
V VDrying at 40 to 60 °C and Relative Humidity
40 to 60% followed by calcination at 450-900°C
Figure 4.1.2. Flow chart illustrating the formation of ceramic membranes using sol-gel
process.
The stress field in the top-layer can become inhomogeneous around hard agglomerates.
This makes the membrane top-layer to crack and peel off from the support. Drying
lll
Chapter 1 V
stresses also have a positive role in membrane formation. The stresses cause weak
aggregates to break down and may help in further rearrangement and ordering of the
primary particles.” The final nano structure of the membrane is believed to be
established at this stage. There exists a maximum and minimum allowable thickness
which should not be surpassed if defect (crack) free membranes have to be obtained. The
actual thickness limit depends on the membrane material.” The last step is calcination,
which gives the mechanical integrity to the membrane-support system. During
calcination, physically adsorbed water, hydroxyls, residual organics and nitrates will
escape below 450 °C. Flow chart for the preparation of membrane using sol-gel method is
presented in Figure 4.1.2.
4.1.2.3 Filtration technology
Filtration technology using membranes has a wide range of applications. So far,
organic filters commonly have been used, although these filters have relatively low
temperature limitations (typically <200°C) and lack chemical stability. As a new kind of
membrane, ceramic filters have a potential capability for replacing organic filters for
some applications; because of their superior high temperature (>l000°C) and chemical
stability. Ceramic filters are expected to be used in applications such as microfiltration
(100 nm < pore size < l0 um), ultrafiltration (pore size<l00 nm), filtration of molten
metal, gas separation at high temperature and particle removal from exhaust gas from
diesel engines (Figure 4. 1.3).” Filtration performance of various type of membranes are
given in Table 4.1.2.
112
Chapter IV
us-" ' MP "
inin
2 <5_n 5
ir
1 _._. ,, __ -\-\-,-..,....._,,_ --w.....,,,_-_-_A_;__-__-_ -_.-- -,- \\ll>l..\l)L\)~4 -4
EL? 1.0 1!] ll] llllllflParticle are (um) L
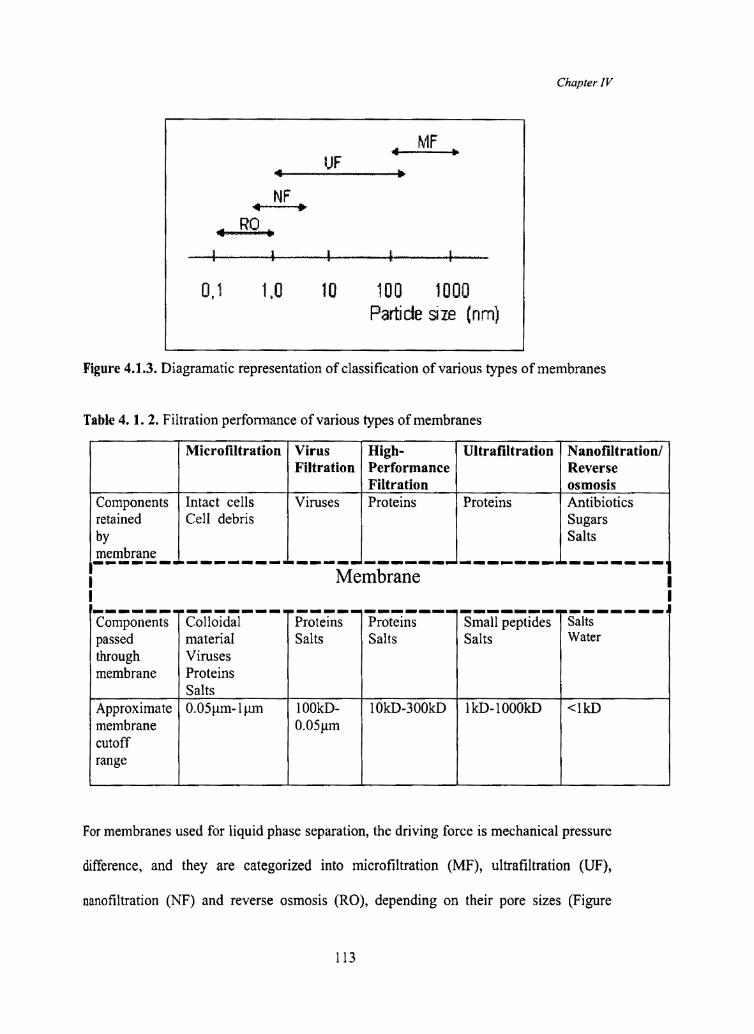
Figure 4.1.3. Diagramatic representation of classification of various types of membranes
Table 4. 1. 2. Filtration perfomiance of various types of membranes
j Microiiltration Virus T High- ll UltrafiltrationlNanofiltrationl‘Filtration Performance Reverse__ _ i _g g gal Filtration M p X g 1 osmosis _A Components y. Intact cells p Viruses Proteins r Proteins l Antibioticsretained Cell debris l r_ Sugars* by A Salts: MembranelF--------¥------—+—---¥--—------P-f------—Components yCollo1dal Proteins Proteins Small peptides Saltspassed ii material I Salts 1 Salts Salts Waterthrough Viruses timembrane t Proteins r g__ a o Salts t e t , 7 pl
.Appr0ximatc 0.05pm-lum y 100kD- 10kD-300kD l 11<1;>-100014) <lkDmembrane 0.05pm iicutoff “rangeFor membranes used for liquid phase separation, the driving force is mechanical pressure
difference, and they are categorized into microfiltration (MP), ultrafiltration (UP),
nanofiltration (NF) and reverse osmosis (R0), depending on their pore sizes (Figure
113
Chapter I V
4.1.3). Microfiltration membranes have pore sizes between 100 and 1000 nm and UF and
NF are classified at the pore size less than 100 mn. RO membranes have smaller pore size
than l nm. According to conventional definition and for the convenience of membrane
users, molecular weight cut-offs (MWCO) which are based on permeation performance
are also often used. NF membranes are categorized to have MWCO between 200 and
1000.30‘ 3' Filtration performance of various types of membranes were given in Table
4.1.2.
4.1.2.4 Applications of ceramic membranes
Initially ceramic membranes were used in waste water technology. Meanwhile,
successful solutions and possible applications cover all industries.
1' Chemical industry
(a ) Product separation and cleaning (b)Concentration of polymer suspensions and
metal hydroxide solutions (c) Separation of catalysts (d) Recovery of dyes and
pigments (e) Desalination of products (t) Cleaning and recycling of organic solvents
(g) Metal industry / Surface engineering (h) Recycling and disposal of degreasing and
rinsing baths (i) Treatment of oil / water emulsions (j) Recovery of heavy metals (k)
Cleaning of waste water from grinding processes (l) Treatment of waste water from
glass and glass fibre production
I Biotechnology
(a)Concentration, fractionation, isolation and sterilization of antibiotics, enzymes,
proteins, amino acids and vitamins (b) Separation, concentration and dewatering of
biomass and algae (c) Disposal of fat emulsions (d) Separation of yeast
114
Chapter I V
I Food and beverages
(a) Clarification of juice and beer ( b) Concentration of juice (c)Sterilization of milk
and whey (d) Separation and fractionation of milk and whey ingredients (e)
Desalination of whey (f) Dewatering of products (g) Purification of drinking water
I Recycling and environment
(a) COD / BOD reduction (b) Oil / water separation (c) Recovery of pharmaceuticals
and pesticides (d) Retention of microorganism (e) Retention of heavy metals and
radioactive substances (t) Recycling of water from swimming pools (g) Purification
of the drain of sewage plants.
4.1.2.5 Benefits of ceramic membranes
(a ) Long and reliable lifetime (b) High resistance to temperature and pressure (c)
High stability to organic media (d) Rigidity with no creep or deformation (e) Stablity
over a wide pH range (t) Corrosion and abrasion resistance (g) Insensitivity to bacterial
action (h) Can be repeatedly sterilized by steam or chemicals (i) Ability to be
backwashed (j) Consistent pore size (k) Can process highly viscous fluid (1) Possibility of
regeneration after fouling (m) Membranes are bonded to substrate by strong ceramic
bonds.
4.1.2.6 Disadvantages of ceramic membranes
(a) Brittle and poor geometrical stability (b) Needs to be in the supported
configuration (c) High installation and maintenance costs (d) Sealing is very difficult for
high temperature application.
Ceramic membranes have a wide variety of applications in chemical industries,
food and beverage industries, biotechnology, water purification and recycling etc. The
115
Chapter I V
general mode of adapting ceramic membranes to the different application domains, in
particular for liquid filtration, has been to superpose successive porous layers starting
from a macroporous support. In order to minimize flow resistance, non interpenetrated
layers are superposed with decreasing pore sizes and thicknesses. The resulting multi
layered ceramic structures must be regarded as advanced ceramic materials with unique
fluid processing performance. Research is actively done in this area of development of
membrane with desired pore structures. Normally all the sol-gel membrane formation
starts with alkoxide precursors. To the best of our knowledge there is no report on the
preparation of multilayered membrane through an aqueous sol-gel method. The objective
of the present work is the development of an aqueous sol-gel method for the preparation
of mesoporous membrane layer on the surface of porous alumina substrate for ultra
filtration applications.
4.1.3 Experimental
Al(NO3)3.9H;O, ( sd. Fine Chemicals, India Ltd ) 125 g was dissolved in 1 litre
water. The solution was heated to 90 °C. Keeping the temperature constant at 90 °C,
ammonium hydroxide solution was added drop wise. Addition was continued till the
precipitation was complete at pH 8. The precipitate was filtered while solution was hot
and washed with distilled water till it becomes free from nitrates. The precipitate was
aged for 24h. It was peptised to a stable sol by the addition of 10% HNO3 at a pH of 3.5.
The particle size of the sol was measured using Malvem Zetasizer 3000 HS (U.K)
particle size analyzer. Alumina coating solutions of different compositions were prepared
using boehmite sol with hydroxylethyl cellulose (HEC) as the binder. The calculated
amount of hydroxyethyl cellulose was dissolved in water and added into the boehmite
116
Chapter I V
sol. The resultant solution was homogenized by stirring for half an hour by gentle
warming followed by centrifugation. The different wt% of boehmite and hydroxy ethyl
cellulose are provided in Table 4.1.3. The viscosities of the above compositions were
measured to study the variation of viscosity with shear rate using a Viscorheometer
(Rheo Labmcl, Physica, Anton Paar, Germany)
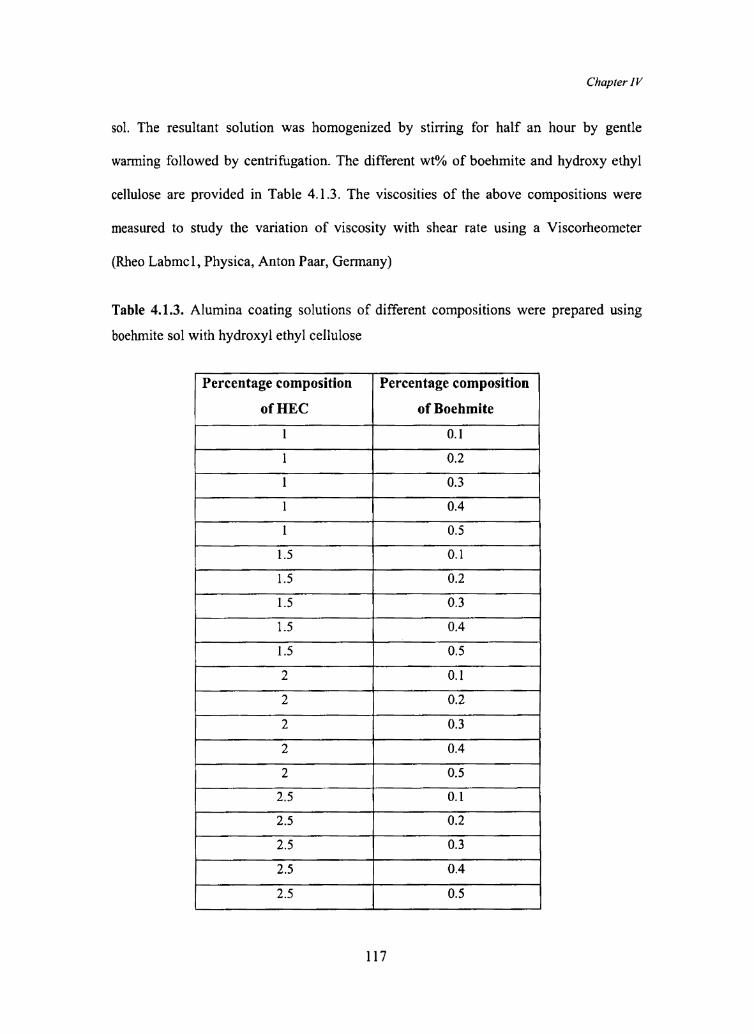
Table 4.1.3. Alumina coating solutions of different compositions were prepared using
boehmite sol with hydroxyl ethyl cellulose
Percentage composition Percentage composition. of HEC » of Boehmitel 0.1l ‘ 0.2I T 5 550.3 2“._ .__ .. _ _ .1 0.4* 5 1 0.5 ‘ll 5 ifs l 00.1 5*1.5 0.2___ _ . -V 1|
l
1.5 0.3J _ _. 1-.l.5 i 0.4' 1.5 0.52 0.]2 0.22 0.3 ._ . . 2 0 - t _ . .12 0.42 0.552.5 ll 0.1 5‘ lo52.5 5 0.25
‘ ‘2.5 5 0.32 A2.5 0.42.5 0.; 0 itl , _. _ t _ 7V117
Chapter I V
Titanyl oxysulphate (TiOSO4, Aldrich Chemicals, 99.99% purity) was used as
precursor for the synthesis of titania sol. In a typical experiment, titanyl oxysulphate was
dissolved in 500 ml of distilled water (0.2 M) and hydrolysed by slow addition of
ammonium hydroxide (10%, sd. Fine Chemicals, India Ltd) solution under constant
stirring at room temperature (32 OC), until thereaction mixture attained pH 8.5. The
precipitate obtained was separated by filtration and was washed free of sulphate ions
(confirmed by the BaCl2 test) with distilled water. The precipitate was further dispersed
in 1000 ml of hot distilled water and peptised by addition of 10% HNO3 (Merck, India
Ltd) solution. A stable sol was obtained at a pH range of 1.7 to 2.2. Different
compositions of coating solutions were prepared by mixing titania sol with hydroxyethyl
cellulose "dissolved in water (HEC). The compositions were stirred for half an hour and
then centrifuged. The compositions prepared were given in Table 4.1.4.
Various compositions of coating solutions prepared from boehmite and titania
sols were used for making unsupported membranes. Particle size distribution of the sol
was analyzed by Malvern Zetasizer 3000 HS particle size analyzer. 20 ml of the different
compositions were poured into separate clean plastic petri dishes and were dried in a
humidity chamber at 50 °C and at 60% relative humidity for 24h followed by drying at 70
°C. The composition which gave crack free membrane of desired viscosity was chosen
for coating purpose. The porous alumina tubes were cleaned well by boiling several times
in distilled water and were subsequently dried. Then the tube to be coated was held in the
vertical direction with the help of a support stand. A glass tube was attached to the upper
end of the porous alumina tube. The lower end of alumina tube was connected to a glass
column. The column was lowered beyond the position of the tube and the coating
ll8

Chapter IV
solution prepared from boehmite sol and hydroxyethyl cellulose of suitable composition
and which showed crack-free behaviour when tested as unsupported membrane was
introduced into the column.
Table 4.1.4. Titania coating solutions of different compositions prepared using boehmite
sol with hydroxylethyl cellulose
Percentage composition Percentage compositionof HEC I of Titanial 5 0.11 A 0.21 0.31 it U 0.4 li1i 0.51.5 0.1= 1.5 0.2 T- 1.5 0.31.5 T 0.4 l1.5 0.5
0.12 0.2 tTT 2 uh WNW“ M T 0.3
l\J
The column containing the coating solution was slowly raised so that the solution rises
through the porous alumina tube until it reaches the glass tube attached to the upper
portion of the alumina tube. The column was then lowered slowly at a speed of 20 cm per
min. so that the level of coating solution also slowly lowered. The coated tubes were
dried in a humidity chamber at 50 °C and 60% relative humidity for 24h and then dried at
70 °C. The dried coated tubes were calcined at 800 °C for 5h at a heating rate of 1 °C per
119
Chapter 1 V
minute followed by atmospheric cooling. Thus an intennediate layer was formed in the
alumina tubes.
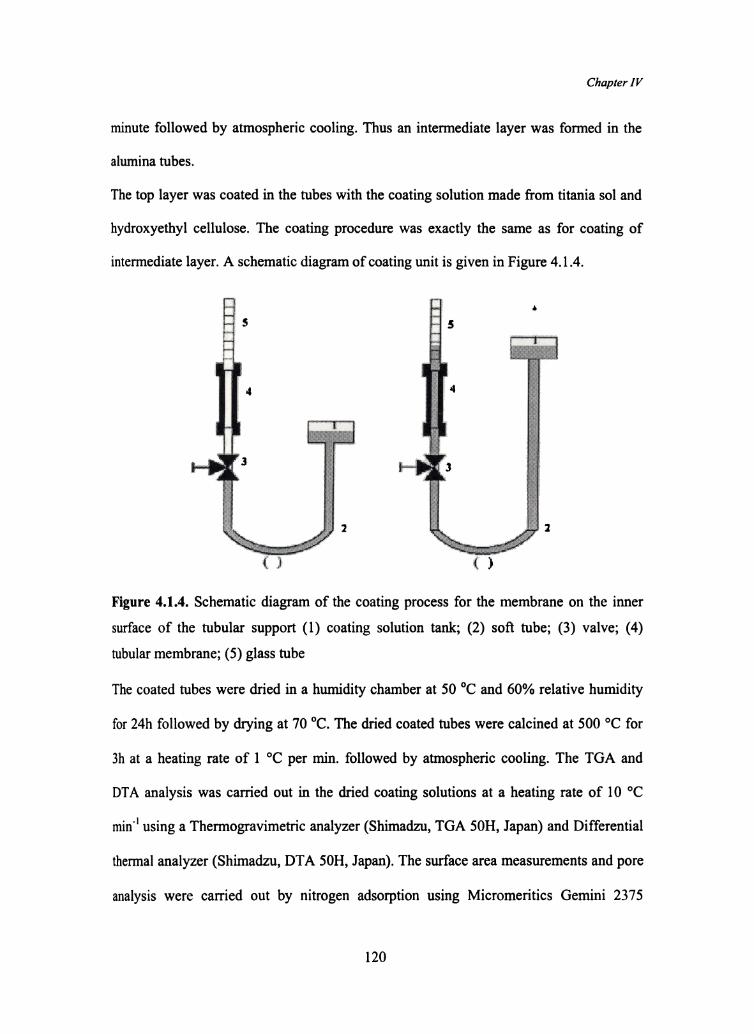
The top layer was coated in the tubes with the coating solution made from titania sol and
hydroxyethyl cellulose. The coating procedure was exactly the same as for coating of
intermediate layer. A schematic diagram of coating unit is given in Figure 4.1.4.
~.- 1*! =f< 2..~1*- , '
~at-'=‘
‘.-»~_-:-:» 1-:.-M .5.< ;'_;_A--Ivr
i;"$§§§&~ ‘1Y§35$<3‘§T,’4l’. S "ffX -~ -:4‘ <:~..4-~.{ -:» 4-ff;-,
$1» 314?‘; i ‘‘é
it‘iii -§ 1-;521.» §:,;'i=§4 4-=2‘: ».~.<-5--=14
,;-1;: .-..;._ $1; .;.~.,. -:- <-:, :-.4'5.-'-. , ; t 5.,' - -. /~.x --_tr >2;at-=4
:'77‘?,"t?'*’$
§_:¢§43.<~'?/Y4-‘-13‘~.;>
_\ 1»1+.‘.-'“M14‘?-i "’- -.~.~: '»
-_'__ ~.<$;_-:5
"$'1'<~.<.§
1;’?-.711: 313,‘
§;>»>
-s +12,4 . H J "',.-.-: ‘:1 .1- -:<.
Z4-.». -2
Q .
1 .é J? _ "5 ?';r_:- 42%.§.i§';rP335.Y'.ii‘§‘ 5‘.._ -»~ >31; :-'5.- -’ : :‘<: :' 1‘" 2*‘ -5 T. :"F5 555 :=.: >15. _ 5.‘; ,§<-;:_ ;.:’»¢-: M: . '3it 2 531$ {ya 2 3.:r’ " »-;<'1=1. -1 ::__ , .{<:':»r;'- ~. a H: V . ._ _.‘::>.::> _§<_;:> ~1 ,- ->':.~,-,, ; _ __ _ _,»s>~"'- ---1'1.=».<. 4.-.,~,...;*-31*‘? ' , , »- .4.-1 .' :'~:.*-" '(J {I
Figure 4.1.4. Schematic diagram of the coating process for the membrane on the inner
surface of the tubular support (1) coating solution tank; (2) soft tube; (3) valve; (4)
tubular membrane; (5) glass tube
The coated tubes were dried in a humidity chamber at 50 °C and 60% relative humidity
for 24h followed by drying at 70 °C. The dried coated tubes were calcined at 500 °C for
3h at a heating rate of l °C per min. followed by atmospheric cooling. The TGA and
DTA analysis was carried out in the dried coating solutions at a heating rate of 10 °C
min" using a Thermogravimetric analyzer (Shimadzu, TGA 50H, Japan) and Differential
thermal analyzer (Shimadzu, DTA 50H, Japan). The surface area measurements and pore
analysis were carried out by nitrogen adsorption using Micromeritics Gemini 2375
120
C haprer I V
surface area analyser after degassing each sample at 200 °C for 2 h. XRD patterns of the
calcined gels were taken in a Philips X’ pert X-ray diffractometer in the diffraction angle
20 range 10-80° using Cu Ka radiation. The morphology of membrane layer was
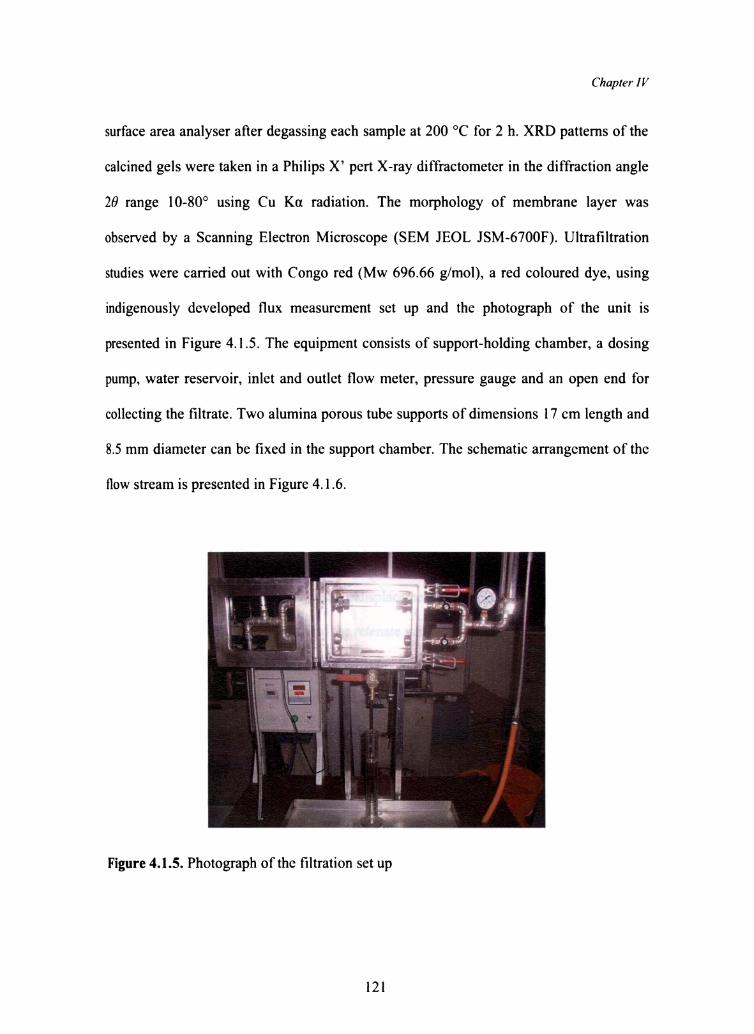
observed by a Scanning Electron Microscope (SEM JEOL JSM-6700F). Ultrafiltration
studies were carried out with Congo red (Mw 696.66 g/mol), a red coloured dye, using
indigenously developed flux measurement set up and the photograph of the unit is
presented in Figure 4. l .5. The equipment consists of support-holding chamber, a dosing
pump, water reservoir, inlet and outlet flow meter, pressure gauge and an open end for
collecting the filtrate. Two alumina porous tube supports of dimensions l7 cm length and
8.5 mm diameter can be fixed in the support chamber. The schematic arrangement of the
flow stream is presented in Figure 4.1.6.
Figure 4.1.5. Photograph of the filtration set up
121

Chapter IV
Controller (Pressure and Flow)
l
Pressure gauge
Feed Modulei Retentatel a ll ‘l ;
F iltrate collection
.__- at L
I Positive displacement5 Pump
Figure 4.1.6. Schematic representation of filtration setup
The feed is pumped by a positive displacement pump (reciprocating) from a sump
through the inlet to the substrate and the retenate was allowed to go back to the sump in a
closed loop manner. A controller is provided at inlet line to control the line pressure and
flow rate. The filtrate is collected down in a measuring cylinder over definite time
interval. The flux is calculated at different time intervals and a plot was made against
time vs. flux. By knowing the concentrations of the feed and the filtrate, the percentage of
rejection by the membrane is calculated.
122

Chapter 1 V
4.1.4 Results and discussions
4.1.4.1 Particle size measurements
Figure 4.1.7 (a) and (b) shows the particle size distribution of boehmite and titania
sol prepared through an aqueous sol-gel method. Boehmite sol shows unimodal particle
size distribution have an average size of 165 nm and titania sol also shows unimodal
particle size distribution having an average size of 27 nm. This sol is further used for the
preparation of alumina and titania membrane.
307. “ . u '_i _-._.- z- b E25
.0? /1 "-\ M
IntensityG
% /' '/“/' ,.-7/' 1'- tv
-nQ
5...
0-I—I-I-I IIIII. \_,I*I-I-I- -———IIIII IIIIUI‘ I I IIIIUVI v I IIllll|10 100 I000
Particle Diameter (nm)
Figure 4.1.7. Particle size distribution curves of (a) boehmite sol and (b) titaniasol.
4.1.4.2 Viscosity measurements
The viscosity curves of the different coating compositions prepared using
boehmite sol and hydroxyethyl cellulose (HEC) are shown in Figure 4.1.8 a, b, c & d. It
is seen that viscosities of all compositions vary with different shear rate. There is a
sudden increase in viscosity upto a particular shear rate and after that it shows a gradual
decrease. The increase in viscosity corresponds to the gelation of sol particles with
123
Chapter 1 V
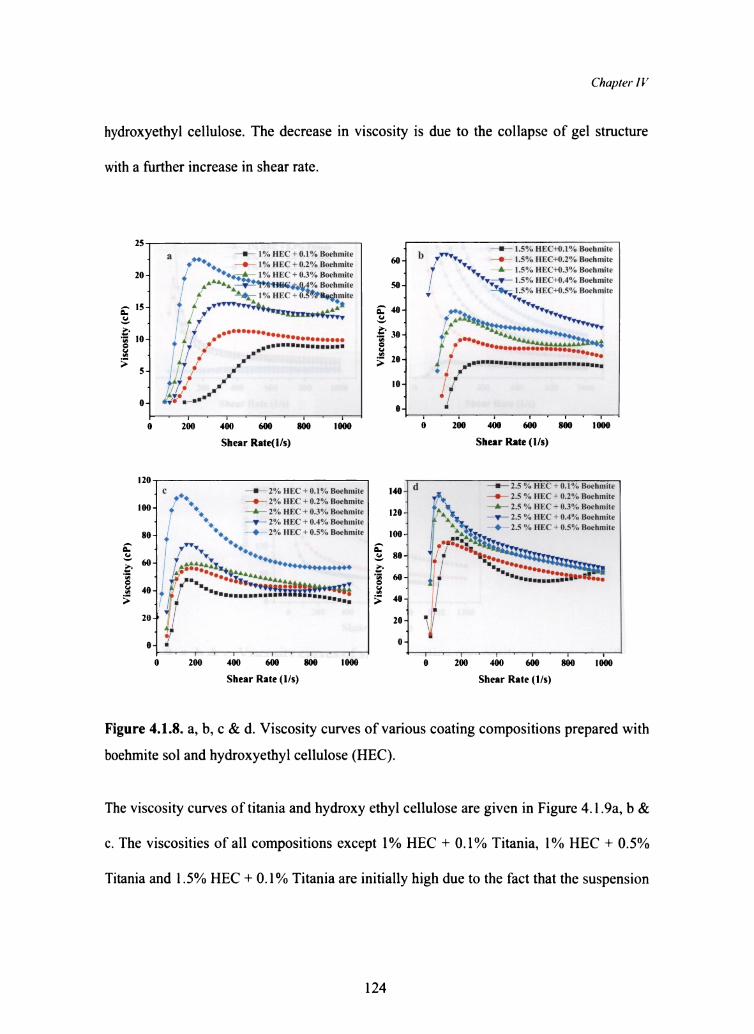
hydroxyethyl cellulose. The decrease in viscosity is due to the collapse of gel structure
with a further increase in shear rate.25 J. . . I— l.5°/ HF.('+0.l°/ Boehmite_ 3 “ P 1°/.. m.( + 0.1% Boehmlte 60 _ b vwyv . l W: "F90 2,,/Z Bwhnme0 '0, 0 1% m:c + 0.2"/.. Boehmile / ‘v " _ J ' , 0 ,A 0, 0 . ,, . _ 7 '0 A 1.5% Ht.C+0.3‘!'.. Bot-hmne20- . 0.1%’ 1 /0 llE( + 0.3 /0 Boehmm: I. 7' _°/ _ 0/ _M“ ¢00q%.w€ 0 . __ '1 v;—'V—~ L: .0 llE( +0.4 ,0 Boehmite4 A —7—- “Q4 /0 Boehmlte 50 , y 0 _ _ ,0, ... ‘ A“rg l% "EC + 0.g%w‘mi‘e _ ‘I —%"|;S /0 Hl'.( +0.5 /0 Boehmlle'7" A O V
‘ ‘I, Illnrwflwv, . . 7. 9 .-12;, "WWW. '~' ..000000q.. _ ‘Ii a‘ '_ 00000000000000 '- . 0000. “lIII--'lIIIlIIIIII - A P '
Viscosity (cP)5' <7
0 0 O\:_\ 00, TX‘
.._\0..
OOI
KNIi
V scos ty (cP)'5 8 8
GA‘\>'
5 _ I A.‘ II fr ‘I .I‘ Ii I/ 0.. ‘T/‘.0’ Ii. I0 " ./“VII, ‘I. - O0 - iv’! I-1‘ .0 1 'F I | I I I I I | I | I I ' I ' I ' I I I I’ I I0 200 400 600 800 1000 0 200 400 600 800 I000Shear Rate(l/s) Shear Rate (1/s)
'°00000000000000....
-gulllnlllllIIIIIIIQIIIIIII0|
I20% 2% "EC + 0"“/0 Boehmm l40__ d —I— 2.5 % HF.(‘ + 0.1% Boehmite- C . .
,0,‘ +7 2% "EC + 0.2% Boehmm , —0— 2.5 % m.c + 0.2% BoehmiteQ O _ , _ 0 _ _100 . _ k _ 2% HE(. + 0.3% Boehmim I20“ Q‘ i— 2.5 0/» HE5( + 0.3‘;/0 Boehmile_ . , 0 . ,, . -, -0- 2.5 /.. m.C + 0.4 /.. Boehmnte
I ° ' 2 /" HE‘ + 0'4 /" B°°"""'° ‘ 1* * ‘ 0 2.5 "/.. mzc + 0.5% Boehmite30 __ . °, 0 2% HI-LC + 0.5% Boehmite mo- A‘0 W 0. 1, , ., v .--%2:j‘§¥Z"I I Q. 80- ‘ ‘Iv |./I I/ _00- Y 2. "5 ""0. ~/A$00“lX "**¢000000000 I ~ "'00Iii‘. . 01 -- I' W’ 1 '90 “‘5AA 60 ' -' .'”, . ¥ ‘ ; 'II000lllII '9040 -I 9 gr‘ ...'lllI::l:::gfi :““; -- i- 1/'5 ...-I= - Z0
Viscosity (cP)NIQ| A |
0:2-___=g _ I""—~0-_
V scos ty (cP)-BQ0 4 L4 4 1
__ >3?_"""‘-—I:_ T.
0 -"/ 0‘1 I | i | l | I | i | 'l 1 t I t I | i ‘ I ‘ I ‘ —0 200 400 600 s00 1000 0 200 400 600 800 1000Shear Rate (I/s) Shear Rate (I/s)
Figure 4.1.8. a, b, c & d. Viscosity curves of various coating compositions prepared with
boehmite sol and hydroxyethyl cellulose (HEC).
The viscosity curves of titania and hydroxy ethyl cellulose are given in Figure 4. l .9a, b &
c. The viscosities of all compositions except 1% HEC + 0.1% Titania, 1% HEC + 0.5%
Titania and 1.5% HEC + 0.1% Titania are initially high due to the fact that the suspension
124

Chapter I V
structure is close to equilibrium. Hence the movement of the particles dominates over the
viscous force (first Newtonian region).32J 7' l Y ‘550 2 g - . ‘ . + |.s"».. HI-_'(‘ + 0.1 '1». litania;00_ + "'"’" H" * "-'"’" T"='"i" 7‘ T 9 i 4 1.5% m;(‘ + 0.2 Titania' - 1 *— l°~<- "EC * 0-Z"-1-’l'iwni== 250- |) y '-. ° A 1.50-1. nu" + 0.3 "/.. Titania450 T 1 ‘P '9"? “F? * 0'-W‘ l""'“§*' 215i ‘- ‘ 9 ° —v— 1.50.. HE(‘ + 0.4 '24. Titania400 1 p 1* l°.*0 HL( + 0.-1"w.. litama - ‘ ' . O I.5“.-G» HEC + 0.5 ‘Ft, Titania3 + 1% mgr ~ 0.5"... Titania 2009 V __ . ' ..m 1 ... ‘ Q .8 soo
3‘ Y
V'sc0sitvI-l IQ8 8|-_J
>.:;_‘:"_§”-'
V scos ty(cP)
§ E Z E
\.. 5 V O.. 0 A v, 9.' A V 0250 1 '-' ' . ‘ V‘ O.- A‘ vv 0..- ' v_ .~ ‘A '7' ‘.0.— V Q‘ n — . L‘ v‘* 9 ‘A ‘V_ _ OQ.. lAA““I00 — A ~ '050 - ....'OO.... M50 J 0 III ...‘..OOOOOOO0 J 25 -I -5- -.---'-IIIIIIIIIIIIIIIIIIIIIIIq i | ' I I + I I | I | I 0 -I i _ii | I | I I I | I i I0 100 400 600 800 I000 0 Z00 400 600 000 I000Shear Rate (1/s) Shear Rate (l/s)
300 ~4- c ‘ “
275 - I —I— 2% HEC + 0.1% Titania250 j 0‘ p + 2% HEC + 0.2% Titania
l
225 .. 8 2% HEC + 0.3% Titania200 — Al A5 - 0i A
Viscosity (cP)
a § E § 5l_)
A4. it i‘ ‘|0__ l‘-. I‘ “¢. I ‘0 ‘A1 Q.‘ AAAAA““‘1 I ...... M50 -J mom
25
0 J | I | I | I | I | I | I | I0 200 400 600 800 I000 I200
Shear Rate (I/s)
Figure 4.1.9. a, b & c. Viscosity curves of various coating compositions prepared with
titania sol and hydroxyethyl cellulose (HEC)
At high shear rates, the viscous forces affect the suspension structure and shear thinning
occurs due to progressive breakdown of particulate network or agglomerates (floc). At
very high shear rates, viscous forces dominate and normally a plateau in viscosity is
observed (second Newtonian region) 32 indicating completely hydrodynamically (arising
from the shear field) controlled structure.” The remaining three compositions show a
small increase in viscosity upto a particular shear rate due to gel formation with
125

Chapter I V
hydroxyethyl cellulose (HEC) and a small decrease in viscosity is observed due to
collapse of gel structure with further application of shear rate.
4.1.4.3 Analysis of unsupported membrane
The photographs of the unsupported membranes prepared using different coating
compositions of alumina (boehmite) sol and hydroxyethyl cellulose (HEC) are shown in
Figure 4.1.10.
Figure 4.1.10. (I) 1% HEC (II) l.5%HEC (III) 2%HEC (IV) 2.5% HEC (a) 0.1%
Boehmite, b) 0.2% Boehmite, c) 0.3% Boehmite, d) 0.4% Boehmite, e) 0.5% Boehmite.
126
C hapler I V
The cracking behaviour of the unsupported alumina membranes was studied. The
unsupported membrane contains 1% HEC + 0.4% boehmite, 1.5% HEC+ 0.3% boehmite
and l%HEC+ 0.5% boehmite cracked during drying. Upon considering the viscosity of
the coating composition, thickness and crack free formation of unsupported membrane,
we adopted a composition 1.5% HEC + 0.4% boehmite which could easily give a crack
free alumina membrane intemiediate layer on porous ceramic substrate.
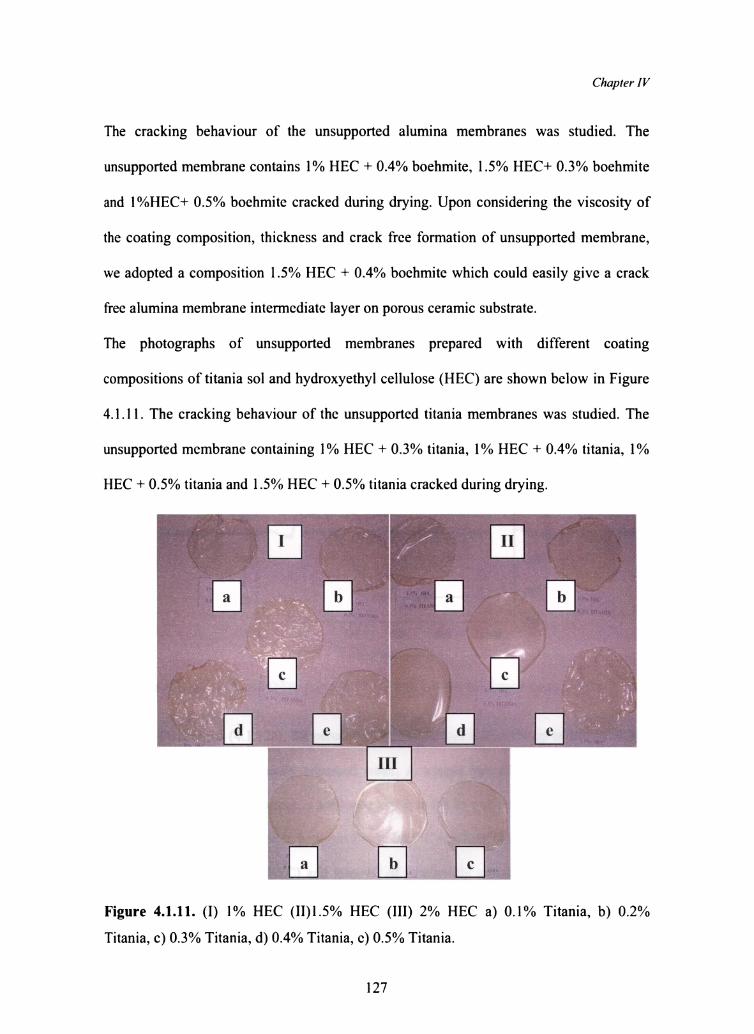
The photographs of unsupported membranes prepared with different coating
compositions of titania sol and hydroxyethyl cellulose (HEC) are shown below in Figure
4.1.11. The cracking behaviour of the unsupported titania membranes was studied. The
unsupported membrane containing 1% HEC + 0.3% titania, 1% HEC + 0.4% titania, 1%
HEC + 0.5% titania and 1.5% HEC + 0.5% titania cracked during drying.
Figure 4.1.11. (1) 1% HEC (ll)l.5% HEC (III) 2% HEC a) 0.1% Titania, b) 0.2%
Titania, c) 0.3% Titania, d) 0.4% Titania, e) 0.5% Titania.
127

Chapter 1 V
Upon considering the viscosity of the coating composition, thickness and crack free
formation of unsupported titania membrane, we adopted a composition (1% HEC + 0.2%
titania) which could easily give a crack free titania membrane top layer on porous
ceramic substrate.
4.1.4.4 Thermo gravimetric and Differential thermal analysis
Figure 4.1.12 a & b shows the Thermo Gravimetric and Differential Thermal
analysis profiles of the unsupported alumina membrane (1.5% I-IEC + 0.4%Boehmite)
dried at 50 °C and at 60% relative humidity for 24h.
~ - | - 1 1*“ ‘—r~"~+-~ 1 ~100- l -300I | 1
1
- 200so - i_; ., _60-t it 1’; it ". 10
s (%)
3@
exo
Wt os
endo
j 1T40- . -100
T
8 - -20020- e he e _. .- . - . ~e.— --3000 200 400 600 800 1 000Temperature (°C)
Figure 4.1.12. TGA and DTA curves of 1.5% HEC- 0.4% Boehmite composition.
In the TGA curve (4.1.12a), the percentage of weight loss is 21.87% up to 190 °C due to
the elimination of physically adsorbed water. A weight loss of 5.59% is obsen/ed in
between 191 to 240 °C, which is attributed to due to the loss of nitrate. Similarly a weight
loss of 51.57% is observed in between 241 to 540 °C resulting from the decomposition of
hydroxyethyl cellulose (HEC) and removal of structurally adsorbed water. Beyond 540
°C, there is no obvious weight loss in the TGA curve.
128

Chapter I V
In the DTA curve (4.1.12b) an endothermic peak at 106 °C corresponds to the
elimination of physically adsorbed water. The exothermic peak at 205 °C is due to the
loss of nitrate. The exothermic peak at 370 °C corresponds to the decomposition of
hydroxyethyl cellulose (HEC).
Figure 4.1.13 shows the TGA and DTA curves of the unsupported titania membrane (1%
HEC + 0.2% Titania) dried at 50 °C and at 60% relative humidity for 24 h.
110 “Peril | - | - -t ' |100 + b '10“lJ \L###,M" _
90 * p— 5070T =_. 1 '°60 -F _50 "' -5040 — 3 .
Wt oss (%)QO
endo exo
301! ‘- - I - 1‘ -re-— 1 - a‘"**i' -1000 200 400 600 800 1000Temperature (°C)
Figure 4.1.13. TGA and DTA curves of 1% HEC-0.2% Titania composition.
In the TGA curve (4.1.13 a), percentage of weight loss is 17% up to 185 °C,
which is the results of elimination of physically adsorbed water. The percentage weight
loss between 186 to 220 °C is 1.22% which is due to the loss of nitrate. The percentage
weight loss from 221 °C to 500 °C is 43% due to consequence of decomposition of
hydroxyethyl cellulose (HEC) and removal of chemically coordinated water. There is no
major weight loss observed after 500 °C. In the DTA curve (4.1.l3b), endothermic peak
centered around 100 °C is the result of removal of physically adsorbed water. The
129

C haprer I V
exothermic peak at 190 °C corresponds to the loss of nitrate. The exothermic peak at 320
°C results from the decomposition of hydroxyethyl cellulose (HEC).
4.1.4.5 X-ray diffraction analysis
Powder X-ray diffraction pattern of unsupported alumina membrane (1.5% HEC
+ 0.4% Boehmite) calcined at 800 °C for 5 h is shown in Figure 4.l.l4(a). The peaks
correspond to the y- alumina formed on calcination. The XRD pattem is not sharp due to
the spinel structure of y- alumina formed.“
400350 — y300 _ A 4250 - I Y
IntensityIQGQ
Y I150- I100- I *‘I50 . . I “di W b01 ' I ‘ I ' I ' I ' I ' I ' I10 20 30 40 50 60 70 80
26 (degree)
Figure 4.1.14. XRD pattem of (a) unsupported alumina membrane calcined at 800 °C for
5 h (b) unsupported titania membrane calcined at 500 °C for 3 h (A) anatase (y) alumina .
The XRD pattem of unsupported titania membrane (1% HEC + 0.2% Titania) calcined at
500 °C for 3h is shown in Figure 4.1.14 (b). The broad peak at 29 value 25.3° is the
characteristic (101) plane peak of nanocrystalline anatase titania. From these
observations, we can conclude that a y- alumina intermediate layer and a nanocrystalline
I30
Chapter IV
titania top layer were formed in the porous alumina support during the fabrication of
membrane layer.
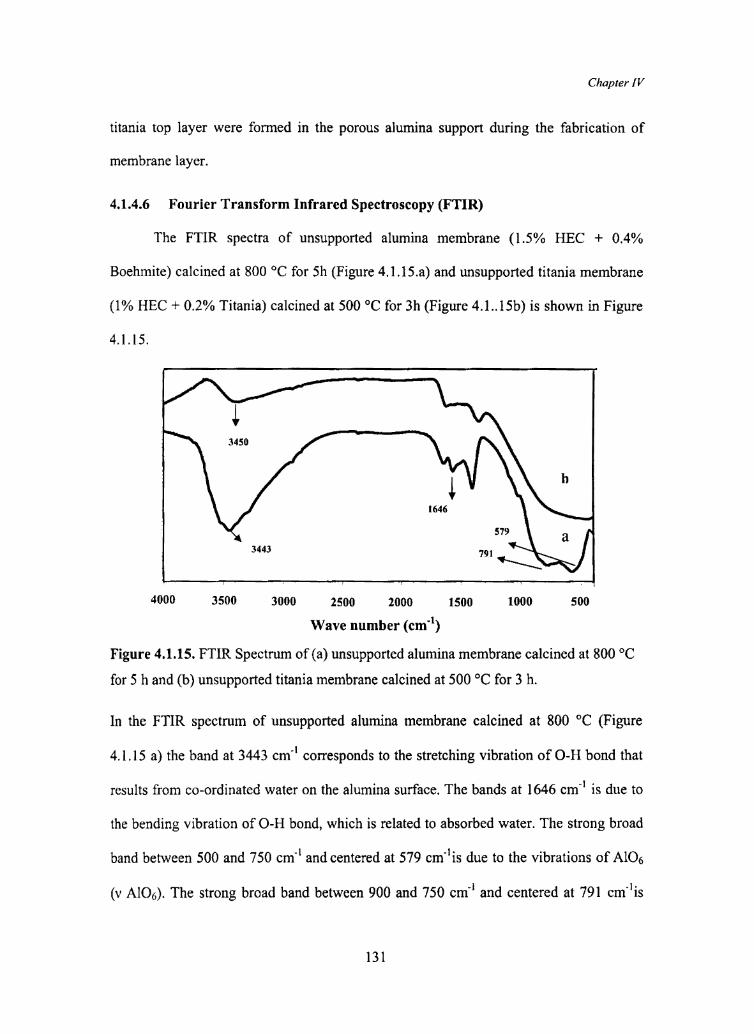
4.1.4.6 Fourier Transform Infrared Spectroscopy (F TIR)
The FTIR spectra of unsupported alumina membrane (1.5% HEC + 0.4%
Boehmite) calcined at 800 °C for 5h (Figure 4.1.15.a) and unsupported titania membrane
(1% HEC + 0.2% Titania) calcined at 500 °C for 3h (Figure 4.1..15b) is shown in Figure
4.1.15.
3450 L h1646
579 £1 .. 3443.i 191$4000 3500 3000 2500 2000 1500 1000 S00
Wave number (cm'1)
Figure 4.1.15. FTIR Spectrum of (a) unsupported alumina membrane calcined at 800 °C
for 5 h and (b) unsupported titania membrane calcined at 500 °C for 3 h.
In the FTIR spectrum of unsupported alumina membrane calcined at 800 °C (Figure
4.1.15 a) the band at 3443 cm" corresponds to the stretching vibration of O-H bond that
results from co-ordinated water on the alumina surface. The bands at 1646 cm'l is due to
the bending vibration of O-H bond, which is related to absorbed water. The strong broad
band between 500 and 750 cm'l and centered at 579 cm"is due to the vibrations of A106
(v A106). The strong broad band between 900 and 750 cm" and centered at 791 cm"is
131

Chapter IV
assigned to the \/A104 vibrations.” From this observation, it is concluded that both
octahedral and tetrahedral alumina species are present in the system.
The FTIR spectrum of titania 4.1.15 (b) shows bands at 3450 cm" and 1626 cm" which
corresponds to the stretching and bending vibrations of hydroxyl group. The band below
1000 cm" is due to the stretching vibrations of Ti-O-Ti network.“
4.1.4.7 BET Surface area analysis
The adsorption isotherm and pore size distribution curve of unsupported alumina
membrane calcined at 800 °C for 5h are shown in Figure 4.1.16 (a) and (b) respectively.
The adsorption isotherm is of type IV which is characteristic of mesoporous material. The
pore size distribution curve is bimodal, one is below 6 nm (60 angstrom) and other one is
below 40 nm (400 angstrom). An average pore diameter of 10.5 nm is obtained.
200 ~ W ~ [AI80 /' ‘0.30_ 160 I: ns- I140 % mi / ‘_ I
V0 ume Adsorbed (Cm3g )
E EPor¢\'o um in
5 in
‘-.
lg-\\
I.l5 '1 I r- " .80 mi i Hwib 077?
l'ortDi||nctcr°Aso /V,- 40 fr"._..-I20 l/
I,.--I
0 - M1 "*1 | ,——~ | 1 - ‘|"‘ _|0.0 0.2 0.4 0.6 0.8 1.0Relative Pressure (P/Po)
Figure 4.1.16. (a) Adsorption isotherm and (b) Pore size distribution curve (inset) of
unsupported alumina membrane calcined at 800 °C for 5 h.
132

Chapter IV
The adsorption isotherm and pore size distribution curve of unsupported titania
membrane calcined at 500 °C for 3h are shown in Figure 4.1.17 (a) and (b) respectively.
The adsorption isotherm is of type IV which is characteristic of mesoporous material. The
pore size distribution curve is bimodal, one is below 4 mn (40 angstrom) and other one is
below 30 mn (300 angstrom). An average pore diameter of 13 nm is obtained.
180. __ ~ - pp .7 "' 1160 0.4 g V / D_._ 0.3 - § E
7"“ 140 '1-g .E 0.2.?
§2 1L 1 I0.03° . '1'.‘ ' """.'.a. " '60 Pore Diameter us‘) ///II
Volume Adsorbed (cmag3 BQ Q
40 If20 I...----'""' '0 i l -"i ‘ i 1?? | u ii i0.0 0.2 0.4 0.6 0.8 1.0
Relative Pressure (P/P0)
Figure 4.1.17. (a) Adsorption isotherm and (b) Pore size distribution curve (inset) of
unsupported titania membrane calcined at 500 °C for 3 h.
Table 4.1.5. Surface area results of unsupported alumina membrane calcined at 800 °C
for 5 h & unsupported titania membrane calcined at 500 °C for 3 h.
if 8 8 8% BETMSurface Y Total Pore“ 8 Average Pore8 Area (mzg ") Volume Diameter1 1 n <¢m’g") 1 (um)
Uinsupported alumina membrane 108.3 in 0.2848 10.5calcined at 800 °C for 5h i' 7' I
p Unsupported titania membrane E 76.7 0.2498 13.0ii calcined at 500 °C for 3hJ ,3. - H-.. i M
133

Chapter 1 V
The surface area results are given in Table 4.1.5. From these observations it is concluded
that a mesoporous alumina and titania multi layer membrane are successfully formed on
the porous alumina support.
4.1.4.8 Scanning Electron Microscopy (SEM)
The morphological features of uncoated and coated substrates can be studied by
Scanning Electron Microscopy (SEM). The SEM pictures of uncoated and alumina
coated alumina substrates are shown in Figures 4.1.18 (a) and (b). The fracture of the
alumina coated substrate is provided in Figure 4. 1 .18(c).
Figure 4.1.18. SEM images of (a) porous alumina surface (uncoated) (b) alumina coated
surface (c) fracture of the coated porous alumina substrate.
The integrity of the membrane layer and its incorporation with the porous A1203 substrate
are crucial factors in the fabrication of defect-free membrane since even few cracks, pin
134
Chapter I V
holes or breakage of weak joints can cause failure of the separation efficiency. Examining
the SEM images (plain view) of membrane layer shown in Fig. 4.l.l8b we observe that
this method is successful to fabricate membrane layer with good integrity and without
significant cracks or pin-holes.
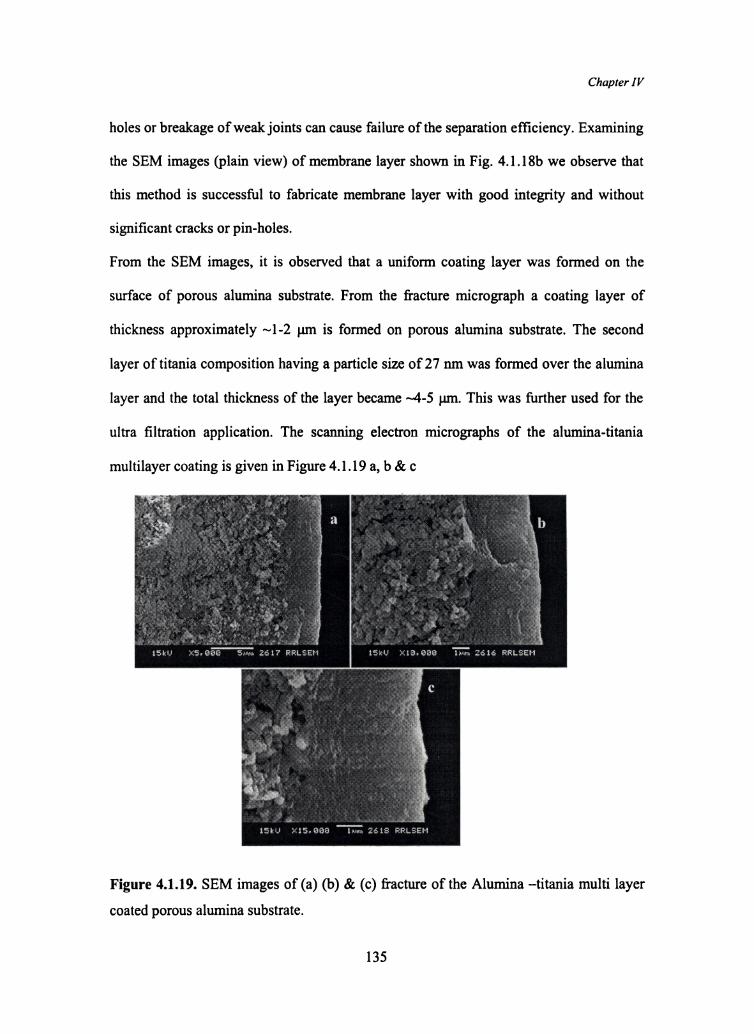
From the SEM images, it is observed that a uniform coating layer was formed on the
surface of porous alumina substrate. From the fracture micrograph a coating layer of
thickness approximately ~l-2 um is formed on porous alumina substrate. The second
layer of titania composition having a particle size of 27 mn was formed over the alumina
layer and the total thickness of the layer became ~4-5 um. This was further used for the
ultra filtration application. The scamiing electron micrographs of the alumina-titania
multilayer coating is given in Figure 4.1.19 a, b & c
Figure 4.1.19. SEM images of (a) (b) & (c) fracture of the Alumina —titania multi layer
coated porous alumina substrate.
135

Chapter I V
4.1.4.9 Filtration studies
The multi-layered membrane fabricated with alumina as intermediate layer and
titania as top layer was used for cross-flow filtration studies. Congo red (696.66 g/mol), a
red coloured dye, was dissolved in water (200 mg / l) and used as the colouring agent in
the feed. The molecular structure of the Congo red dye is given in Figure 4.1.20. The
filtration was performed for 10h and the flux was measured at 15 minute intervals. An
average flux rate of 40 l/m2.h.b is obtained. The permeation flux versus time curve is
given in Figure 4.1.21. This flux rate is comparable to the flux rate observed in other ultra
filtration membranes.”
NH2Q 0“N N{Q O »0;/s\ NQ
HZN
Figure 4.1.20. Molecular structure of Congo red
The filtrate collected after 10h of filtration was analyzed by UV-Visible spectroscopy for
determining rejection rate of membrane in the case of Congo red. A standard plot
showing concentration Vs. absorbance of the standard samples is shown in Figure 4.1.22.
The absorbance of the filtrate was compared with the standard curve. An absorbance
value of 0.061 was observed and from the standard plot, concentration of Congo red in
the filtrate was found to be 1.2743 mg / l.
I36

rate (I/mz.h.bar)Fux
100
l20- 80
60' I
I40
20
01 -I— |iI- | I | I | I | I | I0 100 200 300 400 500 600Time in minutes
Chapter IV
Figure 4.1.21. Permeation flux of alumina-titania multilayer membrane during cross flow
filtration with Congo red.
flfifl
Abs
1
[]_|
0.
0.
[15
Standard
0.....0.000 2.[Il0 4.011] 8.000 BHII 10.['lJ0
mg/I
Figure 4.1.22. Standard curve of Concentration (mg/1) vs. Absorbance of congo red dye.
The membrane prepared through the present method showed a very high rejection
(~99%) of ‘Congo Red’ (mol. wt.696.66 g/mol). From these measurements a cut-off
value of around 1000 Da can be deduced.31
137
Chapter I V
4.1.5 Conclusions
Successful fabrication of alumina-titania multi-layer ceramic membrane on
porous alumina substrates was achieved. The coating compositions prepared from
boehmite and titania sols with hydroxyethyl cellulose (HEC) as binder were characterised
by viscosity measurements, TGA and DTA. Unsupported membranes were prepared and
their cracking behaviour was studied. The composition which corresponds to crack~free
thin layers was chosen for coating on substrates; The membranes were characterised by
XRD, FTIR and Surface area measurements. The morphological features of the
membranes were studied using Scanning Electron Microscopy. The filtration property of
the membrane was examined by filtration test using congo red as a colouring agent.
About 99.3% rejection was observed with congo red. A membrane layer having a
molecular cut off value around 1000 Da was developed.
138

Chapter IV
4.2 Development of Photoactive Titania Coating on Glass Surfaces
4.2.1 Abstract
A uniform nanolayer of alumina doped titania coating has been developed on
glass surface through an aqueous sol-gel method starting from titanylsulphate and
aluminium nitrate as precursor. The thermo gravimetric analysis has been used to
study the decomposition characteristic of coating precursor. The UV-Visible
absorption spectnlm shows that the absorption edge is blue shifted in the presence of
alumina in the titania matrix. Scanning Electron Micrographs show that a uniform
thin layer was formed on the glass surface. The Type IV behaviour shown by the
pure and alumina doped titania powder indicates the mesoporous nature of the titania
thin film formed on the glass surface. The 10 mol% alumina doped titania coating
powder shows two times higher surface area than pure titania powder. Anatase phase
was detected in both pure and 10 mol% alumina coated samples by Raman spectra.
The alumina doping increases the photoactivity of titania film and the maximum
photoactivity is observed for 2 mol% alumina doped titania film.
4.2.2 Introduction
Titania films have attracted attention due to their applications in anti-bacteria1,38‘
3° self-sterilizing,“ 4‘ self-cleaning,” antisoiling and antifogging coatings. or the
different polymorphic fomis of titania, anatase was found to be more photo catalytic
active and useful in such type of coatings. For the fabrication of these titania thin layer,
sol-gel method was found to be a promising one.43’ 44 The deposition of TiO; film by sol
gel method has been reported by few authors.4548 Almost all sol-gel process start from
alkoxide precursor. But for the bulk production of these coating an alkoxide process is
139
Chapter I V
not found to be economically viable. Kishimoto et al. demonstrated the wettability of
titania coating films by sol-gel method using anaqueous solution of Ti(SO)4 containing
polyvinyl pyrollidone (PVP) as the coating solution.” Ichinose et al.50' 5' demonstrasted
the proparation of peroxo titanic acid (PTA) sol derived from TiCl4 for the preparation of
titania film. Lee et al.52 prepared and characterised peroxo titania sol from TiCl3. Ge et
a1.53 prepared the autoclaved sol for the preparation of titania film using titanyl sulphate
and H202. To best of our knowledge no work has been reported for the preparation of
alumina doped titania film using simple aqueous sol-gel method. So in the present study
an aqueous sol-gel method was developed for the preparation of titania film doped with
alumina. Further it was characterized using scanning electron microscopy, atomic force
microscopy and photoactivity studies.
4.2.3 Experimental
Titanyl oxysulphate (TiOSO4, Aldrich Chemicals, 99.99% purity) was used as
precursor for the synthesis of titania sol. In a typical experiment, titanyl oxysulphate was
dissolved in 500 ml of distilled water (0.2 M) and hydrolysed by slow addition of
ammonium hydroxide (10%, sd Fine chemicals, India Ltd) solution under constant
stirring at room temperature (32 OC), until the reaction mixture attained pH 8.5. The
precipitate obtained was separated by filtration and was washed free of sulphate ions
(confirmed by the BaCl; test) with distilled water. The precipitate was further dispersed
in 1000 ml of hot distilled water and was peptised by the addition of 10% HNO3 (Merck,
India Ltd) solution. A stable sol was obtained at a pH range 1.7 to 2.2. To the stable sol 1,
2, 5 and 10 mol % alumina is added as boehmite sol using Al (NO3)3. 9H2O (sd Fine
Chemicals, India Ltd) as a precursor, which was prepared by a procedure reported
140

Chapter 1 V
earlier.“ To the undoped and alumina doped titania sol, 2 wt% polyethylene glycol was
added. The resultant sol was coated on glass surfaces using a dipcoater machine (KSV
dipcoater, Finland). Before the deposition, glass substrates were cleaned in concentrated
sulphuric acid, distilled water and then absolute ethano1.TiO2 thin film was deposited on
substrate by a dip-coating process at room temperature with the withdrawing speed of
about 2 cm/min. Substrates were immersed into the TiO; sol for lmin. Upon withdrawing
from the sol, the substrates‘ were dried at 70 °C. The corresponding dried gels were
further characterized using Thermogravimetric analyzer (Shimadzu, TGA 50H, Japan).
The coated glass slides were calcined at 400 °C for 3h at a heating rate 1°C per min.
XRD pattems of the calcined gels were taken in a Philips X’ pert X-ray diffractometer in
the diffraction angle 20 range 20-60° using Cu Ka radiation. The crystallite size was
calculated using Scherrer equation 4.2.1.
¢=K)t/ficos6 (4.2.l)where K is the shape factor taken as 0.9 for the calculations presented, /1 the wavelength
of the X-ray, ,6 the full width at half maxima, and 6 the diffracting angle.The surface
morphology of dried TiO2 thin film was observed by a Scanning electron microscope
(SEM JEOL JSM-6700F) and Atomic Force Microscope (Topometrix Inc.) in contact
mode using a silicon tip (Mikro Masch Inc., Estonia) of length: 350 um, width: l0 um,
heightzl um, and an end-curvature radius < 10 nm. Spectroscopic analysis of the TiO2
film was performed using UV-Visible spectrophotometer (Shimadzu UV 2401) in the
wave length range of 200-800 nm. The surface area measurements and pore size analysis
were carried out by nitrogen adsorption using Micromeritics Gemini 2375 surface area
analyser after degassing each sample at 200 °C for 2 h. Raman spectra of the samples was
l4l

Chapter 1 V
taken using a FT- Raman spectrometer (Bruker IFS66V). Methylene blue degradation
was used for the determination of photocatalytic property of titania film. In presence of
titania film, methylene blue solution shows photo catalytic degradation. In a typical
experiment, coated glass plates were dipped in an aqueous solution of methylene blue dye
(AR Grade, Qualigens Fine Chemicals, India Ltd) for one hour. It was dried in dark, and
irradiated with ultraviolet light in a UV chamber with wavelength range from 200 to 400
nm (Rayonet Photo reactor, The Netherlands). The degradation of the dye was monitored
after 60 min using UV-Visible spectrometer (Shimadzu, Japan, UV-2401 PC).
4.2.4 Result and Discussion
4.2.4.1 Thermogravimetric analysis
Thermogravimetric analysis shows (Figure 4.2.1) that the coating solutions dried
at 70 °C undergo three decomposition steps between the analysed temperature 30 to 1000
°C. Thermo gravimetric analysis curve shows similar decomposition patterns for pure
titania coating solution and the 10 mol% alumina doped titania coating solution. But 10
mol% alumina doped titania coating solution shows slight increase in the total weight
loss. Pure titania coating solution dried at 70 °C undergoes a total weight loss of 23%,
whereas 10 mol% alumina doped titania coating solution results in a total weight loss of
27.5%. The weight loss below 150 °C is due to the removal of loosely bound water in the
gel network. The decomposition step between 200 and 400 °C is due to the
decomposition of nitrate ions, dehydroxylation of the gel and removal of the polyethylene
glycol used in the coating solution. The % of weight loss is 15.4 and 16.6% respectively
for titania and 10 mol% alumina doped titania compositions in the temperature range 200
to 400 °C. Weight loss between 400 and 1000 °C is extremely small and, hence, a lack of
142

Chapter IV
clear decomposition step. The higher weight loss in titania—alumina samples may be due
to the boehmite species incorporated in the titania gel network. The similarity in the
decomposition pattern of alumina doped samples with pure titania may be an indication
of the higher degree of homogeneous dispersion achieved between titania and alumina in
the doped system through the mixing of the respective colloidal sols.
100 -§
95 -=
l90 -—»
(%)
85 —! 1
Wt loss
l
ad
80 -,75- b70 -rfiffi *-""‘" '1 - | - I - I -i0 200 400 600 800 1000
Temperature (°C)
Figure 4.2.1. TGA curve of coating solution (a) titania (b) 10 mol% alumina doped
titania.
4.2.4.2 X-ray diffraction analysis
The X-ray diffraction analysis (Figure 4.2.2) indicated that only anatase phase
was present in pure and alumina doped titania samples. The crystallite size decreases with
increase in the alumina content in the titania matrix (Table 4.2.1). It was 11.3 nm in pure
titania and it decreases to 8.1 nm in case of 10 mol% alumina doped titania. The alumina
in the titania matrix effectively hinders the crystallite growth of titania.
143

Chapter I V
c 1l1 ll a 1r
lL,\,_./\__,,_J\_J\L,j\_J\j_W
26 (degree)
Intensity (A. U)
31 L L L3
S
%
Figure 4.2.2. X-ray diffraction pattern of coating solution calcined at 400 °C for lh (a)
titania (b) 1 mol% alumina doped titania (c) 2 mol% alumina doped titania (c) 5 mol%
alumina doped titania (d) 10 mol% alumina doped titania
Table 4.2.1 Crystallite size data of alumina doped titania
“sample Crystallite size (ntnji 2 1' TiO2 5 11.28
7TiO;>+lmol% A1203 {£5.78 2TiO2 4231151"/0 A1203 ‘ 10.11 r
T102 + 5 mol% A1203‘ TiO2 + 10 mol% A120; 8.06
4.2.4.3 UV-Visible spectrophotometry
Pure and alumina doped titania thin films deposited on glass substrates calcined at
400 °C are transparent. The corresponding UV-Vis transmittance spectra and Tau plot
144
Chapter I V
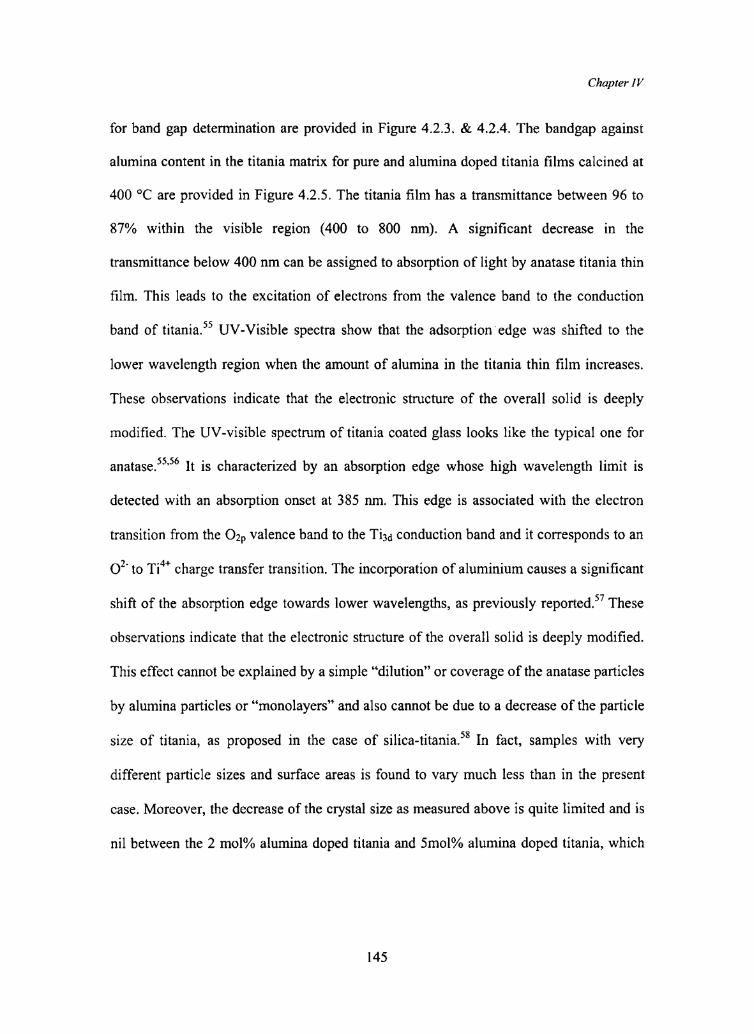
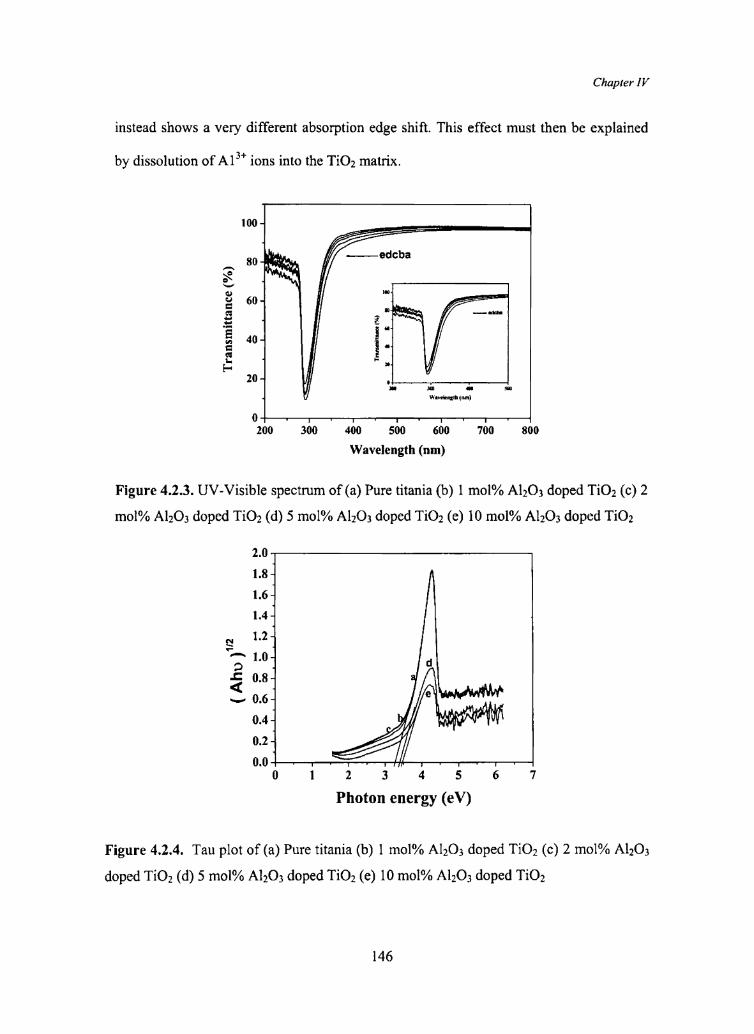
for band gap determination are provided in Figure 4.2.3. & 4.2.4. The bandgap against
alumina content in the titania matrix for pure and alumina doped titania films calcined at
400 °C are provided in Figure 4.2.5. The titania film has a transmittance between 96 to
87% within the visible region (400 to 800 nm). A significant decrease in the
transmittance below 400 nm can be assigned to absorption of light by anatase titania thin
film. This leads to the excitation of electrons from the valence band to the conduction
band of titania.“ UV-Visible spectra show that the adsorptionedge was shifted to the
lower wavelength region when the amount of alumina in the titania thin film increases.
These observations indicate that the electronic structure of the overall solid is deeply
modified. The UV-visible spectrum of titania coated glass looks like the typical one for
anatase.55‘56 It is characterized by an absorption edge whose high wavelength limit is
detected with an absorption onset at 385 nm. This edge is associated with the electron
transition from the 02p valence band to the Ti3d conduction band and it corresponds to an
02' to Ti4+ charge transfer transition. The incorporation of aluminium causes a significant
shift of the absorption edge towards lower wavelengths, as previously reported.” These
observations indicate that the electronic structure of the overall solid is deeply modified.
This effect cannot be explained by a simple “dilution” or coverage of the anatase particles
by alumina particles or “monolayers” and also cannot be due to a decrease of the particle
size of titania, as proposed in the case of silica-titania.58 In fact, samples with very
different particle sizes and surface areas is found to vary much less than in the present
case. Moreover, the decrease of the crystal size as measured above is quite limited and is
nil between the 2 mol% alumina doped titania and 5mol% alumina doped titania, which
145
C haprer I V
instead shows a very different absorption edge shift. This effect must then be explained
3by dissolution of A1 + ions into the TiO;; matrix.
I00
Transmittance (%)
i
20-—
so %60 .40 4 ‘ . 4 =
---edcba
1'3 ._....qu-1IQ
\—v
Q1
rnn1ntannc%
9
T
Wavelength (nm)
..~-~~ — , ~ - - It JU Q Q0'1 - I - "I 1 * "tee" to I ' 1200 300 400 500 600 700 800
Wavelength (nm)
Figure 4.2.3. UV-Visible spectrum of (a) Pure titania (b) 1 mol% A1203 doped TiOg (c) 2
mol% A1203 doped TiO; (d) 5 mol% A1203 doped TiO2 (e) 10 mol% A1203 doped TiO;
2.0 ~1
1.8
1.6
1.4
Q 1.2 t"A 1.0.2 03< O
1
~.- 0.60.4 —
0.2 Ti
H‘I
‘W0.0 J
0
I ./G
* - ~*+"--~- : - st” *"e , .l 2 3 4 5 6 ‘I7Photon energy (eV)
Figure 4.2.4. Tau plot of (a) Pure titania (b) 1 mol% A1203 doped TiO; (c) 2 mol% A1203
doped TiO; (d) 5 mol% A1203 doped TiO; (e) 10 mol% A1203 doped TiO2
146
Chapter 1 V
3.50 V
3.45 -i~
Bandgap (eV)bl U-P U)L.» I» 1..
- I3.25
moi e - e 1 * -at o |--- -ofl—-- 1 40 2 4 6 8 I0Alumina (mol%)
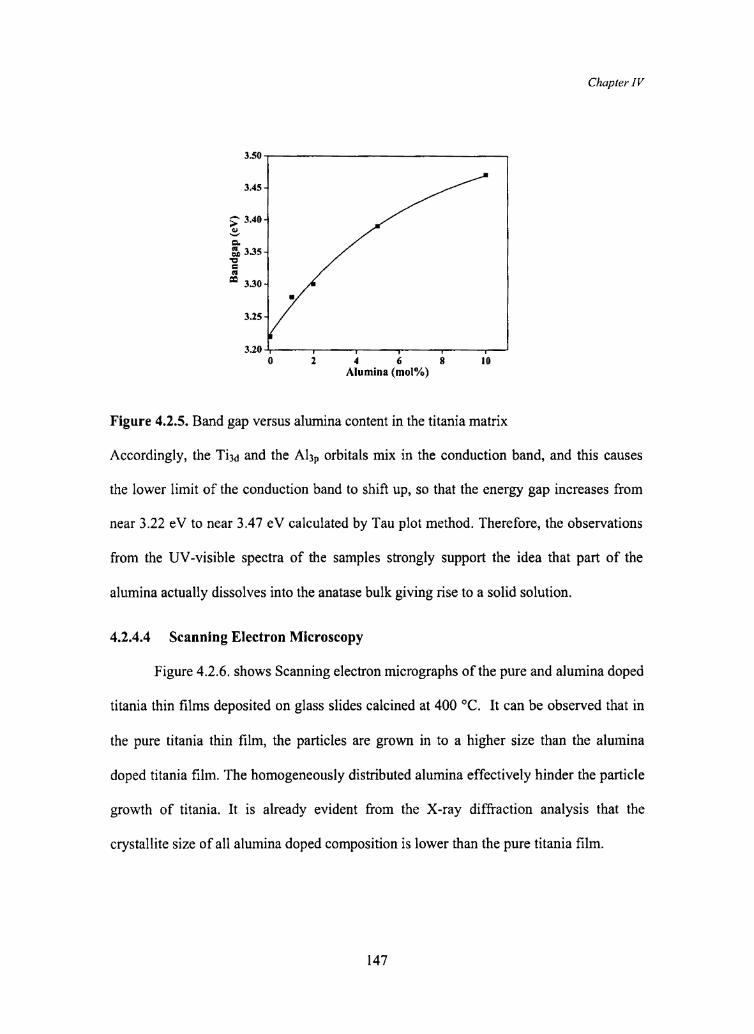
Figure 4.2.5. Band gap versus alumina content in the titania matrix
Accordingly, the Ti3d and the A13!) orbitals mix in the conduction band, and this causes
the lower limit of the conduction band to shift up, so that the energy gap increases from
near 3.22 eV to near 3.47 eV calculated by Tau plot method. Therefore, the observations
from the UV-visible spectra of the samples strongly support the idea that part of the
alumina actually dissolves into the anatase bulk giving rise to a solid solution.
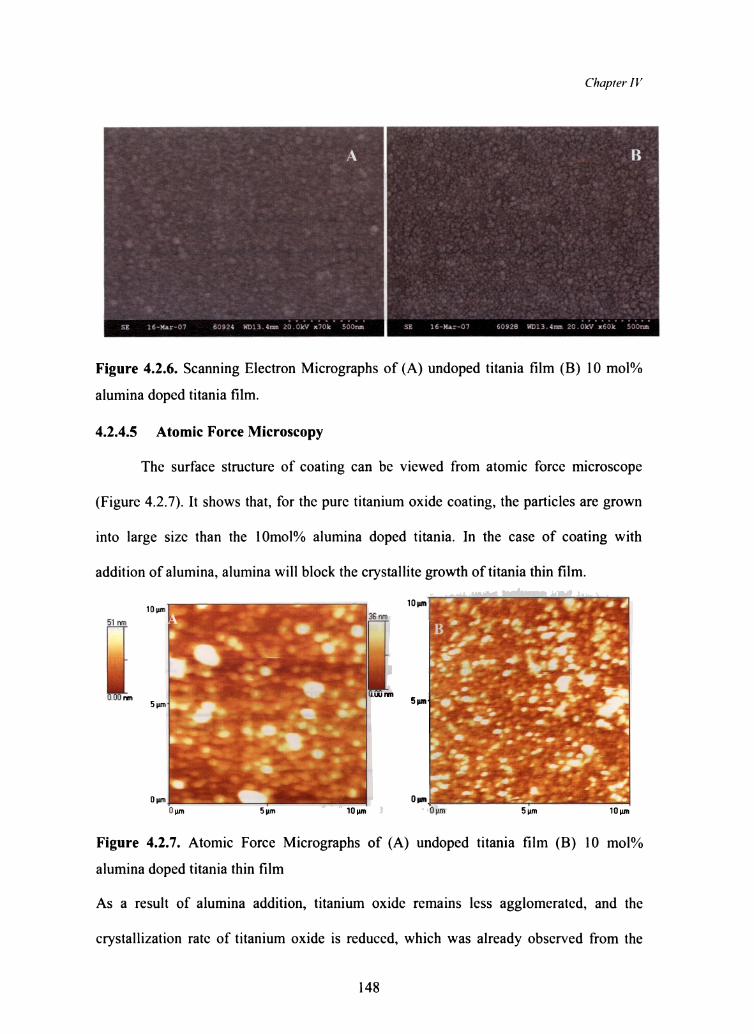
4.2.4.4 Scanning Electron Microscopy
Figure 4.2.6. shows Scanning electron micrographs of the pure and alumina doped
titania thin films deposited on glass slides calcined at 400 °C. It can be observed that in
the pure titania thin film, the particles are grown in to a higher size than the alumina
doped titania film. The homogeneously distributed alumina effectively hinder the particle
growth of titania. It is already evident from the X-ray diffraction analysis that the
crystallite size of all alumina doped composition is lower than the pure titania film.
147
Chapter I V
__ lFigure 4.2.6. Scanning Electron Micrographs of (A) undoped titania film (B) 10 mol%
alumina doped titania film.
4.2.4.5 Atomic Force Microscopy
The surface structure of coating can be viewed from atomic force microscope
(Figure 4.2.7). It shows that, for the pure titanium oxide coating, the particles are grown
into large size than the l0mol% alumina doped titania. In the case of coating with
addition of alumina, alumina will block the crystallite growth of titania thin film.
L 4 i— ii _ 1 Y‘ —-L -Ir ~ ’ —4 _ . ‘ r .1» 7 '1\ ‘Q " v ‘ _ ._ . ‘l M ~* ,"-0 ’ ‘r, I h M:51 m H ‘ h 'l> ‘.‘ A ‘ ‘ ._' I: ~_ ' ' 31*‘ " 7' .
- 1'_ ti
at‘I
. !'\ 4050"‘
,p
. db‘
*~; .- ‘l_ .‘ 11- -‘ v-l _ .1-I " ’:"' ‘.1 _ _ Q ‘ A —Ar‘ - x B . ‘ 1 U ‘ I M 5 ‘J I" .7 7 " L?" 1- Pr‘-‘ ‘ Q I 4. v v JI ‘R ____ _g ~:-fir ~ ‘0 N“ ' V l Illi = A “ yd H- 5um_ ' w-Jr” ‘ ‘ ‘fig ' -.‘ ‘‘ ‘ ‘ ‘ | iv- 4",‘: ‘Q’ g —€ _-4 .»h _ - "Vi, ‘ " » _ 1' . .- "- - v H "t-1i t .¢l 0 _‘ i 5.‘L. 4,$- _,,,,. . ,_ as - .,...s _, .d \i“ _.*¥' 4? i I '~ ”~ ‘J .. A .} D in A r V’ _ 1 l ,
Uwnfifii , 0um,___?"»" i..._.‘ ,‘.7__..._.______,i'» *5 * *Gum 5|.lm 1U|lm Gum Sum 10umFigure 4.2.7. Atomic Force Micrographs of (A) undoped titania film (B) 10 mol%
alumina doped titania thin film
As a result of alumina addition, titanium oxide remains less agglomerated, and the
crystallization rate of titanium oxide is reduced, which was already observed from the
148

Chapter 1 V
crystallite size data obtained from X-ray diffraction. The thickness of the titania layer
fonned on the glass surface was found out to be ~50nm.
4.2.4.6 BET specific surface area analysis
Textural characteristics of the pure and alumina doped titania thin film
composition calcined at 400 °C were derived from N2 adsorption analysis. Specific
surface area (S351), total pore volume calculated at p/pg = 0.9, BJH mesopore volume and
micro pore volume which were calculated by t-plot method and average pore diameter
value are presented in Table 4.2.2. The adsorption isotherms (Figure 4.2.8) of all samples
show type IV behaviour with the typical hysteresis loop. This hysteresis loop is
characteristic of mesoporous materials 59 and it infers that the mesoporous thin layer is
formed on the glass substrate. Surface area results shows that all the doped titania
samples have higher surface area than the undoped one after calcinations at 400 °C. In the
case of pure titania it is 72 m2g'l and for l0 mol% alumina doped titania it is 152 m2g"
which is two times higher than the undoped titania. The total pore volume and mesopore
volume increased as the alumina content in the titania matrix is increased.
Table 4.2.2. Textural characteristics of the pure and alumina doped titania thin film
composition calcined at 400 °C derived from N2- adsorption analysis.
Sample Surface area Total pore volume Average Pore
(m2g") (cm3g") t Diameter (nm)7 TiO2 T 72.33 0.1477 7.5 1Ti02+ 1 mol% A1202, 87.5 0.1598 7.3
TiO2 +2 mol% A1203 95.8 0.1728 7.2 l5 Ti02 + 5 mol% A1202 125.0 0.1978 6.3
y TiO2=—iF“l0mol% A1202 a 152.4 0.5116 5.6
149

Figure 4.2.8. Adsorption-desorption isotherm of (I) Pure titania (0) 1 mol% A1203
doped Ti02 (A) 2 mol% A1203 doped Ti02 (V) 5 mol% A1203 doped Ti02 (6) 10 mol%
A1203 dOp€d
8)
1'1
ume adsorbed (cm
Ii
V0Pore V0 ume (cmsg )
i
j
1.5-1.A
Q 1-Ain ‘cal - L4
0Xigiii iiw ~ ‘go
‘u /V/V0.0 §"9## i
'1'; it
'\x:E\\
-1
'\-§_
140 -V
120 / *- ""’°"'V'V..i.so? /¢/all ..; pi
1
|
0--1- ‘F~ 1— . ;— - ~ I | W0.0 0.2 0.4 0.6 0.8 1.0Relative Pressure (PIPO)
TE_ __ _1‘$3
' '0 ' I 70 -of10 ' ' 100Pore Diameter (A0)
Chapter IV
Figure 4.2.9. Pore size distribution curve of (I) Pure titania (0) 1 mol% A1203 doped
Ti02 (A) 2 mol% A1203 doped Ti02 (V) 5 mol% A1203 doped Ti02 (6) 10 mol% A1203
doped Ti02
150
Chapter I V
The pore size distribution curve (Figure 4.2.9) shows that pores are in mesoporous region
and as alumina content increases, the poresize shifted further to lower region, which
indicates that the alumina in titania matrix effectively hinders the pore size growth. In
adsorption isotherm there was no tailing upward at higher relative pressure and this
shows the formation of long-range order mesoporosity without any contribution of large
pores beyond mesopore scale (>50 nm).59
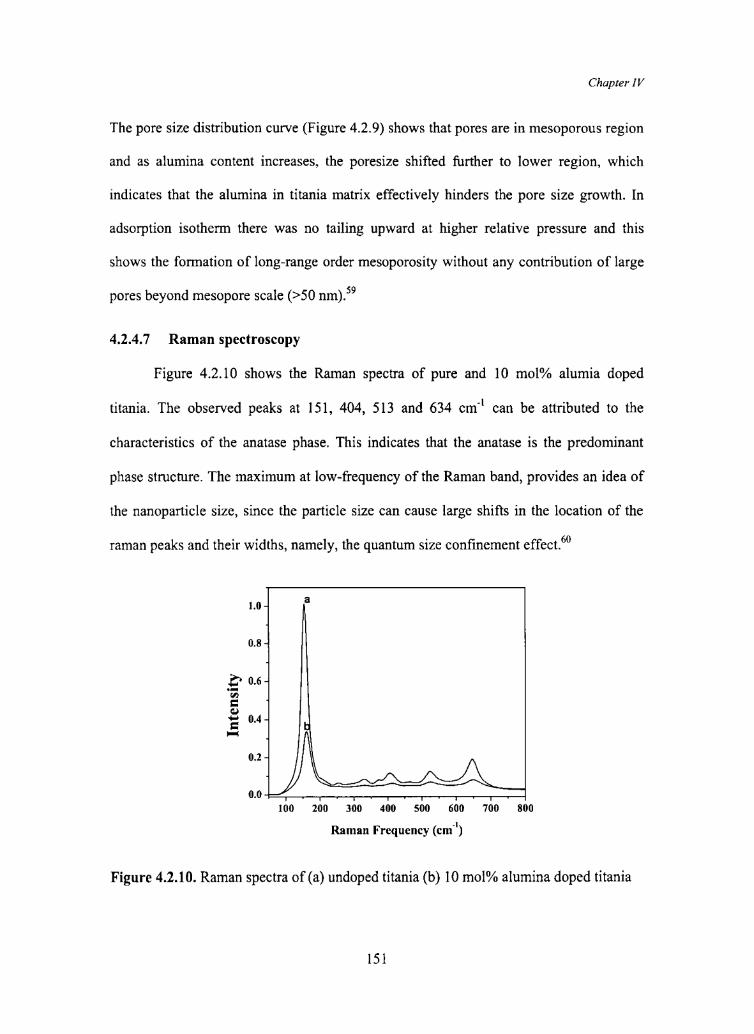
4.2.4.7 Raman spectroscopy
Figure 4.2.10 shows the Raman spectra of pure and 10 mol% alurnia doped
titania. The observed peaks at 151, 404, 513 and 634 cm" can be attributed to the
characteristics of the anatasc phase. This indicates that the anatase is the predominant
phase structure. The maximum at low-frequency of the Raman band, provides an idea of
the nanoparticle size, since the particle size can cause large shifts in the location of the
raman peaks and their widths, namely, the quantum size confinement effect.“
1.0 — |a
0.8 “.1 4R»
-1
IntensityP PA O\
i r,_ ______..-—Q _ ii
0-0 | .""" |——:‘ r—‘—". | 1—-- i- -- 1- 1 1 | 1100 200 300 400 500 600 700 800
Raman Frequency (cm")
Figure 4.2.10. Raman spectra of (a) undoped titania (b) 10 mol% alumina doped titania
151

Chapter I V
The lowest frequency peak is at 151 cm“ for undoped titania. It can also be evidently
seen that the width of this peak increased and resulted in blue shift to 160 cm" in the case
of 10 mol% alumina doped titania. This is due to the lower crystallite size of the sample
than the undoped titania.“
4.2.4.8 Photo catalytic activity studies
Photoactivity of the titania film was measured using methylene blue degradation
studies. The photocatalytic activity of pure titania and titania doped with alumina
coatings was studied using the methylene blue degradation technique. Methylene blue
shows considerable degradation in presence of titania coating. The degradation was
followed through UV spectral measurement. The efficiency of degradation of methylene
blue was plotted against alumina content in titania and is given in Figure 4.2.11. It was
observed that upto 2 mol% alumina doping, the photoactivity increases and then
decreases as the doping concentration of alumina is increased.
407
Efficiency (%)2 is. 4 . __; ; . .i
4
+1;
-.
l
10- ‘ A0_l :* ._ _0 2 4 6 8Mol(%) of alumina in titania matrix
Figure 4.2.11. Methylene blue degradation efficiency against alumina concentration in
titania matrix.
152

Chapter IV
The excessive doping makes the space charge layer very narrow so that the penetration
depth of light into TiO2 greatly exceeds the thickness of the space charge layer, resulting
in easy recombination of electron-hole pairs and poor photoactivity.62 This may be one of
the reasons for the lower activity of 5 and l0 mol% aluminium doped titania.
4.2.5 Conclusions
An aqueous sol-gel method was developed for the preparation of alumina doped
titania thin film. X-ray diffraction analysis indicates that the anatase layer was formed on
the glass surface. Titania coatings having transmittance between 85 to 95% were
developed on the glass surface using dip coating technique. The alumina addition leads to
increase in band gap. Scamiing electron micrographs indicates that a uniform thin layer of
titania coating was formed on the glass surface. Atomic force micrographs indicate that
undoped titania particles were grown into larger size than the 10 mol% alumina doped
titania. The thickness of the coating was ~50 nm. Mesoporous nature of the titania layer
formed was evident from BET surface area analysis. The pore stability was achieved by
alumina doping. Raman spectra were used to confirm the exclusive presence of anatase
phase in the coatings. The coated surface was photocatalytic and the alumina doped
sample showed higher activity than the undoped one. The present method is hence very
useful for the preparation of photocatalytic surfaces from a cheaper precursor, which will
enable the bulk production of photocatalytic titania surfaces.
153

Chapter I V
4.6 References
1. Y. T. Wong , N. B. Wong, L. Shi, J. Mater. Sci., 38, 2003, 973.
2. R. A. Terpstra, B. C. Bonekamp, H. J . Veringa, Desalination, 70, 1988, 395.
3. A. F. M. Leenars, A. J . Burggraff, J. Colloid Interfac. Sci., 105, 1985, 27.
4. L. C. Klein, D. Gallagher, J. Membrane Sci., 39, 1988, 213.
5. H. Choi, E. Stathatos, D. D. Dionysiou, Desalination, 202, 2007, 199.
6. T. Van Gestel, H. Kruidhof, D. H. A. Blank, H. J. M. Bouwmeester, J.
Membrane Sci., 284, 2006, 128.
7. T. P. Hoar, N. M. Mott, J. Phys. Chem. Solids, 9, 1959, 97.
8. A. W. Smith, J. Electrochem. S0c., 120, 1973,1068.
9. A. W. Smith, U.S. Patent 3850762, 1974, 762.
10. Y. S. Lin, A. J. Burggraff, Chem. Eng. Sci., 46, 1991, 3067.
ll. Y. S. Lin, A. J. Burggraff, AICHE. .I., 38, 1992, 445.
12. A. J . Burgaff, K. Keizer, B.A. van Hassel, Solid State Ionics, 32 & 33, 1991, 771.
13. H. P. Hsieh, Inorganic membranes, A. l. Ch. E. Symp. Ser., 261, 1988, 1.
14. T. Yamaki, H. Maeda, K. Kusakabe, S. Morooka, J. Membrane Sci., 85, 1993,
167.
15. X. S. Ju, P. Huang, N. P. Xu, J. Shi, J. Membrane Sci., 202, 2002, 67.
16. P. Puhlfurss, A. Voigt, R. Weber , M. Morbe, J. Membrane Sci., 74, 2000, 123.
17. X. Ding, Y. Fan, N. Xu, J. Membrane Sci., 270, 2006, 179.
18. L. Q. Wu, P. Huang, N. P. Xu , J. Shi, J. Membrane Sci. 173, 2000, 263.
19. C. Yu, L. C. Klein, J. Am. Ceram. Soc., 75, 1992, 2613.
20. R. Soria, S. Cominotti, Nanofiltration Ceramic Membranes, Proceedings of
International Conference of Membranes and Membrane Processes, Yokoham,
Japan, 18-23,1996, p. 6-22.
154

Chapter IV
M. Millares, Method of Fabricating Inorganic Filter Structures, U.S Patent5656168, 1997.
R. Castillion, J. P. Laveniere, Monolithic Ceramic Supports for FiltrationMembranes, U. S Patent no.5415 775, 1995.
K. Prabhakaran, S. Priya, N. M. Gokhale, S. C. Shanna, Ceram. Int., 33, 2007,
515.
A. J. Burggraff, K. Keizer, Inorganic Membranes, ed. R. R. Bhave, V. N. R., New
York, 1991.
Q. Xu, M. A. Anderson, J. Mater. Res, 5, 1991, 3.
A. F. M. Leenaars, K. Keizer, A. J. Burggraaf,.I. Mater. Sci., l9, 1984, 1077.
K. N. P. Kumar, Nanostructured Ceramic Memranes, Thesis: University Twente,
The Netherlands, 1993.
V.T. Zaspalis, International report no. CT92/282/128, 1992, University of
Twente, The Netherlands.
Y. Kinemuchi, T. Suzuki, W. Jiang, K. Yatsui, J. Am. Ceram. Soc., 84, 2001,
2144.
A. J. Burggraaf, L. Cot, A. J. Burggraaf, L. Cot ( Eds. ), Fundamentals of
Inorganic Membrane Science and Technology, Elsvier, Amsterdam, 1996, p. 17.
T. Tsuru, D. Hironaka, T. M. Asaeda, Sep. Purzf Technol, 25, 2001, 307.
B. Boumonville, A. Nzihou, Powder T ech., 128, 2002, 148.
C. G. deKn1if, The rheology of colloidal dispersion in relation to the
microstructure. In Hydrodynamics of Dispersed Media, ed. J. P. Hulin, A. M.
Cazabat, E. Guyon, F. Carmona, Elsevier, Holland, 1990, pp. 79.
R. Z. Zhou, R.L. Snyder, Acta. Cyst. B, 47, 1991, 617.
P. Padmaja, G. M. Anilkumar, P. Mukundan, G. Aruldhas, K. G. K. Warrier,
Inter. J. Inorg. Mater., 3, 2001, 693.
155

Chapter I V
C. P. Sibu, S. R. Kumar, P. Mulcundan, K. G. K. Warrier, Chem. Mater., 14, 2002,
2876.
S. Benfer, U. Popp, H. Richter, C. Siewert, G. Tomandl, Sep. Purzf Techn0l., 22
23, 2001, 231.
C. Hu, Y. Lan, J. Qu, X. Hu, A. Wang, J. Phys. Chem. B, 110, 2006, 4066.
K. V. S. Rao, B. Zhuo, J. M. Cox, K. Chiang, M. Brungs, R. Amal, J. Biomed.
Nan0tech., 2, 2006, 1.
Y. Kikuchi, K. Sunada, T. Iyoda, K. Hashimoto, A. Fujishima, J. Photochem.
Photobio. A: Chem., 106, 1997, 51.
K. Sunada, Y. Kikuchi, K. Hashimoto, A. Fujishima, Environ. Sci. Techn0l.,
32, 1998, 726.
I. P. Parkin, R. G. Palgrave, J. Mater. Chem., 15, 2005, 1689.
R. S. Sonawane, S. G. Hegde, M.K. Dongare, Mater. Chem. Phys., 77, 2002, 744.
J. Yang, S. Mei, J. F. M. Ferreira, J. Eur. Ceram. S0c., 24, 2004, 335.
X. W. Bao, S. S. Yan, C. Feng, J. L. Zhang, Mater. Lett., S9, 2005, 412.
J. C. Yu, X. C. Wang, X. Z. Fu, Chem. Mater., 16, 2004, 1523.
L. Ge, M. X. Xu, E. Lei, Y. M. Tian, H. B. Fang, Key Eng. Mater., 280-283,
2005, 809.
R. S. Sonawane, B. B.Ka1e, M. K. Dongare, Mater. Chem. Phys., 85, 2004, 52.
T. Kishimoto, Kozuka, H., J. Mater. Res., 2, 2003, 466.
H. Ichinose, A. Terasaki, H. Katsuki, J. Ceram. Soc. Jpn., 104, 1996, 715.
H. Ichinose, A. Kawahara, H. Katsuki, J. Ceram. Soc. Jpn., 104, 1996, 914.
C. K. Lee, D. K. Kim, J. H. Lee, J. S0l—Gel Sci. Techn0l., 31, 2004, 67.
L. Ge, M. X. Xu, H. B. Fang, Chin, J. Inorg. Chem., 21, 2005, 394.
T. V. Mani, H. K. Vanna, K. G. K. Warrier, A. D. Damodaran, J. Am. Ceram.
Soc., 74,1991, 1807.
156

TQMChapter I V
J. M. Gallardo Amores, V. Sanchez Escribano, M. Daturi, G. Busca, J. Mater.
Chem, 6, 1996, 879.
H. Bevan, S. V. Dawes, R. A. Ford, Spectrochim. Acta Part A: 13, 1958, 43.
J. Ramirez, L. Ruiz-Ramirez, L. Cedeno, V. Harle, M. Vrinat, M. Breysse, Appl.
Catal. A-Gen., 93, 1993, 163.
A. FernBndez, J. Leyrer, A.R. Gonzalez Elipe, G.Munuera, H. K& Zinger. J.
Cata1., 112, 1989, 489.
S. J. Gregg, K. S. W. Sing, Adsorption, Surface area and Porosity, 11'” Ed.,
Academic Press, 1982.
Y. Iida. M. Fumkawa, T. Aoki, T. Sakai, Appl. Spectrosa, 52, 1998, 673
V. Swamy, A. Kuznetsov, L. S. Dubrovinsky, R. A. Caruso, D. G. Shchukin, B.
C. Muddle, Phys. Rev. B, 71, 2005, 184302.
M. A. Henderson, Surf Sci, 400, 1998, 203.
157
Related Documents