36–1 CHAPTER 36 MORTALITY TRENDS IN TYPE 2 DIABETES Klara J. Rosenquist, MD, and Caroline S. Fox, MD, MPH Dr. Klara J. Rosenquist is the Associate Medical Director of Quality, Safety and Population Health Management at North Shore Physicians Group in Peabody, MA. Dr. Caroline S. Fox is the Director of Metabolic Research at the Framingham Heart Study and the Associate Director at the Center for Population Studies in Framingham, MA. She is also a senior investigator at the Laboratory for Metabolic and Population Health of National Heart, Lung, and Blood Institute and an Associate Clinical Professor of Medicine at the Brigham and Women’s Hospital and Harvard Medical School, Boston, MA. Received in final form August 19, 2014. SUMMARY The overall population in the United States has experienced a marked decline in both all-cause mortality and cardiovascular-related mortality over the last several decades, including a decline in mortality of individuals with diabetes. However, in association with the obesity epidemic, the prevalence and incidence of type 2 diabetes continue to increase. Despite improvements in primary and secondary prevention of cardiovascular disease (CVD), diabetes is an increasingly important risk factor for CVD, and individuals with diabetes as compared to those without diabetes continue to have an increased risk of both all-cause and cardiovascular mortality. The evaluation of long-term trends in mortality rates of diabetes is particularly challenging. The changing definition of diabetes over the last several decades makes the proportion of diabetes deaths hard to interpret. In addition, death certificate data regarding diabetes are often incomplete and likely underestimate the association of diabetes and mortality. Diabetes is the seventh leading cause of death in the United States, and individuals with diabetes have a twofold to threefold increased risk of mortality compared to individuals without diabetes. Individuals with diabetes have a decreased life expectancy by up to 8 years compared to contemporary individuals without diabetes. This decrease is due in part to an increased risk of CVD and an increasing attributable risk of cardiovascular mortality associated with diabetes. The most common nonvascular causes of death from diabetes include cancer, renal disease, liver disease, and pneumonia. Individuals with diabetes have increased all-cause mortality even after adjusting for baseline characteristics, including age, sex, smoking status, and body mass index. Control of cardiovascular risk factors has improved over the last several decades in the general population, as well as in individuals with diabetes. However, many individuals with diabetes remain suboptimally controlled based on current standards. Cardiovascular risk factor control has contributed to a decrease in national mortality rates over time, but both women and men with diabetes remain at higher risk of all-cause and cardiovascular mortality than those without diabetes. The above trends highlight several important points. First, the prevalence and incidence of diabetes continue to increase. Second, despite improvements in cardiovascular risk factor treatment, individuals with diabetes are not optimally controlled. Further, the propor- tion of CVD due to diabetes has increased over time, emphasizing the impact of increasing diabetes incidence on the burden of CVD. Finally, these findings point to the importance of aggressive diabetes and cardiovascular risk factor management to help decrease diabetes morbidity and mortality. INTRODUCTION Rising rates of obesity have led to signif- icant increases in the prevalence and incidence of type 2 diabetes (1,2). The presence of diabetes nearly doubles the risk for cardiovascular disease (CVD) (3), and emerging evidence suggests that diabetes is associated with other potentially fatal conditions, including cancer and life-threatening infections (4). While overall mortality has declined markedly in the United States, individuals with diabetes have a twofold to threefold increase in all-cause mortality compared to individuals without diabetes, a disparity that has remained relatively stable over time (5,6). In addition, there are disparities among ethnic populations in the United States. Both individuals with and without diabetes have experienced an overall decrease in CVD, but the magnitude of the gap between the two groups has remained unchanged, and an increased CVD burden remains among individuals with diabetes (7). In addition, while overall CVD morbidity and mortality has declined in the United States since the 1950s (6,8), the attributable risk of CVD due to diabetes has increased (9). This chapter explores these trends in further detail, while discussing the chal- lenges of accurately determining diabetes mortality. The focus of this chapter is on type 2 diabetes, but some of the methods used for data ascertainment cannot distin- guish between type 1 and type 2 diabetes. Additional information that is specific for type 1 diabetes is provided in Chapter 35 Mortality in Type 1 Diabetes.

Welcome message from author
This document is posted to help you gain knowledge. Please leave a comment to let me know what you think about it! Share it to your friends and learn new things together.
Transcript
36–1
CHAPTER 36
MORTALITY TRENDS IN TYPE 2 DIABETESKlara J. Rosenquist, MD, and Caroline S. Fox, MD, MPH
Dr. Klara J. Rosenquist is the Associate Medical Director of Quality, Safety and Population Health Management at North Shore Physicians Group in Peabody, MA. Dr. Caroline S. Fox is the Director of Metabolic Research at the Framingham Heart Study and the Associate Director at the Center for Population Studies in Framingham, MA. She is also a senior investigator at the Laboratory for Metabolic and Population Health of National Heart, Lung, and Blood Institute and an Associate Clinical Professor of Medicine at the Brigham and Women’s Hospital and Harvard Medical School, Boston, MA.
Received in final form August 19, 2014.
SUMMARY
The overall population in the United States has experienced a marked decline in both all-cause mortality and cardiovascular-related mortality over the last several decades, including a decline in mortality of individuals with diabetes. However, in association with the obesity epidemic, the prevalence and incidence of type 2 diabetes continue to increase. Despite improvements in primary and secondary prevention of cardiovascular disease (CVD), diabetes is an increasingly important risk factor for CVD, and individuals with diabetes as compared to those without diabetes continue to have an increased risk of both all-cause and cardiovascular mortality.
The evaluation of long-term trends in mortality rates of diabetes is particularly challenging. The changing definition of diabetes over the last several decades makes the proportion of diabetes deaths hard to interpret. In addition, death certificate data regarding diabetes are often incomplete and likely underestimate the association of diabetes and mortality.
Diabetes is the seventh leading cause of death in the United States, and individuals with diabetes have a twofold to threefold increased risk of mortality compared to individuals without diabetes. Individuals with diabetes have a decreased life expectancy by up to 8 years compared to contemporary individuals without diabetes. This decrease is due in part to an increased risk of CVD and an increasing attributable risk of cardiovascular mortality associated with diabetes. The most common nonvascular causes of death from diabetes include cancer, renal disease, liver disease, and pneumonia. Individuals with diabetes have increased all-cause mortality even after adjusting for baseline characteristics, including age, sex, smoking status, and body mass index. Control of cardiovascular risk factors has improved over the last several decades in the general population, as well as in individuals with diabetes. However, many individuals with diabetes remain suboptimally controlled based on current standards. Cardiovascular risk factor control has contributed to a decrease in national mortality rates over time, but both women and men with diabetes remain at higher risk of all-cause and cardiovascular mortality than those without diabetes.
The above trends highlight several important points. First, the prevalence and incidence of diabetes continue to increase. Second, despite improvements in cardiovascular risk factor treatment, individuals with diabetes are not optimally controlled. Further, the propor-tion of CVD due to diabetes has increased over time, emphasizing the impact of increasing diabetes incidence on the burden of CVD. Finally, these findings point to the importance of aggressive diabetes and cardiovascular risk factor management to help decrease diabetes morbidity and mortality.
INTRODUCTION
Rising rates of obesity have led to signif-icant increases in the prevalence and incidence of type 2 diabetes (1,2). The presence of diabetes nearly doubles the risk for cardiovascular disease (CVD) (3), and emerging evidence suggests that diabetes is associated with other potentially fatal conditions, including cancer and life-threat ening infections (4). While overall mortality has declined markedly in the United States, individuals with diabetes have a twofold to threefold increase in all-cause mortality compared
to individuals without diabetes, a disparity that has remained relatively stable over time (5,6). In addition, there are disparities among ethnic populations in the United States. Both individuals with and without diabetes have experienced an overall decrease in CVD, but the magnitude of the gap between the two groups has remained unchanged, and an increased CVD burden remains among individuals with diabetes (7). In addition, while overall CVD morbidity and mortality has declined in the United States since the 1950s
(6,8), the attributable risk of CVD due to diabetes has increased (9).
This chapter explores these trends in further detail, while discussing the chal-lenges of accurately determining diabetes mortality. The focus of this chapter is on type 2 diabetes, but some of the methods used for data ascertainment cannot distin-guish between type 1 and type 2 diabetes. Additional information that is specific for type 1 diabetes is provided in Chapter 35 Mortality in Type 1 Diabetes.
36–2
DIABETES IN AMERICA, 3rd Edition
METHODOLOGICAL CHALLENGES IN ASSESSING DIABETES MORTALITY
Several challenges arise in the assessment of diabetes mortality. The first is the shifting definition of diabetes over the last several decades with the prevalence of diabetes varying with changes in the diagnostic criteria. For example, the threshold for diagnosing diabetes has been lowered over time in order to expand the diagnosis and capture earlier, less severe disease (10).
Another challenge is the ascertainment of mortality. Many national studies use death certificate data to obtain mortality rates and are limited by the accuracy and completeness of the documents (11).In addition, the design and methodology of cohort and other observational studies vary widely. Understanding how changing definitions and collection strategies impact the research findings on this topic is important. These issues are discussed in greater detail in the following sections.
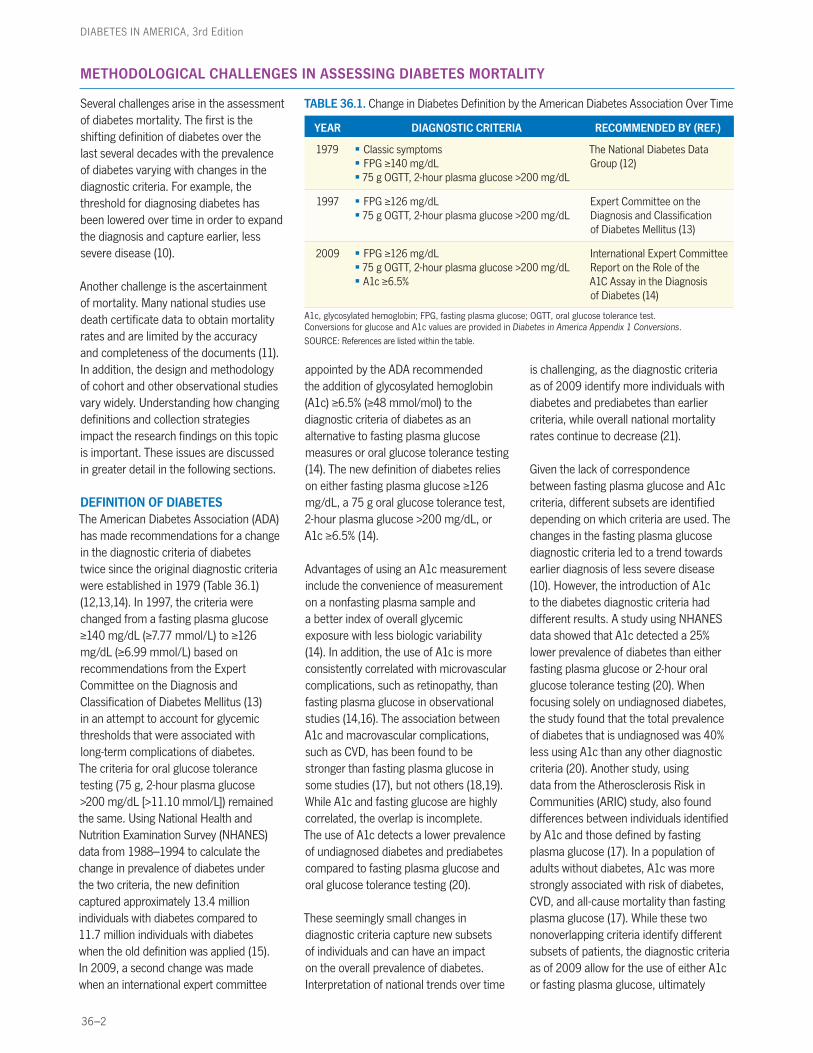
DEFINITION OF DIABETES The American Diabetes Association (ADA) has made recommendations for a change in the diagnostic criteria of diabetes twice since the original diagnostic criteria were established in 1979 (Table 36.1) (12,13,14). In 1997, the criteria were changed from a fasting plasma glucose ≥140 mg/dL (≥7.77 mmol/L) to ≥126 mg/dL (≥6.99 mmol/L) based on recommendations from the Expert Committee on the Diagnosis and Classification of Diabetes Mellitus (13) in an attempt to account for glycemic thresholds that were associated with long-term complications of diabetes. The criteria for oral glucose tolerance testing (75 g, 2-hour plasma glucose >200 mg/dL [>11.10 mmol/L]) remained the same. Using National Health and Nutrition Examination Survey (NHANES) data from 1988–1994 to calculate the change in prevalence of diabetes under the two criteria, the new definition captured approximately 13.4 million individuals with diabetes compared to 11.7 million individuals with diabetes when the old definition was applied (15). In 2009, a second change was made when an international expert committee
appointed by the ADA recommended the addition of glycosylated hemoglobin (A1c) ≥6.5% (≥48 mmol/mol) to the diagnostic criteria of diabetes as an alternative to fasting plasma glucose measures or oral glucose tolerance testing (14). The new definition of diabetes relies on either fasting plasma glucose ≥126 mg/dL, a 75 g oral glucose tolerance test, 2-hour plasma glucose >200 mg/dL, or A1c ≥6.5% (14).
Advantages of using an A1c measurement include the convenience of measurement on a nonfasting plasma sample and a better index of overall glycemic exposure with less biologic variability (14). In addition, the use of A1c is more consistently correlated with microvascular complications, such as retinopathy, than fasting plasma glucose in observational studies (14,16). The association between A1c and macrovascular complications, such as CVD, has been found to be stronger than fasting plasma glucose in some studies (17), but not others (18,19). While A1c and fasting glucose are highly correlated, the overlap is incomplete. The use of A1c detects a lower prevalence of undiagnosed diabetes and prediabetes compared to fasting plasma glucose and oral glucose tolerance testing (20).
These seemingly small changes in diagnostic criteria capture new subsets of individuals and can have an impact on the overall prevalence of diabetes. Interpretation of national trends over time
is challenging, as the diagnostic criteria as of 2009 identify more individuals with diabetes and prediabetes than earlier criteria, while overall national mortality rates continue to decrease (21).
Given the lack of correspondence between fasting plasma glucose and A1c criteria, different subsets are identified depending on which criteria are used. The changes in the fasting plasma glucose diagnostic criteria led to a trend towards earlier diagnosis of less severe disease (10). However, the introduction of A1c to the diabetes diagnostic criteria had different results. A study using NHANES data showed that A1c detected a 25% lower prevalence of diabetes than either fasting plasma glucose or 2-hour oral glucose tolerance testing (20). When focusing solely on undiagnosed diabetes, the study found that the total prevalence of diabetes that is undiagnosed was 40% less using A1c than any other diagnostic criteria (20). Another study, using data from the Atherosclerosis Risk in Communities (ARIC) study, also found differences between individuals identified by A1c and those defined by fasting plasma glucose (17). In a population of adults without diabetes, A1c was more strongly associated with risk of diabetes, CVD, and all-cause mortality than fasting plasma glucose (17). While these two nonoverlapping criteria identify different subsets of patients, the diagnostic criteria as of 2009 allow for the use of either A1c or fasting plasma glucose, ultimately
TABLE 36.1. Change in Diabetes Definition by the American Diabetes Association Over Time
YEAR DIAGNOSTIC CRITERIA RECOMMENDED BY (REF.)
1979 § Classic symptoms § FPG ≥140 mg/dL § 75 g OGTT, 2-hour plasma glucose >200 mg/dL
The National Diabetes Data Group (12)
1997 § FPG ≥126 mg/dL § 75 g OGTT, 2-hour plasma glucose >200 mg/dL
Expert Committee on the Diagnosis and Classification of Diabetes Mellitus (13)
2009 § FPG ≥126 mg/dL § 75 g OGTT, 2-hour plasma glucose >200 mg/dL § A1c ≥6.5%
International Expert Committee Report on the Role of the A1C Assay in the Diagnosis of Diabetes (14)
A1c, glycosylated hemoglobin; FPG, fasting plasma glucose; OGTT, oral glucose tolerance test. Conversions for glucose and A1c values are provided in Diabetes in America Appendix 1 Conversions.
SOURCE: References are listed within the table.
lspofford
Sticky Note
Marked set by lspofford
lspofford
Sticky Note
Marked set by lspofford
lspofford
Sticky Note
Marked set by lspofford
lspofford
Sticky Note
Marked set by lspofford
lspofford
Sticky Note
Marked set by lspofford
lspofford
Sticky Note
Marked set by lspofford
Mortality Trends in Type 2 Diabetes
36–3
identifying more individuals with diabetes than either one alone.
In addition to diagnostic criteria changes, studies relying on different methods of data ascertainment may identify variable prevalence rates based on the definition used to classify diabetes. Survey methods that rely on self-report classically capture a more advanced and severe disease, and the sensitivity of self-report may vary based on age, sex, knowledge of a disease, and utilization of health care (22). However, a study comparing chronic disease prevalence estimates across the Behavioral Risk Factor Surveillance System (BRFSS), the National Health Interview Survey (NHIS), and the NHANES found overall similar absolute preva-lences of diabetes (8.1%–8.7%) among all three national surveys despite different self-report methods and survey questions (23). This study did not attempt to validate prevalence estimates from one survey to the other given that each type of survey has different sampling methods and likely identifies different subgroups, but the finding suggests an overall reliability in capturing secular trends by standardized self-report methods (23).
Thus, the changing definition of diabetes and the method of ascertainment may impact prevalence rates of diabetes and need to be considered carefully within the context of other influencing factors in any longitudinal epidemiologic survey of diabetes. Further, changing prevalence rates of diabetes impact the ability to determine diabetes mortality, as prevalence rates change the number of individuals considered at risk. Diabetes mortality rates are also based on multiple factors, including the duration and severity of disease, making the study of diabetes mortality trends over time partic-ularly challenging.
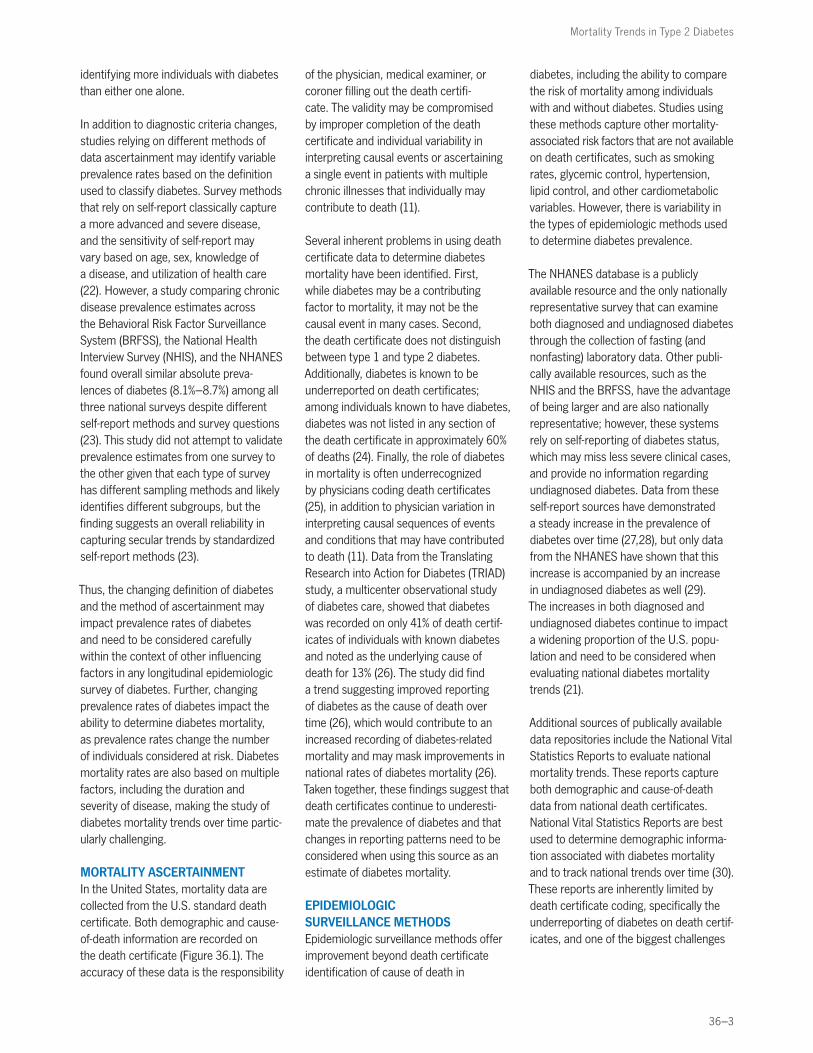
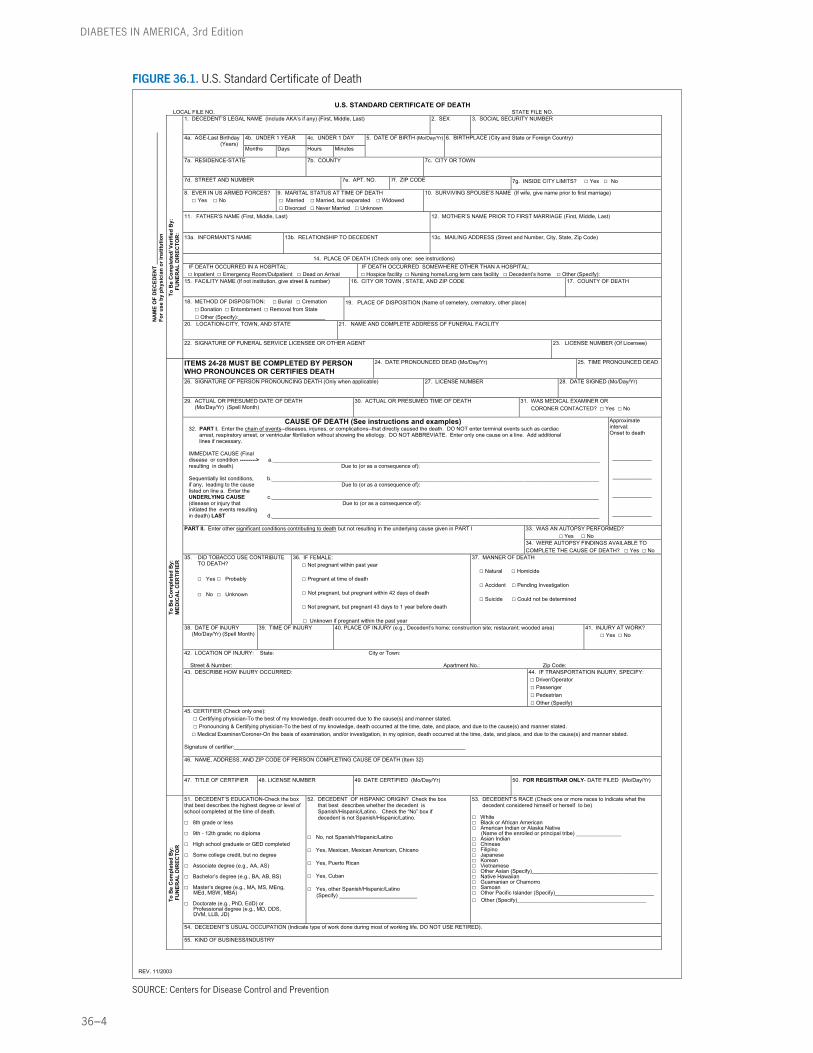
MORTALITY ASCERTAINMENTIn the United States, mortality data are collected from the U.S. standard death certificate. Both demographic and cause-of-death information are recorded on the death certificate (Figure 36.1). The accuracy of these data is the responsibility
of the physician, medical examiner, or coroner filling out the death certifi-cate. The validity may be compromised by improper completion of the death certificate and individual variability in interpreting causal events or ascertaining a single event in patients with multiple chronic illnesses that individually may contribute to death (11).
Several inherent problems in using death certificate data to determine diabetes mortality have been identified. First, while diabetes may be a contributing factor to mortality, it may not be the causal event in many cases. Second, the death certificate does not distinguish between type 1 and type 2 diabetes. Additionally, diabetes is known to be underreported on death certificates; among individuals known to have diabetes, diabetes was not listed in any section of the death certificate in approximately 60% of deaths (24). Finally, the role of diabetes in mortality is often underrecognized by physicians coding death certificates (25), in addition to physician variation in interpreting causal sequences of events and conditions that may have contributed to death (11). Data from the Translating Research into Action for Diabetes (TRIAD) study, a multicenter observational study of diabetes care, showed that diabetes was recorded on only 41% of death certif-icates of individuals with known diabetes and noted as the underlying cause of death for 13% (26). The study did find a trend suggesting improved reporting of diabetes as the cause of death over time (26), which would contribute to an increased recording of diabetes-related mortality and may mask improvements in national rates of diabetes mortality (26). Taken together, these findings suggest that death certificates continue to underesti-mate the prevalence of diabetes and that changes in reporting patterns need to be considered when using this source as an estimate of diabetes mortality.
EPIDEMIOLOGIC SURVEILLANCE METHODSEpidemiologic surveillance methods offer improvement beyond death certificate identification of cause of death in
diabetes, including the ability to compare the risk of mortality among individuals with and without diabetes. Studies using these methods capture other mortality-associated risk factors that are not available on death certificates, such as smoking rates, glycemic control, hypertension, lipid control, and other cardiometabolic variables. However, there is variability in the types of epidemiologic methods used to determine diabetes prevalence.
The NHANES database is a publicly available resource and the only nationally representative survey that can examine both diagnosed and undiagnosed diabetes through the collection of fasting (and nonfasting) laboratory data. Other publi-cally available resources, such as the NHIS and the BRFSS, have the advantage of being larger and are also nationally representative; however, these systems rely on self-reporting of diabetes status, which may miss less severe clinical cases, and provide no information regarding undiagnosed diabetes. Data from these self-report sources have demonstrated a steady increase in the prevalence of diabetes over time (27,28), but only data from the NHANES have shown that this increase is accompanied by an increase in undiagnosed diabetes as well (29). The increas es in both diagnosed and undiagnosed diabetes continue to impact a widening proportion of the U.S. popu-lation and need to be considered when evaluating national diabetes mortality trends (21).
Additional sources of publically available data repositories include the National Vital Statistics Reports to evaluate national mortality trends. These reports capture both demographic and cause-of-death data from national death certificates. National Vital Statistics Reports are best used to determine demographic informa-tion associated with diabetes mortality and to track national trends over time (30). These reports are inherently limited by death certificate coding, specifically the underreporting of diabetes on death certif-icates, and one of the biggest challenges
36–4
DIABETES IN AMERICA, 3rd Edition
U.S. STANDARD CERTIFICATE OF DEATH LOCAL FILE NO. STATE FILE NO.
1. DECEDENT’S LEGAL NAME (Include AKA’s if any) (First, Middle, Last)
2. SEX 3. SOCIAL SECURITY NUMBER
4b. UNDER 1 YEAR 4c. UNDER 1 DAY 4a. AGE-Last Birthday (Years) Months Days Hours Minutes
5. DATE OF BIRTH (Mo/Day/Yr)
6. BIRTHPLACE (City and State or Foreign Country)
7a. RESIDENCE-STATE 7b. COUNTY 7c. CITY OR TOWN
7d. STREET AND NUMBER 7e. APT. NO. 7f. ZIP CODE 7g. INSIDE CITY LIMITS? □ Yes □ No
8. EVER IN US ARMED FORCES? □ Yes □ No
9. MARITAL STATUS AT TIME OF DEATH □ Married □ Married, but separated □ Widowed □ Divorced □ Never Married □ Unknown
10. SURVIVING SPOUSE’S NAME (If wife, give name prior to first marriage)
11. FATHER’S NAME (First, Middle, Last)
12. MOTHER’S NAME PRIOR TO FIRST MARRIAGE (First, Middle, Last)
13a. INFORMANT’S NAME
13b. RELATIONSHIP TO DECEDENT
13c. MAILING ADDRESS (Street and Number, City, State, Zip Code)
14. PLACE OF DEATH (Check only one: see instructions) IF DEATH OCCURRED IN A HOSPITAL: □ Inpatient □ Emergency Room/Outpatient □ Dead on Arrival
IF DEATH OCCURRED SOMEWHERE OTHER THAN A HOSPITAL: □ Hospice facility □ Nursing home/Long term care facility □ Decedent’s home □ Other (Specify):
15. FACILITY NAME (If not institution, give street & number)
16. CITY OR TOWN , STATE, AND ZIP CODE
17. COUNTY OF DEATH
18. METHOD OF DISPOSITION: □ Burial □ Cremation □ Donation □ Entombment □ Removal from State □ Other (Specify):_____________________________
19. PLACE OF DISPOSITION (Name of cemetery, crematory, other place)
20. LOCATION-CITY, TOWN, AND STATE
21. NAME AND COMPLETE ADDRESS OF FUNERAL FACILITY
N
AM
E O
F D
ECED
ENT
____
____
____
____
____
____
____
____
____
____
____
For u
se b
y ph
ysic
ian
or in
stitu
tion
To
Be
Com
plet
ed/ V
erifi
ed B
y:
FUN
ERA
L D
IREC
TOR
:
22. SIGNATURE OF FUNERAL SERVICE LICENSEE OR OTHER AGENT
23. LICENSE NUMBER (Of Licensee)
ITEMS 24-28 MUST BE COMPLETED BY PERSON WHO PRONOUNCES OR CERTIFIES DEATH
24. DATE PRONOUNCED DEAD (Mo/Day/Yr)
25. TIME PRONOUNCED DEAD
26. SIGNATURE OF PERSON PRONOUNCING DEATH (Only when applicable)
27. LICENSE NUMBER
28. DATE SIGNED (Mo/Day/Yr)
29. ACTUAL OR PRESUMED DATE OF DEATH (Mo/Day/Yr) (Spell Month)
30. ACTUAL OR PRESUMED TIME OF DEATH
31. WAS MEDICAL EXAMINER OR CORONER CONTACTED? □ Yes □ No
CAUSE OF DEATH (See instructions and examples) 32. PART I. Enter the chain of events--diseases, injuries, or complications--that directly caused the death. DO NOT enter terminal events such as cardiac arrest, respiratory arrest, or ventricular fibrillation without showing the etiology. DO NOT ABBREVIATE. Enter only one cause on a line. Add additional lines if necessary. IMMEDIATE CAUSE (Final disease or condition ---------> a._____________________________________________________________________________________________________________ resulting in death) Due to (or as a consequence of): Sequentially list conditions, b._____________________________________________________________________________________________________________ if any, leading to the cause Due to (or as a consequence of): listed on line a. Enter the UNDERLYING CAUSE c._____________________________________________________________________________________________________________ (disease or injury that Due to (or as a consequence of): initiated the events resulting in death) LAST d._____________________________________________________________________________________________________________
Approximate interval: Onset to death _____________ _____________ _____________ _____________
33. WAS AN AUTOPSY PERFORMED? □ Yes □ No
PART II. Enter other significant conditions contributing to death but not resulting in the underlying cause given in PART I
34. WERE AUTOPSY FINDINGS AVAILABLE TO COMPLETE THE CAUSE OF DEATH? □ Yes □ No
35. DID TOBACCO USE CONTRIBUTE TO DEATH? □ Yes □ Probably □ No □ Unknown
36. IF FEMALE: □ Not pregnant within past year □ Pregnant at time of death □ Not pregnant, but pregnant within 42 days of death □ Not pregnant, but pregnant 43 days to 1 year before death □ Unknown if pregnant within the past year
37. MANNER OF DEATH □ Natural □ Homicide □ Accident □ Pending Investigation □ Suicide □ Could not be determined
38. DATE OF INJURY (Mo/Day/Yr) (Spell Month)
39. TIME OF INJURY 40. PLACE OF INJURY (e.g., Decedent’s home; construction site; restaurant; wooded area)
41. INJURY AT WORK? □ Yes □ No
42. LOCATION OF INJURY: State: City or Town: Street & Number: Apartment No.: Zip Code: 43. DESCRIBE HOW INJURY OCCURRED:
44. IF TRANSPORTATION INJURY, SPECIFY: □ Driver/Operator □ Passenger □ Pedestrian □ Other (Specify)
45. CERTIFIER (Check only one): □ Certifying physician-To the best of my knowledge, death occurred due to the cause(s) and manner stated. □ Pronouncing & Certifying physician-To the best of my knowledge, death occurred at the time, date, and place, and due to the cause(s) and manner stated. □ Medical Examiner/Coroner-On the basis of examination, and/or investigation, in my opinion, death occurred at the time, date, and place, and due to the cause(s) and manner stated. Signature of certifier:_____________________________________________________________________________ 46. NAME, ADDRESS, AND ZIP CODE OF PERSON COMPLETING CAUSE OF DEATH (Item 32)
To
Be
Com
plet
ed B
y:
M
EDIC
AL
CER
TIFI
ER
47. TITLE OF CERTIFIER
48. LICENSE NUMBER
49. DATE CERTIFIED (Mo/Day/Yr)
50. FOR REGISTRAR ONLY- DATE FILED (Mo/Day/Yr)
51. DECEDENT’S EDUCATION-Check the box that best describes the highest degree or level of school completed at the time of death. □ 8th grade or less □ 9th - 12th grade; no diploma □ High school graduate or GED completed □ Some college credit, but no degree □ Associate degree (e.g., AA, AS) □ Bachelor’s degree (e.g., BA, AB, BS) □ Master’s degree (e.g., MA, MS, MEng,
MEd, MSW, MBA)
□ Doctorate (e.g., PhD, EdD) or Professional degree (e.g., MD, DDS, DVM, LLB, JD)
52. DECEDENT OF HISPANIC ORIGIN? Check the box that best describes whether the decedent is Spanish/Hispanic/Latino. Check the “No” box if decedent is not Spanish/Hispanic/Latino. □ No, not Spanish/Hispanic/Latino □ Yes, Mexican, Mexican American, Chicano □ Yes, Puerto Rican □ Yes, Cuban □ Yes, other Spanish/Hispanic/Latino (Specify) __________________________
53. DECEDENT’S RACE (Check one or more races to indicate what the decedent considered himself or herself to be) □ White □ Black or African American □ American Indian or Alaska Native □ Asian Indian
(Name of the enrolled or principal tribe) _______________
□ Chinese □ Filipino □ Japanese □ Korean □ Vietnamese □ Other Asian (Specify)__________________________________________ □ Native Hawaiian □ Guamanian or Chamorro □ Samoan □ Other Pacific Islander (Specify)_________________________________ □ Other (Specify)___________________________________________
54. DECEDENT’S USUAL OCCUPATION (Indicate type of work done during most of working life. DO NOT USE RETIRED).
T
o B
e C
ompl
eted
By:
FU
NER
AL
DIR
ECTO
R
55. KIND OF BUSINESS/INDUSTRY
REV. 11/2003
FIGURE 36.1. U.S. Standard Certificate of Death
SOURCE: Centers for Disease Control and Prevention
Mortality Trends in Type 2 Diabetes
36–5
in using the National Vital Statistics Reports is that it underestimates the true mortality burden of diabetes (24).
Cohort studies represent another source of important data to estimate the impact of diabetes on mortality trends. Cohort studies by definition follow a group of study participants over time and typically consist of a well-described cohort with longitudinal data. For example, a major strength of the Framingham Heart Study, a longitudinal cohort study conducted in Framingham, Massachusetts, is that fasting plasma glucose data have been collected over the course of the study, and as diabetes definitions change,
these data can be reevaluated to define diabetes according to the changing diagnostic criteria (6). Further, the Framingham Heart Study does not rely on death certificate data; rather, mortality outcomes are adjudicated by a panel of three physicians after review of additional information, such as hospital admission records, medical records, and family members. Therefore, compared to studies that rely solely on death certificate data, cohort studies are able to determine the cause-specific mortality of individuals with diabetes based on this additional information. Finally, as these studies are longitudinal in nature, they are able to evaluate both disease incidence and
prevalence. The main limitation in using cohort studies is that they may not be representative of the national population in terms of sampling. However, relative measures of association may still be generalizable to the national population.
In summary, changes in diabetes definition and differences among data sources impair the ability to make inferences about trends in diabetes mortality and to accurately determine the mortality burden of diabetes. However, the use of a variety of data sources provides complementary information that can be used to help estimate the mortality burden of diabetes.
MORTALITY OF PERSONS WITH TYPE 2 DIABETES
Data from the National Vital Statistics Reports compiled from death certificates indicate that diabetes was the seventh leading cause of death in the United States in 2008, with 70,553 death certif-icates listing diabetes as the underlying cause of death (30). This figure represents nearly 3% of all mortality in that year and a death rate of 23.2 per 100,000 individuals in the general population of the United States (30). These data must be considered in the context of a likely underestimation of the true burden of diabetes-associated mortality, as diabetes may be underrepresented on death certif-icates (26,31).
Given the complexities of using death certificate data, national epidemiologic surveys and United States-based cohort studies help to capture trends both on a national level and within certain populations. In order to evaluate the excess all-cause mortality rate among adults with diabetes compared to adults without diabetes, a PubMed literature search was conducted on November 2, 2012, using the key terms type 2 diabetes and mortality with limits for human subjects and English language within dates from 1993 to present. The search was conducted from 1993 to present because the previous edition of this chapter was completed in 1993 (32). Several United States-based cohorts and
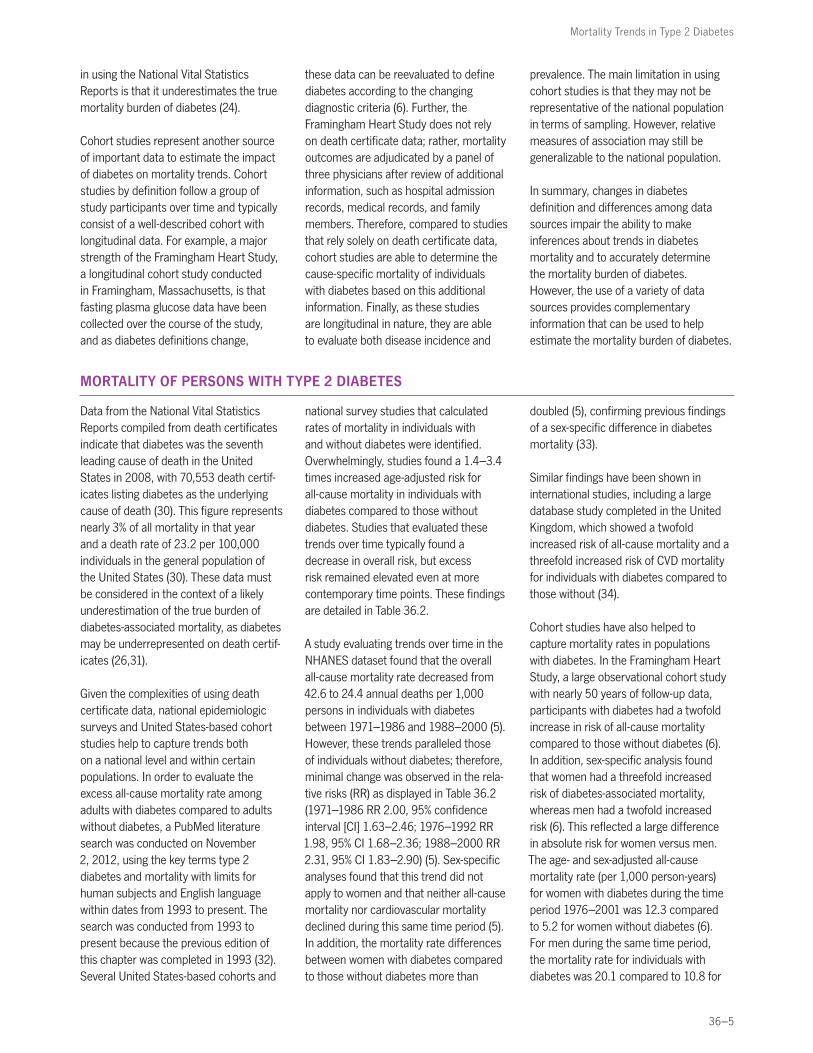
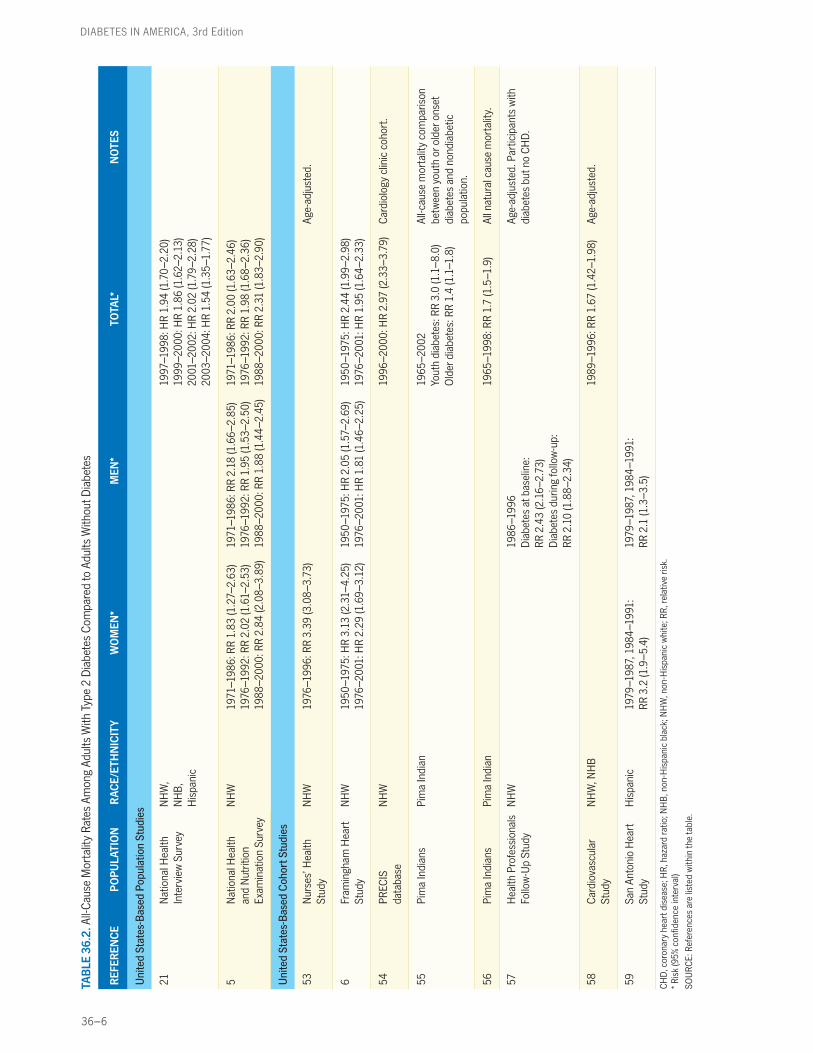
national survey studies that calculated rates of mortality in individuals with and without diabetes were identified. Overwhelmingly, studies found a 1.4–3.4 times increased age-adjusted risk for all-cause mortality in individuals with diabetes compared to those without diabetes. Studies that evaluated these trends over time typically found a decrease in overall risk, but excess risk remained elevated even at more contemporary time points. These findings are detailed in Table 36.2.
A study evaluating trends over time in the NHANES dataset found that the overall all-cause mortality rate decreased from 42.6 to 24.4 annual deaths per 1,000 persons in individuals with diabetes between 1971–1986 and 1988–2000 (5). However, these trends paralleled those of individuals without diabetes; therefore, minimal change was observed in the rela-tive risks (RR) as displayed in Table 36.2 (1971–1986 RR 2.00, 95% confidence interval [CI] 1.63–2.46; 1976–1992 RR 1.98, 95% CI 1.68–2.36; 1988–2000 RR 2.31, 95% CI 1.83–2.90) (5). Sex-specific analyses found that this trend did not apply to women and that neither all-cause mortality nor cardiovascular mortality declined during this same time period (5). In addition, the mortality rate differences between women with diabetes compared to those without diabetes more than
doubled (5), confirming previous findings of a sex-specific difference in diabetes mortality (33).
Similar findings have been shown in international studies, including a large database study completed in the United Kingdom, which showed a twofold increased risk of all-cause mortality and a threefold increased risk of CVD mortality for individuals with diabetes compared to those without (34).
Cohort studies have also helped to capture mortality rates in populations with diabetes. In the Framingham Heart Study, a large observational cohort study with nearly 50 years of follow-up data, participants with diabetes had a twofold increase in risk of all-cause mortality compared to those without diabetes (6).In addition, sex-specific analysis found that women had a threefold increased risk of diabetes-associated mortality, whereas men had a twofold increased risk (6). This reflected a large difference in absolute risk for women versus men. The age- and sex-adjusted all-cause mortality rate (per 1,000 person-years) for women with diabetes during the time period 1976–2001 was 12.3 compared to 5.2 for women without diabetes (6).For men during the same time period, the mortality rate for individuals with diabetes was 20.1 compared to 10.8 for
36–6
DIABETES IN AMERICA, 3rd Edition
TAB
LE 3
6.2.
All-
Cau
se M
orta
lity
Rate
s Am
ong
Adul
ts W
ith T
ype
2 D
iabe
tes
Com
pare
d to
Adu
lts W
ithou
t Dia
bete
s
REF
EREN
CE
PO
PULA
TIO
NR
ACE/
ETH
NIC
ITY
WO
MEN
*M
EN*
TOTA
L*N
OTE
S
Uni
ted
Stat
es-B
ased
Pop
ulat
ion
Stud
ies
21N
atio
nal H
ealth
In
terv
iew
Sur
vey
NH
W,
NH
B,
His
pani
c
1997
–199
8: H
R 1.
94 (1
.70–
2.20
)19
99–2
000:
HR
1.86
(1.6
2–2.
13)
2001
–200
2: H
R 2.
02 (1
.79–
2.28
) 20
03–2
004:
HR
1.54
(1.3
5–1.
77)
5N
atio
nal H
ealth
an
d N
utrit
ion
Exam
inat
ion
Surv
ey
NH
W19
71–1
986:
RR
1.83
(1.2
7–2.
63)
1976
–199
2: R
R 2.
02 (1
.61–
2.53
) 19
88–2
000:
RR
2.84
(2.0
8–3.
89)
1971
–198
6: R
R 2.
18 (1
.66–
2.85
)19
76–1
992:
RR
1.95
(1.5
3–2.
50)
1988
–200
0: R
R 1.
88 (1
.44–
2.45
)
1971
–198
6: R
R 2.
00 (1
.63–
2.46
)19
76–1
992:
RR
1.98
(1.6
8–2.
36)
1988
–200
0: R
R 2.
31 (1
.83–
2.90
)
Uni
ted
Stat
es-B
ased
Coh
ort S
tudi
es
53N
urse
s’ H
ealth
St
udy
NH
W19
76–1
996:
RR
3.39
(3.0
8–3.
73)
Age-
adju
sted
.
6Fr
amin
gham
Hea
rt
Stud
yN
HW
1950
–197
5: H
R 3.
13 (2
.31–
4.25
) 19
76–2
001:
HR
2.29
(1.6
9–3.
12)
1950
–197
5: H
R 2.
05 (1
.57–
2.69
) 19
76–2
001:
HR
1.81
(1.4
6–2.
25)
1950
–197
5: H
R 2.
44 (1
.99–
2.98
) 19
76–2
001:
HR
1.95
(1.6
4–2.
33)
54PR
ECIS
da
taba
seN
HW
1996
–200
0: H
R 2.
97 (2
.33–
3.79
)C
ardi
olog
y cl
inic
coh
ort.
55Pi
ma
Indi
ans
Pim
a In
dian
1965
–200
2Yo
uth
diab
etes
: RR
3.0
(1.1
–8.0
) O
lder
dia
bete
s: R
R 1.
4 (1
.1–1
.8)
All-c
ause
mor
talit
y co
mpa
rison
be
twee
n yo
uth
or o
lder
ons
et
diab
etes
and
non
diab
etic
po
pula
tion.
56Pi
ma
Indi
ans
Pim
a In
dian
1965
–199
8: R
R 1.
7 (1
.5–1
.9)
All n
atur
al c
ause
mor
talit
y.
57H
ealth
Pro
fess
iona
ls
Follo
w-U
p St
udy
NH
W19
86–1
996
Dia
bete
s at
bas
elin
e:
RR 2
.43
(2.1
6–2.
73)
Dia
bete
s du
ring
follo
w-u
p:
RR 2
.10
(1.8
8–2.
34)
Age-
adju
sted
. Par
ticip
ants
with
di
abet
es b
ut n
o C
HD
.
58C
ardi
ovas
cula
r St
udy
NH
W, N
HB
1989
–199
6: R
R 1.
67 (1
.42–
1.98
)Ag
e-ad
just
ed.
59Sa
n An
toni
o H
eart
St
udy
His
pani
c19
79–1
987,
198
4–19
91:
RR 3
.2 (1
.9–5
.4)
1979
–198
7, 1
984–
1991
: RR
2.1
(1.3
–3.5
)
CH
D, c
oron
ary
hear
t dis
ease
; HR
, haz
ard
ratio
; NH
B, n
on-H
ispa
nic
blac
k; N
HW
, non
-His
pani
c w
hite
; RR
, rel
ativ
e ris
k.* R
isk
(95%
con
fiden
ce in
terv
al)
SOU
RC
E: R
efer
ence
s ar
e lis
ted
with
in th
e ta
ble.
Mortality Trends in Type 2 Diabetes
36–7
those without diabetes (6). These findings indicate that while the relative risk for diabetes-associated mortality is higher in women, the number of events for women is lower, and the absolute risk of diabetes-associated mortality is lower than in men (6). The Framingham cohort is a relatively homogenous cohort, and other observational studies have also provided valuable information regarding the associations of demographic variables (Table 36.2).
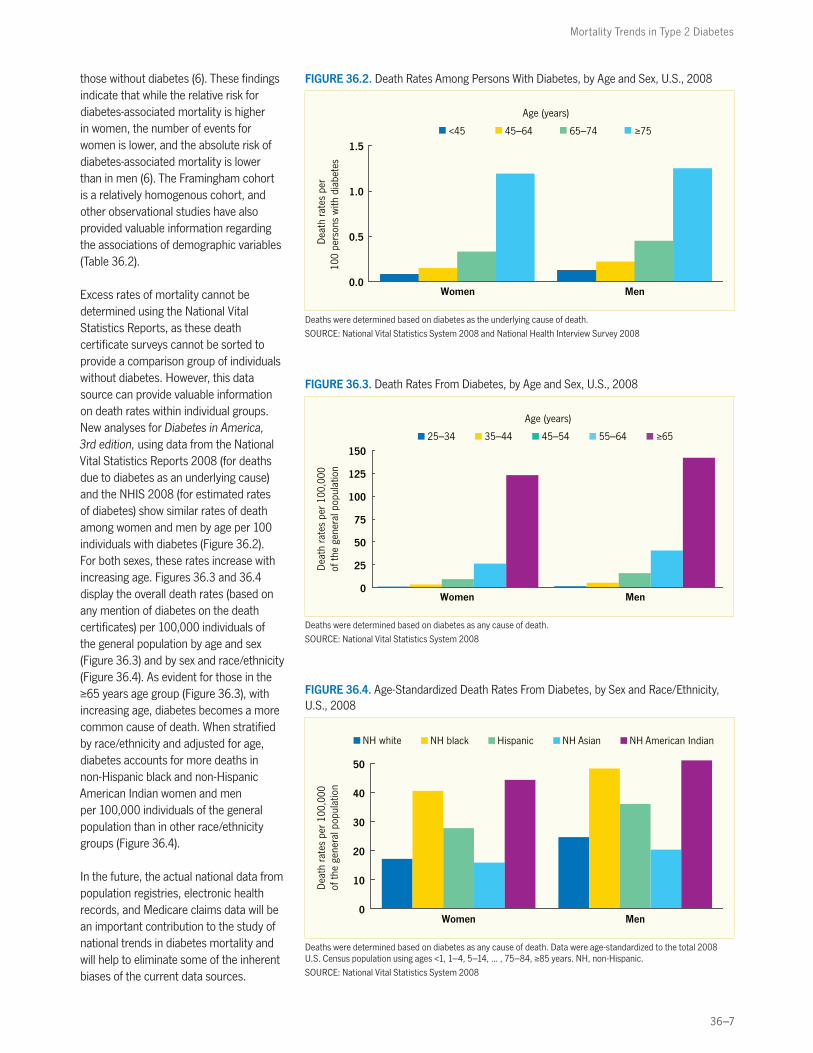
Excess rates of mortality cannot be determined using the National Vital Statistics Reports, as these death certificate surveys cannot be sorted to provide a comparison group of individuals without diabetes. However, this data source can provide valuable information on death rates within individual groups. New analyses for Diabetes in America, 3rd edition, using data from the National Vital Statistics Reports 2008 (for deaths due to diabetes as an underlying cause) and the NHIS 2008 (for estimated rates of diabetes) show similar rates of death among women and men by age per 100 individuals with diabetes (Figure 36.2). For both sexes, these rates increase with increasing age. Figures 36.3 and 36.4 display the overall death rates (based on any mention of diabetes on the death certificates) per 100,000 individuals of the general population by age and sex (Figure 36.3) and by sex and race/ethnicity (Figure 36.4). As evident for those in the ≥65 years age group (Figure 36.3), with increasing age, diabetes becomes a more common cause of death. When stratified by race/ethnicity and adjusted for age, diabetes accounts for more deaths in non-Hispanic black and non-Hispanic American Indian women and men per 100,000 individuals of the general population than in other race/ethnicity groups (Figure 36.4).
In the future, the actual national data from population registries, electronic health records, and Medicare claims data will be an important contribution to the study of national trends in diabetes mortality and will help to eliminate some of the inherent biases of the current data sources.
FIGURE 36.2. Death Rates Among Persons With Diabetes, by Age and Sex, U.S., 2008
0.0
0.5
1.0
1.5
Women Men
Dea
th r
ates
per
100
pers
ons
with
dia
bete
s
<45 45–64 65–74
Age (years)
≥75
Deaths were determined based on diabetes as the underlying cause of death.
SOURCE: National Vital Statistics System 2008 and National Health Interview Survey 2008
FIGURE 36.3. Death Rates From Diabetes, by Age and Sex, U.S., 2008
0
25
50
75
100
125
150
Women Men
Dea
th r
ates
per
100
,000
of
the
gene
ral p
opul
atio
n
25–34 35–44 45–54 55–64
Age (years)
≥65
Deaths were determined based on diabetes as any cause of death.
SOURCE: National Vital Statistics System 2008
FIGURE 36.4. Age-Standardized Death Rates From Diabetes, by Sex and Race/Ethnicity, U.S., 2008
Dea
th r
ates
per
100
,000
of
the
gene
ral p
opul
atio
n
NH Asian NH white NH American Indian NH black
0
10
20
30
40
50
MenWomen
Hispanic
Deaths were determined based on diabetes as any cause of death. Data were age-standardized to the total 2008 U.S. Census population using ages <1, 1–4, 5–14, ... , 75–84, ≥85 years. NH, non-Hispanic.
SOURCE: National Vital Statistics System 2008
36–8
DIABETES IN AMERICA, 3rd Edition
LIFE EXPECTANCY OF PERSONS WITH TYPE 2 DIABETES
Diabetes is associated with premature mortality and an increased risk of morbidity from complications, including CVD, retinopathy, neuropathy, and nephropathy. In the United States, life expectancy for women and men with diabetes at age ≥50 years was 8.2 and 7.5 years less, respectively, than for comparable individuals without diabetes (35). In women and men, individuals with diabetes had 8.4 and 7.8 years less free of CVD, respectively, compared to equiv-alent individuals without diabetes (35). A meta-analysis found similar results inter-nationally, reporting that a 50-year-old
individual with diabetes dies, on average, 6 years earlier than an individual of the same age without diabetes, with 40% of the difference in survival attributable to excess nonvascular deaths (4).
Life expectancy for individuals diagnosed with diabetes in adulthood has been previously established, but few studies have predicted life expectancy in indi-viduals diagnosed during adolescence or young adulthood (36). A study used a variant of Markov modeling to describe the morbidity and mortality experienced by youths diagnosed with type 2 diabetes
(36). Compared with an average 20-year-old without diabetes in the United States with a remaining life expectancy of 58.6 years, a newly diagnosed individual with diabetes on conventional diabetes treatment had an average life expectancy approximately 15 years less (a remaining life expectancy of 43.1 years) (36). In addition, young individuals with type 2 diabetes had a quality-adjusted life expec-tancy of 39.3 years, suggesting that they may experience severe, chronic complica-tions of type 2 diabetes by approximately 40 years of age (36).
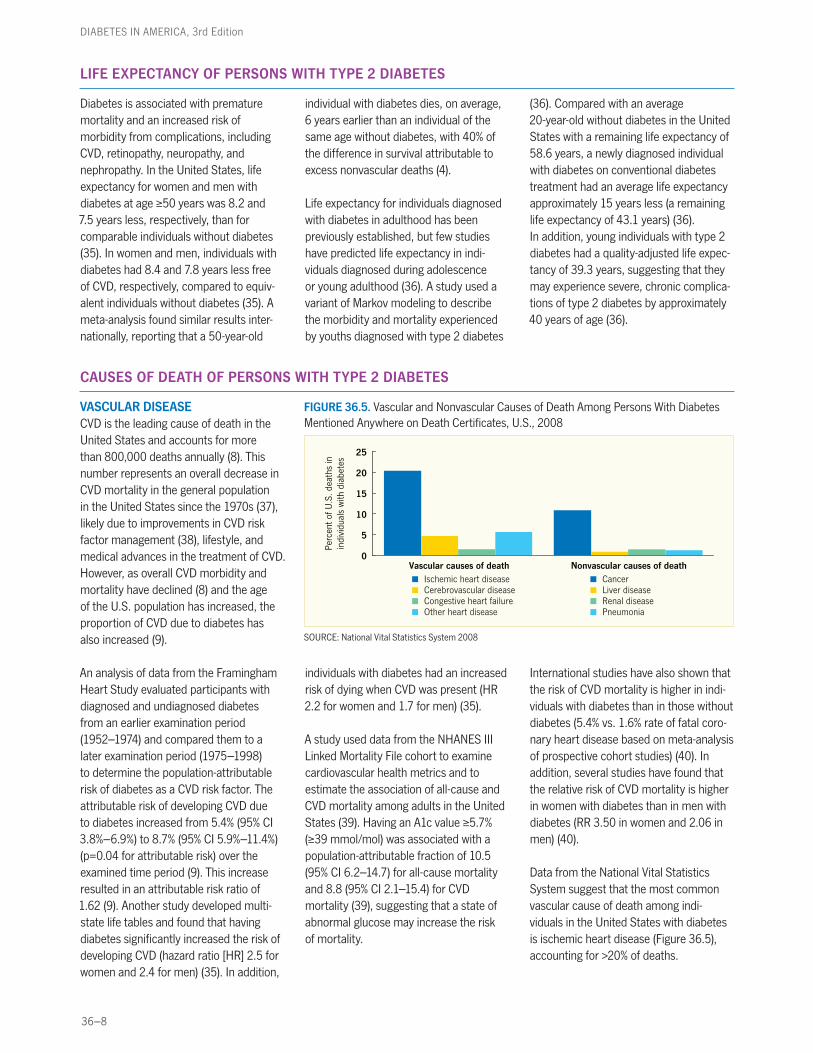
CAUSES OF DEATH OF PERSONS WITH TYPE 2 DIABETES
VASCULAR DISEASECVD is the leading cause of death in the United States and accounts for more than 800,000 deaths annually (8). This number represents an overall decrease in CVD mortality in the general population in the United States since the 1970s (37), likely due to improvements in CVD risk factor management (38), lifestyle, and medical advances in the treatment of CVD. However, as overall CVD morbidity and mortality have declined (8) and the age of the U.S. population has increased, the proportion of CVD due to diabetes has also increased (9).
An analysis of data from the Framingham Heart Study evaluated participants with diagnosed and undiagnosed diabetes from an earlier examination period (1952–1974) and compared them to a later examination period (1975–1998) to determine the population-attributable risk of diabetes as a CVD risk factor. The attributable risk of developing CVD due to diabetes increased from 5.4% (95% CI 3.8%–6.9%) to 8.7% (95% CI 5.9%–11.4%) (p=0.04 for attributable risk) over the examined time period (9). This increase resulted in an attributable risk ratio of 1.62 (9). Another study developed multi-state life tables and found that having diabetes significantly increased the risk of developing CVD (hazard ratio [HR] 2.5 for women and 2.4 for men) (35). In addition,
individuals with diabetes had an increased risk of dying when CVD was present (HR 2.2 for women and 1.7 for men) (35).
A study used data from the NHANES III Linked Mortality File cohort to examine cardiovascular health metrics and to estimate the association of all-cause and CVD mortality among adults in the United States (39). Having an A1c value ≥5.7% (≥39 mmol/mol) was associated with a population-attributable fraction of 10.5 (95% CI 6.2–14.7) for all-cause mortality and 8.8 (95% CI 2.1–15.4) for CVD mor tality (39), suggesting that a state of abnormal glucose may increase the risk of mortality.
International studies have also shown that the risk of CVD mortality is higher in indi-viduals with diabetes than in those without diabetes (5.4% vs. 1.6% rate of fatal coro-nary heart disease based on meta-analysis of prospective cohort studies) (40). In addition, several studies have found that the relative risk of CVD mortality is higher in women with diabetes than in men with diabetes (RR 3.50 in women and 2.06 in men) (40).
Data from the National Vital Statistics System suggest that the most common vascular cause of death among indi-viduals in the United States with diabetes is ischemic heart disease (Figure 36.5), accounting for >20% of deaths.
FIGURE 36.5. Vascular and Nonvascular Causes of Death Among Persons With Diabetes Mentioned Anywhere on Death Certificates, U.S., 2008
Perc
ent o
f U.S
. dea
ths
inin
divi
dual
s w
ith d
iabe
tes
0
5
10
15
20
25
Nonvascular causes of deathCancer
Pneumonia
Liver diseaseRenal disease
Other heart disease
Ischemic heart diseaseCerebrovascular diseaseCongestive heart failure
Vascular causes of death
SOURCE: National Vital Statistics System 2008
Mortality Trends in Type 2 Diabetes
36–9
NONVASCULAR DISEASEDecreases in all-cause mortality in the general population of the United States have been accompanied by decreases in all-cause mortality in individuals with diabetes with varying sex-specific rates depending on study methodology (5,6). Vascular disease is the most common cause of death among individuals with diabetes in the United States and accounts for the majority of diabetes-associated mortality. However, nonvascular causes of death have also been associated with diabetes and contribute significantly to mortality rates (Figure 36.5). Analysis of data from the National Vital Statistics System shows that 10.9% of nonvascular deaths in indi-viduals with diabetes can be attributed to cancer (Figure 36.5). Liver disease and renal disease account for 0.8% and 1.5% of nonvascular deaths, respec tively (Figure 36.5). Pneumonia infections account for 1.3% in total (Figure 36.5). The majority of deaths associated with diabetes (23.4%) are difficult to charac-terize in either vascular or nonvascular causes and are classified as other cause. These other causes are not accounted for in Figure 36.5.
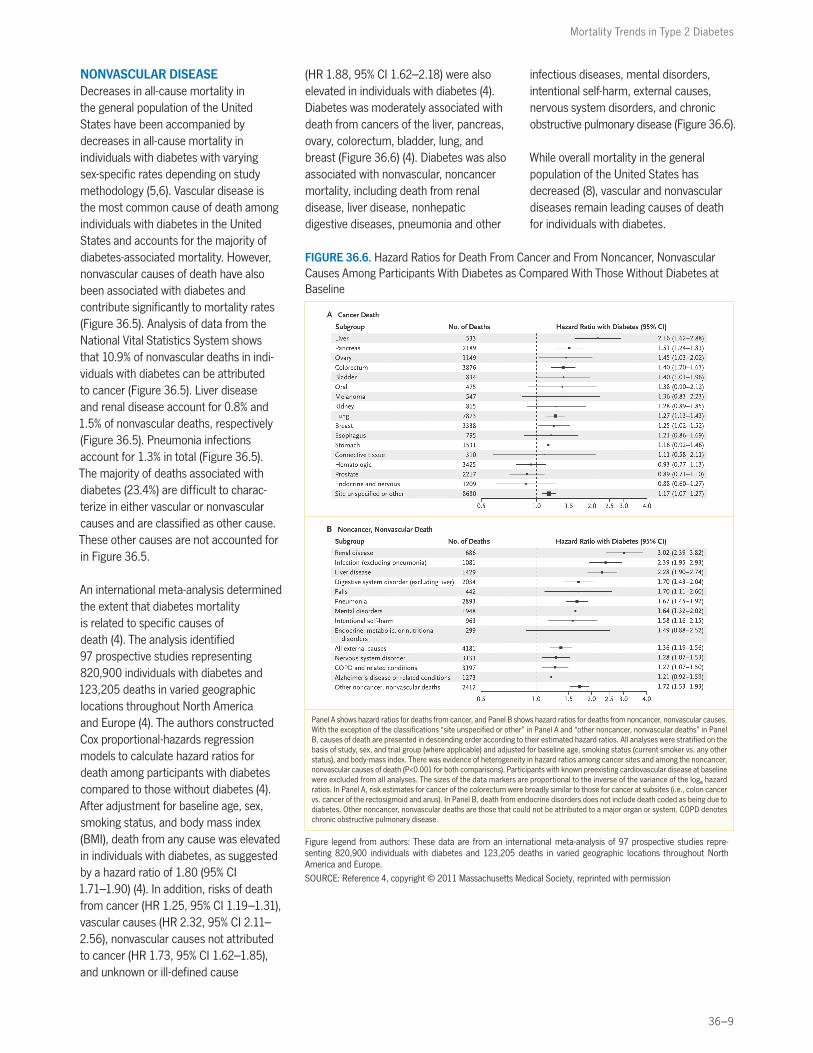
An international meta-analysis determined the extent that diabetes mortality is related to specific causes of death (4). The analysis identified 97 prospective studies representing 820,900 indivi duals with diabetes and 123,205 deaths in varied geographic locations throughout North America and Europe (4). The authors constructed Cox proportional-hazards regression models to calculate hazard ratios for death among participants with diabetes compared to those without diabetes (4). After adjustment for baseline age, sex, smoking status, and body mass index (BMI), death from any cause was elevated in individuals with diabetes, as suggested by a hazard ratio of 1.80 (95% CI 1.71–1.90) (4). In addition, risks of death from cancer (HR 1.25, 95% CI 1.19–1.31), vascular causes (HR 2.32, 95% CI 2.11–2.56), nonvascular causes not attributed to cancer (HR 1.73, 95% CI 1.62–1.85), and unknown or ill-defined cause
(HR 1.88, 95% CI 1.62–2.18) were also elevated in individuals with diabetes (4). Diabetes was moderately associated with death from cancers of the liver, pancreas, ovary, colorectum, bladder, lung, and breast (Figure 36.6) (4). Diabetes was also associated with nonvascular, noncancer mortality, including death from renal disease, liver disease, nonhepatic digestive diseases, pneumonia and other
infectious diseases, mental disorders, intentional self-harm, external causes, nervous system disorders, and chronic obstructive pulmonary disease (Figure 36.6).
While overall mortality in the general population of the United States has decreased (8), vascular and nonvascular diseases remain leading causes of death for individuals with diabetes.
FIGURE 36.6. Hazard Ratios for Death From Cancer and From Noncancer, Nonvascular Causes Among Participants With Diabetes as Compared With Those Without Diabetes at Baseline
Panel A shows hazard ratios for deaths from cancer, and Panel B shows hazard ratios for deaths from noncancer, nonvascular causes. With the exception of the classifications “site unspecified or other” in Panel A and “other noncancer, nonvascular deaths” in Panel B, causes of death are presented in descending order according to their estimated hazard ratios. All analyses were stratified on the basis of study, sex, and trial group (where applicable) and adjusted for baseline age, smoking status (current smoker vs. any other status), and body-mass index. There was evidence of heterogeneity in hazard ratios among cancer sites and among the noncancer, nonvascular causes of death (P<0.001 for both comparisons). Participants with known preexisting cardiovascular disease at baseline were excluded from all analyses. The sizes of the data markers are proportional to the inverse of the variance of the loge hazard ratios. In Panel A, risk estimates for cancer of the colorectum were broadly similar to those for cancer at subsites (i.e., colon cancer vs. cancer of the rectosigmoid and anus). In Panel B, death from endocrine disorders does not include death coded as being due to diabetes. Other noncancer, nonvascular deaths are those that could not be attributed to a major organ or system. COPD denotes chronic obstructive pulmonary disease.
Figure legend from authors: These data are from an international meta-analysis of 97 prospective studies repre-senting 820,900 individuals with diabetes and 123,205 deaths in varied geographic locations throughout North America and Europe.
SOURCE: Reference 4, copyright © 2011 Massachusetts Medical Society, reprinted with permission
36–10
DIABETES IN AMERICA, 3rd Edition
CARDIOVASCULAR RISK FACTORS IN PERSONS WITH DIABETES
The preceding sections outline the interplay among diabetes in CVD, the increasing CVD burden attributed to diabetes, and CVD-related diabetes mortality. CVD risk factor control is there-fore critical to reducing CVD morbidity and mortality in those with diabetes. While the benefits of tight glycemic control with respect to mortality and cardiovascular risk in individuals with diabetes remain an ongoing controversial issue (41), studies have indicated a mortality benefit from statin therapy (42) and blood pressure control (43).
Regarding cholesterol management, a clinical trial examining atorvastatin for primary prevention of CVD in individuals with type 2 diabetes was terminated early because of a significantly improved cardio-vascular profile in the treatment group (42). After a median follow-up of 3.9 years, acute coronary heart disease events were reduced by 36%, coronary revas-cularizations by 31%, and rate of stroke by 48% (42). In addition, an international meta-analysis of clinical trial data from 18,686 individuals with diabetes analyzed treatment effects with each trial weighted
by the absolute low-density lipoprotein (LDL) cholesterol difference in that trial at the end of the first year of follow-up (44). The analysis showed a vascular mortality risk of 0.87 (p=0.008) per 1.0 mmol/L (38.6 mg/dL) reduction in LDL cholesterol (44).
For blood pressure, the United Kingdom Prospective Diabetes Study (UKPDS) found that achieving mean blood pressure levels of 144/82 mmHg compared with 154/87 mmHg (p<0.0001) in the less tight control group was associated with a 32% reduction in deaths related to diabetes (95% CI 6%–51%, p=0.019) (43) and that blood pressure control needed to be maintained for long-term benefits (45). However, blood pressure targets for individuals with diabetes remain controversial, and studies, including the Action to Control Cardiovascular Risk in Diabetes (ACCORD) trial, have shown that stringent control of blood pressure does not improve mortality outcomes (46).
Despite the benefits of cholesterol and adequate blood pressure control in diabetes (42,43), individuals with diabetes
remain suboptimally controlled compared to those without diabetes (47). In a review of national data on CVD risk factors in individuals with diabetes collected as part of the NHANES 1988–2010, 56.2% of individuals with diabetes achieved LDL cholesterol below target (≤100 mg/dL [2.59 mmol/L]), 51.1% had blood pres-sure below target (≤130/80 mmHg), and 52.5% had A1c at target (<7.0% [<53 mmol/mol]) (48). Similar results were found among individuals with diabetes in the Framingham Heart Study, as 23.1% had their LDL cholesterol optimally controlled, only 14% had their hyperten-sion optimally controlled, 17.1% were still smoking cigarettes, and 61.8% were obese (49).
These findings emphasize the impor-tance of cholesterol and blood pressure control among individuals with diabetes, particularly as individuals with diabetes have not had the necessary risk factor reductions compared to their nondiabetic counterparts in order to overcome the increased risk of CVD that is associated with diabetes.
NATIONAL TRENDS OVER TIME
The prevalence of diabetes is increasing, and this increase has been well established by multiple national data sources, including the NHANES and BRFSS (27,28). However, as these sources of data do not follow the same populations longitudinally, these studies cannot be used to estimate risk of disease development. Prevalence estimates will increase if the actual disease becomes more frequent or if affected individuals have improved survival. Therefore, incidence rates are critical in order to elucidate whether increases in prevalence are truly due to an increase in new cases, and these rates can only be calculated from cohort studies.
According to data from the Framingham Heart Study, the incidence rate of diabetes doubled between the 1970s and
the 1990s, increasing from 2.0% to 3.7% in women and from 2.7% to 5.8% in men (50). While not a nationally representative sample, these results are an estimate of national trends in diabetes incidence rates.
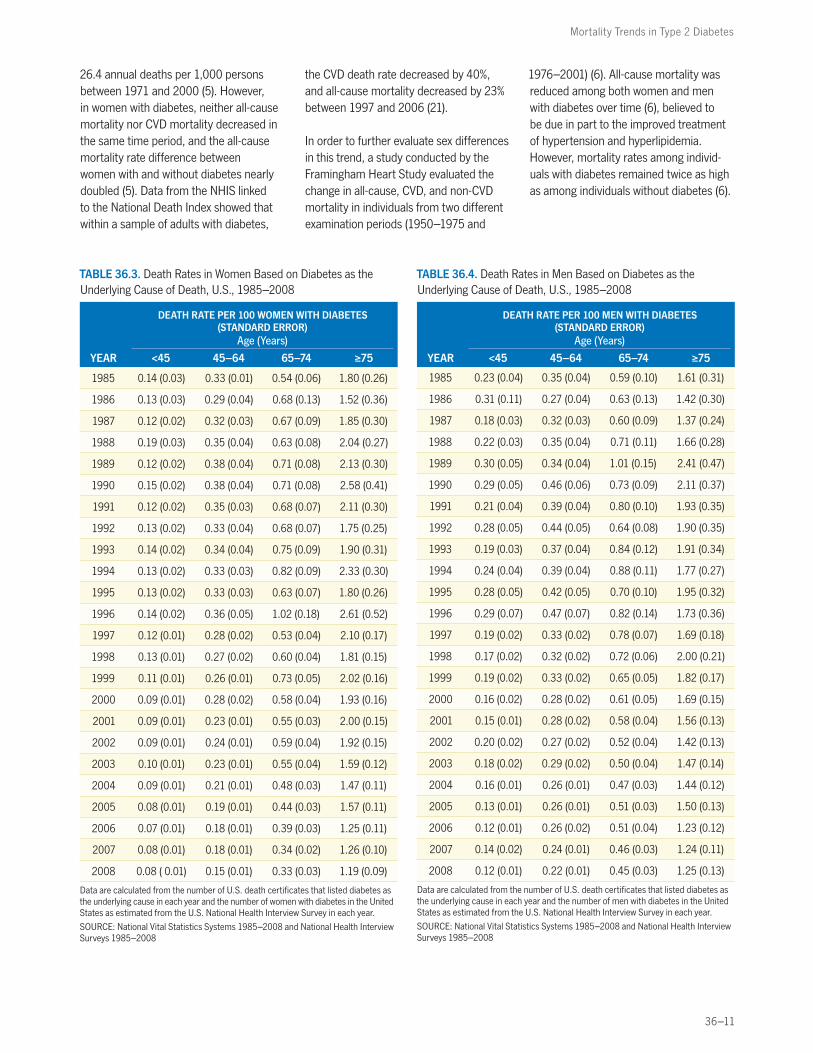
Concomitantly, CVD mortality rates decreased in the U.S. population as a whole (37), and declines in mortality rates among individuals with and without diabetes have been observed (37,51,52).These changes have contributed to a decrease in death rates in both women and men with diabetes over time (Tables 36.3 and 36.4). For women, death rates across all age groups have decreased by almost one-half between 1985 and 2008 (Table 36.3), and for men, the trend is similar, although the relative change in rates is smaller (Table 36.4). The data outlined in Tables 36.3 and 36.4
were calculated for Diabetes in America from the number of U.S. death certificates that list diabetes as the underlying cause each year and the number of people with diabetes in the United States as estimated from the NHIS. As discussed in detail, these sources have inherent limitations, and the calculated death rate is likely an underestimation of the true burden of diabetes mortality.
Despite these changes, individuals with diabetes still have a twofold to fourfold increased relative risk of CVD, in addition to a threefold increased relative risk of mortality (5,7). In an analysis of national trends from the NHANES dataset, among men with diabetes, the absolute all-cause mortality decreased by 18.2 annual deaths per 1,000 persons, and the absolute CVD mortality decreased by
Mortality Trends in Type 2 Diabetes
36–11
26.4 annual deaths per 1,000 persons between 1971 and 2000 (5). However, in women with diabetes, neither all-cause mortality nor CVD mortality decreased in the same time period, and the all-cause mortality rate difference between women with and without diabetes nearly doubled (5). Data from the NHIS linked to the National Death Index showed that within a sample of adults with diabetes,
the CVD death rate decreased by 40%, and all-cause mortality decreased by 23% between 1997 and 2006 (21).
In order to further evaluate sex differences in this trend, a study conducted by the Framingham Heart Study evaluated the change in all-cause, CVD, and non-CVD mortality in individuals from two different examination periods (1950–1975 and
1976–2001) (6). All-cause mortality was reduced among both women and men with diabetes over time (6), believed to be due in part to the improved treatment of hypertension and hyper lipidemia. However, mortality rates among individ-uals with diabetes remained twice as high as among individuals without diabetes (6).
TABLE 36.3. Death Rates in Women Based on Diabetes as the Underlying Cause of Death, U.S., 1985–2008
DEATH RATE PER 100 WOMEN WITH DIABETES (STANDARD ERROR)
Age (Years)
YEAR <45 45–64 65–74 ≥75
1985 0.14 (0.03) 0.33 (0.01) 0.54 (0.06) 1.80 (0.26)
1986 0.13 (0.03) 0.29 (0.04) 0.68 (0.13) 1.52 (0.36)
1987 0.12 (0.02) 0.32 (0.03) 0.67 (0.09) 1.85 (0.30)
1988 0.19 (0.03) 0.35 (0.04) 0.63 (0.08) 2.04 (0.27)
1989 0.12 (0.02) 0.38 (0.04) 0.71 (0.08) 2.13 (0.30)
1990 0.15 (0.02) 0.38 (0.04) 0.71 (0.08) 2.58 (0.41)
1991 0.12 (0.02) 0.35 (0.03) 0.68 (0.07) 2.11 (0.30)
1992 0.13 (0.02) 0.33 (0.04) 0.68 (0.07) 1.75 (0.25)
1993 0.14 (0.02) 0.34 (0.04) 0.75 (0.09) 1.90 (0.31)
1994 0.13 (0.02) 0.33 (0.03) 0.82 (0.09) 2.33 (0.30)
1995 0.13 (0.02) 0.33 (0.03) 0.63 (0.07) 1.80 (0.26)
1996 0.14 (0.02) 0.36 (0.05) 1.02 (0.18) 2.61 (0.52)
1997 0.12 (0.01) 0.28 (0.02) 0.53 (0.04) 2.10 (0.17)
1998 0.13 (0.01) 0.27 (0.02) 0.60 (0.04) 1.81 (0.15)
1999 0.11 (0.01) 0.26 (0.01) 0.73 (0.05) 2.02 (0.16)
2000 0.09 (0.01) 0.28 (0.02) 0.58 (0.04) 1.93 (0.16)
2001 0.09 (0.01) 0.23 (0.01) 0.55 (0.03) 2.00 (0.15)
2002 0.09 (0.01) 0.24 (0.01) 0.59 (0.04) 1.92 (0.15)
2003 0.10 (0.01) 0.23 (0.01) 0.55 (0.04) 1.59 (0.12)
2004 0.09 (0.01) 0.21 (0.01) 0.48 (0.03) 1.47 (0.11)
2005 0.08 (0.01) 0.19 (0.01) 0.44 (0.03) 1.57 (0.11)
2006 0.07 (0.01) 0.18 (0.01) 0.39 (0.03) 1.25 (0.11)
2007 0.08 (0.01) 0.18 (0.01) 0.34 (0.02) 1.26 (0.10)
2008 0.08 ( 0.01) 0.15 (0.01) 0.33 (0.03) 1.19 (0.09)
Data are calculated from the number of U.S. death certificates that listed diabetes as the underlying cause in each year and the number of women with diabetes in the United States as estimated from the U.S. National Health Interview Survey in each year.
SOURCE: National Vital Statistics Systems 1985–2008 and National Health Interview Surveys 1985–2008
TABLE 36.4. Death Rates in Men Based on Diabetes as the Underlying Cause of Death, U.S., 1985–2008
DEATH RATE PER 100 MEN WITH DIABETES (STANDARD ERROR)
Age (Years)
YEAR <45 45–64 65–74 ≥75
1985 0.23 (0.04) 0.35 (0.04) 0.59 (0.10) 1.61 (0.31)
1986 0.31 (0.11) 0.27 (0.04) 0.63 (0.13) 1.42 (0.30)
1987 0.18 (0.03) 0.32 (0.03) 0.60 (0.09) 1.37 (0.24)
1988 0.22 (0.03) 0.35 (0.04) 0.71 (0.11) 1.66 (0.28)
1989 0.30 (0.05) 0.34 (0.04) 1.01 (0.15) 2.41 (0.47)
1990 0.29 (0.05) 0.46 (0.06) 0.73 (0.09) 2.11 (0.37)
1991 0.21 (0.04) 0.39 (0.04) 0.80 (0.10) 1.93 (0.35)
1992 0.28 (0.05) 0.44 (0.05) 0.64 (0.08) 1.90 (0.35)
1993 0.19 (0.03) 0.37 (0.04) 0.84 (0.12) 1.91 (0.34)
1994 0.24 (0.04) 0.39 (0.04) 0.88 (0.11) 1.77 (0.27)
1995 0.28 (0.05) 0.42 (0.05) 0.70 (0.10) 1.95 (0.32)
1996 0.29 (0.07) 0.47 (0.07) 0.82 (0.14) 1.73 (0.36)
1997 0.19 (0.02) 0.33 (0.02) 0.78 (0.07) 1.69 (0.18)
1998 0.17 (0.02) 0.32 (0.02) 0.72 (0.06) 2.00 (0.21)
1999 0.19 (0.02) 0.33 (0.02) 0.65 (0.05) 1.82 (0.17)
2000 0.16 (0.02) 0.28 (0.02) 0.61 (0.05) 1.69 (0.15)
2001 0.15 (0.01) 0.28 (0.02) 0.58 (0.04) 1.56 (0.13)
2002 0.20 (0.02) 0.27 (0.02) 0.52 (0.04) 1.42 (0.13)
2003 0.18 (0.02) 0.29 (0.02) 0.50 (0.04) 1.47 (0.14)
2004 0.16 (0.01) 0.26 (0.01) 0.47 (0.03) 1.44 (0.12)
2005 0.13 (0.01) 0.26 (0.01) 0.51 (0.03) 1.50 (0.13)
2006 0.12 (0.01) 0.26 (0.02) 0.51 (0.04) 1.23 (0.12)
2007 0.14 (0.02) 0.24 (0.01) 0.46 (0.03) 1.24 (0.11)
2008 0.12 (0.01) 0.22 (0.01) 0.45 (0.03) 1.25 (0.13)
Data are calculated from the number of U.S. death certificates that listed diabetes as the underlying cause in each year and the number of men with diabetes in the United States as estimated from the U.S. National Health Interview Survey in each year.
SOURCE: National Vital Statistics Systems 1985–2008 and National Health Interview Surveys 1985–2008
36–12
DIABETES IN AMERICA, 3rd Edition
CONCLUSION
Despite advances in cardiovascular risk prevention and declining rates of overall mortality in the United States, individuals with diabetes are at increased risk for both CVD and non-CVD mortality. Diabetes remains a leading cause of death in the United States, and individuals with diabetes have a decreased life expectancy compared to contemporary individuals without diabetes. Many individuals with diabetes have suboptimal control of cardiovascular risk factors, and targeted cardiovascular risk factor management is essential.
LIST OF ABBREVIATIONS
A1c . . . . . . .glycosylated hemoglobin ACCORD . . .Action to Control
Cardiovascular Risk in Diabetes
ADA . . . . . . .American Diabetes Association
ARIC . . . . . .Atherosclerosis Risk in Communities Study
BMI . . . . . . .body mass indexBRFSS . . . . .Behavioral Risk Factor
Surveillance System CI . . . . . . . . .confidence intervalCVD . . . . . . .cardiovascular diseaseHR . . . . . . . .hazard ratioLDL . . . . . . .low-density lipoproteinNHANES . . .National Health and
Nutrition Examination Survey
NHIS . . . . . .National Health Interview Survey
RR . . . . . . . .relative riskTRIAD . . . . .Translating Research
into Action for Diabetes Study
UKPDS . . . .United Kingdom Prospective Diabetes Study
CONVERSIONS
Conversions for A1c, glucose, and LDL cholesterol values are provided in Diabetes in America Appendix 1 Conversions.
DUALITY OF INTEREST
The authors reported no conflicts of interest.
REFERENCES
1 . Mokdad AH, Ford ES, Bowman BA, Nelson DE, Engelgau MM, Vinicor F, Marks JS: The continuing increase of diabetes in the US. Diabetes Care 24:412, 2001
2 . Mokdad AH, Bowman BA, Ford ES, Vinicor F, Marks JS, Koplan JP: The continuing epidemics of obesity and diabetes in the United States. JAMA 286:1195–1200, 2001
3 . Emerging Risk Factors Collaboration, Sarwar N, Gao P, Seshasai SR, Gobin R, Kaptoge S, Di Angelantonio E, Ingelsson E, Lawlor DA, Selvin E, Stampfer M, Stehouwer CD, Lewington S, Pennells L, Thompson A, Sattar N, White IR, Ray KK, Danesh J: Diabetes mellitus, fasting blood glucose concentration, and risk of vascular disease: a collaborative meta-analysis of 102 prospective studies. Lancet 375:2215–2222, 2010
4 . Emerging Risk Factors Collaboration, Seshasai SR, Kaptoge S, Thompson A, Di Angelantonio E, Gao P, Sarwar N, Whincup PH, Mukamal KJ, Gillum RF, Holme I, Njolstad I, Fletcher A, Nilsson P, Lewington S, Collins R, Gudnason V, Thompson SG, Sattar N, Selvin E, Hu FB, Danesh J: Diabetes mellitus, fasting glucose, and risk of cause-specific death. N Engl J Med 364:829–841, 2011
5 . Gregg EW, Gu Q, Cheng YJ, Narayan KM, Cowie CC: Mortality trends in men and women with diabetes, 1971 to 2000. Ann Intern Med 147:149–155, 2007
6 . Preis SR, Hwang SJ, Coady S, Pencina MJ, D’Agostino RB Sr, Savage PJ, Levy D, Fox CS: Trends in all-cause and cardiovascular disease mortality among women and men with and without diabetes mellitus in the Framingham Heart Study, 1950 to 2005. Circulation 119:1728–1735, 2009
7 . Fox CS, Coady S, Sorlie PD, Levy D, Meigs JB, D’Agostino RB Sr, Wilson PW, Savage PJ: Trends in cardiovascular complications of diabetes. JAMA 292:2495–2499, 2004
8 . Roger VL, Go AS, Lloyd-Jones DM, Benjamin EJ, Berry JD, Borden WB, Bravata DM, Dai S, Ford ES, Fox CS, Fullerton HJ, Gillespie C, Hailpern SM, Heit JA, Howard VJ, Kissela BM, Kittner SJ, Lackland DT, Lichtman JH, Lisabeth LD,
Makuc DM, Marcus GM, Marelli A, Matchar DB, Moy CS, Mozaffarian D, Mussolino ME, Nichol G, Paynter NP, Soliman EZ, Sorlie PD, Sotoodehnia N, Turan TN, Virani SS, Wong ND, Woo D, Turner MB; American Heart Association Statistics Committee and Stroke Statistics Subcommittee: Executive summary: heart disease and stroke statistics—2012 update: a report from the American Heart Association. Circulation 125:188–197, 2012
9 . Fox CS, Coady S, Sorlie PD, D’Agostino RB Sr, Pencina MJ, Vasan RS, Meigs JB, Levy D, Savage PJ: Increasing cardio-vascular disease burden due to diabetes mellitus: the Framingham Heart Study. Circulation 115:1544–1550, 2007
10 . Genuth S, Alberti KG, Bennett P, Buse J, Defronzo R, Kahn R, Kitzmiller J, Knowler WC, Lebovitz H, Lernmark A, Nathan D, Palmer J, Rizza R, Saudek C, Shaw J, Steffes M, Stern M, Tuomilehto J, Zimmet P; Expert Committee on the Diagnosis and Classification of Diabetes Mellitus: Follow-up report on the diag-nosis of diabetes mellitus. Diabetes Care 26:3160–3167, 2003
11 . Gittelsohn A, Senning J: Studies on the reliability of vital and health records: I. Comparison of cause of death and hospital record diagnoses. Am J PublicHealth 69:680–689, 1979
12 . Classification and diagnosis of diabetes mellitus and other categories of glucose intolerance. National Diabetes Data Group. Diabetes 28:1039–1057, 1979
13 . Report of the expert committee on the diagnosis and classification of diabetes mellitus. Diabetes Care 20:1183–1197, 1997
14 . The International Expert Committee. International Expert Committee report on the role of the A1C assay in the diagnosis of diabetes. Diabetes Care 32:1327–1334, 2009
15 . Schwartz LM, Woloshin S: Changing disease definitions: implications for disease prevalence. Analysis of the Third National Health and Nutrition Examination Survey, 1988–1994. Eff Clin Pract 2:76–85, 1999
Mortality Trends in Type 2 Diabetes
36–13
16 . Tapp RJ, Tikellis G, Wong TY, Harper CA, Zimmet PZ, Shaw JE; Australian Diabetes Obesity and Lifestyle Study Group: Longitudinal association of glucose metabolism with retinopathy: results from the Australian Diabetes Obesity and Lifestyle (AusDiab) study. Diabetes Care 31:1349–1354, 2008
17 . Selvin E, Steffes MW, Zhu H, Matsushita K, Wagenknecht L, Pankow J, Coresh J, Brancati FL: Glycated hemoglobin, diabetes, and cardiovascular risk in nondi-abetic adults. N Engl J Med 362:800–811, 2010
18 . Wang H, Shara NM, Lee ET, Devereux R, Calhoun D, de Simone G, Umans JG, Howard BV: Hemoglobin A1c, fasting glucose, and cardiovascular risk in a population with high prevalence of diabetes: the Strong Heart Study. Diabetes Care 34:1952–1958, 2011
19 . Sarwar N, Aspelund T, Eiriksdottir G, Gobin R, Seshasai SR, Forouhi NG, Sigurdsson G, Danesh J, Gudnason V: Markers of dysglycaemia and risk of coronary heart disease in people without diabetes: Reykjavik prospective study and systematic review. PLoS Med 7:e1000278, 2010
20 . Cowie CC, Rust KF, Byrd-Holt DD, Gregg EW, Ford ES, Geiss LS, Bainbridge KE, Fradkin JE: Prevalence of diabetes and high risk for diabetes using A1C criteria in the U.S. population in 1988–2006. Diabetes Care 33:562–568, 2010
21 . Gregg EW, Cheng YJ, Saydah S, Cowie C, Garfield S, Geiss L, Barker L: Trends in death rates among U.S. adults with and without diabetes between 1997 and 2006: findings from the National Health Interview Survey. Diabetes Care 35:1252–1257, 2012
22 . Molenaar EA, Van Ameijden EJ, Grobbee DE, Numans ME: Comparison of routine care self-reported and biometrical data on hypertension and diabetes: results of the Utrecht Health Project. Eur J Public Health 17:199–205, 2007
23 . Li C, Balluz LS, Ford ES, Okoro CA, Zhao G, Pierannunzi C: A comparison of prevalence estimates for selected health indicators and chronic diseases or conditions from the Behavioral Risk Factor Surveillance System, the National Health Interview Survey, and the National Health and Nutrition Examination Survey, 2007–2008. Prev Med 54:381–387, 2012
24 . Bild DE, Stevenson JM: Frequency of recording of diabetes on U.S. death certificates: analysis of the 1986 National Mortality Followback Survey. J Clin Epidemiol 45:275–281, 1992
25 . O’Sullivan JB, Mahan CM: Mortality related to diabetes and blood glucose levels in a community study. Am J Epidemiol 116:678–684, 1982
26 . McEwen LN, Karter AJ, Curb JD, Marrero DG, Crosson JC, Herman WH: Temporal trends in recording of diabetes on death certificates: results from Translating Research Into Action for Diabetes (TRIAD). Diabetes Care 34:1529–1533, 2011
27 . Mokdad AH, Ford ES, Bowman BA, Dietz WH, Vinicor F, Bales VS, Marks JS: Prevalence of obesity, diabetes, and obesity-related health risk factors, 2001. JAMA 289:76–79, 2003
28 . Cowie CC, Rust KF, Ford ES, Eberhardt MS, Byrd-Holt DD, Li C, Williams DE, Gregg EW, Bainbridge KE, Saydah SH, Geiss LS: Full accounting of diabetes and pre-diabetes in the U.S. population in 1988–1994 and 2005–2006. Diabetes Care 32:287–294, 2009
29 . Gregg EW, Cadwell BL, Cheng YJ, Cowie CC, Williams DE, Geiss L, Engelgau MM, Vinicor F: Trends in the prevalence and ratio of diagnosed to undiagnosed diabetes according to obesity levels in the U.S. Diabetes Care 27:2806–2812, 2004
30 . Heron M: Deaths: leading causes for 2008. Natl Vital Stat Rep 60:1–94, 2012
31 . McEwen LN, Kim C, Haan M, Ghosh D, Lantz PM, Mangione CM, Safford MM, Marrero D, Thompson TJ, Herman WH; TRIAD Study Group: Diabetes reporting as a cause of death: results from the Translating Research Into Action for Diabetes (TRIAD) study. Diabetes Care 29:247–253, 2006
32 . Geiss L, Herman W, Smith P: Mortality in non-insulin-dependent diabetes. In Diabetes in America. 2nd ed. Harris MI, Cowie CC, Stern MP, Boyko EJ, Reiber GE, Bennett PH, Eds. Bethesda, MD, National Institutes of Health, NIH Pub No. 95–1468, 1995, p. 233–258
33 . Gu K, Cowie CC, Harris MI: Mortality in adults with and without diabetes in a national cohort of the U.S. population, 1971–1993. Diabetes Care 21:1138–1145, 1998
34 . Taylor KS, Heneghan CJ, Farmer AJ, Fuller AM, Adler AI, Aronson JK, Stevens RJ: All-cause and cardiovascular mortality in middle-aged people with type 2 diabetes compared with people without diabetes in a large U.K. primary care database. Diabetes Care 36:2366–2371, 2013
35 . Franco OH, Steyerberg EW, Hu FB, Mackenbach J, Nusselder W: Associations of diabetes mellitus with total life expectancy and life expectancy with and without cardiovascular disease. Arch Intern Med 167:1145–1151, 2007
36 . Rhodes ET, Prosser LA, Hoerger TJ, Lieu T, Ludwig DS, Laffel LM: Estimated morbidity and mortality in adolescents and young adults diagnosed with type 2 diabetes mellitus. Diabet Med 29:453–463, 2012
37 . Cooper R, Cutler J, Desvigne-Nickens P, Fortmann SP, Friedman L, Havlik R, Hogelin G, Marler J, McGovern P, Morosco G, Mosca L, Pearson T, Stamler J, Stryer D, Thom T: Trends and disparities in coronary heart disease, stroke, and other cardiovascular diseases in the United States: findings of the National Conference on Cardiovascular Disease Prevention. Circulation 102:3137–3147, 2000
38 . Ford ES, Ajani UA, Croft JB, Critchley JA, Labarthe DR, Kottke TE, Giles WH, Capewell S: Explaining the decrease in U.S. deaths from coronary disease, 1980–2000. N Engl J Med 356:2388–2398, 2007
39 . Yang Q, Cogswell ME, Flanders WD, Hong Y, Zhang Z, Loustalot F, Gillespie C, Merritt R, Hu FB: Trends in cardiovascular health metrics and associations with all-cause and CVD mortality among US adults. JAMA 307:1273–1283, 2012
40 . Huxley R, Barzi F, Woodward M: Excess risk of fatal coronary heart disease associated with diabetes in men and women: meta-analysis of 37 prospective cohort studies. BMJ 332:73–78, 2006
41 . Rutter M: Low HbA1c and mortality: causation and confounding. Diabetologia 55:2307–2311, 2012
42 . Colhoun HM, Betteridge DJ, Durrington PN, Hitman GA, Neil HA, Livingstone SJ, Thomason MJ, Mackness MI, Charlton-Menys V, Fuller JH; CARDS investigators: Primary prevention of cardiovascular disease with atorvastatin in type 2 diabetes in the Collaborative Atorvastatin Diabetes Study (CARDS): multicentre randomised placebo-controlled trial. Lancet 364:685–696, 2004
43 . Tight blood pressure control and risk of macrovascular and microvascular complications in type 2 diabetes: UKPDS 38. UK Prospective Diabetes Study Group. BMJ 317:703–713, 1998
44 . Cholesterol Treatment Trialists’ (CTT) Collaborators, Kearney PM, Blackwell L, Collins R, Keech A, Simes J, Peto R, Armitage J, Baigent C: Efficacy of cholesterol-lowering therapy in 18,686 people with diabetes in 14 randomised trials of statins: a meta-analysis. Lancet 371:117–125, 2008
36–14
DIABETES IN AMERICA, 3rd Edition
45 . Holman RR, Paul SK, Bethel MA, Neil HA, Matthews DR: Long-term follow-up after tight control of blood pressure in type 2 diabetes. N Engl J Med 359:1565–1576, 2008
46 . ACCORD Study Group, Cushman WC, Evans GW, Byington RP, Goff DC Jr, Grimm RH Jr, Cutler JA, Simons-Morton DG, Basile JN, Corson MA, Probstfield JL, Katz L, Peterson KA, Friedewald WT, Buse JB, Bigger JT, Gerstein HC, Ismail-Beigi F: Effects of intensive blood-pressure control in type 2 diabetes mellitus. N Engl J Med 362:1575–1585, 2010
47 . Saydah SH, Fradkin J, Cowie CC: Poor control of risk factors for vascular disease among adults with previously diagnosed diabetes. JAMA 291:335–342, 2004
48 . Stark Casagrande S, Fradkin JE, Saydah SH, Rust KF, Cowie CC: The prevalence of meeting A1C, blood pressure, and LDL goals among people with diabetes, 1988–2010. Diabetes Care 36:2271–2279, 2013
49 . Preis SR, Pencina MJ, Hwang SJ, D’Agostino RB Sr, Savage PJ, Levy D, Fox CS: Trends in cardiovascular disease risk factors in individuals with and without diabetes mellitus in the Framingham Heart Study. Circulation 120:212–220, 2009
50 . Fox CS, Pencina MJ, Meigs JB, Vasan RS, Levitzky YS, D’Agostino RB Sr: Trends in the incidence of type 2 diabetes mellitus from the 1970s to the 1990s: the Framingham Heart Study. Circulation 113:2914–2918, 2006
51 . Thomas RJ, Palumbo PJ, Melton LJ 3rd, Roger VL, Ransom J, O’Brien PC, Leibson CL: Trends in the mortality burden associated with diabetes mellitus: a population-based study in Rochester, Minn, 1970–1994. Arch Intern Med 163:445–451, 2003
52 . Tierney EF, Cadwell BL, Engelgau MM, Shireley L, Parsons SL, Moum K, Geiss LS: Declining mortality rate among people with diabetes in North Dakota, 1997–2002. Diabetes Care 27:2723–2725, 2004
53 . Hu FB, Stampfer MJ, Solomon CG, Liu S, Willett WC, Speizer FE, Nathan DM, Manson JE: The impact of diabetes mellitus on mortality from all causes and coronary heart disease in women: 20 years of follow-up. Arch Intern Med 161:1717–1723, 2001
54 . Doshi KB, Kashyap SR, Brennan DM, Hoar BM, Cho L, Hoogwerf BJ: All-cause mortality risk predictors in a preventive cardiology clinic cohort-exam-ining diabetes and individual metabolic syndrome criteria: a PRECIS database study. Diabetes Obes Metab 11:102–108, 2009
55 . Pavkov ME, Bennett PH, Knowler WC, Krakoff J, Sievers ML, Nelson RG: Effect of youth-onset type 2 diabetes mellitus on incidence of end-stage renal disease and mortality in young and middle-aged Pima Indians. JAMA 296:421–426, 2006
56 . Hoehner CM, Williams DE, Sievers ML, Knowler WC, Bennett PH, Nelson RG: Trends in heart disease death rates in diabetic and nondiabetic Pima Indians. J Diabetes Complications 20:8–13, 2006
57 . Cho E, Rimm EB, Stampfer MJ, Willett WC, Hu FB: The impact of diabetes mellitus and prior myocardial infarction on mortality from all causes and from coronary heart disease in men. J Am Coll Cardiol 40:954–960, 2002
58 . Kuller LH, Velentgas P, Barzilay J, Beauchamp NJ, O’Leary DH, Savage PJ: Diabetes mellitus: subclinical cardio-vascular disease and risk of incident cardiovascular disease and all-cause mortality. Arterioscler Thromb Vasc Biol 20:823–829, 2000
59 . Wei M, Gaskill SP, Haffner SM, Stern MP: Effects of diabetes and level of glycemia on all-cause and cardiovascular mortality. The San Antonio Heart Study. Diabetes Care 21:1167–1172, 1998
Related Documents