Chapter 33 DC Short-Circuit Analysis To assure the safe operation of DC systems, whenever there are any changes in the system related to sources, loads, and power transmission components, a DC Short-Circuit Analysis must be carried out to evaluate system conditions under a fault and assess protective device ratings. A complete short-circuit calculation should provide details of fault current variations at the fault location as well as for contributing branches, from the initiation of the fault to its end. Due to the complexities involved in source behaviors and the nonlinearity characteristics of the equipment, such calculations are very extensive and therefore the maximum short-circuit current is often calculated for examination of protective device ratings. Operation Technology, Inc. 33-1 ETAP 7.5.2 User Guide

Chapter-33-ETAP-User-Guide-7-5-2.pdf
Nov 30, 2015
Welcome message from author
This document is posted to help you gain knowledge. Please leave a comment to let me know what you think about it! Share it to your friends and learn new things together.
Transcript

Chapter 33
DC Short-Circuit Analysis
To assure the safe operation of DC systems, whenever there are any changes in the system related to sources, loads, and power transmission components, a DC Short-Circuit Analysis must be carried out to evaluate system conditions under a fault and assess protective device ratings. A complete short-circuit calculation should provide details of fault current variations at the fault location as well as for contributing branches, from the initiation of the fault to its end. Due to the complexities involved in source behaviors and the nonlinearity characteristics of the equipment, such calculations are very extensive and therefore the maximum short-circuit current is often calculated for examination of protective device ratings.
Operation Technology, Inc. 33-1 ETAP 7.5.2 User Guide
DC Short-Circuit Analysis Overview In compliance with IEEE Standard 946, the ETAP DC Short-Circuit Module calculates the total fault current, current contributions from different sources, and the rise time constant of the total fault current. It can conduct calculations on both radial and looped systems. The fault under consideration is a short-circuit between the positive and the negative terminals at the fault location. The contributing sources to the short-circuit current include charger/rectifier, UPS, battery, and DC motor. These sources can be modeled as a constant current source or a constant voltage source behind an impedance. For a charger/rectifier source, the AC system equivalent impedance on the AC side can also be considered. For each DC protective device, ETAP calculates the bus fault current as well as the maximum current that flows through the device and flags the user in a prominent color for underrated devices.
The calculation results are reported in a Crystal Reports format as well as in a one-line diagram display. The Crystal Reports format provides detailed information about the study, including all the input data used in the calculation, fault current, contributions from different sources, and device rating validation summary, etc. The user can customize the format and content of the Crystal Reports output report. The one-line diagram display provides you with a direct visual representation of the system under fault conditions. It displays the short-circuit current at the faulted bus, fault current contributions on surrounding branches, as well as the system voltage profile under the fault.
Operation Technology, Inc. 33-2 ETAP 7.5.2 User Guide
DC Short-Circuit Analysis Study Toolbar
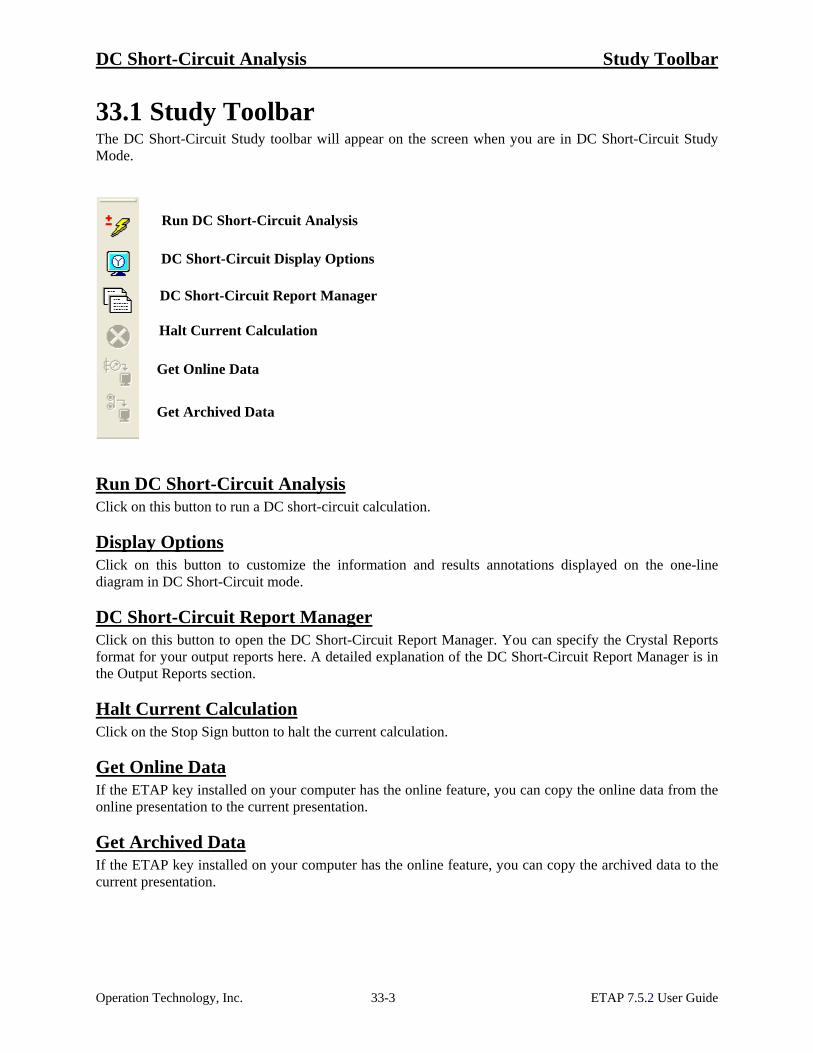
33.1 Study Toolbar The DC Short-Circuit Study toolbar will appear on the screen when you are in DC Short-Circuit Study Mode.
DC Short-Circuit Report Manager
DC Short-Circuit Display Options
Run DC Short-Circuit Analysis
Halt Current Calculation
Get Online Data
Get Archived Data
Run DC Short-Circuit Analysis Click on this button to run a DC short-circuit calculation.
Display Options Click on this button to customize the information and results annotations displayed on the one-line diagram in DC Short-Circuit mode.
DC Short-Circuit Report Manager Click on this button to open the DC Short-Circuit Report Manager. You can specify the Crystal Reports format for your output reports here. A detailed explanation of the DC Short-Circuit Report Manager is in the Output Reports section.
Halt Current Calculation Click on the Stop Sign button to halt the current calculation.
Get Online Data If the ETAP key installed on your computer has the online feature, you can copy the online data from the online presentation to the current presentation.
Get Archived Data If the ETAP key installed on your computer has the online feature, you can copy the archived data to the current presentation.
Operation Technology, Inc. 33-3 ETAP 7.5.2 User Guide
DC Short-Circuit Analysis Study Case Editor
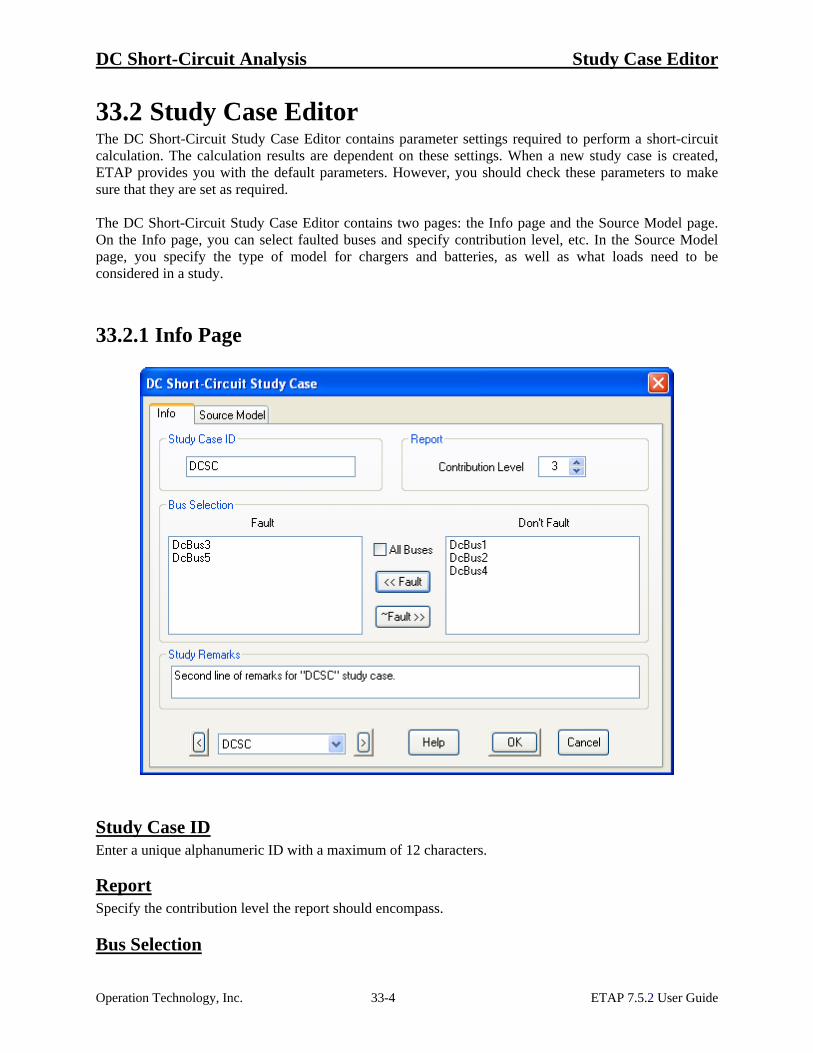
33.2 Study Case Editor The DC Short-Circuit Study Case Editor contains parameter settings required to perform a short-circuit calculation. The calculation results are dependent on these settings. When a new study case is created, ETAP provides you with the default parameters. However, you should check these parameters to make sure that they are set as required. The DC Short-Circuit Study Case Editor contains two pages: the Info page and the Source Model page. On the Info page, you can select faulted buses and specify contribution level, etc. In the Source Model page, you specify the type of model for chargers and batteries, as well as what loads need to be considered in a study.
33.2.1 Info Page
Study Case ID Enter a unique alphanumeric ID with a maximum of 12 characters.
Report Specify the contribution level the report should encompass.
Bus Selection
Operation Technology, Inc. 33-4 ETAP 7.5.2 User Guide
DC Short-Circuit Analysis Study Case Editor Use this area to select which buses to Fault, Don’t Fault, or click on the All Buses checkbox to fault all buses. Note: You can fault buses (or remove faults) directly from the one-line diagram by right-clicking on the desired bus.
Study Remarks You can enter up to 120 alphanumeric characters in this remark box. The information entered here will be printed on the second line of every output report page header. These remarks can provide specific information regarding each study case. The first line of the header information is global for all study cases and entered in the Project Information editor.
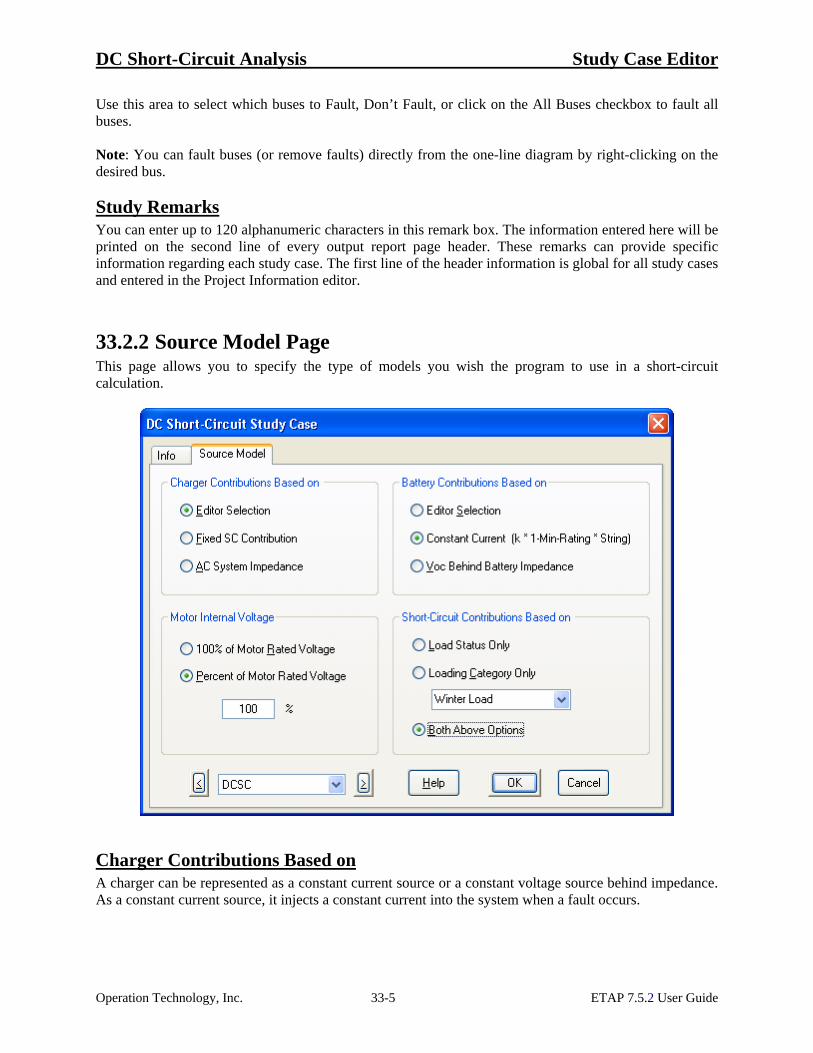
33.2.2 Source Model Page This page allows you to specify the type of models you wish the program to use in a short-circuit calculation.
Charger Contributions Based on A charger can be represented as a constant current source or a constant voltage source behind impedance. As a constant current source, it injects a constant current into the system when a fault occurs.
Operation Technology, Inc. 33-5 ETAP 7.5.2 User Guide
DC Short-Circuit Analysis Study Case Editor Editor Selection Click on this option to select the model type as specified in the editor for individual chargers.
Fixed SC Contribution Click on this option to use the constant current model for all the charges in the system.
AC System Impedance Click on this option to use the constant voltage model for all the charges in the system.
Battery Contributions Based on A battery can be represented as a constant current source or a constant voltage source behind impedance. As a constant current source, it injects a constant current into the system when a fault occurs. The current injected into the system is equal to a constant multiplied by its 1-minute discharge rate.
Editor Selection Click on this option to select the model type as specified in the editor for individual batteries.
Constant Current (K*1-Min-Rating*String) Click on this option to use the constant current model for all the batteries in the system.
Voc Behind Battery Impedance Click on this option to use the constant voltage model for all the batteries in the system.
Motor Internal Voltage A motor, or the motor load portion of a lump load, is modeled as a constant voltage source behind an impedance. You can specify the internal voltage value by selecting one of the following two options:
100% of Motor Rated Voltage Click on this option to use the motor rated voltage as the internal voltage.
Percent of Motor Rated Voltage Click on this option to specify the motor internal voltage in percent based on the motor rated voltage.
Short-Circuit Contributions Based on This group provides you with an option to skip certain load elements in a short-circuit analysis. Static loads are also considered in a DC Short-Circuit Analysis and their presence reduces total fault current.
Load Status Only Select this option to include loads in the Short-Circuit Study based on load status. For the current system configuration, loads that have either the Continuous or Intermittent status will be considered in the study. Loads that have the Spare status will be excluded from the study. When this option is selected, all of the Composite CSD loads will be included in the study.
Load Category Only Select this option to use the loading percent to determine which loads will be included in the short-circuit calculation. Once this option is selected, you can specify a loading category in the Loading Category selection box. All loads that have non-zero loading percent for the selected Loading Category will be included in the short-circuit calculation.
Operation Technology, Inc. 33-6 ETAP 7.5.2 User Guide

DC Short-Circuit Analysis Study Case Editor
Operation Technology, Inc. 33-7 ETAP 7.5.2 User Guide
Use Both Above Options Select this option to use both load status and loading category to determine loads to be included in the short-circuit calculation. When this option is selected, all the loads that satisfy either or both of the above two criterions will be included in the Short-Circuit Study.
DC Short-Circuit Analysis Display Options
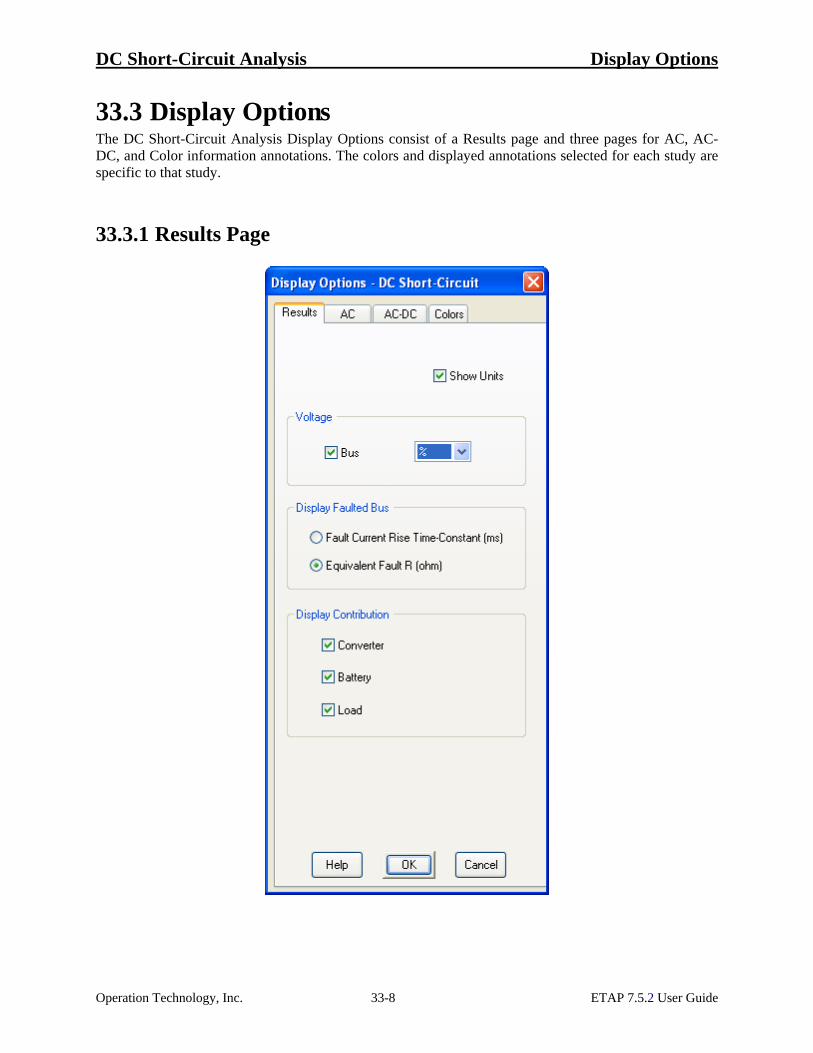
33.3 Display Options The DC Short-Circuit Analysis Display Options consist of a Results page and three pages for AC, AC-DC, and Color information annotations. The colors and displayed annotations selected for each study are specific to that study.
33.3.1 Results Page
Operation Technology, Inc. 33-8 ETAP 7.5.2 User Guide
DC Short-Circuit Analysis Display Options Show Units When this box is checked the unit for the calculation results will be displayed on the one-line diagram along with the results.
Voltage
Bus Click on this checkbox to display bus voltage on the one-line diagram.
Bus Voltage Unit Selection From the drop-down list you can select to display bus voltage as a percentage or in volts.
Display Faulted Bus
Fault Current Rise Time-Constant Click on this option to display the fault current rise time-constant in ms for faulted buses.
Equivalent Fault R Click on this option to display the equivalent fault resistance in ohms for faulted buses.
Display Contribution
Converter, Battery, & Load Click on any or all of these checkboxes to display short-circuit contribution from these components on the one-line diagram.
Operation Technology, Inc. 33-9 ETAP 7.5.2 User Guide

DC Short-Circuit Analysis Display Options
33.3.2 AC Page This page includes options for displaying info annotations for AC elements.
ID Select the checkboxes under this heading to display the ID of the selected AC elements on the one-line diagram.
Operation Technology, Inc. 33-10 ETAP 7.5.2 User Guide
DC Short-Circuit Analysis Display Options Rating Select the checkboxes under this heading to display the ratings of the selected AC elements on the one-line diagram.
Device Type Rating Gen. (Generator) kW/MW Power Grid (Utility) MVAsc Motor HP/kW Load kVA/MVA Panel Connection Type Number of Phases - Number of Wires) Transformer kVA/MVA Branch, Impedance Base MVA Branch, Reactor Continuous Amps Cable/Line Number of Cables - Number of Conductor/Cable - Size Bus kA Bracing Node Bus Bracing (kA) CB Rated Interrupting (kA) Fuse Interrupting (ka) Relay 50/51 for Overcurrent Relays PT & CT Transformer Rated Turn Ratio
kV Select the checkboxes under this heading to display the rated or nominal voltages of the selected elements on the one-line diagram. For cables/lines, click the checkboxes to display the cable/line and the size, length and type on the one-line diagram.
A Select the checkboxes under this heading to display the ampere ratings (continuous or full-load ampere) of the selected elements on the one-line diagram. For cables/lines, click the checkboxes to display the cable/line and the size, length and type on the one-line diagram.
Z Select the checkboxes under this heading to display the rated impedance of the selected AC elements on the one-line diagram.
Device Type Impedance Generator Subtransient reactance Xd” Power Grid (Utility) Positive Sequence Impedance in % of 100 MVA (R + j X) Motor % LRC Transformer Positive Sequence Impedance (R + j X per unit length) Branch, Impedance Impedance in ohms or % Branch, Reactor Impedance in ohms Cable/Line Positive Sequence Impedance (R + j X in ohms or per unit length)
Operation Technology, Inc. 33-11 ETAP 7.5.2 User Guide
DC Short-Circuit Analysis Display Options
Operation Technology, Inc. 33-12 ETAP 7.5.2 User Guide
D-Y Select the checkboxes under this heading to display the connection types of the selected elements on the one-line diagram. For transformers, the operating tap setting for primary, secondary, and tertiary windings are also displayed. The operating tap setting consists of the fixed taps plus the tap position of the LTC.
Composite Motor Click on this checkbox to display the AC composite motor IDs on the one-line diagram, then select the color in which the IDs will be displayed.
Use Default Options Click on this checkbox to use ETAP’s default display options.
DC Short-Circuit Analysis Calculation Methods
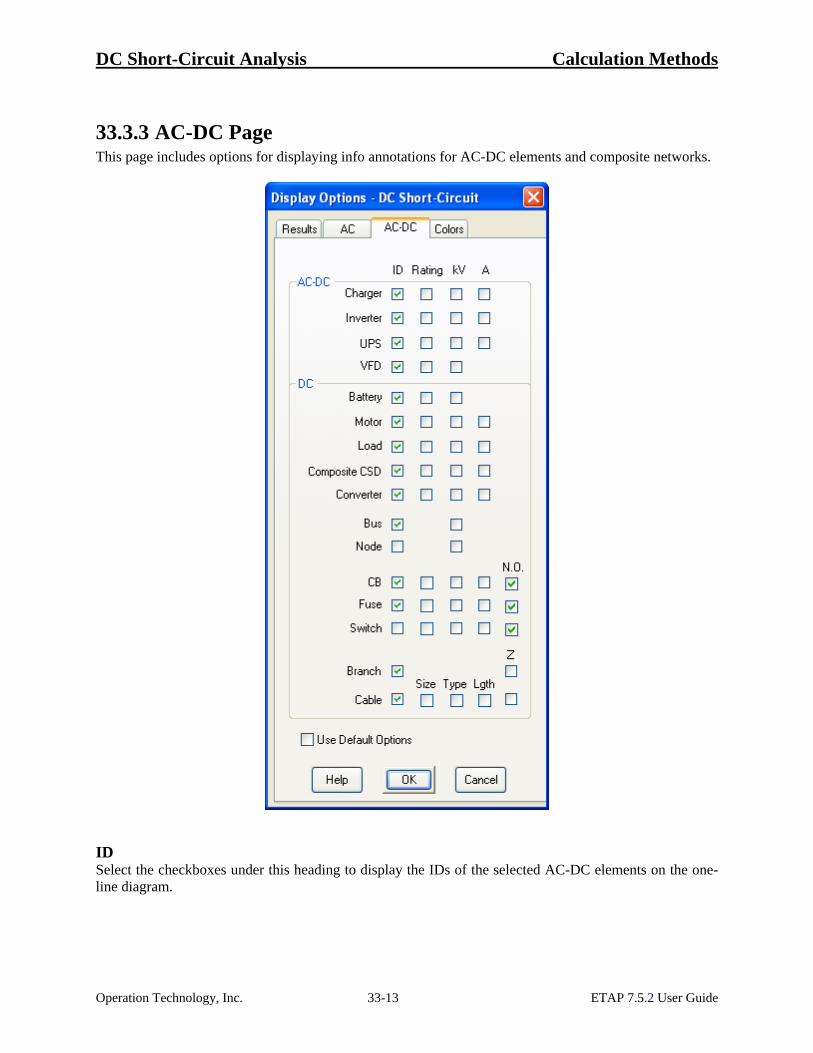
33.3.3 AC-DC Page This page includes options for displaying info annotations for AC-DC elements and composite networks.
ID Select the checkboxes under this heading to display the IDs of the selected AC-DC elements on the one-line diagram.
Operation Technology, Inc. 33-13 ETAP 7.5.2 User Guide

DC Short-Circuit Analysis Calculation Methods Rating Select the checkboxes under this heading to display the ratings of the selected AC-DC elements on the one-line diagram.
Device Type Rating Charger AC kVA & DC kW (or MVA/MW) Inverter DC kW & AC kVA (or MW/MVA) UPS kVA VFD HP/kW
kV Click on the checkboxes under this heading to display the rated or nominal voltages of the selected elements on the one-line diagram.
A Click on the checkboxes under this heading to display the ampere ratings of the selected elements on the one-line diagram.
Device Type Amp Charger AC FLA & DC FLA Inverter DC FLA & AC FLA UPS Input, output, & DC FLA
Composite Network Click on this checkbox to display the composite network IDs on the one-line diagram, then select the color in which the IDs will be displayed.
Use Default Options Click on this checkbox to use ETAP’s default display options.
Operation Technology, Inc. 33-14 ETAP 7.5.2 User Guide

DC Short-Circuit Analysis Calculation Methods
33.3.4 Colors Page This page includes options for assigning colors to annotations for elements on the one-line diagram.
Color Theme A previously defined color theme can be selected from the list. The selected color theme will be used whenever the Theme option button is selected. Annotations This area allows you to assign colors to AC and DC elements, composite elements, and displayed results.
Operation Technology, Inc. 33-15 ETAP 7.5.2 User Guide
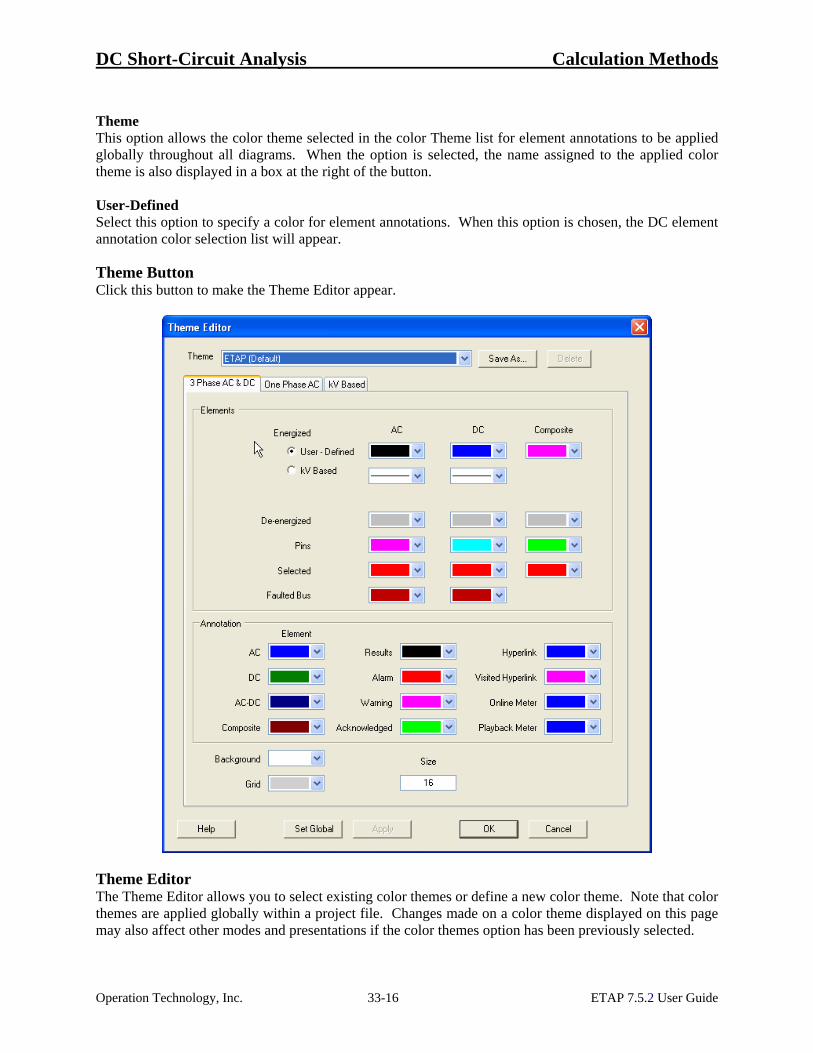
DC Short-Circuit Analysis Calculation Methods Theme This option allows the color theme selected in the color Theme list for element annotations to be applied globally throughout all diagrams. When the option is selected, the name assigned to the applied color theme is also displayed in a box at the right of the button. User-Defined Select this option to specify a color for element annotations. When this option is chosen, the DC element annotation color selection list will appear.
Theme Button Click this button to make the Theme Editor appear.
Theme Editor The Theme Editor allows you to select existing color themes or define a new color theme. Note that color themes are applied globally within a project file. Changes made on a color theme displayed on this page may also affect other modes and presentations if the color themes option has been previously selected.
Operation Technology, Inc. 33-16 ETAP 7.5.2 User Guide

DC Short-Circuit Analysis Calculation Methods
33.4 Calculation Methods The ETAP DC Short-Circuit module can perform fault analysis for a radial or a looped system. It calculates the maximum system fault current and contributions from individual sources. The fault under consideration is assumed to be a short-circuit between the positive and negative terminals at the fault location. Fault current contributing sources include chargers/rectifiers, UPS, batteries, and DC motors. These sources can be modeled either as constant current sources or constant voltage sources behind impedance, as specified by the user. It is assumed that these sources will reach their maximum contribution level at the same time, which results in a conservative solution. ETAP also calculates the rise time of fault current based on the equivalent R and L at the fault location. When calculating short-circuit current, inductance values for all of the system components are neglected. These inductance values are used in calculating fault current rise time.
33.4.1 Procedure for DC Short-Circuit Calculation In a DC short-circuit calculation, a contributing source may be represented by different models, either as a voltage source or as a current source. Even the sources that are represented as constant voltage sources may have different per unit values. This is different from the AC short-circuit calculation by the IEEE method, where a prefault voltage is specified and a circuit network is solved to find the fault current. In the DC short-circuit calculation, a two-step procedure is adopted that applies the superposition theorem to calculate fault current. The two steps are voltage profile calculation and short-circuit current calculation. In the first step of the calculation, the short-circuit current sources such as charger, UPS, battery, and motor are modeled as specified in the study case editor and individual element editors. They may be modeled as constant current sources or as constant voltage sources behind impedance. Based on this system, a load flow calculation is conducted to determine system voltage profile and current flows. These voltage values will be used in the second step as the prefault voltage for short current calculation. In the second step of the calculation, the program calculates fault current and contributions for each bus to be faulted with the bus voltage calculated in the first step as the prefault voltage. In addition to fault current, the program also calculates the equivalent R and L at the faulted bus, based on the separate R and L network. Using the equivalent R and L, it calculates the current rise time constant for the fault.
33.4.2 Short-Circuit Current Rise Time Constant Calculation The short-circuit current reaches its maximum value at a rate depending on the system configuration and the resistance and inductance values of all the elements in the system. For a radial system, it depends on the system R/L ratio, which is simple to calculate. However, for a looped network with multiple sources, it is rather complicated to determine the rise time constant of the short-circuit current. ETAP calculates the rise time constant based on the equivalent R and L at the fault location.
Operation Technology, Inc. 33-17 ETAP 7.5.2 User Guide
DC Short-Circuit Analysis Calculation Methods
33.4.3 Device Rating Evaluation One of the major purposes of conducting a short-circuit calculation is to evaluate the device rating under fault conditions, such as bus rating and protective device ratings. For each DC protective device, ETAP calculates the bus fault current and the maximum current that flows through the device. The program then compares the device rating against the maximum through current. If an underrated condition occurs, ETAP will flag the underrated condition in the text report as well as in the one-line display.
33.4.4 Component Models
Charger A charger can be represented as a constant current source or a constant voltage source behind an impedance. As a constant current source, it injects into the system a constant current equal to its rated current multiplied by the Imax specified in the Rating page of the charger editor. When modeled as a constant voltage source behind impedance, the rated voltage is used as the internal voltage. The AC system Z specified in the Short-Circuit page of the Charger editor is converted to the DC side and used as the impedance in the model.
UPS A UPS (Uninterruptible Power Supply) is represented as a constant current source. It injects into the system a constant current equal to its rated current multiplied by the Imax specified in the Rating page of the UPS editor.
Battery A battery can be represented as a constant current source or a constant voltage source behind impedance. As a constant current source, it injects into the system a constant current equal to its 1 minute discharging current multiplied by a K factor specified in the Short-Circuit page of the Battery Editor. When modeled as a constant voltage source behind impedance, the internal voltage depends on the option selected in the Battery Editor. These options include using the rated voltage or the value calculated based on the battery specific gravity and minimum operating temperature.
DC Converter A DC converter is used to change the voltage level in a DC system. If a fault occurs on the output side of the system, the DC converter is modeled as a constant current source injecting into the system a constant current. This current is equal to its rated current multiplied by the Imax specified in the Rating page of the DC Converter Editor. When calculating fault current contributions, the calculation does not extend into the input side of the system. In case a DC converter has the same input and output rated voltage values and is involved in any loop as the only DC converter, the calculation will stop and post a message to inform the user.
Operation Technology, Inc. 33-18 ETAP 7.5.2 User Guide
DC Short-Circuit Analysis Calculation Methods
Operation Technology, Inc. 33-19 ETAP 7.5.2 User Guide
DC Motor A DC motor is modeled as a constant voltage source behind impedance. The internal voltage value can be specified in the DC Short-Circuit Study Case Editor. The impedance is specified in the Short-Circuit page of the DC Motor Editor.
DC Lumped Load The constant power portion of a DC lumped load is modeled as a constant voltage source behind an impedance. The internal voltage value can be specified in the DC Short-Circuit Study Case editor. The impedance is specified in the Short-Circuit Imp page of the DC Lumped Load editor. Note: Only the motor loads of the lumped loads contribute short-circuit currents, i.e., if the percent motor load of a lumped load is greater than zero, the motor load part will be modeled the same as a DC motor. The static load part will be represented as a static load and the constant current load portion will be ignored in the short-circuit calculation.
DC Static and Composite CSD Loads DC static loads are included in short-circuit calculations. The presence of static loads provides shunt paths for short-circuit current and hence reduce the total fault current. A Composite CSD (CCSD) load is treated the same as a static load.
DC Cable In order to achieve conservative results, in a DC short-circuit analysis, the cable resistance is calculated at the minimum temperature entered in the Cable editor.
DC Short-Circuit Analysis Required Data
33.5 Required Data
33.5.1 Source
Charger
Info Page • Charger ID • Bus connection data
Rating Page • All data in this page is required for DC Load Flow calculations
SC Page • Data in the SC Contribution for DC System section • AC System Z data is required if the Based on AC System Z option is selected
UPS
Info Page • UPS ID • Bus connection data
Rating Page • AC rating data • DC rating data • Auction diode option
SC Imp Page • SC Contribution to DC System section data
Battery
Info Page • Battery ID • Bus connection data • Number of strings
Rating Page • Number of cells
SC Page • Battery Library type data: Rp, time constant, SG, VPC, and 1-min-rating • Short-circuit model data • External impedance data • Voc per cell data
Operation Technology, Inc. 33-20 ETAP 7.5.2 User Guide
DC Short-Circuit Analysis Required Data
33.5.2 Load
DC Motor
Info Page • Motor ID • Bus connection data • Configuration status • Quantity
Rating Page • Rating data • Load category data
SC Page • SC parameters
Lump Load
Info Page • Lump load ID • Bus connection data • Configuration status
Rating Page • Rating section data • Motor/static load percent • Load category data
SC Imp Page • SC parameters
Static Load
Info Page • Static load ID • Bus connection data • Configuration status • Quantity
Rating Page • Rating section data • Load category data
Operation Technology, Inc. 33-21 ETAP 7.5.2 User Guide

DC Short-Circuit Analysis Required Data
CCSD Load
Info Page • CCSD load ID • Bus connection data
Rating Page • Rating section data • Load category data
33.5.3 Branch
DC Cable
Info Page • Cable ID • Bus connection data • Cable length • Number of cables per phase
Impedance Page • Cable resistance and inductance • Units section data • Base and minimum operating temperature
DC Impedance
Info Page • DC impedance ID • Bus connection data • Impedance resistance and inductance
33.5.4 DC Converter
Info Page • DC converter ID • Bus connection data
Rating Page • Rating section data • SC contribution data
Operation Technology, Inc. 33-22 ETAP 7.5.2 User Guide
DC Short-Circuit Analysis Required Data
Operation Technology, Inc. 33-23 ETAP 7.5.2 User Guide
33.5.5 Protective Device If the data for a protective device has been entered by the user, the DC short-circuit calculation will compare the short-circuit current against device rating and flag the user if the device is underrated.
DC CB
Info Page • ID • Bus connection data • Rated V • SC kA
DC Fuse
Info Page • ID • Bus connection data
Rating Page • Rated V • Interrupting kA
DC Single-Throw Switch
Info Page • ID • Bus connection data • Rated V • Momentary kA
DC Double-Throw Switch
Info Page • ID • Bus connection data • Rated V • Momentary kA
33.5.6 Study Case Similar to any other study, you are always required to run a DC short-circuit calculation. When a DC short-circuit calculation is initiated by the user, ETAP uses the study case currently showing in the study case editor in the calculation. Every field in a study case has its default value. However, it is important to set the values in the study case correctly to meet your calculation requirements.
DC Short-Circuit Analysis Output Reports
33.6 Output Reports The DC short-circuit calculation results are reported both on the one-line diagram and in the Crystal Reports format. The graphical one-line diagram displays the calculated fault currents, time constant for current rise, equivalent resistance at the faulted bus, as well as fault contributions from neighboring buses. You can use the Display Options editor to specify the content to be displayed. It also flags underrated protective devices in red. The Crystal Reports format provides you with detailed information for a DC Short-Circuit Analysis. You can utilize the DC Short-Circuit Report Manager to help you view the output report.
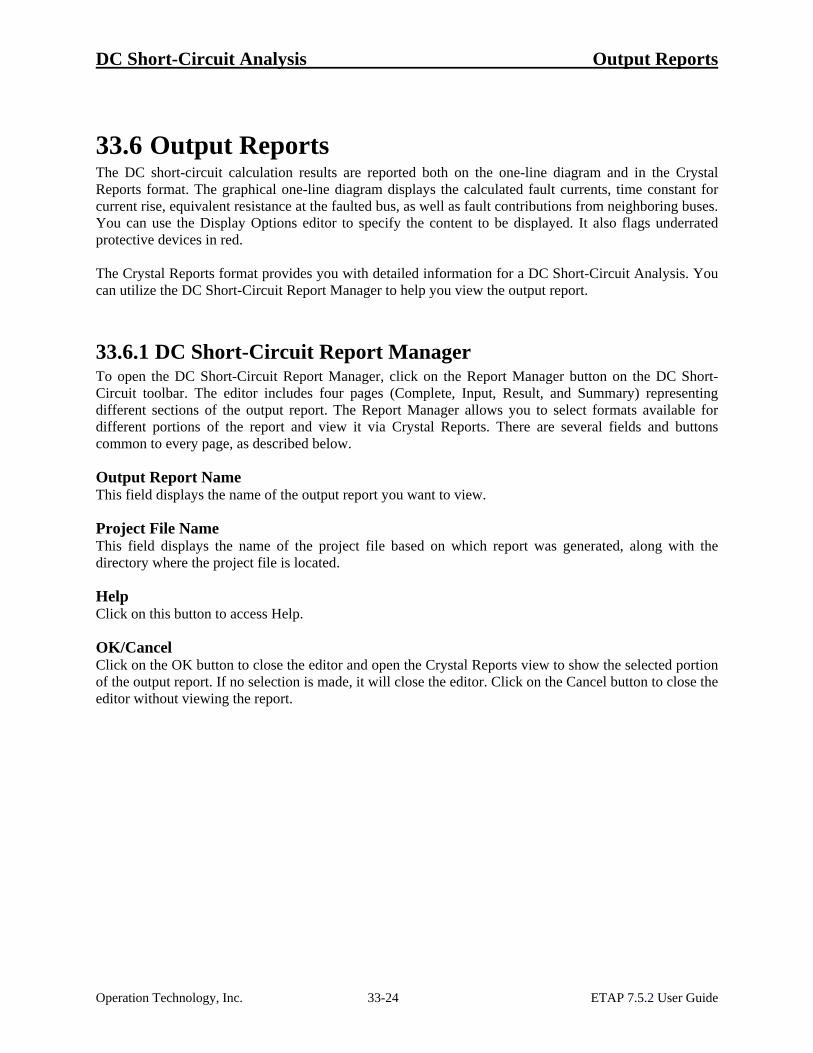
33.6.1 DC Short-Circuit Report Manager To open the DC Short-Circuit Report Manager, click on the Report Manager button on the DC Short-Circuit toolbar. The editor includes four pages (Complete, Input, Result, and Summary) representing different sections of the output report. The Report Manager allows you to select formats available for different portions of the report and view it via Crystal Reports. There are several fields and buttons common to every page, as described below.
Output Report Name This field displays the name of the output report you want to view.
Project File Name This field displays the name of the project file based on which report was generated, along with the directory where the project file is located.
Help Click on this button to access Help.
OK/Cancel Click on the OK button to close the editor and open the Crystal Reports view to show the selected portion of the output report. If no selection is made, it will close the editor. Click on the Cancel button to close the editor without viewing the report.
Operation Technology, Inc. 33-24 ETAP 7.5.2 User Guide
DC Short-Circuit Analysis Output Reports
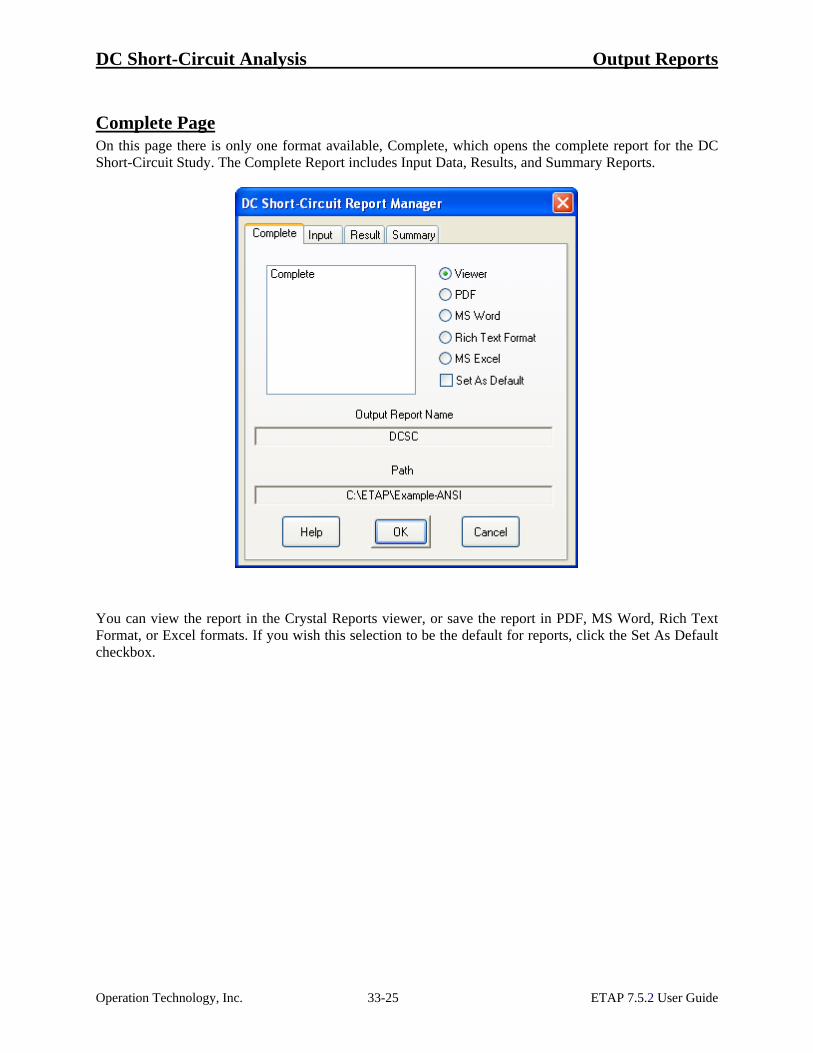
Complete Page On this page there is only one format available, Complete, which opens the complete report for the DC Short-Circuit Study. The Complete Report includes Input Data, Results, and Summary Reports.
You can view the report in the Crystal Reports viewer, or save the report in PDF, MS Word, Rich Text Format, or Excel formats. If you wish this selection to be the default for reports, click the Set As Default checkbox.
Operation Technology, Inc. 33-25 ETAP 7.5.2 User Guide

DC Short-Circuit Analysis Output Reports
Input Data Page This page allows you to select different formats for viewing input data, grouped according to type. They include:
Battery Branch Bus Cable Converter Cover Impedance Loads
You can view the report in the Crystal Reports viewer, or save the report in PDF, MS Word, Rich Text Format, or Excel formats. If you wish this selection to be the default for reports, click the Set As Default checkbox.
Operation Technology, Inc. 33-26 ETAP 7.5.2 User Guide
DC Short-Circuit Analysis Output Reports
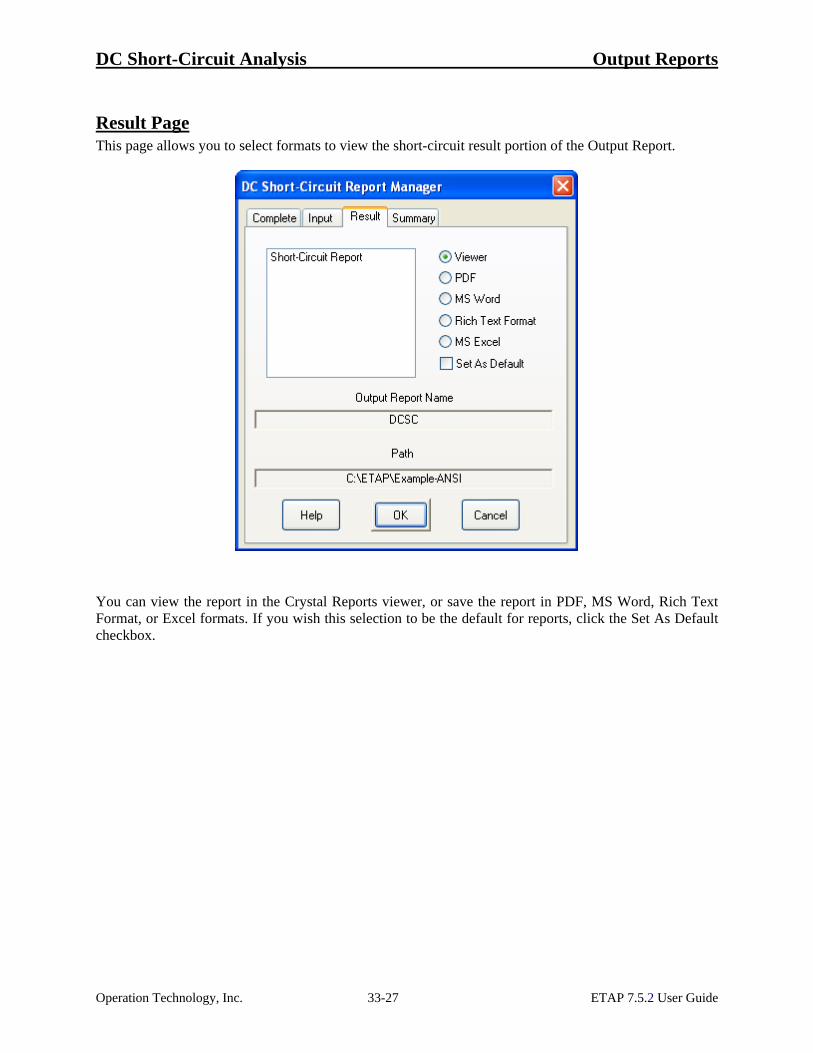
Result Page This page allows you to select formats to view the short-circuit result portion of the Output Report.
You can view the report in the Crystal Reports viewer, or save the report in PDF, MS Word, Rich Text Format, or Excel formats. If you wish this selection to be the default for reports, click the Set As Default checkbox.
Operation Technology, Inc. 33-27 ETAP 7.5.2 User Guide
DC Short-Circuit Analysis Output Reports
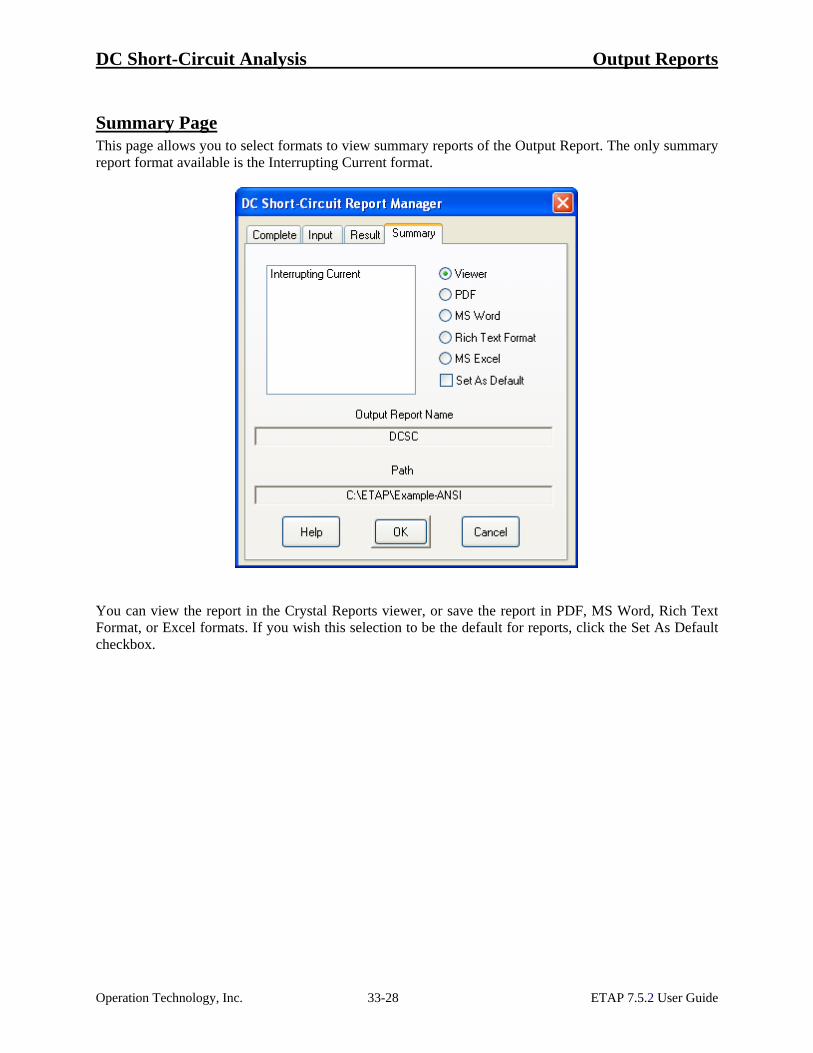
Summary Page This page allows you to select formats to view summary reports of the Output Report. The only summary report format available is the Interrupting Current format.
You can view the report in the Crystal Reports viewer, or save the report in PDF, MS Word, Rich Text Format, or Excel formats. If you wish this selection to be the default for reports, click the Set As Default checkbox.
Operation Technology, Inc. 33-28 ETAP 7.5.2 User Guide

DC Short-Circuit Analysis Output Reports
33.6.2 View Output Reports from Study Case Toolbar This is a shortcut for the Report Manager. When you click on the View Output Report button, ETAP automatically opens the output report, which is listed in the Study Case toolbar with the selected format. In the picture shown below, the output report name is DCSC and the selected format is Complete.
33.6.3 Input Data Input data are grouped together according to element type. The following are some samples of input data.
Cable & Impedance Data The cable and impedance input data page prints resistance and inductance values for these branches, along with connection information. The resistance value for cables has been adjusted to the minimum operating temperature. The inductance value is used to calculate time constant for fault current rise.
Operation Technology, Inc. 33-29 ETAP 7.5.2 User Guide
DC Short-Circuit Analysis Output Reports
Operation Technology, Inc. 33-30 ETAP 7.5.2 User Guide
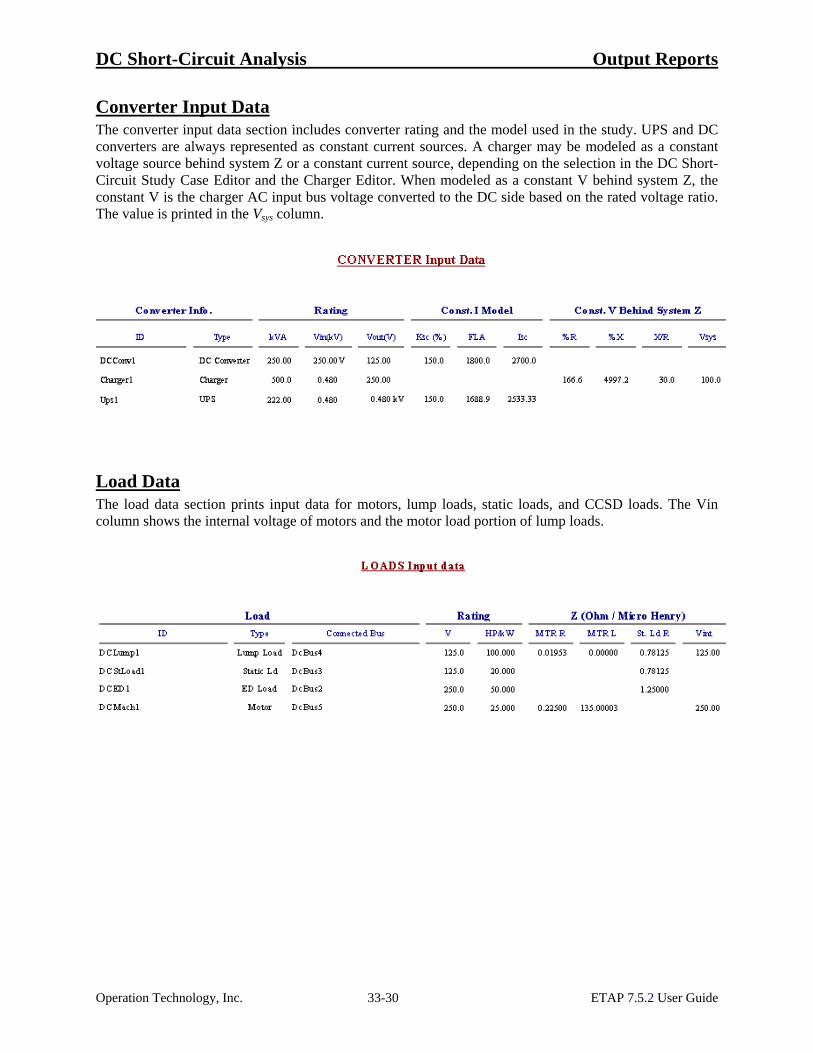
Converter Input Data The converter input data section includes converter rating and the model used in the study. UPS and DC converters are always represented as constant current sources. A charger may be modeled as a constant voltage source behind system Z or a constant current source, depending on the selection in the DC Short-Circuit Study Case Editor and the Charger Editor. When modeled as a constant V behind system Z, the constant V is the charger AC input bus voltage converted to the DC side based on the rated voltage ratio. The value is printed in the Vsys column.
Load Data The load data section prints input data for motors, lump loads, static loads, and CCSD loads. The Vin column shows the internal voltage of motors and the motor load portion of lump loads.
DC Short-Circuit Analysis Output Reports
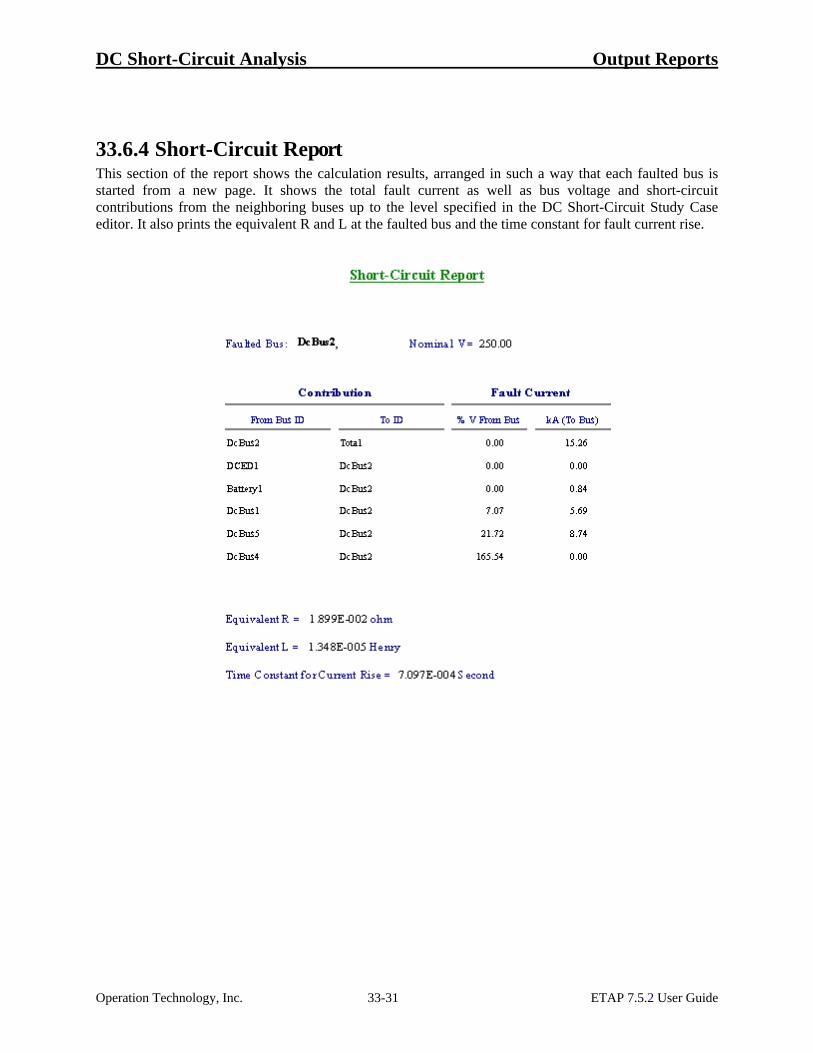
33.6.4 Short-Circuit Report This section of the report shows the calculation results, arranged in such a way that each faulted bus is started from a new page. It shows the total fault current as well as bus voltage and short-circuit contributions from the neighboring buses up to the level specified in the DC Short-Circuit Study Case editor. It also prints the equivalent R and L at the faulted bus and the time constant for fault current rise.
Operation Technology, Inc. 33-31 ETAP 7.5.2 User Guide
DC Short-Circuit Analysis Output Reports
Operation Technology, Inc. 33-32 ETAP 7.5.2 User Guide
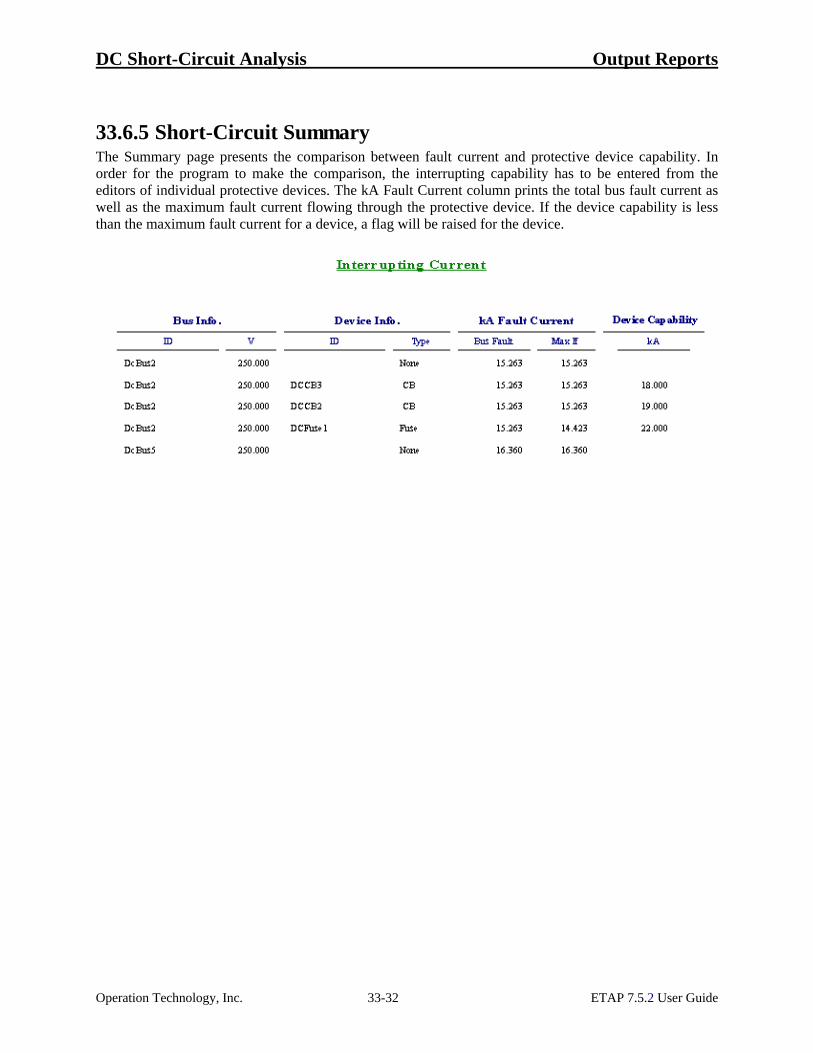
33.6.5 Short-Circuit Summary The Summary page presents the comparison between fault current and protective device capability. In order for the program to make the comparison, the interrupting capability has to be entered from the editors of individual protective devices. The kA Fault Current column prints the total bus fault current as well as the maximum fault current flowing through the protective device. If the device capability is less than the maximum fault current for a device, a flag will be raised for the device.
Related Documents