56 CHAPTER-3 TRENDS AND PATTERN OF FDI Introduction Chapter 3 of the research study consists of the analysis of the trends and pattern of FDI-country- wise and year-wise. Here, different schedules have been prepared in order to know about the flow of FDI during pre-liberalisation and post- liberalisation period. The inflow and outflow of FDI before 1991 and after 1991 is viewed in a sequence systematically so that the importance of FDI in India can be established carefully and the future of FDI can be forecasted there from. The top investing countries of Asia are studied and their comparison has been made of in the light of FDI inflows and outflows. Moreover, apart from the above said information, the different sectors where FDI is permitted upto a certain extent/limit are also studied here, carefully. India stands today as the largest democratic country in the world. Its political and administrative set up has many flows and shortcomings. The Indian administrative system and governance infused with the flows like shortcomings of power, bureaucratic barriers, political uncertainty and infrastructural deficiencies. In spite of all these, India became one of the most attractive grounds for wealthy European and American investors. Since independence till 1990, the performance of Indian economy has been dominated by a regime of multiple controls, restrictive regulations and wide ranging state intervention. In 1991, India’s liberalization has acquired a revolutionary status as a time of change in the planning of India’s future. India has been ranked at the second place in global FDI in 2010 and will continue to remain among the top five attractive destinations for international investors during 2010-12 period. India is the 3 rd largest economy of the world in terms of purchasing power parity and, thus, looks attractive to the world of FDI. Even government of India has been trying hard to do away with FDI caps for majority of the sectors. But there are still some critical areas like retailing and insurance where there is a lot of opposition from local Indians and Indian companies. FDI in India is subjected to certain rules and regulations and is subject to predefined limits in various sectors which range from 20% to 100%. There are also some sectors in which FDI is prohibited. The FDI limitance reviewed by the government from time to time and as and when the need is

Welcome message from author
This document is posted to help you gain knowledge. Please leave a comment to let me know what you think about it! Share it to your friends and learn new things together.
Transcript

56
CHAPTER-3
TRENDS AND PATTERN OF FDI
Introduction
Chapter 3 of the research study consists of the analysis of the trends and
pattern of FDI-country- wise and year-wise. Here, different schedules have been
prepared in order to know about the flow of FDI during pre-liberalisation and post-
liberalisation period. The inflow and outflow of FDI before 1991 and after 1991 is
viewed in a sequence systematically so that the importance of FDI in India can be
established carefully and the future of FDI can be forecasted there from. The top
investing countries of Asia are studied and their comparison has been made of in the
light of FDI inflows and outflows. Moreover, apart from the above said information,
the different sectors where FDI is permitted upto a certain extent/limit are also studied
here, carefully.
India stands today as the largest democratic country in the world. Its political
and administrative set up has many flows and shortcomings. The Indian
administrative system and governance infused with the flows like shortcomings of
power, bureaucratic barriers, political uncertainty and infrastructural deficiencies. In
spite of all these, India became one of the most attractive grounds for wealthy
European and American investors. Since independence till 1990, the performance of
Indian economy has been dominated by a regime of multiple controls, restrictive
regulations and wide ranging state intervention. In 1991, India’s liberalization has
acquired a revolutionary status as a time of change in the planning of India’s future.
India has been ranked at the second place in global FDI in 2010 and will continue to
remain among the top five attractive destinations for international investors during
2010-12 period.
India is the 3rd
largest economy of the world in terms of purchasing power
parity and, thus, looks attractive to the world of FDI. Even government of India has
been trying hard to do away with FDI caps for majority of the sectors. But there are
still some critical areas like retailing and insurance where there is a lot of opposition
from local Indians and Indian companies. FDI in India is subjected to certain rules and
regulations and is subject to predefined limits in various sectors which range from
20% to 100%. There are also some sectors in which FDI is prohibited. The FDI
limitance reviewed by the government from time to time and as and when the need is

57
felt and FDI is allowed in some new sectors where the limits of investment in the
existing sectors are modified accordingly. In order to revise the FDI limits to attract
more foreign investment in India, the Union government constituted a committee
named, Arvind Mayaram Committee headed by the Economic Affairs Secretary. The
government of India on July 16, 2013 approved the recommendation of the committee
to increase the limits of FDI in 12 sectors out of proposed 20 sectors. The major
policy decision taken at meeting convened by P.M. Manmohan Singh for boosting the
flow of foreign funds in the light of depreciating rupee against the dollar and bid to
turn around declining investor sentiments.
Investing Across Borders- Sector wise Caps- 2010
This table explains investing across borders in various sectors. These sectors
are Mining Oil & Gas, Agriculture and forestry, Light Manufacturing,
Telecommunications, electricity, banking, insurance and transportation in different
countries.

58
Table 3.1
Investing Across Sectors
Foreign Equity Ownership Indexes
Country Mining
Oil &
Gas
Agriculture
And forestry
Light
Manufacturing
Telecomm-
unications
Electricity Banking Insurance Transportation Media Construction,
Tourism and
Retail
Health care
and waste
management
Argentina 100 100 100 100 100 100 100 79.6 30 100 100
Brazil 100 100 100 100 100 100 100 68 30 100 50
Chile 100 100 100 100 100 100 100 100 100 100 100
China 75 100 75 49 85.4 62.5 50 49 0 83.3 85
India 100 50 81.5 74 100 87 26 59.6 63 83.7 100
Indonesia 97.5 72 68.8 57 95 99 80 49 5 85 82.5
Korea 100 100 100 49 85.4 100 100 79.6 39.5 100 100
Malaysia 70 85 100 39.5 30 49 49 100 65 90 65
Mexico 50 49 100 74.5 0 100 49 54.4 24.5 100 100
Philippines 40 40 75 40 65.7 60 100 40 0 100 100
Russian 100 100 100 100 100 100 49 79.6 75 100 100
South 74 100 100 70 100 100 100 100 60 100 100
Thailand 49 49 87.3 49 49 49 49 49 27.5 66 49
Source :World Bank, 2010, Investing Across Borders-A Survey of 87 Economies

59
Investing Across Borders measures the extent to which the laws of the home
country allow the foreign stockholders to set up or acquire the local undertakings. It is
evident from the table that the foreign equity cap across different sectors in countries
like Argentina, Brazil, Chile and the Russian federation is much higher than compared
to India whereas sectoral caps in countries like china are lower. It is also observed that
in India, FDI is permitted upto 100% in difference sectors such as mining, oil and gas,
electricity and healthcare & waste management whereas minimum in insurance sector,
i.e. 26 per cent.
FDI Caps in terms of Specific Sectors
This table explains maximum FDI limit in various sector. In some sectors such
as drugs maximum FDI limit is 100% whereas in some sectors FDI limit is 49%.
Table 3.2 Table Showing FDI Caps in Terms of Specific Sectors
Recommended by N.K Singh Committee Report on September 2002
Sector Existing Limit
Recommended For 100 per cent FDI
i. Drugs
ii. Petroleum Refining
iii. Oil Marketing
iv. Diamond, Precious Stone
v. Petroleum Exploration
vi. Coal and Lignite
vii. Coal Wathery
viii. Airports
ix. Total Bandwidth
x. Telecom Gateway
xi. Pipelines for Gas and Oil
xii. Banking
xiii. Investment Companies
xiv. Internet Service Providers
xv. E-mail and Voice mail
xvi. Radio Paging
xvii. Advertising
xviii. Trading
xix. Courier Service
xx. Commercial complexes
xxi. Individual Housing/building
Recommended for 74 per cent FDI
i. Basic Mobile Telecom Services
Recommended for 49 per cent FDI
i. Small Scale Industries
ii. Civil aviation
iii. Insurance
iv. Broadcasting(DTH, KV)
v. Plantation
100
26
74
74
51-100
50
50
74
74
74
51
49
49
100
100
74
74
51
100
0
0
49
24
40
26
20
0
Source: India Today, September 30, 2002

60
FDI Caps in terms of Specific Sectors
FDI is not permitted for generation, transmission & distribution of electricity
produced in atomic power plant/atomic energy, since private investment in this
activity is prohibited and reserved for public sector.
Table 3.3
Table Showing FDI Caps in terms of Specific Sectors Sector Specific Limits of Foreign Investment in India
Sector FDI Cap/
Equity
Entry
Route
Other
Conditions
A. Agriculture
1.) Floriculture, Horticulture,
Development of seeds, Animal
Husbandry, Pisciculture, Aquaculture,
Cultivation of vegetables &
mushrooms and services related to
agro and allied sectors.
2.) Tea sector, including plantation.
100%
100%
Automatic
FIPB
(FDI is not allowed in any other agriculture sector/activity)
B. Industry
1.) Mining covering exploration and
mining of diamonds & precious stones;
gold, silver and minerals.
2.) Coal and lignite mining for captive
consumption by power projects, and
iron & steel, cement production.
3.) Mining and mineral separation of
titanium bearing minerals.
100%
100%
100%
Automatic
Automatic
FIPB
C. Manufacturing
1.) Alcohol-Distillation & Brewing
2.) Coffee & Rubber processing &
Warehousing.
3.) Defence production
4.) Hazardous chemicals and isocyanates
5.) Industrial explosives-Manufacture
6.) Drugs and Pharmaceuticals
7.) Power including generation (except
Atomic energy); transmission,
distribution and power trading.
100%
100%
26%
100%
100%
100%
100%
Automatic
Automatic
FIPB
Automatic
Automatic
Automatic
Automatic

61
(FDI is not permitted for generation, transmission & distribution of
electricity produced in atomic power plant/atomic energy since private
investment in this activity is prohibited and reserved for public sector.
D. Services
1.) Civil aviation (Greenfield projects and
Existing projects)
2.) Asset Reconstruction companies
3.) Banking (private) sector
4.) NBFCs: underwriting, portfolio
management services, investment
advisory services, financial
consultancy, stock broking, asset
management, venture capital,
custodian, factoring, leasing and
finance, housing finance, forex
broking, etc.
5.) Broadcasting:
a.) FM Radio
b.) Cable network, c) Direct to home,
d) Hardware facilities such as up-
linking, HUB.
e) Up-linking a news and current
affairs TV Channel
6.) Commodity Exchanges
7.) Insurance
8.) Petroleum and natural gas:
a.) Refining
9.) Print Media
Publishing of newspaper and
periodicals dealing with news and
current affairs
Publishing of scientific magazines/
specialty journals/periodicals.
10.) Telecommunications a Basic and
cellular, unified access services,
national/international long-distance,
V-SAT, public mobile radio trunked
100%
49%
74%
(FDI+FII).
FII not to
exceed 49%
100%
20%
49%
(FDI+FII)
100%
49%
(FDI+FII)
(FDI 26%
FII 23%)
26%
49% (PSUs)
100% (Pvt.
Companies)
26%
100%
74%
(including
FDI, FII,
NRI,
FCCBs,
Automatic
FIPB
Automatic
Automatic
FIPB
FIPB
Automatic
FIPB (for
PSUs)
Automatic
(Pvt.)
FIPB
FIPB
Automatic
up to 49%
and FIPB
beyond
49%.
S.t.
minimum
capitalization
norms
Clearance
from IRDA
S.t.
guidelines by
Ministry of
Information
&
broadcasting

62
services (PMRTS), global mobile
personal communication services
(GMPCS) and others.
ADRs/GDR,
Convertible
preference
shares, etc.)
Sectors where FDI is Banned
1. Retail Trading (except single brand product retailing);
2. Atomic Energy;
3. Lottery Business including Government/private lottery , online lotteries etc;
4. Gambling and Betting including casinos etc;
5. Business of chit fund;
6. Nidhi Company;
7. Trading in Transferable Development Rights (TDRs);
8. Activities/sector not opened to private sector investment;
9. Agriculture (excluding Floriculture, Horticulture, Development of seeds, Animal
Husbandry, Pisciculture and cultivation of vegetables, mushrooms etc. under
controlled conditions and services related to agro and allied sectors) and
Plantations (Other than Tea Plantations);
10. Real estate business, or construction of farm houses;
Manufacturing of Cigars, cheroots, cigarillos and cigarettes of tobacco or of
tobacco or of tobacco substitutes.
*Source: http://www.bankingawarness.com (Last updated on 20.08.2013)
FDI under the automatic route does not require any prior approval either by
the government or the Reserve Bank of India. The investors are only required to
notify the concerned regional office of the RBI within 30 days of the receipt of inward
remittance and file the required documents with that office within 30 days of issuance
of shares to foreign investors. Under the approval route, the proposals are considered
in a time-bound and transparent manner by the FIPB. Approvals of composite
proposals involving foreign investment or foreign technical collaborations are also
granted on the recommendation of the FIBP.
N. K. Singh Committee has given some recommendations on FDI describing
the FDI Limit for some sectors empowering the FIPB and FIIA to simplify the
administrative process and policy approvals. The Committee also suggested for the
development of Specific Economic Zones by simplifying laws, rules and regulations
and administrative procedures. In 2004-05 government liberalized the FDI regime and
some majors were taken in this regard. In 2008 a comprehensive and major review of
the FDI policy was undertaken to consolidate the liberalization policy and further
rationalize it through governing various activities such as change of root, removal of
restrictive conditions and procedural simplification .The current FDI policy in terms
of sector specific limits have been summarized in Tables 3.2 and 3.3 as above.

63
Agriculture Sector
FDI up to 100% is permitted, under the automatic root , subject to certain
conditions mentioned in consolidated FDI policy in the following agricultural
activities : Floriculture, Horticulture, Apiculture and cultivation of vegetables
and mushrooms under controlled conditions; Development and production of
seeds and planting material ; Animal husbandry ( including breeding of dogs),
Pisciculture, Aquaculture, under controlled conditions: and services related to
Agro and Allied sectors.
100% FDI is also permitted in tea sector under FIPB Route where as 49% FDI
is allowed in Tea Plantation under the same root.
FDI is not allowed in any other agriculture sector / activities except above.
Industry and Manufacturing
The policy was further liberalized after some policy regimes in the year 2010
regarding determination of FDI Limits as follows:
100 % FDI was permitted in Mining covering exploration and mining of
diamonds & precious stones; gold, silver and minerals; Coal and lignite
mining for captive consumption by power projects, and iron & steel, cement
production; Alcohol-Distillation & Brewing ; Coffee & Rubber processing &
Warehousing; Hazardous chemicals and isocyanates; Industrial explosives-
Manufacture ; Drugs and Pharmaceuticals and Power including generation
(except Atomic energy); transmission, distribution and power trading under
automatic route. Whereas 100% FDI was also permitted in Mining and
mineral separation of titanium bearing minerals under FIPB root.
FDI cap in defense sector remained unchanged at 26%, however higher limits
of foreign investment in state-of-the-art manufacturing would be considered
by the Cabinet Committee on Security (CCS). Technically, the decision leaves
it open for CCS to even allow 100% foreign investment in what the defence
ministry will define as "state-of-the-art" segments with safeguards built in to
ensure that the technology and equipment are not shared with other countries.
FDI is not permitted for generation, transmission & distribution of
electricity produced in atomic power plant/atomic energy since private
investment in this activity is prohibited and reserved for public sector.
Service Sector:

64
FDI was allowed upto 100 % under automatic root in the following sectors:
Civil aviation (Greenfield projects and Existing projects); NBFCs:
underwriting, portfolio management services, investment advisory services,
financial consultancy, stock broking, asset management, venture capital,
custodian, factoring, leasing and finance, housing finance, forex broking, etc;
After satisfying minimum capitalization norms. Broadcasting in Up-linking a
news and current affairs TV Channel activities. And 100% FDI is also
permissible in Print media (Publishing of newspaper and periodicals dealing
with news and current affairs) under FIPB route.100% FDI is already
permitted in refining sector only for private sector. No further change is made
in this regard.
FDI is allowed upto 100% in Hotel and Tourism, Roads and Highway,
Education, Advertisement, Farm Sector, Petrol Chemical, Pharmaceuticals,
Coal and Lifnite.
In respect of courier services, FDI upto 100% will be allowed under automatic
route. Earlier, similar amount of investment is allowed through FIPB route as
recommended by N.K. Singh Report on September, 2002.
FDI in 4 sectors i.e. gas refineries, commodity exchange, power trading and
stock exchanges have been allowed via the automatic route. In case of PSU oil
refineries, commodity exchanges, power exchanges, stock exchanges and
clearing corporations, FDI will be allowed up to 49 per cent (as it was FDI
26% and FII 23%) under automatic route as against current routing of the
investment through FIPB.
Banking Sector
Upto 74% FDI + FII was allowed in private banking sector where as FDI upto
49% is allowed through automatic root and FDI beyond 49% but upto 74 % is
allowed through government approval root. Limit for FDI in public sector
banks in the case of nationalized banks as well as SBI and its associate banks,
the overall statutory limit of 20 % as FDI and portfolio investment will
continue i.e. upto 49% for new banks that have been formed after august 2011.
In credit information firms, 74% FDI under automatic route will be allowed.

65
Telecommunication Sector
FDI Limit in Telecom Sector is increased from 74 percent to 100 percent, out
of which up to 49 per cent will be allowed under automatic route and the
remaining through Foreign Investment Promotion Board (FIPB) approval. A
similar dispensation would be allowed from 49% to 100% for asset
reconstruction companies.
In case of FI in Broadcasting sector present position of FDI in FM Radio
Station is 20%, Cable Network, Direct-to-Home(d2h) Services, setting up
hardware facilities such as up-linking, HUB, etc. is 49%.
FDI limit in Headend-In-The-Sky (HITS) Broadcasting Service is 74%(total
direct and indirect foreign investment including portfolio and FDI) Automatic
upto 49% Government route beyond 49% and upto 74%.
There is no change in the current liberalization policy regarding FDI limit in
petroleum refining and gas services which is already allowed upto 49% in
PSUs through FIPB route for PSUs and automatic route for private
undertakings.
Retail Sector
Background and Recent Developments for FDI in Retail Sector which has
raised lot of controversies in political circles. As part of the economic
liberalization process set in place by the Industrial Policy of 1991, the Indian
government has opened the retail sector to FDI slowly through a series of
steps:
1995: World Trade Organisation’s (WTO) General Agreement on Trade
in Services, which includes both wholesale and retailing services, came
into effect.
1997: FDI in cash and carry (wholesale) with 100% rights allowed under
the government approval route.
2006: FDI in cash and carry (wholesale) was brought under automatic
approval route; Upto 51% investment in single brand retail outlet
permitted, subject to Press Note 3 (2006 series).
2011: 100% FDI in Single Brand Retail was allowed.
2012: On Sept. 13, Government approved the allowance of 51% foreign
investment in multi-brand retail.

66
July 2013: In the case of single-brand retail trading upto 100% FDI is
allowed, the 49% limit has been brought under the automatic route and
from 49% to 100% under the FIPB route. Clarity on multi-brand retail
guidelines will also be issued soon to address the concerns of investors,
Commerce and Industry Minister Anand Sharma told reporters here.
Insurance Sector
In the contentious insurance sector, it was decided to raise the sectoral FDI cap
from 26% to 49% under automatic route under which companies investing do
not require prior government approval. A Bill to raise FDI cap in the sector is
pending in the Rajya Sabha.
Sectors where FDI is not allowed by the government till now
Retail Trading (except single brand product retailing);
Atomic Energy;
Lottery Business including Government/private lottery , online lotteries etc;
Gambling and Betting including casinos etc;
Business of chit fund;
Nidhi Company;
Trading in Transferable Development Rights (TDRs);
Activities/sector not opened to private sector investment;
Agriculture (excluding Floriculture, Horticulture, Development of seeds,
Animal Husbandry, Pisciculture and cultivation of vegetables, mushrooms etc.
under controlled conditions and services related to agro and allied sectors) and
Plantations (Other than Tea Plantations);
Real estate business, or construction of farm houses; Manufacturing of Cigars,
cheroots, cigarillos and cigarettes of tobacco or of tobacco or of tobacco
substitutes.
In order to liberalize Foreign Investment in India and to attract more number
of foreign Investors the Government attempts to maintain a practice to continuously
review the Foreign Investment policy. The acceptance of the recommendations to
increase the Foreign Investment Limits in the respective sectors will not only attract
Foreign Investment in India but will also provide growth opportunities to Indian
Companies who can collaborate with Foreign Companies to start business in various

67
new sectors. The withdrawal of requirement of Government Approval for Investment
in different sectors will also act as an incentive various business prospects and will
expedite the launch of new projects. “Consensus” on raising FDI limits in some
sectors and relaxing the route in others was arrived at a meeting Prime Minister
Manmohan Singh took with his key ministers, Commerce and Industry Minister
Anand Sharma said.

68
Flow of Foreign Direct Investment in India during Pre-Liberalization Period
This table depicts the aggregate flow of Foreign Direct Investments during
Pre-Liberalization Period.
Table 3.4
Flow of Foreign Direct Investment in India
During Pre-Liberalization Period (Rs. in Million)
Year Direct
Investment
(A)
%
Share
Portfolio
Investment
(B)
%
Share
TOTAL
(A+B)
%
Share
in
(A+B)
Index
No.
Growth
Rate
Mid 1948 23.1 80.21 5.7 19.79 28.8 5.61 100 -
End 1961 52.7 92.46 4.3 7.54 57.0 11.10 198 98.00
March 1970 73.5 88.66 9.4 11.34 82.9 16.15 288 94.00
March 1980 93.3 88.46 12.2 11.54 105.5 20.55 366 88.67
March 1985 102.9 88.40 13.5 11.60 116.4 22.68 404 76.00
March 1990 107.6 87.69 15.1 12.31 122.7 23.91 426 65.20
TOTAL 453.1 88.27 60.2 11.73 513.3 100.00 84.37
(Avg)
*Source: Compiled from Various Reports of OECD, UNCTAD, World Bank, Fact Sheets of FDI,
Economic Survey, Monthly Bulletins of Reserve Bank of India, Press Notes issued by the DIPP,
Ministry of Commerce and Industry, Government of India.
Flow of Foreign Direct Investment in India
During Pre-Liberalization Period
0
100
200
300
400
500
600
Mid1948
End1961
Mar-70Mar-80Mar-85Mar-90 TOTAL
Direct Investment (A)
Portfolio Investment (B)
TOTAL (A+B)

69
Table 3.4 reveals that the aggregate flow of Foreign Direct Investments which
stood at Rs 28.8 Million in Mid 1948 increased to Rs 122.7 Million in the year 1990.
It means a net increase of 426 % in March 1990 over the base year mid 1948.India
accepted highest amount of total FDI of Rs 122.7 Million at the end of March 1990
during the Pre Liberalization Period. Table further explains that India attracted total
FDI of Rs.28.8 Million in 1948 just one year after India got freedom. In the end of
1961, % share in direct foreign investment was 92.46 which was highest upto March
1990 and also with highest growth rate of 98, Although Portfolio investment in this
period was decreased by Rs 1.4 Million having least % share of 7.54. Since 1948 to
march 1990 share of direct investment in total foreign investment is more than
average 87.65 in every given span except share of FDI in 1948. Whereas share of
portfolio investment in total foreign investment is less than average 12.35 % in every
given span of time except mid 1948. Growth rate in March 1985 and March 1990 is
less as compared to average growth rate of 84.37. Total amount of foreign investment
was also increased Rs 28.8 Millions to Rs 57 Million i.e. Rs 28.2 Million during this
period. The growth rate is decreasing since the beginning of mid 1948 to the end of
March, 1990. But table further depicts that total amount of direct investment and
portfolio investment is showing an increasing trend jointly and individually during
this period except the trend of portfolio investment of end 1961.
Flow of Foreign Direct Investment in India During Post-Liberalization Period
There are two types of foreign direct investment one is direct investment and
another one is portfolio investment. This table reveals that the aggregate flow of
Foreign Direct Investments during Pre-Liberalization Period

70
Table 3.5
Flow of Foreign Direct Investment in India During Post-Liberalization Period
(US$ in Million) Year
Direct
Investment
Percentage
Share in
(A+B)
Portfolio
Investment
Percentage
Share in
(A+B)
TOTAL
(A+B)
% Index
No.
Growth
Rate
(A) % (B) %
1990-1991 97 .03 94.17 6 .003 5.83 103 .021 100 -
1991-1992 129 .04 96.99 4 .002 3.01 133 .027 129 29
1992-1993 315 .11 56.35 244 .13 43.65 559 .12 543 221.5
1993-1994 586 .19 14.11 3,567 1.92 85.89 4,153 .86 4032 1010.67
1994-1995 1,314 .44 25.57 3,824 2.06 74.43 5,138 1.07 4988 1222
1995-1996 2,144 .72 43.83 2,748 1.48 56.17 4,892 1.02 4750 930
1996-1997 2,821 .95 45.99 3,312 1.78 54.01 6,133 1.27 5954 975.67
1997-1998 3,557 1.20 66.05 1,828 .98 33.95 5,385 1.12 5228 732.57
1998-1999 2,462 .83 102.54 -61 - - 2,401 .94 2331 278.88
1999-2000 2,155 .73 71.22 3,026 1.63 28.78 5,181 1.08 5030 547.78
2000-2001 4,029 1.36 59.35 2,760 1.48 40.65 6,789 1.41 6591 649.1
2001-2002 6,130 2.07 75.21 2,021 1.09 24.79 8,151 1.69 7914 710.36
2002-2003 5,035 1.70 83.72 979 .53 16.28 6,014 1.25 5839 478.25
2003-2004 4,322 1.46 27.53 11,377 6.12 72.47 15,699 3.26 15242 1164.77
2004-2005 6,051 2.05 39.38 9,315 5.01 60.62 15,366 3.19 14918 1058.43
2005-2006 8,961 3.03 71.73 12,492 6.72 28.27 21,453 4.45 20828 1381.87
2006-2007 22,826 7.72 76.52 7,003 3.76 23.48 29,829 6.19 28960 1803.75
2007-2008 34,843 11.78 56.10 27,271 14.66 43.90 62,114 12.89 60305 3541.47
2008-2009 41,873 14.16 149.45 -13,855 - - 28,018 5.82 27201 1505.67
2009-2010 37,745 12.76 53.83 32,376 17.41 46.17 70,121 14.56 68079 3577.84
2010-2011 34,847 11.78 52.55 31,471 16.92 47.45 66,318 13.77 64386 3214.3
2011-2012 46,553 15.74 72.78 17,410 9.36 27.22 63,963 13.28 62100 2952.38
2012-2013 26,953 9.11 50.06 26,891 14.46 49.94 53,844 11.18 52276 2371.64
TOTAL 2,95,748 100 61.33 1,86,009 100 28.67 4,81,757 100
*Source: Compiled from Various Reports of OECD, UNCTAD, World Bank, Fact Sheets of FDI, Economic Survey,
Monthly Bulletins of Reserve Bank of India, Press Notes issued by the DIPP, Ministry of Commerce and Industry, Government of India.

71
Flow of Foreign Direct Investment in India During Post-Liberalization Period
Table 3.5 describes that total foreign direct investment of US$ 97 Million in
1990-91 increased to US$ 26953 Millions in 2012-13 with increase of approximately
278 times. Whereas Portfolio Investment shows an increase of 4482 times as compare
to 1990-91. Maximum amount of FDI during the total journey of 23 years is US$
46553 in 2011-12 which is 15.74% in Total FDI and maximum amount of Portfolio
investment during this period is US$ 32376 in 2009-10 which is 17.41% in total
portfolio investment. But percentage share of FDI in total Foreign Investment is
highest i.e. 149.45% in 2008-09 and 102.54% in 1998-99 due to negative direction of
FDI because total foreign investment was found less than FDI. During the initial
period of 8 years of post liberalization period and during 2003-04 to 2008-09 FDI
shows an increasing trend whereas trend of Portfolio investment during this period is
fluctuating. Percentage share of FDI in total FDI of 23 years was very low during the
first 9 years and the same position was in case of Portfolio Investment in initial 3
years. As far as percentage of portfolio investment in total Portfolio Investment is
concerned it was highest in 1993-94 i.e. 85.89%. Maximum total foreign investment
inflow amounts US$ 70,121 Million was in 2009-10. Growth rate of total foreign
investment shown an increasing trend during the first 5 years after slight fluctuating
there was again an increasing trend during 1999 to 2002. Maximum growth rate i.e.
3577.84 was during the year 2009-10. After that Table further shows that trend of
growth rate is fluctuating upto 2012-13.From the year 2003-04 to 2008-09 FDI shows
-100000
0
100000
200000
300000
400000
500000
600000
Direct Investment
Portfolio Investment
TOTAL (A+B)

72
a whopping increase of approximately 10 times as government announce SEZ Act
2005 for providing an internationally competitive and hassle free environment for
exports .Table further reveals that upto 2012-13 total foreign investment inflow was
made at US$ 295748 Million (61.39%) as FDI and US$ 186009 Million (38.61%) as
Portfolio Investment.
FDI Inflows and Outflows on the basis of Development of Economies
FDI has played an important role in the development of Indian economy. So
there is necessity to make a comparison between different economies in terms of FDI
inflows and outflows during pre-liberalization and post-liberalization period.
Table 3.6
FDI Inflows on the basis of Development of Economies
(US$ in Billion) Region/
Economy
Pre-
Liberalization
Post-Liberalization
1985-1990
Annual
Average
1991-
1995
Annual
Average
1996-
2000
Annual
Average
2001-
2005
Annual
Average
2006-
2010
Annual
Average
2011
2012
World 141.93 221.21 788.36 748.77 1547.28 1651.51 1350.93
Developed
Economies
116.74 144.3 576.23 487.43 907.35 820.01 560.72
Developing
Economies
24.74 70.23 378.64 229.34 557.48 735.21 702.83
Other
Developed
Economies
7.26 10.21 18.12 20.21 59.06 78.83 72.14
Least
Developed
Economies
0.56 1.41 3.34 7.24 16.14 21.44 25.7
TOTAL 291.23 447.36 1764.69 1492.99 3087.31 3307 2712.32
*Source: Compiled from Various Reports of OECD, UNCTAD, World Bank, Fact Sheets of FDI,
Economic Survey, Monthly Bulletins of Reserve Bank of India, Press Notes issued by the DIPP,
Ministry of Commerce and Industry, Government of India.

73
FDI Inflows on the basis of Development of Economies
(US$ in Billion)
The Table 3.6 makes an attempt to analyze the comparison between different
economies in terms of FDI inflows during pre liberalization and post liberalization
period. During 1985-90 maximum FDI inflow of US$ 141.93 Billion was made
towards World Economy. It is evident from the table that developed economies have
40.09% inflow as compared to minimum share of .19% inflow towards least
developed economies. In the Post liberalization period amount of FDI inflows to
developed economies have increased from US$ 144.3 Billion to 560.72 during the
period under reference, whereas % share of FDI inflow was decreased from 32.26 to
20.68. FDI inflows to developing economies have also increased from US$ 70.23
Billion to US$ 702.83 Billion and % share was also increased from 15.69 to 25.91
during the same period. As far as total amount is concerned table further shows an
increasing trend of FDI inflows to other developed economies and least developed
economies. Table also depicts that FDI inflows to world, developed and developing
economies have first increased from 1985-90 to 1996-2000 and have increased from
2001-05 to 2011 with slight decrease in 2001-05 .Therefore, from the table data
aggregate FDI inflows of all economies show an increasing trend of from 1985-90 to
2011 except in 2001-05. Whereas total amount of FDI inflows to all economies have
been decreased in 2012 in comparison to FDI inflows of 2011 except FDI inflows to
least developed economies.
0
500
1000
1500
2000
2500
3000
3500
Series1
Series2
Series3
Series4
Series5
Series6
Series7

74
Table 3.7
FDI Outflows on the basis of Development of Economies
(US$ in Billion) Region/
Economy
Pre-
Liberalization
Post-Liberalization
1985-1990
Annual
Average
1991-1995
Annual
Average
1996-2000
Annual
Average
2001-2005
Annual
Average
2006-2010
Annual
Average
2011
2012
World 155.58 245.71 756.61 728.94 1641.79 1678.04 1390.96
Developed
Economies
145.01
215.05 683.88 645.59 1281.95 1183.09 909.38
Developing
Economies
155.54 30.37 70.14 74.53 310.59 422.07 426.08
Other
Developed
Economies
31.98 25.81 30.32 39.37 104.75 127.38 141.60
Least
Developed
Economies
0.06 0.09 0.41 0.27 1.96 3.04 5.03
TOTAL 488.17 517.03 1541.36 1488.70 3341.04 3413.62 2873.05
*Source: Compiled from Various Reports of OECD, UNCTAD, World Bank, Fact Sheets of FDI,
Economic Survey, Monthly Bulletins of Reserve Bank of India, Press Notes issued by the DIPP,
Ministry of Commerce and Industry, Government of India.
FDI Outflows on the basis of Development of Economies
The Table 3.7 also shows a comparative study of FDI outflow between
different economies during pre-liberalization and post- liberalization period. During
1985-90 maximum share of FDI outflow is 155.58 US$ Billion from world economies
which is near to developing economies i.e. 155.54 as compared to FDI outflows from
developed, other developed and least developed economies. Table reveals that total
0
2000
4000
6000
8000
10000
12000
14000
16000
Series7
Series6
Series5
Series4
Series3
Series2
Series1

75
amount of FDI outflow from all economies have been geometrically increased from
1991-95 to 2012 whereas % share of FDI outflow for developed, and other developed
economies have been increased during this period. Total FDI outflow from least
developed, other developed economies, developing economies have increased during
the period of study. Whereas trend of total FDI outflow from world and developed
economies is increasing from 1991-95 to 2011 with minor decrease in 2001-05.
Whereas FDI outflow trend of developed economies shows fluctuating trend from
1991-95 to 2001-05 but showing a decreasing trend from 2006-10 to 2012. % share in
total FDI outflow of world economy during Pre- liberalization period and post-
liberalization period in highest among all the economies where as developed and
developing economies have 2nd
and 3rd
rank during the period under reference. Total
FDI outflow from developing, other developed and least developed economies in the
year 2012 has increased and total FDI outflow from world economy and developed
economies has decreased over total amount of FDI outflow of the year 2011.
Top Investing Countries FDI Inflows during Pre-Liberalization Period
There were many countries which were investing in other countries in the
form of foreign direct investment and portfolio investment during pre-liberalization
period. The inflow of FDI in India during Pre-Liberalization period is given in table
3.8.
Table 3.8
Top Investing Countries FDI Inflows during Pre-Liberalization Period
(Million of Dollars) Ranks Country 1980-1985
Annual
Average
1986 1987 1988 1989 1990 Cumulative
1980-90
% to
total
inflows
1 U.S.A. 18742 34080 58140 59420 70560 37190 278132 45.62
2 U.K. 5163 7309 14106 18263 28165 33392 106398 17.45
3 France 2343 3256 5140 8490 10310 12733 42272 6.93
4 Spain 1724 3451 4571 7021 8428 13841 39036 6.40
5 Australia 1968 3289 3701 7290 7393 7086 30727 5.04
6 Netherlands 1648 3522 2889 4953 8660 8017 29689 4.88
7 Belgium
(Luxembourg)
1189 730 2355 5212 7057 8606 25149 4.12
8 Italy 968 -145 4102 6745 2538 6413 20621 3.38
9 Canada -289 1217 4198 3787 4281 5943 19137 3.14
10 Singapore 1330 1710 2836 3647 4212 4808 18543 3.04
TOTAL 34786 58419 102038 124828 151604 138029 609704 100.00
*Source: Compiled from Various Reports of OECD, UNCTAD, World Bank, Fact Sheets of FDI,
Economic Survey, Monthly Bulletins of Reserve Bank of India, Press Notes issued by the DIPP,
Ministry of Commerce and Industry, Government of India.

76
Top Investing Countries FDI Inflows during Pre - Liberalization Period
(Million of Dollars)
Table 3.8 indicates the inflow of FDI in India during Pre-Liberalization period
was accumulated US$ 609704 Million from various countries. It is evident from the
table that USA has topped as the main sources of FDI inflow in India every year from
1980-85 to 1990, although Percentage share has decreased from 53.87 to 26.94%.
Whereas UK, France, Spain and Singapore has shown an increasing trend of FDI
inflow as well as % share during the same period on their respective rank. Table
further shows that Singapore has lowest rank with an increased amount of FDI inflow
by US$ 17213 Million and % share has also increased from 3.82 to 3.84 from 1980-85
to 1990. In case of other countries trend of FDI inflow was fluctuating.
Top Investing Countries FDI Inflows during Post Liberalization Period
There are many countries which are investing in other countries in the form of
foreign direct investment and portfolio investment during post- liberalization period.
The inflow of FDI in India during post- Liberalization period is given in table 3.9.
0
18742
5163
2343 1724
1968 1648
1189
968
-289
1330
34786
1980-1985
1 U.S.A.
2 U.K.
3 France
4 Spain
5 Australia
6 Netherlands
7 Belgium(Luxembourg)
8 Italy
9 Canada
10 Singapore
10 TOTAL

77
Table 3.9
Top Investing Countries FDI Inflows during Post - Liberalization Period
(Million of Dollars)
Ranks Country 1995 2001 2007 2008-09 2009-10 2010-11 2011-12 2012-13 Cumulative % to total
inflows
1 Mauritius .019 .032 .339 11,229 10,376 6,987 9,942 8,175 72,343 38%
2 Singapore 7.206 15.038 46.972 3,454 2,379 1,705 5,257 1,823 18,976 10%
3 U.K. 20.404 52.623 200.039 864 657 2,711 7,874 1,048 17,517 9%
4 Japan .041 6.241 22.550 405 1,183 1,562 2,972 1,693 14,006 7%
5 U.S.A. 58.772 159.461 215.952 1,802 1,943 1,170 1,115 500 11,064 6%
6 Netherlands 12.151 51.927 119.383 883 899 1,213 1,409 1,517 8,626 5%
7 Cyprus .119 .652 2.226 1,287 1,627 913 1,587 435 6,835 4%
8 Germany 12.026 21.138 80.208 629 626 200 1,622 587 5,208 3%
9 France 23.681 50.476 96.221 467 303 734 663 585 3,512 2%
10 U.A.E. .399 1.184 14.187 257 629 341 353 171 2,414 1%
TOTAL 134.818 358.772 798.077 27,331 25,834 21,383 35,121 19,103 190,083 *Source: Compiled from Various Reports of OECD, UNCTAD, World Bank, Fact Sheets of FDI, Economic Survey, Monthly Bulletins of Reserve Bank of India, Press
Notes issued by the DIPP, Ministry of Commerce and Industry, Government of India.

78
The Table 3.9 reveals that cumulative inflow of FDI in India is US$ 190083
Million in the Post liberalization period upto 2012-13 from various countries. In this
period Mauritius has topped as the main source of FDI inflow in India with a major
cumulative Percentage share of 38% but Percentage share in is decreased from
41.08(2008-09) to 28.31(2011). Whereas UAE has lowest rank out of these 10
countries having 1% share in cumulative total FDI inflow in the same period. UK and
USA had significant amount of FDI inflows in the period. Prior to 2008-09 thereafter
quantum of their FDI inflow was not significant. There is no consistency in the trend
of total FDI inflows from these countries except Netherlands during the period under
reference. Since, Mauritius got 1st rank as it’s total FDI flow is more since 2008-09 to
2012-13 as compare to FDI inflow of other countries. Table further shows that FDI
inflow from all the countries in 2012-13 has decreased as compare to FDI inflow of
2011-12 but trend of FDI inflow from Netherlands is increasing. As far as total
amount of FDI inflow from various countries is maximum in the year 2011-12 in
comparison to remaining period. Total amount of FDI inflow of US$ 35,121 Million
with 18.48% share in cumulative FDI inflow upto January 2013 is the highest as
compare to other periods.
Top Investing Countries FDI Outflows during Post Liberalization Period
There are many countries which are investing in other countries in the form of
foreign direct investment during Post-liberalization period. The outflow of FDI in
India during Post-liberalization period is given in table 3.10.
Table 3.10
Top Investing Countries FDI Outflows during Post Liberalization Period
(Million of Dollars) Rank Country
1995 2000 2005 2010 2011 2012 Total %
1 U.S.A 58.77 314.01 101.03 197.91 226.94 167.62 1066.28 40.46
2 U.K 20.40 118.76 193.69 50.60 51.14 62.35 496.94 18.86
3 Germany 12.03 198.28 35.87 57.43 48.94 6.57 359.12 13.62
4 France 23.68 43.25 81.06 33.63 38.55 25.09 245.26 9.31
5 Canada 9.26 66.79 28.92 29.09 41.39 45.38 220.83 8.39
6 Netherland 12.15 63.85 41.46 7.37 17.18 .24 142.25 5.40
7 Sweden 14.45 23.24 10.17 .06 9.25 13.71 70.88 2.69
8 New Zealand 3.74 3.35 1.67 .45 4.32 2.91 16.44 .62
9 Japan .04 8.32 2.78 1.25 1.76 1.73 15.88 .60
10 Mauritius .02 .28 .04 .43 .27 .36 1.4 .05
TOTAL 154.54 840.13 496.69 378.22 439.74 325.96 2635.28 100.00
*Source: Compiled from Various Reports of OECD, UNCTAD, World Bank, Fact Sheets of FDI,
Economic Survey, Monthly Bulletins of Reserve Bank of India, Press Notes issued by the DIPP,
Ministry of Commerce and Industry, Government of India.

79
Top Investing Countries FDI Outflows during Post Liberalization Period
Table 3.10 indicates that total FDI outflow of US$ 2635.28 Million was made
by all these 10 countries during the period. In the year 1995, 2000, 2010, 2011 and
2012 maximum FDI outflow was made by USA where as maximum amount of FDI
outflow was contributed by UK in 2005, with 2nd
rank among these 10 countries.
Mauritius has lowest rank in terms of FDI outflow in the year 1995, 2000, 2005 and
2011. UK, Canada and Sweden have an increasing trend of FDI outflow during the
year 2010, 2011 and 2012 where as trend of FDI outflow made by Germany is
decreasing during the same period. In case of other countries FDI outflow is showing
the fluctuating trend during this period of 3 years. The table also depicts that USA has
topped the position of total outflow with 40.40% share in the total amount , 2nd
and 3rd
rank was achieved by UK and Germany respectively. Table further reveals that
Maximum FDI outflow was made by all these top 10 countries in the year 2000 but
minimum in the year 1995.
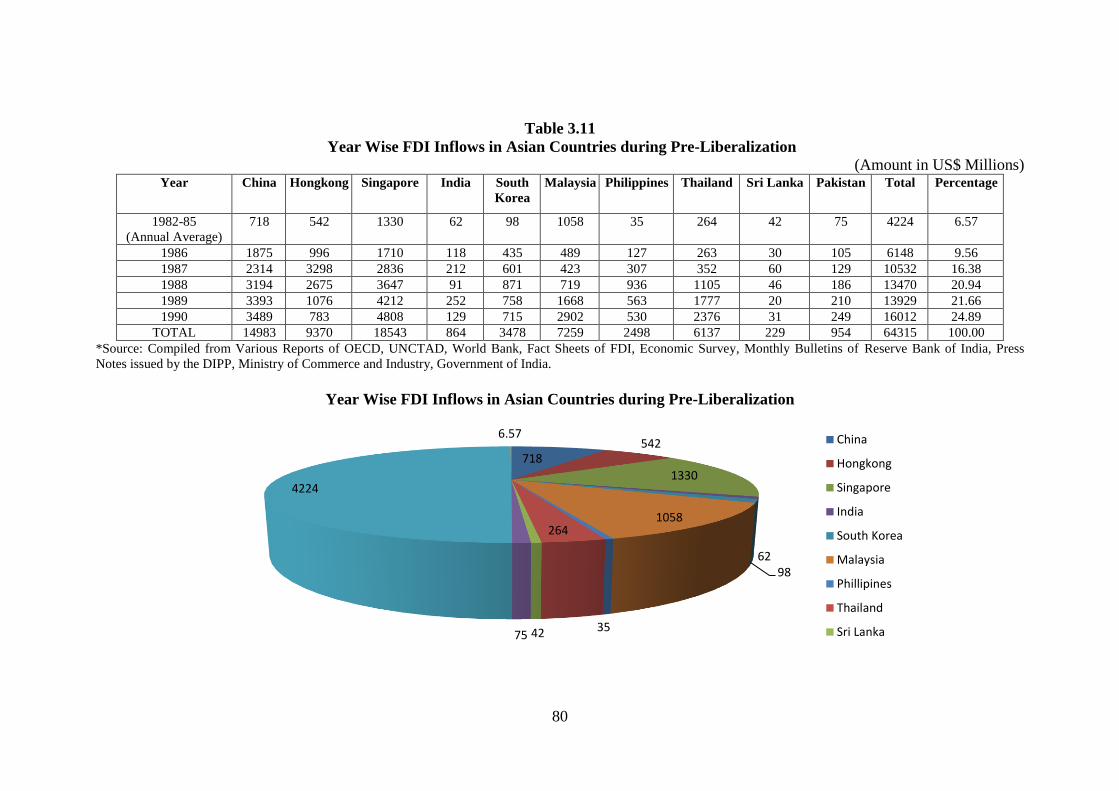
Year Wise FDI Inflows in Asian Countries during Pre-Liberalization
There are various countries which are contributing in Asian countries during
Pre-liberalization. Year Wise FDI Inflows in Asian Countries during Pre-
Liberalization is presented in table 3.11. India could contribute only US$ 864 Million
with 1.34% share which is more than only one Asian country i.e. Sri Lanka.
58.77
20.4
12.03
23.68
9.26
12.15
14.45
3.74
0.04
0.02
154.54
1 U.S.A
2 U.K
3 Germany
4 France
5 Canada
6 Netherland
7 Sweden
8 New Zealand
9 Japan
10 Mauritius
10 TOTAL
80
Table 3.11
Year Wise FDI Inflows in Asian Countries during Pre-Liberalization (Amount in US$ Millions)
Year China Hongkong Singapore India South
Korea
Malaysia Philippines Thailand Sri Lanka Pakistan Total Percentage
1982-85
(Annual Average)
718 542 1330 62 98 1058 35 264 42 75 4224 6.57
1986 1875 996 1710 118 435 489 127 263 30 105 6148 9.56
1987 2314 3298 2836 212 601 423 307 352 60 129 10532 16.38
1988 3194 2675 3647 91 871 719 936 1105 46 186 13470 20.94
1989 3393 1076 4212 252 758 1668 563 1777 20 210 13929 21.66
1990 3489 783 4808 129 715 2902 530 2376 31 249 16012 24.89
TOTAL 14983 9370 18543 864 3478 7259 2498 6137 229 954 64315 100.00
*Source: Compiled from Various Reports of OECD, UNCTAD, World Bank, Fact Sheets of FDI, Economic Survey, Monthly Bulletins of Reserve Bank of India, Press
Notes issued by the DIPP, Ministry of Commerce and Industry, Government of India.
Year Wise FDI Inflows in Asian Countries during Pre-Liberalization
718 542
1330
62 98
1058
35
264
42 75
4224
6.57 China
Hongkong
Singapore
India
South Korea
Malaysia
Phillipines
Thailand
Sri Lanka

81
Table 3.12
Year Wise FDI Inflows in Asian Countries during Post-Liberalization
(Amount in US$ Millions)
Year China Hongkong Singapore India South
Korea
Malaysia Philippines Thailand Sri
Lanka
Pakistan Total Percentage
1991 4.366 .538 4.879 .141 1.180 3.998 .544 2.014 .048 .257 17.965 0.57
1992 11.156 2.051 2.351 .151 .727 5.183 .228 2.116 .123 .335 24.421 0.78
1993 27.515 1.667 5.016 .273 .588 5.006 1.025 1.726 .195 .354 43.365 1.39
1994 33.787 2.000 5.588 .620 .809 4.348 1.457 .640 .166 .422 49.837 1.59
1995 35.849 2.100 6.912 1.929 1.776 4.132 1.478 2.003 .063 .639 56.881 1.82
1996 40.180 5.521 7.884 2.426 2.325 5.078 1.517 2.336 .120 .919 68.306 2.18
1997 44.236 6.000 9.710 3.351 2.844 5.106 1.222 3.733 .430 .714 77.346 2.47
1998 45.463 14.766 7.690 2.633 5.039 2.714 2.212 7.491 .150 .507 88.665 2.84
1999 40.319 24.580 16.067 2.168 9.436 3.895 1.725 6.091 .201 .530 105.012 3.36
2000 40.715 61.939 17.217 2.319 8.572 3.788 1.345 3.350 .175 .305 139.725 4.46
2001 46.878 23.775 15.038 3.403 3.683 .554 .982 3.813 .082 .385 98.593 3.15
2002 52.743 9.682 5.730 3.449 2.941 3.203 1.792 1.068 .197 .823 81.628 2.61
2003 53.505 13.561 11.409 4.269 3.752 2.474 .319 1.802 .229 1.405 92.725 2.96
2004 60.630 34.032 19.828 5.771 8.980 4.624 .688 5.862 .233 1.118 141.766 4.54
2005 72.406 33.618 15.004 6.676 7.050 3.965 1.854 8.957 .272 2.201 152.003 4.86
2006 72.715 45.060 36.700 20.328 4.881 6.060 2.921 9.501 .480 4.273 202.919 6.48
2007 83.521 54.341 46.930 25.506 2.628 8.595 2.916 11.359 .603 5.590 241.989 7.73
2008 108.312 59.621 11.798 43.406 8.409 7.172 1.544 8.455 .752 5.438 254.907 8.14
2009 95.000 54.274 24.939 35.657 8.961 1.453 1.963 4.854 .404 2.338 229.843 7.34
2010 114.734 82.708 53.623 21.125 10.110 9.060 1.298 9.147 .478 2.022 304.305 9.72
2011 123.985 96.125 55.923 36.190 10.247 12.198 1.816 7.779 .981 1.327 346.571 11.07
2012 121.080 74.584 56.651 25.543 9.904 10.074 2.797 8.607 .776 .847 310.863 9.94
Total 1329.095 702.543 436.887 247.334 114.842 112.68 33.643 112.704 7.158 32.749 3129.635 100.00 *Source: Compiled from Various Reports of OECD, UNCTAD, World Bank, Fact Sheets of FDI, Economic Survey, Monthly Bulletins of Reserve Bank of India, Press
Notes issued by the DIPP, Ministry of Commerce and Industry, Government of India.

82
Year Wise FDI Inflows in Asian Countries during Post-Liberalization
The Table 3.11 indicates that total FDI inflows of US$ 64,315 Million was
made in all the Asian countries during the pre-liberalization period in which
Singapore has maximum share of 28.83 % followed by China with 23.39% share in
the total FDI inflow. These both Asian countries got the same rank in the year 1988,
1989 and 1990 in terms of total amount of FDI inflows. India could contribute only
US$ 864 Million with 1.34% share which is more than only one Asian country i.e. Sri
Lanka. Hence, position of India in this regard is not satisfactory during this period
under reference as far as year wise analysis is concerned total FDI inflow of US$
16012 Million with 24.89% share was made in the year 1990 where as minimum FDI
inflow of US$ 4224 Million with 6.57% share was marked during 1982-85. Since
1982-85 to 1990 total amount of FDI inflows shows an increasing trend every year
during the pre-liberalization period. In 1986 China got 1st rank followed by Singapore
whereas in 1987 Hongkong got 1st position which was followed by Singapore.
4.366
11.156
27.515
33.787
35.849
40.18
44.236
45.463
40.319
40.715
46.878
52.743
53.505
60.63
72.406
72.715
83.521
108.312
95
114.734
123.985 121.08
1329.095
China
1991
1992
1993
1994
1995
1996
1997
1998
1999
2000
2001
2002
2003
2004
2005
2006
2007

83
Table 3.12 shows that total FDI of US$ 3129.635 Million were made in 10
Main Asian Countries in the post reforms period during 1991 to 2012. In the total
amount of Maximum FDI has been shared by China i.e. 42.47% during this period of
22 years and Hongkong got 2nd
rank in this regard. Whereas minimum FDI inflow
was made towards Sri Lanka amounted US$ 7.158 having .23% share in total FDI
inflows. As far as our country India is concerned a total amount of US$ 247.334
Millions FDI was made which is 7.9% in total FDI inflows. In this post-liberalization
period highest amount of FDI inflow is made in the year 2011 which is followed by
all these countries in the year 2012. But minimum FDI inflow was US$ .57 and .78
Million in the year 1991 and 1992 respectively during the initial stage of post reforms
period. Table again reveals that India got 4th
rank among these 10 Asian Countries.
India has 59.77% of share in total FDI inflows of South Korea, Malaysia, Phillipines ,
Thailand , Sri Lanka and Pakistan but 10% share in total FDI of Hongkong, China and
Singapore. Table further reveals that only China has an increasing trend of FDI
inflows during a maximum period of 18 years i.e. 1991 to 2008. Whereas other
countries have an increasing trend of FDI inflows for a period of maximum 5 or 6
years generally in the initial years. But trend of FDI inflow in other Asian Countries is
fluctuating in this regard.
Year Wise FDI outflows in Asian Countries during Pre-Liberalization
There are various countries which are contributing in Asian countries during
Pre-liberalization. Year Wise FDI outflows in Asian Countries during Pre-
Liberalization is presented in table 3.13.

84
Table No. 3.13
Year Wise FDI Outflows by Asian Countries during Pre-Liberalization
(Amount in US$ Millions)
Countries 1984-89
(Annual
Average)
1990 Total Percentage
China .581 .830 1.411 13.87
Hongkong 1.833 2.448 4.281 42.07
Singapore .286 2.034 2.320 22.80
India .005 .006 .011 .11
South Korea .137 1.056 1.193 11.71
Malaysia .233 .532 .765 7.52
Phillipines .004 -.005 -.001 0
Thailand .041 .140 .181 1.78
Sri Lanka .001 .001 .002 .02
Pakistan .010 .002 .012 .12
Total 3.131 7.044 10.175 100 *Source: Compiled from Various Reports of OECD, UNCTAD, World Bank, Fact Sheets of FDI,
Economic Survey, Monthly Bulletins of Reserve Bank of India, Press Notes issued by the DIPP,
Ministry of Commerce and Industry, Government of India.
Table 3.13 contains the data of FDI inflows for two period only during the pre-
liberalization period i.e. annual average FDI inflows from 1984-89 and for the year
1990.On the basis of these date table reveals that during 1984-89 maximum FDI
outflow was made by Hongkong amounted US$ 1.833 Million out of total Average
FDI outflow with 58.54% share which is followed by China with 18.56 percentage
share where as minimum FDI outflow was made by Sri Lanka. In the year 1990 also
maximum FDI outflow was made by Hongkong with 34.75% followed by Singapore.
Whereas in 1990 also minimum FDI outflow was also made by Sri Lanka in 1990.
Table further depicts that during the pre-liberalization period Hongkong, Singapore
and China have 1st , 2
nd and 3
rd rank respectively out of these 10 Asian countries but
Phillipines and Sri Lanka have lowest position in total of FDI outflows. During this
period Rank of India in total FDI outflow was not satisfactory.
Year Wise FDI outflows in Asian Countries during Post-Liberalization
There are various countries which are contributing in Asian countries during
Post-liberalization. Year Wise FDI outflows in Asian Countries during Post-
Liberalization is presented in table 3.14

85
Table 3.14
Year Wise FDI Outflows in Asian Countries during Post-Liberalization
(Amount in US$ Millions)
Year China Hongkong Singapore India South
Korea
Malaysia Philippines Thailand Sri
Lanka
Pakistan Total Percentage
1991 .913 2.825 1.024 -.011 1.500 .389 -.026 .167 .005 -.004 6.782 00.34
1992 4.000 8.254 1.317 .024 1.208 .514 .005 .147 .002 -.012 15.459 00.78
1993 4.400 17.713 1.784 .041 1.361 1.325 -.007 .221 .007 -.002 26.843 01.35
1994 2.000 21.437 2.177 .049 2.524 1.817 .028 .493 .008 -.006 30.527 01.54
1995 2.000 25.000 6.281 .117 3.552 3.091 .399 .887 .007 - 41.334 02.09
1996 2.114 26.531 6.274 .239 4.670 4.133 .182 .931 .001 .007 45.082 02.27
1997 2.563 24.407 4.722 .113 4.449 3.425 .136 .447 .001 -.024 40.239 02.03
1998 2.634 16.985 2.996 .047 4.740 .863 .160 .132 -.013 .005 28.549 01.44
1999 1.775 19.358 7.517 .080 4.198 1.422 -.029 .349 .024 .001 34.695 01.75
2000 .916 59.375 5.298 .509 4.999 2.026 -.108 -.022 .002 .011 73.006 03.68
2001 6.884 11.345 17.063 1.397 2.420 .267 -.160 .162 - .031 39.409 01.99
2002 2.518 17.463 3.699 1.107 2.617 1.904 .059 .106 .011 .028 29.512 01.49
2003 1.800 3.769 5.536 .913 3.429 1.370 .158 .557 .004 .019 17.555 00.89
2004 5.498 45.716 8.074 2.179 4.658 2.061 .579 .076 .006 .056 68.903 03.48
2005 12.261 27.201 5.034 2.495 4.298 2.972 .189 .552 .038 .044 55.084 02.78
2006 21.160 44.979 18.637 14.285 11.175 6.021 .103 .968 .029 .109 117.466 05.93
2007 22.469 61.081 36.897 19.594 19.720 11.314 3.536 3.003 .055 .098 177.767 08.97
2008 52.150 50.581 6.812 19.257 20.251 14.965 .259 4.057 .062 .049 168.443 08.49
2009 56.530 63.991 17.704 15.927 17.197 7.784 .359 4.172 .020 .071 183.755 09.27
2010 68.811 98.414 25.341 15.933 28.357 13.399 .616 4.467 .043 .047 255.428 12.89
2011 74.654 95.885 26.249 12.456 28.999 15.249 .539 8.217 .060 .062 262.370 13.24
2012 84.220 83.985 23.080 8.583 32.978 17.115 1.845 11.911 .080 .073 263.870 13.31
Total 432.270 826.295 233.516 115.334 209.300 113.426 8.822 42.000 .452 .663 1982.078 100.00
*Source: Compiled from Various Reports of OECD, UNCTAD, World Bank, Fact Sheets of FDI, Economic Survey, Monthly Bulletins of Reserve Bank of India, Press
Notes issued by the DIPP, Ministry of Commerce and Industry, Government of India.

86
Table 3.14 indicates that US$ 1982.078 million FDI outflow was made by
these 10 Asian Countries during the post- liberalization period from 1991 to 2012. As
per these data maximum FDI outflow was made by Hongkong amounted US$
826.295 million with 41.69 share in total amount, whereas China and Singapore got
2nd
and 3rd
rank respectively in this regard. But Sri Lanka could contribute minimum
FDI outflows with .023% share in total FDI outflows during this period under
reference. As far as year wise data is concerned highest amount of FDI outflow with
13.31% share was made in the year 2012 as compare to earlier years. But these
countries could contribute minimum amount of FDI outflows in the initial years
during the same period of 22 years. Table 3.15 depicts that China has increasing trend
of FDI outflow in a maximum period of 10 years at the end (during2003 to 2012). But
Hongkong, Singapore, India, South Korea, Malaysia and Thailand has increasing
trend for a period of approximately 5 to 6 years in the initial stage (1991-2000) where
as Malaysia and Thailand show increasing trend in approximately 6 to 7 years during
2001 to 2012. Table further reveals that India has 5th
Rank with 5.82% share in total
FDI outflow during the period of study under reference. Table also indicates that all
these 10 Asian Countries could contribute only 17.27% in total FDI outflows during
first 10 years of Post-liberalization period i.e. 1991 to 2000 where as 82.73% of total
FDI outflow was made by these countries in last 12 years i.e. 2001 to 2012. India is
leading Asian Country in this regard.

87
Sectoral Distribution of the Stock of FDI in India during Pre-liberalization
Period
This table explains stock in various sectors in India. Table 3.15 explains a
brief account of FDI in India at the end of Financial Years 1964, 1974, 1980 and 1990
regarding distribution of FDI in some important sectors.
Table 3.15
Sectoral Distribution of the Stock of FDI in India during Pre-liberalization
(Rs Crores = 10 million) Industry March 1964 March 1974 March 1980 March 1990
A. Plantation 105.6
(18.7)
107.2
(11.7)
38.5
(4.1)
256
(9.5)
B. Mining
4.7
(0.9)
6.4
(0.8)
7.8
(0.8)
8.0
(0.3)
C. Petroleum
143.3
(25.3)
137.9
(14.7)
36.8
(3.9)
3.0
(0.1)
D. Manufacturing
229.3
(40.5)
625.6
(68.4)
811.6
(86.9)
2298
(84.9)
i. Food and
Beverages.
30.2
(13.2)
52.1
(8.3)
39.1
(4.8)
162
(7.0)
ii. Textile Products
16.6
(7.2)
35.6
(5.7)
32.0
(3.9)
92
(4.0)
iii. Machinery and
Machine Tools
15.7
(6.8)
42.1
(6.7)
71.0
(8.8)
354
(15.4)
iv. Transport
Equipment
15.0
(6.5)
32.1
(5.1)
51.5
(6.3)
282
(12.3)
v. Metal and Metal
Products
33.1
(14.4)
86.7
(13.9)
118.7
(14.7)
141
(6.1)
vi. Electrical Goods
18.2
(7.9)
68.1
(10.9)
97.5
(12.0)
295
(12.8)
i. Chemical and
Allied Products
60.1
(26.2)
203.7
(32.6)
30.8
(37.2)
769
(33.4)
ii. Miscellaneous
40.4
(17.6)
105.0
(16.7)
100.0
(12.3)
203
(8.8)
E. Services
82.3
(14.6)
39.8
(4.4)
38.5
(4.1)
140
(5.2)
Total
565.5
(100.0)
916.9
(100.0)
933.2
(100.0)
2705
(100.0)
*Source: Compiled from Various Reports of OECD, UNCTAD, World Bank, Fact Sheets of FDI,
Economic Survey, Monthly Bulletins of Reserve Bank of India, Press Notes issued by the DIPP,
Ministry of Commerce and Industry, Government of India.
Note: Figures in parenthesis show percentage from the total.
Table 3.15 reveals that manufacturing sector has highest share of 40.5%
followed by petroleum sector with 25.3% where as mining sector has minimum share
of 0.9%. Table depicts the same trend in the year 1974 by the manufacturing sector. It
is evident from the table that manufacturing sector again got highest share of 86.9%
and followed by plantation and service sector with the same equal share of 4.1% but
minimum share of 0.8% is marked by mining sector. In 1990 also manufacturing

88
sector has highest share of 84.9 followed by plantation sector but mining sector has
minimum share of 8.1 % FDI inflow. Table further shows that mining and petroleum
sector show decreasing trend during this period whereas manufacturing sector shows
increasing trend upto march 1980 and decreased in 1990. Trend of service sector
regarding FDI inflow is decreasing upto 1980 with minor increment in 1990.
Maximum FDI inflow was made in chemical & allied products and minimum FDI in
textile products by the manufacturing industry during this period under reference.
Sectors Attracting Highest FDI Equity Inflows during Post-liberalization Period
This table explains stock of FDI in top ten sectors in India. Table 3.16 reveals
a brief account of FDI during Post-liberalization period upto 31.03.2014 regarding
distribution of FDI in some important sectors out of total sectors in which FDI is
permitted in India.

89
Table 3.16
Sectors Attracting Highest FDI Equity Inflows during Post-liberalization Amount in Rs. Crores (US$ in million)
Ranks Sector Upto
31.03.2009
2009-10 2010-11 2011-12 2012-13 2013-14 Cumulative
Inflows
(April 2000-14)
%age to total Inflows
(in terms of US$)
1 Services Sector
(financial & non- financial)
85,484
(19,538)
20,776
(4,353)
15,054
(3,296)
24,656
(5,216)
26,306
(4,833)
13,294
(2,225)
1,85,570
(39,460)
18%
2 Construction Development:
Township, Housing, Built-
Up Infrastructure
57,460
(13,078)
13,516
(2,862)
7,590
(1,667)
15,236
(3,141)
7,248
(1,332)
7,508
(1,226)
1,08,558
(23,306)
11%
3 Telecommunications
(radio paging, cellular
mobile, basic telephone
services)
28,187
(6,336)
12,338
(2,554)
7,542
(1,665)
9,012
(1,997)
1,654
(304)
7,987
(1,307)
66,720
(14,163)
7%
4 Computer Software &
hardware
38,413
(8,710)
4,351
(919)
3,551
(780)
3,804
(796)
2,656
(486)
6,896
(1,126)
59,671
(12,817)
6%
5 Drugs & Pharmaceuticals 26,296
(5,542)
1,006
(213)
961
(209)
14,605
(3,232)
6,011
(1,123)
7,191
(1,279)
56,070
(11,598)
5%
6 Automobile Industry
14,821
(3,328)
5,754
(1,208)
5,864
(1,299)
4,347
(923)
8,384
(1,537)
9,027
(1,517)
48,197
(9,812)
5%
7 Chemicals (other than
fertilizers)
8,159
(1750)
1,707
(362)
10,612
(2,345)
18,422
(4,041)
1,596
(292)
4.738
(878)
45,234
(9,668)
4%
8 Power
12,831
(2,937)
6,908
(1,437)
5,796
(1,272)
7,678
(1,652)
2,923
(536)
6,519
(1,066)
42,655
(8,900)
4%
9 Metallurgical Industries 11,630
(2,750)
1,935
(407)
5,023
(1,098)
8,348
(1,786)
7,878
(1,466)
3,436
(568)
38,250
(8,075)
4%
10 Hotel & Tourism 5,758
(1,389)
3,566
(753)
1,405
(308)
4,754
(993)
17,777
(3,259)
2,949
(486)
36,209
(7,188)
3%
*Source: Compiled from Various Reports of OECD, UNCTAD, World Bank, Fact Sheets of FDI, Economic Survey, Monthly Bulletins of Reserve Bank of India,
Press Notes issued by the DIPP, Ministry of Commerce and Industry, Government of India.

90
The table 3.16 indicates a brief account of FDI in India upto 31.03.2014 in
respect of sectors attracting highest amount of FDI inflows during post-liberalization
period. As far as higher amount of FDI inflow upto 31.03.2009 is concerned, Service
Sector (financial and non-financial) has highest figure of FDI inflow amounting to
Rs.85,484 crores followed by Construction Sector. Out of these top ten sectors the
foreign promoters have shown their less interest in Hotel & Tourism Sector. It is
evident from the table that same trend of FDI inflow in India can be seen upto
31.03.2014 regarding the top position enjoyed by Service Sector having Rs.1.85.570
crore with 18 per cent in total inflows and lowest position retained by Hotel &
Tourism Sector amounting Rs.36,2089 crore with 3 per cent in total FDI inflows.
During this period Computer Software & Hardware Sector had 3rd
rank upto
31.03.2009 but declined to 4th
rank upto 31.03.2014 regarding FDI inflows. Chemical
Sector has 9th
rank in the beginning and now it is reached at 7th
rank regarding FDI
inflows. In total, maximum FDI inflow has been shared by Service Sector whereas
minimum by Hotel & Tourism Sector out of these top ten sectors during this period
under reference.
RBI’s Regional Office-Wise Financial-Year Wise FDI Equity Inflows
There are various Regional offices of RBI governing the different states of our
country in respect of FDI equity inflows from the year 2000 to 2013. Total no. of
Regional offices of RBI governing the different states of our country in respect of FDI
equity inflows from the year 2000 to 2013 is presented in table 3.17

91
Table 3.17
RBI’s Regional Office-Wise Financial-Year Wise FDI Equity Inflows April, 2000 To January, 2013
(Amount in Rs. Crore & US$ million) Sr.
No.
Regional
Offices of RBI
States Covered Upto March,
2009
2009-10 2010-11 2011-12 2012-13 Cumulative
(April 2000- Jan 2013)
%age to
Total Inflows
1 MUMBAI MAHARASHTRA,
DADRA & NAGAR
HAVELI, DAMAN &DIU
134,393
(30,722)
39,409
(8,249)
27,669
(6,097)
44,664
(9,553)
40,909
(7,523)
287,044
(62,144)
33
2 NEW DELHI DELHI, PART OF UP
AND HARYANA
55,308
(12,717)
46,197
(9,695)
12,184
(2,677)
37,403
(7,983)
17,020
(3,135)
168,112
(36,207)
19
3 BANGALORE KARNATAKA
25,672
(5,868)
4,852
(1,029)
6,133
(1,332)
7,235
(1,533)
4,342
(799)
48,234
(10,561)
6
4 CHENNAI TAMIL NADU,
PONDICHERRY
21,079
(4,725)
3,653
(774)
6,115
(1,352)
6,711
(1,422)
11,850
(2,176)
49,408
(10,449)
6
5 AHMEDABAD GUJARAT
24,523
(5,625)
3,876
(807)
3,294
(724)
4,730
(1,001)
2,470
(455)
38,893
(8,612)
5
6 HYDERABAD ANDHRA
PRADESH
15,639
(3,496)
5,170
(1,203)
5,753
(1,262)
4,039
(848)
5,635
(1,037)
36,236
(7,846)
4
7 KOLKATA WEST BENGAL,
SIKKIM, ANDAMAN &
NICOBAR SLANDS
5,411
(1,278)
531
(115)
426
(95)
1,817
(394)
1,938
(354)
10,123
(2,236)
1
8 CHANDIGARH CHANDIGARH,
PUNJAB,HARYANA,
HIMACHAL PRADESH
1,756
(385)
1,038
(224)
1,892
(416)
624
(130)
182
(33)
5,492
(1,188)
1
9 BHOPAL MADHYA PRADESH,
CHATTISGARH
1235
(277)
255
(54)
167
(37)
2,274
(471)
342
(63)
4,273
(902)
0.5
10 KOCHI KERELA,
LAKSHADWEEP
884
(203)
606
(128)
167
(37)
2,274
(471)
342
(63)
4,273
(902)
0.5
11 PANAJI GOA 1,141
(253)
808
(169)
1,376
(302)
181
(38)
43
(8)
3,549
(770)
0.4
12 JAIPUR RAJASTHAN 2067
(438)
149
(31)
230
(51)
161
(33)
556
(102)
3,163
(655)
0.3
13 BHUBANESHWAR ORISSA 437
(97)
702
(149)
68
(15)
125
(28)
285
(52)
1,617
(341)
0.2

92
14 KANPUR UTTAR PRADESH,
UTTRANCHAL
72
(17)
227
(48)
514
(112)
635
(140)
136
(25)
1,584
(342)
0.2
15 GUWAHATI ASSAM, ARUNACHAL
PRADESH, MANIPUR,
MEGHALAYA,
MIZORAM,
NAGALAND, TRIPURA
228
(53)
51
(11)
37
(8)
5
(1)
27
(5)
348
(78)
0
16 PATNA BIHAR, JHARKHAND 1
(0)
0
(0)
25
(5)
123
(24)
41
(8)
190
(37)
0
17 REGION NOT INDICATED 100,149
(22,496)
15,056
(3,148)
29,344
(6,447)
53,851
(11,399)
17,325
(3,172)
215,725
(46,662)
24.6
Sub Total 389,426
(88,521)
122,580
(25,834)
97,320
(21,383)
165,146
(35,121)
103,956
(19,103)
878,429
(189,962)
100
18 RBI’S – NRI SCHEMES
(from 2000 to 2002)
533
(121)
0 0 0 0 533
(121)
-
GRAND TOTAL 389,960
(88,642)
122,580
(25,834)
97,320
(21,383)
165,146
(35,121)
103,956
(19,103)
878,962
(190,083)
-
*Source: Compiled from Various Reports of OECD, UNCTAD, World Bank, Fact Sheets of FDI, Economic Survey, Monthly Bulletins of Reserve Bank of India, Press
Notes issued by the DIPP, Ministry of Commerce and Industry, Government of India.
.

93
Table 3.17 indicates the total no. of Regional offices of RBI governing the
different states of our country in respect of FDI equity inflows from the year 2000 to
2013. Table shows that upto 2009 foreign investors have shown their maximum
interest in Mumbai region by investing US $ 62,144 millions for investment with 33%
of total FDI equity inflows. After that their IInd & IIIrd choice for investment was
New Delhi and Banglore Region respectively. But Patna could invite least amount of
FDI inflows in this period. From year 2009 to 2013 also Foreign investors have shown
their attraction towards Mumbai Region investing US $ 62,144 million with highest
share of 33% in total FDI Equity inflows which was followed by New Delhi and
Banglore Region with 19% share and 6% share respectively. During this period
minimum amount of FDI Equity inflows was enjoyed by Patna and Guwahati Region
with US $ 37 million and US $ 78 million respectively. In this journey of 13 years
total amount of US $ 121 million were invested under RBI’s NRI Schemes. Table also
reveals that Chennai Region has an increasing trend of FDI Equity Inflows during last
4 years from 2009-10 to 2012-13 but Bhuvaneshwar Region also shown increasing
trend during last 3 years from 2010-11 to 2012-13. All others regions have fluctuating
trend regarding FDI Equity Inflows during this period under reference.
FDI Inflows and Outflows by Region/ Economy
Different countries contributed in FDI during Pre-Liberalization and Post-
Liberalzation periods. The table 3.18 describes the Region/Economy wise FDI inflow
and outflow for the pre-liberalization and post-liberalization period.

94
Table 3.18
FDI Inflows and Outflows by Region/ Economy
(US$ in Billions) Region/
Economy
FDI INFLOWS
Pre- Liberalization Post- Liberalization
FDI OUTFLOWS
Pre- Liberalization Post- Liberalization
1984-
1989
Annual
average
1990
1991-
1994
Annual
average
1995-
2000
Annual
average
2001-
2005
Annual
average
2006-
2010
Annual
average
2011 2012 1984-
1989
Annual
average
1990
1991-
1994
Annual
average
1995-
2000
Annual
average
2001-
2005
Annual
average
2006-
2010
Annual
average
2011 2012
Developed
Economies
93.12 169.78 122.52 543.9 484.34 907.35 820.01 560.72 113.99 222.45 191.63 638.5 621.48 1281.95 1183.09 909.38
Europe 39.76 103.39 77.08 326.2 337.72 572.71 472.85 275.58 67.96 139.81 111.31 450.6 425.9 824.92 609.20 384.97
European
Union
37.70 97.39 74.00 312.9 327.24 531.22 441.56 258.51 62.64 132.96 102.02 421.3 391.34 746.17 536.49 323.13
Japan .08 1.75 1.59 4.6 6.46 10.23 1.76 1.73 20.79 48.02 24.63 25.1 35.24 76.56 107.60 122.55
USA 43.94 47.92 32.62 169.7 104.78 220.2 226.94 167.62 16.85 27.18 46.76 125.9 123.82 299.48 396.66 328.87
Other
Developed
Countries
4.71 10.61 8.24 43.3 35.34 59.05 78.83 72.14 24.52 50.74 28.58 36.9 36.56 107.75 127.38 141.60
Developing
Economies
22.19 33.74 62.96 188.0 230.86 557.47 735.21 702.83 7.62 17.77 25.52 74.3 81.38 310.59 422.07 426.08
Africa 2.73 2.30 3.55 9.0 19.98 48.37 47.59 50.04 1.03 1.41 .66 2.4 0.6 7.13 5.38 14.29
Latin
America &
Caribbean
7.74 8.90 19.45 72.6 69.46 163.35 249.43 243.86 .59 4.54 1.12 21.1 26.74 86.05 105.15 103.05
Asia &
Oceania
- - - 106.3 141.42 345.75 438.18 408.92 - - - 50.8 54.04 303.33 311.54 308.74
Asia 11.54 22.12 39.51 105.8 141.1 343.99 436.15 406.77 5.98 11.82 22.77 50.8 54.0 217.33 310.61 308.16
West Asia 1.69 2.32 2.35 3.3 17.52 72.34 49.06 47.12 .84 -.46 0.71 0.8 3.92 25.78 26.18 23.94
East Asia - - - 70.7 88.42 165.72 233.82 214.80 - - - 39.6 36.76 135.09 212.52 214.41
China 2.28 3.49 19.21 41.8 57.22 94.86 123.99 121.08 .58 .83 2.83 2.0 6.02 44.22 74.65 84.22
South Asia - - - 3.9 7.28 37.92 44.23 33.51 - - - 0.2 1.96 16.93 12.95 9.22
South –
East Asia
- - - 27.9 27.9 69.01 109.04 111.34 - - - 10.2 11.36 39.53 58.96 60.59

95
Oceania
- - - 0.5 0.32 1.75 2.03 2.15 - - - - .04 86.0 .93 .58
South- East
Europe &
CIS
- - - 8.8 26.12 81.27 95.24 86.52 - - - 2.0 9.34 152.09 72.73 55.22
South- East
Europe
- - - 2.7 9.1 9.42 7.20 4.24 - - - 0.1 .03 103.95 .28 .05
CIS - - - 6.1 17.02 71.84 88.04 82.28 - - - 1.9 9.0 48.14 72.45 55.17
WORLD 115.37 203.81 189.87 740.7 741.32 1547.28 1651.51 1350.93 121.63 204.25 217.37 714.8 712.04 1641.79 1678.04 1390.96
*Source: Compiled from Various Reports of OECD, UNCTAD, World Bank, Fact Sheets of FDI, Economic Survey, Monthly Bulletins of Reserve Bank of India, Press
Notes issued by the DIPP, Ministry of Commerce and Industry, Government of India.

96
It is clear from the table 3.18 that Developed Economies have got maximum
share in FDI inflows and outflows at inter-national level which is followed by Europe
and European Economy in the pre-liberalization period and post-liberalization period.
On an average FDI inflow and FDI outflow have been increased in 1990 as compare
to average amount of FDI inflows of 1984-89 except FDI inflow of Africa and FDI
outflow of West Asia. During 1991-2000 table shows an increasing trend in FDI
inflow and outflow (except China) but trend of FDI inflow and outflow is decreased
during 2006-2012 in economies of Developed nations, Europe and European Union.
Whereas trend of FDI inflow and outflow in majority of the other economies has
increased during 2001 to 2011 but decreased in 2012. The same trend has being
shown by the economy of the world in this regard during the period of study under
reference. Table further shows that Developing Economies has increasing trend of
both FDI inflow and outflow during the pre-liberalization and post- liberalization
period with the exception of inflow of 2012.
Conclusion
Chapter 3 concludes that there are certain areas where on the one hand, FDI is
prohibited and on the other hand, in the certain other areas, FDI is permitted upto the
extent of 100%. From time to time, these limits have been revised. At the time of
Independence, there was a total foreign investment worth Rs.28.8 million, which
within next one decade, grew around 98% and FDI consisted 92.46% of the total of it.
Economic reforms of 1991 viewed that total FDI worth Rs. 453.1 million. And during
the post-liberalisation period, FDI was just US$ 97 million in 1990-91 which
increased US$ 26953 million in 2013 with a rise of approximately 278 times. It also
states about the positions of various developed and developing economies where it
concludes, that developed economies have 40.09% inflow as compared to the
minimum share of 0.19% inflow towards least developed economies. It also describes
that during pre-liberalisation period, USA occupied the top position among the world
which has the highest inflow of capital in India whereas Mauritius grabbed this status
of USA during the post-liberalisation period. On the same terms, maximum FDI
outflow was also made by USA till date. Among the different sectors, manufacturing
sector has the maximum and highest share in FDI inflows during Pre-liberlization and
Post-liberalization periods whereas petroleum sector and hotel & tourism sector have
the lowest share during the respective periods.
Related Documents


![Design Patterns Parte 1 · Design Patterns Introduzione (5/64) Definizione di “Design Pattern” (3/3) un pattern ha 4 elementi essenziali: [GoF] Nome del Pattern = Il nome del](https://static.cupdf.com/doc/110x72/5fbc84b7d379b740bb65faea/design-patterns-parte-1-design-patterns-introduzione-564-definizione-di-aoedesign.jpg)


