55 CHAPTER 3: RESEARCH OBJECTIVES AND RESEARCH METHODOLGY 3.1 Introduction This chapter will present a detailed idea about the methodology followed in conducting this research. It will start with the objectives to be achieved in this study followed by the framework to conceptualize and operationalise those research objectives. It also highlights the sampling technique, data collection methods, questionnaire development and brief idea about data analysis tools. At the end of the chapter validity and reliability issues will be discussed to follow the quality standards of the research. 3.2 Objectives of the Study Following are the broad objectives of the study: 1) To study the trends of online marketing as adopted by Indian railways. 2) To measure the perception, beliefs and attitude of consumers in India towards online marketing, the opportunities offered by it and the challenges posed by it. 3) To measure the perception, beliefs and attitude of Indian railway department in India towards online marketing offered by Indian railways, the opportunities offered by it and the challenges posed by it. 4) To measure the perception, beliefs and attitude of travel agents in India towards online marketing offered by Indian railways, the opportunities offered by it and the challenges posed by it. 5) To suggest an appropriate model for an effective online marketing in Indian railways. 3.3 Conceptualization and Operationalisation of Objectives 3.3.1 To study the trends of online marketing as adopted by Indian railways. Under this objective pace and pattern of technological developments undertaken by Indian Railways will be studied. It will cover following concepts namely; Trends of

Welcome message from author
This document is posted to help you gain knowledge. Please leave a comment to let me know what you think about it! Share it to your friends and learn new things together.
Transcript

55
CHAPTER 3: RESEARCH OBJECTIVES ANDRESEARCH METHODOLGY
3.1 Introduction
This chapter will present a detailed idea about the methodology followed in
conducting this research. It will start with the objectives to be achieved in this study
followed by the framework to conceptualize and operationalise those research
objectives. It also highlights the sampling technique, data collection methods,
questionnaire development and brief idea about data analysis tools. At the end of the
chapter validity and reliability issues will be discussed to follow the quality standards
of the research.
3.2 Objectives of the StudyFollowing are the broad objectives of the study:
1) To study the trends of online marketing as adopted by Indian railways.
2) To measure the perception, beliefs and attitude of consumers in India towardsonline marketing, the opportunities offered by it and the challenges posed byit.
3) To measure the perception, beliefs and attitude of Indian railway departmentin India towards online marketing offered by Indian railways, theopportunities offered by it and the challenges posed by it.
4) To measure the perception, beliefs and attitude of travel agents in Indiatowards online marketing offered by Indian railways, the opportunities offeredby it and the challenges posed by it.
5) To suggest an appropriate model for an effective online marketing in Indianrailways.
3.3 Conceptualization and Operationalisation of Objectives
3.3.1 To study the trends of online marketing as adopted by Indian
railways.
Under this objective pace and pattern of technological developments undertaken by
Indian Railways will be studied. It will cover following concepts namely; Trends of

56
online ticket reservation (I-Ticket, E-Ticket and Agents online booking), different
earnings through online marketing (promotional mails, banners on site, confirmation
mail, text link, PNR alert) of Indian Railways, online tourism services (Rail tour
packages, holiday packages, Tourist Trains, Online hotel booking, Online cab facility
as well as air Segements) and web server analysis for online marketing purposes.
3.3.2 To measure the perception, beliefs and attitude of consumers in
India towards online marketing offered by Indian railways
Conceptualization
Technology Acceptance Model (developed by Davis in 1986) along with some
external constructs will be used to measure the consumers’ perception, beliefs and
attitude towards Online Marketing of Indian Railways which is being shown in figure
3.1. In this section different constructs of TAM with their respective hypothesis and
indicators have been explained.
3.3.2.1 Perceived Usefulness (PU)
TAM model reported perceived usefulness as direct antecedent of attitude and
behavioral intention. Chen et. al., (2002), and Heijden et. al., (2001) and childers et.
al., (2001) also found that perceived usefulness affects the attitude toward online
shopping behavior of the consumer. In this study, it is a positive outcome of
consumers when they use Online Marketing of Indian Railways, in this context
following hypothesis is being proposed:
H1: Perceived Usefulness have positive impact on attitude towards Online
Marketing of Indian Railways.
H2: Perceived Usefulness have positive impact on behavioral intention towards
adoption of Online Marketing of Indian Railways.
Indicators of Perceived usefulness
1. Useful to purchase a ticket (PU1)
2. Saves time in purchasing a ticket (PU2)

57
3. Makes easier to buy a ticket (PU3)
4. Provides information in time (PU4)
3.3.2.2 Perceived Ease of use (PEOU)
This construct is also being adapted from TAM. This is an important antecedent of
perceived usefulness and attitude. In this study, it refers to the degree to which
consumers believe that using online marketing of Indian railways would be easy and
simple, in this context following hypothesis are formulated:
H3: Perceived Ease of Use has a positive impact on perceived usefulness of online
marketing of Indian Railways.
H4: Perceived Ease of Use has a positive impact on attitude towards online
marketing of Indian Railways.
Indicators of Perceived Ease of Use
1. Easy to learn (PEOU1)
2. Easy to understand (PEOU2)
3. Simple (PEOU3)
4. Easy to use (PEOU4)
5. Interaction is clear (PEOU5)
3.3.2.3 Trust (TR)
Gefen et. al. (2003) introduced trust as third major belief in addition to perceived
usefulness and perceived ease of use in predicting technology adoption. Egger 1999;
Egger and Groot 2000, found that trust depends upon the firm’s reputation and its
privacy policy. In this study trust refers to the consumers’ confidence in online
marketing of Indian Railways.

58
H5: Trust has a positive impact on attitude towards online marketing of Indian
Railways.
Indicators of Trust
1. Trustworthy (TR1)
2. Reliable (TR2)
3.3.2.4 Perceived Enjoyment (PE)
Goldsmith (2002) reported that perceived enjoyment is an important construct in
determining online shopping behavior. In this study it could be defined as consumers
perception that using online marketing of Indian Railways is interesting and a joyful
activity.
H6: Perceived Enjoyment has a positive impact on attitude towards online
marketing of Indian Railways.
Indicators of Perceived Enjoyment
1. Buying a ticket through internet is enjoyable (PE1)
2. Interesting (PE2)
3. Joyful activity (PE3)
3.3.2.5 Image (IM)
Image is one of the important determinants in technology adoption and attitude.
Image could be defined as consumers’ belief that use of online marketing of Indian
railways is a status symbol and fits according to their lifestyle. To check this relation
the proposed hypothesis is as follows:
H7: Image has a positive impact on attitude towards online marketing of Indian
Railways.
Indicators of Image
1. Status symbol (IM1)
2. Improves image (IM2)
3. Fits into my lifestyle (IM3)

59
3.3.2.6 Subjective Norm (SN)
One of the major weaknesses of TAM model is non-consideration of subjective norm.
In fact, this construct is one of the main constructs in many models like Theory of
reasoned action and Theory of planned behavior. In order to overcome this weakness
subjective norm has also been considered in the present study research model.
Subjective norm refers to the degree of perceived social influence on consumers’
decision to use online marketing of Indian Railways. Ajzen 1991, found that
subjective norm have positive effect on intention to perform behavior. In this context
proposed hypothesis is given below:
H8: Subjective Norm has a positive impact on attitude towards online marketing
of Indian Railways.
Indicators of Subjective Norm
1. People who influence my behavior think I should purchase a ticket through
internet (SN1)
2. People who are important to me think I should get information about trains
through internet (SN2)
3.3.2.7 Facilitating Condition (FC)
Facilitating condition has been tested in number of technology acceptance studies
(Venkatesh, 2000). In the present study facilitating condition represents the degree of
consumers’ belief about the availability of required resources and knowledge to use
online marketing of Indian Railways. To examine the relation of this construct with
attitude the proposed hypothesis is:
H9: Facilitating Condition has a positive impact on attitude towards online
marketing of Indian Railways.
Indicators of Facilitating Condition
1. I have personal computer (FC1)
2. I have stable internet connection(FC2)
3. I have knowledge to use it (FC3)

60
3.3.2.8 Perceived Risk (PR)
Now a day’s perceived risk is an important determinant in shaping the attitude and
intention to use the online services. In case of online transactions individual may
perceive various kinds of risks like financial risk, risk of privacy, illegal activities on
internet etc. Perceived risk could be defined as uncertainties of possible negative
consequences of using a product or service (Dehbashi, 2007). In present study
perceived risk could be defined as the consumers’ perceived lack of privacy, financial
risk and risk of internet hackers. Therefore in the present research following
hypothesis could be considered
H10: Perceived Risk has a negative impact on attitude towards online marketing
of Indian Railways.
Indicators of Perceived Risk
1. Personal information is not safe (PR1)
2. Risk in monetary transactions (PR2)
3. Risk of internet hackers (PR3)
4. Money deducted without ticket booking (PR4)
5. Wastage of money (PR5)
3.3.2.9 Attitude (ATT)
In TAM model attitude is being defined as the intermediary affective rejoinder
between perceived usefulness and ease of use beliefs and behavioral intentions to
adopt internet based technologies. In this research attitude represents consumers’
positive and negative feelings towards online marketing of Indian Railways that
affects the intention to use it. So it can be concluded:
H11: Attitude has a positive direct impact on behavioral intention toward online
marketing of Indian Railways.
Indicators of Attitude
1. It is good idea to buy a ticket through internet (ATT1)
2. I like the idea to get information through internet (ATT2)
3. It is pleasant to use (ATT3)

61
4. Using online services is wise idea (ATT4)
3.3.2.10 Behavioral Intention (BI)
Most of the researches have not concentrated on the relationship between behavioral
intention and actual use. But behavioral intention toward actual use or adoption of
online technology is an indication of decision maker’s readiness to adoption. It can be
concluded that behavioral intention is significant predictor of actual use (Taylor and
Todd, 1995; Pavlou, 2003). In the present study, behavioral intention refers to
consumers’ perceived intention to adopt online marketing of Indian Railways. In this
reference following hypothesis is formulated.
H12: Behavioral Intention has a positive direct impact on actual use of Online
Marketing of Indian Railways.
Indicators of Behavioral Intention
1. It is better to buy a ticket through internet than going to reservation centre
(BI1)
2. I will strongly recommend others to use it (BI2)
3. I will purchase a ticket through internet in near future(BI3)
3.3.2.11 Actual Use (AU)
Considering that online marketing in India is still relatively new, it is reasonable for
the present study to focus on its adoption. Thereby, the link between behavioral
intention and actual use is also being tested in this study.
Indicators of Actual Use
1. I will use it on regular basis (AU1)
2. I will use it frequently (AU2)
Operationalisation
All the indicators of the constructs of TAM will be measured on a five point likert
scale ranging from Strongly Disagree = 1, Disagree = 2, Neutral = 3, Agree = 4 to
Strongly Agree = 5. This scale is widely used to measure attitude.

62
Figure 3.1: Research Framework for consumers
3.3.3 To identify the main opportunities for consumers offered by
Online Marketing of Indian Railways
Conceptualization
On the basis of review of literature and deep discussion with consumers, present study
has considered following seven variables to identify the major opportunities offered
by online marketing of Indian Railways to its consumers.
1. Convenient
2. Time saving
3. No long queues
PerceivedUsefulnes
s
Perceivedease of use
Attitude Behavioralintention
ActualUse
H 3
H 4
H 2H 1
H 11 H 12
Trust
PerceivedEnjoyment
Subjectivenorm
Facilitatingcondition
Image
PerceivedRisk
H 10
H 9H 8
H 7
H 6
H 5

63
4. Buying tickets 24/7 (at any time & from anywhere)
5. Price saving
6. Easy access to information
7. New technology experience
OperationalisationThe respondents will be asked to rank all the opportunities in order of their
importance (Rank 1 for most important, 2 for 2nd important and so on up to 7) why
they opted for online marketing of Indian Railways. All the missing values (No
response) will be replaced with median value 4.
3.3.4 To identify the major challenges posed by Online Marketing of
Indian Railways
Conceptualization
On the basis of review of literature and deep discussion with consumers, present study
has considered following nine variables to identify the major challenges posed by
online marketing of Indian Railways to its consumers.
1. Very busy network
2. Risky to use credit card
3. Difficulty in cancellation or refund
4. Lack of online payment facility
5. Lack of privacy of personal information
6. Risk of wrong ticket
7. Expensive
8. Complex system
9. Don’t know how to use
Operationalisation
The respondents will be asked to rank all the challenges faced by them in order of
their importance (Rank 1 for most important, 2 for 2nd important and so on up to 9).
All the missing values (No response) will be replaced with median value 5.
64
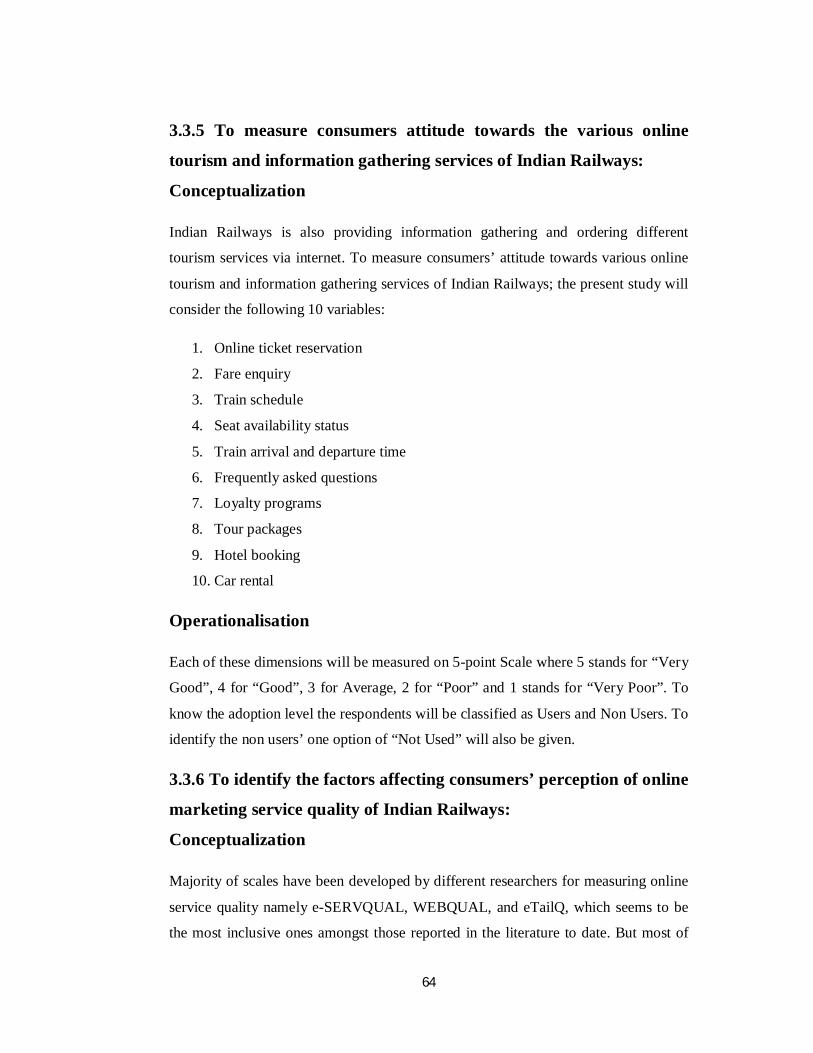
3.3.5 To measure consumers attitude towards the various online
tourism and information gathering services of Indian Railways:
Conceptualization
Indian Railways is also providing information gathering and ordering different
tourism services via internet. To measure consumers’ attitude towards various online
tourism and information gathering services of Indian Railways; the present study will
consider the following 10 variables:
1. Online ticket reservation
2. Fare enquiry
3. Train schedule
4. Seat availability status
5. Train arrival and departure time
6. Frequently asked questions
7. Loyalty programs
8. Tour packages
9. Hotel booking
10. Car rental
Operationalisation
Each of these dimensions will be measured on 5-point Scale where 5 stands for “Very
Good”, 4 for “Good”, 3 for Average, 2 for “Poor” and 1 stands for “Very Poor”. To
know the adoption level the respondents will be classified as Users and Non Users. To
identify the non users’ one option of “Not Used” will also be given.
3.3.6 To identify the factors affecting consumers’ perception of online
marketing service quality of Indian Railways:
Conceptualization
Majority of scales have been developed by different researchers for measuring online
service quality namely e-SERVQUAL, WEBQUAL, and eTailQ, which seems to be
the most inclusive ones amongst those reported in the literature to date. But most of
65
the scales have been used in the e-retailing context. There is a need to evaluate
railway website which is a tourism website. In the present study ESERVQUAL
developed by Parasuraman et al., 2005 will be employed. The present will modify the
statements of the ESERVQUAL in order to tailor the model in the context of online
marketing of Indian Railways. Finally, 21 statements will be developed measured on
five point Likert scale (ranging from 1 = strongly disagree to 5 = strongly agree) to
identify the factors affecting consumers perception of online marketing service quality
of Indian Railways.
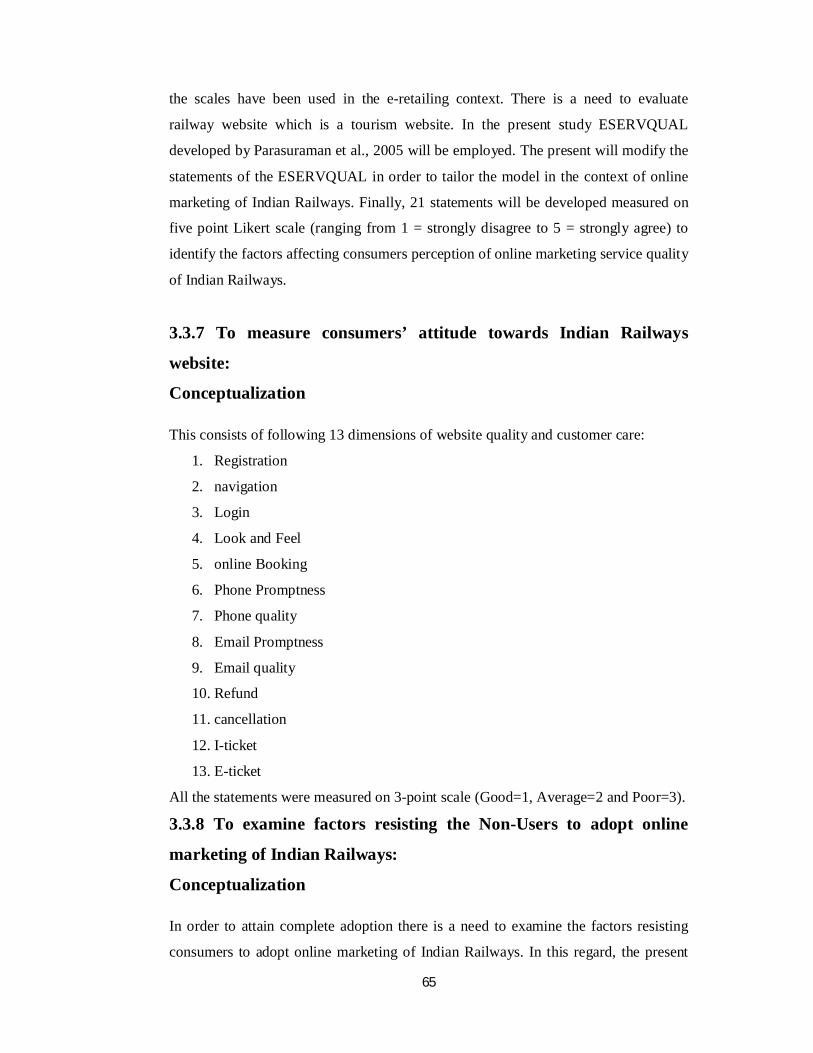
3.3.7 To measure consumers’ attitude towards Indian Railways
website:
Conceptualization
This consists of following 13 dimensions of website quality and customer care:
1. Registration
2. navigation
3. Login
4. Look and Feel
5. online Booking
6. Phone Promptness
7. Phone quality
8. Email Promptness
9. Email quality
10. Refund
11. cancellation
12. I-ticket
13. E-ticket
All the statements were measured on 3-point scale (Good=1, Average=2 and Poor=3).
3.3.8 To examine factors resisting the Non-Users to adopt online
marketing of Indian Railways:
Conceptualization
In order to attain complete adoption there is a need to examine the factors resisting
consumers to adopt online marketing of Indian Railways. In this regard, the present

66
study conceptualizes multiple variables preventing consumers to adopt this new
technology. The variables will be measured on a five point Likert scale (ranging from
1 = strongly disagree to 5 = strongly agree). The following 12 variables included in
the study are as follows:
1. Do not have adequate knowledge of using computer and internet
2. Lack of awareness about the benefits of online services of Indian Railways
3. Lack of sufficient information about how to make use of online services
(online reservation)
4. Fear of Security and Privacy of your monetary transactions
5. Fear of making error while feeding information
6. Online reservation system would be too complicated to operate
7. Lack of interest in using internet for ticket reservation
8. No access to internet at home or office
9. Not reliable to reserve a ticket through internet
10. May not receive correct information over the internet
11. Using online services is time consuming
12. It is expensive to use online services of Indian railways
3.3.9 To measure the perception, beliefs and attitude of employees of
Indian railway department in India towards online marketing
offered by Indian railways
Conceptualization
Technology Acceptance Model which is used to measure the employees’ perception,
belief and attitude towards Online Marketing of Indian Railways is shown in figure.
In this section different constructs of TAM with their respective hypothesis and
indicators have been explained.
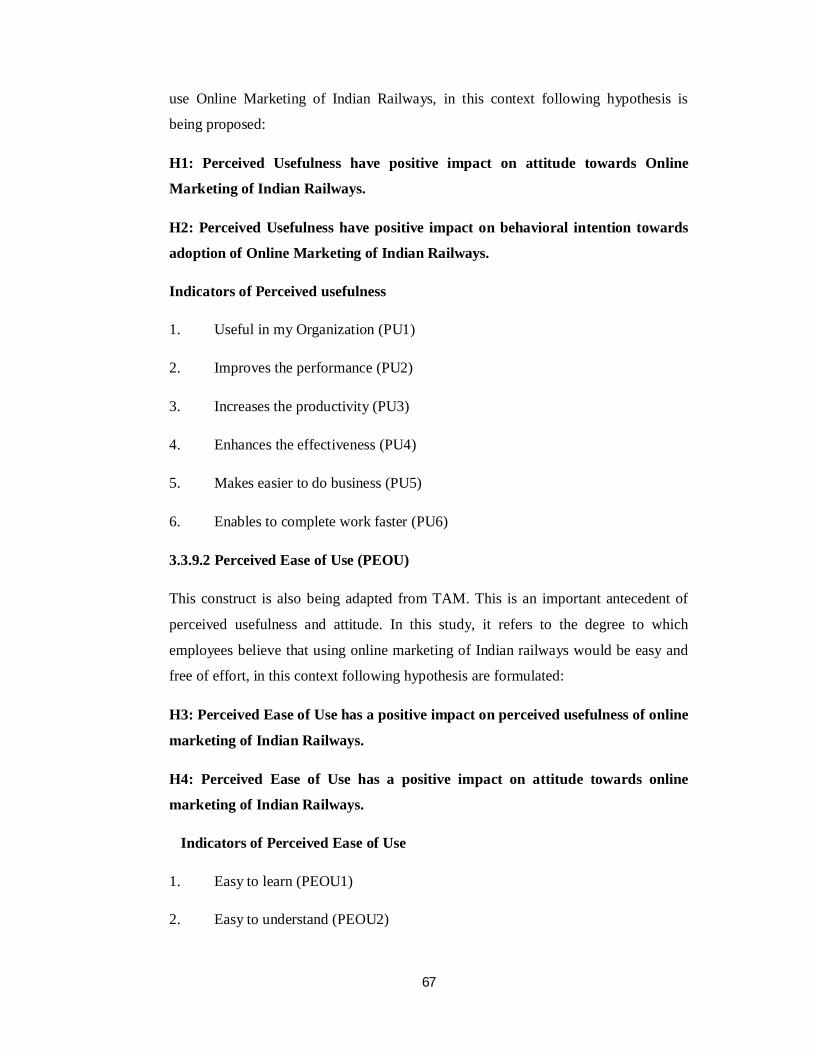
3.3.9.1 Perceived Usefulness (PU)
TAM model reported perceived usefulness as direct antecedent of attitude and
behavioral intention. In this study, it is a positive outcome of employees when they
67
use Online Marketing of Indian Railways, in this context following hypothesis is
being proposed:
H1: Perceived Usefulness have positive impact on attitude towards Online
Marketing of Indian Railways.
H2: Perceived Usefulness have positive impact on behavioral intention towards
adoption of Online Marketing of Indian Railways.
Indicators of Perceived usefulness
1. Useful in my Organization (PU1)
2. Improves the performance (PU2)
3. Increases the productivity (PU3)
4. Enhances the effectiveness (PU4)
5. Makes easier to do business (PU5)
6. Enables to complete work faster (PU6)
3.3.9.2 Perceived Ease of Use (PEOU)
This construct is also being adapted from TAM. This is an important antecedent of
perceived usefulness and attitude. In this study, it refers to the degree to which
employees believe that using online marketing of Indian railways would be easy and
free of effort, in this context following hypothesis are formulated:
H3: Perceived Ease of Use has a positive impact on perceived usefulness of online
marketing of Indian Railways.
H4: Perceived Ease of Use has a positive impact on attitude towards online
marketing of Indian Railways.
Indicators of Perceived Ease of Use
1. Easy to learn (PEOU1)
2. Easy to understand (PEOU2)

68
3. Easy to use (PEOU3)
4. Simple (PEOU4)
5. Easy to become skillful (PEOU5)
6. Free of effort (PEOU6)
3.3.9.3 Attitude (ATT)
In TAM model attitude is being defined as the intermediary affective rejoinder
between perceived usefulness and ease of use beliefs and behavioral intentions to
adopt internet based technologies. In this research attitude represents employees’
positive and negative feelings towards online marketing of Indian Railways that
affects the intention to use it. So it can be concluded:
H5: Attitude has a positive direct impact on behavioral intention toward online
marketing of Indian Railways.
Indicators of Attitude
1. Using it is a good idea (ATT1)
2. Beneficial in my organization (ATT2)
3. I like the idea of using it (ATT3)
4. Using it in job is pleasant (ATT4)
5. Using it is a wise idea (ATT5)
3.3.9.4 Behavioral Intention (BI)
Most of the researches have not concentrated on the relationship between behavioral
intention and actual use. But behavioral intention toward actual use or adoption of
online technology is an indication of decision maker’s readiness to adoption. It can be
concluded that behavioral intention is significant predictor of actual use (Taylor and
Todd, 1995; Pavlou, 2003). In the present study, behavioral intention refers to
employees’ perceived intention to adopt online marketing of Indian Railways. In this
reference following hypothesis is formulated.
H6: Behavioral Intention has a positive direct impact on actual use of Online
Marketing of Indian Railways.

69
Indicators of Behavioral Intention
4. It is good to use it in addition to traditional methods (BI1)
5. I will strongly recommend others to use it (BI2)
6. I intend to use it in near future(BI3)
3.3.9.5 Actual use (AU)
Considering that online marketing in India is still relatively new, it is reasonable for
the present study to focus on its adoption. Thereby, the link between behavioral
intention and actual use is also being tested in this study.
Indicators of Actual Use
3. I will use it on regular basis (AU1)
4. I will use it frequently (AU2)
The proposed conceptual model of adoption of online marketing of Indian Railways
among employees of Indian Railway Department has been shown in figure:
Figure 3.2: Research Framework for employees
PerceivedUsefulnes
s
Perceivedease of use
Attitude Behavioralintention
ActualUse
H 3
H 4
H 2H 1
H 5 H 6

70
Operationalisation
All the indicators of the constructs of TAM will be measured on a five point likert
scale ranging from Strongly Disagree = 1, Disagree = 2, Neutral = 3, Agree = 4 to
Strongly Agree = 5. This scale is widely used to measure attitude. .
3.3.10 To Identify the Opportunities for Employees as Offered by
Online Marketing of Indian Railways
Conceptualization
On the basis of extensive review of literature and discussion with railway employees,
the present study has considered following eight variables to identify the major
opportunities offered by Indian Railways.
1. Possibility of improvement in organizations image
2. It helps to expand customer base
3. Impetus for new product development
4. Possibility of extra revenue through banner ads, text links, etc.
5. Helps in handling large volume of sales
6. Possibility of improved customer services
7. Possibility of shortening of supply chain
8. Possibility of reduced costs
Operationalisation
The respondents will be asked to rate all the opportunities on a five point Likert-type
scale ranging from strongly disagree (1), Disagree (2), Neutral (3), Agree (4) to
Strongly agree (5) on the basis of their agreement or disagreement. All the missing
values will be replaced with neutral value 3.
3.3.11 To Identify the Challenges for Employees as posed by Online
Marketing of Indian Railways
Conceptualization
The adoption of online marketing by Indian Railways has also posed several
71
challenges. In order to identify the main opportunities offered by Online Marketing
respondents will be presented with a list of following eight variables.
1. Problem in conducting online transactions due to heavy load on server.
2. Premature termination of site before completing the transactions
3. Unauthorized access to confidential information
4. Resistance from channel members
5. Lack of training
6. Lack of infrastructure
7. Difficulty with integrating online system with existing system
8. Lack of availability of technology
Operationalisation
The respondents will be asked to rate all the challenges on a five point scale (ranging
from 1= not at all to 5= Greater Extent). All the missing values will be replaced with
mid value 3.
3.3.12 To measure employees’ attitude towards readiness to embrace
online technology of Indian Railways
Conceptualization
Deep insights of review of literature reflect that people have both negative and
positive attitude towards technology. The findings of Parasuraman, 2001, showed that
people beliefs can be categorized into four segments on the basis of their attitude
towards technology. Two of these segments- optimism and innovativeness are
contributors while the other two – discomfort and insecurity are inhibitors. Relative
strength of these positive and negative beliefs determines peoples’ receptivity of
technology. The four segments are relatively independent. In other words, one can
simultaneously harbor positive and negative feelings about technology.
Optimism: A positive view of technology and a belief that it offers people increased
control, flexibility, and efficiency in their lives.
Innovativeness: A tendency to be a technology pioneer and thought leader.
Discomfort: A perceived lack of control over technology and a feeling of being
overwhelmed by it.
72
Insecurity: Distrust of technology and skepticism about its ability to work properly.
The present study will employ following 10-items of Technology Readiness scale
(Parasuraman, 2000), consisting of 2 items for optimism, 3 items for innovativeness,
2 items for discomfort, and 3 items for insecurity. All the items will be measured on a
5-point Likert-type scale ranging from strongly disagree (1), Disagree (2), Neutral (3),
Agree (4) to strongly agree(5).
Statements for optimism
1. Use of internet in providing services is very exciting
2. Use of internet based technologies makes you more efficient
Statements for Innovativeness
1. Other people come to you for guidance on online technologies
2. I don’t need help of other people in using online technologies
3. You are among the first in your friend circle to learn internet based technology
Statements for Discomfort
1. It is very complicated to use internet based technologies
2. It is awkward when you have difficulty in handling online device while people
are watching you
Statements for insecurity
1. Online technologies are not reliable
2. Internet is not safe for monetary transactions
3. Lack of privacy of information sent through internet
On the basis of the responses of the employees; technology readiness index will be
computed. Based on their TRI score, they will be identified as Explorer, Pioneer,
Skeptic, Paranoid, or Laggard. The scores will be computed on the basis of the
guidelines given under technology Readiness scale.
Optimism score: It will be computed by taking the mean of 2 items measuring

73
optimism of employees’.
Innovativeness score: It will be a mean of three items.
Discomfort score: Likewise it will be obtained by taking the average of two items.
Insecurity score: It will be calculated by taking the mean of three items.
TRI score: It will be computed by taking the average of all the above four dimensions
as follows:
TRI= [Optimism + Innovativeness + (6-Insecurity) + (6-Discomfort)/4
The employees will be further classified into four TR segments i.e. Explorers,
Pioneers, Skeptics, Paranoids and Laggards on the basis of their TRI scores.
Table 3.1: Characteristics of TR Typologies
TR
Typologies
Typologies Characteristics
Explorers Extremely high in technology readiness, ranking higher on driver and
lower on inhibitors of adoption. They are easy group to attract when a
new technology is introduced; they will comprise the first wave of
customers
Pioneers Desire the benefits of the new frontier but more practical about the
difficulties and dangers. Pioneers share the optimism and innovative
tendencies of the explorers.
Skeptics They do not believe strongly in technology and lack any desire for pure
innovation.
Paranoids Convinced of the fruits but unusually concerned about the risks. A
Paranoid is like a child encountering a burning candle for the first time.
The fame is fascinating, but also frightening and painful to touch.
Laggards Never move unless are forced to do so. They opposite of explores are
ranking lower in motivation and higher in inhibition than the market as
a whole.
Source: Parasuraman and Colby (2001)
74
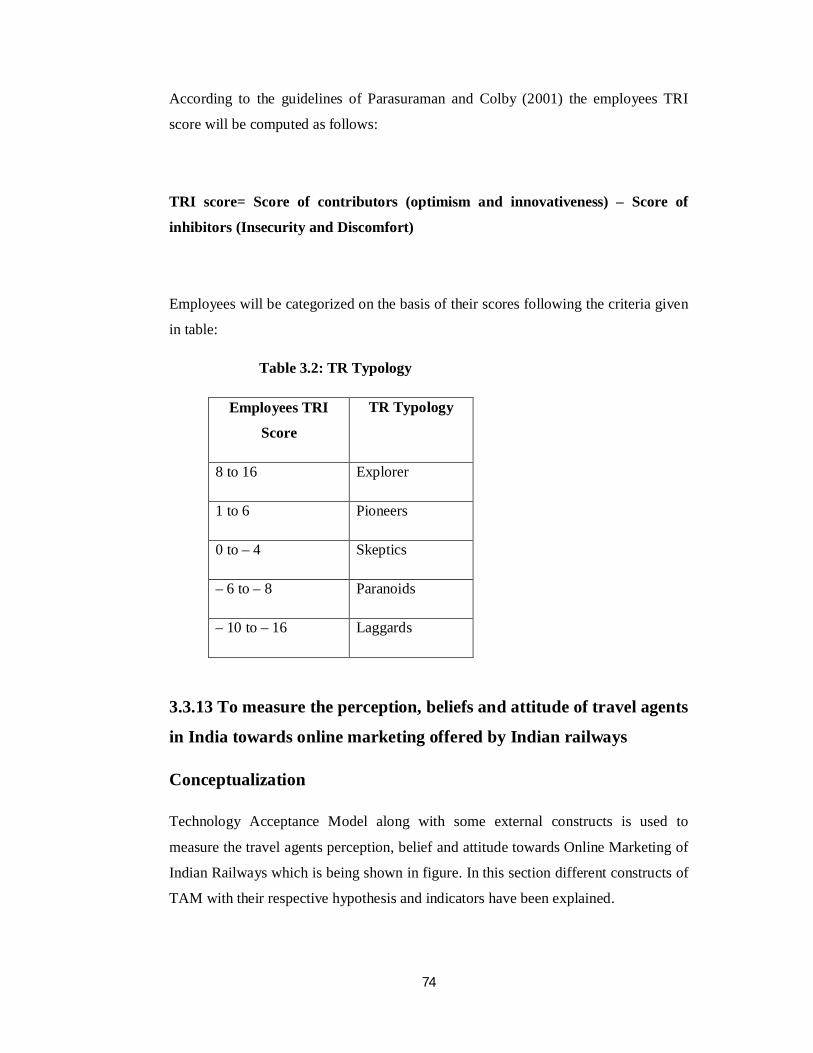
According to the guidelines of Parasuraman and Colby (2001) the employees TRI
score will be computed as follows:
TRI score= Score of contributors (optimism and innovativeness) – Score of
inhibitors (Insecurity and Discomfort)
Employees will be categorized on the basis of their scores following the criteria given
in table:
Table 3.2: TR Typology
Employees TRI
Score
TR Typology
8 to 16 Explorer
1 to 6 Pioneers
0 to – 4 Skeptics
– 6 to – 8 Paranoids
– 10 to – 16 Laggards
3.3.13 To measure the perception, beliefs and attitude of travel agents
in India towards online marketing offered by Indian railways
Conceptualization
Technology Acceptance Model along with some external constructs is used to
measure the travel agents perception, belief and attitude towards Online Marketing of
Indian Railways which is being shown in figure. In this section different constructs of
TAM with their respective hypothesis and indicators have been explained.

75
3.3.13.1 Perceived Usefulness (PU)
TAM model reported perceived usefulness as direct antecedent of attitude and
behavioral intention. In this study, it is a positive outcome of travel agents when they
use Online Marketing of Indian Railways in their agency, in this context following
hypothesis is being proposed:
H1: Perceived Usefulness have positive impact on attitude towards Online
Marketing of Indian Railways.
H2: Perceived Usefulness have positive impact on behavioral intention towards
adoption of Online Marketing of Indian Railways.
Indicators of Perceived usefulness
1. Improves the performance (PU1)
2. Increases the productivity (PU2)
3. Makes easier to do business (PU3)
4. Enables to complete work faster (PU4)
3.3.13.2 Perceived Ease of use (PEOU)
This construct is also being adapted from TAM. This is an important antecedent of
perceived usefulness and attitude. In this study, it refers to the degree to which travel
agents believe that using online marketing of Indian railways in their agency would be
easy, simple and free of effort in this context following hypothesis are formulated:
H3: Perceived Ease of Use has a positive impact on perceived usefulness of online
marketing of Indian Railways.
H4: Perceived Ease of Use has a positive impact on attitude towards online
marketing of Indian Railways.
Indicators of Perceived Ease of Use
1. Easy to learn (PEOU1)
2. Easy to understand (PEOU2)

76
3. Easy to use (PEOU 3)
4. Simple (PEOU4)
5. Easy to become skillful (PEOU5)
6. Interaction is clear (PEOU6)
3.3.13.3 Trust (TR)
Gefen et. al. (2003) introduced trust as third major belief in addition to perceived
usefulness and perceived ease of use in predicting technology adoption. In this study
trust refers to the travel agents confidence in online marketing of Indian Railways.
H5: Trust has a positive impact on attitude towards online marketing of Indian
Railways.
Indicators of Trust
1. Provides reliable information (TR 1)
2. Trustworthy (TR 2)
3.3.13.4 Perceived Enjoyment (PE)
Goldsmith (2002) reported that perceived enjoyment is an important construct in
determining online shopping behavior. In this study it could be defined as travel
agents perception that using online marketing of Indian Railways is interesting and a
joyful activity for their business.
H6: Perceived Enjoyment has a positive impact on attitude towards online
marketing of Indian Railways.
Indicators of Perceived Enjoyment
1. Joyful activity (PE1)
2. Interesting (PE2)
3. I enjoy to use it (PE3)

77
3.3.13.5 Image (IM)
Image is one of the important determinants in technology adoption and attitude.
Image could be defined as travel agents belief that use of online marketing of Indian
railways in their agency is prestigious, status symbol and improves the image. To
check this relation the proposed hypothesis is as follows:
H7: Image has a positive impact on attitude towards online marketing of Indian
Railways.
Indicators of Image
1. Improves image (IM1)
2. Status symbol (IM2)
3. Prestigious (IM3)
3.3.13.6 Subjective norm (SN)
One of the major weaknesses of TAM model is non-consideration of subjective norm.
In fact, this construct is one of the main constructs in many models like Theory of
reasoned action and Theory of planned behavior. In order to overcome this weakness
subjective norm has also been considered in the present study research model.
Subjective norm refers to the degree of perceived social influence on travel agents
decision to use online marketing of Indian Railways. In this context proposed
hypothesis is given below:
H8: Subjective Norm has a positive impact on attitude towards online marketing
of Indian Railways.
Indicators of Subjective Norm
1. People who influence my behavior think I should use it (SN1)
2. People who are important to me think I should use it (SN2)
3.3.13.7 Facilitating Condition (FC)
Facilitating condition has been tested in number of technology acceptance studies
(Venkatesh, 2000). In the present study facilitating condition represents the degree of
travel agents belief about the availability of required resources like funds, technology,
78
training and help to use online marketing of Indian Railways. To examine the relation
of this construct with attitude the proposed hypothesis is:
H9: Facilitating Condition has a positive impact on attitude towards online
marketing of Indian Railways.
Indicators of Facilitating Condition
1. Specific group for help in difficulties (FC1)
2. Special training given (FC2)
3. Appropriate technology (FC3)
4. Sufficient funds (FC4)
3.3.13.8 Perceived Risk (PR)
Now a day’s perceived risk is an important determinant in shaping the attitude and
intention to use the online services. In case of online transactions individual may
perceive various kinds of risks like financial risk, risk of privacy, security etc. In
present study perceived risk could be defined as the travel agents perceived lack of
privacy, financial risk and security of online transactions. Therefore in the present
research following hypothesis could be considered
H10: Perceived Risk has a negative impact on attitude towards online marketing
of Indian Railways.
Indicators of Perceived Risk
1. Online transactions are not secure (PR1)
2. Not safe for monetary transactions (PR2)
3. Lack of privacy (PR3)
3.3.13.9 Attitude (ATT)
In TAM model attitude is being defined as the intermediary affective rejoinder
between perceived usefulness and ease of use beliefs and behavioral intentions to
adopt internet based technologies. In this research attitude represents travel agents
positive and negative feelings towards online marketing of Indian Railways that
affects the intention to use it. So it can be concluded:

79
H11: Attitude has a positive direct impact on behavioral intention toward online
marketing of Indian Railways.
Indicators of Attitude
1. Using it is a good idea (ATT1)
2. Beneficial in my organization (ATT2)
3. I like the idea of using it (ATT3)
4. Using it is a wise idea (ATT4)
3.3.13.10 Behavioral Intention (BI)
Most of the researches have not concentrated on the relationship between behavioral
intention and actual use. But behavioral intention toward actual use or adoption of
online technology is an indication of decision maker’s readiness to adoption. It can be
concluded that behavioral intention is significant predictor of actual use (Taylor and
Todd, 1995; Pavlou, 2003). In the present study, behavioral intention refers to travel
agents perceived intention to adopt online marketing of Indian Railways. In this
reference following hypothesis is formulated.
H12: Behavioral Intention has a positive direct impact on actual use of Online
Marketing of Indian Railways.
Indicators of Behavioral Intention
7. It is good to use it in addition to traditional methods (BI1)
8. I will strongly recommend others to use it (BI2)
9. I to use it in near future(BI3)
3.3.13.11 Actual use (AU)
Considering that online marketing in India is still relatively new, it is reasonable for
the present study to focus on its adoption. Thereby, the link between behavioral
intention and actual use is also being tested in this study.
Indicators of Actual Use
5. I will use it on regular basis (AU1)
6. I will use it frequently (AU2)

80
igure 3.3: Research Framework for Travel agents
Operationalisation
All the indicators of the constructs of TAM will be measured on a five point likert
scale ranging from Strongly Disagree = 1, Disagree = 2, Neutral = 3, Agree = 4 to
Strongly Agree = 5. This scale is widely used to measure attitude.
3.3.14 To identify the main opportunities for Travel Agents as offered
by online Marketing of Indian Railways
PerceivedUsefulnes
s
Perceivedease of use
Attitude Behavioralintention
ActualUse
H 3
H 4
H 2H 1
H 11 H 12
Trust
PerceivedEnjoyment
Subjectivenorm
Facilitatingcondition
Image
PerceivedRisk
H 10
H 9H 8
H 7
H 6
H 5

81
Conceptualization
On the basis of review of literature and deep discussion with travel agents, present
study has considered following ten variables to identify the major opportunities
offered by online marketing of Indian Railways to its consumers
1. Helps in handling large volume of sales
2. Possibility of reduced costs
3. Reaching for new markets
4. Possibility of improved customer services
5. Easy access to information
6. Possibility of improved profitability
7. Increase in customer base
8. Possibility of improvement in the organization’s image
9. Possibility of shortening of supply chain
10. Impetus for new product development
Operationalisation
The respondents will be asked to rank all the opportunities in order of their
importance (Rank 1 for most important, 2 for 2nd important and so on up to 10) why
they opted for online marketing of Indian Railways.
3.3.15 To identify the major challenges for Travel Agents as posed by
Online Marketing of Indian Railways
Conceptualization
In order to identify the main challenges posed by Online Marketing respondents will
be presented with a list of following eleven variables.
1. Lack of government support
2. Lack of infrastructure
3. Lack of technology
4. Security
5. Resistance from channel members
6. Lack of training

82
7. Lack of confidence in the benefits of online marketing
8. Difficulty with integrating online marketing and existing system
9. Lack of skilled employees
10. Threat of disintermediation
11. Lack of funds
Operationalisation
The respondents will be asked to rank all the challenges in order of their importance
(Rank 1 for most important, 2 for 2nd important and so on up to 11) of the problems
faced by them with online marketing of Indian Railways.
3.3.16 To measure attitude towards criticality of online marketing of
Indian RailwaysIn order to understand the criticality (importance) of online marketing of Indian
Railways for travel agents as a part of their marketing strategies, they were asked to
present their attitude regarding the issue on a 4- point scale ranging from 1=Very
Critical, 2=Somewhat critical, 3= Not at all Critical and 4= Don’t Know.
3.3.17 To Appraise the Business Performance of the Travel Agencies
after the Adoption of online Marketing of Indian RailwaysThe purpose of this issue is to understand the impact of online marketing on the
business performance of the travel agency after the adoption of online marketing of
Indian railways. To appraise the impact of business performance five performance
parameters will be taken namely Sales revenue, Cost of sale, Market share, Customer
satisfaction and organizational image. Then the respondents were asked to report their
agreement or disagreement, on a five point likert scale ranging from Strongly
Disagree to Strongly Agree.
3.3.18 To determine the effect on Number of Levels of Distribution
ChannelIn order to determine the effect of online marketing on the length of distribution
channel respondents will be asked to report the changes, in terms of Reduced, No
change or increased, after the introduction of online marketing of Indian Railways.

83
3.3.19 To identify the main reason of Growth of Online
MarketingIn order to identify the main reasons for the growth of the online marketing, the
respondents will be asked to select suitable reasons of growth out of given six
reasons.
3.4 Research Methodology
3.4.1 Research Design
The present research is descriptive and diagnostic in nature as it describes what is
happening, why is it happening and possible solution for it via understanding and
analyzing attitude of consumers, employees and travel agents towards the various
aspects of online marketing of Indian Railways.
3.4.2 Sample Design: The sample design of the present study comprises the
following elements:
Universe: Indian Railways
Sampling Element: Online Marketing
Sampling Unit: Based on data provided by Internet Ticketing Reservation
Centre of Indian Railways (An undertaking of IRCTC
Area of the study: India
3.4.3 Nature and Sources of Data: The present study has employed both the
types of data primary and secondary according to the requirement of the present
study. The primary data has been collected by conducting a survey through six set of
structured questionnaires, four for consumers of railway services, one for railway
employees and one for travel agents to know their views on various dimensions of
online marketing. To analyze the trends of online marketing secondary data has been
collected from the records maintained by Based on data provided by Internet
Ticketing Reservation Centre of Indian Railways of Indian Railways.
3.4.4 Questionnaire Design: In order to collect the primary data from the target
population following six set of structured questionnaires have been constructed:

84
3.4.4.1 Consumers Questionnaire: - In the light of need of research objectives
following four different questionnaires have been structured for consumers:
To Measure Attitude: - It is divided into four sections:
Section I: It collects the demographic information about respondents age, gender,
marital status, education, occupation and income. In addition, it looks for the
information related with the internet usage, access to internet and length of using
online services of Indian Railways.
Section II: It is devoted to measure the different constructs of Technology
Acceptance Model i.e. Perceived Usefulness, Perceived Ease of Use, Perceived
Enjoyment, Trust, Image, Subjective Norm, Perceived Risk, Attitude, Behavioral
Intention and Actual Use on a five point scale.
Section III: It contains ordinal (ranking) questions to identify the various
opportunities and challenges of online marketing for consumers.
Section IV: This section aims to elicit information regarding the adoption and
evaluation of various online services i.e. hotel booking, car rental, tour packages, seat
availability status, train arrival & departure time, online ticket reservation, fair
enquiry, train schedule, frequently asked questions and loyalty programs. The services
have been evaluated on a five point scale whereas to know the adoption level an
option of not used has also been given.
To Measure Online Marketing Service Quality: - First, it collects the
demographic information about respondents age, gender, education, occupation and
income. In addition, it looks for the information related with the length and of using
online services of Indian Railways. It is also used to determine respondent’s
perception on online marketing service quality using 21 items developed on the basis
of ESERVQUAL (Parasuraman et al., 2005).
To Measure Attitude towards Website: - For this purpose, feedback form
uploaded on IRCTC website is used. It contains 13 aspects of website and customer
care quality. The demographic information is collected from the respondents
respective registration form.
To Examine Factors Resisting the Non-Users to adopt Online Marketing: First,
it seeks information regarding the respondents’ demographic details such as gender,
age, education, occupation, access to internet, internet usage, income and awareness
about online marketing of Indian Railways. It also aims to elicit information regarding

85
non-users perception towards factors resisting them to use online marketing of Indian
railways. Lastly, it attempts to investigate potential future use if online marketing of
Indian Railways.
3.4.4.2 Employees Questionnaire: The questionnaire is divided into four sections.
The first section belongs to demographic while the second section is dedicated to
measure all the constructs of the TAM model. Third section is devoted to identify
opportunities and challenges. Finally, fourth section seeks the information regarding
their attitude towards readiness to embrace online technology of Indian Railways.
3.4.4.3 Travel Agents Questionnaire: Questionnaire starts with a set of questions
related with their annual turnover, establishment, and number of computers,
employees and length of using online services of Indian Railways. After that it is
devoted to measure the different construct items of Technology Acceptance model.
At last questions related with opportunities, challenges and impact of online
marketing on their business is asked.
3.4.5 Data Collection
3.4.5.1 Procedure to collect data from Consumers:
To Measure Attitude: Web survey method is used to collect the primary data from
the target population. To approach the target population a text link of the
questionnaire with the railway ticket booking confirmation mail; is taken from Intenet
Ticketing Reservation centre. It gives an opportunity to users who have booked their
tickets through internet to participate in the survey by clicking on the text link. It’s a
non random convenience sampling.
The target population of this survey is defined as:
Target population: Travelers who are booking online railway tickets.
Time: 3rd July to 17th August of 2010.
Sampling: Online sampling (Non random).
785 users filled the questionnaire out of which 18 were incomplete and excluded from
the analysis. This yields a response rate of 97.7%. It implies that final sample size for
this survey is equal to 767.
86
To Measure Online Marketing Service Quality: - The questionnaire is distributed
to the respondents who have participated in the previous web survey measuring
perception, belief and attitude of consumers. The questionnaire is sent by e-mail to the
target population during the month of July and August 2010. Totally 787
questionnaires were mailed to potential respondents, and 158 0f the 787 individuals
replied at a response rate of 20.08 percent. Among 158 questionnaires, 8 incomplete
questionnaires were removed from the further analysis. The remaining 150 responses
formed the basis of the present study.
To Measure Attitude towards Website: - Secondary data is collected from the
Based on data provided by Internet Ticketing Reservation Centre of Indian Railways
of Indian Railways. Target population for this purpose is users IRCTC website. Data
is collected during the month of March, 2010. During this period 2449 users filled the
feedback form of IRCTC website. So the final sample size for this objective is 2449.
To Examine Factors Resisting the Non-Users to adopt Online Marketing:
Sampling unit for this survey is non users of online marketing of Indian railways.
Convenient and judgment sampling technique is being followed for the administration
of the survey. The questionnaires are distributed personally or via email to the target
sample. Totally 156 individuals filled the questionnaires. Among 156 questionnaires,
12 incomplete questionnaires were removed from the further analysis. The remaining
144 responses formed the basis of this study.
3.4.5.1 Procedure to collect data from Employees: The population of interest is
defined as the employees’ of Based on data provided by Internet Ticketing
Reservation Centre of Indian Railways of Indian Railways Department. The present
study limited the sampling frame to Based on data provided by Internet Ticketing
Reservation Centre of Indian Railways as most of the online marketing activities of
Indian Railways is being operated from there only. In order to conduct a self
administered survey among the employees a written permission is sought from the
Deputy General Manager of Indian Railways department. Finally the permission was
granted on 16th September 2010.
The target population of this study is defined as:
Elements: Employees of Indian Railway Department
87
Sampling Units: Based on data provided by Internet Ticketing Reservation Centre of
Indian Railways (IRCTC)
Extent: Executive employees dealing with online marketing of Indian railways
Time: 19th September and 20th September of 2010.
Sampling: Convenience sampling
Convenience sampling technique is being employed in the present study. The total
number of employees in Based on data provided by Internet Ticketing Reservation
Centre of Indian Railways is about 150. So it was decided to distribute the
questionnaire to all the employees on the basis of convenience and to those who are
willing to fill the questionnaire. Total number of questionnaires distributed was equal
to 130, from which 110 respondents returned the questionnaire. Out of 110 filled
questionnaires 17 were incomplete and excluded from the analysis. This yields a
response rate of 78%. This means that final sample size for this study is equal to 93
3.4.5.1 Procedure to collect data from Travel Agents: Electronic mail survey
method is employed to collect the primary data from the travel agents. The target
population in this survey is the registered travel agents with IRCTC to use the online
services of Indian Railways. To approach the target population an emailer facility
from IRCTC is hired during the month of August. IRCTC has sent an email to 500
travel agents containing the text link of the website where the questionnaire is being
posted. It gives an opportunity to registered travel agents of online services of Indian
Railways to participate in the survey by clicking on the text link. It is a non random
online convenience sampling. 68 travel agents filled the questionnaire out of which 7
were incomplete and excluded from the analysis. This yields a response rate of 12.2%.
It implies that final sample size for this survey is equal to 61.
3.4.6 Statistical Analysis Techniques
3.4.6.1 Structural Equation Modeling
Structural Equation Modeling (SEM) technique will be used to analyze Technology
Acceptance Model (TAM). It is a second generation data analysis technique which
meets recognized standards for high quality statistical analysis (Gefen, 2000). SEM
has a capability for simultaneous analysis differs greatly from most first generation

88
regression models such as linear regression, ANOVA, and MANOVA, which can
analyze only one layer of linkages between independent and independent variable at a
time. SEM enables researchers to answer a set of interrelated research questions in a
single, systematic and comprehensive analysis by modeling the relationships among
multiple and dependent constructs simultaneously. (Karami, 2006).
Structural Equation Modeling technique will be performed by using AMOS 18 to
analyze the data. SEM is combination of two approaches to model fitting:
measurement approach of factor analysis and structural approach of multiple
regression analysis. The measurement model specifies how the latent variables or
hypothetical constructs are measured in terms of the observed variables, and it
describes the measurement properties (validities and reliabilities) of the observed
variables. The structural equation model specifies the causal relationships among the
latent variables and describes the causal effects and the amounts of unexplained
variance.
To check the reliability cronbach’s alpha ( ) will be calculated which the most
common measure of scale reliability is. In various articles and books it is being
reported that cronbach’s alpha value above 0.7 is an acceptable value; lower values
indicate unreliable scale.
Model Evaluation
In order to achieve the objective to measure perception, belief and attitude, the
measurement model through confirmatory factor analysis and statistical tests to
establish the validity and reliability of the survey will be performed. Second, the
structural model will be analyzed to test the hypothesized relationship among
different factors presented in the model.
Measurement Model
The measurement model of all the constructs will be assessed individually with the
help of confirmatory factor analysis.
Measurement Model fit: Measurement model fit may be assessed on the basis of
goodness of fit indices and badness of fit indices.
Good of fit indices indicate how well the specified model fits the observed or sample
data, and so higher values of these measures are desirable. Measures that are
commonly used are the goodness-of-fit index (GFI) and comparative-fit-index (CFI).
89
GFI is an absolute fit index and CFI is an incremental fit index. Higher values in the
0.90 range are considered acceptable for GFI and CFI.
On the other hand, badness-of-fit indices measure error or deviation in some form and
so lower values on these indices are desirable. The commonly used badness-of-fit
measure is root mean square error of approximation (RMSEA). Root mean square
error of approximation (RMSEA) examines the difference between the actual and the
predicted covariance, i.e. residual or, specifically, the square of the mean of the
squared residuals. A RMSEA value of 0.08 is considered conservative.
Finally it may be concluded that fit of the model will be evaluated on three different
indices goodness-of-fit index (GFI), comparative-fit-index (CFI) and root mean
square error of approximation (RMSEA).
3.4.6.2 Multidimensional Scaling
Multidimensional scaling is a class of procedures for representing perceptions and
preferences of respondents spatially by means of visual display (Malhotra, 2008).
This technique will be used to identify major opportunities and challenges of online
marketing of Indian railways. It will also be used to obtain consumers perception
towards website service quality. SPSS 16 version will be used to perform ALSCAL
MDS.
3.4.6.3 Factor Analysis
Factor analysis is a class of procedures primarily used for data reduction and
summarization (Malhotra, 2008). In the present study Principal component Analysis
with Varimax rotation will be performed via SPSS 16 version to identify various
dimension of service quality.
3.4.6.4 Time Series Analysis: It is used to study the trends of Online marketing of
Indian railways.
3.4.6.5 One way ANOVA
The Analysis of variance technique is used when the independent variables are of
nominal scale (categorical) and the dependent variable is metric (continuous), or at
least interval scaled (Nargundkar, 2010). In the present study One-way ANOVA is

90
performed to examine the significant difference among three categories of intention to
use online marketing of Indian Railways.
3.4.6.6 Percentage, Frequencies, Mean and standard deviation
3.4.7 Reliability and Validity
3.4.7.1 Convergent Validity: The convergent validity of the measurement model of
the construct will be assessed by examining the score of standardized regression
coefficients between construct and its indicator. At a minimum, all factor loadings
should be statistically significant and higher than 0.5 (Malhotra 2009). High loadings
ensure that all indicators are measuring the same construct.
3.4.7.2 Construct Reliability: To assess the internal consistency of the construct
cronbach’s alpha values will be calculated. The proposed threshold value for
confirmative research: Cronbach alpha > 0.700. Values must not be lower than .600
(Cronbach 1951).
3.5 ReferencesDavis, F.D. (1989), “Perceived Usefulness, Perceived Ease of Use and User Acceptance of
Information Technology”, MIS Quarterly, Vol. 13, No. 3, pp. 319-339.
Dehbashi, Shima (2007), Factors Affecting on Iranian Customers’ AcceptanceTowards e-Ticketing Provided by Airlines, Master Thesis, Lulea University ofTechmology, available at http://www.essays.se
Gefen, D. (2000), “E-Commerce: The Role of Familiarity and Trust”, Omega, Vol. 28, No. 6,pp. 725-737.
Gefen, D.; Karahanna, E. and Straub, D. (2003), “Trust and TAM in Online Shopping: AnIntegrated Model”, MIS Quarterly, Vol. 27, No. 1. pp. 51-90.
Gefen, D.; Karahanna, E. and Straub, D. (2003), “Trust and TAM in Online Shopping: AnIntegrated Model”, MIS Quarterly, Vol. 27, No. 1. pp. 51-90.
Kelley, S. W. and Davis, M. A. (1994), “Antecedents to Customer Expectations for ServiceRecovery”, Journal of the Academy of Marketing Science, Vol. 22, No. 1, pp. 52-61.
Kotler, Philip; Keller, Kevin Lane; Koshy, Abraham and Jha, Mithileshwar (2009), MarketingManagement: A South Asian Perspective, 13th Edition, Pearson Education, UnitedStates.
Laukkanen, Pekka; Sinkkonen, Suvi and Laukkanen, Tommi (2008), “Consumer Resistanceto Internet Banking: Postponers, Opponents and Rejectors”, The InternationalJournal of bank Marketing, Vol. 26, No.6, pp. 440-455.

91
Laukkanen, T. and Lauronen (2005), “Consumer Value Creation in Mobile BankingServices”, International Journal of Mobile Communications, Vol. 3, No. 4, pp. 325-338.
Malhotra, Naresh K. (2009), Marketing Research: An Applied Orientation, 7th Edition,Prentice Hall of India Private Ltd., New Delhi.
Nargundkar, Rajendra (2010), Marketing Research: Text and Cases, Tata McGrawHill Publishing Company Ltd., New Delhi.
Parasuraman, A. (2000), “Technological Readiness Index: A Multiple-Item Scale to MeasureReadiness to Embrace New Technologies”, Journal of Service Research, Vol. 2, No.4, pp. 307-320.
Parasuraman, A.; Zeithaml, V.A. and Malhotra, A. (2005), “E-SQUAL: A Multiple-ItemScale for Assessing Electronic Service Quality”, Journal of Service Research, Vol. 7,No.3, pp. 213-233.
Parasuraman, A; Zeithaml, V A and Berry, L L (1988), “SERVQUAL: A Multiple-item Scalefor Measuring Consumer Perceptions of Service Quality”, Journal of Retailing, Vol.64, No, 1, pp. 12-40.
Rogers, E. M. (1995), Diffusion of Innovations, Free Press, New York.
Taylor, S. and Todd, P. A. (1995), “Assessing IT Usage: The Role of Prior Experience”, MISQuarterly, Vol. 19, No. 4, pp. 561-570.
Venkatesh, V. and Davis, F. D. (2000), “A Theoretical Extension of the TechnologyAcceptance Model: Four Longitudinal Field Studies”, Management Science, Vol. 46,No. 2, pp. 186-204.
Wang, Yi-Shun; Wang, Yu-Min; Lin, Hsin-Hui and Tang, Tzung-1 (2003), “Determinants ofUsers Acceptance of Internet Banking: An Empirical Study”, International Journal ofService Industry Management, Vol. 14, Issue 5, pp. 501-519.
Related Documents