Chapter 3: Chronic Disease Management in Ontario Technical Report Prepared by CT Lamont Primary Health Care Research Centre For the Ontario Health Quality Council May 2008

Welcome message from author
This document is posted to help you gain knowledge. Please leave a comment to let me know what you think about it! Share it to your friends and learn new things together.
Transcript
Chapter 3: Chronic Disease Management in Ontario
Technical Report
Prepared by CT Lamont Primary Health Care Research Centre For the Ontario Health Quality Council
May 2008
2
Table of Contents Introduction ......................................................................................................................................3 Objectives.........................................................................................................................................4 Methodology ....................................................................................................................................4
Comparison of Models of Primary Care Study............................................................................4 Design.......................................................................................................................................4 Sample......................................................................................................................................4 Eligibility..................................................................................................................................5
Practice .................................................................................................................................5 Provider ................................................................................................................................6 Patient (surveys)...................................................................................................................6 Chart .....................................................................................................................................6
Recruitment ..............................................................................................................................6 Practice .................................................................................................................................6 Provider ................................................................................................................................7 Patient...................................................................................................................................7 Chart .....................................................................................................................................7
Instruments ...............................................................................................................................7 Practice survey .....................................................................................................................8 Provider survey ....................................................................................................................8 Patient Survey ......................................................................................................................8 Chart audit ............................................................................................................................8
Analyses related to OHQC...........................................................................................................9 Indicators..................................................................................................................................9
Composite scores................................................................................................................10 Sample description for CDM evaluation............................................................................11
Analyses .................................................................................................................................12 Weighing ............................................................................................................................12 Power calculations..............................................................................................................13 Standardization...................................................................................................................14 Predictive analysis..............................................................................................................15
Results ............................................................................................................................................15 Model description.......................................................................................................................15 Performance in Ontario ..............................................................................................................16 Equitable provision of care ........................................................................................................20
Sex differences (Table 6) .......................................................................................................20 Age differences (Table 7).......................................................................................................20
Factors associated with overall CDM score...............................................................................26 Comparison of models across composite CDM score ...........................................................26 Factors associated with CDM ................................................................................................29
Research limitations .......................................................................................................................31 Acknowledgements ........................................................................................................................33 Endnotes .........................................................................................................................................34
3
Introduction
Chronic diseases such as type II diabetes and cardiovascular illness have a significant negative impact on the health related quality of life of Canadians1 as well as a major economic impact as losses due to death from chronic disease are projected to cost an average of $900 million annually in labour supplies and savings between 2005-15.2 According to the World Health Organization, an estimated 89% of all deaths in Canada in 2005 were caused by chronic disease.3
The bulk of care for chronic diseases occurs in primary care 4 5 and the demand for these services is increasing, in part owing to longer life spans of the population6 and longer survival of patients with multiple chronic illnesses.7 The primary health care system in Canada was developed to address the needs of acute health conditions. There is a growing consensus that primary care now needs to be adapted for the delivery of systematic care for chronic diseases.8 9
10While delivering such systematic care would be expensive and time consuming,11 increasingly, commentators feel that not making these changes would put the long term sustainability of the Canadian health care system at risk.12 Although chronic disease treatment is improving in general practice, the level of care does not yet meet optimal standards.13 14 15
This project was undertaken to address a need for empirical data on the state of chronic disease management (CDM) in Ontario. The study examines the quality of CDM in the province as a whole. It compares the care delivered to recommendations for the management of diabetes, coronary artery disease (CAD), congestive heart failure (CHF) and hypertension. It also evaluates whether the delivery of care is equitable in men and women and between patients of different ages. Sex and age differences in chronic care delivery in Ontario and elsewhere have been previously documented.16 17 Our results provide a baseline measure of CDM performance in Ontario to which future evaluations can be compared.
Investments in our health care system, including changes to the organization of primary care delivery, continue to be made. Efforts to understand what factors drive primary care performance in Ontario are required in order to guide these investments. Previous research has demonstrated the benefits of changing organizational structure in the delivery of care for patients with chronic illness.6 14 18 19 20
We compare whether differences in quality of care exist between four primary care models, and evaluate the impact of various organizational factors on the performance level of practices. For example, we consider whether team structure, size of practice, provider profile, practice setting, use of information technology and other practice factors are associated with the quality of care delivered. We found significant associations between practice organizational factors and quality of care, which will inform practice managers on effective practice structures to support better CDM. Our findings will also inform policy makers regarding future investments for improvements.
4
Objectives
We report on the performance of Ontario primary care practices in the management of chronic diseases. The evaluation relies on data collected from a large cross-sectional study, the Comparison of Models of Primary Care in Ontario (COMP-PC) study. Indicators for diabetes, CAD and CHF are used to evaluate adherence to recommended guidelines for the management of these conditions. Haemoglobin A1c (HbA1c) and blood pressure measurements are used to measure control of diabetes and hypertension, respectively.
We also evaluate equity by comparing care provided to males and females and to patients of different ages. Finally, we compare CDM performance across four primary care models and evaluate what features are associated with better care levels.
Methodology
The methodology section is divided into two parts. The first part explains data collection in the COMP-PC study, and the second describes the analyses related specifically to CDM evaluated in this report.
Comparison of Models of Primary Care Study
Design
This report relies on data collected for the COMP-PC project--a cross-sectional evaluation of primary care practices in Ontario between 2004 and 2006. The objective of the COMP-PC study was to describe four models of primary care delivery and to measure and compare the quality of care delivered in their practices. The quantitative portion of the study included chart abstraction and three types of surveys administered in family practices across Ontario. In each participating practice, patients and providers were surveyed, a practice questionnaire was completed, and chart reviews were performed. The study was approved by the Ottawa Hospital Research Ethics Board.
Sample
Four organizational models that serve the majority of Ontario’s population were studied: 1) the traditional Fee-For-Service (FFS) model, in which providers are remunerated based on services rendered (including the recently formed Family Health Groups [FHGs], for which limited financial incentives for accessibility are also provided); 2) Health Service Organization (HSO), in which provider salary is based on capitation for patients rostered and includes a FFS component for non-rostered patients (up to 30% of the practice); 3) Family Health Network (FHN), a blended model of remuneration primarily based on capitation but including a 10%
5
premium payment on FFS billings for non-rostered patients and pay for performance bonuses; and 4) Community Health Centres (CHCs), which are community governed, multidisciplinary group practices with strictly salaried providers.
The study did not include all of Ontario. For practical reasons, geographical limits were set that excluded approximately 5% of the northernmost practices in the province. The areas excluded serve a population living under special conditions and for whom the experience in primary care services is very different from the rest of the sample. The findings from the COMP-PC study cannot be extrapolated to that group.
There was no accessible central source of reliable practice lists within each model except for CHCs. Much effort was invested in creating and validating such lists (two of which were established for a different study, 2004), but it is impossible to ensure that all eligible practices were identified. In addition, late in 2004, the Ontario MOHLTC made available a new model of care delivery to which FFS practices could transition: the Family Health Group (FHG). During the recruitment period, we observed that the majority (approximately 80%) of FFS practices had converted to FHGs, and a decision was made to include FHG practices within the FFS group. At that time, the principal difference between the FHG and FFS models lay in accessibility: the former were required to provide after-hour availability and received increased payments for certain FFS billings for registered patients.
Eligibility
Practice
Eligible practices were required to have belonged to their respective model for at least one year before enrolment in the study. Practices were required to provide broad-based primary care and were excluded if they limited their services to certain populations (e.g., psychotherapy or sports medicine patients, children or walk-in patients). Eligible practices were required to have at least one full-time-equivalent physician, and at least half of the providers (doctors and NPs) at the practice had to consent to participate in the study. If a group practice had more than one physical site (address), each site was considered a discrete entity unless the sites shared at least four of the following five criteria: office space, staff, expenses, patient records and on-call duties [adapted from the College of Family Physicians of Canada’s National Family Physician Workforce Survey (2007)]. 21
For three models, potential practices were identified by updating an internal list of sites established for the purpose of another study conducted in 2004. The FHN, CHC and FFS lists contained 104 (94 eligible), 51 and 1,884 practice sites, respectively. There was no publicly available list of HSO practices, but it was estimated that approximately 75 such sites were in operation in the province. We compiled our own list of HSO sites by telephoning physicians known to be practising in HSOs and networking to identify others. Seventy-six potential sites were identified, 65 of which were eligible.
6
In the three models with fewer than 120 sites (CHCs, FHNs and HSOs), the entire population was targeted. For the FFS models, we used a random-number generator to select and order a pool of 300 practices from which contact could be sequentially made to perform a preliminary evaluation of eligibility. Eventually, 197 practices (155 eligible) were approached for participation.
We recruited 35 FFS practices, 35 FHNs, 35 CHCs and 32 HSOs. FFS was the predominant model, serving roughly 89% of the population; CHCs, HSOs and FHNs cared for approximately 2.9%, 2.6% and 5.6%, respectively. This information was derived from the list of practices we had and estimates of the number of patients served in each model.
Provider
Doctors and NPs working at the practice were eligible for the study if: they had practised at that site for at least one year (six months for NPs), that practice was the site of their principal clinical practice, the majority of their services were devoted to primary care, and the majority of their patients were 18 years old or older. In each participating practice, at least 50% of providers [family physicians and nurse practitioners (NPs)] were required to take part in the study.
Patient (surveys)
Patients were eligible if they were: clients of consenting providers, 18 years of age or older, not severely ill or cognitively impaired, not known to the survey administrator (SA) and able to communicate in English or French (either directly or through a translator).
All patients of participating providers who had an appointment at the practice on the day of survey administration were potential candidates and were reviewed sequentially for eligibility as they arrived for their appointment. Brief exceptions were made if the SA was fully occupied with other participants.
Chart
The chart data gathered were unrelated to the data collected in the surveys (i.e., not matched to the patient). Chart abstraction was limited to the charts of regular patients of consenting care providers who were 18 years of age or older at the time of their last visit and who had active charts (defined as a chart with at least two years of information and at least one visit documented in the prior year). Patients were excluded if they had died, had been transferred out of the practice in the previous two years, were seen at the practice for specialized services only (e.g., foot care), were known to the chart abstractor (CA) or were staff members of the practice.
Recruitment
Practice Practice recruitment began in August 2005 and was closed in May 2006. Eligible
practices were invited to participate through a mailed package containing a recruitment form, an
7
explanatory brochure, an organizational consent form and a provider consent form. For HSOs, the package was delivered by the MOHLTC through its monthly salary mailing. For all other models, follow-up was done through a combination of mailings, telephone calls and face-to-face visits.
Provider
Provider recruitment was conducted simultaneously with practice recruitment. It was the responsibility of the practice manager to ensure participation of at least 50% of the providers.
Patient
Because the study team was not permitted to approach patients directly, the receptionist performed the initial eligibility screening and invited patients to obtain information about the study following a prepared script. The receptionist then provided an invitation letter and directed interested patients to the SA in the waiting room. Following another prepared script, the SA provided more detailed information about the study, verified the full set of eligibility criteria and invited the client to participate in the study. The target number of patient participants in each practice was 50, but data collection was discontinued after one week of recruitment efforts if at least 30 surveys had been completed.
Chart
In practices with paper-based charting, the CA used the “tape measure” method to randomly select 30 charts for review. The total length of the shelves containing the charts was divided into 60 “similar distance” sections, and the fifth chart from the start of each section was retrieved for evaluation. The CA examined each chart sequentially until 30 eligible charts were identified for review. For practices with electronic medical records, a random-number generator produced a list of 100 numbers based on the total number of patients enrolled at the practice. The CA then sequentially selected the corresponding charts until 30 eligible charts were identified for review. Patients were eligible for the CDM analysis if they had one or more chronic diseases. Classification of patients in chronic disease groups (e.g., diabetes) was determined by the medical diagnosis in the chart. The CAs received three days of training and were provided with instruction manuals. Their work was consistently reviewed to ensure the on-going accuracy and consistency of data collection.
Instruments
The quantitative data collection tools consisted of three surveys (patient, provider and practice) and a chart abstraction form. Chronic disease information was gathered by chart abstraction, and health promotion was evaluated in the patient survey. The provider and practice surveys captured organizational and contextual information that could be used to understand performance. The surveys were modified from the Primary Care Assessment Tool (PCAT), a survey instrument developed and validated by the Johns Hopkins Primary Care Policy Center that was designed to measure the quality of primary care services.22

8
Practice survey
The practice survey, which was filled out by the office manager, was divided into three sections. The first section focused on the description of the practice environment, including the setting, hours of operation, availability of medical and social services in the surroundings, use of information technology and accessibility for disabled persons. The purpose of the questions pertaining to information technology was to determine which technologies were present at the practices; we did not assess to what degree they were used by staff. The second section contained questions that measured comprehensiveness, community orientation and cultural competency. The third section captured financial and governance information, including team structure, sources of income, salaries and operating costs.
Provider survey
All participating providers were required to complete a provider survey, which was composed of three sections. The first section contained questions measuring the provider’s perception of practice performance on several dimensions of health care service delivery: first-contact accessibility, availability, accommodation, equity, cultural sensitivity, family-centred care, coordination, collaboration, services offered, population orientation and provider satisfaction. The second section captured information on provider preferences and demographics, while the third focused on work setting and provider socioeconomic information.
Patient Survey
The patient survey was divided into two sections. The first section, which was completed in the waiting room before the visit with the provider, captured patient descriptive information and elicited patients’ experiences of the practice’s performance on measures covering a broad range of dimensions of health care service delivery, including first-contact accessibility, accommodation, patient–provider relationship, cultural sensitivity, respectfulness, family-centred care, trust, relational continuity, co-ordination, comprehensiveness and population orientation. The second section, completed after the visit with the provider, captured information specific to that visit, including waiting time, visit duration and whether the patient was counselled on health promotion activities (e.g., smoking behaviour, physical exercise, fall prevention); it took less than five minutes to complete.
The patient survey was available in English and French. It was developed in English, translated into French through an extensive iterative translation process and validated against the English version using a sample of 120 bilingual individuals.23 When necessary, translators assisted patients in completing the surveys.
Chart audit
The chart abstraction captured four thematic areas: 1) patient demographic information, 2) visit activities (including referrals, prescriptions and orders), 3) chart organization and 4) measures of performance of technical quality of care, including prevention and chronic disease management.
9
Analyses related to OHQC
Indicators
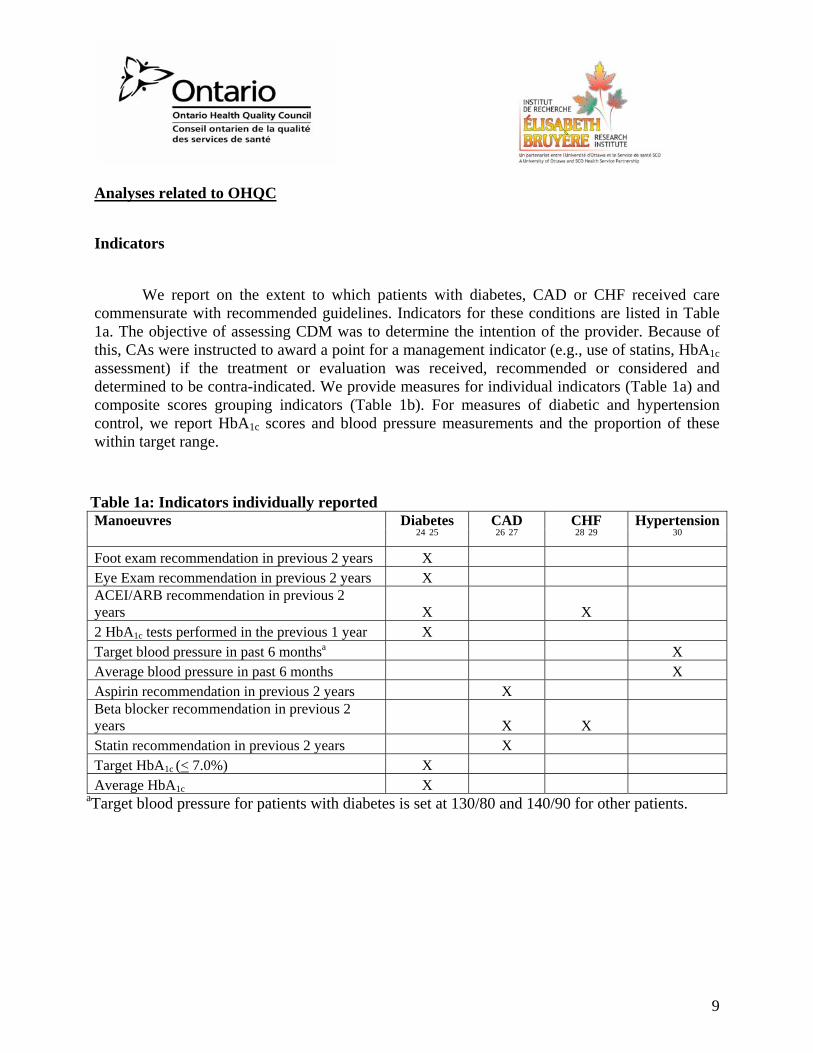
We report on the extent to which patients with diabetes, CAD or CHF received care commensurate with recommended guidelines. Indicators for these conditions are listed in Table 1a. The objective of assessing CDM was to determine the intention of the provider. Because of this, CAs were instructed to award a point for a management indicator (e.g., use of statins, HbA1c assessment) if the treatment or evaluation was received, recommended or considered and determined to be contra-indicated. We provide measures for individual indicators (Table 1a) and composite scores grouping indicators (Table 1b). For measures of diabetic and hypertension control, we report HbA1c scores and blood pressure measurements and the proportion of these within target range.
Table 1a: Indicators individually reported Manoeuvres Diabetes
24 25 CAD 26 27
CHF 28 29
Hypertension30
Foot exam recommendation in previous 2 years X Eye Exam recommendation in previous 2 years X ACEI/ARB recommendation in previous 2 years X X 2 HbA1c tests performed in the previous 1 year X Target blood pressure in past 6 monthsa X Average blood pressure in past 6 months X Aspirin recommendation in previous 2 years X Beta blocker recommendation in previous 2 years X X Statin recommendation in previous 2 years X Target HbA1c (< 7.0%) X Average HbA1c X
aTarget blood pressure for patients with diabetes is set at 130/80 and 140/90 for other patients.
10
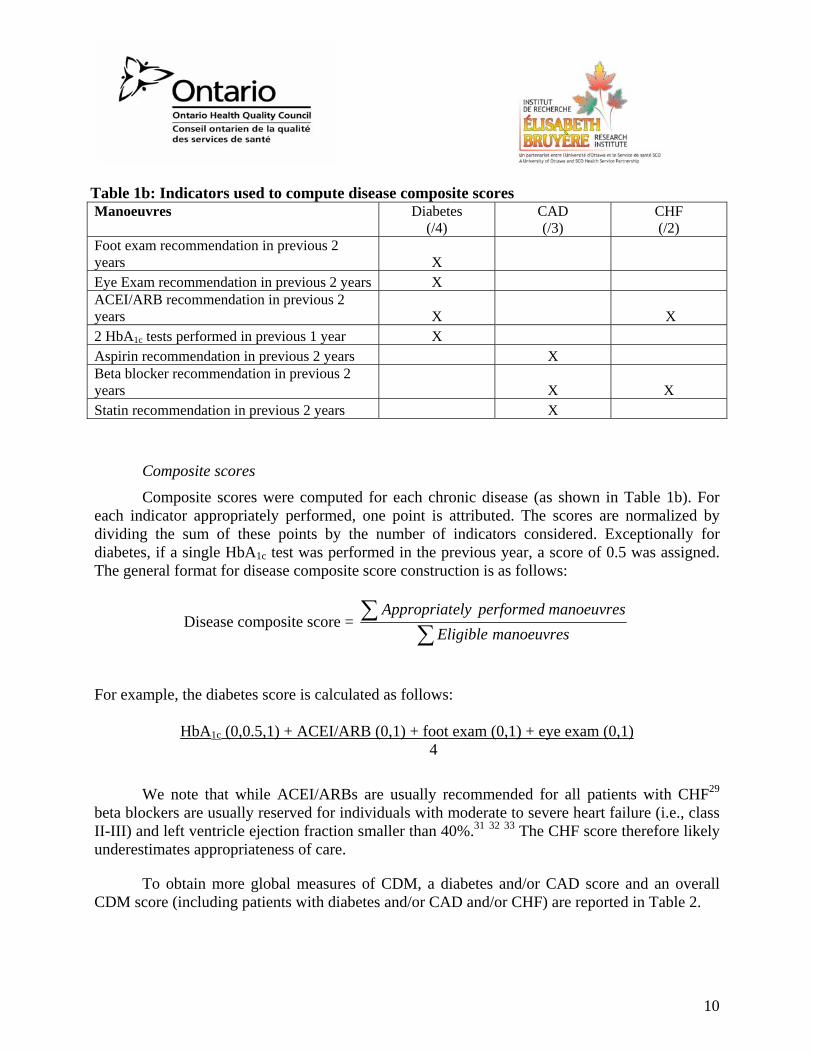
Table 1b: Indicators used to compute disease composite scores Manoeuvres Diabetes
(/4) CAD (/3)
CHF (/2)
Foot exam recommendation in previous 2 years X Eye Exam recommendation in previous 2 years X ACEI/ARB recommendation in previous 2 years X X 2 HbA1c tests performed in previous 1 year X Aspirin recommendation in previous 2 years X Beta blocker recommendation in previous 2 years X X Statin recommendation in previous 2 years X
Composite scores
Composite scores were computed for each chronic disease (as shown in Table 1b). For each indicator appropriately performed, one point is attributed. The scores are normalized by dividing the sum of these points by the number of indicators considered. Exceptionally for diabetes, if a single HbA1c test was performed in the previous year, a score of 0.5 was assigned. The general format for disease composite score construction is as follows:
Disease composite score = ∑
∑manoeuvresEligible
manoeuvresperformedelyAppropriat
For example, the diabetes score is calculated as follows:
HbA1c (0,0.5,1) + ACEI/ARB (0,1) + foot exam (0,1) + eye exam (0,1) 4
We note that while ACEI/ARBs are usually recommended for all patients with CHF29 beta blockers are usually reserved for individuals with moderate to severe heart failure (i.e., class II-III) and left ventricle ejection fraction smaller than 40%.31 32 33 The CHF score therefore likely underestimates appropriateness of care.
To obtain more global measures of CDM, a diabetes and/or CAD score and an overall CDM score (including patients with diabetes and/or CAD and/or CHF) are reported in Table 2.
11
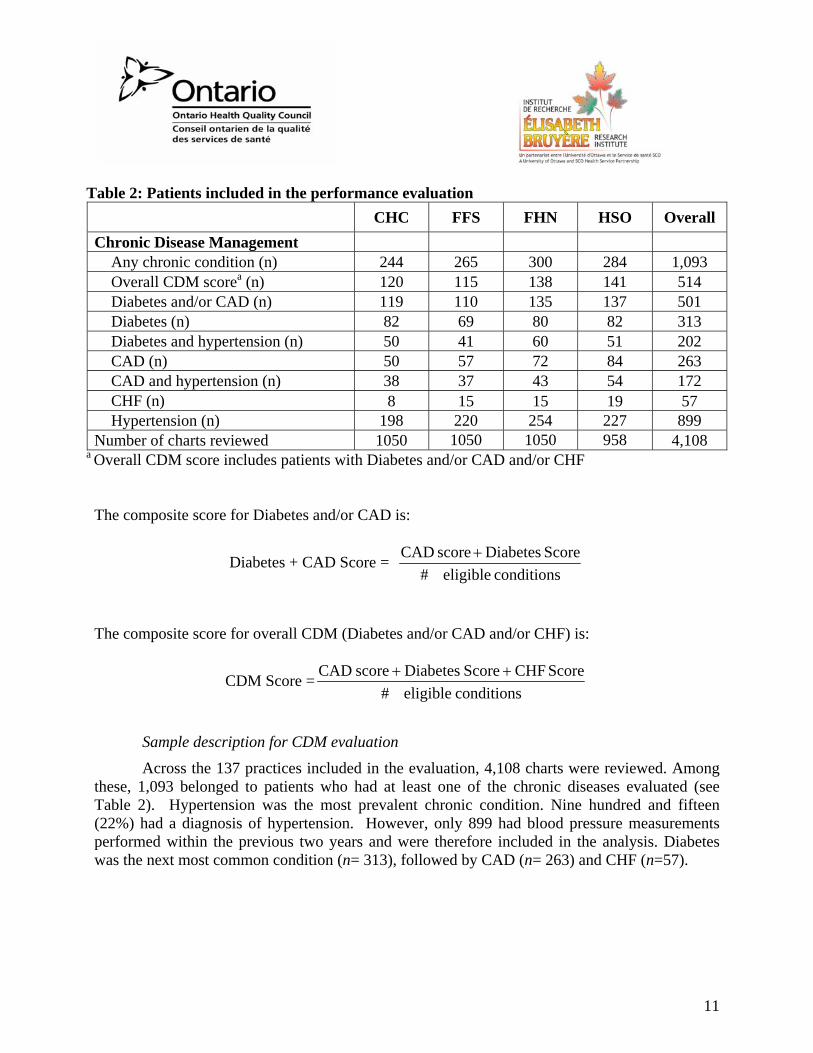
Table 2: Patients included in the performance evaluation CHC FFS FHN HSO Overall Chronic Disease Management
Any chronic condition (n) 244 265 300 284 1,093 Overall CDM scorea (n) 120 115 138 141 514 Diabetes and/or CAD (n) 119 110 135 137 501 Diabetes (n) 82 69 80 82 313 Diabetes and hypertension (n) 50 41 60 51 202 CAD (n) 50 57 72 84 263 CAD and hypertension (n) 38 37 43 54 172 CHF (n) 8 15 15 19 57 Hypertension (n) 198 220 254 227 899
Number of charts reviewed 1050 1050 1050 958 4,108 a Overall CDM score includes patients with Diabetes and/or CAD and/or CHF
The composite score for Diabetes and/or CAD is:
Diabetes + CAD Score = conditionseligible#
ScoreDiabetesscoreCAD +
The composite score for overall CDM (Diabetes and/or CAD and/or CHF) is:
CDM Score =conditionseligible#
Score CHFScoreDiabetesscoreCAD ++
Sample description for CDM evaluation
Across the 137 practices included in the evaluation, 4,108 charts were reviewed. Among these, 1,093 belonged to patients who had at least one of the chronic diseases evaluated (see Table 2). Hypertension was the most prevalent chronic condition. Nine hundred and fifteen (22%) had a diagnosis of hypertension. However, only 899 had blood pressure measurements performed within the previous two years and were therefore included in the analysis. Diabetes was the next most common condition (n= 313), followed by CAD (n= 263) and CHF (n=57).

12
Analyses
Weighing
Since the intent of the COMP-PC study was to allow a comparison of models, a stratified recruitment strategy was performed, resulting in a roughly equivalent number of practices from each model in the study (35 each from CHC, FFS and FHN, and 32 from HSO). However, in reality the proportion of patients served by each of these models in Ontario differs considerably. For example, approximately 89% of the Ontario population receives care from FFS practices. To obtain performance measures reflective of the Ontario population, samples were weighted to represent the prevalence of practices in that model and the number of patients served in these practices. Each practice was assigned a weight that was inversely proportional to the probability of being selected for the study sample. Similarly, each patient record was assigned a weight that was inversely proportional to the probability of being selected from the practice for the study sample. These two weights were combined and standardised to obtain overall patient-specific weights. As such, patients sampled from larger practices belonging to a more prevalent model were more heavily weighted. These weights were applied to all analyses except the model comparison, which was weighted to account for practice size only.
The formula used for weighing by practice is as follows;
ppractice= practice
practice
Nn
and wpractice= practicep1
where ppractice: probability of practice being selected for the study sample Npractice: Number of all practices in the model npractice: number of practices selected to sample from the model wpractice: weight of each practice
The formula for weighing by patient record is as follows;
Ppatient= patient
patient
Nn
and wpatient= patientp1
where Ppatient: probability of patient being selected for the study sample Npatient : Number of all patients in the practice npatient : number of patients selected to sample from the practice wpatient: weight of each practice

13
These two weights were combined and standardized to obtain overall patient-specific weights.
Combined weights= wcombined = practicep1
⋅patientp1 =
practice
practice
nN
⋅patient
patient
nN
Patient –specific weights = ∑diseasewithpatientsall
combined
combined
ww
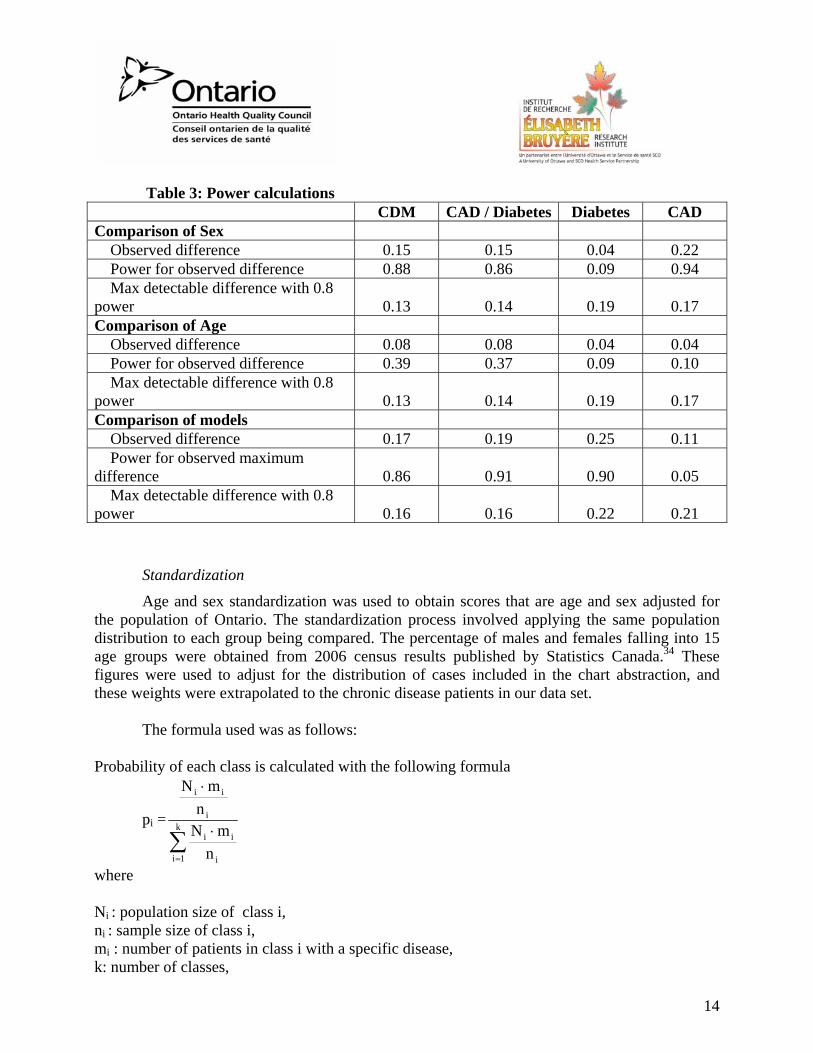
Power calculations
Power analyses are performed for all composite scores to calculate the amount of departures from affinity that can be detected with the data set available for the analyses of each factor. The intra-class correlations (ICC) are calculated for each score to find the effect of practices on the independence of the patient scores. The effective sample sizes, in which the ICC are considered, were derived using the power analysis in G-power program to perform the power analyses. We assumed equal number of patients in the groups compared. Table 3 lists, for each comparison of composite score performed, the difference in score, the power to detect that difference, and differences that could be detected with an 80% power
14
Table 3: Power calculations CDM CAD / Diabetes Diabetes CAD Comparison of Sex
Observed difference 0.15 0.15 0.04 0.22 Power for observed difference 0.88 0.86 0.09 0.94 Max detectable difference with 0.8
power 0.13 0.14 0.19 0.17 Comparison of Age
Observed difference 0.08 0.08 0.04 0.04 Power for observed difference 0.39 0.37 0.09 0.10 Max detectable difference with 0.8
power 0.13 0.14 0.19 0.17 Comparison of models
Observed difference 0.17 0.19 0.25 0.11 Power for observed maximum
difference 0.86 0.91 0.90 0.05 Max detectable difference with 0.8
power 0.16 0.16 0.22 0.21
Standardization
Age and sex standardization was used to obtain scores that are age and sex adjusted for the population of Ontario. The standardization process involved applying the same population distribution to each group being compared. The percentage of males and females falling into 15 age groups were obtained from 2006 census results published by Statistics Canada.34 These figures were used to adjust for the distribution of cases included in the chart abstraction, and these weights were extrapolated to the chronic disease patients in our data set.
The formula used was as follows:
Probability of each class is calculated with the following formula
pi =∑=
⋅
⋅
k
1i i
ii
i
ii
nmN
nmN
where
Ni : population size of class i, ni : sample size of class i, mi : number of patients in class i with a specific disease, k: number of classes,
15
Average of score for each class is computed. The standardized score is calculated as
follows, where ri is the weighted average for the class i.
∑=
k
1iii rp
Predictive analysis
To determine which factors are associated with better performance, we evaluated the relationship between the overall CDM score (diabetes and/or CAD and/or CHF) and individual patient, provider and practice factors. A list of potential predictors was created based on the literature and the investigators’ opinions. The association these factors have with the overall CDM score was evaluated in the bi-variate setting. Interaction or non-linear terms was used for the variables that have different behaviour for different primary health care models or non-linear relation with the outcome. The forward selection method of multivariate regression with manual verification was used to build a predictive model. Multi-collinearity checks were applied and variables creating multi-collinearity were excluded from the analysis. Normality of the error terms was also verified.
The predictive analysis was performed only for the overall CDM score, but the results were also validated with the CAD and diabetes score. No significant difference on the estimated parameters for the reported variables was detected.
Results
Model description
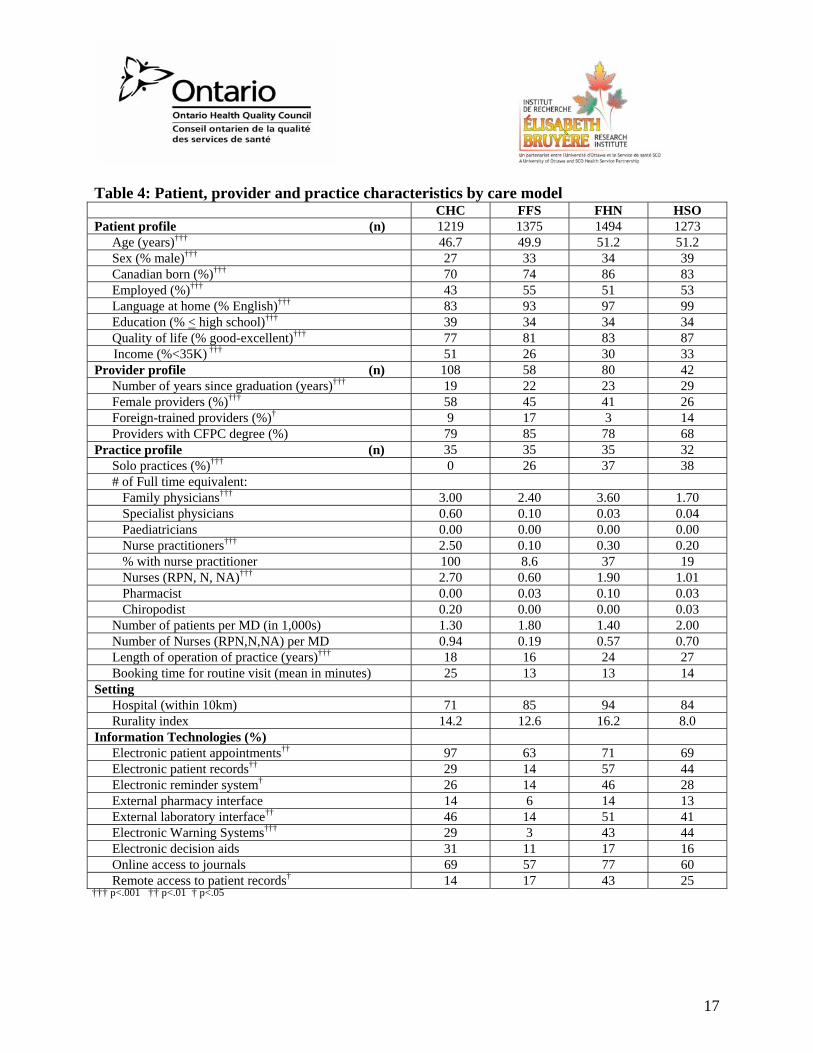
Primary care is organized by model. At the time of the COMP-PC study, there were four predominant models: CHC, FFS, FHN and HSO. Together, these models served approximately 95% of the population. While there is considerable variability within practices of the same model, there are also commonalities resulting in distinctions between models. Characteristics of the four models of primary care in our sample are summarized in Table 4.
Patient profiles varied significantly between models, the most notable differences being between the CHCs and the other three. Patients at CHCs were the most likely to be younger, female, have been born outside of Canada, have lower socio-economic status and report lower quality of life.
There were also several noticeable differences in practice organization between the models. For instance, CHCs were all group practices, had longer booking times for routine visits and employed more full-time-equivalent nurses and NPs than the other models, while HSOs had more male physicians and the highest ratio of patients per physician. FFS practices were the least
16
likely to employ a nurse or implement information technology. FHNs were the largest practices and were the least likely to have foreign trained physicians.
From the results of this study, we estimated the profile of family practices in Ontario by weighting the data from each model according to its prevalence. Overall, in Ontario, 26% of family physician offices were solo practices, 13% employed an NP, 18% had implemented electronic patient records, 17% had an electronic reminder system, and 17% reported having electronic decision aids. The average (mean) booking interval was 14 minutes, and the overall ratio of nurses to family physicians was 1:4.
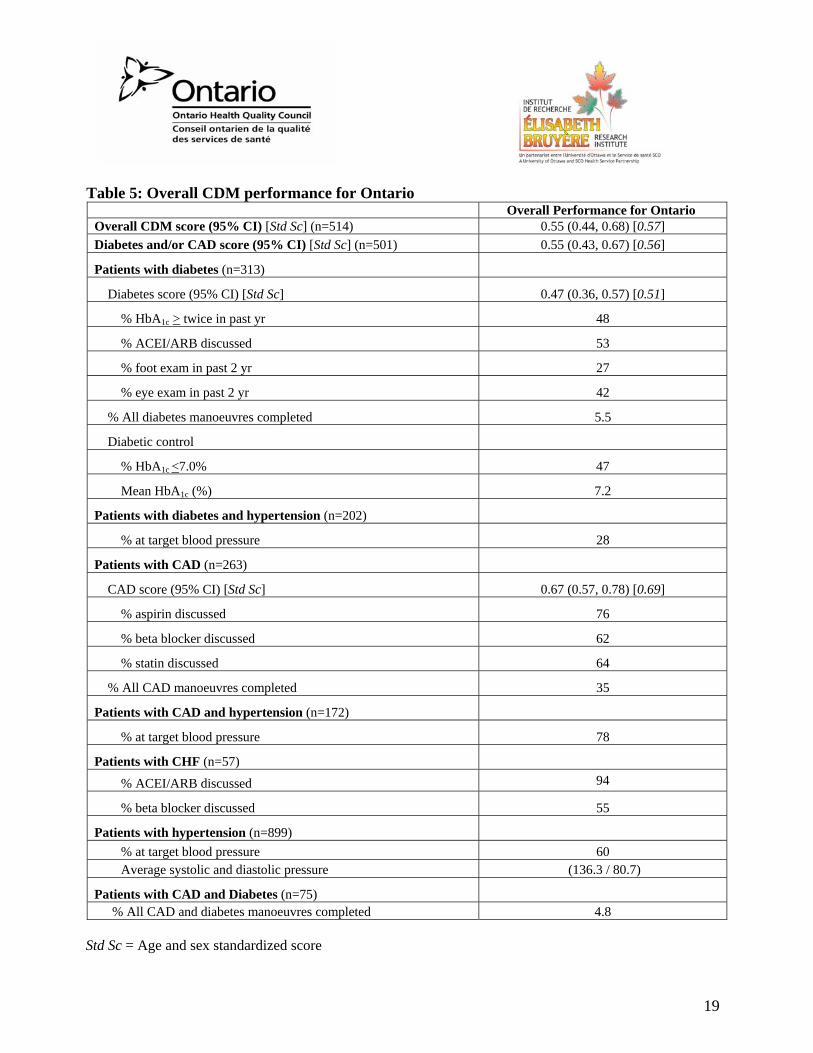
Performance in Ontario
The data presented in Table 5 reflect the overall estimate of performance in CDM. Overall, among the seven chronic disease management indicators we evaluated, 55% were performed. Adherence to recommended guidelines was lowest for diabetes (47%). A yearly foot examination in diabetic patients is recommended for the early detection and prevention of foot ulcers. Foot examination can lead to the identification of risk factors associated with foot ulceration (such as lack of sensation and poorly fitting footwear). Foot ulcers occur in 5% of diabetics and can lead to serious consequences, such as amputation and, occasionally, death.32 However, only 27% of Ontario patients with diabetes had a documented foot examination in the previous two years. Diabetic patients are also at an elevated risk of retinopathy (damage to the retina), which is thought to be the result of poorly controlled blood glucose on the blood vessels of the eye.35 Screening by an optometrist or ophthalmologist is recommended yearly for the early detection of retinal changes.25 In our sample, 42% of Ontarians had a screening eye exam or referral to an eye care specialist documented in the previous two years.
17
Table 4: Patient, provider and practice characteristics by care model CHC FFS FHN HSO Patient profile (n) 1219 1375 1494 1273
Age (years)††† 46.7 49.9 51.2 51.2 Sex (% male)††† 27 33 34 39 Canadian born (%)††† 70 74 86 83 Employed (%)††† 43 55 51 53 Language at home (% English)††† 83 93 97 99 Education (% < high school)††† 39 34 34 34 Quality of life (% good-excellent)††† 77 81 83 87 Income (%<35K) ††† 51 26 30 33
Provider profile (n) 108 58 80 42 Number of years since graduation (years)††† 19 22 23 29 Female providers (%)††† 58 45 41 26 Foreign-trained providers (%)† 9 17 3 14 Providers with CFPC degree (%) 79 85 78 68
Practice profile (n) 35 35 35 32 Solo practices (%)††† 0 26 37 38 # of Full time equivalent:
Family physicians††† 3.00 2.40 3.60 1.70 Specialist physicians 0.60 0.10 0.03 0.04 Paediatricians 0.00 0.00 0.00 0.00 Nurse practitioners††† 2.50 0.10 0.30 0.20 % with nurse practitioner 100 8.6 37 19 Nurses (RPN, N, NA)††† 2.70 0.60 1.90 1.01 Pharmacist 0.00 0.03 0.10 0.03 Chiropodist 0.20 0.00 0.00 0.03
Number of patients per MD (in 1,000s) 1.30 1.80 1.40 2.00 Number of Nurses (RPN,N,NA) per MD 0.94 0.19 0.57 0.70 Length of operation of practice (years)††† 18 16 24 27 Booking time for routine visit (mean in minutes) 25 13 13 14
Setting Hospital (within 10km) 71 85 94 84 Rurality index 14.2 12.6 16.2 8.0
Information Technologies (%) Electronic patient appointments†† 97 63 71 69 Electronic patient records†† 29 14 57 44 Electronic reminder system† 26 14 46 28 External pharmacy interface 14 6 14 13 External laboratory interface†† 46 14 51 41 Electronic Warning Systems††† 29 3 43 44 Electronic decision aids 31 11 17 16 Online access to journals 69 57 77 60 Remote access to patient records† 14 17 43 25
††† p<.001 †† p<.01 † p<.05
18
HbA1c testing, which reflects blood glucose levels over the preceding three months,36 is the gold standard for monitoring glucose control. It is recommended that it be performed at least twice yearly. Approximately one in every two Ontarians with diabetes had at least two HbA1c measurements in the previous year. Among those with at least one evaluation, 50% had values within recommended range (< 7.0%).
Drug therapy with angiotensin converting enzyme inhibitors (ACEI) or angiotensin receptor blockers (ARB) in diabetics is used to reduce the risks of kidney disease and cardiovascular disease, including hypertension, which are often associated with diabetes.37 According to the Canadian Diabetes Association guidelines25 ACEI or ARBs are recommended for all patients with diabetes. But only 53% of diabetic COMP-PC patients were offered that treatment. In our sample, 65% of diabetic patients also had hypertension, and 28% of these had blood pressure measurements within the recommended range, which is not higher than 130/80. Finally, we estimate that only 5.5% of Ontarians with diabetes received all four recommended manoeuvres evaluated for this disease.
CAD, also referred to as ischemic heart disease or coronary heart disease, is the result of reduced blood flow to the heart caused by narrowing of its arteries. We measured drug-based manoeuvres for the management of CAD. Statins (cholesterol lowering agents), aspirin – ASA (an anti-platelet agent) and beta blockers (which control blood pressure and lower heart rate) are recommended therapy for the management of the condition. Ontarians discussed two thirds of the recommended drug therapy for CAD, and one third discussed all recommended drug therapy with their physicians. ASA is most commonly prescribed or recommended (76%). Hypertension is often associated with CAD. In this study, two thirds of individuals with CAD also had a hypertension diagnosis, and 78% had blood pressure measurements within the recommended range.
CHF is a condition in which the pumping action of the heart becomes less powerful. ACEI or ARBs are the recommended first line therapy for all individuals with CHF. The great majority (94%) of individuals with CHF had discussed these medications with their physicians. Beta blockers are usually reserved for more severe conditions and were discussed with 55% of individuals with CHF.
Hypertension was common (prevalence of 22% of those with chronic diseases in this sample). Sixty percent of individuals diagnosed with hypertension and who had blood pressure records within the previous two years had measurements within the recommended range, which for non-diabetic patients is not higher than 140/90. Sixteen patients had a diagnosis of hypertension but did not have recorded blood pressure measurements.
Several patients had more than one chronic condition. The management of individuals with multiple chronic conditions can be challenging. Among patients who had diabetes and CAD, only 5% received all recommended manoeuvres evaluated.
19
Table 5: Overall CDM performance for Ontario Overall Performance for Ontario Overall CDM score (95% CI) [Std Sc] (n=514) 0.55 (0.44, 0.68) [0.57] Diabetes and/or CAD score (95% CI) [Std Sc] (n=501) 0.55 (0.43, 0.67) [0.56]
Patients with diabetes (n=313)
Diabetes score (95% CI) [Std Sc] 0.47 (0.36, 0.57) [0.51]
% HbA1c > twice in past yr 48
% ACEI/ARB discussed 53
% foot exam in past 2 yr 27
% eye exam in past 2 yr 42
% All diabetes manoeuvres completed 5.5
Diabetic control
% HbA1c <7.0% 47
Mean HbA1c (%) 7.2
Patients with diabetes and hypertension (n=202)
% at target blood pressure 28
Patients with CAD (n=263)
CAD score (95% CI) [Std Sc] 0.67 (0.57, 0.78) [0.69]
% aspirin discussed 76
% beta blocker discussed 62
% statin discussed 64
% All CAD manoeuvres completed 35
Patients with CAD and hypertension (n=172)
% at target blood pressure 78
Patients with CHF (n=57) % ACEI/ARB discussed 94
% beta blocker discussed 55
Patients with hypertension (n=899) % at target blood pressure 60 Average systolic and diastolic pressure (136.3 / 80.7)
Patients with CAD and Diabetes (n=75) % All CAD and diabetes manoeuvres completed 4.8
Std Sc = Age and sex standardized score
20
Equitable provision of care
Sex differences (Table 6)
Overall, women received 49% of the recommended care for the management of chronic diseases, while physician adherence to recommended care was 15% higher in men (64%). There was no significant difference in the management of diabetes or CHF between sexes. However, male patients with CAD were significantly more likely to have discussed the recommended drug therapy with their physicians than women (77% vs. 55%). This trend was consistent across all prescription drugs, but was significant for statins only. Men with CAD were also significantly more likely to have their blood pressure within target values than their female counterparts (94% vs. 59%).
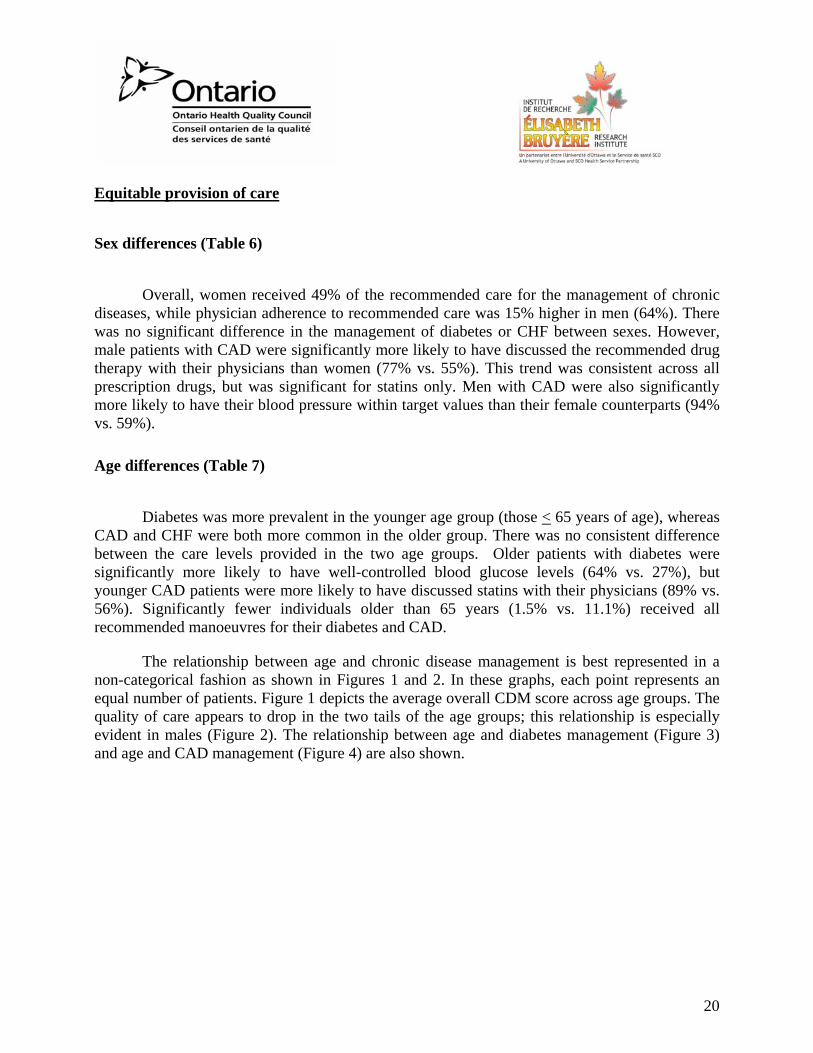
Age differences (Table 7)
Diabetes was more prevalent in the younger age group (those < 65 years of age), whereas CAD and CHF were both more common in the older group. There was no consistent difference between the care levels provided in the two age groups. Older patients with diabetes were significantly more likely to have well-controlled blood glucose levels (64% vs. 27%), but younger CAD patients were more likely to have discussed statins with their physicians (89% vs. 56%). Significantly fewer individuals older than 65 years (1.5% vs. 11.1%) received all recommended manoeuvres for their diabetes and CAD.
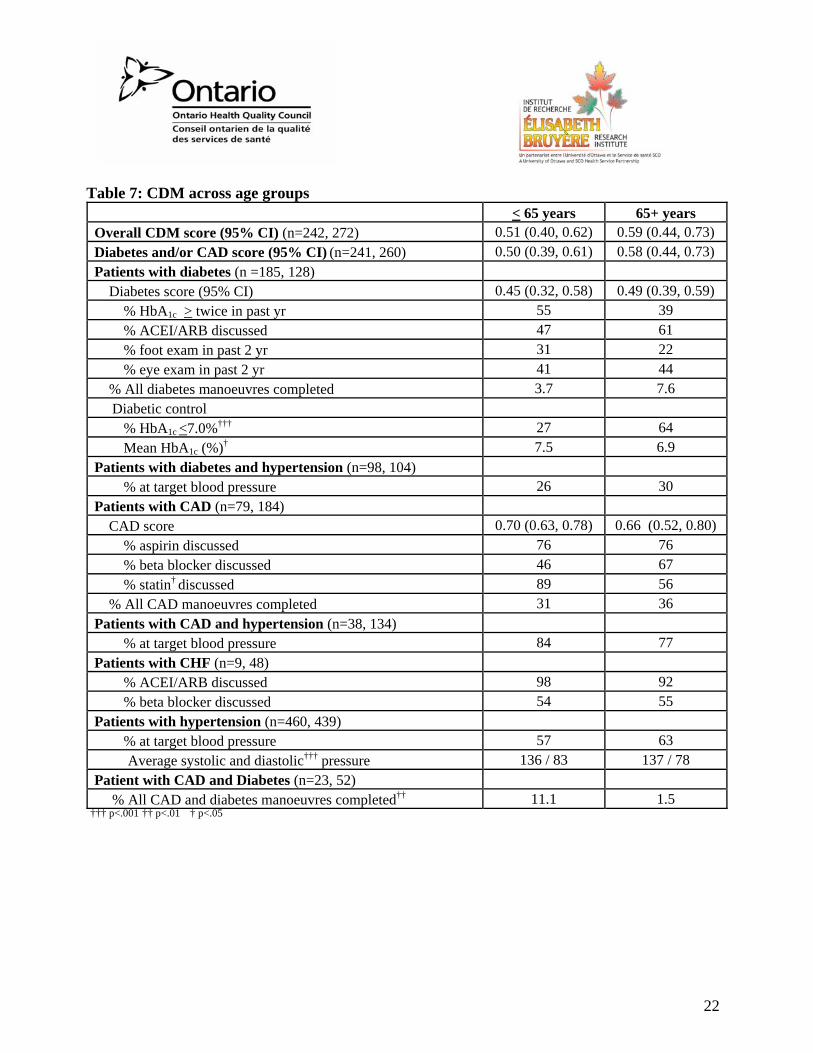
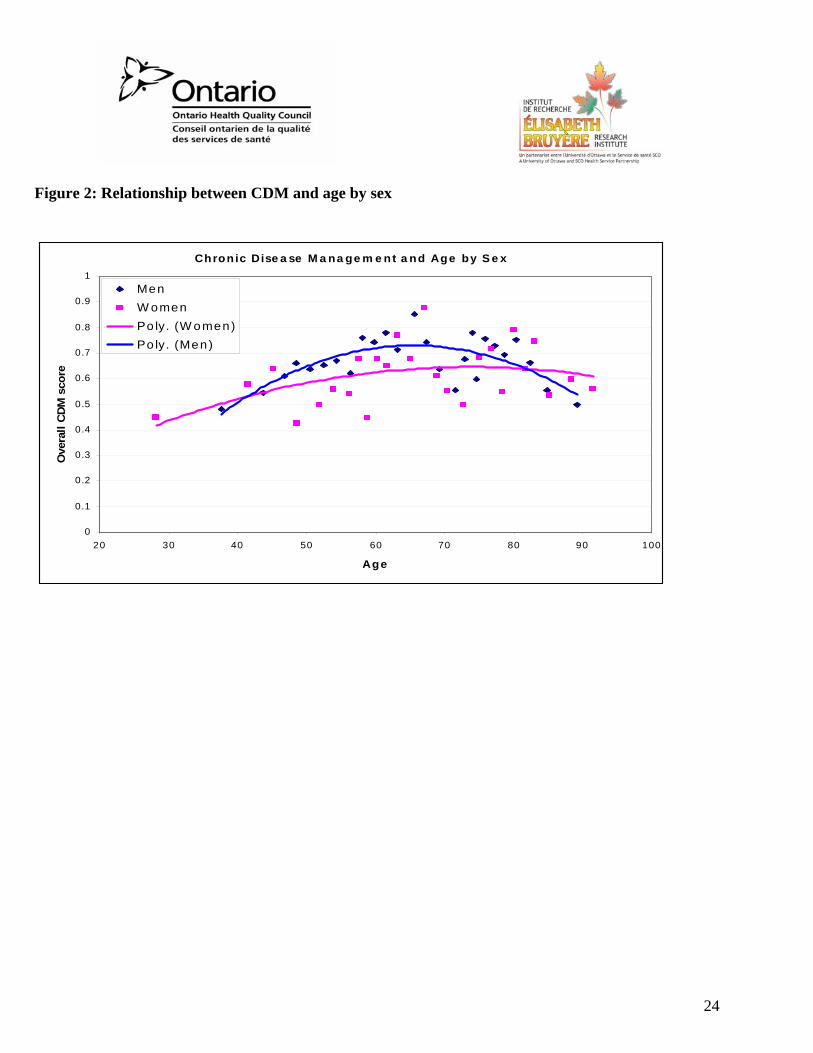
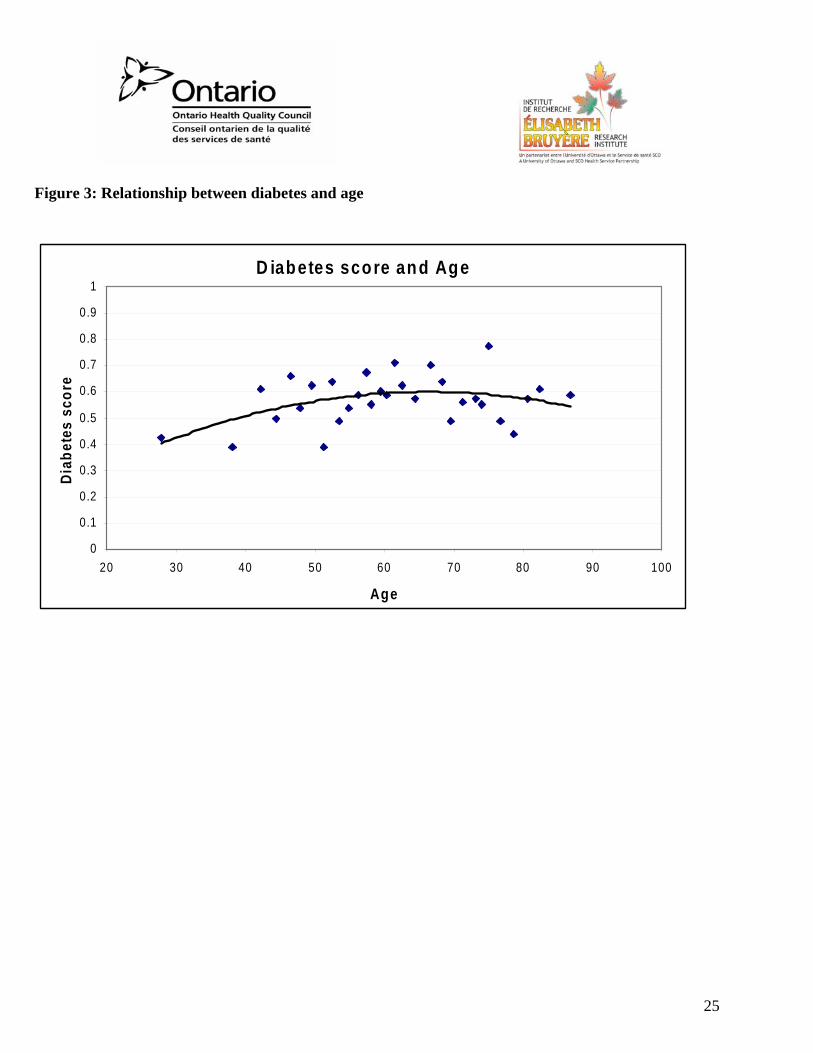
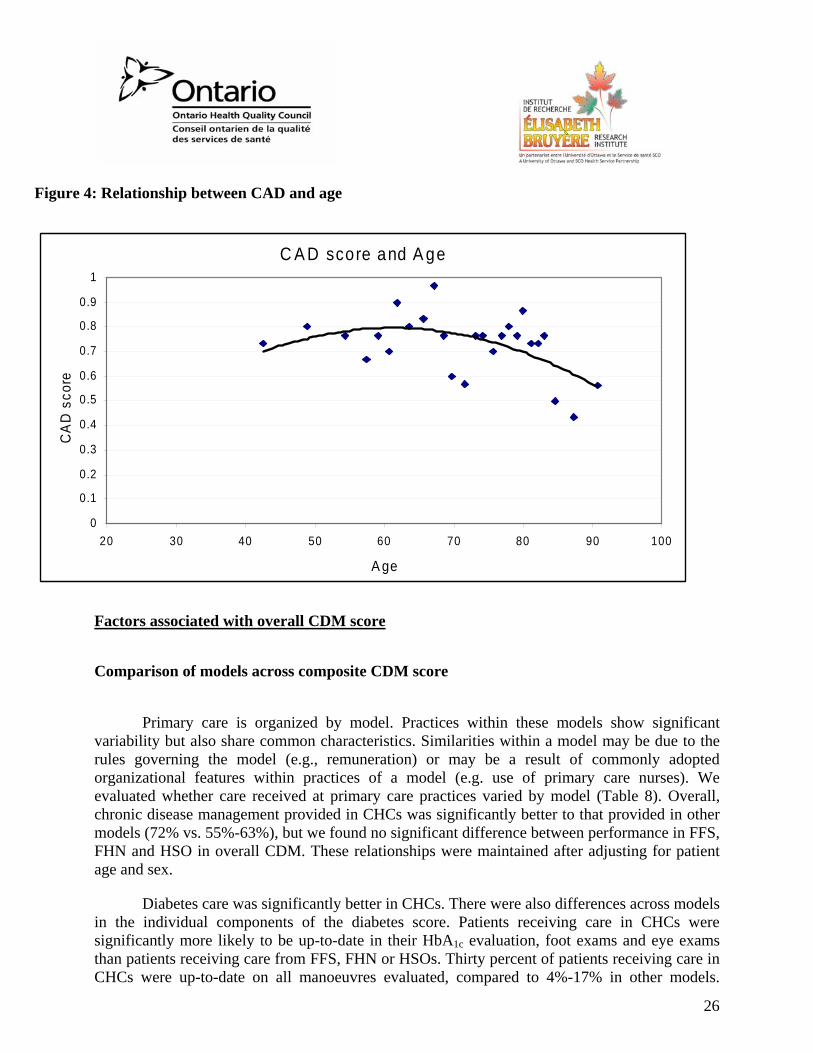
The relationship between age and chronic disease management is best represented in a non-categorical fashion as shown in Figures 1 and 2. In these graphs, each point represents an equal number of patients. Figure 1 depicts the average overall CDM score across age groups. The quality of care appears to drop in the two tails of the age groups; this relationship is especially evident in males (Figure 2). The relationship between age and diabetes management (Figure 3) and age and CAD management (Figure 4) are also shown.

21
Table 6: CDM by sex Men Women Overall CDM score ††† (95% CI) (n=256, 258) 0.64 (0.51, 0.77) 0.49 (0.38, 0.59) Diabetes, CAD score (95% CI) ††† (n=248, 253) 0.63 (0.50, 0.76) 0.48 (0.37, 0.59) Patients with diabetes (n=148, 165) Diabetes score (95% CI) 0.49 (0.31, 0.67) 0.45 (0.38, 0.51)
% HbA1c > twice in past yr 56 41 % ACEI/ARB discussed 66 44 % foot exam in past 2 yr 32 24 % eye exam in past 2 yr 32 50
% All diabetes manoeuvres completed 8.2 3.5 Diabetic control
% HbA1c <7.0% 44 49 Mean HbA1c (%) 7.1 7.3
Patients with diabetes and hypertension (n=99, 103) % at target blood pressure 34 22
Patients with CAD (n=143, 120) CAD score† 0.77 (0.71, 0.82) 0.55 (0.35, 0.75)
% aspirin discussed 81 70 % beta blocker discussed 69 52 % statin†† discussed 81 43
% All CAD manoeuvres completed 45 22 Patients with CAD and hypertension (n=86, 86)
% at target blood pressure††† 94 59 Patients with CHF (n=29, 28)
% ACEI/ARB discussed 98 91 % beta blocker discussed 62 50
Patients with hypertension (n=416, 483) % at target blood pressure 64 56 Average systolic and diastolic pressure 134/ 82 138/ 80
Patients with CAD and Diabetes (n=43, 32) % All CAD and diabetes manoeuvres completed 5.4 3.3
††† p<.001 †† p<.01 † p<.05
22
Table 7: CDM across age groups < 65 years 65+ years Overall CDM score (95% CI) (n=242, 272) 0.51 (0.40, 0.62) 0.59 (0.44, 0.73) Diabetes and/or CAD score (95% CI) (n=241, 260) 0.50 (0.39, 0.61) 0.58 (0.44, 0.73) Patients with diabetes (n =185, 128) Diabetes score (95% CI) 0.45 (0.32, 0.58) 0.49 (0.39, 0.59)
% HbA1c > twice in past yr 55 39 % ACEI/ARB discussed 47 61 % foot exam in past 2 yr 31 22 % eye exam in past 2 yr 41 44
% All diabetes manoeuvres completed 3.7 7.6 Diabetic control
% HbA1c <7.0%††† 27 64 Mean HbA1c (%)† 7.5 6.9
Patients with diabetes and hypertension (n=98, 104) % at target blood pressure 26 30
Patients with CAD (n=79, 184) CAD score 0.70 (0.63, 0.78) 0.66 (0.52, 0.80)
% aspirin discussed 76 76 % beta blocker discussed 46 67 % statin† discussed 89 56
% All CAD manoeuvres completed 31 36 Patients with CAD and hypertension (n=38, 134)
% at target blood pressure 84 77 Patients with CHF (n=9, 48)
% ACEI/ARB discussed 98 92 % beta blocker discussed 54 55
Patients with hypertension (n=460, 439) % at target blood pressure 57 63 Average systolic and diastolic††† pressure 136 / 83 137 / 78
Patient with CAD and Diabetes (n=23, 52) % All CAD and diabetes manoeuvres completed†† 11.1 1.5
††† p<.001 †† p<.01 † p<.05
23
Figure 1: Relationship between CDM and age
C h ro n ic D isease M anagem ent an d Ag e
0
0.1
0.2
0.3
0.4
0.5
0.6
0.7
0.8
0.9
1
20 30 40 50 60 70 80 90 100
Age
Ove
rall
CD
M s
core
24
Figure 2: Relationship between CDM and age by sex
Chronic Dise a se M a na ge m e nt a nd Age by S e x
0
0.1
0.2
0.3
0.4
0.5
0.6
0.7
0.8
0.9
1
20 30 40 50 60 70 80 90 100
Age
Ove
rall
CDM
sco
re
MenW omenPo ly. (W omen)Po ly. (Men)
25
Figure 3: Relationship between diabetes and age
D iabetes score and Age
0
0.1
0.2
0.3
0.4
0.5
0.6
0.7
0.8
0.9
1
20 30 40 50 60 70 80 90 100
Age
Diab
etes
sco
re
26
Figure 4: Relationship between CAD and age
C A D score and A ge
0
0.1
0.2
0.3
0.4
0.5
0.6
0.7
0.8
0.9
1
20 30 40 50 60 70 80 90 100
A ge
CA
D s
core
Factors associated with overall CDM score
Comparison of models across composite CDM score
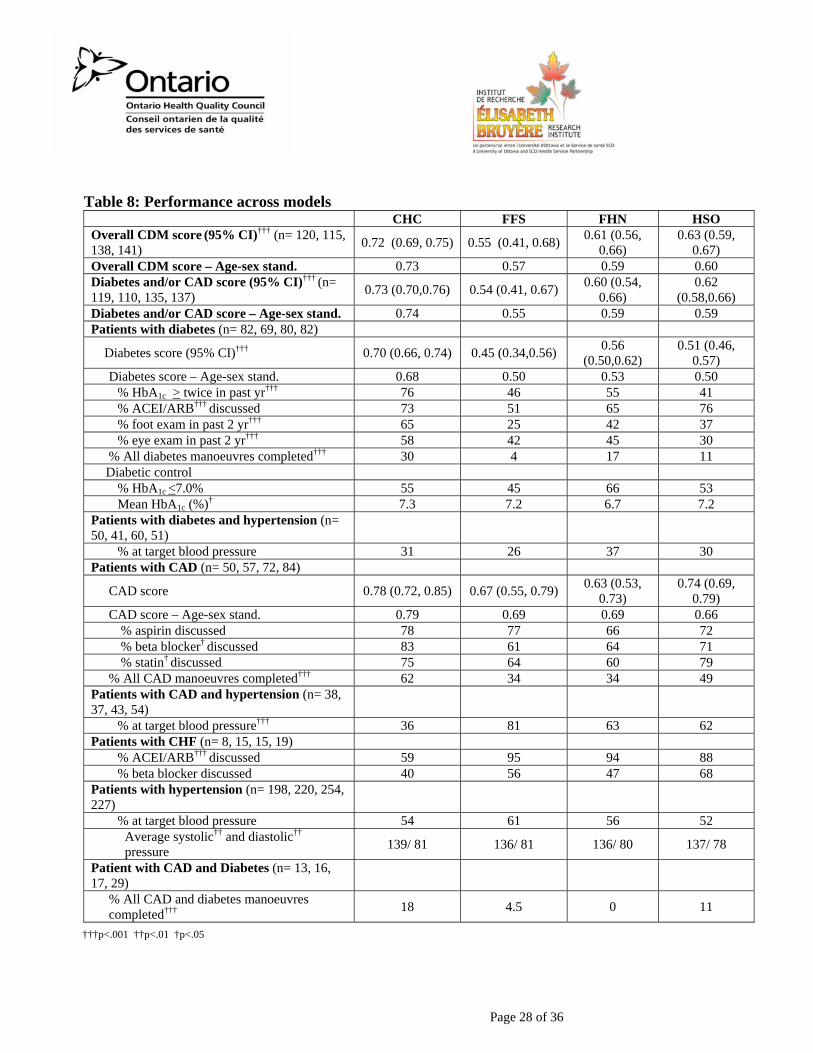
Primary care is organized by model. Practices within these models show significant variability but also share common characteristics. Similarities within a model may be due to the rules governing the model (e.g., remuneration) or may be a result of commonly adopted organizational features within practices of a model (e.g. use of primary care nurses). We evaluated whether care received at primary care practices varied by model (Table 8). Overall, chronic disease management provided in CHCs was significantly better to that provided in other models (72% vs. 55%-63%), but we found no significant difference between performance in FFS, FHN and HSO in overall CDM. These relationships were maintained after adjusting for patient age and sex.
Diabetes care was significantly better in CHCs. There were also differences across models in the individual components of the diabetes score. Patients receiving care in CHCs were significantly more likely to be up-to-date in their HbA1c evaluation, foot exams and eye exams than patients receiving care from FFS, FHN or HSOs. Thirty percent of patients receiving care in CHCs were up-to-date on all manoeuvres evaluated, compared to 4%-17% in other models.
27
Despite better adherence to recommended guidelines in CHCs, including frequency of HbA1c evaluation, the extent of blood glucose control (reflected by the proportion of patients at target HbA1c levels) did not differ across models.
There were no statistically significant differences across models in the score for medical management of CAD. However, patients receiving care in CHCs were more likely to have received all recommended care for CAD, including recommendations for beta blockers and statins. Nonetheless, considerably fewer CHC patients with CAD and a diagnosis of hypertension had blood pressure measurements within target values (36% vs. 62%- 81%).
Patients with CHF attending CHCs were less likely to have discussed ACEI or ARBs (59%) than those attending practices of other models (88%-95%). Overall, 18% of CHC patients with CAD and diabetes were up-to-date on all the recommended manoeuvres evaluated. This was significantly different from FHNs (0%) up-to-date.
Page 28 of 36
Table 8: Performance across models
CHC FFS FHN HSO Overall CDM score (95% CI)††† (n= 120, 115, 138, 141) 0.72 (0.69, 0.75) 0.55 (0.41, 0.68) 0.61 (0.56,
0.66) 0.63 (0.59,
0.67) Overall CDM score – Age-sex stand. 0.73 0.57 0.59 0.60 Diabetes and/or CAD score (95% CI)††† (n= 119, 110, 135, 137) 0.73 (0.70,0.76) 0.54 (0.41, 0.67) 0.60 (0.54,
0.66) 0.62
(0.58,0.66) Diabetes and/or CAD score – Age-sex stand. 0.74 0.55 0.59 0.59 Patients with diabetes (n= 82, 69, 80, 82)
Diabetes score (95% CI)††† 0.70 (0.66, 0.74) 0.45 (0.34,0.56) 0.56 (0.50,0.62)
0.51 (0.46, 0.57)
Diabetes score – Age-sex stand. 0.68 0.50 0.53 0.50 % HbA1c > twice in past yr††† 76 46 55 41 % ACEI/ARB††† discussed 73 51 65 76 % foot exam in past 2 yr††† 65 25 42 37 % eye exam in past 2 yr††† 58 42 45 30
% All diabetes manoeuvres completed††† 30 4 17 11 Diabetic control
% HbA1c <7.0% 55 45 66 53 Mean HbA1c (%)† 7.3 7.2 6.7 7.2
Patients with diabetes and hypertension (n= 50, 41, 60, 51)
% at target blood pressure 31 26 37 30 Patients with CAD (n= 50, 57, 72, 84)
CAD score 0.78 (0.72, 0.85) 0.67 (0.55, 0.79) 0.63 (0.53, 0.73)
0.74 (0.69, 0.79)
CAD score – Age-sex stand. 0.79 0.69 0.69 0.66 % aspirin discussed 78 77 66 72 % beta blocker† discussed 83 61 64 71 % statin† discussed 75 64 60 79
% All CAD manoeuvres completed††† 62 34 34 49 Patients with CAD and hypertension (n= 38, 37, 43, 54)
% at target blood pressure††† 36 81 63 62 Patients with CHF (n= 8, 15, 15, 19)
% ACEI/ARB††† discussed 59 95 94 88 % beta blocker discussed 40 56 47 68
Patients with hypertension (n= 198, 220, 254, 227)
% at target blood pressure 54 61 56 52 Average systolic†† and diastolic†† pressure 139/ 81 136/ 81 136/ 80 137/ 78
Patient with CAD and Diabetes (n= 13, 16, 17, 29)
% All CAD and diabetes manoeuvres completed††† 18 4.5 0 11
†††p<.001 ††p<.01 †p<.05
Page 29 of 36 15/05/2008
Factors associated with CDM
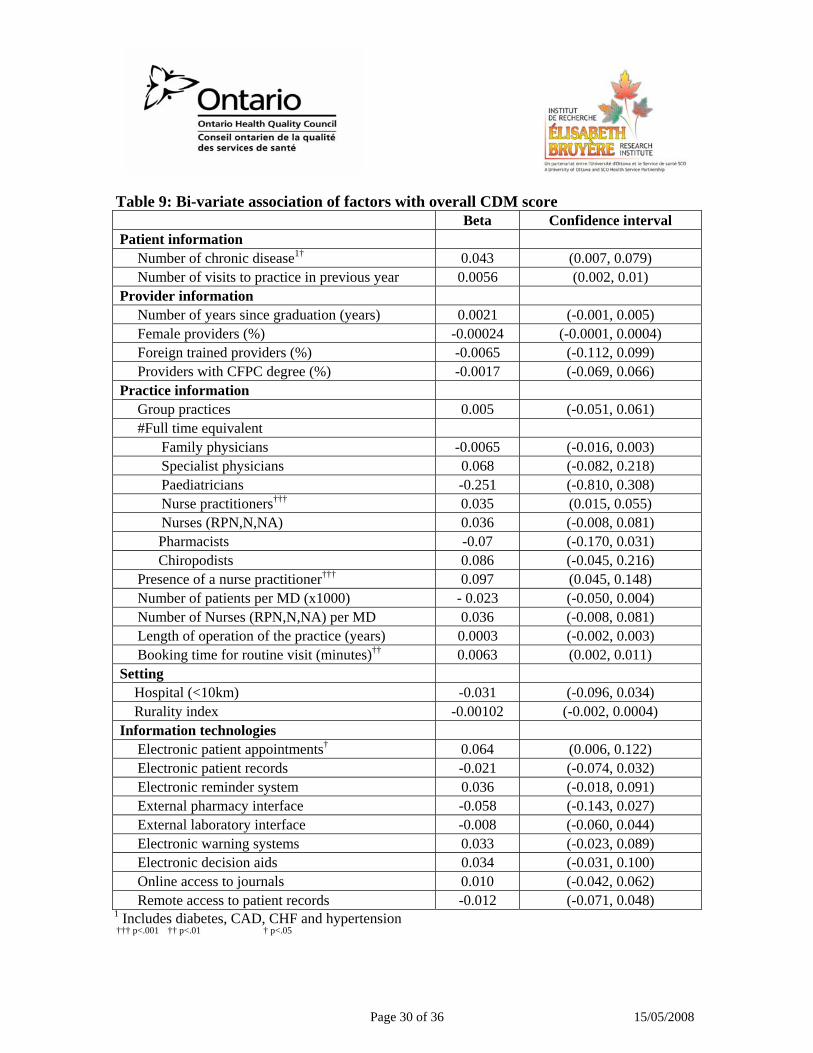
Table 9 shows the results of the bi-variate association between CDM and the patient, provider and practice factors evaluated. Factors that were significantly associated with this composite score are identified by the symbol †. For example, having more chronic diseases and having more frequent visits to the practice was associated with a higher overall CDM score. We did not find any significant relationship between family physician profile and performance. Several practice characteristics were associated with superior care. Having more NPs on staff, having longer booking intervals for routine visits and the presence of electronic patient appointment systems were associated with better overall CDM.
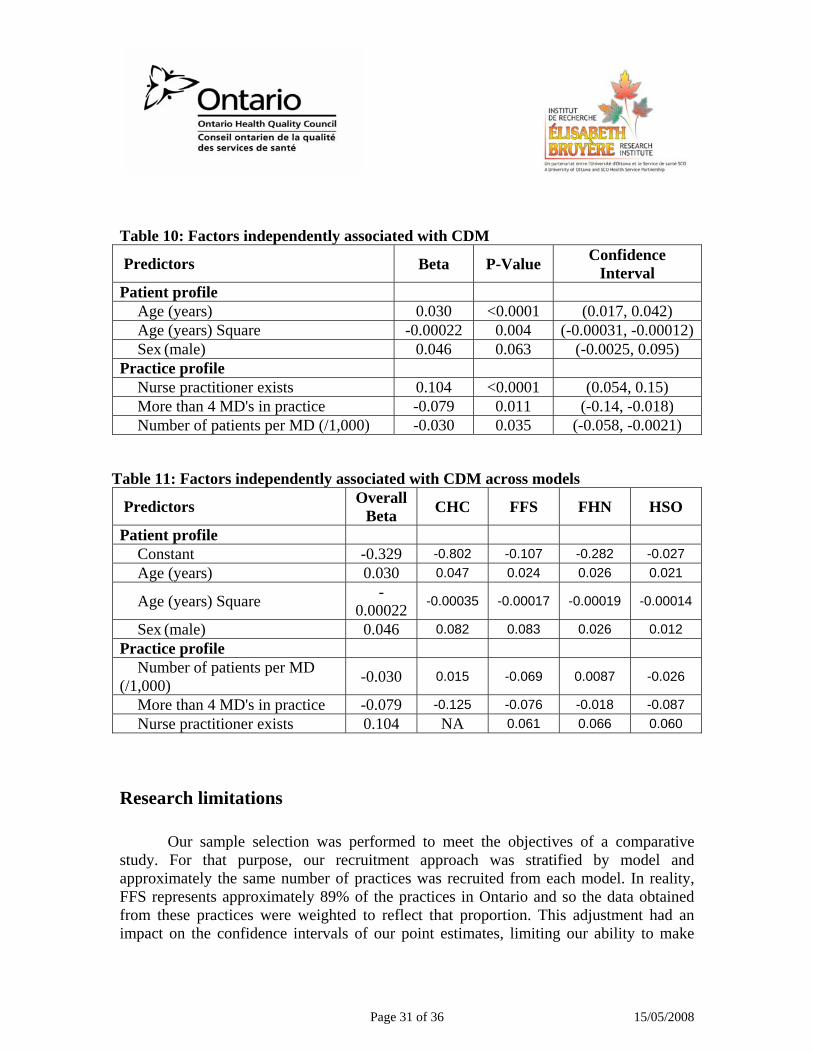
The patient and practice characteristics listed in Table 10 are significant and independent predictors of overall CDM resulting from multiple regression analysis. These variables accounted for 10% (R2=0.10) of the variability in CDM. Patient age was a significant predictor of performance but sex was not. The relationship between age and CDM is not linear. Increases in age are associated with increased quality of care for ages up to age 68, after which there is a slight decline with increasing age. Having one or more NP on staff is associated with nearly 10.4% enhanced CDM. The positive relationship between the presence of an NP and CDM score was consistent across models. FFS practices employing an NP had a CDM score 11% higher than those without an NP. Larger practices had lower CDM scores. In fact, the performance of practices with more than four family physicians had lower adherence to recommended guidelines by 7.9%. Finally, as the average number of patients managed per family physician in a practice increased, the performance decreased. Practices in which the average patient load was 2,500 had a 3% lower quality of care compared to practices with an average load of 1,500. This relationship was especially strong in FFS practices. For example, in these practices, performance dropped by 6.5% when the patient number increased from 1,000 to 2,000 (bivariate analysis).
A stratified analysis, by model is shown in Table 11. The results indicate that, with the exception of the patient load variable (Number of patients per MD (/1,000)) which appears to be driven by the influence of FFS practices, the predictor variables are rather consistent across models. Because stratification results in smaller number of cases in each analysis, we consider only the beta values, not p values in the interpretation of the results. Larger practices are associated with lower levels of care in CHC, FFS, and HSO, and to a lesser extent FHNs. The impact of the presence of a nurse practitioner cannot be evaluated in CHCs because all practices in that model have nurse practitioners. In all other models, the presence of a nurse practitioner is associated with approximately 6% improvement in care.
Page 30 of 36 15/05/2008
Table 9: Bi-variate association of factors with overall CDM score
Beta Confidence interval Patient information
Number of chronic disease1† 0.043 (0.007, 0.079) Number of visits to practice in previous year 0.0056 (0.002, 0.01)
Provider information Number of years since graduation (years) 0.0021 (-0.001, 0.005) Female providers (%) -0.00024 (-0.0001, 0.0004) Foreign trained providers (%) -0.0065 (-0.112, 0.099) Providers with CFPC degree (%) -0.0017 (-0.069, 0.066)
Practice information Group practices 0.005 (-0.051, 0.061) #Full time equivalent
Family physicians -0.0065 (-0.016, 0.003) Specialist physicians 0.068 (-0.082, 0.218) Paediatricians -0.251 (-0.810, 0.308) Nurse practitioners††† 0.035 (0.015, 0.055) Nurses (RPN,N,NA) 0.036 (-0.008, 0.081) Pharmacists -0.07 (-0.170, 0.031) Chiropodists 0.086 (-0.045, 0.216)
Presence of a nurse practitioner††† 0.097 (0.045, 0.148) Number of patients per MD (x1000) - 0.023 (-0.050, 0.004) Number of Nurses (RPN,N,NA) per MD 0.036 (-0.008, 0.081) Length of operation of the practice (years) 0.0003 (-0.002, 0.003) Booking time for routine visit (minutes)†† 0.0063 (0.002, 0.011)
Setting Hospital (<10km) -0.031 (-0.096, 0.034) Rurality index -0.00102 (-0.002, 0.0004)
Information technologies Electronic patient appointments† 0.064 (0.006, 0.122) Electronic patient records -0.021 (-0.074, 0.032) Electronic reminder system 0.036 (-0.018, 0.091) External pharmacy interface -0.058 (-0.143, 0.027) External laboratory interface -0.008 (-0.060, 0.044) Electronic warning systems 0.033 (-0.023, 0.089) Electronic decision aids 0.034 (-0.031, 0.100) Online access to journals 0.010 (-0.042, 0.062) Remote access to patient records -0.012 (-0.071, 0.048)
1 Includes diabetes, CAD, CHF and hypertension ††† p<.001 †† p<.01 † p<.05
Page 31 of 36 15/05/2008
Table 10: Factors independently associated with CDM
Predictors Beta P-Value Confidence Interval
Patient profile Age (years) 0.030 <0.0001 (0.017, 0.042) Age (years) Square -0.00022 0.004 (-0.00031, -0.00012)Sex (male) 0.046 0.063 (-0.0025, 0.095)
Practice profile Nurse practitioner exists 0.104 <0.0001 (0.054, 0.15) More than 4 MD's in practice -0.079 0.011 (-0.14, -0.018) Number of patients per MD (/1,000) -0.030 0.035 (-0.058, -0.0021)
Table 11: Factors independently associated with CDM across models
Predictors Overall Beta CHC FFS FHN HSO
Patient profile Constant -0.329 -0.802 -0.107 -0.282 -0.027 Age (years) 0.030 0.047 0.024 0.026 0.021
Age (years) Square -0.00022 -0.00035 -0.00017 -0.00019 -0.00014
Sex (male) 0.046 0.082 0.083 0.026 0.012 Practice profile
Number of patients per MD (/1,000) -0.030 0.015 -0.069 0.0087 -0.026
More than 4 MD's in practice -0.079 -0.125 -0.076 -0.018 -0.087 Nurse practitioner exists 0.104 NA 0.061 0.066 0.060
Research limitations
Our sample selection was performed to meet the objectives of a comparative study. For that purpose, our recruitment approach was stratified by model and approximately the same number of practices was recruited from each model. In reality, FFS represents approximately 89% of the practices in Ontario and so the data obtained from these practices were weighted to reflect that proportion. This adjustment had an impact on the confidence intervals of our point estimates, limiting our ability to make
Page 32 of 36 15/05/2008
inferences. To better reflect the experience of Ontarians, practices serving a larger population were weighted more heavily in the estimate. Therefore, large FFS practices contributed more to the estimates. For example, data from a FFS serving 12,000 were weighted approximately ten times more than one serving 1,200 patients. For example, compared to an HSO practice of 1,200, the weight its data would contribute 340 times more heavily. There are two concerns with this weighting: 1) if practices happen to be outliers in their performance, the overall estimate will be skewed. 2) even if they adequately represent the performance of practices that size, we cannot be sure that the proportion of very large practices within our sample is representative of the proportion of these practice in Ontario. As an example, among the 313 patients evaluated for appropriateness of diabetes management, 16% were found to be up-to-date in their manoeuvres, 7.2% among the 69 FFS patients only. However, our estimate of the overall up-to-datedness in Ontario is 5.5% because of the contribution of some large FFS practices with poor performance.
Our sample selection was also limited by the northern geographical boundaries established for data collection. The results of this study cannot be extrapolated to northern regions excluded from the sampling frame. Our ability to identify practices within a model was also limited. Within the practices studied, the provider sample was self-selected, making it difficult to extrapolate the findings for provider factors on a provincial level. While, to our knowledge, this is the largest study of its kind in Ontario, it remains that the number of cases studied are relatively small, and potentially important association may have gone undetected because of lack of statistical power.
We relied on documented care manoeuvres to determine the extent of adherence to guidelines. It is impossible to know what care was provided but not recorded. We cannot depend on recorded coordination and continuity of care between providers (for example, between eye doctors and MDs for diabetic eye care). This limitation will impact our ability to estimate the quality of care in the province; our measurements will likely underestimate the level of quality. To the extent that documentation practices may vary by model, it may influence the reliability of our comparisons between models, but is unlikely to have a significant impact on performance comparisons by patient factors.
We captured the providers’ intent for care. A medication that was documented as recommended was counted as appropriate, regardless of patient compliance. What patients do with the advice given to them will depend on many factors, including potential financial barriers, cultural perceptions and how the information itself was presented by the provider. As such, our estimates represent the quality of the providers’ intent, not the quality of the care received. In addition, chart abstractors looked back in charts only two years. It is possible and indeed likely that some of the recommended manoeuvres had been attempted and rejected due to intolerable side effects or other
Page 33 of 36 15/05/2008
reasons prior to that two year window. If so, we would not capture that data and quality of care would appear poorer.
Acknowledgements
Funding for data collection was provided by the Ontario Ministry of Health and Long-Term Care Primary Health Care Transition Fund. The views expressed in this report are the views of the authors and do not necessarily reflect those of the Ontario Ministry of Health and Long-Term Care.
Page 34 of 36 15/05/2008
Endnotes
1 Schultz SE, Kopec JA. Impact of chronic conditions. Health Reports / Statistics Canada, Canadian Centre for Health Information. 2003; 14: 41-53. 2 World Health Organization. An estimation of the economic impact of chronic noncommunicable diseases in selected countries. 2006. 3 World Health Organization. Preventing chronic diseases: a vital investment: WHO global report. 2003. 4 Institute for Clinical Evaluative Sciences. Primary Care in Ontario 2006. 5 Rothman AA, Wagner EH. Chronic Illness Management: What is the role of primary care? Annals of Internal Medicine. 2003. 138: 256-261. 6 Berra K, Miller NH, Fair JM. Cardiovascular disease prevention and disease management: A critical role for nursing. Journal of Cardiopulmonary Rehabilitation. 2006; 26:197-206. 7 Parchman ML, Noël PH, Lee S. Primary care attributes, health care system hassles, and chronic illness. Medical Care. 2005; 43: 1123-1129. 8 Muldoon LK, Hogg WE, Levitt M. Primary care and primary health care. What is the difference? Canadian Journal of Public Health 2006; Revue: 409-411. 9 Muldoon L, Rowan MS, Geneau R, Hogg W, Coulson D. Models of primary care service delivery in Ontario: why such diversity? Healthcare Management Forum / Canadian College of Health Service Executives. 2006; 19:18-23. 10 Thorne S. Patient-provider communication in chronic illness: a health promotion window of opportunity. Family & Community Health. 2006;29:4S-11s. 11 Wagner EH, Glasgow RE, Davis C et al. Quality improvement in chronic illness care: a collaborative approach. The Joint Commission Journal on Quality Improvement. 2001;27:63-80. 12 Morgan MW, Zamora NE, Hindmarsh MF. An inconvenient truth: a sustainable healthcare system requires chronic disease prevention and management transformation. Healthcarepapers. 2007;7:6-23. 13 Crosson JC, Ohman-Strickland PA, Hahn KA et al. Electronic medical records and diabetes quality of care: results from a sample of family medicine practices. Annals of Family Medicine. 2007;5:209-215. 14 Harris MF, Zwar NA. Care of patients with chronic disease: the challenge for general practice. The Medical Journal of Australia. 2007;187:104-107. 15 McGlynn EA, Asch SM, Adams J et al. The quality of health care delivered to adults in the United States. The New England Journal of Medicine. 2003;348:2635-2645.

Page 35 of 36 15/05/2008
16 Burstein JM, Yan R, Weller I, Abramson BL. Management of congestive heart failure: a gender gap may still exist. Observations from a contemporary cohort. BMC Cardiovascular Disorders. 2003;3:1. 17 Ko DT, Mamdani M, Alter DA. Lipid-lowering therapy with statins in high-risk elderly patients: the treatment-risk paradox. The Journal of The American Medical Association. 2004;291:1864-1870 18 Bodenheimer T, Wang MC, Rundall TG et al. What are the facilitators and barriers in physician organizations' use of care management processes? Joint Commission Journal on Quality and Safety. 2004;30:505-514. 19 Bower P, Campbell S, Bojke C, Sibbald B. Team structure, team climate and the quality of care in primary care: an observational study. Quality and Safety in Health Care. 2003;12:273-279. 20 Campbell J, Ramsay J, Green J. Practice size: impact on consultation length, workload, and patient assessment of care. The British Journal of General Practice. 2001;51:644-650. 21 College of Family Physicians of Canada. National Family Physician Workforce Survey 2001. 2007. 22 Shi L, Starfield B, Xu J. Validating the Adult Primary Care Assessment Tool. Journal of Family Practice. 2001;50(2):161. 23 Haggerty J, Centre De Recherche Du Centre Hospitalier De l'Université de Montréal (CHUM). Accessibility and Continuity of Primary Care in Quebec, Annex 2: Primary Care Assessment Questionnaire. 2004. Ref Type: Personal Communication 24 Haley, L. Regular eye care essential for diabetic patients. The Medical Post 38[41]. 11-12-2002. 25 Canadian Diabetes Association. Canadian Diabetes Association 2003 Clinical Practice Guidelines for the Prevention and Management of Diabetes in Canada. 2003. 26 Wilt TJ, Bloomfield HE, MacDonald R et al. Effectiveness of statin therapy in adults with coronary heart disease. Arch Intern Med. 2004;164:1427-1436. 27 Canadian Cardiovascular Society 1997 Consensus Conference on the Evaluation and Management of Chronic Ischemic Heart Disease. The Canadian Journal of Cardiology. 1998;14 Suppl C:1C-23c. 28 Ontario Drug Therapy Guidelines for Chronic Heart Failure in Primary Care's. first edition, 1-40. 2000. 29 Liu P, Arnold JM, Belenkie I et al. The 2002/3 Canadian Cardiovascular Society consensus guideline update for the diagnosis and management of heart failure. The Canadian Journal of Cardiology. 2003;19:347-356. 30 Hemmelgarn BR, Zarnke KB, Campbell NRC et al. The 2004 Canadian Hypertension Education Program recommendations for the management of hypertension: Part I--Blood pressure measurement, diagnosis and assessment of risk. The Canadian Journal of Cardiology. 2004;20:31-40.

Page 36 of 36 15/05/2008
31 Hunt SA, Baker DW, Chin MH et al. ACC/AHA Guidelines for the Evaluation and Management of Chronic Heart Failure in the Adult: Executive Summary A Report of the American College of Cardiology/American Heart Association Task Force on Practice Guidelines (Committee to Revise the 1995 Guidelines for the Evaluation and Management of Heart Failure): Developed in Collaboration With the International Society for Heart and Lung Transplantation; Endorsed by the Heart Failure Society of America. Circulation. 2001;104:2996-3007. 32 Rathur HM, Boulton AJ. The diabetic foot. [Review]. Clinics in Dermatology. 2007;25:109-120. 33 Whorlow SL, Krum H. Meta-analysis of effect of beta-blocker therapy on mortality in patients with New York Heart Association class IV chronic congestive heart failure. The American Journal of Cardiology. 2000;86:886-889. 34 Statistics Canada. 2006 Community profiles. http://www12.statcan.ca/english/census06/data/profiles/community/. 35 Bloomgarden ZT. Screening for and managing diabetic retinopathy: current approaches. [Review]. American Journal of Health-System Pharmacy. 2007;64:Suppl-14. 36 Saudek CD, Kalyani RR, Derr RL. Assessment of glycemia in diabetes mellitus: hemoglobin A1c. Journal of the Association of Physicians of India. 2005;53:299-305. 37 Hughes DB, Britton ML. Angiotensin-converting enzyme inhibitors or angiotensin II receptor blockers for prevention and treatment of nephropathy associated with type 2 diabetes mellitus. Pharmacotherapy. 2005;25:1602-1620.
Related Documents