63 CHAPTER 3 CHAPTER 3 CHAPTER 3 CHAPTER 3 CONCEPTUAL FRAMEWORK FOR THE STUDY CONCEPTUAL FRAMEWORK FOR THE STUDY CONCEPTUAL FRAMEWORK FOR THE STUDY CONCEPTUAL FRAMEWORK FOR THE STUDY Several conceptual frameworks related to the topic of monitoring education exist in literature and in this chapter; three school effectiveness research models are presented, namely the Creemers model (1994), the Stringfield and Slavin model (1992) and the Scheerens model (1990). These models are included as they provide possible components for monitoring the quality of education in South Africa. Highlighted in particular is the Scheerens model (1990) which is based on an extensive review of school effectiveness research. School effectiveness models utilise a systems thinking approach, identifying indicators into the system (inputs), processes through the system and outputs. Furthermore, the Scheerens model (1990) takes the multilevel nature of relationships within schools into account, as well as causal and reciprocal relationships. For these reasons, the Scheerens model (1990) represents the most likely candidate. However, the literature used to construct the model is from a developed world context and this research takes place within a developing world context. Thus adaptations are needed to reflect the change in context. The adaptations proposed are taken from literature and debates in the field of school effectiveness research, which are relevant for a developing world context. The adaptations resulted in a conceptual model for monitoring education in South Africa. The two main research questions guiding this research are also discussed in light of the conceptual model. 3.1 Introduction The aim of this research is to develop a monitoring system for secondary schools, which can be used to gauge the effectiveness of teaching and learning or the quality of education learners are receiving. The notion of quality in education has been discussed in Chapter 1 as well as in Chapter 2. The use of indicators, which provide the basis for monitoring systems, in order to measure the characteristics of educational systems have been alluded to but not discussed in depth. The idea behind the use of indicators is to identify key aspects that would provide a snapshot of current conditions within the education system. Furthermore, indicators are statistics,

Welcome message from author
This document is posted to help you gain knowledge. Please leave a comment to let me know what you think about it! Share it to your friends and learn new things together.
Transcript

63
CHAPTER 3CHAPTER 3CHAPTER 3CHAPTER 3
CONCEPTUAL FRAMEWORK FOR THE STUDYCONCEPTUAL FRAMEWORK FOR THE STUDYCONCEPTUAL FRAMEWORK FOR THE STUDYCONCEPTUAL FRAMEWORK FOR THE STUDY
Several conceptual frameworks related to the topic of monitoring education exist
in literature and in this chapter; three school effectiveness research models are
presented, namely the Creemers model (1994), the Stringfield and Slavin model
(1992) and the Scheerens model (1990). These models are included as they
provide possible components for monitoring the quality of education in South
Africa. Highlighted in particular is the Scheerens model (1990) which is based on
an extensive review of school effectiveness research. School effectiveness
models utilise a systems thinking approach, identifying indicators into the system
(inputs), processes through the system and outputs. Furthermore, the Scheerens
model (1990) takes the multilevel nature of relationships within schools into
account, as well as causal and reciprocal relationships. For these reasons, the
Scheerens model (1990) represents the most likely candidate. However, the
literature used to construct the model is from a developed world context and this
research takes place within a developing world context. Thus adaptations are
needed to reflect the change in context. The adaptations proposed are taken from
literature and debates in the field of school effectiveness research, which are
relevant for a developing world context. The adaptations resulted in a conceptual
model for monitoring education in South Africa. The two main research questions
guiding this research are also discussed in light of the conceptual model.
3.1 Introduction
The aim of this research is to develop a monitoring system for secondary schools, which can
be used to gauge the effectiveness of teaching and learning or the quality of education
learners are receiving. The notion of quality in education has been discussed in Chapter 1 as
well as in Chapter 2. The use of indicators, which provide the basis for monitoring systems, in
order to measure the characteristics of educational systems have been alluded to but not
discussed in depth.
The idea behind the use of indicators is to identify key aspects that would provide a snapshot
of current conditions within the education system. Furthermore, indicators are statistics,

64
which provide a benchmark against which quality can be evaluated, thus quality can be
monitored (Scheerens et al., 2003). Indicators provide summary information about the
functioning of an area of the system with the intention to inform stakeholders and serve as a
basis from which improvements may be suggested, thus reflecting the condition of an aspect
of the education system or of the system as a whole. Moreover, indicators provide
diagnostics tools from which aims, goals, or expectations can be evaluated and future aims,
goals, or expectations can be identified (Bottani & Tuijnman, 1994). Indicators are the basic
building blocks used to construct conceptual models in school effectiveness research.
In the section to follow (3.2) models of school effectiveness are discussed, with the
Scheerens model (1990) elaborated on in 3.3 This is followed by a comprehensive
discussion of the conceptual model used in this research (3.4) as well as the specific
research questions (3.5).
3.2 School effectiveness models
Indicators are central in monitoring systems based on school effectiveness research. In
recent years, research on school effectiveness using different approaches to educational
effectiveness has been integrated, resulting in the technical and conceptual development in
the field. For example, indicators are carefully considered before including them for study and
the use of multilevel analysis has facilitated the analysis of “nested” data where the central
assumption is that higher-level variables facilitate conditions that enhance effectiveness at
lower-levels (Scheerens et al., 2003). Various models have been developed based on an
integrated approach, such as the Creemers model, Stringfield and Slavin model, as well as
the Scheerens model. These models have three things in common:
� They are conceptualised in terms of a basic systems model with inputs, processes,
and context of schooling;
� They have a multilevel structure, which implies that the school system can be
thought of as an onion with one layer “nested” within another;
� They include complex causal structures, where certain components are dynamic
and certain components are static (Scheerens, 1997).
Various levels, like the layers of an onion, could exist within the school, such as the learner-
level, classroom-level, and the school-level. However, within the education system higher
additional levels could be identified, such as community and parental-level, district-level,
provincial-level, and the national-level. The models discussed, in the section to follow,

65
include various levels ranging from strictly school-based levels (school, classroom, and
learner-level) to broader system levels (such as community and parental-level).
Creemers (1994) developed a model that focused specifically on the classroom-level and
essentials of effective instruction elements, as can be seen in his integrated model for
educational effectiveness developed in 1994. The integrated model developed by Creemers
makes provision for the assumption that higher-level school organisational and contextual
conditions facilitate lower-level conditions. Therefore, the context of the education board
policy targets attainment, material, and financial conditions, which is seen as facilitating
conditions on the school-level. In the same way, school-level aspects such as the school
work plan, school organisation and material conditions facilitate conditions on the classroom-
level. Of importance on a classroom-level, are indicators such as training and experience,
instruction, including method, grouping pattern and educator behaviour. The instruction
component has an effect on effective learning time and the opportunity to learn. Classroom-
level components facilitate conditions on the learner-level and learner achievement. Learner
aptitude, socio-economic status (SES) and peer group are seen as contributing factors to
achievement, while learner achievement has an effect on learner motivation and
perseverance (Scheerens, 1997).
The second model to be discussed is that of Stringfield and Slavin (Stringfield, 1994). The
model developed by Stringfield and Slavin in 1992 is an integrated model known as the
Quality, Appropriateness, Incentive and Time of instruction/Meaningful goals, Attention to
academic focus, Coordination, Recruitment and training as well as Organisation or
QAIT/MACRO for short (Scheerens, 1997). This model of elementary school effects has four
levels, each with its own discernable elements (Stringfield, 1994):
� The learner-level, which includes elements such as ability to understand instruction,
perseverance, opportunity and the quality of instruction;
� The level of groups providing school relevant instruction, including parents, educators,
and persons giving additional academic support. Elements at this level are quality,
appropriateness, incentives and time;
� The school-level, including meaningful goals, attention to academic functioning,
coordination of curricula and instruction, recruitment and development of staff, and the
organisation of the school to support universal learner learning;
� The groups-beyond-the-school-level include the community, school district, state
sources of programming, funding, and assessment

66
The third model is that of Scheerens (1990), which is discussed in detail in the section to
follow. The model is based on a context-input-process-output model that originated in
systems thinking and has been widely used in school effectiveness research (Scheerens,
2000). Incorporating systems thinking in the model, in which indicators associated with the
inputs into the system, the processes through the system and the output are central, this
model takes the multilevel nature of relationships into account as well as the intermediate
causal effects and reciprocal relationships (Scheerens, 1992). These characteristics make
the model suitable as the basis from which a conceptual model for monitoring education in
South Africa can be developed.
3.3 Scheeren’s model for school effectiveness research
This model developed by Scheerens (1990) is based on a review of school effectiveness
research. The model developed by Scheerens (1990) can be called an integrated model as it
draws heavily on production functions, instructional effectiveness, and school effectiveness
literature. Essentially the Scheerens model is used as the basis to carry out meta-analyses
as well as multilevel analyses (Scheerens, 2000). According to Scheerens (2000, p. 55) the
“choice of variables in this model is supported by the ‘review of reviews’ on school
effectiveness research.”
As with the two models discussed above, the Scheerens model sees higher-level conditions
as facilitating lower-level conditions (Scheerens & Bosker, 1997). In addition, the model
makes provision for the nested structure found within the education system. The use of data
on the different levels allows for the analysis of variation between units and also allows better
adjustments to be made so that it is possible to draw more valid causal inferences
(Scheerens et al., 2003). Statistical models based on the conceptual model make across-
level interpretations possible for the investigation of direct effects, indirect effects and
interaction effects. Thus it is possible to investigate the direct effects of school characteristics
on learner outputs but also indirect effects mediated by classroom-level conditions. The
interactions of these are then interpreted as values of higher-level variables working in
conjunction with intermediary conditions (Scheerens, 1997). Figure 3.1 illustrates the
Scheerens (1990) model.

67
Figure 3.1 School effectiveness model as developed by Scheerens (1990)
The school context variables included in the Scheerens model (1990) are seen as conditions
from the broader school environment. Elements included in the Scheerens model (1990) are
achievement stimulants from higher administrative levels that refer to whether achievement
standards are set by the school district and other administrative levels, educational
consumerism that refers to whether parents have a free choice of which school there children
will attend. Finally, Scheerens includes a number of co-variables such as school size, school
location, and learner composition, which relate to the demographics of the school (Scheerens
et al., 2003). Furthermore, the context in the Scheerens model (1990) is seen as having a
direct effect on the process indicators.
The input variables in the Scheerens model (1990) include teacher experience, per-pupil
expenditure, and parent support. Teacher experience could be measured in terms of the
number of years the teacher has been teaching. Per-pupil expenditure is related to the
financial resources available to the school. Finally, parental support is the support provided
by parents to school activities and learners’ learning (see also Scheerens et al., 2003).

68
In the Scheerens model (1990), the process mechanisms can be divided into two levels,
namely the school-level and the classroom-level. Variables included on the school-level
include the following (see also Scheerens et al., 2003):
� The degree of an achievement oriented policy such as whether there is a set of
achievement standards and whether schools measure achievement against local
constituency standards.
� Educational leadership refers to the amount of time spent on educational matters as well
as appraisal of educators and the amount of time dedicated to instructional matters
during staff meetings.
� Consensus and cooperative planning of educators are articulated in terms of the type
and frequency of meetings, nature of cooperation as well as importance attributed to
cooperation.
� Quality of curricula is seen as the cornerstone of the most important function of
education. Quality of curricula includes indicating clear targets, formal structure, and the
degree to which the specified content is covered.
� Orderly environment refers to the school climate in which there is good discipline and the
learner behaviour is considered acceptable.
� Evaluative potential expresses the aspirations and possibilities of schools to make use of
evaluation mechanisms with the aim of improving learning and feedback at various
levels within the school.
Variables on a classroom-level include:
� Time on task as defined in terms of instruction time (Scheerens et al., 2003), the
duration of lesson periods spent on task related activities as well as whether or not
homework is given (Scheerens, 1990).
� Structured teaching which is seen in the use of lesson plans, preparation and use of
materials (see also Scheerens et al., 2003) as well as stating objectives clearly,
providing well sequenced units and providing feedback (Scheerens, 1990).
� Opportunity to learn which can be thought of as the overlap of what is assessed and
what has been covered in lessons (Scheerens, 1990).
� High expectations of learner progress, which is the degree to which educators strive for
high learner achievement (see also Scheerens et al., 2003).
� Degree of evaluation and monitoring of learner progress as seen in the evaluation of
assessment results in order to ascertain learner progress (see also Scheerens et al.,
2003), as well as the frequency of assessments and standardised tests (Scheerens,
1999).

69
� Reinforcement, which is the extent to which assignments are discussed, whether
mistakes are corrected, as well as the frequency of discussing progress (see also
Scheerens et al., 2003).
The final component of the Scheerens (1990) model is the output in which only one variable
or factor has been included which is in line with school effectiveness research namely learner
achievement. However, Scheerens (1990) stipulates that learner achievement is not taken on
raw scores but is evaluated in light of previous achievement, intelligence, as well as socio-
economic status.
3.4 Model for monitoring education in South Africa
According to Scheerens (2000, p. 36):
In developing countries there is a strong predominance of studies of the
education production function type. Relatively few of these studies have been
expanded to include school organizational and instructional variables.
Of the three models of school effectiveness discussed above, the Scheerens model (1990)
would possibly be best suited as a framework for monitoring education in South Africa as it
does include production functions, instructional effectiveness, and school effectiveness
variables. Not only does the model include the various levels of the school system, it is also
based on a ‘review of reviews’ providing a framework for meta-analyses and re-analyses of
international datasets (Scheerens, 2000). The literature used to develop this model comes
predominantly from the developed world whereas the current research takes place within a
developing country context. Therefore the applicability of the model needs to be evaluated
against the backdrop of evidence emerging from developing countries.
In a literature review carried out on school effectiveness research in developing countries
Fuller and Clark (1994) found that a substantial number of research projects were
undertaken in primary schools with a limited number of research projects undertaken at the
secondary school-level. In addition, factors which are in the control of policymakers and
which are easier to measure such as average class size and textbook supply have received
considerable attention with very little work done on what occurs inside the classroom. Fuller
and Clark go on to argue that only modest progress has been made in specifying which
conditions are likely to impact learner performance and that little work is done showing how
basic inputs are mobilised within classrooms. Furthermore, Fuller and Clark are of the

70
contention that accumulating more evidence without linking inputs to educator practices is a
less than fruitful exercise and that local context highlighting cultural variation is an important
aspect that has been ignored. Local conditions highlighted by Fuller and Clark include the
family’s demand for schooling, the school’s aggregated influence on learning via contextual
forces, the indigenous character of knowledge being instructed in the classroom, the level of
complexity of the demands on educators inside the classroom and the meaning of
pedagogical behaviours.
The Systemic Evaluation of Grade 6 learners found that certain contextual factors were
associated with learner achievement (National Department of Education, 2005b). These
factors included socio-economic status, information available at school and at home, parental
involvement, homework practices, learning material and textbooks. Other factors are
resources available to the educators, school resources, school fees, staff qualifications,
learner participation, educator and learner attendance, discipline and safety and throughput
rates as seen as the time it took learners to complete Grade 4-6 (National Department of
Education, 2005b).
In addition to Fuller and Clark (1994), Scheerens (2001a) undertook a review of school
effectiveness research emerging from developing countries for the World Bank. The results
indicate that three major conclusions could be drawn from the emerging research. Firstly,
there is considerably larger between-school variation in developing countries as opposed to
developed countries. Secondly, there is a consistent and strong effect of material and human
input factors. Finally, there is weak and at times inconclusive evidence on instructional
factors that have research support from developed countries.
An additional concern pertains to the redundancy of school effectiveness research in
developing countries as a result of the lack of methodological sophistication (Riddell, 1997).
So, not only has very little work been undertaken in secondary schools as far as school
effectiveness research in developing countries is concerned but the way in which analysis is
being undertaken is also highlighted. Furthermore, studies that are taking place in a
developing world context do not always consider factors such as family’s demand for
schooling, the school’s aggregated influence on learning via contextual forces or the
indigenous character of knowledge. As a rule studies do not focus on instructional processes
on a classroom-level either, resulting in a dearth of studies of this nature. Scheerens (2001a)
states that the use of multilevel school effectiveness studies could in principle be used to
allow for the study of instructional processes. Multilevel analysis could be used to integrate
conditions at school and classroom-levels that could address the cultural concerns that have

71
been raised by Fuller and Clark (1994) as well as address the concern that school
effectiveness research in developing countries runs the risk of becoming redundant.
What are the implications for the development of a framework for monitoring education in a
developing world context? Firstly, the Scheerens model (1990), although a useful point of
departure, in its current form does not take into account factors emerging from the
developing world context, namely the strong effect of material and human input factors,
comprehensive factors relating to instructional processes, the role of the school, educator
and contextual factors. Secondly, important measures of system level policy concerns are
not covered in the model developed by Scheerens (1990) and Scheerens et al. (2003) warn
that the model as it currently stands should not be seen as a tool to be used in solving all
educational problems, especially in a developing world context. Finally, the Scheerens model
(1990) was developed as a general integrated model of educational effectiveness, whereas
the conceptual model of this study focuses specifically on factors that could elucidate school
functioning for monitoring purposes.
The Scheerens model (1990) in its present form is not ideal as it does not include literature
from the developing world and certain adaptations have been made based on the literature
and debates presented in Chapter 2 (Fuller & Clark, 1994; Gray et al, 1999; Howie, 2002;
Leithwood, Aitken & Jantzi, 2001; Mortimore & Sammons, 1994; Riddell, 1997; Sammons,
1999; Scheerens & Bosker, 1997; Scheerens, 1999, 2000). In addition, literature pertaining
to monitoring systems in a developing world context has been presented in this chapter and
could inform a model for monitoring education in developing countries, specifically South
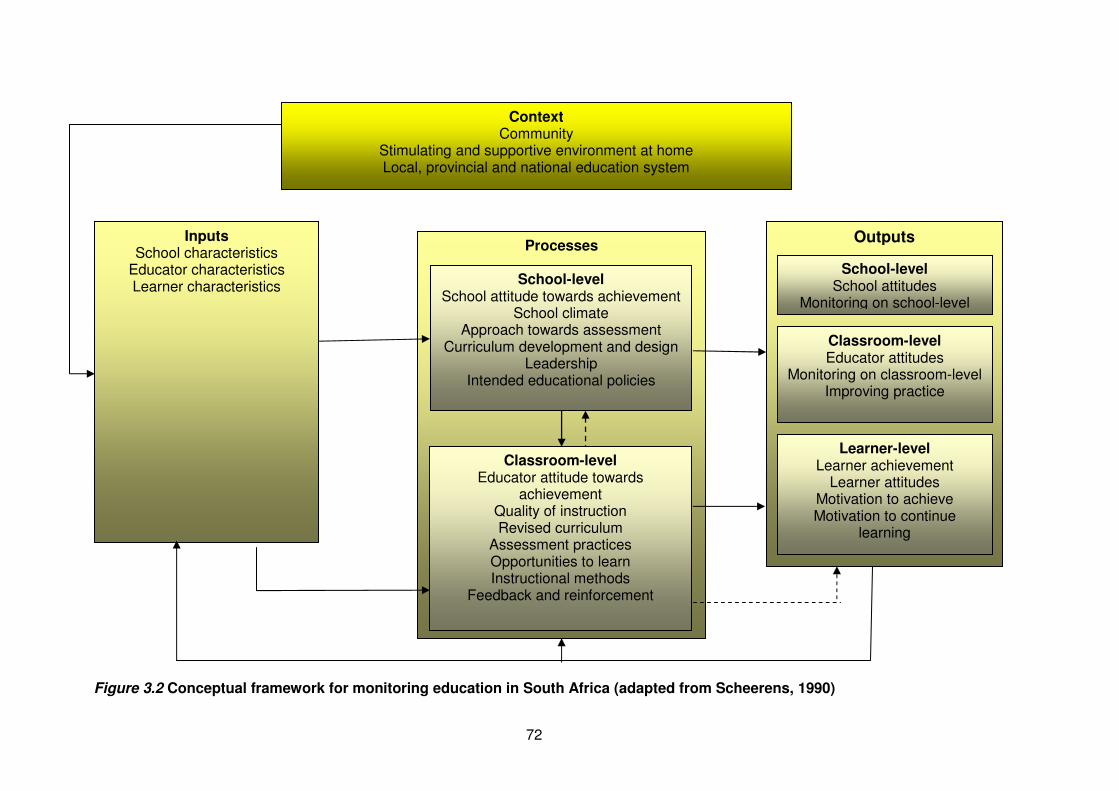
Africa. Figure 3.2 visually depicts the conceptual model for monitoring education in South
Africa.
72
Figure 3.2 Conceptual framework for monitoring education in South Africa (adapted from Scheerens, 1990)
Context Community
Stimulating and supportive environment at home Local, provincial and national education system
Inputs School characteristics
Educator characteristics Learner characteristics
Processes
School-level School attitude towards achievement
School climate Approach towards assessment
Curriculum development and design Leadership
Intended educational policies
Classroom-level Educator attitude towards
achievement Quality of instruction Revised curriculum
Assessment practices Opportunities to learn Instructional methods
Feedback and reinforcement
Outputs
Learner-level Learner achievement
Learner attitudes Motivation to achieve Motivation to continue
learning
Classroom-level Educator attitudes
Monitoring on classroom-level Improving practice
School-level School attitudes
Monitoring on school-level

73
Table 3.1 provides an overview of the indicators and variables included in the model while
the model is discussed in detail in the section to follow under the key components of context,
input indicators, process indicators and outcome indicators.
Table 3.1 Overview of indicators and variables included in the conceptual model
Indicators Variables included
Inputs into the system
Learner characteristics Gender, socio economic status, developed abilities,
intelligence, and prior achievement.
Educator characteristics Age, home language, experience, years employed at the
current school and training undergone that is articulated in
terms of qualifications and professional development
activities.
School characteristics Location (rural, peri-urban, or urban area), physical
resources, financial resources, and human resources.
Processes through the system on a school-level
School’s attitude towards
achievement
Official documents expressing an achievement-oriented
emphasis, high expectations at school and educators level
and offering records of learner achievement.
The climate of the school
Orderly atmosphere, absenteeism and dropout, the
behaviour and conduct of learners, priorities, perceptions,
relationships between the various parties, appraisal of
roles and tasks, the facilities and buildings.
Approaches towards
assessment
School assessment policies, approach to assessment
advocated by the school.
Intended policies
Whole School Evaluation, Systemic Evaluation, and
Development Appraisal System.
Leadership Leadership style, monitoring of activities.
Designing and
developing of curricula
Decisions about what the curricula should be, a collective
and intentional process directed at curriculum change,
quality of school curricula.
Processes through the system on a classroom-level
Educator’s attitude
toward achievement
Importance the educator attaches to learner achievement,
achievement orientation, expectations of learner
achievement.
Quality of instruction Curricular priorities, choice, and application of teaching
materials.

74
Indicators Variables included
Instructional methods Method of instruction, preparation of lessons, structure of
lessons, and monitoring.
The revised curriculum Curriculum framework, decisions about what the curricula
should be, cooperative planning, curriculum change and
quality of curriculum.
Assessment practices Type of assessment strategies educators’ use.
Opportunities to learn Time allowed for learning, match between what is
assessed, and what was taught.
Feedback and
reinforcement
Opportunity to receive comments, clear, fair discipline and
homework policies.
Outputs of the system on a learner-level
Learner achievement Marks, grades, and proficiency.
Learner attitudes Attitudes towards school, classroom, peers, and home.
Motivation to achieve Direction of behaviour towards a predetermined goal, peer
pressure, pressure from home to achieve, intrinsic
motivation.
Motivation to continue
learning
Future goals and plans to study further such as going to
university.
Outputs of the system on a classroom-level
Educator attitudes Attitudes towards school and work.
Monitoring on classroom-
level
Monitoring mechanism used in the classroom such as
record books.
Improving practice Professional development in terms of workshops,
seminars, and continuing education.
Outputs of the system on a school-level
School attitudes Attitudes towards staff, policy initiatives, professional
development.
Monitoring on school-
level
Systems for monitoring of learner performance on a
school-level such as computer programmes.
3.4.1 The context
In the model for monitoring education quality in South Africa, the education system is seen as
having a layered structure. The learner and educator are placed in the school context. The
school is also in a context namely schools within circuits, within districts and within provinces.
Broader policy initiatives are also included on the context level. The community is seen as

75
the broader area from which the school draws learners and reflects the degree of
involvement of the community such as the participation of school governing bodies (SGB)
(Scheerens et al., 2003). The stimulating and supportive home environment refers to the
degree of parental involvement not only in the learning of the learner, the parents’ role in
encouraging and supporting children’s effort in school (Mortimore, 1998), but also in school
matters and activities (Scheerens, et al., 2003).
The context variables feed into both the input indicators and the process indicators that will
be discussed in the sections to follow. It is important to note that some of the indicators on
the context level do not necessarily have a direct effect on indicators included in the inputs
but may rather have an indirect effect as a consequence of mediating variables. For
example, professional development initiatives for educators as initiated by the provincial
department of education may indirectly affect educator characteristics as the school could act
as a mediating variable.
3.4.2 Input indicators
Specifically, the inputs for the model identified for this research consists of learner
characteristics that include factors such as gender, socio-economic status, developed
abilities, intelligence, and prior achievement. Educator characteristics include factors such as
age, home language, experience, years employed at the current school and training
undergone that is articulated in terms of qualifications and professional development
activities. Finally, school characteristics and school demographics have also been included
as input indicators articulated by factors such as location of the school, i.e. whether the
school is situated in a rural, peri-urban, or urban area. Another school characteristic is
resources that refer to materials available to the school to facilitate the carrying out of
educational objectives (Sammons, 1999). Resources can be divided into physical resources
in terms of buildings and equipment, financial resources, and human resources in terms of
number of staff employed (refer to Figure 3.2). The input indicators have an effect on the
process indicators, in other words directly on school-level and classroom-level but also
indirectly via school-level factors on the classroom-level.
3.4.3 Process indicators
Process indicators shed light on what has traditionally been called the “black box” of
education. What makes these variables interesting is that they refer to conditions that are
flexible in nature and can be improved upon. Within a school environment, process indicators
refer to conditions of schooling and instruction, all of which are under the control of school

76
management and staff (Scheerens et al., 2003). The process mechanisms can be divided
into two levels, namely the school-level and the classroom-level (Figure 3.2).
On the school-level, the key indicators for the conceptual framework include:
� School’s attitude towards achievement. This is articulated in terms of official documents
expressing an achievement oriented emphasis (Scheerens, 1990), which provides a
clear focus for the mastering of basic subjects, stipulates high expectations at school
and educators level as well as offers records of learner achievement (Scheerens &
Bosker, 1997).
� The climate of the school is seen as an orderly atmosphere in which there are rules and
regulations, punishment as well as rewards, where absenteeism and dropout are
monitored and the behaviour and conduct of learners are taken into account. Internal
relationships are also highlighted here in terms of the priorities, perceptions, and
relationships between the various parties in the school, appraisal of roles, tasks of
parties in the school and finally the facilities and buildings available to schools
(Scheerens & Bosker, 1997).
� Approaches to assessment are reflected in whether there are school assessment
policies in place where assessment is viewed as the process of gathering information
(Gay & Airasian, 2003). The approach to assessment is mirrored in the assessment
strategies that are used as advocated by the school and stipulated in an assessment
policy.
� The effect of intended policies such as Whole School Evaluation, Systemic Evaluation,
and Development Appraisal System. These are the policies that Government put in
place for schools and educators to follow. The focus of these policies is to gauge the
extent to which the intended curriculum and the Government legislation on teaching
goals and objectives are adhered to and to monitor school functioning (Bosker &
Visscher, 1999).
� The leadership within the school is characterised by the leadership style of the principal,
e.g. whether s/he is actively involved in the development and monitoring of educational
activities (Scheerens, 1990). This indicator makes provision for general leadership skills
and characterises the school principal as an information provider, coordinator, meta-
controller of classroom processes, instigator of participatory decision-making, and
initiator and facilitator of staff professional development (Scheerens & Bosker, 1997).
� Designing and developing of curricula include decisions about what the curricula should
be; of which cooperative planning is an important component. Collective and intentional
processes or activities directed at beneficial curriculum change are included here (Marsh

77
& Willis, 2003), as well as the design and the development of curricula in which is
reflected the overall quality of school curricula (Bosker & Visscher, 1999).
The following classroom-level indicators are included in the conceptual framework (Figure
3.2):
� Educator’s attitude toward achievement including the importance an educator attaches
to learner achievement, whether the educator has a positive attitude towards
achievement (Mortimore, 1998) and the extent to which educators are achievement
oriented and have positive expectations of learner achievement (Sammons, 1999).
� Quality of instruction is mirrored in the way the curricular priorities are set out, the choice
and application of methods and textbooks utilised and the educator’s satisfaction with
the curriculum (Scheerens & Bosker, 1997).
� Instructional methods. Here is understood the methods used in the classroom and their
degree of effectiveness. This indicator is also reflected in the structure of instruction as
represented by preparation of lessons, structure of lessons, direct instruction, and
monitoring taking place (Scheerens & Bosker, 1997).
� Revised curriculum. A curriculum framework comprises of a set of principles and
guidelines which provides both a philosophical base and an organisational structure for
curriculum development initiatives at all levels, be they nationally, provincially,
community or school-based. This is the framework which is based on the principles of
co-operation, critical thinking, and social responsibility, and which should empower
individuals to participate in all aspects of society (Curriculum, 2005). Reflected in this
indicator are decisions about what the curricula should be, the presence of cooperative
planning, the collective and intentional processes or activities which are directed at
beneficial curriculum change (Marsh & Willis, 2003) and the quality of school curricula
more generally (Bosker & Visscher, 1999).
� Assessment practices represent a type of assessment strategies and methods educators
use in the classroom; it is the process of gathering information (Gay & Airasian, 2003) by
means of various strategies and tools.
� Opportunities afforded learners to learn indicate the amount of time allowed for learning
(Scheerens, 1997) and whether there is a match between what is being assessed and
what has been taught during lessons (Scheerens, 1992).
� Feedback is the opportunity to receive comment (feedback) on work done, comments,
which are clearly understood, timely, and of use in the learning situation. Reinforcement
can be positive or negative. Positive reinforcement is reflected in whether clear, fair
discipline is present and whether feedback is received (Sammons, 1999). Homework is

78
included under this indicator as it forms part of the comments learners receive on
learning. Here the quantity and quality of homework are highlighted (Sammons, 1999).
Conditions on the school-level are seen as facilitating conditions on the classroom-level.
These levels are in interaction with one another and the classroom-level adapts according to
the changes taking place on the school-level (refer to Figure 3.2). Both school-level
conditions and classroom-level conditions have a direct effect on the outputs. However, while
certain school-level conditions have a direct effect on certain elements included in the output,
school-level conditions also have an indirect effect via classroom-level conditions.
3.4.4 Output indicators
The outputs for the conceptual model can be divided into the various levels of the school
system namely the learner, classroom, and school-level (Figure 3.2). Two indicators have
been identified on a school-level, namely school attitudes and monitoring on a school-level,
while three indicators have been identified on a classroom-level, namely educators’ attitudes,
motivation to improve practice and monitoring.
Factors on a school-level are school attitudes and monitoring on a school-level. The latter is
the use of curriculum specific tests and the use of standardised achievement monitoring
systems to track students from one grade level to the next (Scheerens, 1990). These are
articulated as well established mechanisms for monitoring the performance and progress of
learners, classes and the school as a whole and can be formal or informal in nature. The
monitoring system provides a mechanism for determining whether goals are met, focuses
staff and learners on these goals, informs planning, teaching and assessment, and gives a
clear message that the educator and school are interested in progress (Sammons, 1999).
On the classroom-level, motivation to improve practice refers to vocational training
undertaken for professional development purposes (Sammons, 1999) as articulated by in-
service training opportunities, updating policies, and introduction of new programmes
(Taggart & Sammons, 1999). Monitoring on a classroom-level is the monitoring of learner
progress and making use of monitoring systems (Scheerens & Bosker, 1997) that are well
established mechanisms for monitoring the performance and progress of learners and
classes. Monitoring systems provide a mechanism for the educator to determine whether
goals have been met and inform planning, teaching and assessment (Sammons, 1999).

79
The learner-level has four indicators:
� Learner achievement is seen as the current status of learners with respect to proficiency
in given areas of knowledge or skills (Gay & Airasian, 2003).
� Learner attitudes, seen as the emotions that prepare or predispose an individual to
respond consistently in a favourable or unfavourable manner when confronted with a
particular object, a specific affective characteristic (Anderson, 1988). Depending on
whether attitudes are positively or negatively directed towards a particular object, they
can promote or inhibit learner behaviour in the classroom, home, peer group and
ultimately learning (Anderson, 1994).
� Motivation to achieve. Motivation is defined as the cause for initiation, continuation, or
cessation of an activity or behaviour and as the direction of behaviour towards a
predetermined goal. Achievement motivation is described as a pattern of planning, of
actions, and feelings connected with striving to achieve some internalised standard of
excellence (Day, 1988). Academic motivation on the other hand, is concerned with the
factors that determine the direction, intensity, and persistence of behaviour related to
learning and achievement in academic frameworks (Nisan, 1988).
� Motivation to continue education or learning as defined by the initiation of and
persistence in mindful learning in order to attain a future goal (Lens, 1994).
The output indicators as discussed in the previous section are then fed back into the system
by means of input as well as process indicators.
3.5 Specific research questions
Figure 3.2 presents a comprehensive model that can be used to monitor the quality of
education in South Africa. Various indicators have been included in the model on a school-
level, classroom-level, and learner-level. The indicators included are based on literature from
the developed as well as developing world and give a flavour of what is of importance when
the monitoring of education is the main aim. As was seen from the literature review
presented in Chapter 2, the main aim of any monitoring system is to ascertain what learners
achieve academically. This aim is also present in the conceptual framework under learner
outputs. In this research, learner achievement is measured by means of the MidYIS
instrument, which, in addition to the feedback mechanisms, form part of the MidYIS value-
added monitoring system. Thus the first main research question addresses the
appropriateness of the MidYIS system how appropriate is the Middle Years Information
System (MidYIS) as a monitoring system in the South African context?

80
The main aim of any monitoring system, as was seen in Chapter 2, is to gauge the quality of
education as reflected in learners’ performance. In the conceptual model developed from
literature, learner achievement can be found under the learner-level output section of the
model. The first main research question is concerned with the appropriateness of the MidYIS
monitoring system for the South African context. However, before inferences can be made
about the appropriateness of MidYIS for the South African context, MidYIS will have to be
compared to other monitoring systems. Thus the first specific research question is how does
the Middle Years Information System (MidYIS) compare with other monitoring
systems?
Appropriateness can also refer to the generalisability of the MidYIS system from the United
Kingdom context to the South African context. Literature suggests that when considering the
generalisability of monitoring systems one finds that two key issues are highlighted, namely
the reliability and validity of the monitoring system (Scheerens & Hendriks, 2002; Fitz-
Gibbon, 1996; Greaney & Kellaghan, 1996). Fitz-Gibbon (1996) suggests several criteria,
depicted in Figure 3.3, when evaluating the quality of measurements which form the core of
any monitoring system and which provide the information necessary for feedback.
Figure 3.3 Criteria for evaluating quality of measurement used in monitoring systems (adapted from Fitz-Gibbon, 1996)
The question how appropriate is the Middle Years Information System (MidYIS) as a
monitoring system in the South African context, interrogates validity issues not only in
terms of the appropriateness of the MidYIS instrument and feedback mechanisms. Also
Generalisability
Reliability: Evaluates the consistency of
measurements
Validity: Credibility of results
Sub-tests: on item
level
Groups of sub-tests
Occasions Judges, observers, markers
Agreeing with other methods, predicting
future results
Fairness of items
Measuring what is
intended, free of bias
Internal Consistency
Equivalence Stability Inter-rater reliability
Predictive and concurrent
validity
Content-related validity
Construct validity
81
assumed is what adaptations need to be made in order for the MidYIS system to be feasible
in the South African context. An important aspect as illustrated by literature (Scheerens &
Hendriks, 2002; Fitz-Gibbon, 1996; Greaney & Kellaghan, 1996) is that of acquiring a valid
measure, which would translate into credibility of results in terms of predictive validity, face
validity and construct validity, as illustrated in Figure 3.3. As South Africa has diverse
schooling conditions, it is important that the instrument can be used in schools that are vastly
different and that the results are consistent (illustrated in Figure 3.3). Therefore, from
literature one finds that in order to investigate the first main research question of how
appropriate the MidYIS monitoring system is for the South African context, issues of validity
and reliability have to be interrogated. Thus a specific research question that is a stepping-
stone to obtain answers to the first main research question is how valid and reliable are the
data generated by the MidYIS monitoring system for South Africa? Here validity is used
as an overarching term that includes content-related validity (which includes face validity as
well as curriculum validity); construct validity and predictive validity, all of which refer to the
credibility of the results and where the term reliable refers to the consistency of results.
A third specific research question can be identified that draws on the two specific research
questions elaborated on in the preceding sections. The specific research question is what
adaptations are needed to transform MidYIS into SASSIS, a monitoring system for the
South African context? In order to fully investigate the MidYIS system as a system, which is
appropriate for South Africa, the characteristics of the MidYIS system has to be interrogated
and suitable changes made. These changes are vital if the monitoring system is ever truly
going to be a system that can be used in South Africa. The MidYIS monitoring system is
elaborated on in Chapter 4 and possible avenues of investigation suggested.
As was seen from the school effectiveness models presented in Chapter 2 and elaborated on
in this chapter, various factors affect performance. This forms the essence of the second
main research question namely which factors could have an effect on learner
performance and therefore inform the design of the monitoring system? The school
system is part of a nested structure, as in the school effectiveness models described in this
chapter. In the models presented in this chapter, the levels of monitoring range from school
specific levels (classroom and learner) to levels from the broader educational system
(districts and provinces). For the purposes of this research, three levels have been identified
for inclusion and form the specific research questions that will be used as stepping stones to
answer the second main research question. The three specific question research questions
encompass the school, classroom, and the learner-level. The context as illustrated in Figure
3.2 is not included for study. The specific research questions are:

82
2.1 What factors on a school-level affect the performance of learners on the
assessment?
2.2 What factors on a classroom-level affect the performance of learners on the
assessment?
2.3 What factors on a learner-level affect performance of learners on the assessment?
2.4 How can the identified factors be included in the design of the monitoring system?
The conceptual model introduced in the previous section was constructed based on literature
and includes factors that affect achievement. Literature suggests that the school has a
hierarchical structure in which one level has an influence on the other (Scheerens & Bosker,
1997). However, when considering factors that are of relevance for a developing world
context, certain factors seem to be stronger or more important than others are. For example,
Fuller and Clark (1994) found that the local context in which schools find themselves is of
importance. Howie (2002) found that the location of the school has an effect on achievement.
Scheerens (2001a) found that material and human input factors were important; this was
corroborated by the Systemic Evaluation Grade 6 (2005) results that highlighted factors such
as learning materials and textbooks, school resources and staff qualifications as well as the
socio-economic status of learners. In addition, Fuller and Clark state that very little research
has been done in developing world contexts on how inputs are mobilised within the
classroom, while Scheerens (2001a) found that there is conflicting information on the role of
instructional factors. However, Howie (2002) found that classroom-level factors as well as
teacher characteristics have an effect on achievement.
In order to address the second main research question, factors from the developing world
literature have to be considered. This includes the input indicators comprising of learner,
educator, and school characteristics, as these indicators provide information pertaining to the
home background of the learner, background information of educators such as qualifications,
gender, and age while school characteristics provide information pertaining to location.
Indicators from the school-level and classroom-level processes were included as found in
literature in the conceptual framework. However, it is recognised that not all these factors will
effect learner achievement as strongly in a developing world context. Therefore a two-fold
approach has been identified consisting of a conceptual approach based on literature and an
empirical approach based on what emerges from the data. From a conceptual point of view
only one school-level process indicator will be included for study namely school attitude to
achievement. On a classroom-level educator attitude towards achievement, quality of
instruction, instructional method, and opportunities to learn have been included because they

83
feature in literature from both the developed and the developing world. In addition to the
conceptual approach, an empirical approach was employed where additional variables may
be considered based on whether they are valid, reliable, and correlate with achievement.
Finally, output indicators on a learner-level based on literature include learner achievement,
learner attitudes, and motivation to achieve. On a classroom-level educator attitudes,
monitoring on the classroom-level and improving practice have been identified. Only one
output indicator has been identified on a school-level namely school attitudes. The indicators
focused on in this research in terms of the conceptual framework presented in 3.4 are
highlighted by brown in Figure 3.4. The indicators were selected based on their prominence
in literature as well as with the South African context in mind. Furthermore, as this is an
exploratory study and the main focus of the research was on validity and reliability issues, it
was necessary to limit the indicators included for further study.

84
Figure 3.4 Components included for study (adapted from Scheerens, 1990)
Context Community
Stimulating and supportive environment at home Local, provincial and national education system
Inputs School characteristics
Educator characteristics Learner characteristics
Processes
School-level School attitude towards achievement
School climate Approach towards assessment
Curriculum development and design Leadership
Intended educational policies
Classroom-level Educator attitude towards
achievement Quality of instruction Revised curriculum
Assessment practices Opportunities to learn Instructional methods
Feedback and reinforcement
Outputs
Learner-level Learner achievement
Learner attitudes Motivation to achieve Motivation to continue
learning
Classroom-level Educator attitudes
Monitoring on classroom-level Improving practice
School-level School attitudes
Monitoring on school-level

85
3.6 Conclusion
In this chapter, school effectiveness models were reviewed with the aim to ascertain whether
they could be applied as models for monitoring the quality of education in the South African
context. One particular model was focused on, namely the Scheerens model (1990). This
model, although providing a solid point of departure, was found not to be ideal in its present
form. Adaptations based on literature and debates in the field of school effectiveness were
proposed. These adaptations resulted in a conceptual framework for monitoring education in
South Africa that included many features of school effectiveness models, such as having a
multilevel structure and accounting for interactions between variables. The conceptual model,
however, also differs from the Scheerens model in that it includes the type of indicators that
reflect South Africa’s developing world context.
In the conceptual framework proposed for monitoring education, a key element is learner
achievement. The aim of any monitoring system is to ascertain how much learners are
learning in order to make judgements on the effectiveness of education. In the model
presented learner achievement, reflected under the output component and measured using
the MidYIS instrument, encompasses the first research question. As this research focuses on
the school, classroom, and learner-level, variables included under the inputs, processes and
outputs are highlighted for study and encompass the second main research question.
MidYIS as a value-added monitoring system has, however, not been described in detail. In
Chapter 4 the MidYIS monitoring system will be discussed in light of the literature review
presented in Chapter 2. Key criteria, based on literature, are presented as a basis for
evaluating the MidYIS system and for providing a framework within which recommendations
of adaptations can be made.

86
CHAPTER 4CHAPTER 4CHAPTER 4CHAPTER 4
MIDDLE YEARS INFORMATION SYSTEM (MIDYIS): MIDDLE YEARS INFORMATION SYSTEM (MIDYIS): MIDDLE YEARS INFORMATION SYSTEM (MIDYIS): MIDDLE YEARS INFORMATION SYSTEM (MIDYIS):
CHALLENGES AND CHANGESCHALLENGES AND CHANGESCHALLENGES AND CHANGESCHALLENGES AND CHANGES
The use of monitoring systems for internal evaluations in schools is
not new and several countries such as the United States of America,
United Kingdom, the Netherlands, and New Zealand have developed
monitoring systems. In this chapter the monitoring system Middle
Years Information System (MidYIS) developed by the Curriculum,
Evaluation and Management (CEM) centre is discussed as a feasible
option in the context of South Africa. The discussion takes place
against the backdrop of literature. Key characteristics of monitoring
systems have been identified in Chapter 2 and MidYIS is discussed in
light of these characteristics. Core components of the MidYIS system
are highlighted, as well the aim of the project, target population,
administration procedures, instruments used and feedback provided.
4.1 Introduction
In the literature chapter of this dissertation (Chapter 2) various monitoring systems, including
value-added assessment systems were discussed. In this chapter, one system that was not
included in the literature chapter is discussed in depth namely the Middle Years Information
System (MidYIS) which was developed by the Curriculum, Evaluation, and Management
(CEM) Centre at the University of Durham in the United Kingdom.
The Curriculum, Evaluation and Management (CEM) Centre is a research centre at the
University of Durham, England. CEM has done extensive work in developing monitoring
systems that are unique and confidential to schools and colleges (CEM, 2005). Participation
by schools in the projects developed by CEM is voluntary and not enforced by the
government. This approach is in contrast with systems that are imposed on schools by the
national education system. Monitoring systems, like those developed by CEM, were
encouraged by the need to measure outcomes along with process variables and covariates
so that fair comparisons between schools could be made. This was largely in reaction to the
league-tables that evaluated schools from different areas were evaluated as equal. The
87
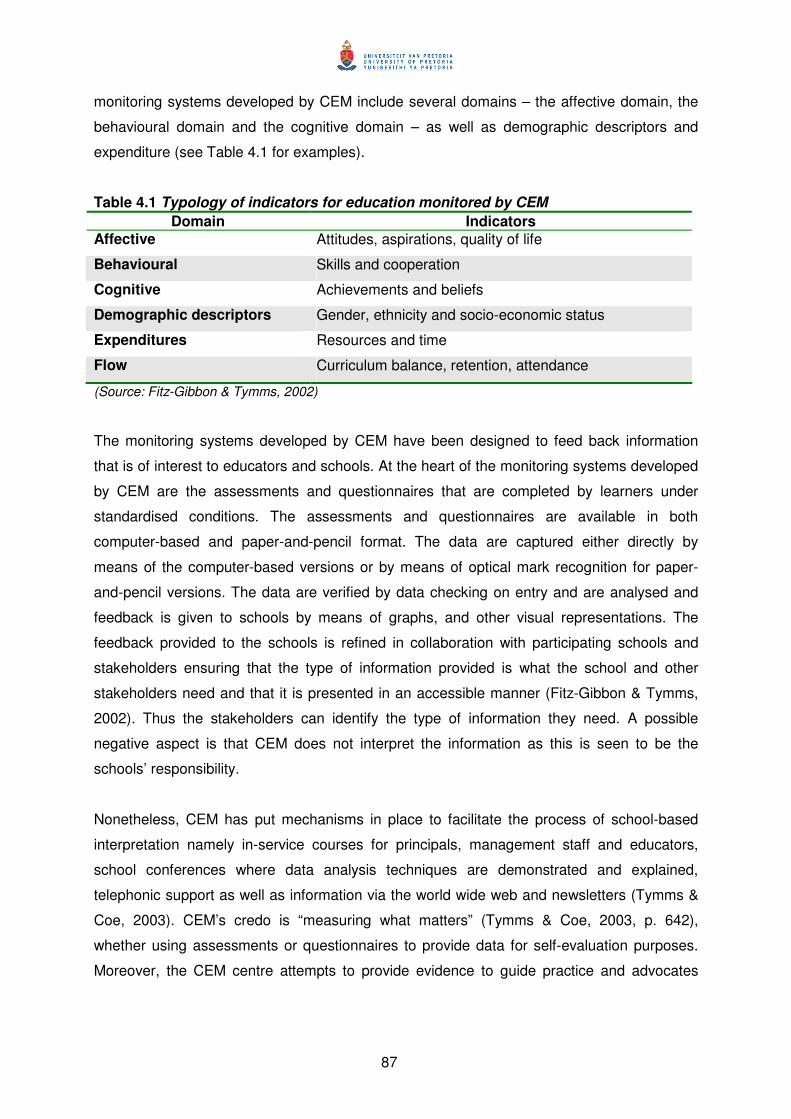
monitoring systems developed by CEM include several domains – the affective domain, the
behavioural domain and the cognitive domain – as well as demographic descriptors and
expenditure (see Table 4.1 for examples).
Table 4.1 Typology of indicators for education monitored by CEM
Domain Indicators
Affective Attitudes, aspirations, quality of life
Behavioural Skills and cooperation
Cognitive Achievements and beliefs
Demographic descriptors Gender, ethnicity and socio-economic status
Expenditures Resources and time
Flow Curriculum balance, retention, attendance
(Source: Fitz-Gibbon & Tymms, 2002)
The monitoring systems developed by CEM have been designed to feed back information
that is of interest to educators and schools. At the heart of the monitoring systems developed
by CEM are the assessments and questionnaires that are completed by learners under
standardised conditions. The assessments and questionnaires are available in both
computer-based and paper-and-pencil format. The data are captured either directly by
means of the computer-based versions or by means of optical mark recognition for paper-
and-pencil versions. The data are verified by data checking on entry and are analysed and
feedback is given to schools by means of graphs, and other visual representations. The
feedback provided to the schools is refined in collaboration with participating schools and
stakeholders ensuring that the type of information provided is what the school and other
stakeholders need and that it is presented in an accessible manner (Fitz-Gibbon & Tymms,
2002). Thus the stakeholders can identify the type of information they need. A possible
negative aspect is that CEM does not interpret the information as this is seen to be the
schools’ responsibility.
Nonetheless, CEM has put mechanisms in place to facilitate the process of school-based
interpretation namely in-service courses for principals, management staff and educators,
school conferences where data analysis techniques are demonstrated and explained,
telephonic support as well as information via the world wide web and newsletters (Tymms &
Coe, 2003). CEM’s credo is “measuring what matters” (Tymms & Coe, 2003, p. 642),
whether using assessments or questionnaires to provide data for self-evaluation purposes.
Moreover, the CEM centre attempts to provide evidence to guide practice and advocates

88
processes that are transparent (using ordinary least squares regression instead of multilevel
models) and focuses on the outcome (Tymms & Coe, 2003).
The aim of the present study is to determine whether one of the projects developed by the
CEM centre, the Middle Years Information System (MidYIS) is a feasible monitoring system
for the South African context. MidYIS has been briefly referred to in Chapter 1 but was not
discussed in Chapter 2 because MidYIS is the focus of this research and requires a separate
in-depth discussion. A description of the MidYIS project is given in 4.2 including the aims and
objectives of the project, target population and administration procedures. 4.2 is followed by
an overview of the assessments and questionnaires used (4.3) and then by the feedback
provided (4.4). The MidYIS project is evaluated, in 4.5, against the backdrop of the findings
from Chapter 2 and the arguments presented in favour of MidYIS being used as a viable
monitoring system for the South African context. Recommendations on how this project could
be adapted and extended for the South African context are presented in 4.6.
4.2 MidYIS in the United Kingdom
The MidYIS system, focusing on 11 to 13 year old learners (Year 7 to Year 9), was the last
project to be developed by the CEM centre and was launched in 1996 with a pilot study in
200 schools. The MidYIS system provides an assessment that forms a baseline value-added
measure for secondary schools in the United Kingdom of which 1500 schools are
participating in the project. The MidYIS assessment, a developed abilities assessment, has
been designed to take approximately 45 minutes to complete and provides a good predictor
of later academic achievement (Fitz-Gibbon & Tymms, 2002). In addition, MidYIS provides a
value-added system for two United Kingdom national examinations, namely Key Stage 3 and
General Certificate Secondary Education (GCSE), based on results of the baseline
assessment. In this context, value-added in CEM’s view, refers to the growth in learner
achievement that could be attributed to the efforts made by the school. Thus the focus is on
the “value” the school has added to the achievement of a learner (CEM, 2002c).
A reason why schools would choose MidYIS is possibly because the assessment is
independent of the curriculum. The assessment gives an indication of abilities rather than
strictly academic performance based on primary schools attended and quality of education.
MidYIS also provides a viable alterative baseline to Key Stage 2 tests. Furthermore, with
standardised administration procedures, teachers are not required to do anything.
Audiotapes are used and testing takes place during regular class periods with little disruption

89
to school timetables. Finally, the assessments are externally marked and provide high quality
data with feedback given promptly and results clearly presented (CEM, 2002a).
The aim of MidYIS is to provide secondary schools with a monitoring system that would be
efficient and effective in predicting later achievement and to provide a baseline measure for
value-added (Tymms & Coe, 2003). The CEM centre developed assessments that could be
used for prediction purposes and to work out the “value” the school has added to learners
over time. The idea behind the value-added component is to provide a fair measure of
assessing how learners in one school performed in comparison to learners of similar abilities
from other schools (CEM, 2002a). Furthermore, MidYIS assessments are designed to
measure developed ability and are designed to be relatively curriculum content free. This
baseline is then used to determine how easy or difficult it would be for learners to succeed in
subsequent grades (Fitz-Gibbon & Tymms, 2002).
The MidYIS assessments are administered in England and Wales to Year 7 (or 11 year olds),
Year 8 (or 12 year olds) as well as Year 9 (or 13 year olds) (CEM, 2002b). Year 7
corresponds to the first year of secondary school in England and Wales, while the
assessment is administered in Year 8 in Northern Ireland and P 6 in Scotland (refer to Table
4.2). However, schools may want learners, who were not tested in Year 7, to be tested in
Year 8 or 9 (for England and Wales). In these cases, an additional baseline assessment is
also made available to schools and is designed specifically for learners who did not take part
in the assessment at Year 7 or 8 such as learners who transferred from one school to
another.
Table 4.2 Age group of learners participating in the MidYIS project
The assessment is a paper-and-pencil assessment that is administered under timed
examination conditions. The administration of the assessment is standardised. All learners
hear the same information, are given the same examples, and receive the same amount of
help throughout data collection. By means of having a standardised administration procedure
in place it is possible to provide a measure of typical performance which is both fair to the
participating learners as well as the schools (CEM, 2002b).
Assessment table for the MidYIS project
Age group England and Wales Northern Ireland Scotland
11 + years Year 7 Year 8 P 6
12 + years Year 8 Year 9 S1
13 + years Year 9 Year 10 S2

90
4.3 The MidYIS instruments
The MidYIS instruments (for both Year 7-8 and Year 9) are designed to measure developed
abilities. The assessment is in English and consists of seven sub-tests namely vocabulary,
mathematics, proof reading, perceptual speed and accuracy, cross-sections, block counting
and pictures. The MidYIS scales are a combination of seven sub-tests, and these are
discussed and examples are provided in the section to follow.
4.3.1 The MidYIS Scales
The seven sub-tests are used to derive the four different scales each of which measures
certain abilities (Figure 4.1).
Figure 4.1 The scales and sub-tests of the MidYIS assessment
It has been found that both the sub-tests and scales are valid for the United Kingdom while
the relevance of both the sub-tests and scales for the South African context is discussed in
Chapters 6 and 7 based on the findings of this research. The scales and the sub-tests are
explained below:
1) The vocabulary scale is derived from the sub-test with the same name in the
assessment and measure abilities in vocabulary as well as fluency and speed (CEM,
2002e).
2) The mathematics scale is derived from the sub-test with the same name in the
assessment and measure abilities in mathematics as well as fluency and speed
(CEM, 2002e).
BASELINE ASSESSMENT
VOCABULARY SCALE
MATHEMATICS SCALE
SKILLS SCALE
NON-VERBAL SCALE
Vocabulary sub-test
Mathematics sub-test
Proof reading sub-test
Perceptual speed and accuracy sub-test
Cross-sections sub-test
Block counting sub-test
Pictures sub-test

91
3) The skills scale comprises two sub-tests namely the proof reading sub-test and the
perceptual speed and accuracy sub-test. Both sub-tests are designed to measure
fluency and speed in finding patterns and spotting mistakes and therefore make
heavy demands on the learner’s scanning and skimming skills (CEM, 2002e).
Because of this scale’s demanding nature as far as learners’ skimming and scanning
skills are concerned, it is not only addressed in only the language component of the
curriculum (by including reading and drilling exercises to develop those skills) but also
in geography where educators could include exercises in which learners are
requested to find places on a map. The abilities (skills) included in the skills scale are
important as they prepare learners to effectively and efficiently look for information
and these skills are essential in the work environment.
4) The non-verbal scale comprises three sections namely cross-sections, block counting
and pictures. These tests attempt to measure 2-D and 3-D visualisation, spatial
aptitude, pattern recognition, and logical thinking. The non-verbal score is a useful
indicator of ability in the case of learners for whom English is a second language, as
there is no reliance on language (CEM, 2002e). Development of the non-verbal skills
could primarily take place in mathematics with the introduction of geometry where 2-D
and 3-D visualisation is important. Educators could include exercises where learners
systematically revisit the progression of 2-D shapes to 3-D shapes such as taking
cereal boxes apart and then trying to put them back together again. Educators could
get learners to draw objects from different angles and give them blocks to play with.
For pattern recognition, exercises in which learners identify the next number or picture
can be used.
4.3.2 The vocabulary sub-test
The vocabulary sub-test provides a measure of verbal fluency and is a strong indicator of
later academic achievement. In the vocabulary section, learners are presented with a series
of multiple-choice items designed to test their verbal ability or their ability in vocabulary
(CEM, 2002e). Learners are given a word and the learner is then asked to identify the
synonym from the four answer options provided. Figure 4.2 provides an example item.

92
Draw a cross in the box with the word that means the same, or nearly the same, as the word on the left. For example: hat
book
cap
pencil
road
Figure 4.2 Example from the vocabulary sub-test
4.3.3 The mathematics sub-test
The mathematics sub-test was designed with an emphasis on the measuring of fluency,
speed, and ability in mathematics. In CEM’s view, one of the most efficient ways of collecting
mathematical information is to use constructed answers and multiple-choice questions (CEM,
2002e). Like the vocabulary score, the mathematics score can be an excellent predictor of
later academic achievement. Figure 4.3 provides examples of constructed response items.
What number comes next?
What is 32 – 12?
Determine y if 2y = 4
3, 6, 9, 12 …
Figure 4.3 Example from the mathematics sub-test

93
4.3.4 The proof reading sub-test
In the proof reading sub-test learners are required to identify mistakes in a piece of text (see
Figure 4.4). These mistakes include spelling, grammar and punctuation (CEM, 2002e). The
analysis by CEM has found that the proof reading sub-test on its own is not a good predictor
of later performance but as part of the overall score it is a very good predictor, specifically in
the United Kingdom, of language and mathematics.
Figure 4.4 Example item from the proof reading sub-test
4.3.5 The perceptual speed and accuracy (PSA) sub-test
The items included in the perceptual speed and accuracy sub-test consist of a sequence of
characters, both numerical as well as non-numerical. The learners have to choose the
identical match from the multiple-choice answers provided (see Figure 4.5). If learners were
provided with enough time they would probably get all the answers correct but this sub-test
measures how quickly learners can find a match. An example of such a skill would be how
quickly a learner could find a symbol or grid reference on a map or perhaps how quickly an
error in a mathematical calculation could be identified (CEM, 2002e). This sub-test on its own
is not a good predictor of later performance but as part of the overall score is a very good
predicator of language and mathematics.
You will look for mistakes in each paragraph on the next page. Look for mistakes such
as such as spelling, capitals, commas, apostrophes or quotation marks. Look at the
sentence in the box below. The word riting should be writing spelt with a w, so the box
underneath is crossed out. Also you re should be you’re with an apostrophe so that
box is crossed out, and reed should be read so it is crossed out underneath as well.
The riting youre about to reed is about making bread

94
Look at the letters or symbols in the left-hand box. Find the matching letters or symbols
in the right-hand box. Draw a cross in the box underneath the
correct answer.
AaB Aab AaB AAb AbA
Figure 4.5 Example item from the perceptual speed and accuracy sub-test
4.3.6 The cross-sections sub-test
The cross-sections component of the assessment consists of solids, each of which has been
cut. The learners are given a cross section and their task is to decide which one of the solids,
if any, has been cut to produce the cross section. Figure 4.6 provides an example of the
instructions that learners receive in order to complete the section.
1. If you cut an apple 2. We can picture this 3. This is the
in half, you get a as a surface going shape of the
”cross-section”. through the apple cross-section.
On the following page, eleven shapes have been cut. They are labelled A
to K. In each question that follows, you are given a cross-section. Decide
which of the shapes must have been cut to produce the cross-section.
Please note that some cross-sections have no matching shape.
In these cases, fill in the “No match” response.
Figure 4.6 Example item from the cross-sections sub-test

95
4.3.7 The block counting sub-test
In this sub-test, the learner is provided with two sizes of block. The task is to determine how
many of each type of block are in each diagram as illustrated in Figure 4.7.
In this section, there are two sizes of blocks. The larger blocks are three times as
long as the smaller blocks. Count how many blocks of each type are in each
diagram. In this example, there are two small blocks and one large block. Draw a
cross in the correct box.
Figure 4.7 Example item from the block counting sub-test
4.3.8 The pictures sub-test
The final section of the assessment is the pictures sub-test. There are three distinctive types
of question in this section. Two pictures are given together with four multiple-choice answers.
The learners are required to select the correct picture that would be the result of adding the
two pictures together, and then what picture would be the result if one of the pictures were
subtracted from the other. Finally, a series of pictures are given together with multiple-choice
answers. The given pictures have a distinct sequence and the task is to identify the picture
that would follow the pictures provided. Figure 4.8 provides an example of adding two
pictures.

96
Figure 4.8 Example item from the pictures sub-test
4.3.9 Extended MidYIS
Extended MidYIS is an additional component for which schools can register and consists of a
survey of learner attitudes in the form of three learner questionnaires each of which can be
undertaken separately. The three questionnaires include an induction questionnaire, a
bullying questionnaire, and finally a general questionnaire. The induction questionnaire is
aimed at ascertaining how effective the school’s transfer arrangements and inclusion of the
learner into the school have been from the perspective of the learner. The bullying
questionnaire aims to ascertain the level of bullying taking place in the school and to provide
information about the efficiency of the school’s bullying policy. The third and final component
of Extended MidYIS is a general questionnaire. It is designed to cover aspects related to the
areas of learner care, guidance and support and includes attitudes toward the school,
attitudes towards subjects, racism, bullying, motivation, aspiration, parental involvement and
alcohol and drug use (CEM, 2006c). Conceptually, the Extended MidYIS is based on the
Student Attitudes Information System or SATIS that was developed for MidYIS Year 9 as a
stand-alone component (CEM, 2006d).
Part of this study is to investigate the validity of the general questionnaire for the South
African context. The reasons for selecting the general questionnaire are:
� When the project was initiated, the CEM centre only had the SATIS instrument available
and was still developing Extended MidYIS.
� In South Africa, many schools have an informal induction programme in place to
introduce new learners to the rules and physical layout of the school, but no formal
programme is advocated.
� Issues such as the length of the questionnaire had to be taken into consideration.
� The general questionnaire seemed appropriate because in addition to items that could
On the left are two transparent frames (boxes) each containing a shape. If one frame is
placed directly on top of the other, the shapes are added. Draw a cross underneath the
box that shows the two shapes added together.

97
be related to school effectiveness research, it also includes items pertaining to the
induction into the school and the issue of bullying.
4.4 Feedback provided by the MidYIS project
In order to develop good indicators adequate samples are necessary and the indicators
should have appropriate levels of reliability and validity. The assessments themselves were
developed by the CEM centre in conjunction with the UK stakeholders. Correlations of 0.65
were found between the MidYIS assessment, specifically the overall MidYIS score which
comprises all the scales, and English, mathematics and science for Key Stage 3 (Fitz-Gibbon
& Tymms, 2002), which points to the predictive validity of the assessment (see Table 4.3).
Table 4.3 Correlations between MidYIS assessments and Key Stage 3 examinations for 2003
English Maths Science Test
Correlation N Correlation N Correlation N
Year 7 0.68 39,587 0.84 43,317 0.79 42,856
Year 8 0.69 4,442 0.83 4,745 0.79 4,787
Year 9 0.72 7,553 0.85 8,547 0.83 8,196
(Source CEM, 2006a)
As the CEM centre attempts to provide quality data that could be trusted and is scientifically
grounded, initial steps for the project included ascertaining the reliability of each of the scales
of the assessments by using Cronbach’s alpha (CEM, 2002d). In both versions of the
assessment, namely for Year 7/8 and Year 9, the Cronbach alpha’s are well above 0.8 (see
Table 4.3, Table 4.4 and Table 4.5) indicating that the assessments are consistent within the
United Kingdom context.
Table 4.4 Reliability coefficients for the UK, Year 7/ 8 assessment (n = 68 574), academic year 1998/1999
Scale Cronbach Alpha Number of Items
Vocabulary 0.90 40
Mathematics 0.93 74
Non-verbal 0.89 54
Skills 0.84 53
Overall MidYIS Score 0.96 221
(Source CEM, 2002d)

98
The scales for both the Year 7/8 assessment and the Year 9 assessment are essentially the
same in terms of high reliability coefficients but the pattern is very different. Items that appear
in the Year 7/8 assessment can be found in the Year 9 assessment. The difference is that
additional items have been included in the vocabulary, mathematics and skills scale of the
Year 9 version, while items have been omitted in the non-verbal scale.
Table 4.5 Reliability coefficients for the UK, Year 9 assessment (n = 19 383), academic year 1998/1999
Scale Cronbach Alpha Number of Items
Vocabulary 0.91 50
Mathematics 0.91 77
Non-verbal 0.91 50
Skills 0.91 55
Overall MidYIS Score 0.96 232
(Source CEM, 2002c)
The data on which the reliability analysis and feedback is based, is captured electronically by
an outside agent and is then sent to the CEM centre for analysis. The information is cleaned,
processed, and transformed in order for analysis to take place, which is done by software
that has been designed especially for this purpose. The software is called Predictions and
Reporting Interactive Software (PARIS). PARIS provides predictive information, identifies
value-added indicators, and provides longitudinal tracking information (CEM, 2002j).
Once the data has been transformed and analysed, feedback is given. The feedback
provided by MidYIS includes individual learner feedback, nationally standardised feedback
for the UK (4.4.1), each according to the four scales of the test as well as an overall MidYIS
score. Band profile graphs (4.4.2) and chance graphs (4.4.3) are also included as well as
predictions to Key Stage 3, and GCSE (4.4.4) based on the latest relationship between the
MidYIS assessment and each Key Stage 3 and GCSE subject. In addition, value-added
feedback is given at the learner and subject level (CEM, 2002a). The value-added feedback
is elaborated on in 4.4.5. The various forms of feedback will be briefly described in the
section to follow.
4.4.1 Nationally standardised feedback
The MidYIS assessment results for each learner are standardised against a nationally
representative sample of schools in the United Kingdom and are standardised to have a
mean score of 100 and a standard deviation of 15, where a score greater than 100 indicates

99
that learners are performing better than average. Furthermore, learner scores for each scale
are reported in stanines (this refers to the statistical term indicating that the national
representative sample is divided into nine divisions). The standardised results are useful to
schools because it enables them to compare their learners’ performance with that of other
schools as well as the national average (CEM, 2002h). Figure 4.9 provides an example of the
standardised feedback that schools receive.
(Source: CEM, 2002h)
Figure 4.9 Standardised scores
At the top of the each column is the average score obtained by the cohort of learners who
participated. A score of 100 indicates that the cohort of learners score is the same as the
nationally representative sample while a score above 100 indicates that the cohort performed
better than the nationally representative sample, while a score lower than 100 indicates that
the cohort performed worse than the nationally representative sample. Note that the
nationally representative sample comprises schools from across the country whose learners
participated in the project for the given year (CEM, 2002k). Thus looking at Figure 4.9 one
finds that Gray Grapes performed better than the national average in the skills scale but did
not fare as well in the mathematics and the non-verbal scale.
Furthermore, when looking at Figure 4.9 one finds a column that says “band”. Four bands are
used namely A, B, C and D, where A indicates high performance and D low performance with

100
B and C being in the middle constituting average performance. The bands have been
constructed using quartiles as depicted in Figure 4.10 (CEM, 2002k).
Figure 4.10 MidYIS bands represented on a normal distribution
4.4.2 Band profile graphs
Learner performance is reported in terms of bands as was mentioned in the previous section
with each band containing 25% of the nationally standardised sample. Figure 4.11 provides
an example of a summary of the learners in a school obtaining a result equivalent to Bands A
– D. The band profile graph (as illustrated in Figure 4.11) allows schools to see how they
performed in relation to the nationally representative sample. If the school performs the same
as the nationally representative sample then all four bars on the graph will the same height
each containing 25% in each. In Figure 4.11, the dotted red line indicates the 25% level. In
the example given in Figure 4.11, the majority of the learners scored in band D and C (70%
of total sample) indicating that as a group the learners fared worse in vocabulary than the
national average (CEM, 2002k). As a large percentage of learners scored in band D and C,
the school will be alerted to a potential problem pertaining to language that should be
investigated and for which intervention strategies should be developed such as word attack
skills and a monitored language journal.
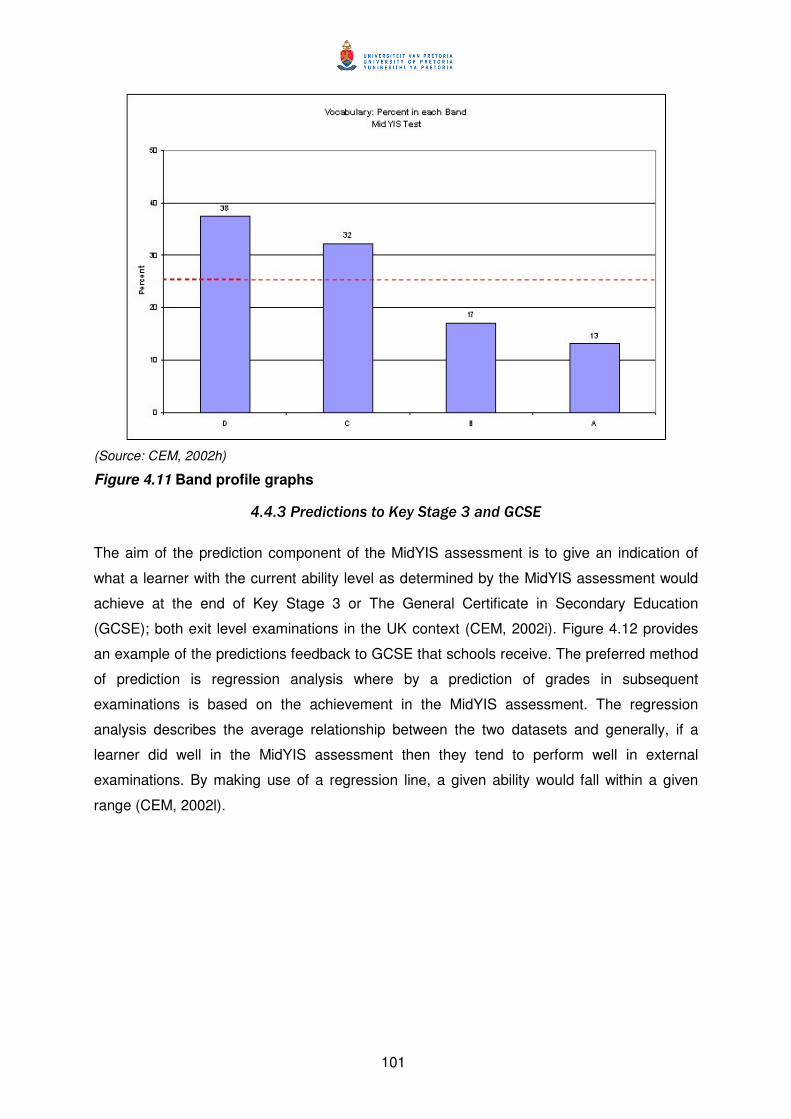
101
(Source: CEM, 2002h)
Figure 4.11 Band profile graphs
4.4.3 Predictions to Key Stage 3 and GCSE
The aim of the prediction component of the MidYIS assessment is to give an indication of
what a learner with the current ability level as determined by the MidYIS assessment would
achieve at the end of Key Stage 3 or The General Certificate in Secondary Education
(GCSE); both exit level examinations in the UK context (CEM, 2002i). Figure 4.12 provides
an example of the predictions feedback to GCSE that schools receive. The preferred method
of prediction is regression analysis where by a prediction of grades in subsequent
examinations is based on the achievement in the MidYIS assessment. The regression
analysis describes the average relationship between the two datasets and generally, if a
learner did well in the MidYIS assessment then they tend to perform well in external
examinations. By making use of a regression line, a given ability would fall within a given
range (CEM, 2002l).

102
(Source: CEM, 2003i)
Figure 4.12 Predictions to GCSE subjects
If one refers to Figure 4.12, one finds that Abigail Apple obtained a predicted value of 4.4 for
English. This indicates that one would expect a MidYIS score of between 4 and 5 for English
which is equivalent to a GCSE grade of between D and C (CEM, 2002l). This type of
feedback is valuable in the context of the United Kingdom where league-tables are published
every year based on the performance of learners. By obtaining an indication of how learners
would fare, schools are provided with the opportunity to devise strategies to assist learners to
develop the necessary skills to succeed academically.
Table 4.6 GCSE grades and equivalent MidYIS scores
GCSE grade U G F E D C B A A*
MidYIS score 0 1 2 3 4 5 6 7 8
(Source: CEM, 2002l)
Within the GCSE framework grades are given based on the results obtained and these are
then converted to MidYIS scores for comparison purposes (see Table 4.6) i.e. the predicted
score based on the MidYIS assessment and the MidYIS score that is converted from the
GCSE grade. For example if a learner obtained a D as a GCSE grade then the learner’s
MidYIS score would be 4. In the case of the MidYIS feedback (Figure 4.12) predicted GCSE
is given as a point score (also refer to Table 4.6 to see the converted grade to MidYIS score).

103
4.4.4 Chances graphs
Chances graphs are generated per learner and per subject and give an indication of the
probability of achieving various grades at GCSE. The graphs depict the distribution of
possible predicted grades for a pupil of a certain ability group based on the results of
assessment (CEM, 2002i). An example of the chances graph for English as created by the
CEM centre can be found in figure 4.13. The example graph shows that this learner has the
greatest probability of obtaining a grade C and D in the GCSE examination with a 26% and
24% probability respectively but that the learner could, with a certain probability, obtain most
of the grades in GSCE (CEM, 2002l).
(Source: CEM, 2002i)
Figure 4.13 Learner-level chances graph for English
4.4.5 Value-added feedback
The value-added feedback (see Figure 4.14) provided by the CEM centre makes use of
linear regression, which produces a regression line. The regression line indicates the
expected grade attained based on performance of the MidYIS assessment. The expected
grade attained is referred to as the predicted grade. To determine the value-added the
attained grade is compared to the predicted grade and the discrepancy between the attained
grade and the predicted grade is the residual. If a learner achieved a result better than was
expected and is above the regression line a positive residual or a positive value-added is
achieved. However, if a learner fared worse than expected and the result is below the

104
regression then a negative residual or value-added has been attained. Figure 4.14 presents
the type of feedback provided. To interpret the results both the residuals and the MidYIS
score points are used (MidYIS score points were described in 4.4.3). For example Billy
Banana achieved a predicted value of 3.1 for Art. However, a result of 4 was attained for Art
that results in a positive residual of 0.9. If one examines the residuals for Art one finds that in
the majority of the cases a positive residual was attained which could indicate that the
subject is being taught well or that the examination was relatively easy. By means of making
use of value-added results, fair comparisons can be made as low ability learners are
compared with low ability learners in different classes as well as low ability learners from
different schools. In addition, CEM encourages schools to interpret results of value-added in
terms of trends over time and as a result, each subject is monitored on a yearly basis as well
as over a number of years (CEM, 2002m)
(Source: CEM, 2002m)
Figure 4.14 Value-added analysis
4.5 Evaluation of the MidYIS project and relevance for South Africa
As was discussed in Chapter 2 certain common features may be identified when comparing
monitoring systems. A common feature of monitoring systems is the clear, underpinning
rationale. The rationale may be to provide tools for self-evaluation or provide mechanisms to
gauge effectiveness of teaching and learning. The aim of the system would be to provide
valid and reliable information for making decisions and devising improvement strategies. The

105
level at which these systems are directed may vary but more often than not the systems
focus on the learner, and/or classroom, and/or school-levels.
The implementation of monitoring systems varies and depends on the indicators included.
Certain monitoring systems, like the systems developed by CEM, are designed to fit into the
school programme with minimum interference with school activities while other systems are
more intrusive and labour intensive, for example the ABC+ model discussed in Chapter 2.
Some systems focus exclusively on monitoring learner performance, as for instance the VCE
data project discussed in Chapter 2, while other systems include additional contextual
information, such as the ZEBO-project discussed in Chapter 2. The assessment instruments
used in monitoring systems could be more curriculum oriented, as in the Tennessee Value-
Added Assessment System (TVAAS), which tracks learners from one year to the next by
means of curriculum specific assessments. Alternatively a developed abilities assessment
could be used to collect baseline information from which future achievement can be
predicted, for example the Quantitative Analysis for Self Evaluation (QUASE). Additional
contextual information may be collected by means of questionnaires and interviews. Table
4.7 provides an analysis of the MidYIS project in the UK context in terms of the
characteristics of monitoring systems.
Table 4.7 Characteristics of the MidYIS monitoring system
System characteristics MidYIS monitoring system
Unit of analysis Learner-level.
Rationale underpinning the
project
To provide secondary schools with a monitoring system
that would be efficient and effective in predicting later
achievement as well as providing a baseline measure for
value-added.
Primary aim of the project Providing valid and reliable information to schools for
monitoring purposes.
Stakeholder input Input from stakeholders such as school boards is
encouraged as MidYIS strives to remain relevant for its
clients.
Effect on behavioural aspects Information used for evaluation purposes so that
intervention strategies can be designed.
Implementation of the project As it takes approximately 45 minutes to complete, it fits
into the school timetable with minimal disruption.

106
There are many similarities between MidYIS and other monitoring systems discussed in
Chapter 2. MidYIS has a clear rationale underpinning the system namely to provide tools for
schools to undertake self-evaluation by means of the valid and reliable information from
which decisions can be made and improvement strategies devised. The MidYIS system
focuses on a learner-level, as only assessment data based on an ability type assessment is
included. The information from the assessment is used for prediction purposes and
calculating the “value” the school has added to learners learning. The system is designed to
fit into school timetable so as not to disrupt school activities. However, MidYIS also differs
from many monitoring systems, as only one level, i.e. the learner-level, has been included; in
other words, MidYIS does not include any additional contextual information apart from what
is supplied by the learner. The information is used for predicting future achievement rather
than tracking learners from one grade to the next.
South Africa is a country with rich diversity (Howie, 2002), diversity that any monitoring
system will have to take into account. The appeal of MidYIS lies in the fair comparisons that
can be made not only between learners but also between schools. The systems developed
by CEM answer a need, in the United Kingdom, for fairer comparisons between schools
amidst the league-table debates (Fitz-Gibbon, 1996; West, 2000). In the United Kingdom
traditionally, league-tables have been published in which schools are ranked according to
achievement. Schools are unilaterally compared with each other regardless of the location
and school population (West, 2000). Elite schools typically drawing learners from affluent
backgrounds are compared with schools which typically cater for disadvantaged learners
(West, 2000). Schools catering for disadvantaged learners are typically located in poorer
areas and are less likely to be as well resourced as elite schools. In the words of Taylor, Fitz
and Gorard (2005, p. 59) “…different social backgrounds have a direct influence upon the
relative performance as measured by public examination result.”
By means of developing a system that considers covariates, fairer comparisons of the quality
of education received can be obtained. In South Africa vast discrepancies among schools
exist and persist even after more than 10 years of democracy. Despite these discrepancies
schools are still expected to function at the same level. They are compared as if they were
equal, especially when the Grade 12 (matriculation) results are published at the end of the
academic year. The MidYIS project developed by CEM provides the opportunity to include
covariates. It will not only place achievement in context, but will by means of calculating the
value-added also give an indication of the academic gains made by a learner relative to
his/her starting position. This information is valuable to schools because it enables them to
demonstrate their contribution towards learning taking place. Furthermore, as predictions of

107
subsequent achievement are based on the assessment results, schools will have enough
time to react to the needs of their learners and provide a starting point for the development of
intervention strategies.
Secondly, the approach the MidYIS project used is considered as appropriate as it was
developed especially for schools in collaboration with schools and district officials, and is free
from the accountability functions inherent in United States driven initiatives. Thus the aim of
using this system is to help the schools develop themselves by means of school-based
interventions that are based on the results.
The monitoring system has also been developed to slot into the school timetable with relative
ease and is not time intensive so that minimal disruption takes place. The CEM system uses
a developed abilities assessment to provide baseline information about a learner’s abilities
free from the curriculum. This makes the assessment fair to learners because due to
discrepancies in schooling, learners have different kinds of exposure to the curriculum.
Finally, the developed abilities assessment was designed to provide a means of measuring
typical performance and has been correlated with academic subjects. The correlations
between the academic subjects and the MidYIS assessment are high in the UK (refer to
Table 4.3), and thus allow for reliable prediction of subsequent performance. In the context of
South Africa this is a desirable characteristic as achievement at the end of Grade 9, which is
the first exit point and end of compulsory education, can be determined. This would assist in
identifying learners in need of additional assistance in time to give them a fair chance to
continue education to the Grade 12 level.
4.6 Summary and adaptations to enhance MidYIS for South Africa
The problems relating to the adoption of successful programmes from other contexts
without the consideration of local conditions has been mentioned
frequently…Contextual adaptation does not only mean fitting into a South African
context, but into a local context as well. There is tremendous variance in schools within
South Africa... Furthermore the same school is experienced differently by different
groups of students (Smith & Ngomo-Maema, 2003, p. 361).
It is acknowledged that importing programmes or assessments from other countries is often
problematic and a point of contestation as the quote above indicates. On the other hand,
noteworthy lessons can be learnt from the international examples. In South Africa, there is a

108
need for school-based monitoring systems. A system to assist the schools’ self-evaluation
processes for growth and development. Research within the international community is rich
with possibilities which may be used to inform initiatives in South Africa that would end the
dearth in research in developing countries.
However, the “importance of context in education (sic)…cannot be underestimated” (Smith &
Ngomo-Maema, 2003, p. 348). Any international initiative must be evaluated in terms of
appropriateness for the South African context. Issues of feasibility, validity, and reliability
become important. In addition, the context both past and present affects the decision to
implement international initiatives.
In this chapter, the Middle Years Information System (MidYIS) has been discussed in detail
in order to provide the information needed to make recommendations for changes. The
MidYIS system has many advantages, which are appealing for the South African context:
� The system provides tools that schools can use with relative ease as well as information
with which schools can evaluate themselves in order to identify strategies for
development.
� As the assessment information can be used to predict future achievement, schools are
in a better position to identify learners at risk of failing and who may need additional
support.
� As the system provides value-added information, schools from different contexts can be
compared with similar schools, the evaluation being based on the academic growth of
learners with similar abilities. In this regard, learners are compared according to the point
at which they started and by academic gains made, instead of being compared on raw
scores regardless of background and context.
� The MidYIS system has been designed to fit into the school timetable, which means that
minimum disruption of school activities takes place.
� The feedback given to schools is comprehensive and due to the support programmes in
place, schools are able to interpret the information that provides them with valuable
insights for future planning.
Although the MidYIS system is appealing and, as discussed in 4.5, could be relevant for
South Africa, it may in its present form not be suitable for South Africa. The feasibility of
using the assessment in South African schools has to be established. For example in the
United Kingdom the language of learning is English. However, South Africa has 11 official
languages and mother tongue instruction takes place until the fourth grade at which time the
109
language of learning should switch to English or Afrikaans. Consequently, the question has
been raised whether English second language learners would be able to access the words
included in the vocabulary sub-test when they have only received four years of instruction in
English. In addition, the results of the MidYIS assessment are based on nationally
standardised samples for the United Kingdom and not South Africa. Furthermore, developed
abilities type assessments are viewed with scepticism in South Africa because in the past
similar assessments were used to reinforce the apartheid system. Avenues need to be
explored further if MidYIS is to be used in the South African context. The MidYIS system may
be an asset for South Africa if correctly contextualised. Therefore, the following aspects were
investigated to ascertain the relevance of the MidYIS monitoring system:
1) The issue of curriculum validity: The overlap of skills tested in the MidYIS
assessment and the skills taught in the curriculum had to be ascertained. This was a
vital step in order to ascertain curricular validity, a specialised form of content-related
validity, and suitability of the assessment in terms of the outcomes-based education
system followed in South Africa. The relevance of MidYIS for the educational context
and curriculum had to be established.
2) The issue of content-related validity: The MidYIS assessment is an assessment of
developed abilities, which falls within the domain of psychology. As such, the overlap
of items included in the assessment with the psychological domains had to be
ascertained in order to establish face and content validity of the assessment. This
was done by comparing the assessment to other “abilities” assessments as well as by
asking psychologists to evaluate the assessment. The assessment, although used in
an educational context, was originally developed by drawing on abilities theory in the
realm of psychology. As MidYIS is a well established assessment one would expect
the items drawn from abilities theory, to be thorough. However, for reporting purposes
the overlap between items and the possible domain had to be explored. The content-
related validity in question is different from the curriculum validity as inferences were
made with regard to two different domains namely the curriculum and abilities.
3) Additional learner questionnaire: The MidYIS system does not include learner
contextual information unless schools register for Extended MidYIS (an online learner
questionnaire or Student Attitudes Information System). This component is an
additional element to the proposed monitoring system for South Africa. The general
learner questionnaire (discussed earlier) was used which provides information on
learner attitudes, aspirations, and quality of life. The learner questionnaire includes
items pertaining to the age of the learner, gender of the learner and home
background of the learner, future aspirations, attitudes towards the school and school
work, motivation to achieve and motivation to continue learning. The learner

110
questionnaire was also included in order to obtain information on learner attitudes.
The questionnaire was evaluated in order to ascertain face and content validity. It was
also evaluated to see which items had to be included to provide more detailed
information on attitudes to school subjects and classroom practices (see Chapter 5 for
details).
4) Assessment and questionnaire format: The language used as well as the format
and layout of the assessment and questionnaire was evaluated and adapted where
necessary, so that these are accessible for South African learners, for instance
converting UK English to South African English.
5) Time allocation for the sub-tests: The time allocated for each sub-test was
evaluated in order to ensure that learners had adequate time and that the
assessment was fair for South African learners.
6) Suitability of the assessment for second language learners: The assessment was
evaluated to ensure that it is suitable for second language learners. An important
aspect is that the MidYIS assessment is in English. In many South African schools,
neither the language of learning nor the first language of the majority of learners is
English. The assessment had to be deemed appropriate for learners taught in English
as a second language.
7) Administration procedures: The administration procedures had to be revised, as
tape recorders are not always available in South African schools. For the monitoring
system to be standardised, tape recorders would have to be provided or the schools
and educators trained. In order for the initial work to be undertaken the data had to be
collected by trained fieldworkers for quality monitoring purposes. Furthermore, in
order to ensure that the ESL learners understood the instructions and what is
expected, the instructions had to be translated into learners’ mother tongue.
8) Additional contextual questionnaires had to be developed to broaden the scope
of MidYIS: Indicators included in monitoring systems may vary as was explored in the
beginning of this chapter as well as in Chapter 2. Different kinds of inputs, processes
and outputs should be included in the monitoring system so as to broaden the scope
of the monitoring system. With the additional information the monitoring system would
be appropriate for the purposes of self-evaluation in terms of management and the
design, development and implementation of curricula. For the monitoring system to be
used for self-evaluation purposes, it has to encapsulate more than the learner
performance. Therefore, principal and educator questionnaires had to be developed.
The education system is a nested system where learners are within classes and
classes are within schools. As was seen from literature presented in Chapter 2, each
of the levels affects the other and in order to identify explanatory variables, to design

111
interventions programmes and effect change, information from the various levels is
needed. The questionnaires had to be sound to ensure the collection of valid
information and they had to be evaluated to ensure that they have face and content
validity before being finalised and administered.
9) Issues of construct validity: Problematic items had to be identified and the
underlying data structure evaluated in terms of construct validity to ensure that the
constructs or scales in the assessment were found in the South African data. Rasch
analysis was undertaken to identify the items which seem to measure the same
construct. Reliability analysis was also undertaken to evaluate whether the items in
the sub-tests cohere to form the scales as found in MidYIS.
10) Predictive validity had to be established for the South African context: The
assessment is used for prediction purposes in the context of the United Kingdom. If
predictive validity was to be established for South Africa, the results from the
assessment had to be correlated with academic results, specifically language and
mathematics, obtained from school-based assessments.
11) Analysis procedures used to provide schools with information: Analysis
procedures used to provide information given to schools were evaluated and
appropriate analysis procedures for the initial validation phase as well as more
developed phases had to be identified. For example, standardised feedback will not
be given initially, as the assessment has not been standardised for the South African
context. Because of financial constraints and as a result of small sample sizes,
standardisation was not possible in the initial stages of the project. However, the aim
is to standardise the assessment for the South African context and to develop
national norms.
12) The feedback reports to schools: The feedback provided had to be simplified and
narratives added so that the results were presented in a comprehensive manner.
Individual school reports were considered more appropriate in the South African
context. These were presented to the schools during information sessions and follow-
up telephone calls. The report included background information on the assessment
and how the learner results should be interpreted. Individual learner results were
provided as well as aggregated scores. Exceptional learners were identified as well
as those who may require additional attention. As far as possible visual
representations in the form of graphs were provided, possible reasons for poor
performance were given and key areas identified where learners had difficulty.

112
4.7 Conclusion
Monitoring systems are important mechanisms that schools can use to gauge their
effectiveness in teaching and learning. Yet, monitoring systems on school-level to assist in
self-evaluation processes in the context of South Africa are not readily available. The schools
in South Africa vary greatly and schools in rural areas as well as in townships are still
disadvantaged in terms of resources and facilities. However, current assessments, such as
the Grade 12 examination, do not take the complexities within which disadvantaged schools
work into account. In order to evaluate the true performance of a school more appropriate
monitoring and measurement systems are necessary. Moreover, with the increasing demand
of the provincial and national education departments that schools become accountable for
their learners’ performance, the need for a system, which monitors learner performance, has
become imperative. Schools will have to develop the capacity to monitor their own
effectiveness in order to be accountable for their learners’ performance. By means of using a
system such as MidYIS with adaptations for the South African context, school processes as
well as outputs can be monitored.
In this chapter, an attempt has been made to provide information about MidYIS developed by
the CEM centre in the United Kingdom. This has been done in order to provide a framework
within which the proposed South African project or SASSIS (South African Secondary School
Information System) can be developed by means of putting forward recommendations of how
the MidYIS components can be built upon and extended to make it feasible for the South
African context. What has been discussed in this chapter pertains to the relevance of MidYIS
for the South African context, thus, is directly linked with the first main research question
identified for this research namely how appropriate is the Middle Years Information
System (MidYIS) as a monitoring system in the South African context?
In this chapter, changes were discussed as to how MidYIS could be enhanced for South
Africa. A number of changes were directly related to the validity and reliability of the
assessment, as discussed in 4.6. Thus a specific research question emerges namely how
valid and reliable are the data generated by the MidYIS monitoring system for South
Africa. This is related to Figure 3.3 presented in Chapter 3. The concept of validity although
a unitary concept (Gronlund, 1998; Linn & Gronlund, 2000) comprises various facets as was
highlighted in 4.6 such as curricular validity, and content-related validity. For this reason the
specific research question how valid and reliable are the data generated by the MidYIS
monitoring system for South Africa can be refined further into a number of sub-questions.
113
The sub-questions identified are directly linked to the steps needed to make inferences
related to validity and reliability. The sub-questions are:
1.2.1 To what extent are the skills tested by MidYIS valid for the South African
curriculum?
This research question explores the extent to which the skills assessed in the
MidYIS assessment are prevalent in the South African curriculum. This speaks of
the degree to which learners have been exposed to learning situations which
foster the skills assessed.
1.2.2 To what extent are the items in MidYIS in agreement with the domain of
ability testing and applicable for South Africa?
The domain of abilities is a well-documented field, one in which psychologists
have been working for a number of years. This question is to map the extent to
which the items in the assessment sample the items prevalent in the domain of
ability. This also relates to the theoretical constructs underlying the MidYIS
assessment and together with sub-questions 1.2.1 and 1.2.3 inferences made
with regard to validity are strengthen.
1.2.3 How well do the items per sub-test function and do they form well-defined
constructs?
This sub-question addresses issues on construct validity. The question addresses
whether or not the items cohere in the intended manner to form the theoretical
construct intended.
1.2.4 To what extent are the results obtained on MidYIS reliable?
The consistency of the results is an important aspect of an assessment as the
results of one testing situation should be comparable and similar to the results of
another testing situation using the same assessment. This gives an indication of
how reliable the results are.
1.2.5 To what extent do the data predict future achievement?
This sub-question explores the concept of predictive validity. Specifically focusing
on the extent to which the assessment data is related to results obtained by
learners in academic subjects.
Both the validity of the assessment and the reliability of assessment give an indication of
whether the results or learner achievement can be trusted, where the learner achievement
component is illustrated in the output section under learner outputs of the conceptual model
identified for this research, as illustrated in Figure 3.4 in Chapter 3. The emphasis was on
what adaptations were needed in order to develop MidYIS into a monitoring system for the

114
South African context. Therefore, another specific research question emerges namely what
adaptations are needed to transform MidYIS into SASSIS, a monitoring system for the
South African context? The discussion of what adaptations are needed is drawn from
investigations related to validity and reliability in which key aspects are highlighted for closer
examination. In 4.6 several aspects were noted. These aspects relate to time allocations,
language, and format of the assessment. As key aspects can be highlighted, the specific
research question related to adaptations can be refined into sub-questions. The sub-
questions are:
1.3.1 To what extent are the administration procedures appropriate and if not,
how can they be adjusted?
As was seen in this chapter and highlighted in the discussion in 4.6 administration
procedures need to be standardised. Not only is the way in which MidYIS is
undertaken in the UK not suitable for South Africa but standardisation is vital as
issues of administration can negatively influence the reliability of the assessment
(Frisbie, 1988).
1.3.2 To what extent is the content in MidYIS appropriate for second language
learners?
In South Africa, even though a learner attends an English medium school it does
not mean that the learner’s home language is English. For this reason, it is
important to ascertain the extent to which second language learners understand
the language used in the assessment. This is an important aspect as only 8.2% of
the South African population speaks English in the home (About South Africa,
2006).
1.3.3 To what extent is the format of the assessment appropriate and if not, how
can it be changed?
The assessment is compiled in a manner in which electronic data capturing can
be undertaken in order to ensure quick turnaround times as was briefly discussed
in the Chapter. However, this format although advantageous may not yet be the
optimal in South Africa.
1.3.4 To what extent are the time allocations appropriate and if not, what
adjustments are needed?
In the United Kingdom time per section has been allocated in a manner in which
the majority of the learners would be able to complete the sections. In South
Africa the time allocations may need to be adjusted to ensure that the majority of
the learners will be able to complete the sections.

115
1.3.5 To what extent is the feedback given in MidYIS appropriate for South Africa
and how can this format be improved upon?
As was discussed in this chapter feedback is provided to schools in a particular
manner. The extent to which this form of feedback is appropriate has to be
evaluated. In the United Kingdom, educators have a certain theoretical grounding
which makes it possible for them to learn how to interpret the results. In South
Africa however, a significant percentage of the educators are underqualified whilst
others obtained their qualification at a College of Education (most of which are
now closed) and not a university. The quality of teacher training varied greatly
across colleges and universities as did the qualifications due to the fact that these
were based on race i.e. Colleges of Education catered formally for African
teachers were mostly poorly funded, under-resourced and produced teachers
most often with insufficient skills and knowledge for teaching effectively. It is
anticipated that educators in South Africa may not benefit from the type of
feedback in its current form.
In addition to the assessment, the Chapter briefly discussed the learner questionnaire or
Extended MidYIS (4.3.9) as well as in the adaptations section (4.6). The information in the
questionnaire includes factors that could influence performance and has direct relevance to
the second main research question namely which factors could have an effect on learner
performance and therefore inform the design of the monitoring system? Issues related
to the learner are addressed, thus the following specific research question associated with
the second main research question is highlighted namely what factors on a learner-level
affect the performance of learners on the assessment. Not only does the questionnaire
provide the opportunity to collect information on learner characteristics (as indicated in the
inputs section of the conceptual framework in Figure 3.4) but also information on learner
attitudes and motivation to achieve (as indicated in the outputs section under learner-level of
the conceptual framework in Figure 3.4). Furthermore, the educator and school-level has
been identified as important as discussed in Chapter 3 but also highlighted in section 4.6 of
this chapter. In order for the educator and school-level to be investigated data from
questionnaires are needed. Thus two additional specific research questions can be identified
what factors on a school-level affect the performance of learners on the assessment
and what factors on a classroom-level affect the performance of learners on the
assessment.
However, there is another component of the second main research question namely how the
factors identified on a school, classroom and learner-level can inform the design and

116
development of a comprehensive monitoring system for South Africa. Thus the fourth specific
question identified, as a stepping-stone to answer the second main research question is how
can the identified factors be included in the design of the monitoring system?
In the chapter to follow, Chapter 5, the research questions are elaborated on further in terms
of data questions. Here the question of what data is needed in order to answer the specific
research questions that in turn will provide answers to the main research questions identified
is elaborated on. Issues pertaining to the sample, data collection and data analysis are
addressed in addition to the theoretical and methodological foundation of the research.
Related Documents