Chapter 24 It May Not Take a Village: Increasing Achievement among the Poor Vilsa E. Curto The Education Innovation Laboratory at Harvard University Roland G. Fryer, Jr. Department of Economics and EdLabs, Harvard University; NBER and Meghan L. Howard The Education Innovation Laboratory at Harvard University

Welcome message from author
This document is posted to help you gain knowledge. Please leave a comment to let me know what you think about it! Share it to your friends and learn new things together.
Transcript
Chapter 24
It May Not Take a Village:
Increasing Achievement among the Poor
Vilsa E. Curto
The Education Innovation Laboratory at Harvard University
Roland G. Fryer, Jr.
Department of Economics and EdLabs, Harvard University; NBER
and
Meghan L. Howard
The Education Innovation Laboratory at Harvard University

1
It May Not Take a Village: Increasing Achievement among the Poor
Introduction
One of the most important developments in the field of racial inequality in the past
quarter century has been quantifying the importance of pre-market skills in explaining
differences in economic and social outcomes between minorities and nonminorities (Neal and
Johnson 1996; O'Neill 1990). Using the National Longitudinal Survey of Youth 1979 (NLSY79),
a nationally representative sample of 12,686 individuals aged fourteen to twenty-two in 1979,
Neal and Johnson (1996) show that educational achievement among fifteen- to eighteen-year-
olds explains all of the black-white wage gap among young women and 70 percent of the gap
among men. Important critiques such as racial bias in the achievement measure (Darity and
Mason 1998; Jencks 1998), labor market dropouts, or the potential that forward-looking
minorities underinvest in human capital because they anticipate discrimination in the market
cannot explain the stark results.1
In developing countries, eradicating poverty requires a large and diverse set of strategies:
battling disease, fighting corruption, building schools, providing clean water, and so on (Schultz
and Strauss 2008). In the United States, important progress toward racial equality can be made
by ensuring that African American and white children obtain the same skills.
Fryer (forthcoming) shows that the key insight from Neal and
Johnson (1996) is robust to including the most recent wage data (in which individuals are fifteen
years older than in the original analysis) and extends far beyond income. Accounting for
educational achievement reduces disparities in employment by 53 percent, incarceration by 79
percent, and health outcomes by 88 percent (defined by the Physical Component Score of the 12-
Item Short Form Health Survey).

2
The problem is, despite decades of interventions, we do not know how to close the racial
achievement gap. Early childhood interventions such as Perry Preschool, Head Start, the Nurse-
Family Partnership, and the Milwaukee Project boost kindergarten readiness, but the effects on
cognitive ability often fade after children enter school (Currie and Thomas 1995; Puma et al.
2010). School-district-based strategies such as smaller schools and classrooms (Jepsen and
Rivkin 2002; Krueger 1999); mandatory summer school (Jacob and Lefgren 2004); merit pay for
principals, teachers, and students (Fryer 2010; Podgursky and Springer 2007); afterschool
programs (Lauer et al. 2006); budget, curricula, and assessment reorganization (Borman et al.
2003); ending social promotion (Jacob and Lefgren 2009); and policies to lower the barrier to
teaching via alternative paths to accreditation (Decker, Mayer, and Glazerman 2004; Kane,
Rockoff, and Staiger 2008) have not substantially reduced the gap in even the most reform-
minded districts. In an analysis of policies to foster human capital in poor children, Jacob and
Ludwig (2008) estimate that targeted investment in early childhood education, smaller class
sizes, and bonuses for teachers in hard-to-staff schools all pass a cost-benefit analysis, but cannot
close the achievement gap by themselves.
The lack of progress in closing the racial achievement gap has led some to assert that we
need more supportive communities and neighborhoods; stronger, more intact families and
engaged parents; or less income inequality to eliminate racial disparities in achievement (Brooks-
Gunn and Markman 2005; Duncan and Magnuson 2005; Rothstein 2004). Others have
interpreted the lack of progress as prima facie evidence that genetics or other cultural
dysfunctions are holding blacks back, and argue that these problems cannot be solved by
government interventions (Ferguson 2001; Herrnstein and Murray 1994; Jensen 1973; Rushton
1995). A third group argues that the presence of labor unions makes true reform impossible

3
(Hoxby 1996; Thernstrom and Thernstrom 2004), dismissing the current school-based
interventions as being tantamount to "fiddling while Rome burns." Understanding how and
where to invest our resources--communities, schools, families, and so on--is a subject of intense
debate and vicious disagreement. The answer is of first order importance for the direction of
public policy designed to eliminate racial inequality.
In this chapter, we describe recent social experiments and evaluations of investments in
schools, communities, and family engagement strategies and use these data to argue that it may
not take a village to increase educational achievement of the poorest minority children. We
envision a three-by-three conceptual matrix: school quality categorized as low, medium, and
high, and environment quality categorized similarly. See figure 24.1 for an illustration. As an
anchor, we assume that the typical low-income minority student is now in a low-quality school
and is being reared in a low-quality environment. We do not want to quibble over words here, so
consider this a normalization. On the opposite end, there are several features that seem common
among high-quality schools, including challenging coursework (college preparatory at the
secondary level); orderly, respectful, and safe environments; and high expectations for student
success. These and other characteristics are necessary elements of what Thernstrom and
Thernstrom (2004) call the "No Excuses" model that many charter schools have adopted. We
realize that the placement of particular interventions into a category in our conceptual matrix
will, to some extent, be ad hoc. We do our best to adhere to a clear and principled assignment
mechanism, although we recognize that all such mechanisms will cause some amount of concern
for the reader.
4
With these important caveats in mind, we use recent evaluations of charter across the US
to show that providing high quality schools to children who live in low-quality environments can
significantly increase their achievement. Yet, changing environments by moving individuals to
different neighborhoods or placing them in boarding schools to create a more nurturing and
stimulating home environment does not significantly alter achievement.2 Taken together, the
evidence to date suggests it may not take a village to increase the achievement of the poorest
minority students, just a high-quality school.3
Status Quo
The racial achievement gap is a persistent fact of life in the United States. Although there
are no cognitive differences between black and white infants, cognitive differences can be
observed as early as two years of age (Fryer and Levitt, forthcoming), and these differences can
thereafter be observed at every grade level on every subject (Campbell, Hombo, and Mazzeo
2000; Neal 2005). The typical black seventeen-year-old reads at the proficiency level of the
typical white thirteen-year-old (Campbell et al. 2000). On the SAT, black college-goers score, on
average, more than one standard deviation below white college-goers (Card and Rothstein 2004).
The differences are even more dramatic in large urban areas. On the National Assessment
of Educational Progress (NAEP), only 14 percent of black fourth graders in large cities are at
least proficient in mathematics, compared with 55 percent of white fourth graders; for reading,
these percentages are 14 and 47, respectively. In eighth grade, 10 percent of black students in
large cities are proficient in math, compared with 47 percent of white students; the percentages
for reading are 11 and 41 percent, respectively.

5
Still, these numbers cannot fully describe the lack of achievement of black students in
some urban areas. In Detroit, for example, 4 percent of black fourth graders are proficient in
math; by eighth grade, 3 percent are proficient. Similarly, 5 percent of black fourth and eighth
graders in Cleveland are proficient in math. In Milwaukee, 6 percent of black fourth graders and
3 percent of black eighth graders are proficient in math. Of the eighteen districts in the NAEP
Trial Urban District Assessment (TUDA) sample, at least half of the black students in fourteen of
these districts score at the "below basic" level on eighth grade math.
High-poverty, urban public schools can often be characterized by certain recurring
qualities. A MetLife study (2001) of principals, teachers, and students reports that teachers and
principals in heavily minority or low-income schools have lower expectations for their students
and report lower teaching quality than teachers and principals in schools with lower poverty rates
or lower concentrations of minority students. Students in low-income schools report that the
curriculum and courses are not challenging. Teachers and principals from low-income schools
also report lower quality of instruction and lower quality of the physical school environment than
teachers in more affluent schools.
The community and home environments of black children also offer a stark picture of
racial inequality. According to the 2008 American Community Survey, 67 percent of black
women between the ages of fifteen and fifty who gave birth in a twelve-month period were
unmarried, compared with only 26 percent of white women. One-third of black children live
below the poverty level; for whites, 11 percent do. One in five black households received food
stamps in 2008, compared with 6 percent of white households.4 At the end of the 1990s, there
were one-third more black men under the jurisdiction of the corrections system than there were
enrolled in colleges or universities (Ziedenberg and Schiraldi 2002).
6
With these facts in mind, we label the status quo for low-income minority children as
low-quality schools and a low-quality environment. In what follows, we describe interventions in
terms of how they change either the social environment in which students live or the schools that
students attend.
Charter Schools
One of the most promising education reforms in the past fifty years has been the creation
of charter schools. Charter schools are publicly funded but privately run schools that are playing
an increasingly significant role in the field of public school reform, especially in large urban
areas. Minnesota passed the first charter school law in 1991; today, thirty-nine states and the
District of Columbia have laws to authorize charter schools. The laws vary significantly from
state to state. Some states cap the number of charter schools, some do not; some states require
charter school teachers to remain covered by collective bargaining agreements, others do not.5
As of the 2009/10 school year, more than 1.6 million students were attending 4,638 charter
schools across the country. Most charter schools are located in cities and serve a student
population that is disproportionately black.6
At their current rate of growth, it will take charter
schools forty years to educate every student. Owing to their relative freedom, charter schools use
an array of intervention strategies, which include parental pledges of involvement and aggressive
human capital strategies that tie teacher retention to value-added measures. There has been a
recent flurry of work on the efficacy of charter schools, which we describe below.
National Sample
Gleason et al. (2010) conducted a national study of 36 charter middle schools in 15 states.
By limiting the set of analyzed schools to include only those that were oversubscribed and that
7
used a lottery to determine student enrollment, the authors are able to credibly estimate the
causal relationship of attendance at these schools on student achievement. Gleason et al. (2010)
find that on average, the charter schools studied are no more or less successful at improving
student achievement than traditional public schools. This average, however, taken on its own
masks the sizeable variance in the effect size of different schools: the effects on students' reading
scores after two years were estimated to be greater than zero in 11 sites and less than zero in 17
sites, and the estimates were significant for only 4 sites; for math, the effects were greater than
zero in 10 sites and less than zero in 18 sites, and the estimates were significant for 10 sites. The
authors also find that charter middle schools in large urban areas have significant positive
impacts on math achievement, while charter middle schools in other settings have negative
effects in this domain.
It is important to note that there are some significant demographic differences between
the charter schools included in this study and charter schools in general. In the charter schools
included in the study, students were less likely to be eligible for free or reduced-price lunch (44
versus 62 percent), were less likely to be minority students (47 versus 62 percent), and were less
likely to have scored below proficiency on the state assessment before entering the charter
lottery. Because this chapter focuses on interventions aimed to improve the educational or
environmental experiences of low-income minority students, the relevance of these results must
be interpreted carefully. Next, we explore analyses of charter schools that more specifically
serve this target population.
New York City
Hoxby and Murarka (2009) use matched charter school and New York City public
schools data from forty-two of New York City's forty-seven charter schools that were operating

8
during the 2005/06 school year to analyze the impact of charter schools on student performance.7
They first examine the comparability of those students who entered charter school lotteries and
those students from similar public schools in New York City who did not enter charter school
lotteries. They then compare winners and losers of the lotteries for spots in charter schools.
Comparing charter school applicants and nonapplicants using weighted averages of the
traditional public schools from which the charter schools draw applicants, Hoxby and Murarka
find that charter school applicants and their comparison group are quite similar in terms of
gender ratios and the percentage that are non-Hispanic white, Asian, or "other" race. The charter
applicants group, however, is significantly more black (64 percent versus 50 percent) and less
Hispanic (32 percent versus 45 percent) than the comparison group.8
The forty-two charter schools that Hoxby and Murarka (2009) examine differ
substantially in their methodology, inputs, and ultimate results. The authors sort the styles of
charter schools in New York City into five groups: child-centered/progressive educational
philosophy; general or traditional educational program; rigorous academic focus; schools that
target a specific population of students; and those that focus on a specific aspect of the
curriculum. The schools that are considered to have a rigorous academic focus are likely to be of
high quality, but only twelve of the schools (serving 25 percent of charter students in the study)
can be classified as fitting this model (Hoxby and Murarka 2009). Given that some New York
City charter schools have been closed owing to poor performance, we also know that some of the
charter schools are likely of low quality. Because of the wide variance in charter school quality
They also conclude that
charter school applicants are more likely to be eligible for free or reduced-price lunch than those
in the comparison group, are equally likely to be special education students, and are less likely to
be English Language Learners (ELL).

9
included in this study, we believe that, on average, New York City charter schools are of
medium quality. The environments in which these students are reared can be considered low-
quality, so an analysis of this intervention allows us to examine the impact of medium-quality
schools and a low-quality environment.
By New York law, oversubscribed charter schools must assign admission via random
lottery. When comparing lottery winners to lottery losers, Hoxby and Murarka (2009) find no
significant differences between the groups in terms of the observable characteristics described
above. Between lottery winners who attend and lottery winners who do not attend, those who
attend are slightly more likely to be female and slightly less likely to be special education or ELL
students. Using only those lotteries that were balanced, Hoxby and Murarka find that charter
schools in New York City increase student achievement in grades three through eight by .09
standard deviations in math and .04 standard deviations in reading for each year that a student
spends in the school.9
Boston
Thus, providing students with average-quality schools while maintaining
their low-quality social environment produces modest results.
Abdulkadiroglu and colleagues (2009) compare charter schools against traditional public
school or pilot school attendance in Boston.10 Restricting their analysis to only oversubscribed
charter schools that were operating when data were collected and that had available lottery data,
the authors are able to include five charter middle schools and four charter high schools in their
analysis. Comparing the charter school population to the overall population of Boston Public
Schools, the authors find that Boston charter schools with available lottery data have a higher
percentage of black students (59 percent versus 47 percent in middle schools; 68 percent versus
51 percent in high schools) and a lower percentage of Hispanic students (19 percent versus 37

10
percent in middle schools; 23 percent versus 36 percent in high schools) than traditional public
schools, a finding similar to that of Hoxby and Murarka (2009) in New York City. Charter
students are less likely to be eligible for free or reduced-price lunch or to be ELL students than
students in traditional public schools. Incoming middle and high school charter students also
have substantially higher previous year's test scores in math and ELA than their public school
peers. They conclude, however, that those who enroll in charter schools are similar to the overall
charter lottery group on these characteristics.11
Although it seems clear that Boston charter schools attract a stronger student group than
the average Boston public school, it is difficult to determine whether the Boston charter schools
examined in this study are themselves medium- or high-quality schools. To answer this question,
we examine the individual schools included in the study. All five of the included middle schools
are considered by themselves and others to be “No Excuses” charter schools. Of the four high
schools, one is explicitly a “No Excuses” school, while two others have features that lead many
to consider them to fit into that model.
12
Abdulkadiroglu et al. (2009) find that charter middle school students outperform charter
school applicants who attend traditional public schools by .149 standard deviations per year in
ELA and .405 standard deviations per year in math. Charter high school students have ELA
scores that are .187 standard deviations higher per year in ELA and .274 standard deviations
higher per year in math.
For these reasons, we consider this study to be an
analysis of the impact of mainly high-quality schools on above-average students in low-quality
environments.
13

11
Lynn, Massachusetts
The Knowledge is Power Program (KIPP) is the nation's largest charter school network.
In 2009/10, there were eighty-two KIPP schools in nineteen states and the District of Columbia
serving more than twenty-one thousand students. KIPP was founded in Houston, Texas, in 1994,
by two Teach for America alumni. Founded as a middle school curriculum model, the KIPP
Foundation has since expanded to preschool, elementary, and high school instruction, although
KIPP still serves students mostly in grades five through eight. KIPP schools are characterized by
high expectations (both academically and behaviorally), more time-on-task (longer school day
and school year than in traditional public schools), selective teacher hiring, and a high-
commitment requirement of students, parents, and faculty--the features that distinguish a school
as a “No Excuses” adherent.
Located in Lynn, Massachusetts, KIPP Academy Lynn was founded in 2004, and in
2007/08 served 326 students in grades five through eight. The school serves a student body that
is about half Hispanic and 22 percent black. Eighty-three percent of the student body is eligible
for free or reduced-price lunch, and seventeen percent of the school is classified as having
special needs.14
Like other KIPP schools and the majority of the Boston charter schools examined by
Abdulkadiroglu et al. (2009), KIPP Lynn is a “No Excuses” charter school, suggesting that this,
too, falls into the category of high-quality school and low-quality environment. The important
distinction between KIPP Lynn and the Boston charter schools is that while the Boston charter
school analysis informs us about the impact of this combination on above-average students,
Angrist et al. (2010) demonstrate that KIPP Lynn students are quite representative of the general
population from which they are drawn. Therefore, the analysis of KIPP Lynn allows us to draw

12
stronger conclusions about the impact of high-quality schools on typical students from a low-
quality environment.
Because of state regulations, KIPP Lynn must fill its incoming class using a lottery if
more students apply than there are spots available. This random assignment of students into--and
out of--the program allows for reliable evaluation of program effects. Angrist et al. (2010) use
lottery data from KIPP Lynn and student data from the Massachusetts Student Information
Management System (SIMS) to compare the performance of KIPP Lynn lottery winners with
those who entered the lottery but did not win a spot in the school.15
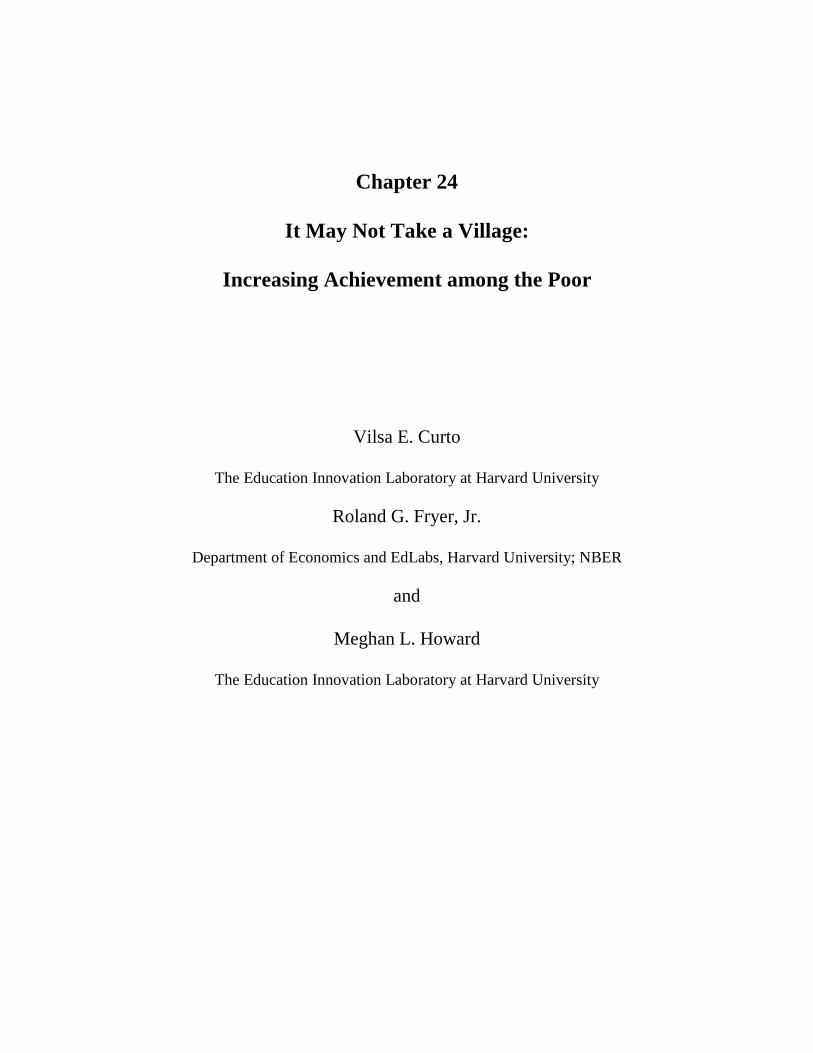
Figure 24.2 plots estimates of the impact of being offered admission into KIPP Lynn on
math (panel A) and reading (panel B) achievement from Angrist et al. (2010). In particular, the
figure plots the coefficients from a regression of achievement test scores on the lottery-offer
dummy interacted with dummies for grade of test times application year, including basic and
demographic controls. In math, the effect of KIPP is quite large and relatively linear over time
for all cohorts except the 2005 cohort in their eighth grade year. Reading achievement follows a
similar, though more muted, pattern.
Using test scores from the
Massachusetts Comprehensive Assessment System (MCAS) and a two-stage least squares
analysis strategy, with the random lottery assignment serving as an instrument for time spent at
KIPP Lynn, Angrist and colleagues find that KIPP Lynn significantly improves student
performance. Students improve by .35 standard deviations in math and .1 to .15 standard
deviations in ELA for each year at KIPP Lynn.
Angrist et al. (2010) also examine the effects of attending KIPP Lynn for various
subgroups of students. A major criticism of charter schools is that although schools like KIPP
Lynn serve largely poor and minority communities, these schools often have lower percentages
13
of special education or ELL students than traditional public schools serving the same community
and that the gains made by students in these schools are made by students at the upper end of the
ability distribution among poor and minority students. Angrist and colleagues find that the
opposite is true at KIPP Lynn: ELA gains are actually driven by the ELL group, which also
experiences stronger gains in math than non-ELL students. Special education students have
similar results. Furthermore, they find that students whose baseline scores are .5 standard
deviations below the mean have achievement gains that are .05 to .08 standard deviations higher
than those students whose baseline achievement is at the mean.
Social Environment Interventions
There have been many efforts to vary the social environment of poor minority children
with the goal of increasing academic achievement. Rosenbaum (1995) documents the impact of
the Gautreaux housing program on the outcomes of low-income families in Chicago.16 The
Gautreaux program granted housing vouchers to more than 5,000 families, quasi-randomly
assigning the families to move either to middle-income, predominantly white suburbs or to low-
income, predominantly black, urban neighborhoods. Rosenbaum finds that students from
families that moved to suburban neighborhoods were more likely to attend college and, if not
attending college, to be employed full-time than children whose families were relocated to low-
income urban neighborhoods. Using data from the 1989 NBER Boston Youth Survey, Case and
Katz (1991) find that measured family background traits are highly correlated with the
socioeconomic outcomes of disadvantaged youth. They also conclude that neighborhood effects
in the form of peer influences have a strong impact on youth outcomes: youths who live in
neighborhoods with high rates of crime, drug use, and idleness are more likely to have similar
outcomes.

14
The most comprehensive effort to quantify the importance of neighborhood effects was
the Moving to Opportunity (MTO) experiment. Operating under the same general model as the
Gautreaux program, MTO provided housing vouchers to low-income families in a randomized
manner. One group of families received housing vouchers that were eligible for use in low-
poverty neighborhoods ("restricted vouchers"), one group received regular Section 8 housing
vouchers that had no neighborhood restrictions, and one group received no housing vouchers but
was still eligible for public housing. The program operated between 1994 and 1997 in Boston,
Baltimore, Chicago, Los Angeles, and New York and included 4,248 families. Forty-seven
percent of the restricted voucher families and 59 percent of the Section 8 voucher families used
their vouchers to move to a new apartment (Sanbonmatsu et al. 2006).
MTO succeeded in changing the neighborhood environments of the children from
families that were offered restricted vouchers. These families lived in neighborhoods with lower
poverty rates, lower unemployment rates, and reported feeling safer in their neighborhoods,
among other neighborhood improvements (Kling, Liebman, and Katz 2007; Sanbonmatsu et al.
2006). The program's effects on improving school quality for the children who moved were
much smaller than neighborhood effects, however. Schools attended by treatment students had
only marginally better state exam scores than schools attended by control students (nineteenth
percentile compared to fifteenth percentile), a slightly lower percentage of students eligible for
free lunch, and there was no difference in the average student-teacher ratio at these schools
(Sanbonmatsu et al. 2006). Because the school quality was largely unchanged for these children,
we consider the schools they attended to be of low quality. The neighborhoods they moved to,
however, were a significant improvement over the status quo on measurable characteristics; thus

15
we consider the environments to be of medium quality. Therefore, MTO allows us to examine
the impact of low-quality schools and medium-quality neighborhoods on student achievement.17
Sanbonmatsu et al. (2006) find that MTO had insignificant effects on student
achievement in reading and math, grade retention, student engagement in school, and enrollment
in either gifted or remedial education courses. Kling, Liebman, and Katz (2007) find that living
in an area with lower poverty rates leads to large decreases in mental health issues [-1.84 (.50)
standard deviations] and risky behavior [-.94 (.39) standard deviations] for female youth.
However, they find an increase in physical health problems [1.07 (.49) standard deviations] and
risky behavior [1.46 (.54) standard deviations] for male youth. Kling, Ludwig, and Katz (2005)
find a similar female-male differential in arrest rates: females in MTO had fewer lifetime violent
crime arrests, lifetime property crime arrests, and total lifetime arrests than control group
females, while MTO male youth experienced an increase in lifetime property crime arrests
compared to control group males and had higher scores on the self-report behavior problems
index. On the basis of this evidence, we conclude that changing a student's neighborhood from
low to medium quality, while keeping school quality constant, does not increase achievement.
Parental and Home Environment Interventions
Many argue that to improve children's educational outcomes, one must improve the
family and social environments in which the children are reared. A myriad of programs have
attempted to change a student's family environment in ways that are believed to improve
educational outcomes. Opportunity NYC is a conditional cash transfer program that offers cash
incentives to families living in high-poverty communities in New York for specific education,
health care, and employment target behaviors. For instance, families are given $25 per parent-
teacher conference they attend, $50 for obtaining a library card, and $600 for each Regents exam

16
that their high school children pass. Miller, Riccio, and Smith (2009) find that after one year in
this program, there are no effects on elementary or middle school students and that there are
small effects for high school students on attendance, number of credits attempted (but not
number of credits completed), and percentage of students taking and passing at least one Regents
exam. However, these effects are largely driven by the particular subgroup of ninth graders
considered academically prepared for high school.
Overall, research on the impact of parent intervention programs on student achievement
has been weak. In a chapter in this volume, Furstenberg reviews the existing literature, both
experimental and nonexperimental, on parental and family intervention programs at different
stages in a child's development. He concludes that the impact of "micro-level" intervention
programs designed to change parental or family habits along a specific dimension is likely
overestimated by policymakers.
Coupling Community and School Investments
The SEED School
SEED schools, America's only urban public boarding schools, provide a rich laboratory
to help understand the social environment versus schools debate. Located in Washington, DC,
and Baltimore, the SEED schools serve students in grades six through twelve. They combine a
curriculum model that shares some characteristics with many of the successful charter schools
with a residential boarding program. Students live on-campus five days a week, returning home
only for weekends.
Academic Program

17
The academic component of the SEED model is comprised of a middle school program
and a high school program. The middle school curriculum is focused on basic skills with the goal
of allowing all students to enter the high school program performing at or above grade level. The
benchmark standards that middle school students must master before promotion to high school
are referred to as the "Gate." Students who need more time to master grade-level skills can take a
“growth year” during middle school. The middle school curriculum uses a readers and writers
workshop model for language arts instruction and is designed such that all students will have
taken algebra before entering high school.
The high school curriculum is a college-preparatory program for all students. To
graduate, students must complete four years each of English and mathematics (through Algebra
II); three years each of social studies, science, and a foreign language; one and a half years of
physical education and health; one year of arts; a half year each of U.S. government and politics,
DC history, and technology; and five and a half years' worth of elective courses. In addition to
course requirements, students must also take the SAT or ACT college admissions test, apply to at
least five colleges or universities, and complete sixty hours of community service in order to
graduate. The school offers advanced placement courses in English Literature, English
Language, U.S. History, Government, and Biology.
Both the DC and Maryland schools at the middle and high school levels have an extended
school day, from 8 A.M. until 4 P.M., and provide students with extensive afterschool tutoring as
needed. Instruction within the schools relies heavily on data. SEED uses internal interim
assessments and has data days every quarter for the staff (both academic and boarding) to review
student data. There is a strong emphasis on college preparation from the time the students enter
the school, which begins more informally in middle school and is a formal part of the curriculum

18
in high school. The SEED model espouses year-round education; while the schools are only open
for a traditional school year, they strive to place all of their students in educational programs
during the summer months.
Residential Program
From Sunday evening through Friday afternoon, students live on campus in double
bedrooms in same-sex dorms. Students are organized into "houses" of twelve to fourteen
students within the dormitories. The houses are all named for a college or university and have
study hall and meal times together, as well as other activities such as book clubs, field trips, and
community service. The school offers a wide range of athletic and other extracurricular activities
to students after school hours, as well as a program known as HALLS (Habits for Achieving
Life-Long Success) that teaches students study skills, time management, and interpersonal
communication, among other valuable life skills. Students can complete homework in their dorm
rooms or in one of the common study spaces available throughout the dormitory. There is a
computer in each dorm room as well as in the common areas, and the residential staff is available
during homework times to answer any questions that students might have. The residential staff is
separate from the school faculty, although the two groups interact often to discuss student
progress.
Despite the fact that students are living away from their families for the majority of the
week, SEED emphasizes parental involvement to whatever level possible. Through events such
as community dinners, SEED attempts to draw parents into the school community; parents are
also given the opportunity to serve as tutors during study hall, assist during extracurricular
activities, and participate in book clubs.

19
We argue that SEED provides its students with a medium-quality environment. While the
schools offer students a very structured, safe, and nurturing environment that is somewhat
removed from the risks and distractions they would normally face in their status quo low-quality
environments, the schools are still located in Washington, DC, and Baltimore. The DC SEED
School is located in one of the most impoverished wards in the city, an area marked by public
housing and other signs of urban blight. In addition, SEED sends its students home to low-
quality environments every weekend.
We also argue that SEED is a high-quality school, similar to other "No Excuses" charter
schools. SEED provides a rigorous college preparatory curriculum for its students and
incorporates many of the elements common to "No Excuses" schools, such as extended
instructional time and the use of data to drive student instruction. SEED, therefore, allows us to
examine the effect on student achievement of the interaction of high-quality schools and a
medium-quality environment.
Curto and Fryer (2010) estimate the impact of being offered admission into SEED
schools on reading and math achievement. For the 2007 and 2008 cohorts of lottery applicants to
the SEED School in Washington, D.C., the impact of being offered admission into SEED is .188
(.087) in reading and .218 (.081) in math. If one instruments for enrollment in SEED with lottery
assignment, the standard approach in the charter school evaluation literature (Abdulkadiroglu et
al. 2009; Angrist et al. 2010; Dobbie and Fryer 2009), the impact of attending SEED schools on
achievement is .198 (.093) in reading and .230 (.084) in math, per year.18 These effects are large
and comparable in magnitude to those reported for high-performing charter schools such as the
Harlem Children’s Zone (Dobbie and Fryer 2009) and KIPP (Angrist et al. 2010), but come at a
far steeper price. However, an important qualification is that the positive effects are entirely

20
driven by the performance of girls. That is, the impact of attending SEED for boys is statistically
zero (-0.138 (0.145) in reading and 0.037 (0.156) in math) and for girls is 0.382 (0.155) in
reading and 0.265 (0.142) in math. The overall evidence from the SEED School of DC suggests
that changing a student’s social environment and putting the student in high-quality schools has
positive results, though these are mainly driven by female students.
Harlem Children's Zone
The Harlem Children's Zone (HCZ), which began in 1970 as an amalgam of after-school
programs, truancy-prevention services, and antiviolence training for teenagers in schools, offers
an extremely rare chance to estimate the impact on student achievement of being exposed to “No
Excuses” charter schools and significant community investments.
HCZ offers a number of programs, which we have partitioned into “community”
investments and “school” investments. Community programs are available to anyone living near
HCZ, and serve 8,058 youth and 5,291 adults. School programs are only available to the
approximately 1,300 students who attend the HCZ public charter schools.
Community Investments
HCZ has more than twenty programs in its ninety-seven blocks designed to help and
empower individuals. These investments include early childhood programs (Head Start, for
example); public elementary, middle, and high school programs (such as karate, dance,
afterschool tutoring); a college success office; family, community and health programs; foster
care prevention services; and so on. The vision of Geoffrey Canada, CEO of the Harlem
Children's Zone, is to "create a tipping point" in the neighborhood so that children are
surrounded by an enriching environment of college-oriented peers and supportive adults. This is

21
consistent with the vision articulated by scholars and policymakers who argue that communities,
not schools, are responsible for the achievement gap. For a more detailed analysis of HCZ
community programs, see Dobbie and Fryer (2009).
School Investments
The HCZ Promise Academy public charter schools began in fall 2004 with the opening of
the HCZ Promise Academy elementary and middle schools, followed in fall 2005 by the opening
of the HCZ Promise Academy 2 Elementary School.19 The HCZ Promise Academy will enroll a
new kindergarten and sixth-grade cohort each year until it is a full K-12 school, while HCZ
Promise Academy 2 will enroll a new kindergarten cohort each year until it is a full K-12
school.20
The HCZ Promise Academies have an extended school day and year, with coordinated
afterschool tutoring and additional classes on Saturdays for children who need remediation in
mathematics and English Language Arts skills. Our rough estimate is that HCZ Promise
Academy students who are behind grade level are in school for twice as many hours as a
traditional public school student in New York City. Students who are at or above grade level still
attend the equivalent of about 50 percent more school in a calendar year. Some would argue that
these extended hours necessarily constitute an environmental intervention due to the fact that for
these hours, the school acts as a substitute for the home or neighborhood environment. While we
do not debate the existence of this substitution effect, we nonetheless consider this extended time
model to be a school intervention. During the extended time, students are receiving traditional
instruction, as opposed to participating in more piecemeal or community-based extracurricular
activities. Furthermore, extended time is an intervention that schools can implement on their
own; many "No Excuses" charter schools require more in-school hours from students than

22
traditional public schools. In this and other ways, we consider school interventions to be those
policies within the control of schools, rather than the set of policies common to all high-
achieving schools, as we imagine the second list would be rather short.
Both schools emphasize the recruitment and retention of high-quality teachers and use a
test-score value-added measure to create incentives and evaluate current teachers. The schools
have had high turnover as they search for the most effective teachers: 48 percent of HCZ
Promise Academy teachers did not return for the 2005/06 school year, 32 percent left before
2006/07, and 14 percent left before 2007/08. Each teacher has an annual meeting with Geoffrey
Canada to discuss his or her performance and is supported by myriad behind-the-scenes efforts to
make sure his or her time is spent primarily on teaching and not on administrative tasks.
Another key element of HCZ's instructional model is the reliance on data-driven
instruction at the HCZ Promise Academy. The schools administer formative assessments to all
students at regular intervals. The results of these assessments are analyzed to determine which
skills each student has not yet mastered, and teachers create plans to address these weaknesses.
The remediation plans often include afterschool tutoring or Saturday school time devoted to
improving these skills in a way that is coordinated with and integrated into the regular school
curriculum.
The schools provide free medical, dental, and mental health services (students are
screened upon entry and receive regular check-ups through a partnership with the Children's
Health Fund); student incentives for achievement (such as money or trips to France); high-
quality and nutritious cafeteria meals; support for parents in the form of food baskets, meals, bus
fare, and so forth; and less tangible benefits such as the support of a committed staff. The schools
also make a concerted effort to change the culture of achievement, surrounding students with
23
reminders of the importance of hard work in achieving success. These types of school
investments are consistent with those recommended by experts who argue that high-quality
schools are enough to close the achievement gap.
Dobbie and Fryer (2009) use two separate statistical strategies to estimate the causal
impact of HCZ charter schools on student achievement. First, they exploit the fact that HCZ
charter schools are required to select students by lottery when the number of applicants exceeds
the number of available slots for admission. In this scenario, the treatment group is composed of
students who are lottery winners and the control group consists of students who are lottery losers.
The second identification strategy explored in Dobbie and Fryer (2009) uses the interaction
between a student's home address and his or her cohort year as an instrumental variable. This
approach takes advantage of two important features of the HCZ charter schools: (1) anyone is
eligible to enroll in HCZ's schools, but only students living inside the zone are actively recruited
by HCZ staff; and (2) there are cohorts of children who are ineligible owing to their age at the
time of the schools' openings.
Both statistical approaches lead to the same basic story. Harlem Children's Zone is
effective at increasing the achievement of the poorest minority children, closing the gap between
poor minority students and the average white student in New York City public schools in math
and English Language Arts in elementary school and math in middle school.
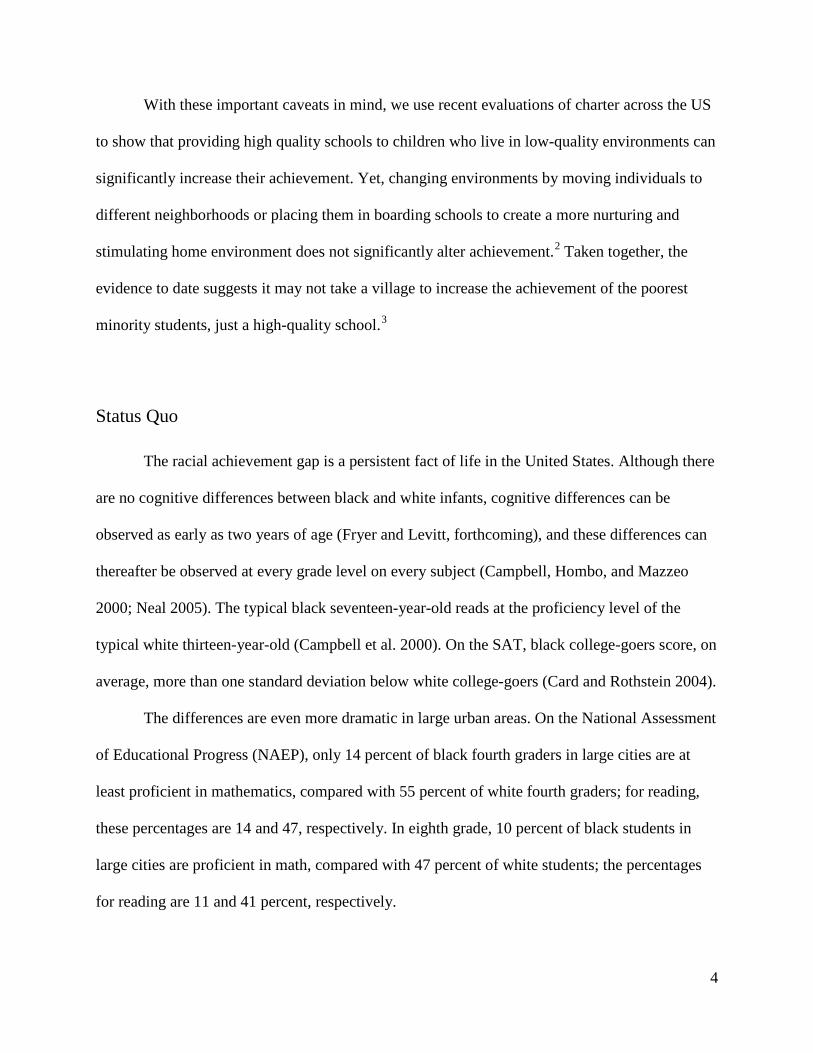
Figures 24.3a and 24.3b provide a visual representation of the basic results from HCZ
Promise Academy--Middle School, reported in Dobbie and Fryer (2009). Figure 24.3a plots
yearly, raw, mean state math test scores from fourth to eighth grade for four subgroups: lottery
winners, lottery losers, white students in New York City public schools and black students in

24
New York City public schools. The difference between the lottery winners and lottery losers
lines represents the impact of being offered admission to HCZ Promise Academy.
In fourth and fifth grade, before entering middle school, math test scores for lottery
winners, losers, and the typical black student in New York City are virtually identical, and
roughly .75 standard deviations behind the typical white student.21
The effect of attending the HCZ Promise Academy Middle School on math scores is
depicted in figure 24.3b. These results follow a similar pattern, showing remarkable convergence
between children in the middle school and the average white student in New York City. After
three years of being enrolled, HCZ Promise Academy students have nearly closed the
achievement gap in math. They are behind their white counterparts by .121 standard deviations
(p-value = .113). If one adjusts for gender and free lunch, the typical eighth grader enrolled in the
HCZ middle school outscores the typical white eighth grader in New York City public schools
by .087 standard deviations, although the difference is not statistically significant (p-value =
.238).
Lottery winners have a
modest increase in sixth grade, followed by a more substantial increase in seventh grade and
even larger gains by their eighth-grade year.
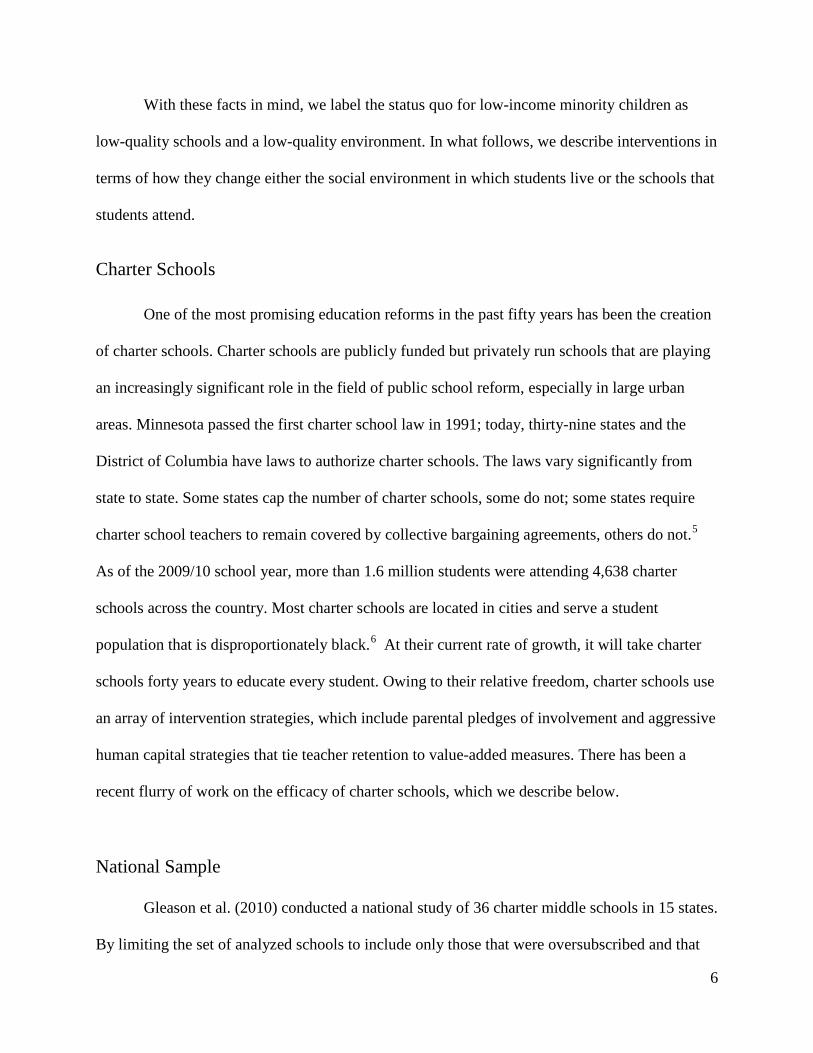
Figure 24.4a plots yearly state ELA test scores from fourth to eighth grade. Treatment
and control designations are identical to those in figure 24.3a. In fourth and fifth grade, before
they enter the middle school, ELA scores for lottery winners, losers, and the typical black student
in New York City are not statistically different, and are roughly .65 standard deviations behind
those of the typical white student.22 Lottery winners and losers have very similar ELA scores
from fourth through seventh grade. In eighth grade, HCZ Promise Academy students distance
themselves from the control group. These results are statistically meaningful, but much less so

25
than the math results. The estimate of the effect of attending HCZ Promise Academy, depicted in
figure 24.4b, follows an identical pattern with marginally larger differences between enrolled
middle school students and the control group. Adjusting for gender and free lunch pushes the
results in the expected direction.23

26
Better Neighborhoods, Engaged Parents, More Effective Schools, or All of the Above? The ideal data to distinguish whether we should invest in neighborhoods or schools
would come from an experiment in which we randomly distributed a common population into
high-quality schools, high-quality schools coupled with a better social environment, and a better
social environment without high-quality schools. We do not have these data, but we know the
impact of high-quality schools from Abdulkadiroglu et al. (2009) and Angrist et al. (2010). We
also have a good sense of the impact of changing the social environment from MTO and SEED.
Taken together, these examples provide good, but clearly not gold standard, evidence that high-
quality schools are enough to significantly improve the academic achievement of the poorest
minority students.
There are four additional pieces of evidence that, taken together, suggest it does not take
a village to close the racial achievement gap--just a great school. First, Dobbie and Fryer (2009)
find no correlation between participation in community programs in HCZ and academic
achievement. Second, Dobbie and Fryer (2009) report that children inside the zone garnered the
same benefit from the schools as those outside the zone, suggesting that proximity to the
community programs is unimportant. Third, siblings of HCZ students who are in regular public
schools, but likely have better-than-average access and information about HCZ community
programs, have marginally lower absences but their achievement is unchanged (Dobbie and
Fryer 2009). Fourth, Curto and Fryer (2011) show that students admitted to SEED schools (“No
Excuses charter schools with a five-day-a-week boarding program) have similar increases in
achievement as similar students admitted to “No Excuses” schools that do not contain a boarding
27
option. This, coupled with the results from MTO, suggests that the marginal benefit on
achievement of taking students out of their home environment is small.
Again, we still need to run the ideal experiment and our conceptual matrix is admittedly
ad hoc, but the only fair reading of the available data is that schools are a stronger driver of
student achievement than is environment.
Conclusion: Four Caveats to the Success of “No Excuses” Charter Schools
There is a tremendous amount of enthusiasm surrounding the success of charter schools
and their ability to educate even the poorest minority students. In July 2009, the federal
government announced "Race to the Top," a two-phase grant program in which states apply for a
share of $4.35 billion to improve public schools. The program is designed to give states
incentives to advance education reform in specific areas. Charter schools have been leading the
way in many of the targeted reform areas, such as data-driven instruction and performance pay
for teachers. U.S. Secretary of Education Arne Duncan declared that states that sought to limit
the growth of charter schools would "jeopardize" their Race to the Top applications. Another
federal government grant program, the Public Charter Schools Program, explicitly targets the
expansion of charter school coverage, awarding grants to state educational agencies to support
the planning, development, and initial implementation of charter schools.
The private sector is also investing in the success of charter schools. The Charter School
Growth Fund is a social venture investment fund that is backed by more than $100 million and
supports charter school operators who can demonstrate evidence of improving the educational
achievement of underserved students. These are just a few of the many programs and initiatives
that reflect a growing consensus that charter schools are the way forward to close the racial

28
achievement gap and improve educational achievement for all children. However, what if charter
schools are not the panacea that people increasingly believe them to be?
We conclude with four potentially important caveats to the recent success of charter
schools that are worth considering carefully and for which, to date, there are no solid data to lead
the way. First, can charter school strategies educate every child? Many charter schools have strict
entry requirements or a tedious application process. KIPP makes parents sign a pledge that holds
them responsible for their children's attendance (including on Saturdays and during the summer),
for their children's adherence to the school dress code, and for their children's behavior, among
other commitments. Achievement First has a similar parent contract requirement. The 2007/08
application for the SEED school in Washington, DC, was twelve pages long, including a student
essay portion. The Maryland SEED application process currently requires parents to request an
application, which is mailed to them and that they must then complete and return.
All three of these networks--KIPP, Achievement First, and SEED--have a strong college
focus from the time students enter, which could serve to attract only more motivated students and
families. The average charter student who enters a charter school is more academically prepared
than the typical public school student with similar demographics. Lottery estimates are only valid
for making inferences about the (potentially self-selected) set of people who signed up for a
lottery. Estimates based on these individuals do not necessarily generalize to the larger public.
Discussing the effectiveness of randomized control trials in development economics, Deaton
(2009) argues that randomization is not enough to measure the impact of policy interventions
because what randomized control trials truly allow one to assess is the local average treatment
effects of the program, rather than the impact of the program across all treatment recipients or
the impact that the program would have on the population as a whole. We do not have a good
29
sense of how effective charter strategies might be in an average public school with parents who
might refuse to sign a pledge, might be unwilling to fill out a twelve-page application, and so on.
Furthermore, many charter school critics argue that even if charter schools originally
admit a random sample of the community, there is a significant difference in attrition rates
between charter and traditional public schools (for example, Buckley and Schneider 2009;
Frankenberg, Hawley, and Wang 2010). Although there is a large variance in attrition rates in
charter schools, those such as the KIPP schools in the San Francisco Bay Area garnered much
attention when they lost over half of their 2003 cohort between fifth and eighth grades
(Woodworth et al. 2008). Mac Iver and Farley-Ripple (2007) find that the students who left
KIPP schools had lower test scores than those who stayed, suggesting that there is some degree
of differential attrition in charter schools.
This latter critique is not likely an issue because the estimates of the impact of being
offered admission into a charter school include all students who won the lottery whether or not
they attended the school. Per usual, these estimates are smaller than the estimates of the impact
of actually attending a charter school, but taking the former estimates at face value would likely
generate the same level of enthusiasm. The concern in Deaton (2009), however, is still
potentially very important.
Second, many charter schools have aggressive human capital strategies. We have little
idea what the equilibrium in the teacher market would look like if all schools were to implement
these strategies. In the first year, Harlem Children's Zone fired 48.6 percent of its teachers. “No
Excuses” charter schools routinely require their teachers to work sixty-plus hours per week with
only a two-week break over the summer (Carter 2000). At KIPP, teachers are expected to be
available 24 hours a day by phone to students. Teacher attrition in charter schools is 20-25

30
percent overall, but close to 40 percent for new teachers (Miron and Applegate 2007). Many
have argued that this strategy might not be sustainable, as it might lead to teacher burnout among
even experienced, talented, reform-minded teachers (Hubbard and Kulkarni 2009). Carter (2000)
describes effective charter principals as having to "scour the country" for suitable teachers,
which further suggests that the teacher recruiting model of successful charter schools might not
be scalable. It is unclear whether the supply can keep pace with demand in this environment. On
the other hand, as charter management organizations such as KIPP and HCZ grow to encompass
an entire kindergarten through twelfth grade model, the heroic effort by teachers to ensure that
students are achieving at grade level may take substantially less effort, since students will be less
likely to fall as far behind in the first place.
A third question is whether the increases in achievement test scores will translate into
college graduation and other desirable life outcomes. While we know that educational
achievement is correlated with positive life outcomes, we have not yet determined the causal
impact of education on these outcomes. Early anecdotal evidence suggests that some charter
schools are struggling to get their students through college, despite their early emphasis on
college completion and high achievement test scores. From the first graduating class (2004) at
the SEED School in Washington, D.C., only two students completed college within four years;
only seven students—or 33 percent—completed college within six years. One of the goals of
KIPP NYC is for 75 percent of their eighth grade alumni to complete college within six years of
high school graduation, but currently only 50 percent of eighth grade alumni are on this track.
A final question, which encompasses some of the concerns above, is whether charter
school practices can be boiled down into a form that can be used in traditional public schools.
KIPP seems to be highly successful at building new schools, but it is too early to tell whether

31
their early successes are being replicated. Many of the charter management organizations that
manage networks of charter schools provide some evidence that it is possible. Yet, it is unclear
whether there are enough people like Dave Levin, Mike Feinberg, Geoffrey Canada, and the
other dynamic leaders who manage these organizations to absorb this demand.
Assuming that we do not have this ample supply, there are two options: allow market
forces to ensure that only gap-closing schools can thrive or figure out what makes charter
schools work and try to replicate those strategies in traditional public schools. For this reason,
and because of the caveats above, it will be a difficult task. If this is successful, however, there is
a chance to transform the state of poverty and racial inequality in the United States.

32
References
Abdulkadiroglu, Atila, Joshua Angrist, Susan Dynarski, Thomas J. Kane, and Parag Pathak. 2009. "Accountability and Flexibility in Public Schools: Evidence from Boston's Charters and Pilots." Working paper 15549. Cambridge, MA: National Bureau of Economic Research.
Angrist, Joshua D., Susan M. Dynarski, Thomas J. Kane, Parag A. Pathak, and Christopher R. Walters. 2010. "Who Benefits from KIPP?" Working paper 15740. Cambridge, MA: National Bureau of Economic Research.
Borman, Geoffrey D., Gina M. Hewes, Laura T. Overman, and Shelley Brown. 2003. "Comprehensive School Reform and Achievement: A Meta-Analysis." Review of Educational Research 73(2): 125-230.
Brooks-Gunn, Jeanne, and Lisa B. Markman. 2005. "The Contribution of Parenting to Ethnic and Racial Gaps in School Readiness." The Future of Children 15(1): 139-168.
Buckley, Jack, and Mark Schneider. 2009. Charter Schools: Hope or Hype? Princeton, NJ: Princeton University Press.
Campbell, Jay R., Catherine M. Hombo, and John Mazzeo. 2000. "NAEP 1999 Trends in Academic Progress: Three Decades of Student Performance." National Center for Education Statistics Reports, no. 2000-469. Washington: U.S. Government Printing Office.
Card, David, and Jesse Rothstein. 2004. "Racial Segregation and the Black-White Test Score Gap." Unpublished paper. Princeton University.
Carter, Samuel Casey. 2000. No Excuses: Seven Principals of Low-Income Schools Who Set the Standard for High Achievement. Washington, DC: Heritage Foundation.
Case, Anne, and Lawrence F. Katz. 1991. "The Company You Keep: The Effects of Family and Neighborhood on Disadvantaged Youth." Working paper W3705. Cambridge, MA: National Bureau of Economic Research.
Currie, Janet, and Duncan Thomas. 1995. "Does Head Start Make a Difference?" American Economic Review 85(3): 341-364.
Curto, Vilsa, and Roland Fryer. 2010. “Estimating the Returns to Urban Boarding Schools: Evidence from SEED.” Working paper, Harvard University.
Darity, William A., and Patrick L. Mason. 1998. "Evidence on Discrimination in Employment: Codes of Color, Codes of Gender." Journal of Economic Perspectives 12(2): 63-90.
Deaton, Angus. 2009. "Instruments of Development: Randomization in the Tropics, and the Search for the Elusive Keys to Economic Development." Working paper 14690. Cambridge, MA: National Bureau of Economic Research.
Decker, Paul T., Daniel P. Mayer, and Steven Glazerman. 2004. "The Effects of Teach for America on Students: Findings from a National Evaluation." Discussion paper 1285-04. Madison, WI: Institute for Research on Poverty.
Dobbie, Will, and Roland Fryer. 2009. "Are High Quality Schools Enough to Close the Achievement Gap? Evidence from a Social Experiment in Harlem." Working paper 15473. Cambridge, MA: National Bureau of Economic Research.
Duncan, Greg J., and Katherine A. Magnuson. 2005. "Can Family Socioeconomic Resources Account for Racial and Ethnic Test Score Gaps?" The Future of Children 15(1): 35-54.

33
Ferguson, Ronald. 2001. "Test Score Trends Along Racial Lines, 1971 to 1996: Popular Culture and Community Academic Standards." In America Becoming: Racial Trends and Their Consequences, Volume 1, edited by Neil J. Smelser, William Julius Wilson, and Faith Mitchell. Washington, DC: National Academies Press.
Frankenberg, Erica, Genevieve Siegel-Hawley, and Jia Wang. 2010. "Choice without Equity: Charter School Segregation and the Need for Civil Rights Standards." Los Angeles: The Civil Rights Project/Proyecto Derechos Civiles at UCLA.
Fryer, Roland. Forthcoming. "Racial Inequality in the 21st Century: The Declining Significance of Discrimination." In Handbook of Labor Economics, Volume 4, edited by Orley Ashenfelter and David Card. Amsterdam and New York: North Holland.
________. 2010. "Financial Incentives and Student Achievement: Evidence from Randomized Trials." Working paper 15898. Cambridge, MA: National Bureau of Economic Research.
Fryer, Roland, and Steven Levitt. 2006. "The Black-White Test Score Gap Through Third Grade." American Law and Economics Review 8(2): 249-281.
________. Forthcoming. "Testing for Racial Differences in the Mental Ability of Young Children." American Economic Review.
Gleason, Philip, Melissa Clark, Christina Clark Tuttle, and Emily Dwoyer. 2010. The Evaluation of Charter School Impacts: Final Report. NCEE 2010-4030. Washington, DC: US Department of Education.
Hart, Betty, and Todd R. Risley. 1995. Meaningful Differences in the Everyday Experience of Young American Children. Baltimore: Brookes.
Herrnstein, Richard J., and Charles Murray. 1994. The Bell Curve: Intelligence and Class Structure in American Life. New York: The Free Press.
Hoxby, Caroline Minter. 1996. "How Teachers' Unions Affect Education Production." Quarterly Journal of Economics 111(3): 671-718.
Hoxby, Caroline M., and Sonali Murarka. 2009. "Charter Schools in New York City: Who Enrolls and How They Affect Their Students' Achievement." Working paper 14582. Cambridge, MA: National Bureau of Economic Research.
Hubbard, Lee, and Rucheeta Kulkarni. 2009. "Charter Schools: Learning from the Past, Planning for the Future." Journal of Educational Change 10: 173-189.
Jacob, Brian A. 2005. "Accountability, Incentives and Behavior: Evidence from School Reform in Chicago." Journal of Public Economics 89(5-6): 761-796.
Jacob, Brian A., and Lars Lefgren. 2004. "Remedial Education and Student Achievement: A Regression Discontinuity Analysis." Review of Economics and Statistics 86(1): 226-244.
________. 2009. "The Effect of Grade Retention on High School Completion." American Economic Journal 1(3): 33-58.
Jacob, Brian, and Jens Ludwig. 2008. "Improving Educational Outcomes for Poor Children." Working paper 14550. Cambridge, MA: National Bureau of Economic Research.
Jencks, Christopher. 1998. "Racial Bias in Testing." In The Black-White Test Score Gap, edited by Christopher Jencks and Meredith Phillips. Washington, DC: Brookings Institution Press.
Jensen, Arthur A. 1973. Educability and Group Differences. New York: The Free Press. Jepsen, Christopher, and Steven Rivkin. 2002. Class Size Reduction, Teacher Quality, and
Academic Achievement in California Public Elementary Schools. San Francisco, CA: Public Policy Institute of California.

34
Kane, Thomas J., Jonah E. Rockoff, and Douglas O. Staiger. 2008. "What Does Certification Tell Us About Teacher Effectiveness? Evidence from New York City." Working paper 12155. Cambridge, MA: National Bureau of Economic Research.
Kling, Jeffrey R., Jeffrey B. Liebman, and Lawrence F. Katz. 2007. "Experimental Analysis of Neighborhood Effects." Econometrica 75(1): 83-119.
Kling, Jeffrey R., Jens Ludwig, and Lawrence F. Katz. 2005. "Neighborhood Effects on Crime for Female and Male Youth: Evidence from a Randomized Housing Voucher Experiment." Quarterly Journal of Economics 120(1): 87-130.
Krueger, Alan B. 1999. "Experimental Estimates of Education Production Functions." Quarterly Journal of Economics 114(2): 497-532.
Lang, Kevin, and Michael Manove. 2008. "Education and Labor-Market Discrimination." Working paper 12257. Cambridge, MA: National Bureau of Economic Research.
Lauer, Patricia A., Motoko Akiba, Stephanie B. Wilkerson, Helen S. Apthorp, David Snow, and Mya L. Martin-Glenn. 2006. "Out-of-School-Time Programs: A Meta-Analysis of Effects for At-Risk Students." Review of Educational Research 76(2): 275-313.
Mac Iver, Martha Abele, and Elizabeth Farley-Ripple. 2007. "The Baltimore KIPP Ujima Village Academy, 2002-2006: A Longitudinal Analysis of Student Outcomes." Baltimore, MD: Johns Hopkins University, Center for Social Organization of Schools.
Metropolitan Life Insurance, Inc. 2001. The MetLife Survey of the American Teacher 2001: Key Elements of Quality Schools. Rochester, NY: Harris Interactive, Inc.
Miller, Cynthia, James Riccio, and Jared Smith. 2009. "A Preliminary Look at Early Educational Results of the Opportunity NYC -- Family Rewards Program (A Research Note for Funders)." New York: MDRC.
Miron, Gary, and Brooks Applegate. 2007. "Teacher Attrition in Charter Schools." East Lansing, MI: Great Lakes Center for Education Research and Practice.
Neal, Derek. 2005. "Why Has Black-White Skill Convergence Stopped?" Working paper 11090. Cambridge, MA: National Bureau of Economic Research.
Neal, Derek A., and William R. Johnson. 1996. "The Role of Premarket Factors in Black-White Wage Differences." Journal of Political Economy 104(5): 869-895.
Nelson, Charles A. 2000. " The Neurobiological Bases of Early Intervention." In Handbook of Early Childhood Intervention, edited by Jack P. Shonkoff and Samuel J, Meisels. New York: Cambridge University Press.
O'Neill, June. 1990. "The Role of Human Capital in Earnings Differences between Black and White Men." Journal of Economic Perspectives 4(4): 25-45.
Perry, George, and Nancy Kopperman. 1973. "A Better Chance: Evaluation of Student Attitudes and Academic Performance, 1964-1972." Boston: A Better Chance, Inc.
Podgursky, Michael J., and Matthew G. Springer. 2007. "Teacher Performance Pay: A Review." Journal of Policy Analysis and Management 26(4): 909-949.
Puma, Michael, Stephen Bell, Ronna Cook, Camilla Heid, et al. 2010. "Head Start Impact Study: Final Report." Washington: Administration for Children and Families.
Rockoff, Jonah E. 2004. "The Impact of Individual Teachers on Student Achievement: Evidence from Panel Data." American Economic Review 94(2): 247-252.
Rosenbaum, James E. 1995. "Changing the Geography of Opportunity by Expanding Residential Choice: Lessons from the Gautreaux Program." Housing Policy Debate 6(1): 231-269.
Rothstein, Richard. 2004. Class and Schools: Using Social, Economic, and Educational Reform to Close the Achievement Gap. Washington, DC: Economic Policy Institute.
35
Rushton, J. Philippe. 1995. "Thirty Years of Research on Race Differences in Cognitive Ability." Psychology, Public Policy, and Law 113(2): 235-294.
Sanbonmatsu, Lisa, Jeffrey R. Kling, Greg J. Duncan, and Jeanne Brooks-Gunn. 2006. "Neighborhoods and Academic Achievement: Results from the Moving to Opportunity Experiment." Journal of Human Resources 41(4): 649-691.
Schultz, T. Paul, and John Strauss, eds. 2008. Handbook of Development Economics, Volume 4. Amsterdam and New York: North-Holland.
Thernstrom, Abigail, and Stephan Thernstrom. 2004. No Excuses: Closing the Racial Gap in Learning. New York: Simon & Schuster.
Tough, Paul. 2008. Whatever It Takes: Geoffrey Canada's Quest to Change Harlem and America. New York: Mariner Books.
Woodworth, Katrina R., Jane L. David, Roneeta Guha, Haiwen Wang, and Alejandra Lopez-Torkos. 2008. "San Francisco Bay Area KIPP Schools: A Study of Early Implementation and Achievement. Final Report." Menlo Park, CA: SRI International.
Ziedenberg, Jason, and Vincent Schiraldi. 2002. "Cellblocks or Classrooms? The Funding of Higher Education and Corrections and Its Impact on African American Men." Unpublished paper. Justice Policy Institute.
Zimmer, Ron, Brian Gill, Kevin Booker, Stephane Lavertu, Tim R. Sass, and John Witte. 2009. Charter Schools in Eight States: Effects on Achievement, Attainment, Integration, and Competition. Santa Monica, CA: RAND Corporation.

36
Notes
1 Lang and Manove (2006) show that including years of schooling in the Neal and Johnson (1996) specification causes the gap to increase--arguing that when one controls for AFQT performance, blacks have a higher educational attainment than whites and that the labor market discriminates against blacks by not financially rewarding them for their greater education. 2 It is imperative to note that no interventions that have moved students from low- to high-quality environments, such as the "A Better Chance" program, have been credibly evaluated. 3 Although Brihouse and Schouten (this volume) argue that separating influences that are internal to school from those that are external to school is a false dichotomy that is harmful to the policy debate around improving educational outcomes for disadvantaged students, we argue that this distinction is real and significant and frame our categorization of the various interventions we examine to reflect these differences. 4 These statistics can all be accessed through the American FactFinder on the U.S. Census Bureau website and refer to the 2008 American Community Survey 1-Year Estimates. 5 A state-by-state description of charter laws as of 2010 can be found at http://www.charterschoolresearch.com/. This site also ranks the relative "strength" of states' charter school laws. 6 These and other important charter school statistics about schools and students can be found at http://www.publiccharters.org/dashboard/home. 7 Two schools that were excluded did not have any students in test-taking grades, thus their omission has no impact on the analysis of achievement outcomes. One school was in the process of closing during 2005-2006 and the authors could not obtain lottery information from this school. The NY Center for Autism Charter School was excluded because of obvious comparability issues. The United Federation of Teachers Elementary Charter School declined to participate in the study. 8 It should be noted that the comparison group is not representative of the overall population of NYC public schools, which enroll a much larger percentage of both white and Asian students than can be found in the charter applicant or comparison groups. 9 The specification that produced these results was a treatment-on-treated analysis with gender, race/ethnicity, free and reduced-price lunch status, special education status, ELL status, and previous year's test score controls, as well as grade, school, and lottery fixed effects and robust standard errors clustered at the school level. 10 Pilot schools occupy a theoretical middle ground in the Boston schools landscape, with more autonomy than traditional public schools but less than that enjoyed by charter schools. For this discussion, we focus on the charter school results. See Abdulkadiroglu et al. (2009) for results on the effectiveness of pilot schools. 11 This is not true of fourth grade ELA and math test scores for incoming middle school students. The test scores of those who enter the charter school lotteries are higher than those of students who ultimately enroll in charter schools. 12 The fourth high school--Health Careers Academy (HCA)--is a Horace Mann Charter, which means that it shares some important characteristics with pilot schools, such as a unionized teacher pool. Abdulkadiroglu et al. (2009) conduct separate analyses, one including HCA as a charter school and one including HCA as a pilot school. See Abdulkadiroglu et al. (2009) for more on these distinct specifications. 13 These are treatment-on-treated analysis results that include demographic controls. 14 These figures are taken from the KIPP Report Card 2008, which can be accessed on the KIPP website at http://www.kipp.org/about-kipp/results/annual-report-card. 15 Because of differential rates of matching, Angrist et al. (2010) use only data from those students who entered the KIPP Lynn lottery who were initially in Lynn Public Schools. The authors posit that those students who were enrolled in private schools who entered and lost the lottery remained in private school and thus did not have data in SIMS. 16 The program was the response by the Chicago Housing Authority (CHA) to the Supreme Court decision in Hill v. Gautreaux (1976), which declared that the CHA needed to provide more dispersed housing to public housing residents who were at the time living in high-poverty public housing projects. 17 "A Better Chance" (ABC) was founded in 1963 to give low-income minority students with above-average achievement the opportunity to live and attend school in more affluent environments. Originally, many of the students attended independent schools, many of which were elite boarding schools. Today, some students attend independent schools, while others live in ABC houses and attend private or public schools in suburban communities. This program theoretically allows us to examine the impact of high-quality schools and a high-quality environment on the academic achievement of low-income students. Perry and Kopperman (1973) evaluate this program and find

37
positive effects on college attendance and on the selectivity of the colleges attended by ABC alumni. However, these findings must be taken with a grain of salt for two reasons. First, the evaluation is nearly forty years old, and it is difficult to say whether the findings would be the same today. Second, there is an issue of selection bias in the sample. Perry and Kopperman attempted to match ABC scholarship recipients to nonrecipients based on a set of observed characteristics. The program selection was not random, however, so it is possible that those selected for the program differed in some important way from those not selected for the program. In addition, because of ABC's mission to specifically serve high-performing disadvantaged youth, the program cannot tell us anything about the impact of high-quality schools and a high-quality environment on average low-income minority youth. 18 Reported estimates include controls for baseline test scores and demographic characteristics. For the 2007 and 2008 DC cohorts, Curto and Fryer (2010) are able to match 94 percent of the students who signed up for the charter school lottery with test scores from either the District of Columbia Comprehensive Assessment System (DCCAS) or the Maryland School Assessment (MSA). Their analysis is based on results from the SEED School of Washington, D.C., which has been in operation since 1998. The SEED School of Maryland has only been open since 2008. The first year of operation is usually difficult; estimates of effect sizes from the first year may not be representative of the typical effect sizes one would expect (Zimmer et al. 2009). 19 Promise Academy 2 held kindergarten and first-grade lotteries in its first year, enrolling forty students in each grade. After its first year of operation, Promise Academy 2 relocated, and in the process lost a number of students. To simplify our analysis and abstract from the issues created by this relocation, we focus our analysis on Promise Academy. 20 In the fall of 2007, Promise Academy did not enroll a new sixth-grade cohort, and expelled the entire existing eighth-grade cohort (the 2004 lottery cohort). HCZ was unhappy with the performance of the middle school to this point, and the decision was made to focus on the existing sixth- and seventh-grade cohorts in reforming the school. Test data, which were made public months after the decision was made, showed that the 2004 cohort did quite well (Tough 2008). In 2008, the lottery was moved back to fifth grade (Tough 2008). 21 This is similar in magnitude to the math racial achievement gap in nationally representative samples [.882 in Fryer and Levitt (2006), and .763 in Campbell et al. (2000)], and samples with an urban focus (Fryer, forthcoming). 22 This is smaller than the reading racial achievement gap in some nationally representative samples [.771 in Fryer and Levitt (2006), and .960 in Campbell et al. (2000)], but similar to gaps in data with an urban focus (Fryer, forthcoming). 23 Interventions in education often have larger impacts on math scores as compared to reading or ELA scores (see, for example, Decker, Mayer, and Glazerman 2004; Rockoff 2004; Jacob 2005). This may be because it is relatively easier to teach math skills, or because reading skills are more likely to be learned outside of school. Another explanation is that language and vocabulary skills may develop early in life, making it difficult to impact reading scores in adolescence (Hart and Risley 1995, Nelson 2000). For a detailed explanation of the brain development that occurs early in life that can impact a child's language skills, see Nelson and Sheridan (this volume).
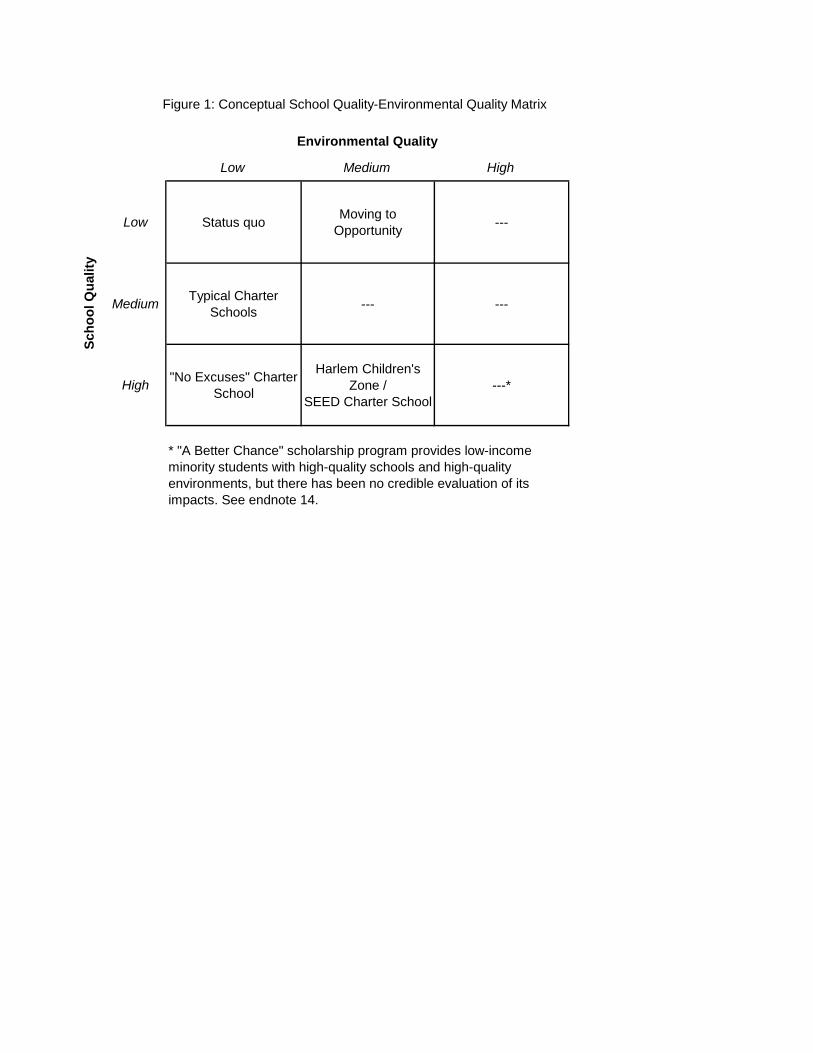
Low Medium High
Low Status quo Moving to Opportunity ---
Medium Typical Charter Schools --- ---
High "No Excuses" Charter School
Harlem Children's Zone /
SEED Charter School---*
* "A Better Chance" scholarship program provides low-income minority students with high-quality schools and high-quality environments, but there has been no credible evaluation of its impacts. See endnote 14.
Scho
ol Q
ualit
y
Environmental Quality
Figure 1: Conceptual School Quality-Environmental Quality Matrix
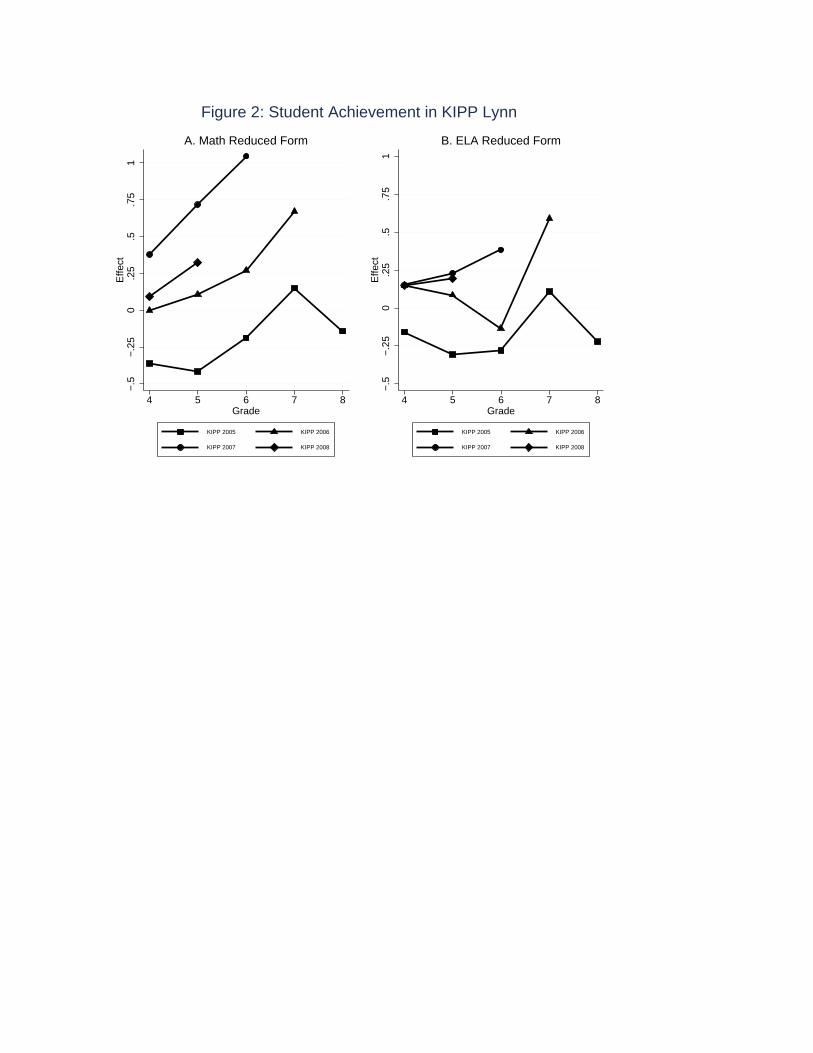
−.5
−.2
50
.25
.5.7
51
Effe
ct
4 5 6 7 8Grade
KIPP 2005 KIPP 2006
KIPP 2007 KIPP 2008
A. Math Reduced Form
−.5
−.2
50
.25
.5.7
51
Effe
ct
4 5 6 7 8Grade
KIPP 2005 KIPP 2006
KIPP 2007 KIPP 2008
B. ELA Reduced Form
Figure 2: Student Achievement in KIPP Lynn

−.5
−.2
50
.25
.5.7
51
Effe
ct
5 6 7 8Grade
HCZ 2005 HCZ 2006
A. Math Reduced Form
−.5
−.2
50
.25
.5M
ath
Sco
re
4 5 6 7 8Grade
Compliers CCM
Avg White Avg Black
B. Math − TOT
Figure 3: Student Achievement in HCZ (Math)

−.5
−.2
50
.25
.5.7
51
Effe
ct
5 6 7 8Grade
HCZ 2005 HCZ 2006
A. ELA Reduced Form
−.5
−.2
50
.25
.5E
LA S
core
4 5 6 7 8Grade
Compliers CCM
Avg White Avg Black
B. ELA − TOT
Figure 4: Student Achievement in HCZ (ELA)
Related Documents