Chapter 22 Benchmarking European Public Procurement Practices: Purchasing of “Fix-Line Telephone Services” and “Paper for Printers” Laura Carpineti, Gustavo Piga, and Matteo Zanza INTRODUCTION Public procurement, estimated as about 16% of European GDP in 2002, faces many challenges in the modern economy (European Commission). 1 One of these is the crucial role in improving the trans- border participation of enterprises to international markets. Indeed, the WTO text of the Agreement of Government Procurement (World Trade Organization, 1996) recognizes “the need for an effective multilateral framework of rights and obligations with respect to laws, regulations, procedures and practices regarding government procurement with a view to achieving greater liberalization and expansion of world trade and improving the international framework for the conduct of world trade…” In addition, it is commonly accepted that public procurement contest design strongly influences the control and monitoring of current public expenditure, the promotion of innovative products and processes, the achievement of the best value for money, and the highest participation of enterprises, especially the SMEs. It is not by chance if, in 2003, two networks on public procurement were constituted: the first one, called Public Procurement Network (PPN), 2 with the main objective of solving problems in cross-border cases relating to public procurement; the second one, named EU Public Procurement Learning Lab (EU Lab), 3 aimed at exchanging best practices and experiences in the field of public purchases and at strengthening networking activities. The challenge of encouraging trans-border participation to tenders resulted in the PPN network reaching in 2005 a significant

Welcome message from author
This document is posted to help you gain knowledge. Please leave a comment to let me know what you think about it! Share it to your friends and learn new things together.
Transcript
Chapter 22
Benchmarking European Public Procurement Practices: Purchasing of “Fix-Line Telephone
Services” and “Paper for Printers” Laura Carpineti, Gustavo Piga, and Matteo Zanza
INTRODUCTION
Public procurement, estimated as about 16% of European GDP in 2002, faces many challenges in the modern economy (European Commission).1 One of these is the crucial role in improving the trans-border participation of enterprises to international markets. Indeed, the WTO text of the Agreement of Government Procurement (World Trade Organization, 1996) recognizes “the need for an effective multilateral framework of rights and obligations with respect to laws, regulations, procedures and practices regarding government procurement with a view to achieving greater liberalization and expansion of world trade and improving the international framework for the conduct of world trade…”
In addition, it is commonly accepted that public procurement contest design strongly influences the control and monitoring of current public expenditure, the promotion of innovative products and processes, the achievement of the best value for money, and the highest participation of enterprises, especially the SMEs.
It is not by chance if, in 2003, two networks on public procurement were constituted: the first one, called Public Procurement Network (PPN),2 with the main objective of solving problems in cross-border cases relating to public procurement; the second one, named EU Public Procurement Learning Lab (EU Lab),3
aimed at exchanging best practices and experiences in the field of public purchases and at strengthening networking activities.
The challenge of encouraging trans-border participation to tenders resulted in the PPN network reaching in 2005 a significant
484 CARPINETI, PIGA & ZANZA
goal. Indeed, the network identified eleven cases of European disputes between contracting authorities and companies. The network contributed to solving ten cases out of eleven, concerning, in particular, suppliers misunderstanding and contracting authorities’ misapplication of rules.4
The challenges of exploring how to achieve significant goals through public procurement and to compare different practices led the EU Lab network to work in 2005 on how European central purchasing bodies procure the same product category through a competitive process. As far as we know, this is the first attempt of comparing procurement practices and performances when purchasing the same good.
However, it is worth pointing out that collected data represent an arguably limited sample of procurement practices for fixed line telephone services and paper for printers. Therefore, caution has to be used when interpreting our results.
In the chapter, we explain the methodology adopted to collect data, then describe the strategy adopted and the results achieved in procuring “fix line telephone services” and “paper for printers.” The chapter ends with a case study and with concluding remarks.
METHODOLOGY
Choice of Product Categories
Two product categories were selected out of several products: fix-line telephone service and paper for printers. They have been chosen as the most appropriate for two main reasons that allow effective benchmarks:
- Homogeneity. Only with very homogeneous products categories it is possible to carry on reliable analysis.
- Spread. They seemed to be the product categories procured by the highest number of institutions.
Structure of the Questionnaires
Distributed questionnaires were structured in six main parts.
Chapter 22: BENCHMARKING EUROPEAN PUBLIC PROCUREMENT PRACTICES 485
- Framework Agreement features. We were interested in knowing the awarding date, the monetary value and the duration of the framework agreement awarded.
- Tender format. This section was aimed at collecting information about the awarding procedure used in traditional tenders and (if relevant) in electronic auctions, open or restricted, and on the format applied: standard paper-based tenders, sealed bid single round, multiple round, or combinatorial tenders.
- Number of lots and participants per lot. We first investigated if the supply framework agreement was divided into lots. Then, we collected information about the feature of the lots procured. Lots can be quantitative (lots containing the same product and referring to the same geographical area), geographical (lots that refer to different geographical area), and qualitative (lots containing different types of product). Finally, per each lot, we requested the number of participants, the price offered, and information about the bidding firm.
- Quality. We gathered information on the quality required only for the "paper for printer" product category. We selected seven specific features: paper basis weight, thickness, ISO white, opacity, coarseness, moisture, permeability. These features constitute the EU standard requirements. We did not collect data about the quality of fix lines telephone services because of the complexity of the service itself. In this case we decided to focus our analysis only on those parameters that could be easily traced by the institutions involved.
- Prices. In this section we focused on awarding prices as well as market prices.
- Awarding criteria. We collected data about the awarding criteria used – the lowest bid or the most economically advantageous offer – and the relative formula applied.
Questionnaires were sent to thirty institutions involved in public procurement, representative of twenty-five European countries.
RESULTS
We received seven responses for the “fixed-line telephone services” questionnaires and eleven for the “paper for printer” ones.

486 CARPINETI, PIGA & ZANZA
The questionnaire on “Fixed Line Telephone Services” was returned by: ABA (Belgium); BBG (Austria); BESHA (Germany); Consip (Italy); Department of Finance (Ireland); SKI (Denmark); Statskontoret (Sweden).
The institutions that returned the questionnaire on “paper for printers” are ABA (Belgium), BBG (Austria), Consip (Italy) Hansel (Finland), MIENFI (France), GSA (Ireland), OGC (UK), PPD5 (Cyprus), SKI (Denmark), Statskontoret (Sweden), and UMIC (Portugal).
The low number of responses is partially justified by the fact that not all the European governments satisfy their needs through a central procurement agency. In fact, the survey conducted in 2004 revealed that ten institutions out of nineteen are considered central purchasing bodies (Piga & Zanza, 2004).
FIX-LINE TELEPHONE SERVICES
Introduction – The Fix-Line Telephone Services Market
Information on “Fix line telephone services” refers to the most relevant aspects of the procurement of services related to calls from fixed line to local, national, international, and mobile numbers. The costs include connection fees. As anticipated, we received only seven feedback forms on this product category because few institutions across Europe procure this service through a competitive process.
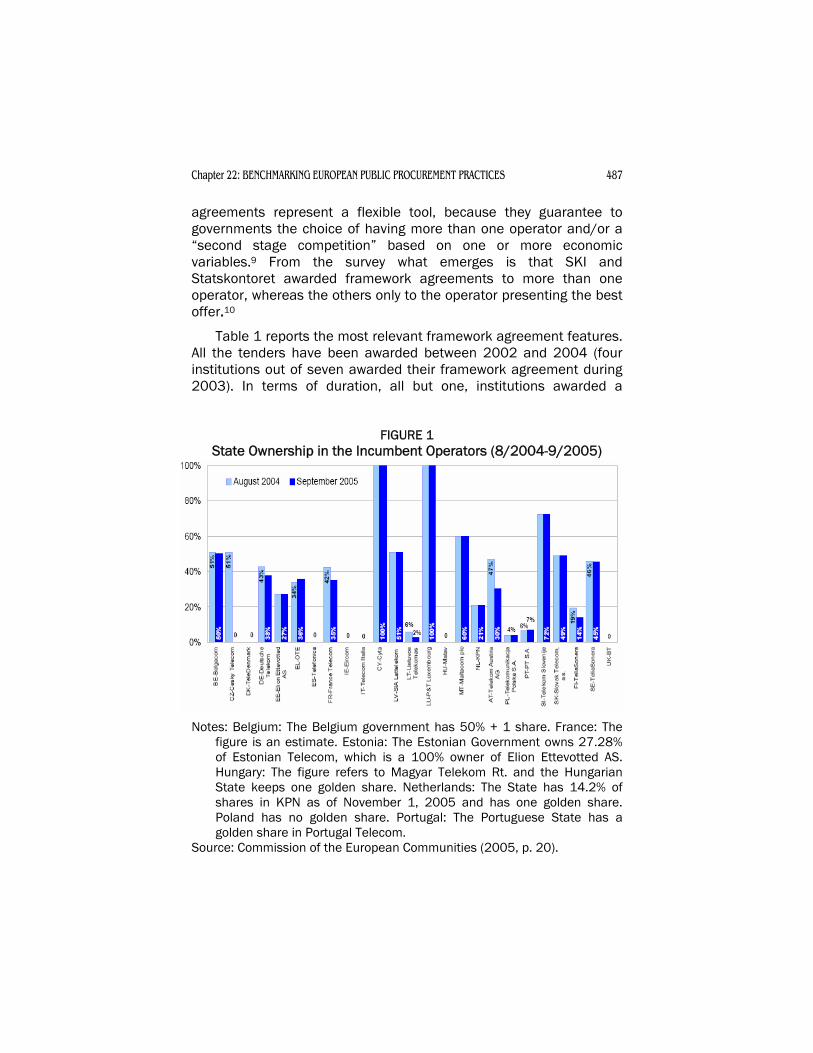
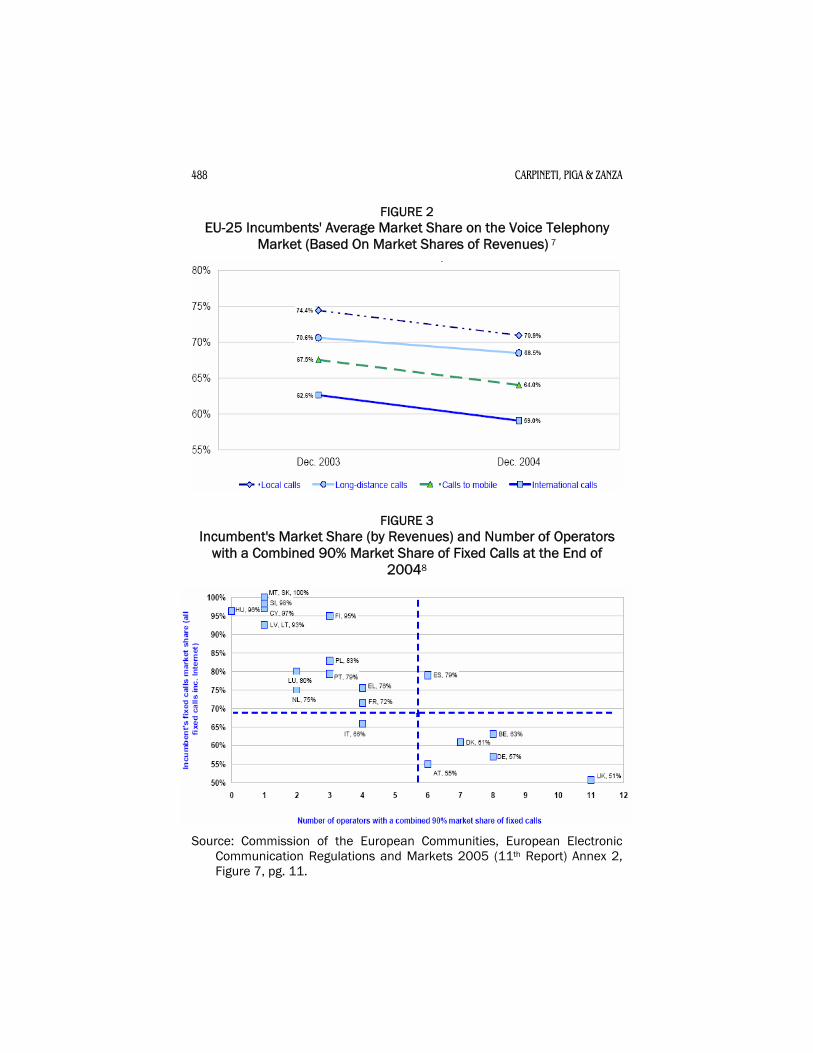
This is probably due to the structure of this market. Recently, the European fix line telephone services markets began a liberalization process that produced the first results in terms of higher competition. As a matter of fact, state ownership of incumbent operators decreased (Figures 1 and 2) as well as the incumbent average market share (Figure 3).6
Framework Agreements Features
According to Article 32 of the EU Directive 18/2004, a "framework agreement" is an “agreement between one or more contracting authorities and one or more economic operators, the purpose of which is to establish the terms governing contracts to be awarded during a given period, in particular with regard to price and, where appropriate, the quantity envisaged.” Usually, framework
Chapter 22: BENCHMARKING EUROPEAN PUBLIC PROCUREMENT PRACTICES 487
agreements represent a flexible tool, because they guarantee to governments the choice of having more than one operator and/or a “second stage competition” based on one or more economic variables.9 From the survey what emerges is that SKI and Statskontoret awarded framework agreements to more than one operator, whereas the others only to the operator presenting the best offer.10
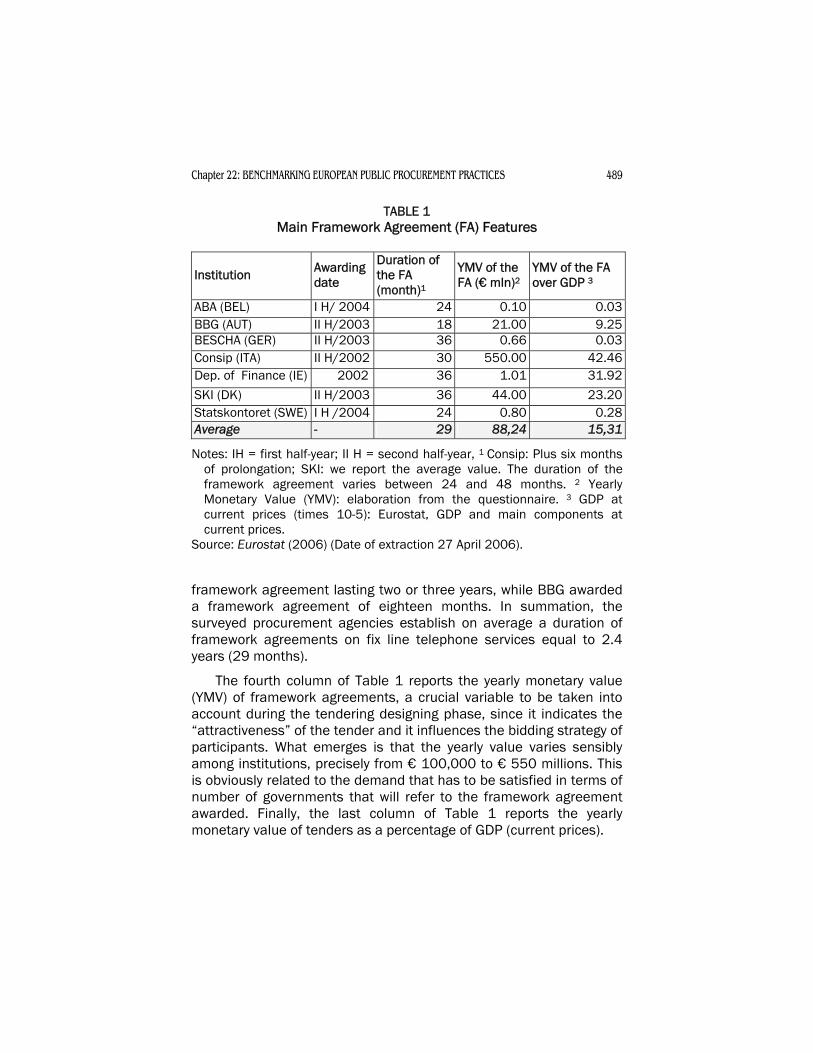
Table 1 reports the most relevant framework agreement features. All the tenders have been awarded between 2002 and 2004 (four institutions out of seven awarded their framework agreement during 2003). In terms of duration, all but one, institutions awarded a
FIGURE 1 State Ownership in the Incumbent Operators (8/2004-9/2005)
Notes: Belgium: The Belgium government has 50% + 1 share. France: The
figure is an estimate. Estonia: The Estonian Government owns 27.28% of Estonian Telecom, which is a 100% owner of Elion Ettevotted AS. Hungary: The figure refers to Magyar Telekom Rt. and the Hungarian State keeps one golden share. Netherlands: The State has 14.2% of shares in KPN as of November 1, 2005 and has one golden share. Poland has no golden share. Portugal: The Portuguese State has a golden share in Portugal Telecom.
Source: Commission of the European Communities (2005, p. 20).
488 CARPINETI, PIGA & ZANZA
FIGURE 2 EU-25 Incumbents' Average Market Share on the Voice Telephony
Market (Based On Market Shares of Revenues) 7
FIGURE 3 Incumbent's Market Share (by Revenues) and Number of Operators
with a Combined 90% Market Share of Fixed Calls at the End of 20048
Source: Commission of the European Communities, European Electronic
Communication Regulations and Markets 2005 (11th Report) Annex 2, Figure 7, pg. 11.
Chapter 22: BENCHMARKING EUROPEAN PUBLIC PROCUREMENT PRACTICES 489
TABLE 1 Main Framework Agreement (FA) Features
Institution Awarding date
Duration of the FA (month)1
YMV of the FA (€ mln)2
YMV of the FA over GDP 3
ABA (BEL) I H/ 2004 24 0.10 0.03 BBG (AUT) II H/2003 18 21.00 9.25 BESCHA (GER) II H/2003 36 0.66 0.03 Consip (ITA) II H/2002 30 550.00 42.46 Dep. of Finance (IE) 2002 36 1.01 31.92
SKI (DK) II H/2003 36 44.00 23.20 Statskontoret (SWE) I H /2004 24 0.80 0.28 Average - 29 88,24 15,31
Notes: IH = first half-year; II H = second half-year, 1 Consip: Plus six months of prolongation; SKI: we report the average value. The duration of the framework agreement varies between 24 and 48 months. 2 Yearly Monetary Value (YMV): elaboration from the questionnaire. 3 GDP at current prices (times 10-5): Eurostat, GDP and main components at current prices.
Source: Eurostat (2006) (Date of extraction 27 April 2006).
framework agreement lasting two or three years, while BBG awarded a framework agreement of eighteen months. In summation, the surveyed procurement agencies establish on average a duration of framework agreements on fix line telephone services equal to 2.4 years (29 months).
The fourth column of Table 1 reports the yearly monetary value (YMV) of framework agreements, a crucial variable to be taken into account during the tendering designing phase, since it indicates the “attractiveness” of the tender and it influences the bidding strategy of participants. What emerges is that the yearly value varies sensibly among institutions, precisely from € 100,000 to € 550 millions. This is obviously related to the demand that has to be satisfied in terms of number of governments that will refer to the framework agreement awarded. Finally, the last column of Table 1 reports the yearly monetary value of tenders as a percentage of GDP (current prices).

490 CARPINETI, PIGA & ZANZA
Data show that Consip awarded the framework agreement with the highest value, followed by the Irish Department of Finance and by SKI.
Awarding Procedure and Tender Format
According to Article 1 of the new European Directive for Public Procurement, “Open Procedures means those procedures whereby any interested economic operator may submit a tender; Restricted Procedures means those procedures in which any economic operator may request to participate and whereby only those economic operators invited by the contracting authority may submit a tender.” Responses indicated that five institutions used an open procedure while BBG and Statskontoret awarded the framework agreement through a restricted one.
Regarding the tender submissions, six institutions used standard paper-based tenders and only SKI performed it online. It is interesting to underline that the BBG performed a multi-round procurement tender, with two rounds, while Consip ran a combinatorial procurement tender. In July 2002, Consip decided to implement a combinatorial tender to procure the telecommunication services for the whole government. Two different lots have been awarded: lot A for fixed telecommunication services and lot B for mobile telecommunication services. Moreover, it was possible to present an offer on the package composed by lot A and lot B. However, single offers prevailed over the package.11 The awarding criteria chosen defined that the package bid had to be compared to non-package bids on each of the two lots included in the package. The package bid would have been awarded if it reported the best offers both on lot A and B. The two lots were instead awarded to two different firms.
Lots and Participants
From the survey what emerges is that almost all institutions that sent back the questionnaire did not divide the framework agreement into lots.12 Only BBG did it, procuring two lots and awarding them to two different providers. The two lots were homogeneous and satisfied two different types of departments of the government.
Regarding the number of participants, it is interesting to know how many operators entered the tender with respect to the number of fixed operators active in each country, and if the procurement entities
Chapter 22: BENCHMARKING EUROPEAN PUBLIC PROCUREMENT PRACTICES 491
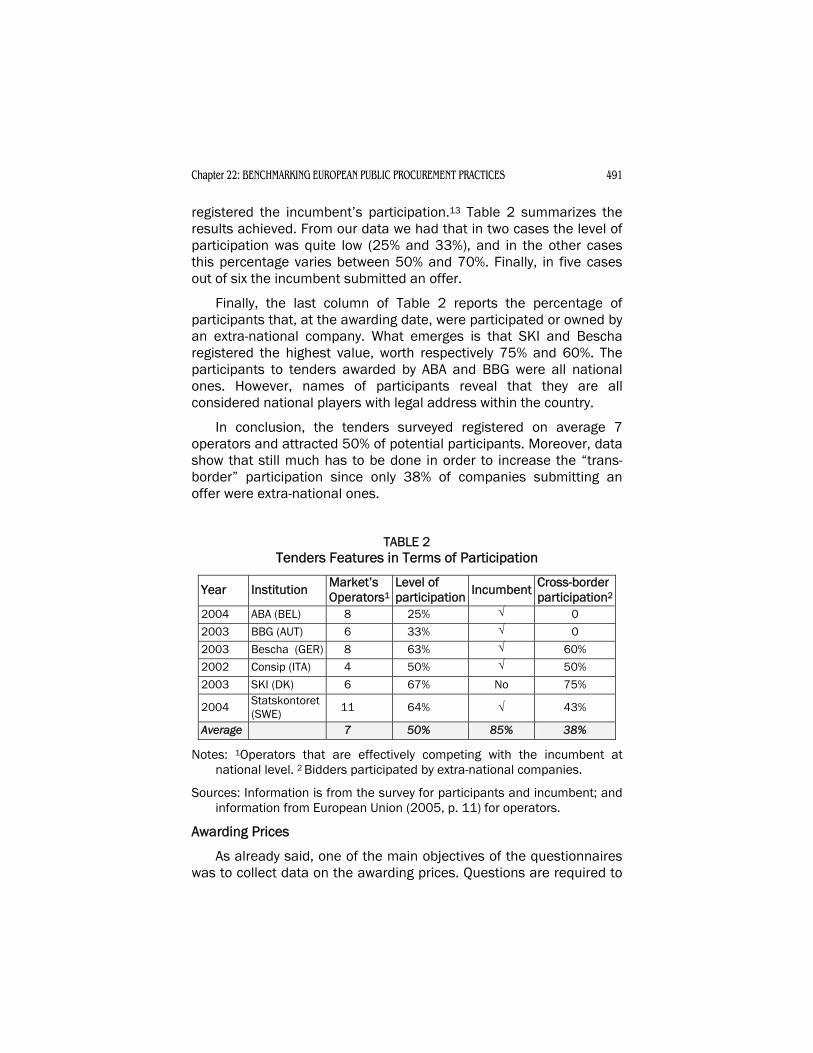
registered the incumbent’s participation.13 Table 2 summarizes the results achieved. From our data we had that in two cases the level of participation was quite low (25% and 33%), and in the other cases this percentage varies between 50% and 70%. Finally, in five cases out of six the incumbent submitted an offer.
Finally, the last column of Table 2 reports the percentage of participants that, at the awarding date, were participated or owned by an extra-national company. What emerges is that SKI and Bescha registered the highest value, worth respectively 75% and 60%. The participants to tenders awarded by ABA and BBG were all national ones. However, names of participants reveal that they are all considered national players with legal address within the country.
In conclusion, the tenders surveyed registered on average 7 operators and attracted 50% of potential participants. Moreover, data show that still much has to be done in order to increase the “trans-border” participation since only 38% of companies submitting an offer were extra-national ones.
TABLE 2 Tenders Features in Terms of Participation
Year Institution Market’s Operators1
Level of participation Incumbent Cross-border
participation2
2004 ABA (BEL) 8 25% √ 0
2003 BBG (AUT) 6 33% √ 0
2003 Bescha (GER) 8 63% √ 60%
2002 Consip (ITA) 4 50% √ 50%
2003 SKI (DK) 6 67% No 75%
2004 Statskontoret (SWE) 11 64% √ 43%
Average 7 50% 85% 38%
Notes: 1Operators that are effectively competing with the incumbent at national level. 2 Bidders participated by extra-national companies.
Sources: Information is from the survey for participants and incumbent; and information from European Union (2005, p. 11) for operators.
Awarding Prices
As already said, one of the main objectives of the questionnaires was to collect data on the awarding prices. Questions are required to
492 CARPINETI, PIGA & ZANZA
provide the price obtained for a three minutes call, comprehensive of connecting fees. Namely, we asked for three different prices: local call price, national/long distance call price, and versus mobile call price. We gathered data from five institutions out of seven.
Table 3 reports the awarding prices declared by the institutions. It is immediately clear that these prices have a large variance within the type of calls and between different institutions. The first differences are quite obvious: local calls are less expensive than national ones and even cheaper than calls toward mobile phones.14
TABLE 3
Awarding Prices in Euros Declared by Institutions for 3-Minutes Calls (Connection Fees Included)
Institution Awarding Year Local National/Long
Distance Mobile
ABA (BEL) 2004 0.1 0.15 0.24 BESCHA (GER) 2003 0.054 0.06 0.45 Consip (ITA) 2002 0.0465 0.0744 0.3793 SKI (DK) 2003 0.0177 0.0177 0.31 Statskontoret (SWE) 2004 0.04 0.04 0.44 Average 0.052 0.068 0.364
The second difference, the one between different institutions, is less obvious, because it may depend on different factors: the total value of the framework agreement, the geographical distribution of lines and, last but not least, the competition during the tender. Obviously we do not control for the different national regulation of prices.
What emerges from data is that SKI presents the lowest awarding price both on local and national calls, while ABA gets the lowest one on calls “versus” mobile phone. Finally, the average prices are 0.052 € for local calls, 0.068 for National/Long distance calls, and 0.364 € for calls versus mobile.
It is important to underline that it is difficult to compare these data, for two main reasons: first, we do not know the weight assigned by the procurement agencies to each type of call (demand effect); and second, prices are probably influenced by other factors, such as
Chapter 22: BENCHMARKING EUROPEAN PUBLIC PROCUREMENT PRACTICES 493
incumbents’ market power (Figure 3), number of participants, and monetary value of the framework agreements (supply effect).
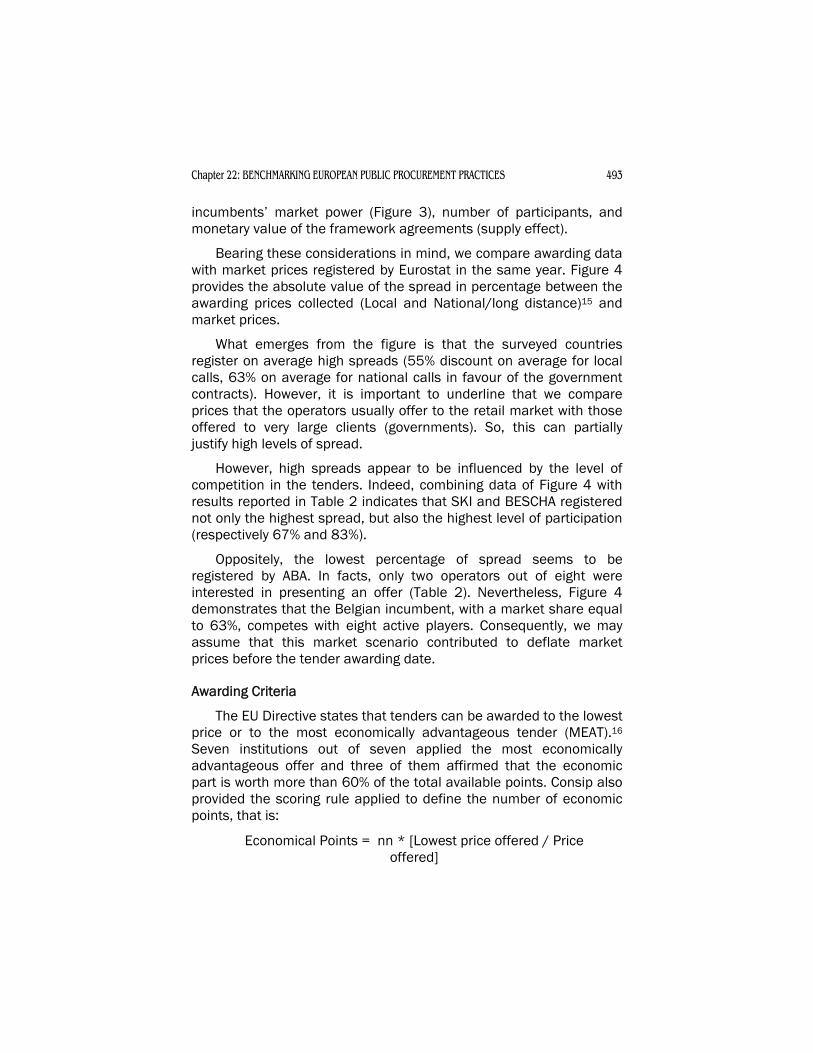
Bearing these considerations in mind, we compare awarding data with market prices registered by Eurostat in the same year. Figure 4 provides the absolute value of the spread in percentage between the awarding prices collected (Local and National/long distance)15 and market prices.
What emerges from the figure is that the surveyed countries register on average high spreads (55% discount on average for local calls, 63% on average for national calls in favour of the government contracts). However, it is important to underline that we compare prices that the operators usually offer to the retail market with those offered to very large clients (governments). So, this can partially justify high levels of spread.
However, high spreads appear to be influenced by the level of competition in the tenders. Indeed, combining data of Figure 4 with results reported in Table 2 indicates that SKI and BESCHA registered not only the highest spread, but also the highest level of participation (respectively 67% and 83%).
Oppositely, the lowest percentage of spread seems to be registered by ABA. In facts, only two operators out of eight were interested in presenting an offer (Table 2). Nevertheless, Figure 4 demonstrates that the Belgian incumbent, with a market share equal to 63%, competes with eight active players. Consequently, we may assume that this market scenario contributed to deflate market prices before the tender awarding date.
Awarding Criteria
The EU Directive states that tenders can be awarded to the lowest price or to the most economically advantageous tender (MEAT).16 Seven institutions out of seven applied the most economically advantageous offer and three of them affirmed that the economic part is worth more than 60% of the total available points. Consip also provided the scoring rule applied to define the number of economic points, that is:
Economical Points = nn * [Lowest price offered / Price offered]
494 CARPINETI, PIGA & ZANZA
Where: - “nn” = the maximum amount of economical points that a bidder
can get; - “lowest price offered” indicates the lowest bid among all bids
received; and - “Price Offered” equals to the bid offered by each participant. This
formula contributes to make bidders more aggressive, since the lowest the price offered, the higher the probability of getting all the “nn” points. In addition, submitting the best offer means reducing the points obtained by all other bidders.17
PAPER FOR PRINTERS
The second study aimed at collecting information about how the product category “paper for printers” is procured by the EU Lab members. As anticipated, eleven institutions answered the questionnaire.
FIGURE 4 Spread between Awarding Prices and Market Prices
12%
84%
80%
84%
56%
63%
42%
57%
38%
84%
56%
55%
0% 10% 20% 30% 40% 50% 60% 70% 80% 90%
ABA2004
BESCHA2003
Consip2002
SKI2003
Statskontoret2004
Average
Spread National Calls Local Calls
Note: One minute of call including VAT. Sources: This survey for awarding prices. Eurostat (2005) for market price.
Chapter 22: BENCHMARKING EUROPEAN PUBLIC PROCUREMENT PRACTICES 495
Framework Agreement Features
Data collected on the framework agreement features reveal that the surveyed institutions adopt different strategies in tender designing, and the first difference is in the choice of the number of selected suppliers. Indeed, five institutions - namely MINEFI, OGC,18 SKI, Statskontoret, and UMIC - awarded a framework agreement to at least three suppliers, while the other procurement agencies awarded the framework agreement to only the best submitted offer.
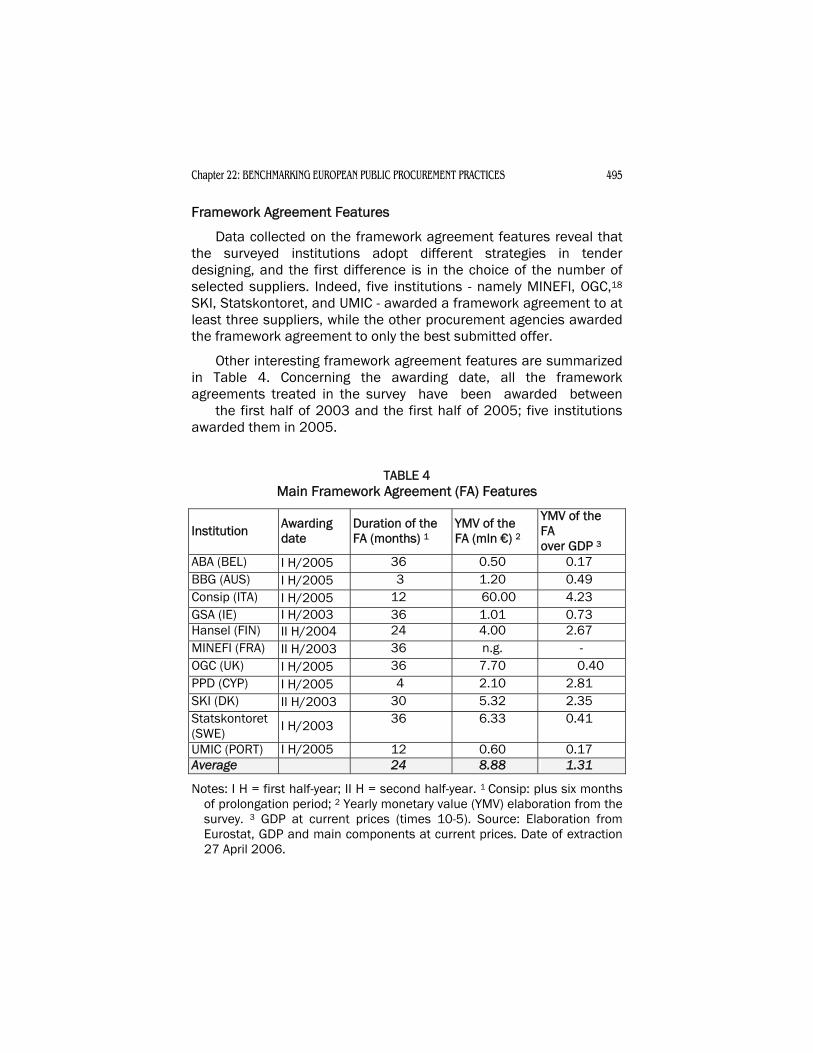
Other interesting framework agreement features are summarized in Table 4. Concerning the awarding date, all the framework agreements treated in the survey have been awarded between the first half of 2003 and the first half of 2005; five institutions awarded them in 2005.
TABLE 4 Main Framework Agreement (FA) Features
Institution Awarding date
Duration of the FA (months) 1
YMV of the FA (mln €) 2
YMV of the FA over GDP 3
ABA (BEL) I H/2005 36 0.50 0.17 BBG (AUS) I H/2005 3 1.20 0.49 Consip (ITA) I H/2005 12 60.00 4.23 GSA (IE) I H/2003 36 1.01 0.73 Hansel (FIN) II H/2004 24 4.00 2.67 MINEFI (FRA) II H/2003 36 n.g. - OGC (UK) I H/2005 36 7.70 0.40 PPD (CYP) I H/2005 4 2.10 2.81 SKI (DK) II H/2003 30 5.32 2.35 Statskontoret (SWE) I H/2003 36 6.33 0.41
UMIC (PORT) I H/2005 12 0.60 0.17 Average 24 8.88 1.31
Notes: I H = first half-year; II H = second half-year. 1 Consip: plus six months of prolongation period; 2 Yearly monetary value (YMV) elaboration from the survey. 3 GDP at current prices (times 10-5). Source: Elaboration from Eurostat, GDP and main components at current prices. Date of extraction 27 April 2006.
496 CARPINETI, PIGA & ZANZA
The table shows a second difference on tender design of this product. In fact, the duration of framework agreements differs significantly among institutions. From one side, BBG and PPD decided for 3 and 4 months respectively, whereas five institutions awarded a framework agreement lasting 36 months. On average, the surveyed institutions designed a tender for the awarding of paper for printers lasting 2 years. This result is probably a consequence of the fact that the product is highly standardized. Therefore it is not influenced by continuous innovative processes that may affect the quality and the price in the market.
Also the framework agreement value is substantially different: ABA awarded a framework agreement of 0.5 millions of euro per year, while Consip awarded a framework agreement worth 60 millions of euro. As already said, the monetary value of framework agreements may influence the level of participation and the bidding strategy of participants. Finally, the last column of Table 4 reports the yearly monetary value of tenders as a percentage of GDP (current prices). The main finding is that Consip awarded the tender with the highest value, followed by PPD and Hansel.
Awarding Procedure and Tender Format
From the answers to the questionnaires what emerges is that the majority of institutions adopt the open procedure. The only exceptions are MINEFI, OGC, and UMIC.19 The cases of MINEFI and UMIC present some peculiarities. In fact, a two-stage procedure is applied. In the first stage four suppliers are selected. At this stage, competition is open to all potential suppliers. During the first stage the procurement entity does not evaluate offers in terms of prices, but considers only technical aspects (delay of delivery and quality of the paper). Once the four winners are selected, the competition is re-opened and each three months the four suppliers selected are invited to present an offer in terms of price only. The contract is awarded to the competitors that bid the lowest price. This explains why MINEFI considers this awarding procedure open and restricted at the same time. Also UMIC opted for a two stage competitive process: in the first stage the four best participants are selected through an open procedure; in the second one (restricted procedure) the tender is awarded to the bidder submitting the best offer in an electronic descending auction.
Chapter 22: BENCHMARKING EUROPEAN PUBLIC PROCUREMENT PRACTICES 497
Regarding the format applied, we investigated whether some institutions awarded the framework agreements by adopting the standard paper-based or electronic tender. What emerges is that ABA, SKI, and UMIC used this second tender format.20 Two of them used a sealed bid single round auction, while UMIC decided to adopt a descending multiple round auction: the auction had a fixed time period (thirty minutes) plus extensions: if any bids were received within the last five minutes then the on line auction was extended for an additional five minutes period.
Lots and Participants
Data collected on the number and the type of lots reveals the variety of strategies adopted, as shown in Table 5. Four institutions chose a single lot and seven split the supply in two or more lots, while Consip split it into 12 lots.21 What emerges from the table is that three institutions divided the framework agreement into lots by
TABLE 5 Number and Type of Lots22
Institution N. of Lots Geographical Lots1
Quantitative Lots2
Qualitative Lots3
ABA (BEL) 1 - - - BBG (AUS) 3 √ √ - Consip (ITA) 12 √ √ - GSA (IE) 2 - √ Hansel (FIN) 24 - - √ MINEFI (FRA) 1 - - - OGC (UK) 3 - - √ PPD (CYP) 2 - - √ SKI (DK) 1 - - - Statskontoret (SWE) 1 - - - UMIC (PORT) 45 √ - √
Average 3 30% 30% 40%
Notes: 1 Lots that refer to different geographical area; 2 Lots containing the same product and referring to the same geographical area; 3 Lots containing different types of product. 4The second lot of Hansel contains a kind of paper not adequate for the analysis, since it is not A4, A3 standard or recycled paper. Following data will refer only to the first lot. 5The number of lots was 5, but one of them was for special paper (A4, white, 100g), not adequate for the analysis.

498 CARPINETI, PIGA & ZANZA
adopting a geographical rationale, four institutions opted for a qualitative one, while only the Irish GSA split the framework agreement in two quantitative lots. UMIC from Portugal is the only institution that awarded both geographical and qualitative lots. On average the surveyed agencies procuring paper for printers split framework agreements for the procurement of paper for printers into 3 lots. Finally, it is interesting to combine the value of lots with the number of offers received, in order to check if they are positively correlated.
Figure 5 represents the relation between the value of lots (indicated by alphabetic letters) and the number of offers received for each lot. The figure shows that points are “randomly” distributed in the area. This means that there is not an evident relation between these two variables. In fact, even if points “AE” and “AF” represent framework agreements with the highest value, the number of participants achieved is equal, for instance, to the one registered by lots “P” and “M”. On the other hand, points “P” and “S” registered a
FIGURE 5 Heterogeneity of Participation Patterns (Value of Lots Combined with
Number of Participants in Each Lot)
B
C
H
MPD
E
F; L
G
J
K
N
QR
ST
AD
AEAF
AG
AH
AJ, AK
0
2
4
6
8
10
12
0 2 4 6 8 10 12 14 16 18 2Value of Lots
Num
ber o
f Par
ticip
ants
0
Chapter 22: BENCHMARKING EUROPEAN PUBLIC PROCUREMENT PRACTICES 499
high number of suppliers even if the monetary value is worth less than €2 million.
This result makes it clear that increasing the monetary value of tenders procured does not necessarily increase the level of participation. In fact, the procuring agency should take into account other aspects than simply “attractiveness” of the object. For example, participation requirements matter (bank warranties, ability to execute the framework agreement etc). Indeed, if the market registers many SMEs and few big enterprises - firms dimensionally heterogonous - only the second ones can present an offer for tenders with high monetary value.
Institutions surveyed also provided information about participants showing them to be private companies and distributors of products. Only OGC registered three suppliers that are also producers of paper. It was difficult to collect information on market structure. Therefore, we do not report the number of participants of the number of total players in the market, but considering that in Italy there are several potential participants, mainly distributors and resellers, we assume that the other surveyed countries also register a high level of operators in the market.
Finally, responses revealed the names of participants. We do not report them for privacy reasons but it is interesting to notice that there are three cases in which branches of the same company bid in different competitive tenders. In the first case, eight branches owned by the same multinational company submitted a bid in eight different countries out of eleven.23 In the second case, two branches of the same company bid in the UK and in Ireland, respectively. In the third case, two branches bid in France and Belgium.
The first case underlines that the "paper for printers" market may represent a single European market, whereas the second and the third cases point out how language can play a key role in facilitating participation to public procurement.
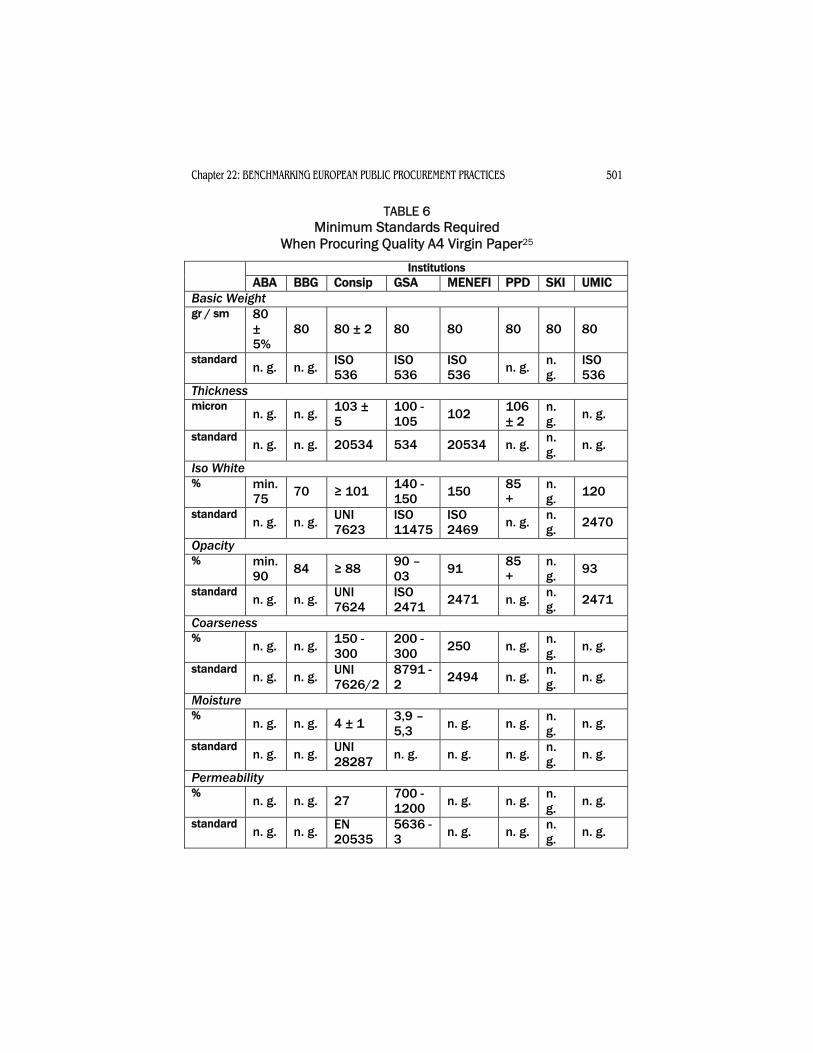
Quality
The questionnaires also aimed at gathering information about the minimum quality required by procurement institutions. Seven factors have been analysed: Basis weight, Thickness, ISO white, Opacity, Coarseness, Moisture, and Permeability.
500 CARPINETI, PIGA & ZANZA
Table 6 focuses on A4 virgin paper. What emerges is that the majority of institutions requested from participants the submission of products having a minimum level of quality. In fact, eight procurement agencies out of eleven specified the characteristics of the object of the framework agreement, while the others did not impose minimum levels of quality.
It is interesting to notice that data collected show that the majority of institutions refer to the same level of quality established by the International Organization for Standardization (ISO).24 For instance, ISO 536 on “Determination of grammage” is considered the minimum quality accepted by eight institutions out of eleven procuring standard A4 virgin paper.
In summation, data reveal that the minimum quality required when procuring paper for printers is introducing de facto a standard in Europe.
Awarding Prices
Through the questionnaires we aimed at collecting the unitary price of a ream of paper for virgin paper, A4 and A3 size, and for recycled paper, A4 and A3 size. Furthermore, figuring that there are relevant economies of scale in offering this product (in particular transportation costs), we asked the institutions if they pay different prices for different amounts of paper, namely for one ream, for a pallet (250 reams), and for twenty pallet.
Regarding this market, differently from fix line telephone service prices, finished paper prices are characterized by a high level of volatility over time, as they depend on the pulp of cellulose prices. Therefore, the awarding date probably influences the price paid by each institution.
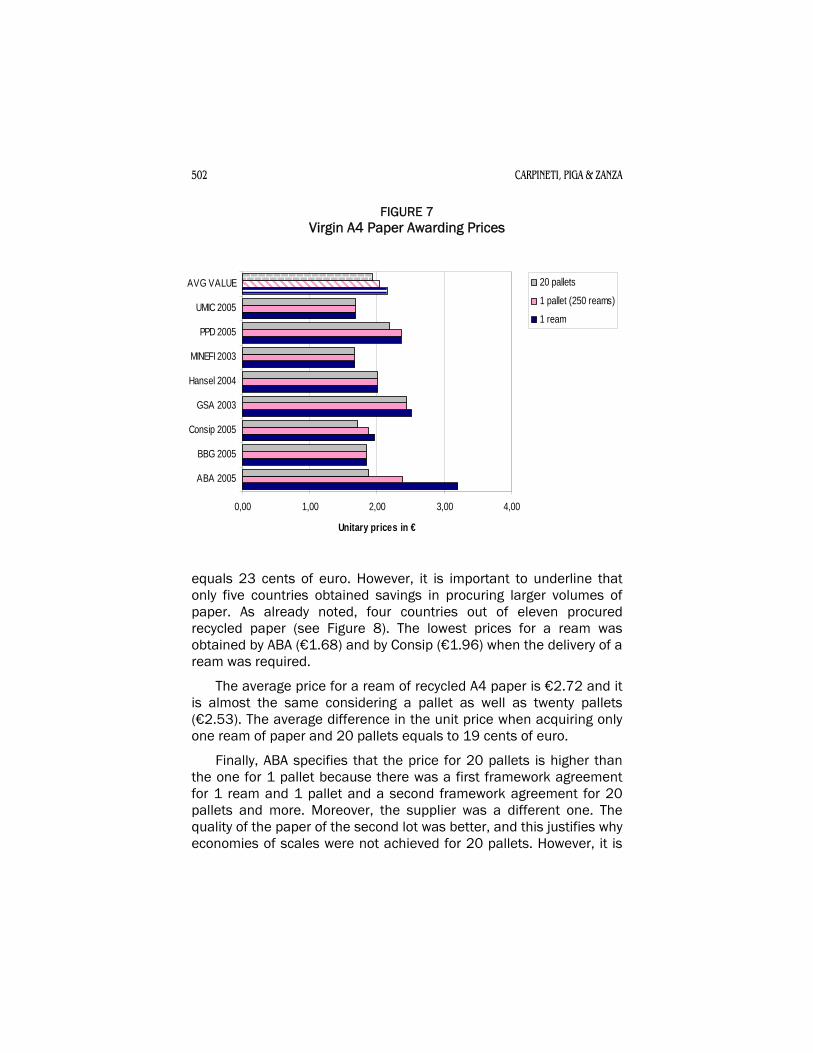
Comparing all prices received, what emerges is that the lowest prices for a ream of paper A4 size were paid by MINEFI in 2003, and UMIC in 2005 (Figure 7). Their unit prices are almost the same and worth €1.67 and €1.68 respectively. The Irish GSA registered the highest price: €2.45 for a ream of paper in 2003.
The average price for a ream is €2.16. This value decreases if a pallet or twenty pallets are acquired. The difference in the average unit price when acquiring only one ream of paper and 20 pallets
Chapter 22: BENCHMARKING EUROPEAN PUBLIC PROCUREMENT PRACTICES 501
TABLE 6 Minimum Standards Required
When Procuring Quality A4 Virgin Paper25
Institutions ABA BBG Consip GSA MENEFI PPD SKI UMIC
Basic Weight gr / sm 80
± 5%
80 80 ± 2 80 80 80 80 80
standard n. g. n. g. ISO
536 ISO 536
ISO 536 n. g. n.
g. ISO 536
Thickness micron
n. g. n. g. 103 ± 5
100 - 105 102 106
± 2 n. g. n. g.
standard n. g. n. g. 20534 534 20534 n. g. n.
g. n. g.
Iso White % min.
75 70 ≥ 101 140 - 150 150 85
+ n. g. 120
standard n. g. n. g. UNI
7623 ISO 11475
ISO 2469 n. g. n.
g. 2470
Opacity % min.
90 84 ≥ 88 90 – 03 91 85
+ n. g. 93
standard n. g. n. g. UNI
7624 ISO 2471 2471 n. g. n.
g. 2471
Coarseness %
n. g. n. g. 150 - 300
200 - 300 250 n. g. n.
g. n. g.
standard n. g. n. g. UNI
7626/2 8791 - 2 2494 n. g. n.
g. n. g.
Moisture %
n. g. n. g. 4 ± 1 3,9 – 5,3 n. g. n. g. n.
g. n. g.
standard n. g. n. g. UNI
28287 n. g. n. g. n. g. n. g. n. g.
Permeability %
n. g. n. g. 27 700 - 1200 n. g. n. g. n.
g. n. g.
standard n. g. n. g. EN
20535 5636 - 3 n. g. n. g. n.
g. n. g.
502 CARPINETI, PIGA & ZANZA
FIGURE 7 Virgin A4 Paper Awarding Prices
0,00 1,00 2,00 3,00 4,00
ABA 2005
BBG 2005
Consip 2005
GSA 2003
Hansel 2004
MINEFI 2003
PPD 2005
UMIC 2005
AVG VALUE
Unitary prices in €
20 pallets
1 pallet (250 reams)
1 ream
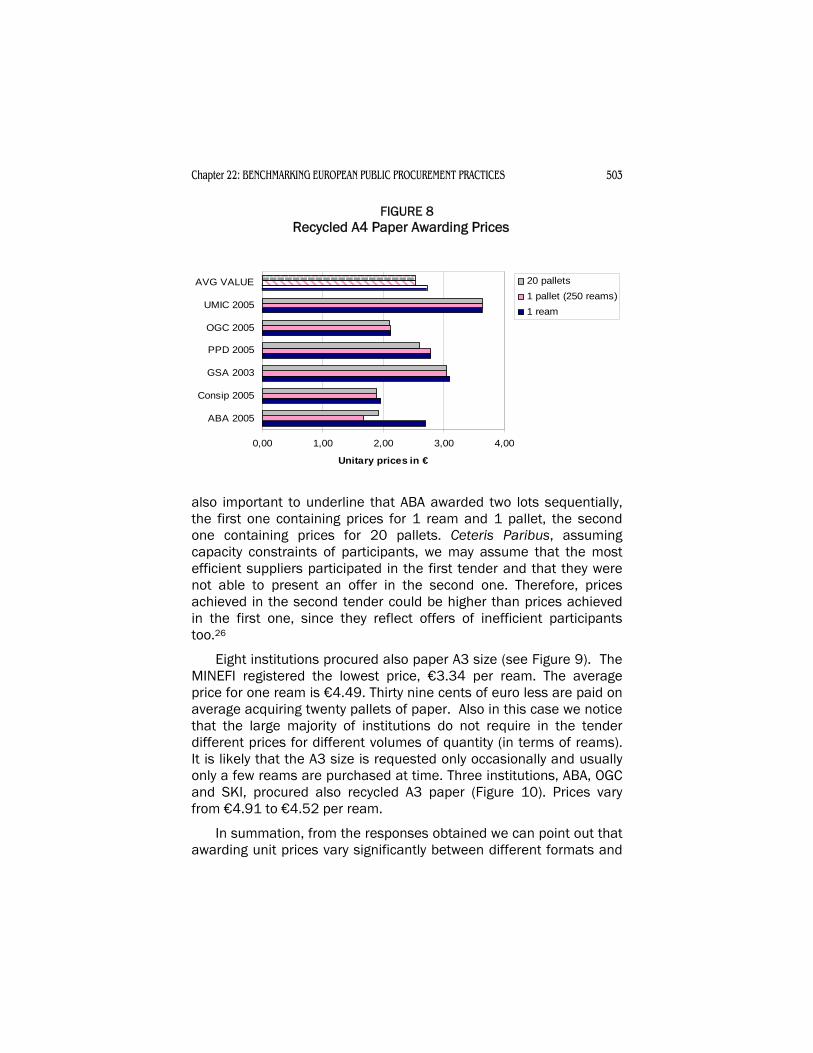
equals 23 cents of euro. However, it is important to underline that only five countries obtained savings in procuring larger volumes of paper. As already noted, four countries out of eleven procured recycled paper (see Figure 8). The lowest prices for a ream was obtained by ABA (€1.68) and by Consip (€1.96) when the delivery of a ream was required.
The average price for a ream of recycled A4 paper is €2.72 and it is almost the same considering a pallet as well as twenty pallets (€2.53). The average difference in the unit price when acquiring only one ream of paper and 20 pallets equals to 19 cents of euro.
Finally, ABA specifies that the price for 20 pallets is higher than the one for 1 pallet because there was a first framework agreement for 1 ream and 1 pallet and a second framework agreement for 20 pallets and more. Moreover, the supplier was a different one. The quality of the paper of the second lot was better, and this justifies why economies of scales were not achieved for 20 pallets. However, it is
Chapter 22: BENCHMARKING EUROPEAN PUBLIC PROCUREMENT PRACTICES 503
FIGURE 8 Recycled A4 Paper Awarding Prices
0,00 1,00 2,00 3,00 4,00
ABA 2005
Consip 2005
GSA 2003
PPD 2005
OGC 2005
UMIC 2005
AVG VALUE
Unitary prices in €
20 pallets1 pallet (250 reams)1 ream
also important to underline that ABA awarded two lots sequentially, the first one containing prices for 1 ream and 1 pallet, the second one containing prices for 20 pallets. Ceteris Paribus, assuming capacity constraints of participants, we may assume that the most efficient suppliers participated in the first tender and that they were not able to present an offer in the second one. Therefore, prices achieved in the second tender could be higher than prices achieved in the first one, since they reflect offers of inefficient participants too.26
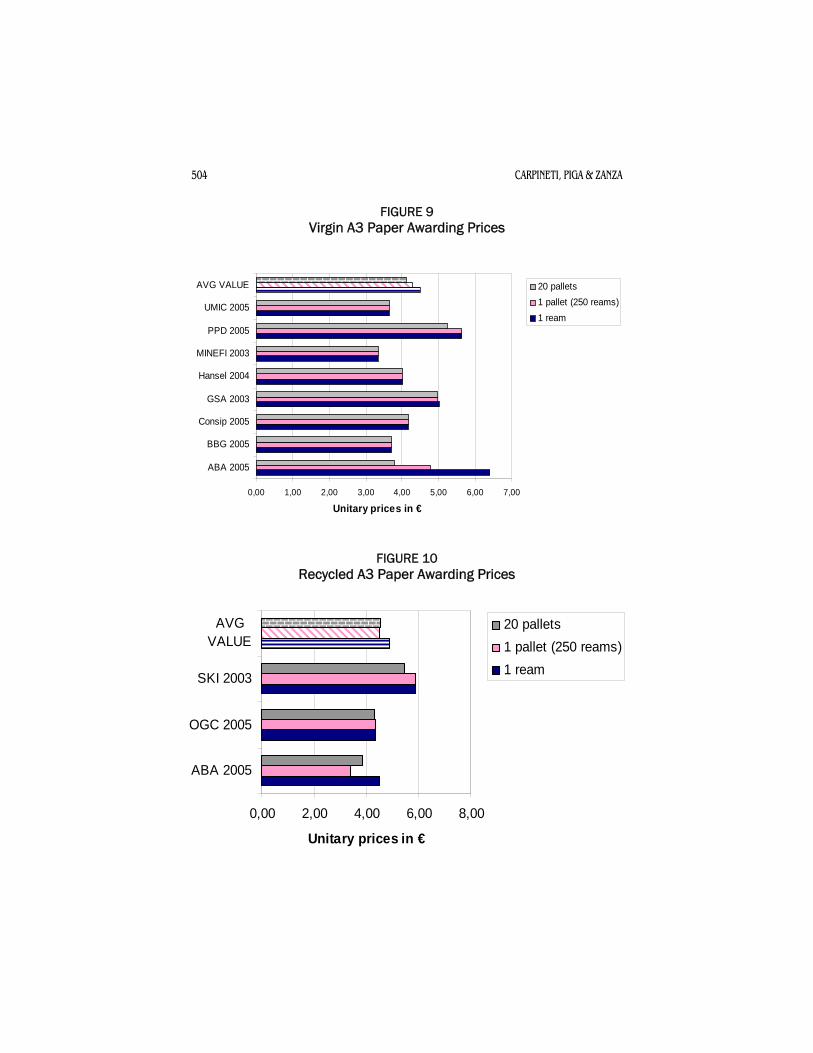
Eight institutions procured also paper A3 size (see Figure 9). The MINEFI registered the lowest price, €3.34 per ream. The average price for one ream is €4.49. Thirty nine cents of euro less are paid on average acquiring twenty pallets of paper. Also in this case we notice that the large majority of institutions do not require in the tender different prices for different volumes of quantity (in terms of reams). It is likely that the A3 size is requested only occasionally and usually only a few reams are purchased at time. Three institutions, ABA, OGC and SKI, procured also recycled A3 paper (Figure 10). Prices vary from €4.91 to €4.52 per ream.
In summation, from the responses obtained we can point out that awarding unit prices vary significantly between different formats and
504 CARPINETI, PIGA & ZANZA
FIGURE 9 Virgin A3 Paper Awarding Prices
0,00 1,00 2,00 3,00 4,00 5,00 6,00 7,00
ABA 2005
BBG 2005
Consip 2005
GSA 2003
Hansel 2004
MINEFI 2003
PPD 2005
UMIC 2005
AVG VALUE
Unitary prices in €
20 pallets1 pallet (250 reams)1 ream
FIGURE 10 Recycled A3 Paper Awarding Prices
0,00 2,00 4,00 6,00 8,00
ABA 2005
OGC 2005
SKI 2003
AVGVALUE
Unitary prices in €
20 pallets1 pallet (250 reams)1 ream

Chapter 22: BENCHMARKING EUROPEAN PUBLIC PROCUREMENT PRACTICES 505
kinds. The average prices for a ream of paper are €2.16 for standard A4, €2.72 for recycled A4, €4.49 for standard A3 paper, and €4.91 for recycled A3.
These values decrease when the quantity purchased is larger (this is confirmed also by data on recycled A3 paper awarded by SKI). We notice that while certain institutions procured recycled A4 paper at a price lower than the one paid for standard A4 paper, others obtained exactly the opposite result. Interestingly, Consip obtained almost the same price for virgin and recycled paper A4.
We also tried to combine the awarding unitary prices with other information obtained, as the number of participants, monetary value, and the number of lots. Unfortunately, the findings’ results are weak, since each variable is endogenously influenced by the others. For instance, it was not relevant to compare awarding prices with the number of participants in the tender, because the first ones reflect not only the level of competition in the tender, but also the competition in the market.
Transportation Costs
It is important to underline that the prices obtained by the institutions may be influenced by such framework agreement clauses as the transportation of products from the store to the government’s site. From the survey what emerges is that the majority of institutions (apart from PPD and Statskontoret) require this service and among those specifying the monetary value only GSA decided a fixed price, not related with the unit price. Governments purchasing from framework agreements awarded by ABA pay for the transport 9% of the unit price (of one ream).
UMIC states that the tendering notice includes information about the expected amount of paper that the government will purchase. This gives to the suppliers the opportunity of setting up a delivery plan and defining delivery times. The final objective is to avoid piling stocks and reach “just in time” distribution.
Awarding Criteria
As defined by the European Directive, two awarding criteria can be used: the lowest price and the most economically advantageous tender (MEAT). Also in this case institutions did not follow the same
506 CARPINETI, PIGA & ZANZA
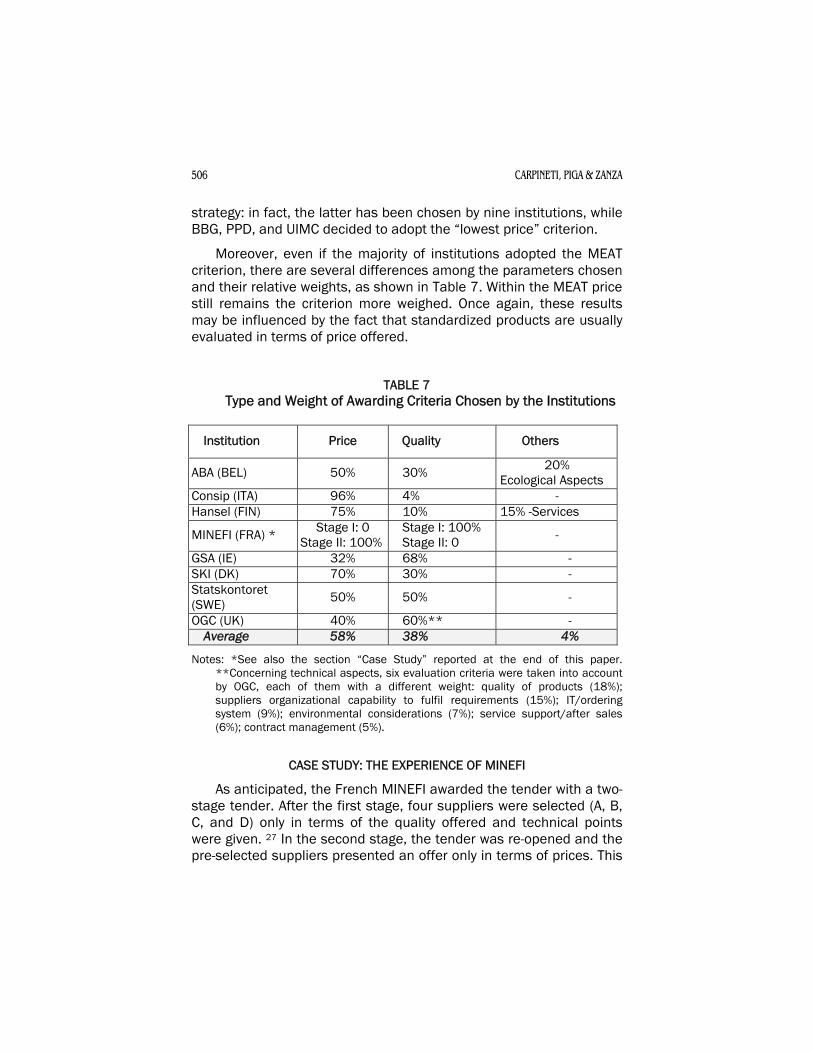
strategy: in fact, the latter has been chosen by nine institutions, while BBG, PPD, and UIMC decided to adopt the “lowest price” criterion.
Moreover, even if the majority of institutions adopted the MEAT criterion, there are several differences among the parameters chosen and their relative weights, as shown in Table 7. Within the MEAT price still remains the criterion more weighed. Once again, these results may be influenced by the fact that standardized products are usually evaluated in terms of price offered.
TABLE 7 Type and Weight of Awarding Criteria Chosen by the Institutions
Institution Price Quality Others
ABA (BEL) 50% 30% 20% Ecological Aspects
Consip (ITA) 96% 4% - Hansel (FIN) 75% 10% 15% -Services
MINEFI (FRA) * Stage I: 0 Stage I: 100% Stage II: 100% Stage II: 0 -
GSA (IE) 32% 68% - SKI (DK) 70% 30% - Statskontoret (SWE) 50% 50% -
OGC (UK) 40% 60%** - Average 58% 38% 4%
Notes: *See also the section “Case Study” reported at the end of this paper. **Concerning technical aspects, six evaluation criteria were taken into account by OGC, each of them with a different weight: quality of products (18%); suppliers organizational capability to fulfil requirements (15%); IT/ordering system (9%); environmental considerations (7%); service support/after sales (6%); contract management (5%).
CASE STUDY: THE EXPERIENCE OF MINEFI
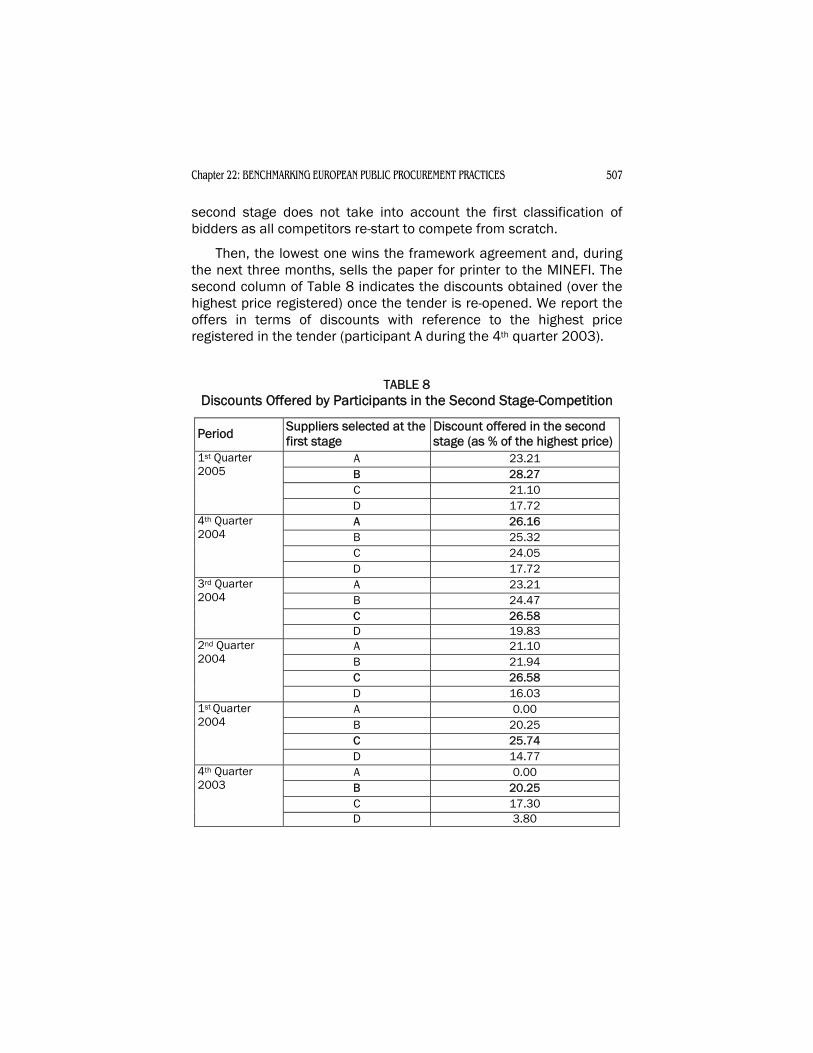
As anticipated, the French MINEFI awarded the tender with a two-stage tender. After the first stage, four suppliers were selected (A, B, C, and D) only in terms of the quality offered and technical points were given. 27 In the second stage, the tender was re-opened and the pre-selected suppliers presented an offer only in terms of prices. This
Chapter 22: BENCHMARKING EUROPEAN PUBLIC PROCUREMENT PRACTICES 507
second stage does not take into account the first classification of bidders as all competitors re-start to compete from scratch.
Then, the lowest one wins the framework agreement and, during the next three months, sells the paper for printer to the MINEFI. The second column of Table 8 indicates the discounts obtained (over the highest price registered) once the tender is re-opened. We report the offers in terms of discounts with reference to the highest price registered in the tender (participant A during the 4th quarter 2003).
TABLE 8 Discounts Offered by Participants in the Second Stage-Competition
Period Suppliers selected at the first stage
Discount offered in the second stage (as % of the highest price)
A 23.21 B 28.27 C 21.10
1st Quarter 2005
D 17.72 A 26.16 B 25.32 C 24.05
4th Quarter 2004
D 17.72 A 23.21 B 24.47 C 26.58
3rd Quarter 2004
D 19.83 A 21.10 B 21.94 C 26.58
2nd Quarter 2004
D 16.03 A 0.00 B 20.25 C 25.74
1st Quarter 2004
D 14.77 A 0.00 B 20.25 C 17.30
4th Quarter 2003
D 3.80
508 CARPINETI, PIGA & ZANZA
From a competitive point of view it is important to underline that the choice of re-opening the tender among participants risks facilitating the participants’ collusive behaviour. For instance, they could decide to rotate and to share the gains obtained.
CONCLUDING REMARKS
This chapter investigates the tendering strategies and the relative results of a group of 13 European institutions that procured the same product categories, namely “fix line telephone services” and “paper for printers.” Data provided represent only a portion of European public procurement practices adopted and, in particular, they reflect the results achieved by centralized agencies only.
From the analysis we noticed that the design of procurement contest varies significantly both between product categories and among institutions. An example is provided by the strategy adopted to evaluate bids received. In the case of fix line telephone services, the surveyed institutions unanimously adopted the most economically advantageous tender, evaluating the economic offer as well as the technical one. In contrast, data on paper for printers revealed that some institutions awarded the framework agreement only to the lowest financial offer. In addition, one institution adopted a third criterion aimed at screening participants in a first stage of competition only in terms of quality provided.
Concerning the tender format, the survey revealed that electronic auctions are not yet a common practice across European procurement agencies. Also, the tenders’ performance shows interesting results in terms of participation (number of offers) and competition (in terms of awarding prices obtained). The survey on fix line telephone services seems to reveal that the higher the level of participation, the greater the spread obtained between awarding prices and market prices. Data on paper for printers allowed the possibility of comparing the number of participants with the monetary values of lots and what emerged was that there is not relation between these two variables. In addition, the analysis of data collected revealed cases of “cross-border” participation to tenders. We may assume that market operators start to consider the European Regions as a single market, even if the national languages seem to represent a serious entry barrier.
Chapter 22: BENCHMARKING EUROPEAN PUBLIC PROCUREMENT PRACTICES 509
As already underlined, this study is one of the first attempts to benchmark public procurement performances of the same product categories. Our study reveals why there are no more frequent attempts of this kind. Even if standardized products were chosen, the main challenge was to collect comparable data. In fact, each country presents specific peculiarities that affect both the tender design strategy and the procurement results.
For this reason, it would be useful in the future to collect more detailed information in order to build a richer data set. From our experience, it would be necessary to gather information about the evolution and structure of national markets, the role of national regulation authorities, and the legislative framework. Last but not least, it would be crucial to know the role assigned by governments to public procurement, since different goals to be achieved imply different procurement designing strategies and results.
ACKNOWLEDGMENTS
This chapter has been written with the support of the Research Unit of Consip. We would like to thank the EU Public Procurement Learning Lab members for the provision of data and original insights; and particularly Carmine Pugliese (working at Consip as Category Manager in Telecommunication), Lorena Cavallaro (working at Consip as Category Manager in Paper for Printers), Federico Russo (working at Consip), and Maria Ebano (working at the Ministry of Economy and Finance, Department of Treasury, Office V – Prices and Regulation of Tariffs).
NOTES
1. See also the European Commission web site on public procurement, available at www.europa.eu.int/comm/internal_ market/publicprocurement/index_en.
2. The PPN is an international co-operation network of public procurement expert officials involving European states. The PPN's aim is to strengthen the application of the EU procurement rules through a mutual exchange of experience and benchmarking and to promote problem solving in cross-border cases relating to public procurement. Noteworthy is the PPN’s Report, “Public Procurement in Europe” available at www.minefi.gouv.fr/daj/
510 CARPINETI, PIGA & ZANZA
marches_publics/ppn/ppnanglais/pdf/11_public_procurement_in _europe.pdf.
3. The laboratory was launched in November 2003 by the Italian Department of Public Administration, jointly with the Ministry of Economy and Finance and Consip S.p.A. The members of the EU Lab meet on a regular basis 3 times per year and, up to now, 35 institutions representative of 27 countries have participated in the 7 meetings organized between 2003 and 2005. Besides the topics of “Procurement and Small and Medium Enterprise” and “Technical Issues of Procurement,” participants assigned great importance to compare national experiences on “auction design”. After a preliminary study conducted in 2004 providing a general overview of the EU practices on this topic, in 2005, participants decided to focus the activity on the topic of public purchasing of specific product categories. Information on the EU Lab initiative are available at www.consip.it/sc/uff_studi_ini_eu_ing.htm.
4. These results were presented at the PPN General Annual Meeting held in Paris on March 16-17. Moreover, the network elaborated a guideline explaining how the PPN problem-solving function works, called "Guidance for Companies prevented from Competing in Foreign Markets because of Discriminatory Public Procurement Practices", available at www.minefi.gouv.fr/daj/ marches_publics/ppn/ppn-anglais/pdf/05_ppn_en.pdf.
5. This product is procured by the Printing Office of the Republic of Cyprus. Information is submitted by the Public Procurement Directorate.
6. Report promoted by the EU Commission, the European Electronic Communication Regulation and Markets 2005 (11th Report).
7. Notes: Countries not included in each data point. Dec. 2003: Local: DK, LU, PT, SE, CZ, EE, LT; Long-distance: DK, LU, SE, EE, LT, MT; Mobile: DK, FI, EE, HU, LT; International: DK, E, LT. Dec. 2004: Local: DK, LU, PT, SE, CZ, EE; Long-distance: DK, LU, SE, EE, MT; Mobile: DK, FI, EE; International: DK, EE (Commission of the European Communities [2005, p. 12]).
8. Operators that along with the incumbent operator have a combined market share of at least 90% of the voice market. Data for Portugal do not include calls to the Internet. Data on market shares for Estonia, Sweden and Czech Republic are confidential.
Chapter 22: BENCHMARKING EUROPEAN PUBLIC PROCUREMENT PRACTICES 511
Data on competing players in Ireland is confidential. Denmark, Luxembourg: Market share based on minutes, not on revenues. Austria: Values on market share are estimates based on data from Q4/2004. Slovakia: Competition by means of CS only started in August 2005. Finland: The 3 incumbent groupings hold 95% of the fixed voice market. Hungary: There are five fixed incumbent operators, each of them former local monopolies in their primary areas. The figure on market share refers to 2003. United Kingdom: Data on market shares refer to Q1/2005. Data for Portugal do not include calls to the Internet. Data on market shares for Estonia, Sweden and Czech Republic are confidential. Data on competing players in Ireland is confidential. In Denmark and Luxembourg, market share is based on minutes, not on revenues. In Austria, values on market share are estimates based on data from Q4/2004. In Slovakia, competition by means of CS only started in August 2005. In Finland, the three incumbent groupings hold 95% of the fixed voice market. In Hungary, there are five fixed incumbent operators, each of them former local monopolies in their primary areas. The figure on market share refers to 2003. In United Kingdom, data on market shares refer to Q1/2005.
9. It is important to keep in mind that collected data represent just a portion of European public procurement practices in purchasing fixed line telephone services.
10. The EC Directive considers traditional frame contracts, where only the best offer is selected without possibility of a second stage contracting level, as a particular framework agreement. For this reason, this chapter will include into framework agreement also the traditional frame contracts.
11. See Dimitri, Pacini, Pagnozzi and Spagnolo G. (2006).
12. Consip awarded just one lot for the fix-line telephone services. In fact, as it was explained before, the two lots refer respectively to fixed and mobile telephone services.
13. Number of operators with a combined 90% market share of fixed calls
14. The largest variance between a three minutes local and “versus mobile” calls is registered by Statskontoret and it sums to around 40 cents of euro.

512 CARPINETI, PIGA & ZANZA
15. Market price of mobile calls is not available.
16. Whereas 14, EC Directive 18/2004.
17. For a more careful analysis on properties of this formula, see Dini, Pacini and Valletti (2006).
18. Interestingly, OGC bundled different products in a framework agreement to be awarded to two different suppliers: one supplier providing desktop stationery and paper for printers, the second offering IT consumables.
19. UMIC states that the participants to the on-line auction were chosen among the winners of a framework agreement (open procedure).
20. This innovative technique is defined as well within the new EC Directive (Whereas 7, Article 1): “An electronic auction is a repetitive process involving an electronic device for the presentation of new prices, revised downwards, and/or new values concerning certain elements of tenders, which occurs after an initial full evaluation of the tenders, enabling them to be ranked using automatic evaluation methods.”
21. Consip awarded two of the twelve lots tendered. Remaining lots were not assigned.
22. Surveyed institutions provided detailed information on the type of lots: ABA procured a single lot. Paper A4 and A3 size, both virgin and recycled, had to be provided (standard A4= 55%; standard A3= 12 %; recycled A4= 28%; recycled A3=5%); BBG split the framework agreement into three geographical and quantitative lots for A4 paper. In these lots 1-3% refers to A3 paper; Consip split the framework agreement into 12 lots both geographical and quantitative, containing standard and recycled paper; The two lots designed by the Irish GSA were quantitative: both contained white paper A3 Size (2.8% of total), Coloured paper A4 Size (1.9% of total), white paper A4 Size (95.3% of total). The white A4 paper was virgin paper (85.2% of the total) and recycled paper (10.1% of the total); the two lots of Hansel were qualitative, one containing the standard type of paper (A4 and A3 size), the other a different kind of paper whose weight was of 110-160 g/m2; the French MINEFI awarded one single lot containing 96% of A4 Paper and 4% of A3 Paper; OGC divided the framework
Chapter 22: BENCHMARKING EUROPEAN PUBLIC PROCUREMENT PRACTICES 513
agreement into three qualitative lots. This framework was split into three generic lots and only one of these refer to paper for printers. Paper was modelled on recycled office A4 and A3 paper; PPD divided the framework agreement into two qualitative lots: the first lot contains A4 Virgin paper, while the second contains A3 Virgin paper; SKI auctioned off one lot, containing 95-98% of standard A4 and the left recycled paper; even Statskontoret auctioned off only one lot. Information about the type of paper in each lot is not available; UMIC awarded four lots, geographical and qualitative. The first two lots were for virgin A4 paper, while lot number 3 and 4 contained standard A3 paper. Geographical lots considered the "Lisbon Area" and "rest of the country including the islands". Recycled paper was not procured through the auction.
23. Bidders were located in Austria, Belgium, Denmark, France, Ireland, Italy, Portugal, and Sweden.
24. See also the website www.iso.org/iso/en/ISOOnline.frontpage for further details.
25. Only institutions providing data are indicated. Where “n.g.” is reported, the tender document did not request minimum standards.
26. See Albano and Spagnolo (2005).
27. In the new edition of this tender the MINEFI states that in the first stage are also taken into account: technical quality, environmental criteria, logistics ability to execute the contract, and indicative price.
REFERENCES
Albano, G., L., & Spagnolo, G., (2005) “"The Collusive Drawbacks of Sequential Auctions." Quaderni Consip, IX. [On-line]. Available at http://www.consip.it/scd/PressComunicazioniLista. jsp?id=18 .
Commission of the European Communities (2006, February 20) European Electronic Communication Regulations and Markets. (11th Report, Annex 2). Paris, France: Author.
Dimitri, N., Pacini, R., Pagnozzi, M., & Spagnolo, G. (2006). “Multi-Contract Tendering and Package Bidding in Procurement.” In N.
514 CARPINETI, PIGA & ZANZA
Dimitri, G. Piga, and G. Spagnolo (Eds.). Handbook of Procurement (pp. 193-219). Cambridge, England: Cambridge University Press.
Dini, F., Pacini, R., & Valletti, T. (2006). “Scoring Rules.” In N. Dimitri, G. Piga and G. Spagnolo (Eds.). Handbook of Procurement, chapter 12, pp. 293-321. Cambridge, England: Cambridge University Press.
European Commission, European Parliament, and the Council (2004). “Directive 2004/18/EC: On the Coordination of Procedures for the Award of Public Works Contracts, Public Supply Contracts and Public Service Contracts.” Brussels, Belgium: Author.
Eurostat (2006) “GDP and Main Components at Current Prices.” [On-line]. Available at www.epp.eurostat.cec.eu.int/portal/page?_ pageid=0,1136173,0_45570701&_dad=portal&_schema=PORTAL . (Retrieved April 27, 2006).
Piga, G., & Valletti, T. (2006, January 5). “TLC, l’Autorità Regola Poco.” Il Sole24Ore.
Piga, G., & Zanza, M. (2004). “An Exploratory Analysis of Public Procurement Practices in Europe.” In K. V. Thai et al. (Eds.), Challenges in Public Procurement: An International Perspective (pp. 179-206). Bacon Raton, FL: PrAcademic Press.
Public Procurement Network (2006). "Guidance for Companies prevented from Competing in Foreign Markets because of Discriminatory Public Procurement Practices." [On-line] Available at http://www.minefi.gouv.fr/daj/marches_publics/ppn/ppn-anglais/pdf/05_ppn_en.pdf.
Public Procurement Network (2004). “Public Procurement in Europe.” [On-line]. Available at www.minefi.gouv.fr/daj/ marches_publics/ ppn/ppn-anglais/pdf/11_public_procurement_in_europe.pdf.
World Trade Organization (1996). “Uruguay Agreement: Agreement on Government Procurement.” [On-line] Available at www.wto.org/ English/docs_e/legal_e/gpr-94_e.pdf.
Related Documents