Copyright 2009 Cengage Learning. All Rights Reserved. May not be copied, scanned, or duplicated, in whole or in part. Chapter 21: Thrift Operations The term thrift institution (or savings institution) is normally used to refer to a depository institution that specializes in mortgage lending. They were created to accept deposits and channel the funds for mortgage loans. Some thrift operations are independent financial institutions, while others are units (subsidiaries) of financial conglomerates. Sometimes credit unions are also considered to be thrift institutions. For this reason, credit unions are also covered in this chapter. The specific objectives of this chapter are to: ■ identify the key sources and uses of funds for savings institutions, ■ describe the exposure of savings institutions to various types of risk, ■ explain the valuation of a savings institution, ■ describe the savings institution crisis and the actions taken to resolve the crisis, ■ describe the main sources and uses of funds for credit unions, and ■ describe the exposure of credit unions to various forms of risk. 574 Background on Savings Institutions Savings institutions include savings banks and savings and loan associations (S&Ls). S&Ls are the most dominant type. While S&Ls are spread across the entire country, savings banks are mainly concentrated in the northeastern United States. The insuring agency for both S&Ls and savings banks is the Deposit Insurance Fund (DIF), which is administered by the Federal Deposit Insurance Corporation (FDIC) and insures deposits up to $100,000 per depositor. The DIF was formed on March 31, 2006, as a result of the merger of the Savings Association Insurance Fund (SAIF), which had for- merly insured S&Ls, and the Bank Insurance Fund (BIF), which had insured savings banks. As of the end of 2006, the DIF had just under $50 billion in reserves. Although savings banks have had more flexibility in their investing practices than S&Ls, the difference has narrowed over time. The two types of thrifts are now very similar in their sources and uses of funds. Therefore, the remainder of the chapter fo- cuses on savings institutions, abbreviated as SIs. As shown in Exhibit 21.1, most SIs are small, with less than $1 billion in assets. The largest 10 percent of SIs manage more assets than are managed by all other SIs in the industry. Ownership Savings institutions are classified as either stock owned or mutual (owned by deposi- tors). Although most SIs are mutual, many SIs have shifted their ownership structure from depositors to shareholders through what is known as a mutual-to-stock conversion. This conversion allows SIs to obtain additional capital by issuing stock. 21-B4312-AM1.indd 574 21-B4312-AM1.indd 574 8/29/07 2:32:11 AM 8/29/07 2:32:11 AM

Welcome message from author
This document is posted to help you gain knowledge. Please leave a comment to let me know what you think about it! Share it to your friends and learn new things together.
Transcript

Copyright 2009 Cengage Learning. All Rights Reserved. May not be copied, scanned, or duplicated, in whole or in part.
Chapter 21: Thrift Operations
The term thrift institution (or savings institution) is normally used to refer to a depository institution that specializes in mortgage lending. They were created to accept deposits and channel the funds for mortgage loans. Some thrift operations are independent financial institutions, while others are units (subsidiaries) of financial conglomerates. Sometimes credit unions are also considered to be thrift institutions. For this reason, credit unions are also covered in this chapter.
The specific objectives of this chapter are to:
■ identify the key sources and uses of funds for savings institutions,
■ describe the exposure of savings institutions to various types of risk,
■ explain the valuation of a savings institution,
■ describe the savings institution crisis and the actions taken to resolve the crisis,
■ describe the main sources and uses of funds for credit unions, and
■ describe the exposure of credit unions to various forms of risk.
574
Background on Savings InstitutionsSavings institutions include savings banks and savings and loan associations (S&Ls). S&Ls are the most dominant type. While S&Ls are spread across the entire country, savings banks are mainly concentrated in the northeastern United States. The insuring agency for both S&Ls and savings banks is the Deposit Insurance Fund (DIF), which is administered by the Federal Deposit Insurance Corporation (FDIC) and insures deposits up to $100,000 per depositor. The DIF was formed on March 31, 2006, as a result of the merger of the Savings Association Insurance Fund (SAIF), which had for-merly insured S&Ls, and the Bank Insurance Fund (BIF), which had insured savings banks. As of the end of 2006, the DIF had just under $50 billion in reserves.
Although savings banks have had more flexibility in their investing practices than S&Ls, the difference has narrowed over time. The two types of thrifts are now very similar in their sources and uses of funds. Therefore, the remainder of the chapter fo-cuses on savings institutions, abbreviated as SIs.
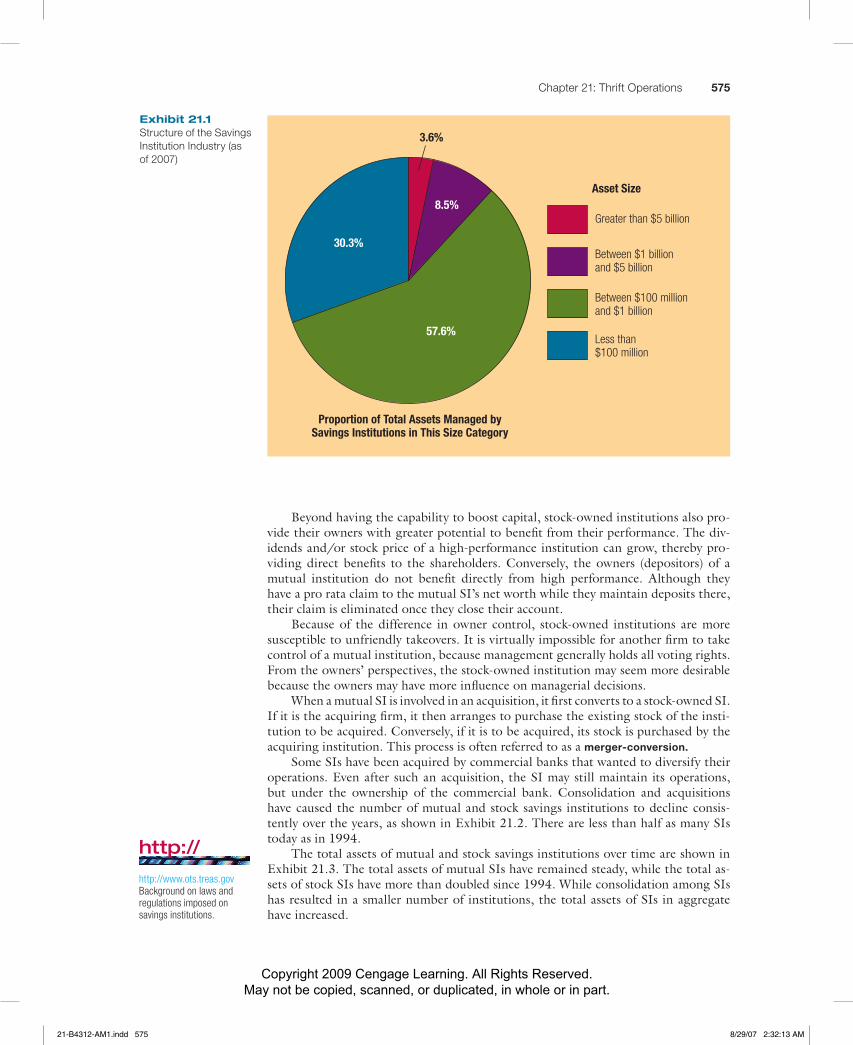
As shown in Exhibit 21.1, most SIs are small, with less than $1 billion in assets. The largest 10 percent of SIs manage more assets than are managed by all other SIs in the industry.
OwnershipSavings institutions are classified as either stock owned or mutual (owned by deposi-tors). Although most SIs are mutual, many SIs have shifted their ownership structure from depositors to shareholders through what is known as a mutual-to-stock conversion.This conversion allows SIs to obtain additional capital by issuing stock.
21-B4312-AM1.indd 57421-B4312-AM1.indd 574 8/29/07 2:32:11 AM8/29/07 2:32:11 AM
Copyright 2009 Cengage Learning. All Rights Reserved. May not be copied, scanned, or duplicated, in whole or in part.
Chapter 21: Thrift Operations 575
Beyond having the capability to boost capital, stock-owned institutions also pro-vide their owners with greater potential to benefit from their performance. The div-idends and/or stock price of a high-performance institution can grow, thereby pro-viding direct benefits to the shareholders. Conversely, the owners (depositors) of a mutual institution do not benefit directly from high performance. Although they have a pro rata claim to the mutual SI’s net worth while they maintain deposits there, their claim is eliminated once they close their account.
Because of the difference in owner control, stock-owned institutions are more susceptible to unfriendly takeovers. It is virtually impossible for another firm to take control of a mutual institution, because management generally holds all voting rights. From the owners’ perspectives, the stock-owned institution may seem more desirable because the owners may have more influence on managerial decisions.
When a mutual SI is involved in an acquisition, it first converts to a stock-owned SI.If it is the acquiring firm, it then arranges to purchase the existing stock of the insti-tution to be acquired. Conversely, if it is to be acquired, its stock is purchased by the acquiring institution. This process is often referred to as a merger-conversion.
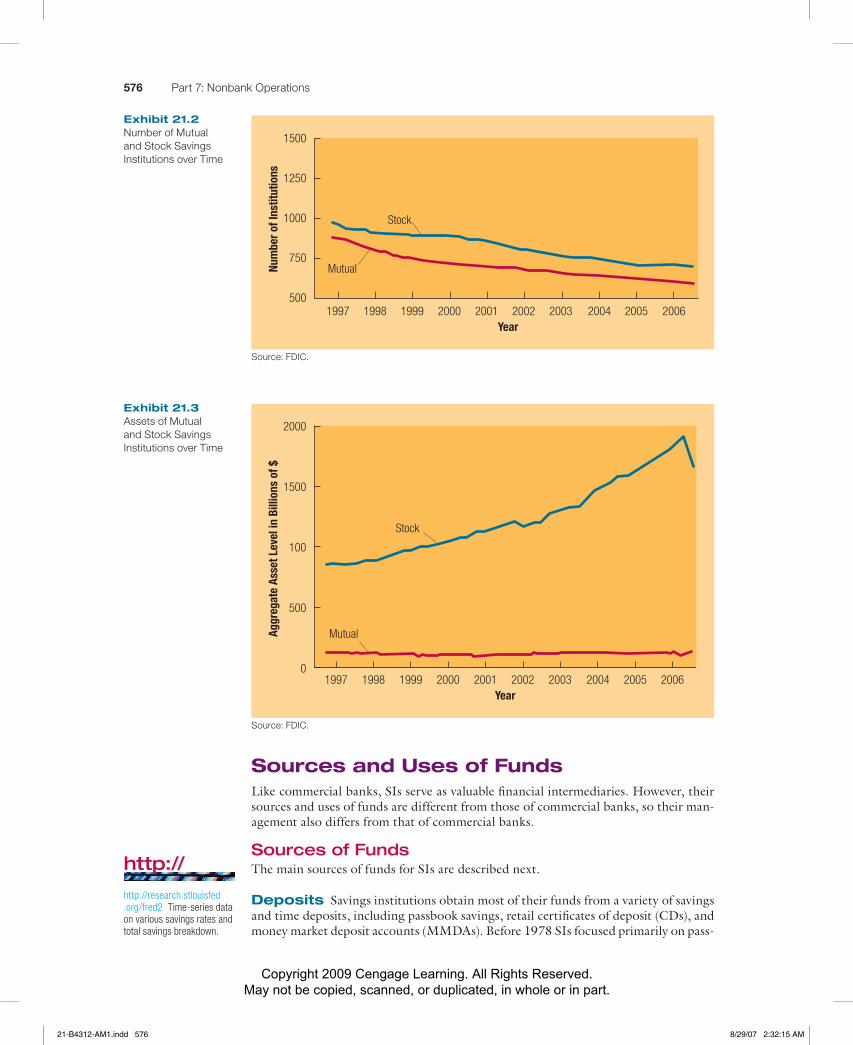
Some SIs have been acquired by commercial banks that wanted to diversify their operations. Even after such an acquisition, the SI may still maintain its operations, but under the ownership of the commercial bank. Consolidation and acquisitions have caused the number of mutual and stock savings institutions to decline consis-tently over the years, as shown in Exhibit 21.2. There are less than half as many SIs today as in 1994.
The total assets of mutual and stock savings institutions over time are shown in Exhibit 21.3. The total assets of mutual SIs have remained steady, while the total as-sets of stock SIs have more than doubled since 1994. While consolidation among SIs has resulted in a smaller number of institutions, the total assets of SIs in aggregate have increased.
Proportion of Total Assets Managed bySavings Institutions in This Size Category
Greater than $5 billion
Between $1 billionand $5 billion
Between $100 millionand $1 billion
Less than$100 million
Asset Size8.5%
3.6%
57.6%
30.3%
Exhibit 21.1 Structure of the Savings Institution Industry (as of 2007)
http://
http://www.ots.treas.govBackground on laws and regulations imposed on savings institutions.
21-B4312-AM1.indd 57521-B4312-AM1.indd 575 8/29/07 2:32:13 AM8/29/07 2:32:13 AM
Copyright 2009 Cengage Learning. All Rights Reserved. May not be copied, scanned, or duplicated, in whole or in part.
576 Part 7: Nonbank Operations
Sources and Uses of FundsLike commercial banks, SIs serve as valuable financial intermediaries. However, their sources and uses of funds are different from those of commercial banks, so their man-agement also differs from that of commercial banks.
Sources of FundsThe main sources of funds for SIs are described next.
Deposits Savings institutions obtain most of their funds from a variety of savings and time deposits, including passbook savings, retail certifi cates of deposit (CDs), and money market deposit accounts (MMDAs). Before 1978 SIs focused primarily on pass-
Exhibit 21.2 Number of Mutual and Stock Savings Institutions over Time
Source: FDIC.
Num
ber o
f Ins
titut
ions
1500
1250
1000
750
5002003 2004 2005 20062002200120001997 19991998
Stock
Mutual
Year
Aggr
egat
e As
set L
evel
in B
illio
ns o
f $
2000
1500
100
500
02003 2004 2005 20062002200120001997 19991998
Stock
Mutual
Year
Exhibit 21.3 Assets of Mutual and Stock Savings Institutions over Time
Source: FDIC.
http://
http://research.stlouisfed.org/fred2 Time-series data on various savings rates and total savings breakdown.
21-B4312-AM1.indd 57621-B4312-AM1.indd 576 8/29/07 2:32:15 AM8/29/07 2:32:15 AM
Copyright 2009 Cengage Learning. All Rights Reserved. May not be copied, scanned, or duplicated, in whole or in part.
Chapter 21: Thrift Operations 577
book savings accounts. During the early and mid-1970s, market interest rates exceeded the passbook savings rate, so many savers transferred their funds from SIs to alternative investments, a process known as disintermediation. Because disintermediation reduced the volume of savings at SIs, it reduced the amount of mortgage financing available.
In 1981 SIs across the country were allowed to offer NOW (negotiable order of withdrawal) accounts as a result of the Depository Institution Deregulation and Monetary Control Act (DIDMCA) of 1980. This was a major change because they were previously unable to offer checking services. Suddenly, the differences between commercial banks and SIs were not so obvious to savers. NOW accounts enabled SIs to be perceived as full-service financial institutions.
The creation of MMDAs in 1982 (as a result of the Garn-St Germain Act) al-lowed SIs to offer limited checking combined with a market-determined interest rate and therefore to compete against money market funds. Because these new accounts offered close-to-market interest rates, they were a more expensive source of funds than passbook savings. The new types of deposit accounts also increased the sensitiv-ity of SIs’ liabilities to interest rate movements.
Like commercial banks, SIs were historically unable to offer a rate above a regu-latory ceiling on deposits. In 1978 regulations were loosened, allowing them to of-fer limited types of retail CDs with rates tied to Treasury bills. With the wider vari-ety of retail CDs allowed in the late 1970s and early 1980s and the introduction of MMDAs in 1982, the ceiling rate on passbook savings was no longer as relevant. By 1986, all deposits were free from ceiling rates.
Borrowed Funds When SIs are unable to attract sufficient deposits, they can borrow on a short-term basis from three sources. First, they can borrow from other depository institutions that have excess funds in the federal funds market. The inter-est rate on funds borrowed in this market is referred to as the federal funds rate.
Second, SIs can borrow through a repurchase agreement (repo). With a repo, an institution sells government securities, with a commitment to repurchase those secu-rities shortly thereafter. This essentially reflects a short-term loan to the institution that initially sold the securities until the time when it buys the securities back.
Third, SIs can borrow at the Federal Reserve, but this is not as common as the other alternatives.
Capital The capital (or net worth) of an SI is primarily composed of retained earn-ings and funds obtained from issuing stock. During periods when SIs are performing well, capital is boosted by additional retained earnings. Capital is commonly used to support ongoing or expanding operations.
Savings institutions are required to maintain a minimum level of capital to cush-ion against potential losses that could occur and thus help to avoid possible failure. During the 1980s, many SIs experienced losses, and their capital levels were reduced. Concerned about the erosion of capital, regulatory agencies tightened requirements.
Uses of FundsThe main uses of funds for SIs are
• Cash • Mortgages • Mortgage-backed securities • Other securities • Consumer and commercial loans • Other uses
21-B4312-AM1.indd 57721-B4312-AM1.indd 577 8/29/07 2:32:16 AM8/29/07 2:32:16 AM
Copyright 2009 Cengage Learning. All Rights Reserved. May not be copied, scanned, or duplicated, in whole or in part.
578 Part 7: Nonbank Operations
Cash Savings institutions maintain cash to satisfy reserve requirements enforced by the Federal Reserve System and to accommodate withdrawal requests of deposi-tors. In addition, some SIs hold correspondent cash balances at other financial insti-tutions in return for various services.
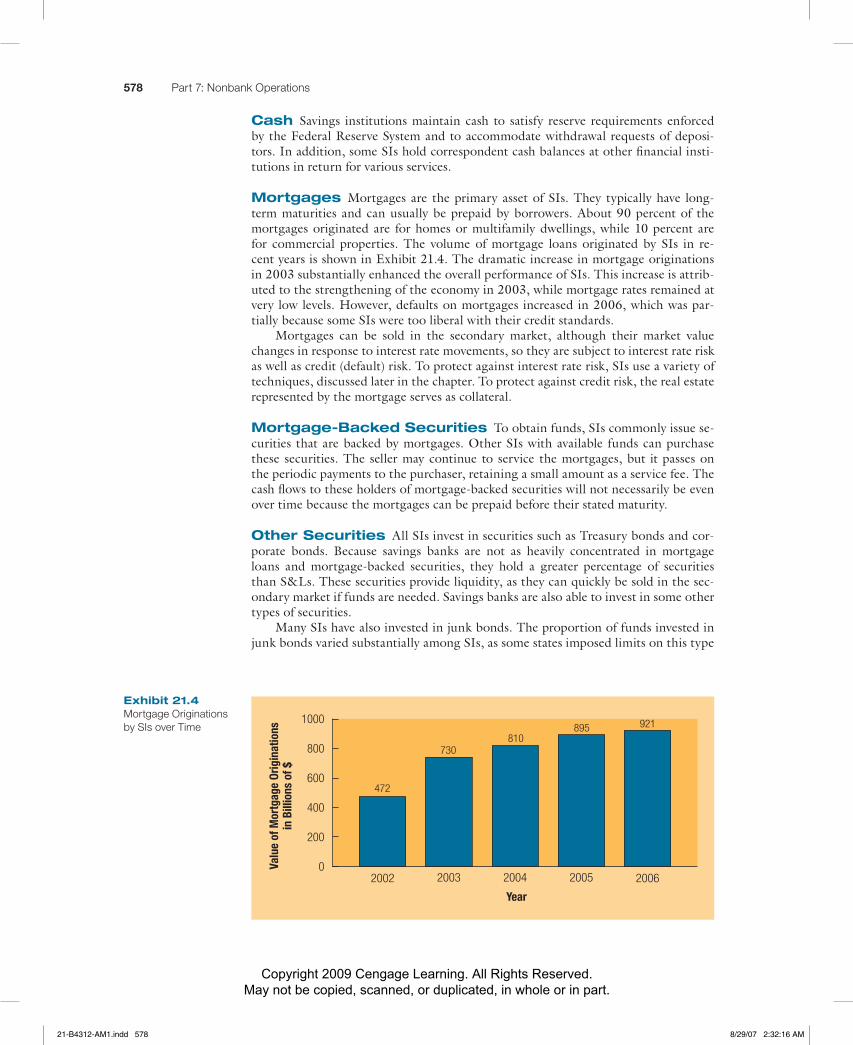
Mortgages Mortgages are the primary asset of SIs. They typically have long-term maturities and can usually be prepaid by borrowers. About 90 percent of the mortgages originated are for homes or multifamily dwellings, while 10 percent are for commercial properties. The volume of mortgage loans originated by SIs in re-cent years is shown in Exhibit 21.4. The dramatic increase in mortgage originations in 2003 substantially enhanced the overall performance of SIs. This increase is attrib-uted to the strengthening of the economy in 2003, while mortgage rates remained at very low levels. However, defaults on mortgages increased in 2006, which was par-tially because some SIs were too liberal with their credit standards.
Mortgages can be sold in the secondary market, although their market value changes in response to interest rate movements, so they are subject to interest rate risk as well as credit (default) risk. To protect against interest rate risk, SIs use a variety of techniques, discussed later in the chapter. To protect against credit risk, the real estate represented by the mortgage serves as collateral.
Mortgage-Backed Securities To obtain funds, SIs commonly issue se-curities that are backed by mortgages. Other SIs with available funds can purchase these securities. The seller may continue to service the mortgages, but it passes on the periodic payments to the purchaser, retaining a small amount as a service fee. The cash flows to these holders of mortgage-backed securities will not necessarily be even over time because the mortgages can be prepaid before their stated maturity.
Other Securities All SIs invest in securities such as Treasury bonds and cor-porate bonds. Because savings banks are not as heavily concentrated in mortgage loans and mortgage-backed securities, they hold a greater percentage of securities than S&Ls. These securities provide liquidity, as they can quickly be sold in the sec-ondary market if funds are needed. Savings banks are also able to invest in some other types of securities.
Many SIs have also invested in junk bonds. The proportion of funds invested in junk bonds varied substantially among SIs, as some states imposed limits on this type
Exhibit 21.4 Mortgage Originations by SIs over Time
Valu
e of
Mor
tgag
e Or
igin
atio
nsin
Bill
ions
of $
2004 20052002 2003
1000
800
600
400
200
0
810895
472
2006
Year
921
730
21-B4312-AM1.indd 57821-B4312-AM1.indd 578 8/29/07 2:32:16 AM8/29/07 2:32:16 AM

Copyright 2009 Cengage Learning. All Rights Reserved. May not be copied, scanned, or duplicated, in whole or in part.
Chapter 21: Thrift Operations 579
of investment. As a result of the savings institution crisis, regulators prohibited addi-tional investment in junk bonds in 1989.
Consumer and Commercial Loans Many SIs are attempting to in-crease their consumer loans and commercial loans. As a result of the DIDMCA and the Garn-St Germain Act, the lending guidelines for federally chartered SIs were loosened, and many state-chartered SIs were also granted more lending flexibility by their respective states. Specifically, federally chartered SIs are allowed to invest up to 30 percent of their assets in nonmortgage loans and securities. A maximum 10 per-cent of assets can be used to provide non–real estate commercial loans.
Savings institutions have taken advantage of the deregulatory acts by providing corporate and consumer loans with maturities typically ranging between one and four years. Because consumer and corporate loan maturities closely match their liability maturities, SIs that reduce their mortgage loan concentration in favor of more corpo-rate and consumer loans reduce their exposure to interest rate risk. However, offering these loans results in some noninterest costs. The increased emphasis on corporate and consumer loans can increase an SI’s overall degree of credit risk. The loss rate on mortgage loans has been significantly lower than the loss rate on credit card loans, al-though it increased in the 2006–2007 period.
Despite their moves into corporate and consumer lending, SIs’ participation in these fields is still limited by regulators. Thus, mortgages and mortgage-backed secu-rities continue to be their primary assets.
Other Uses of Funds Savings institutions can provide temporary financing to other institutions through the use of repurchase agreements. In addition, they can lend funds on a short-term basis through the federal funds market. Both methods al-low them to efficiently use funds that they will have available for only a short period of time.
Balance Sheet of Savings InstitutionsThe sources of funds represent liabilities or equity of an SI, while the uses of funds represent assets. Each SI determines its own composition of liabilities and assets, which determines its specifi c operations.
Exhibit 21.5 summarizes the main sources and uses of funds of SIs by showing the balance sheet of Ashland Savings. The assets are shown on
the left side of the balance sheet. The second column shows dollar amount, and the third column shows the size of each asset in proportion to the total assets, to illus-trate how Ashland Savings distributes its funds. Ashland’s main asset is mortgage loans. The allocation of assets by Ashland Savings represents the average allocation for all SIs. Allocations vary considerably among SIs, however, as some institutions maintain a much larger amount of mortgages than others.
Ashland Savings incurs some expenses from all types of deposits. Specifi cally, it hires employees to serve depositors. Its composition of liabilities determines its in-terest expenses, since it must pay a higher interest rate on large CDs than on small savings deposits. Ashland also incurs expenses from managing its assets. In partic-ular, it hires employees to assess the creditworthiness of individuals and businesses that request loans. In general, Ashland wants to generate enough income from its assets to cover its expenses and provide a reasonable return to its shareholders. Its primary source of income is interest received from the mortgage loans that it pro-vides. Its capital is shown on the balance sheet as common stock issued and retained earnings. ■
I L L U S T R A T I O NI L L U S T R A T I O NI L L U S T R A T I O NI L L U S T R A T I O N
21-B4312-AM1.indd 57921-B4312-AM1.indd 579 8/29/07 2:32:17 AM8/29/07 2:32:17 AM

Copyright 2009 Cengage Learning. All Rights Reserved. May not be copied, scanned, or duplicated, in whole or in part.
580 Part 7: Nonbank Operations
Exhibit 21.6 shows how savings institutions use the key balance sheet items to fi nance economic growth. They channel funds from their depositors with surplus funds to other households that purchase homes. They also channel funds to support investment in commercial property. They serve a major role in the development of the housing and commercial property market. They also use some deposits to purchase Treasury and municipal securities and thereby fi nance spending by the Treasury and municipalities.
Regulation of Savings InstitutionsSavings institutions are regulated at both the state and federal levels. All federally chartered SIs are regulated by the Office of Thrift Supervision (OTS). State-chartered SIs are subject to some oversight by the state that has chartered them, but the states have no authority over federally chartered institutions. Supervision can also vary ac-cording to whether the SI is mutual or stock owned.
Regulatory Assessment of Savings InstitutionsRegulators conduct periodic on-site examinations to ensure that SIs have the mini-mum level of capital required and maintain their exposure to risk within a tolerable range. SIs are monitored using the CAMELS rating in a manner similar to commer-cial banks. They are assessed according to their capital adequacy, asset quality, man-agement, earnings, liquidity, and sensitivity to market conditions. If an SI receives a composite CAMELS rating of 4 or higher, it is classified as a “problem” and receives close attention. It may be subject to corrective action by the Office of Thrift Supervi-sion. Exhibit 21.7 shows the number of problem thrifts and their aggregate asset level in recent years. In general, the number and aggregate asset level of “problem” SIs have been low in recent years. However, in 2006, the problem thrift asset level rose due mostly to subprime (low quality) mortgage loans that defaulted. During the weak economy in 2001–2002, there was not a pronounced increase in problem SIs.
Proportion of Total Dollar Proportion Liabilities and Dollar Liabilities and Amount of Total Stockholders’ Amount Stockholders’Assets (in Millions) Assets Equity (in Millions) Equity
Cash (includes required reserves) $ 60 6% Savings deposits $ 100 10%
Single-family mortgages 500 50% NOW accounts 50 5%
Multifamily mortgages 50 5% Money market deposit accounts 300 30%
Other mortgages 40 4% Short-term CDs 360 36%
Mortgage-backed securities 70 7% CDs with maturities beyond 100 10% one year
Other securities 100 10%
Consumer loans 70 7%
Commercial loans 40 4%
Fixed assets 70 7% Common stock issued 50 5%
Retained earnings 40 4%
TOTAL ASSETS $1,000 100% TOTAL LIABILITIES AND STOCKHOLDERS’ EQUITY $1,000 100%
Exhibit 21.5 Balance Sheet of Ashland Savings as of June 30, 2008
21-B4312-AM1.indd 58021-B4312-AM1.indd 580 8/29/07 2:32:17 AM8/29/07 2:32:17 AM

Copyright 2009 Cengage Learning. All Rights Reserved. May not be copied, scanned, or duplicated, in whole or in part.
SavingsInstitutions
$ deposits
CorporateInvestment inCommercial
Property
HouseholdPurchasesof Homes
TreasurySpending
MunicipalGovernment
Spending
$ commercial property loans
$ mortgage loans
$ purchases of Treasury securities$ purchases of municipal securities
Households
Exhibit 21.6 How Savings Institutions Finance Economic Growth
Num
ber o
fPr
oble
m T
hrift
s
1999 2000 2002 2003
20
15
10
5
0
12
1514
2001 2005 20062004
16
8
5 5 5
Asse
ts o
f Pro
blem
Thr
ifts
in B
illio
ns o
f $
1999 2000 2002 2003
10
8
6
4
2
0
5.5
7.0
3.0
2001 2005 20062004
Year
Year
4.0
1.02.0
3.9
1.0
Exhibit 21.7 Problem Thrifts over Time (Based on CAMELS Ratings)
21-B4312-AM1.indd 58121-B4312-AM1.indd 581 8/29/07 2:32:17 AM8/29/07 2:32:17 AM
Copyright 2009 Cengage Learning. All Rights Reserved. May not be copied, scanned, or duplicated, in whole or in part.
582 Part 7: Nonbank Operations
Deregulation of ServicesIn recent years, SIs have been granted more flexibility to diversify the products and ser-vices they provide. They can offer products that historically were offered only by real estate, insurance, or brokerage firms. For example, some SIs serve as limited agents for registered brokerage firms and are therefore able to offer their customers access to dis-count brokerage services. In some joint ventures, an SI allows a registered broker to offer services on its premises. By offering discount brokerage service and other non-traditional services, an SI can attract customers searching for a one-stop shop.
Exposure to RiskLike commercial banks, SIs are exposed to liquidity risk, credit risk, and interest rate risk. However, because their sources and uses of funds differ from those of banks, their exposure to risk varies as well.
Liquidity RiskSince SIs commonly use short-term liabilities to finance long-term assets, they de-pend on additional deposits to accommodate withdrawal requests. If new deposits are not sufficient to cover withdrawal requests, these institutions can experience liquid-ity problems. To remedy this situation, they can obtain funds through repurchase agreements or borrow funds in the federal funds market. These sources of funds will resolve only a short-term shortage, however. They will not be appropriate if a longer-term liquidity problem exists.
An alternative way to remedy a problem of insufficient liquidity is to sell assets in exchange for cash. Savings institutions can sell their Treasury securities or even some of their mortgages in the secondary market. Although the sale of assets can boost liquidity, it also reduces the institution’s size and possibly its earnings. Therefore, minor liquidity deficiencies are typically resolved by increasing liabilities rather than selling assets.
Credit RiskBecause mortgages represent the primary asset, they are the main reason for credit risk at SIs. Although Federal Housing Authority (FHA) and Veterans Administration (VA) mortgages originated by SIs are insured against credit risk, conventional mort-gages are not. Private insurance can normally be obtained for conventional mortgages, but SIs often incur the risk themselves rather than pay for the insurance. If they per-form adequate credit analysis on their potential borrowers and geographically diver-sify their mortgage loans, they should be able to maintain a low degree of credit risk.
Some SIs increased their concentration of subprime (low quality) mortgage loans in order to strive for a higher return on their assets. This strategy failed as many of the loans defaulted in the 2006–2007 period.
Some SIs were adversely affected by the weak economy in 2001–2002. Layoffs increased, and the expected income of households was subject to more uncertainty. Since SIs rely on households for most of their income from loans, their exposure to credit risk increased.
Interest Rate RiskThe exposure of SIs to interest rate risk received much attention during the 1980s when interest rates increased substantially. At that time, they had a heavy concentra-tion of fixed-rate mortgages, while their liabilities were mostly rate sensitive. Thus, the spread between their interest revenue and interest expenses narrowed when inter-est rates increased. The spread even became negative in the early 1980s because rates
21-B4312-AM1.indd 58221-B4312-AM1.indd 582 8/29/07 2:32:18 AM8/29/07 2:32:18 AM
Copyright 2009 Cengage Learning. All Rights Reserved. May not be copied, scanned, or duplicated, in whole or in part.
Chapter 21: Thrift Operations 583
on deposits increased beyond the fixed interest rates charged on mortgages that the SIs had originated in previous years.
In contrast, many SIs benefited from their exposure to interest rate risk in the 2001–2002 period. Interest rates declined in response to the weak economy, and the spread increased.
Measurement of Interest Rate Risk SIs commonly measure the gap between their rate-sensitive assets and their rate-sensitive liabilities in order to deter-mine their exposure to interest rate risk. However, the gap measurement is dependent on the criteria used to classify an asset or liability as rate sensitive.
Siesta Savings Institution was recently created. It obtains most of its funds from two-year CDs and offers 30-year fixed-rate mortgages. It
defines its assets and liabilities as rate sensitive if they are repriced within a year or less. Most of Siesta’s liabilities are initially considered to be rate insensitive because their rate will not be affected within the year. Its assets are also considered to be rate insensitive because their rate will not be affected within the year. Thus, Siesta’s gap is close to zero because its rate-sensitive assets and liabilities are close to zero, which im-plies that the institution is not exposed to interest rate risk. Nevertheless, Siesta will be adversely affected by an increase in interest rates because its interest expenses would rise over time while the rate on its mortgage loans is fixed for a long-term period. Thus, the gap measurement is not an accurate indicator of Siesta’s exposure to interest rate risk. ■
Given the limitations of the gap measurement, some SIs measure the duration of their respective assets and liabilities to determine the imbalance in sensitivity of inter-est revenue versus expenses to interest rate movements. An example follows.
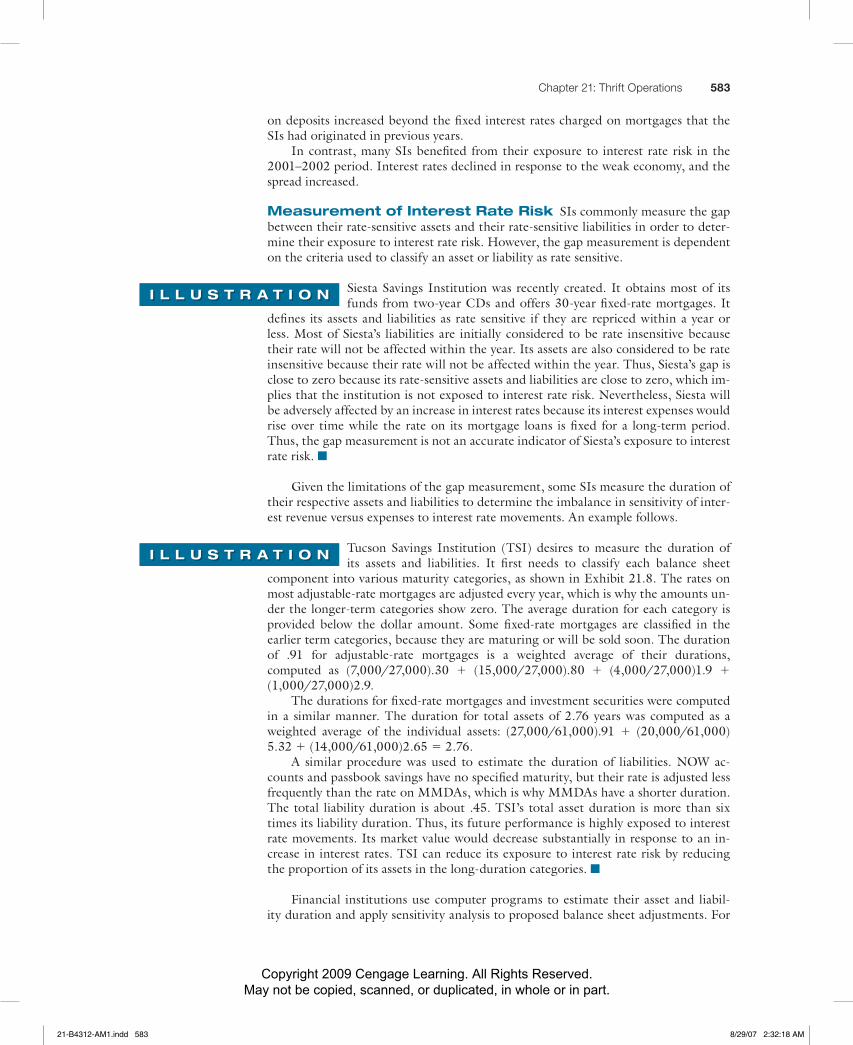
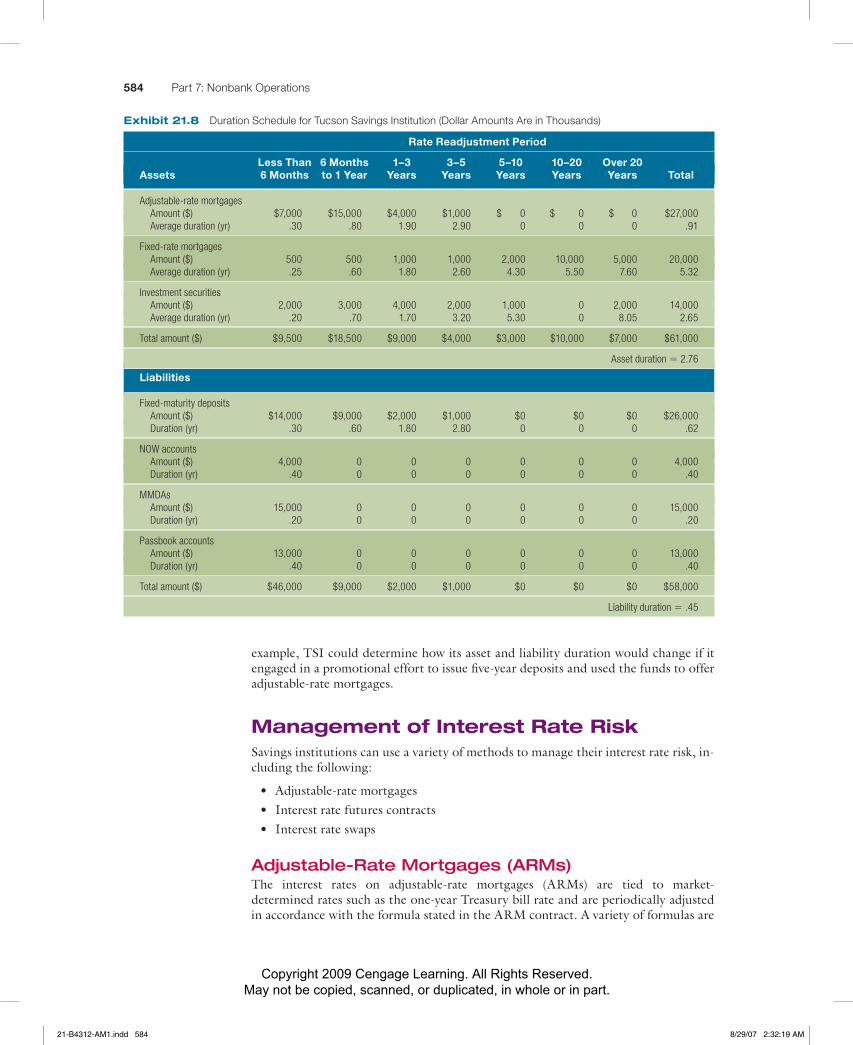
Tucson Savings Institution (TSI) desires to measure the duration of its assets and liabilities. It first needs to classify each balance sheet
component into various maturity categories, as shown in Exhibit 21.8. The rates on most adjustable-rate mortgages are adjusted every year, which is why the amounts un-der the longer-term categories show zero. The average duration for each category is provided below the dollar amount. Some fixed-rate mortgages are classified in the earlier term categories, because they are maturing or will be sold soon. The duration of .91 for adjustable-rate mortgages is a weighted average of their durations, computed as (7,000/27,000).30 � (15,000/27,000).80 � (4,000/27,000)1.9 � (1,000/27,000)2.9.
The durations for fixed-rate mortgages and investment securities were computed in a similar manner. The duration for total assets of 2.76 years was computed as a weighted average of the individual assets: (27,000/61,000).91 � (20,000/61,000)5.32 � (14,000/61,000)2.65 � 2.76.
A similar procedure was used to estimate the duration of liabilities. NOW ac-counts and passbook savings have no specified maturity, but their rate is adjusted less frequently than the rate on MMDAs, which is why MMDAs have a shorter duration. The total liability duration is about .45. TSI’s total asset duration is more than six times its liability duration. Thus, its future performance is highly exposed to interest rate movements. Its market value would decrease substantially in response to an in-crease in interest rates. TSI can reduce its exposure to interest rate risk by reducing the proportion of its assets in the long-duration categories. ■
Financial institutions use computer programs to estimate their asset and liabil-ity duration and apply sensitivity analysis to proposed balance sheet adjustments. For
I L L U S T R A T I O NI L L U S T R A T I O NI L L U S T R A T I O NI L L U S T R A T I O N
I L L U S T R A T I O NI L L U S T R A T I O NI L L U S T R A T I O NI L L U S T R A T I O N
21-B4312-AM1.indd 58321-B4312-AM1.indd 583 8/29/07 2:32:18 AM8/29/07 2:32:18 AM
Copyright 2009 Cengage Learning. All Rights Reserved. May not be copied, scanned, or duplicated, in whole or in part.
584 Part 7: Nonbank Operations
example, TSI could determine how its asset and liability duration would change if it engaged in a promotional effort to issue five-year deposits and used the funds to offer adjustable-rate mortgages.
Management of Interest Rate RiskSavings institutions can use a variety of methods to manage their interest rate risk, in-cluding the following:
• Adjustable-rate mortgages • Interest rate futures contracts • Interest rate swaps
Adjustable-Rate Mortgages (ARMs)The interest rates on adjustable-rate mortgages (ARMs) are tied to market-determined rates such as the one-year Treasury bill rate and are periodically adjusted in accordance with the formula stated in the ARM contract. A variety of formulas are
Rate Readjustment Period
Less Than 6 Months 1–3 3–5 5–10 10–20 Over 20Assets 6 Months to 1 Year Years Years Years Years Years Total
Adjustable-rate mortgages Amount ($) $7,000 $15,000 $4,000 $1,000 $ 0 $ 0 $ 0 $27,000 Average duration (yr) .30 .80 1.90 2.90 0 0 0 .91
Fixed-rate mortgages Amount ($) 500 500 1,000 1,000 2,000 10,000 5,000 20,000 Average duration (yr) .25 .60 1.80 2.60 4.30 5.50 7.60 5.32
Investment securities Amount ($) 2,000 3,000 4,000 2,000 1,000 0 2,000 14,000 Average duration (yr) .20 .70 1.70 3.20 5.30 0 8.05 2.65
Total amount ($) $9,500 $18,500 $9,000 $4,000 $3,000 $10,000 $7,000 $61,000
Asset duration � 2.76
Liabilities
Fixed-maturity deposits Amount ($) $14,000 $9,000 $2,000 $1,000 $0 $0 $0 $26,000 Duration (yr) .30 .60 1.80 2.80 0 0 0 .62
NOW accounts Amount ($) 4,000 0 0 0 0 0 0 4,000 Duration (yr) .40 0 0 0 0 0 0 .40
MMDAs Amount ($) 15,000 0 0 0 0 0 0 15,000 Duration (yr) .20 0 0 0 0 0 0 .20
Passbook accounts Amount ($) 13,000 0 0 0 0 0 0 13,000 Duration (yr) .40 0 0 0 0 0 0 .40
Total amount ($) $46,000 $9,000 $2,000 $1,000 $0 $0 $0 $58,000
Liability duration � .45
Exhibit 21.8 Duration Schedule for Tucson Savings Institution (Dollar Amounts Are in Thousands)
21-B4312-AM1.indd 58421-B4312-AM1.indd 584 8/29/07 2:32:19 AM8/29/07 2:32:19 AM

Copyright 2009 Cengage Learning. All Rights Reserved. May not be copied, scanned, or duplicated, in whole or in part.
Chapter 21: Thrift Operations 585
used. ARMs enable SIs to maintain a more stable spread between interest revenue and interest expenses.
Although ARMs reduce the adverse impact of rising interest rates, they also re-duce the favorable impact of declining interest rates. Suppose an SI that obtains most of its funds from short-term deposits uses the funds to provide fixed-rate mortgages. If interest rates decline and the SI does not hedge its exposure to interest rate risk, the spread will increase. If the SI uses ARMs as a hedging strategy, however, the interest on loans will decrease during a period of declining rates, so the spread will not widen.
While ARMs reduce the risks of SIs, they expose consumers to interest rate risk. Although ARMs typically have a maximum cap limiting the increase in interest rates (such as 2 percent per year and 5 percent over the loan life), the impact on house-hold mortgage payments is still significant. Because some homeowners prefer fixed-rate mortgages, most SIs continue to offer them and therefore incur interest rate risk. Thus, additional strategies besides the use of ARMs are necessary to reduce this risk.
Interest Rate Futures ContractsAn interest rate futures contract allows for the purchase of a specific amount of a par-ticular debt security for a specified price at a future point in time. Sellers of futures contracts are obligated to sell the securities for the contract price at the stated future point in time.
Some SIs use Treasury bond futures contracts because the cash flow characteris-tics of Treasury bonds resemble those of fixed-rate mortgages. Like mortgages, Trea-sury bonds offer fixed periodic payments, so their market value moves inversely to interest rate fluctuations. Savings institutions that sell futures contracts on these se-curities can effectively hedge their fixed-rate mortgages. If interest rates rise, the mar-ket value of the securities represented by the futures contract will decrease. The SIs will benefit from the difference between the market value at which they can purchase these securities in the future and the futures price at which they will sell the securi-ties. This can offset the reduced spread between their interest revenue and interest ex-penses during the period of rising interest rates.
Although the concept of using interest rate futures to guard against interest rate risk is simple, the actual application is more complex. It is difficult to perfectly offset the potential reduction in the spread with a futures position.
Interest Rate SwapsAnother strategy for reducing interest rate risk is the interest rate swap, which allows an SI to swap fixed-rate payments (an outflow) for variable-rate payments (an inflow). The fixed-rate outflow payments can be matched against the fixed-rate mortgages held so that a certain spread can be achieved. In addition, the variable-rate inflows due to the swap can be matched against the variable cost of funds. In a rising rate environ-ment, the institution’s fixed-rate outflow payments from the swap agreement remain fixed, while the variable-rate inflow payments due to the swap increase. This favor-able result can partially offset the normally unfavorable impact of rising interest rates on an SI’s spread. However, an interest rate swap also reduces the favorable impact of declining interest rates. Inflow interest payments decrease, while the outflow interest payments remain the same during a period of declining rates.
Conclusions about Interest Rate RiskMany SIs have used the strategies just described to reduce their interest rate risk. Al-though these strategies are useful, it is virtually impossible to completely eliminate the risk. One reason for this is the potential prepayment of mortgages. Homeowners often pay off their mortgages before maturity without much advance notice to the SI.
21-B4312-AM1.indd 58521-B4312-AM1.indd 585 8/29/07 2:32:19 AM8/29/07 2:32:19 AM
Copyright 2009 Cengage Learning. All Rights Reserved. May not be copied, scanned, or duplicated, in whole or in part.
586 Part 7: Nonbank Operations
Consequently, SIs do not really know the actual maturity of the mortgages they hold and cannot perfectly match the interest rate sensitivity of their assets and liabilities.
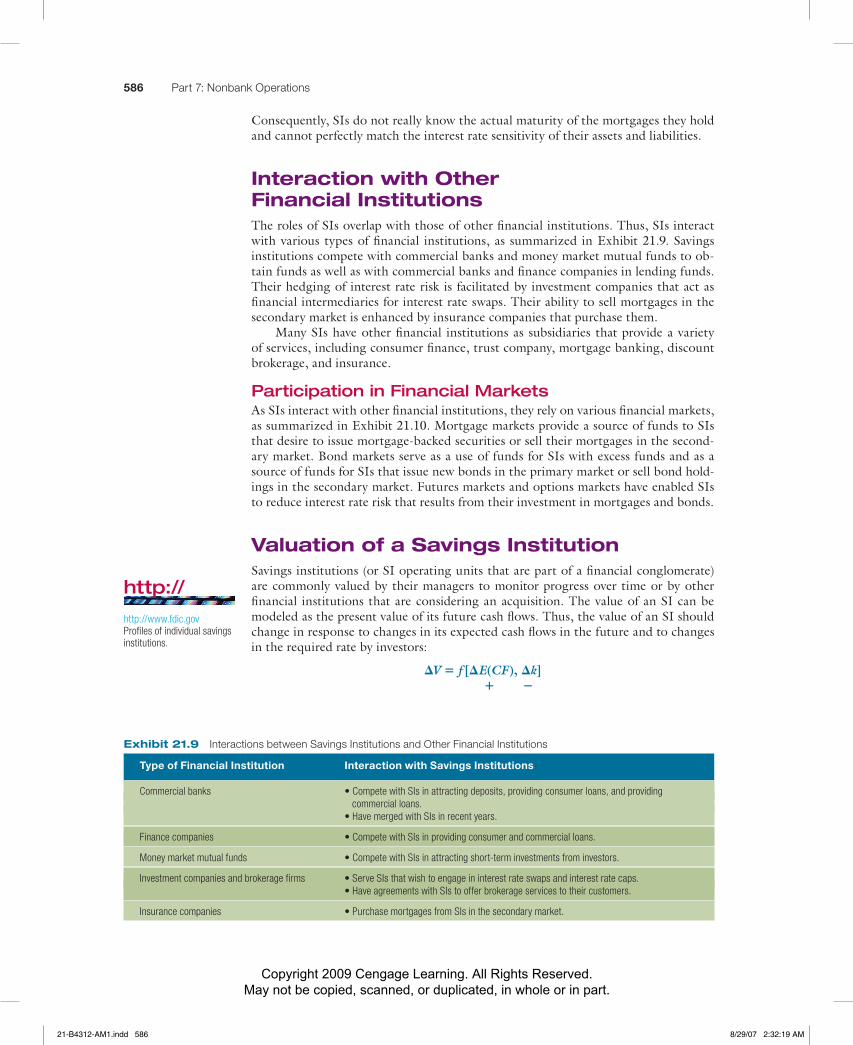
Interaction with Other Financial InstitutionsThe roles of SIs overlap with those of other fi nancial institutions. Thus, SIs interact with various types of financial institutions, as summarized in Exhibit 21.9. Savings institutions compete with commercial banks and money market mutual funds to ob-tain funds as well as with commercial banks and finance companies in lending funds. Their hedging of interest rate risk is facilitated by investment companies that act as financial intermediaries for interest rate swaps. Their ability to sell mortgages in the secondary market is enhanced by insurance companies that purchase them.
Many SIs have other financial institutions as subsidiaries that provide a variety of services, including consumer finance, trust company, mortgage banking, discount brokerage, and insurance.
Participation in Financial MarketsAs SIs interact with other fi nancial institutions, they rely on various financial markets, as summarized in Exhibit 21.10. Mortgage markets provide a source of funds to SIs that desire to issue mortgage-backed securities or sell their mortgages in the second-ary market. Bond markets serve as a use of funds for SIs with excess funds and as a source of funds for SIs that issue new bonds in the primary market or sell bond hold-ings in the secondary market. Futures markets and options markets have enabled SIs to reduce interest rate risk that results from their investment in mortgages and bonds.
Valuation of a Savings InstitutionSavings institutions (or SI operating units that are part of a financial conglomerate) are commonly valued by their managers to monitor progress over time or by other financial institutions that are considering an acquisition. The value of an SI can be modeled as the present value of its future cash flows. Thus, the value of an SI should change in response to changes in its expected cash flows in the future and to changes in the required rate by investors:
�V � f [�E(CF), �k] � �
Type of Financial Institution Interaction with Savings Institutions
Commercial banks • Compete with SIs in attracting deposits, providing consumer loans, and providing commercial loans. • Have merged with SIs in recent years.
Finance companies • Compete with SIs in providing consumer and commercial loans.
Money market mutual funds • Compete with SIs in attracting short-term investments from investors.
Investment companies and brokerage firms • Serve SIs that wish to engage in interest rate swaps and interest rate caps. • Have agreements with SIs to offer brokerage services to their customers.
Insurance companies • Purchase mortgages from SIs in the secondary market.
Exhibit 21.9 Interactions between Savings Institutions and Other Financial Institutions
http://
http://www.fdic.govProfiles of individual savings institutions.
21-B4312-AM1.indd 58621-B4312-AM1.indd 586 8/29/07 2:32:19 AM8/29/07 2:32:19 AM

Copyright 2009 Cengage Learning. All Rights Reserved. May not be copied, scanned, or duplicated, in whole or in part.
Chapter 21: Thrift Operations 587
Factors That Affect Cash FlowsThe change in an SI’s expected cash flows may be modeled as
�E(CF) � f(�ECON, �Rf, �INDUS, �MANAB) � � ? �
where ECON represents economic growth, Rf represents the risk-free interest rate, INDUS represents the industry conditions to which SIs are exposed, and MANAB represents abilities of the SI’s management.
Economic Growth Economic growth can enhance an SI’s cash flows by in-creasing household demand for consumer loans or mortgage loans, thereby allowing the SI to provide more loans. In addition, loan defaults are normally reduced in peri-ods of strong economic growth. Furthermore, the demand for other financial services (such as real estate and insurance services) provided by SIs tends to be higher during periods of strong economic growth when households have relatively high levels of dis-posable income.
Change in the Risk-Free Interest Rate An SI’s cash flows may be inversely related to interest rate movements. First, if the risk-free interest rate de-creases, other market rates may also decline, and the result may be a stronger demand for the SI’s loans. Second, SIs rely heavily on short-term deposits as a source of funds, and the rates paid on these deposits are typically revised in accordance with other in-terest rate movements. Savings institutions’ assets (such as consumer loans and mort-gage loans) commonly have fixed rates, so interest income does not adjust to interest rate movements until those assets reach maturity or are sold. Therefore, when interest rates fall, an SI’s cost of obtaining funds declines more than the decline in the interest earned on its loans and investments. An increase in interest rates can reduce the SI’s expected cash flows because the interest paid on deposits may increase more than the interest earned on loans and investments.
Change in Industry Conditions Savings institutions are exposed to in-dustry conditions such as regulatory constraints, technology, and competition. If reg-ulatory constraints are reduced, the expected cash flows of some SIs should increase. For example, when regulators reduced constraints on the services that could be of-fered, SIs were able to provide more services for their customers. At the same time, however, a reduction in regulations can cause some of the less efficient SIs to lose market share and therefore experience a reduction in cash flows.
Change in Management Abilities An SI has control over the composi-tion of its managers and its organizational structure. Its managers attempt to make in-ternal decisions that will capitalize on the external forces (economic growth, interest
Financial Market How Savings Institutions Participate in This Market
Money markets • Compete with other depository institutions for short-term deposits by issuing commercial paper.
Mortgage markets • Sell mortgages in the secondary market and issue mortgage-backed securities.
Bond markets • Purchase bonds for their investment portfolios. • Issue bonds to obtain long-term funds.
Futures markets • Hedge against interest rate movements by taking positions in interest rate futures.
Options markets • Hedge against interest rate movements by purchasing put options on interest rate futures.
Swap markets • Hedge against interest rate movements by engaging in interest rate swaps.
Exhibit 21.10 Participation of Savings Institutions in Financial Markets
21-B4312-AM1.indd 58721-B4312-AM1.indd 587 8/29/07 2:32:21 AM8/29/07 2:32:21 AM
Copyright 2009 Cengage Learning. All Rights Reserved. May not be copied, scanned, or duplicated, in whole or in part.
588 Part 7: Nonbank Operations
rates, regulatory constraints) that the institution cannot control. Thus, the manage-ment skills of an SI influence its expected cash flows. For example, skillful managers will recognize whether to increase the funds allocated to fixed-rate mortgages based on expectations of future interest rates. They can capitalize on regulatory changes by offering a diversified set of services that accommodate specific customers. They can use technology in a manner that reduces expenses. They may also use derivative securities to alter the potential return and the exposure of the SI to interest rate movements.
Factors That Affect the Required Rate of Return by InvestorsThe required rate of return by investors who invest in an SI can be modeled as
�k � f(�Rf , �RP) � �
where ∆Rf represents a change in the risk-free interest rate, and ∆RP represents a change in the risk premium.
An increase in the risk-free rate results in a higher return required by investors. High inflation, economic growth, and a high budget deficit place upward pressure on interest rates, while money supply growth places downward pressure on interest rates (assuming it does not cause inflation). Thus, a substantial increase in inflation or in the budget deficit typically results in lower valuations of SIs.
Change in the Risk Premium If the risk premium on an SI rises, so will the required rate of return by investors who invest in the SI. High economic growth re-sults in less risk for an SI because its consumer loans, mortgage loans, and investments in debt securities are less likely to default. The effect of industry conditions on SIs can be mixed. A reduction in regulatory constraints on services can reduce the risk of SIs as they diversify their offerings, or it can increase their risk if they engage in some services that are riskier than their traditional services. An improvement in management skills may reduce the perceived risk of the SIs and therefore reduce the risk premium.
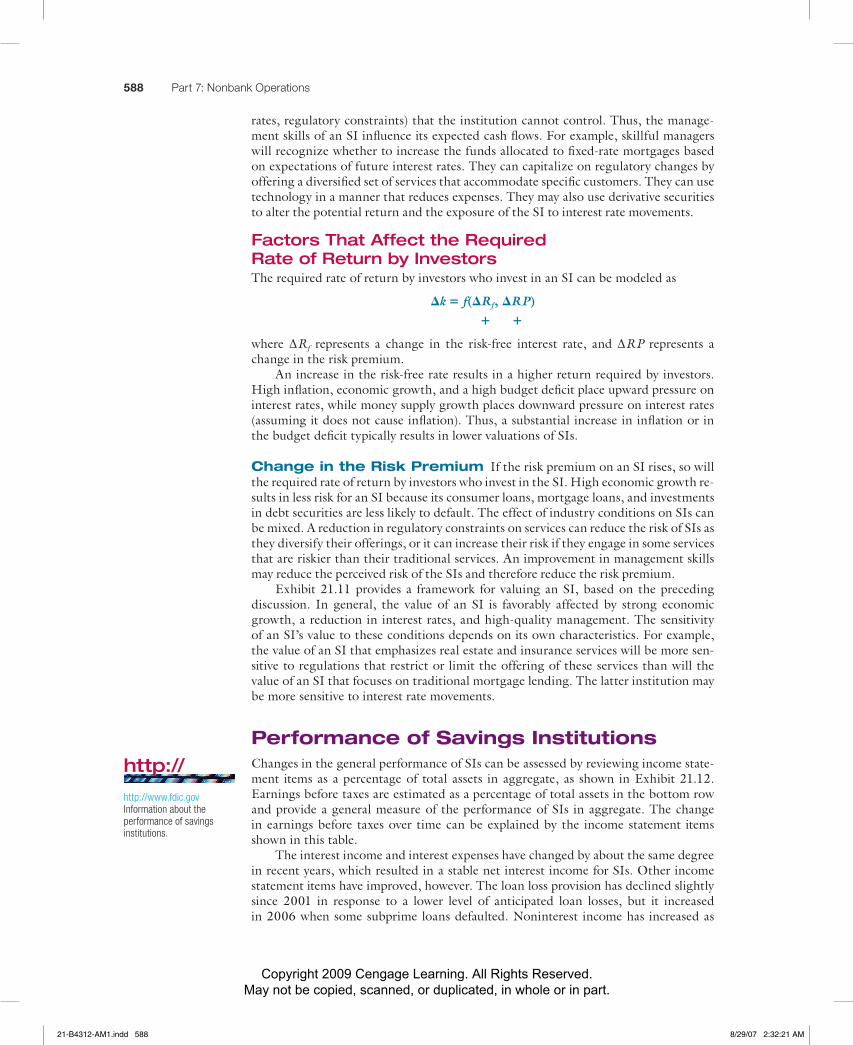
Exhibit 21.11 provides a framework for valuing an SI, based on the preceding discussion. In general, the value of an SI is favorably affected by strong economic growth, a reduction in interest rates, and high-quality management. The sensitivity of an SI’s value to these conditions depends on its own characteristics. For example, the value of an SI that emphasizes real estate and insurance services will be more sen-sitive to regulations that restrict or limit the offering of these services than will the value of an SI that focuses on traditional mortgage lending. The latter institution may be more sensitive to interest rate movements.
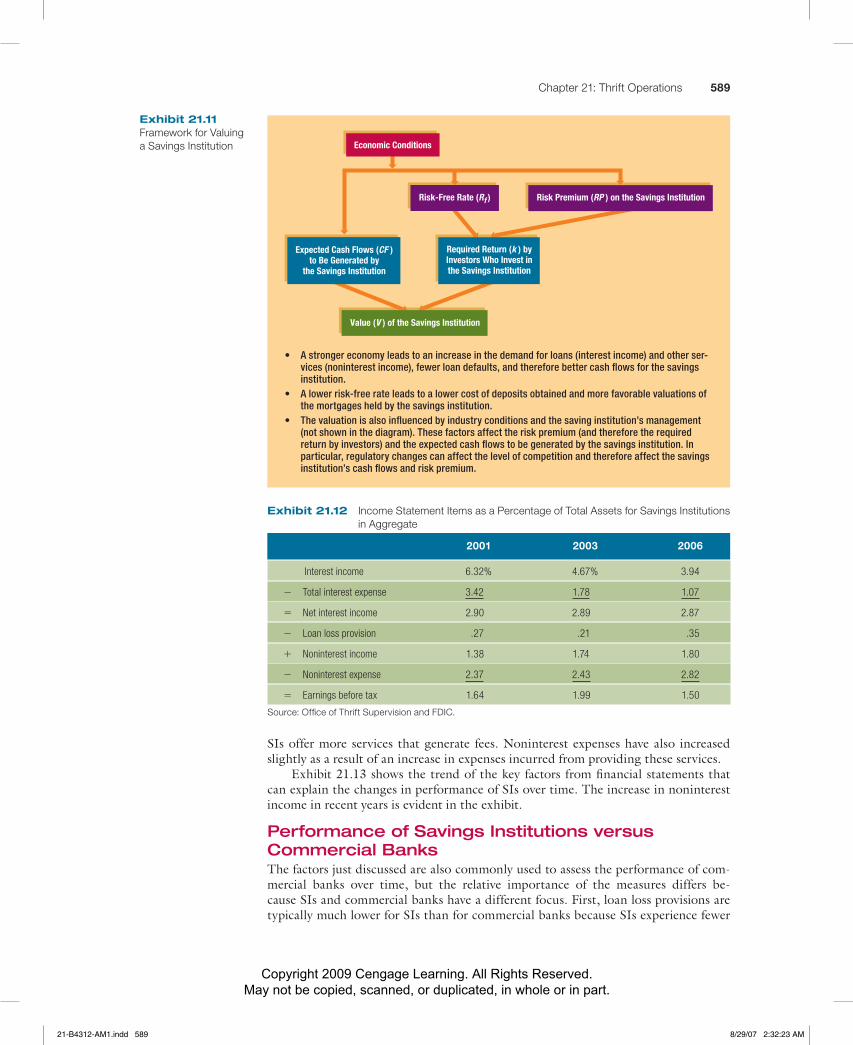
Performance of Savings InstitutionsChanges in the general performance of SIs can be assessed by reviewing income state-ment items as a percentage of total assets in aggregate, as shown in Exhibit 21.12. Earnings before taxes are estimated as a percentage of total assets in the bottom row and provide a general measure of the performance of SIs in aggregate. The change in earnings before taxes over time can be explained by the income statement items shown in this table.
The interest income and interest expenses have changed by about the same degree in recent years, which resulted in a stable net interest income for SIs. Other income statement items have improved, however. The loan loss provision has declined slightly since 2001 in response to a lower level of anticipated loan losses, but it increased in 2006 when some subprime loans defaulted. Noninterest income has increased as
http://
http://www.fdic.govInformation about the performance of savings institutions.
21-B4312-AM1.indd 58821-B4312-AM1.indd 588 8/29/07 2:32:21 AM8/29/07 2:32:21 AM
Copyright 2009 Cengage Learning. All Rights Reserved. May not be copied, scanned, or duplicated, in whole or in part.
Chapter 21: Thrift Operations 589
SIs offer more services that generate fees. Noninterest expenses have also increased slightly as a result of an increase in expenses incurred from providing these services.
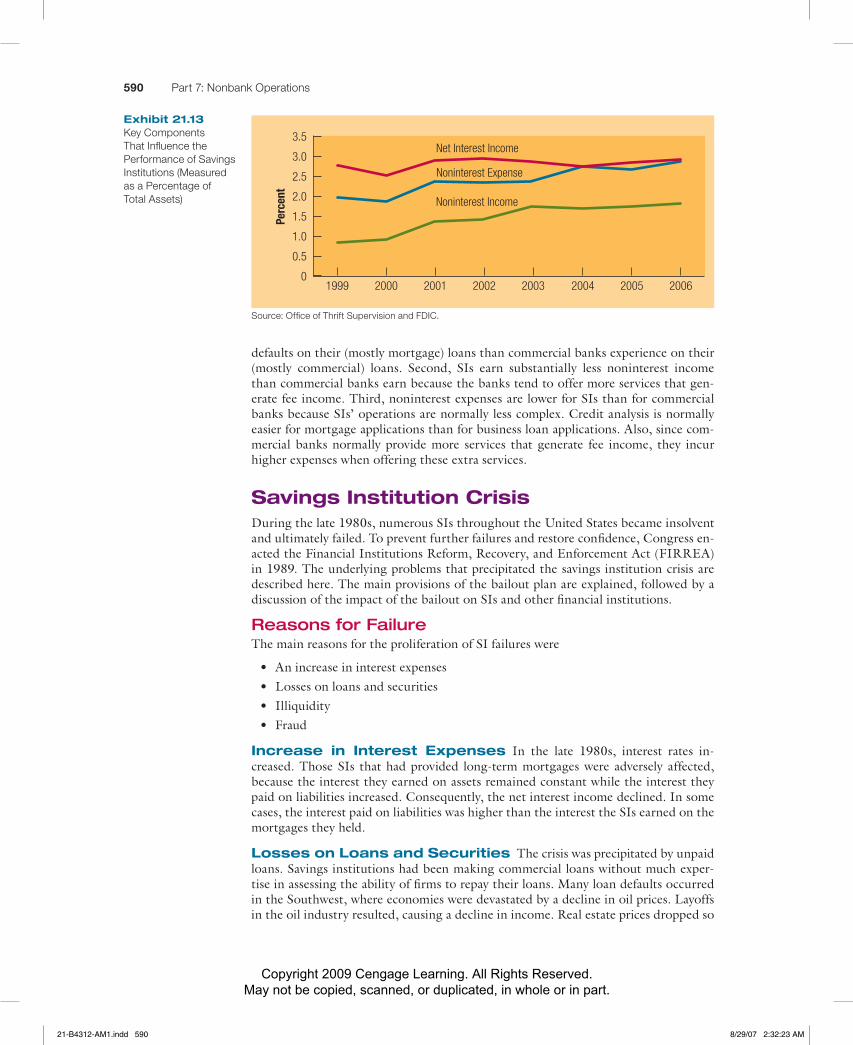
Exhibit 21.13 shows the trend of the key factors from financial statements that can explain the changes in performance of SIs over time. The increase in noninterest income in recent years is evident in the exhibit.
Performance of Savings Institutions versus Commercial BanksThe factors just discussed are also commonly used to assess the performance of com-mercial banks over time, but the relative importance of the measures differs be-cause SIs and commercial banks have a different focus. First, loan loss provisions are typi cally much lower for SIs than for commercial banks because SIs experience fewer
2001 2003 2006
Interest income 6.32% 4.67% 3.94
� Total interest expense 3.42 1.78 1.07
� Net interest income 2.90 2.89 2.87
� Loan loss provision .27 .21 .35
� Noninterest income 1.38 1.74 1.80
� Noninterest expense 2.37 2.43 2.82
� Earnings before tax 1.64 1.99 1.50
Source: Office of Thrift Supervision and FDIC.
Exhibit 21.12 Income Statement Items as a Percentage of Total Assets for Savings Institutions in Aggregate
• A stronger economy leads to an increase in the demand for loans (interest income) and other ser-vices (noninterest income), fewer loan defaults, and therefore better cash flows for the savings institution.
• A lower risk-free rate leads to a lower cost of deposits obtained and more favorable valuations of the mortgages held by the savings institution.
• The valuation is also influenced by industry conditions and the saving institution’s management (not shown in the diagram). These factors affect the risk premium (and therefore the required return by investors) and the expected cash flows to be generated by the savings institution. In particular, regulatory changes can affect the level of competition and therefore affect the savings institution’s cash flows and risk premium.
Economic Conditions
Expected Cash Flows (CF )to Be Generated by
the Savings Institution
Required Return (k ) byInvestors Who Invest inthe Savings Institution
Risk-Free Rate (Rf ) Risk Premium (RP ) on the Savings Institution
Value (V ) of the Savings Institution
Exhibit 21.11 Framework for Valuing a Savings Institution
21-B4312-AM1.indd 58921-B4312-AM1.indd 589 8/29/07 2:32:23 AM8/29/07 2:32:23 AM
Copyright 2009 Cengage Learning. All Rights Reserved. May not be copied, scanned, or duplicated, in whole or in part.
590 Part 7: Nonbank Operations
defaults on their (mostly mortgage) loans than commercial banks experience on their (mostly commercial) loans. Second, SIs earn substantially less noninterest income than commercial banks earn because the banks tend to offer more services that gen-erate fee income. Third, noninterest expenses are lower for SIs than for commercial banks because SIs’ operations are normally less complex. Credit analysis is normally easier for mortgage applications than for business loan applications. Also, since com-mercial banks normally provide more services that generate fee income, they incur higher expenses when offering these extra services.
Savings Institution CrisisDuring the late 1980s, numerous SIs throughout the United States became insolvent and ultimately failed. To prevent further failures and restore confidence, Congress en-acted the Financial Institutions Reform, Recovery, and Enforcement Act (FIRREA) in 1989. The underlying problems that precipitated the savings institution crisis are described here. The main provisions of the bailout plan are explained, followed by a discussion of the impact of the bailout on SIs and other financial institutions.
Reasons for FailureThe main reasons for the proliferation of SI failures were
• An increase in interest expenses • Losses on loans and securities • Illiquidity • Fraud
Increase in Interest Expenses In the late 1980s, interest rates in-creased. Those SIs that had provided long-term mortgages were adversely affected, because the interest they earned on assets remained constant while the interest they paid on liabilities increased. Consequently, the net interest income declined. In some cases, the interest paid on liabilities was higher than the interest the SIs earned on the mortgages they held.
Losses on Loans and Securities The crisis was precipitated by unpaid loans. Savings institutions had been making commercial loans without much exper-tise in assessing the ability of fi rms to repay their loans. Many loan defaults occurred in the Southwest, where economies were devastated by a decline in oil prices. Layoffs in the oil industry resulted, causing a decline in income. Real estate prices dropped so
2000 2001 2002 2003 2004 2005 20061999
Net Interest Income
Noninterest Income
Noninterest Expense
Perc
ent
3.5
3.0
2.5
2.0
1.5
1.0
0.5
0
Exhibit 21.13 Key Components That Influence the Performance of Savings Institutions (Measured as a Percentage of Total Assets)
Source: Office of Thrift Supervision and FDIC.
21-B4312-AM1.indd 59021-B4312-AM1.indd 590 8/29/07 2:32:23 AM8/29/07 2:32:23 AM
Copyright 2009 Cengage Learning. All Rights Reserved. May not be copied, scanned, or duplicated, in whole or in part.
Chapter 21: Thrift Operations 591
dramatically that foreclosures on bad real estate loans did not serve as adequate collat-eral. Although some housing loans defaulted, the major loan losses were in commer-cial real estate, such as office complexes. Savings institutions were forced to assume real estate holdings that were sometimes worth less than half the loan amount origi-nally provided.
Savings institutions also experienced losses on their junk bond holdings. For ex-ample, Columbia S&L had purchased $4 billion worth of junk bonds. The value of these bonds declined by $1.5 billion as a result of numerous defaults.
Illiquidity Many SIs experienced a cash flow deficiency as a result of loan losses, as the inflows from loan repayments were not sufficient to cover depositor withdraw-als. Consequently, they were forced to offer higher interest rates on deposits to at-tract more funds. As depositors became aware of the S&L crisis, they began to with-draw their savings from SIs, which exacerbated the illiquidity problem. Normally, the threat of deposit runs is mitigated by deposit insurance. Depositors were aware, however, that the insuring agency (the Federal Savings and Loan Insurance Corpo-ration, FSLIC) was already experiencing its own liquidity problems because it pro-vided subsidies to financial institutions willing to acquire failing SIs. By April 1988, the net worth of the FSLIC was estimated to be negative $11.6 billion. Media atten-tion about the FSLIC’s liquidity problems led to further depositor withdrawals, caus-ing greater liquidity problems for the SIs.
FraudMany SIs experienced financial problems because of various fraudulent activities. In one of the most common types of fraud, managers used
depositors’ funds to purchase personal assets, including yachts, artwork, and automo-bile dealerships. At many SIs, there had clearly been a lack of oversight by executives and by the board of directors, which allowed some managers to serve their own in-terests rather than shareholder interests. Many of the problems of the SIs could have been reduced if proper governance had been applied. ■
Provisions of the FIRREAIn February 1989, the White House proposed a bill that was ultimately enacted by Congress as the Financial Institutions Reform, Recovery, and Enforcement Act (FIR-REA); it was signed by President George Bush on August 9, 1989. The following is a summary of some of the Act’s more relevant provisions:
• The FSLIC was terminated. A new insurance agency for SIs, called the Savings Association Insurance Fund (SAIF), was formed.
• As of January 1990, SIs were required to have $1.50 in tangible capital per $100 of deposits, or a 1.5 percent ratio. The ratio was to increase over time.
• The Federal Home Loan Bank Board (FHLBB), which historically regulated SIs, was replaced by the Office of Thrift Supervision (OTS). The Resolution Trust Corporation was created to deal with insolvent SIs.
• The penalties for officers of SIs and other financial institutions convicted of fraud were increased.
• Savings institutions were required to use 70 percent of their assets for housing loans, up from 60 percent.
• Savings institutions were prohibited from holding some risky investments, in-cluding junk bonds, in the future. Those SIs holding junk bonds were required to divest them over time.
• Commercial banks were allowed to purchase both failing and healthy SIs.
BEHAVIORAL FINANCEBEHAVIORAL FINANCE
21-B4312-AM1.indd 59121-B4312-AM1.indd 591 8/29/07 2:32:24 AM8/29/07 2:32:24 AM
Copyright 2009 Cengage Learning. All Rights Reserved. May not be copied, scanned, or duplicated, in whole or in part.
592 Part 7: Nonbank Operations
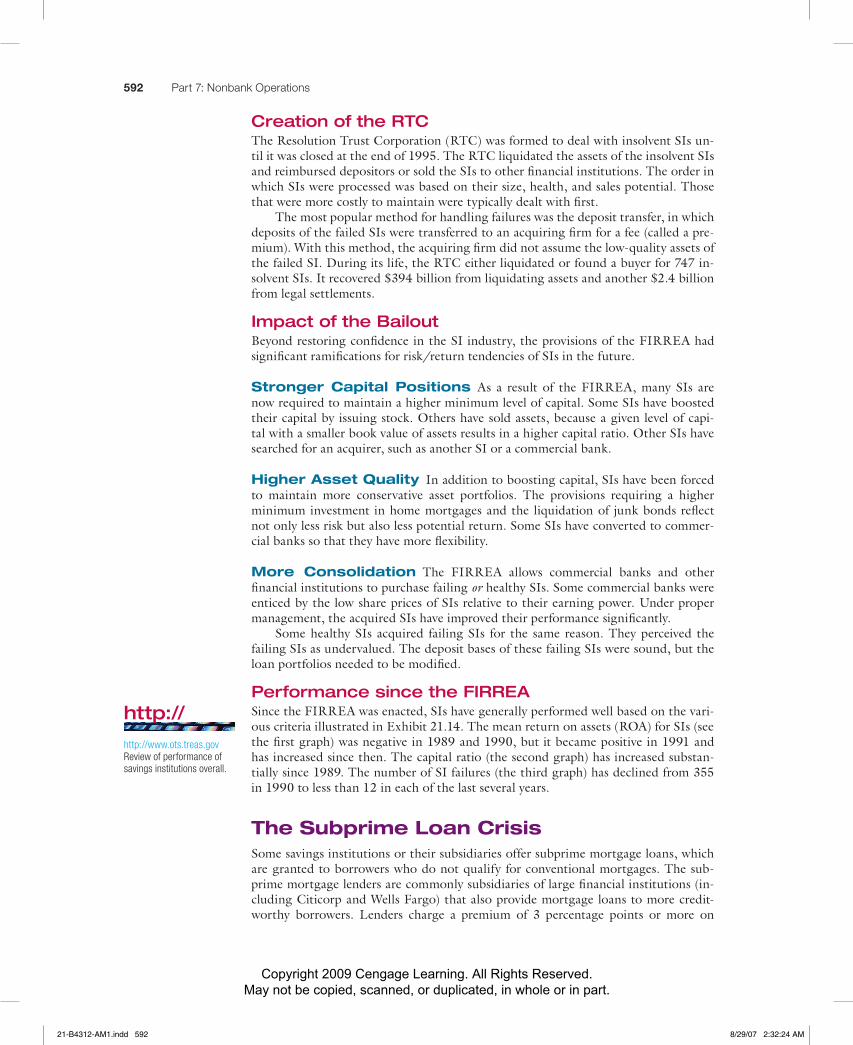
Creation of the RTCThe Resolution Trust Corporation (RTC) was formed to deal with insolvent SIs un-til it was closed at the end of 1995. The RTC liquidated the assets of the insolvent SIs and reimbursed depositors or sold the SIs to other financial institutions. The order in which SIs were processed was based on their size, health, and sales potential. Those that were more costly to maintain were typically dealt with first.
The most popular method for handling failures was the deposit transfer, in which deposits of the failed SIs were transferred to an acquiring firm for a fee (called a pre-mium). With this method, the acquiring firm did not assume the low-quality assets of the failed SI. During its life, the RTC either liquidated or found a buyer for 747 in-solvent SIs. It recovered $394 billion from liquidating assets and another $2.4 billion from legal settlements.
Impact of the BailoutBeyond restoring confidence in the SI industry, the provisions of the FIRREA had significant ramifications for risk/return tendencies of SIs in the future.
Stronger Capital Positions As a result of the FIRREA, many SIs are now required to maintain a higher minimum level of capital. Some SIs have boosted their capital by issuing stock. Others have sold assets, because a given level of capi-tal with a smaller book value of assets results in a higher capital ratio. Other SIs have searched for an acquirer, such as another SI or a commercial bank.
Higher Asset Quality In addition to boosting capital, SIs have been forced to maintain more conservative asset portfolios. The provisions requiring a higher minimum investment in home mortgages and the liquidation of junk bonds reflect not only less risk but also less potential return. Some SIs have converted to commer-cial banks so that they have more flexibility.
More Consolidation The FIRREA allows commercial banks and other financial institutions to purchase failing or healthy SIs. Some commercial banks were enticed by the low share prices of SIs relative to their earning power. Under proper management, the acquired SIs have improved their performance significantly.
Some healthy SIs acquired failing SIs for the same reason. They perceived the failing SIs as undervalued. The deposit bases of these failing SIs were sound, but the loan portfolios needed to be modified.
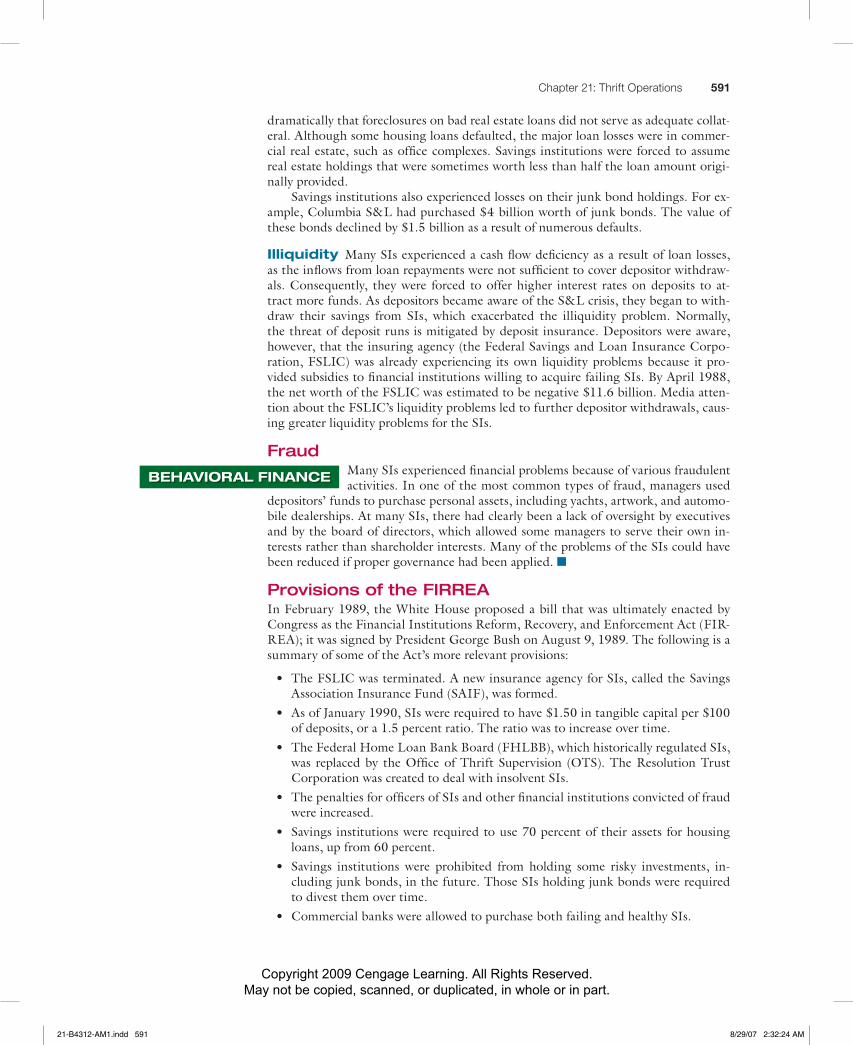
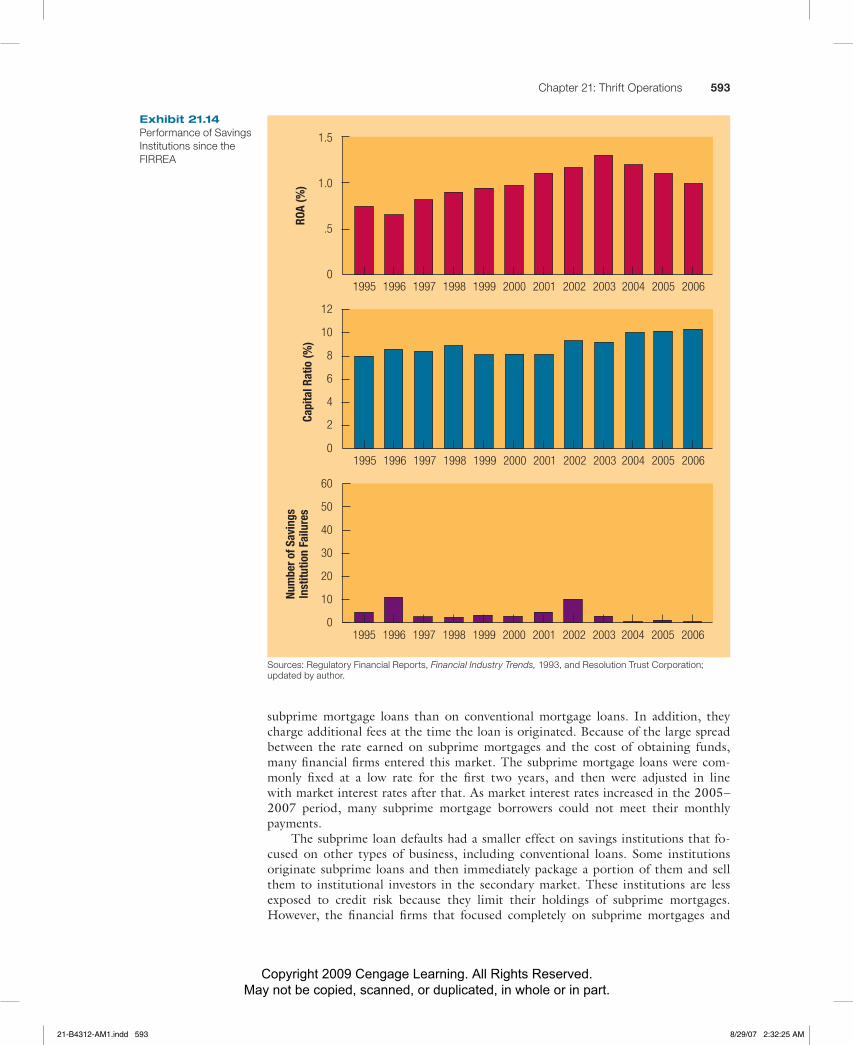
Performance since the FIRREASince the FIRREA was enacted, SIs have generally performed well based on the vari-ous criteria illustrated in Exhibit 21.14. The mean return on assets (ROA) for SIs (see the first graph) was negative in 1989 and 1990, but it became positive in 1991 and has increased since then. The capital ratio (the second graph) has increased substan-tially since 1989. The number of SI failures (the third graph) has declined from 355 in 1990 to less than 12 in each of the last several years.
The Subprime Loan CrisisSome savings institutions or their subsidiaries offer subprime mortgage loans, which are granted to borrowers who do not qualify for conventional mortgages. The sub-prime mortgage lenders are commonly subsidiaries of large fi nancial institutions (in-cluding Citicorp and Wells Fargo) that also provide mortgage loans to more credit-worthy borrowers. Lenders charge a premium of 3 percentage points or more on
http://
http://www.ots.treas.govReview of performance of savings institutions overall.
21-B4312-AM1.indd 59221-B4312-AM1.indd 592 8/29/07 2:32:24 AM8/29/07 2:32:24 AM
Copyright 2009 Cengage Learning. All Rights Reserved. May not be copied, scanned, or duplicated, in whole or in part.
Chapter 21: Thrift Operations 593
subprime mortgage loans than on conventional mortgage loans. In addition, they charge additional fees at the time the loan is originated. Because of the large spread between the rate earned on subprime mortgages and the cost of obtaining funds, many fi nancial fi rms entered this market. The subprime mortgage loans were com-monly fi xed at a low rate for the fi rst two years, and then were adjusted in line with market interest rates after that. As market interest rates increased in the 2005–2007 period, many subprime mortgage borrowers could not meet their monthly payments.
The subprime loan defaults had a smaller effect on savings institutions that fo-cused on other types of business, including conventional loans. Some institutions originate subprime loans and then immediately package a portion of them and sell them to institutional investors in the secondary market. These institutions are less exposed to credit risk because they limit their holdings of subprime mortgages. However, the fi nancial fi rms that focused completely on subprime mortgages and
1.5
1.0
.5
01995 1996 1997 1998 1999 2000 2001 2002 2003 2004 2005 2006
1995 1996 1997 1998 1999 2000 2001 2002 2003 2004 2005 2006
1995 1996 1997 1998 1999 2000 2001 2002 2003 2004 2005 2006
ROA
(%)
12
10
8
6
4
2
0
Capi
tal R
atio
(%)
60
50
40
30
20
10
0
Num
ber o
f Sav
ings
Inst
itutio
n Fa
ilure
s
Exhibit 21.14 Performance of Savings Institutions since the FIRREA
Sources: Regulatory Financial Reports, Financial Industry Trends, 1993, and Resolution Trust Corporation; updated by author.
21-B4312-AM1.indd 59321-B4312-AM1.indd 593 8/29/07 2:32:25 AM8/29/07 2:32:25 AM
Copyright 2009 Cengage Learning. All Rights Reserved. May not be copied, scanned, or duplicated, in whole or in part.
594 Part 7: Nonbank Operations
maintained the mortgages after originating them experienced poor performance in 2007 when many borrowers could not cover their mortgage payments. Several sub-prime lenders went bankrupt in 2007. The lesson was that the higher premium charged on these risky loans exists because the borrowers are more likely to default, especially when interest rates rise. Some subprime lenders did not anticipate that mar-ket interest rates would rise, or that the higher mortgage payments resulting from the higher market interest rates would cause so many loan defaults.
Background on Credit UnionsCredit unions (CUs) are nonprofit organizations composed of members with a com-mon bond, such as an affiliation with a particular labor union, church, university, or even residential area. A qualified person can typically become a member of a CU by depositing $5 or more into an account. Credit unions serve as intermediaries for their members. They accept deposits from members who have excess funds and chan-nel most of the funds to those members who want to finance the purchase of a car or other assets.
There are about 10,200 CUs in the United States. Although the number of CUs now exceeds the number of commercial banks, the total assets of CUs are less than one-tenth the amount of total assets in commercial banks.
Ownership of Credit UnionsBecause CUs do not issue stock, they are technically owned by the depositors. The deposits are called shares, and interest paid on the deposits is called a dividend. Be-cause CUs are nonprofit organizations, their income is not taxed. Like savings insti-tutions and commercial banks, CUs can be federally or state chartered. If the state does not offer a charter, a federal charter is necessary.
Although a few CUs (such as the Navy Federal CU) have assets of more than $1 billion, most are very small. Federally chartered CUs are growing at a faster rate than state-chartered CUs, and their total assets are now significantly larger than the aggregate assets of state-chartered CUs.
Because CUs are owned by members, their objective is to satisfy those members. CUs offer interest on share deposits to members who invest funds. In addition, they provide loans to members who are in need of funds. Thus, as mentioned earlier, they act as intermediaries by repackaging deposits from member savers and providing them as loans to member borrowers. If CUs accumulate earnings, they can use the earn-ings to either offer higher rates on deposits or reduce rates on loans. Growth can al-low CUs to be more diversified and more efficient if economies of scale exist.
Advantages and Disadvantages of Credit UnionsAs mentioned earlier, CUs are nonprofit and therefore are not taxed. This creates a major advantage for CUs over other types of fi nancial institutions. Credit unions can offer higher deposit rates and lower loan rates than their competitors and still achieve a satisfactory level of performance, because their profi ts are not taxed and they do not have to achieve a desired return for shareholders. In addition, their noninterest ex-penses are relatively low, because their office and furniture are often donated or pro-vided at a very low cost through the affiliation of their members.
Some characteristics of CUs can be unfavorable. Their employees may not have the incentive to manage operations efficiently. In addition, the common bond re-quirement for membership restricts a given CU from growing beyond the potential
http://
http://www.corningcu.orgInformation about services related to financial planning that are provided by CUs.
http://
http://www.findcu.com/Identifies credit unions in all states.
21-B4312-AM1.indd 59421-B4312-AM1.indd 594 8/29/07 2:32:25 AM8/29/07 2:32:25 AM

Copyright 2009 Cengage Learning. All Rights Reserved. May not be copied, scanned, or duplicated, in whole or in part.
Chapter 21: Thrift Operations 595
size of that particular affiliation. The common bond also limits the ability of CUs to diversify. This is especially true when all members are employees of a particular insti-tution. If that institution lays off a number of workers, many members may simulta-neously experience financial problems and withdraw their share deposits or default on their loans. This could cause the CU to become illiquid at a time when more mem-bers need loans to survive the layoff.
Even when the common bond does not represent a particular employer, many CUs are unable to diversify geographically because all members live in the same area. Thus, an economic slowdown in this area would have an adverse impact on most members. Furthermore, CUs cannot diversify among various products the way that commercial banks and savings institutions do. They are created to serve the members and therefore concentrate heavily on providing loans to members. Finally, in the event that CUs do need funds, they are unable to issue stock because they are owned by de-positors rather than shareholders.
To try to overcome some of these disadvantages as well as to better diversify their services and take greater advantage of economies of scale, CUs increasingly have been merging. Consequently, some CUs now draw their members from a number of employers, organizations, and other affiliations. CUs are also trying to diversify their products by offering traveler’s checks, money orders, and life insurance to their members.
Sources and Uses of Credit Union FundsCredit unions obtain funds from their members and channel these funds to other members.
Sources of FundsCredit unions obtain most of their funds from share deposits by members. The typical deposit is similar to a passbook savings account deposit at commercial banks or sav-ings institutions, as it has no specified maturity and is insured up to $100,000. CUs also offer share certificates, which provide higher rates than share deposits but require a minimum amount (such as $500) and a specified maturity. The share certificates of-fered by CUs compete against the retail CDs offered by commercial banks and SIs. The proportion of funds obtained through regular share deposits is relatively large compared to the counterpart passbook accounts offered by other depository insti-tutions. This characteristic allows CUs to obtain much of their funds at a relatively low cost.
In addition to share deposits and certificates, most CUs also offer checkable accounts called share drafts, which became more popular in the early 1990s. These accounts can pay interest and allow an unlimited amount of checks to be written. They normally require a minimum balance to be maintained. Share drafts offered by CUs compete against the NOW accounts and MMDAs offered by commercial banks and SIs.
If a CU needs funds temporarily, it can borrow from other CUs or from the Central Liquidity Facility (CLF). The CLF acts as a lender for CUs to accommodate sea-sonal funding and specialized needs or to boost the liquidity of troubled CUs.
Like other depository institutions, CUs maintain capital. Their primary source of capital is retained earnings. In recent years, CUs have boosted their capital, which helps cushion against any future loan losses. Given that CUs tend to use conserva-tive management, their capital ratio is relatively high compared with other depository institutions.
http://
http://www.ncua.govProvides financial data for any federally chartered CU.
21-B4312-AM1.indd 59521-B4312-AM1.indd 595 8/29/07 2:32:28 AM8/29/07 2:32:28 AM
Copyright 2009 Cengage Learning. All Rights Reserved. May not be copied, scanned, or duplicated, in whole or in part.
596 Part 7: Nonbank Operations
Uses of FundsCredit unions use the majority of their funds for loans to members. These loans finance automobiles, home improvements, and other personal expenses. They are typically secured and carry maturities of five years or less. Some CUs offer long-term mortgage loans, but many prefer to avoid loans with long maturities. In addition to providing loans, CUs purchase government and agency securities to maintain ade-quate liquidity.
Regulation of Credit UnionsFederal CUs are supervised and regulated by the National Credit Union Administration (NCUA), which is composed of three board members, one of whom chairs the board.
The NCUA employs a staff of examiners to monitor CUs. The examiners conduct assessments of all federally chartered CUs as well as any state-chartered CUs apply-ing for federal insurance. Each CU completes a semiannual call report that provides financial information. From this information, the NCUA examiners derive financial ratios that measure the financial condition of the CU. The ratios are then compared to an industry norm to detect any significant deviations. Then a summary of the CU, called a Financial Performance Report, is completed to identify any potential prob-lems that deserve special attention in the future.
As part of the assessment, the examiners classify each CU into a specific risk cat-egory, ranging from Code 1 (low risk) to Code 5 (high risk). This is intended to serve as an early warning system so that CUs that are experiencing problems or are in po-tential danger can be closely monitored in the future. The criteria used to assess risk are capital adequacy, asset quality, management, earnings, liquidity, and sensitivity to market conditions. This CAMELS system has been used since 1987 and is very sim-ilar to the FDIC’s system for tracking the commercial banks it insures. In 1999, the NCUA implemented a Corporate Risk Information System (CRIS), which provides a more detailed analysis of each CU’s risk. In addition, CUs are required to maintain a capital ratio of 8 percent of risk-weighted assets.
Regulation of State-Chartered Credit UnionsState-chartered CUs are regulated by their respective states. The degree to which CUs can offer various products and services is influenced by the type of charter and by their location. In addition to services and rates, loans offered by CUs to officers and directors of CUs also carry certain limitations.
Insurance for Credit UnionsAbout 90 percent of CUs are insured by the National Credit Union Share Insurance Fund (NCUSIF), which is administered by the NCUA. The CUs typically pay an an-nual insurance premium of one-twelfth of 1 percent of share deposits. A supplemental premium is added if necessary. Some states require their CUs to be federally insured; others allow insurance to be offered by alternative insurance agencies.
The NCUSIF was created in 1970, without any contributing start-up capital from the U.S. Treasury and Federal Reserve. All federally chartered CUs are required to obtain insurance from the NCUSIF. State-chartered CUs are eligible for NCUSIF insurance only if they meet various guidelines. The maximum insurance per deposi-tor is $100,000.
The NCUSIF sets aside a portion of its funds as reserves to cover expenses result-ing from CU failures each year. Given the low number of failures, the reserves have been more than adequate to cover these expenses.
http://
http://www.ncua.govBackground on the NCUA.
21-B4312-AM1.indd 59621-B4312-AM1.indd 596 8/29/07 2:32:29 AM8/29/07 2:32:29 AM
Copyright 2009 Cengage Learning. All Rights Reserved. May not be copied, scanned, or duplicated, in whole or in part.
Chapter 21: Thrift Operations 597
Credit Union Exposure to RiskLike other depository institutions, CUs are exposed to liquidity risk, credit risk, and interest rate risk. Their balance sheet structure differs from that of other institutions, however, so their exposure to each type of risk also differs.
Liquidity RiskIf a CU experiences an unanticipated wave of withdrawals without an offsetting amount of new deposits, it could become illiquid. It can borrow from the Central Liquidity Facility to resolve temporary liquidity problems, but if the shortage of funds is expected to continue, the CU must search for a more permanent cure. Other de-pository institutions have greater ability to boost deposit levels because they can tap various markets. Because the market for a CU is restricted to those consumers who qualify as members, CUs have less ability to quickly generate additional deposits.
Credit RiskBecause CUs concentrate on personal loans to their members, their exposure to credit (default) risk is primarily derived from those loans. Most of their loans are secured, which reduces the loss to CUs in the event of default. Poor economic conditions can have a significant impact on loan defaults. Some CUs will perform much better than others because of more favorable economic conditions in their area. However, even during favorable economic periods, CUs with very lenient loan policies could experi-ence losses. A common concern is that CUs may not conduct a thorough credit analy-sis of loan applicants; the loans provided by CUs are consumer oriented, however, so an elaborate credit analysis is not required.
Interest Rate RiskThe majority of maturities on consumer loans offered by CUs are short term, caus-ing their asset portfolios to be rate sensitive. Because their sources of funds are also generally rate sensitive, movements in interest revenues and interest expenses of CUs are highly correlated. Therefore, the spread between interest revenues and interest ex-penses remains somewhat stable over time, regardless of how interest rates change.
Summary
■ The main sources of funds for SIs are deposits and borrowed funds. The main uses of funds for SIs are mortgages, mortgage-backed securities, and other securities.
■ Savings institutions are exposed to credit risk as a result of their heavy concentration in mortgages, mortgage-backed securities, and other securities. They attempt to diversify their investments to reduce credit risk.
Savings institutions are highly susceptible to inter-est rate risk, because their asset portfolios are typi-cally less rate sensitive than their liability portfolios. They can reduce their interest rate risk by using in-terest rate futures contracts or interest rate swaps.
■ The valuation of an SI is a function of its expected cash flows and the required return by its investors. The expected cash flows are influenced by economic growth, interest rate movements, regulatory con-straints, and the abilities of the institution’s manag-ers. The required rate of return is influenced by the prevailing risk-free rate and the risk premium. The risk premium is lower when economic conditions are strong. A reduction in regulatory constraints can re-duce the risk premium by allowing the SI to diver-sify its services, but may increase the risk premium if the institution pursues services that it cannot pro-vide efficiently.
21-B4312-AM1.indd 59721-B4312-AM1.indd 597 8/29/07 2:32:30 AM8/29/07 2:32:30 AM
Copyright 2009 Cengage Learning. All Rights Reserved. May not be copied, scanned, or duplicated, in whole or in part.
598 Part 7: Nonbank Operations
■ In the late 1980s, many SIs experienced heavy losses from loan defaults, adverse interest rate move-ments, and fraud. These adverse effects led to the SI crisis. In 1989, the FIRREA was passed to resolve the crisis. Specifically, the FIRREA boosted capital requirements, increased penalties for fraud, and pro-hibited SIs from purchasing junk bonds. It also cre-ated the Resolution Trust Corporation to liquidate assets of failed SIs.
■ Credit unions obtain most of their funds from share deposits by members. If they experience a cash defi-
ciency, they can borrow from other CUs or from the Central Liquidity Facility (CLF). They use the major-ity of their funds for personal loans to members.
■ Credit unions are exposed to liquidity risk because they could experience an unanticipated wave of de-posit withdrawals. They are also exposed to credit risk as a result of personal loans to members.
Because the personal loans offered by CUs are short term, they are rate sensitive like the liabilities. Thus, the interest rate risk of CUs is typically less than that of other depository institutions.
Can All Savings Institutions Avoid Failure?
Point Counter-Point
Point Yes. If savings institutions use conservative management by focusing on adjustable-rate mortgages with limited default risk, they can limit their risk and avoid failure.
Counter-Point No. Some savings institutions will be crowded out of the market for high-quality
adjustable-rate mortgages and will have to take some risk. There are too many savings institutions, and some that have weaker management will inevitably fail.
Who Is Correct? Use the Internet to learn more about this issue. Offer your own opinion on this issue.
1. SI Sources and Uses of Funds Explain in general terms how savings institutions differ from com-mercial banks with respect to their sources of funds and uses of funds. Discuss each source of funds for SIs. Identify and discuss the main uses of funds for SIs.
2. Ownership of SIs What are the alternative forms of ownership of a savings institution?
3. Regulation of SIs What criteria are used by regula-tors to examine a thrift institution?
4. MMDAs How did the creation of money market deposit accounts influence a savings institution’s overall cost of funds?
5. Offering More Diversified Services Discuss the entrance of savings institutions into consumer and commercial lending. What are the potential risks and rewards of this strategy? Discuss the conflict between diversification and specialization of SIs.
6. Liquidity and Credit Risk Describe the liquidity and credit risk of savings institutions, and discuss how each is managed.
7. ARMs What is an adjustable-rate mortgage (ARM)? Discuss potential advantages such mort-gages offer a savings institution.
8. Use of Financial Futures Explain how savings in-stitutions could use interest rate futures to reduce interest rate risk.
9. Use of Interest Rate Swaps Explain how savings institutions could use interest rate swaps to reduce interest rate risk. Will SIs that use swaps perform better or worse than those that were unhedged during a period of declining interest rates? Explain.
10. DIDMCA What effect did the Depository Insti-tution Deregulation and Monetary Control Act (DIDMCA) of 1980 and the Garn-St Germain Act of 1982 have on savings institutions?
11. Hedging Interest Rate Movements If market in-terest rates are expected to decline over time, will a savings institution with rate-sensitive liabilities and a large amount of fixed-rate mortgages perform best by (a) using an interest rate swap, (b) selling financial futures, or (c) remaining unhedged? Explain.
Questions and Applications
21-B4312-AM1.indd 59821-B4312-AM1.indd 598 8/29/07 2:32:32 AM8/29/07 2:32:32 AM
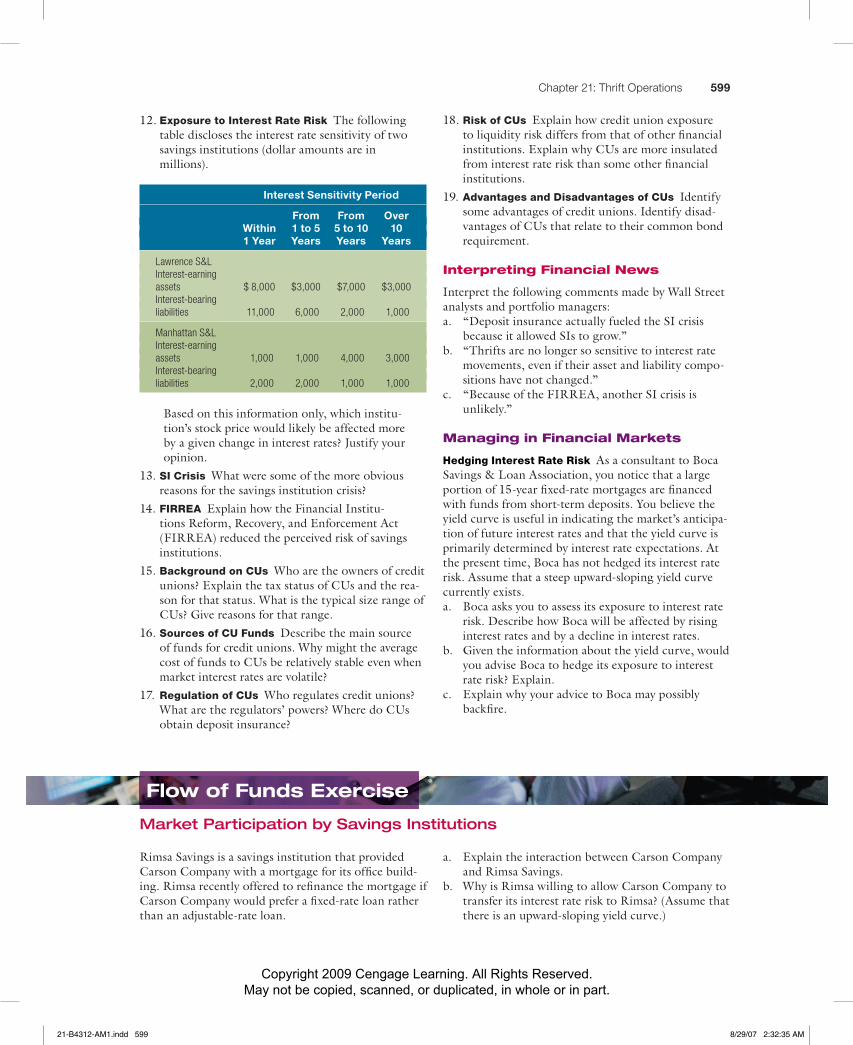
Copyright 2009 Cengage Learning. All Rights Reserved. May not be copied, scanned, or duplicated, in whole or in part.
Chapter 21: Thrift Operations 599
18. Risk of CUs Explain how credit union exposure to liquidity risk differs from that of other financial institutions. Explain why CUs are more insulated from interest rate risk than some other financial institutions.
19. Advantages and Disadvantages of CUs Identify some advantages of credit unions. Identify disad-vantages of CUs that relate to their common bond requirement.
Interpreting Financial News
Interpret the following comments made by Wall Street analysts and portfolio managers:a. “Deposit insurance actually fueled the SI crisis
because it allowed SIs to grow.”b. “Thrifts are no longer so sensitive to interest rate
movements, even if their asset and liability compo-sitions have not changed.”
c. “Because of the FIRREA, another SI crisis is unlikely.”
Managing in Financial Markets
Hedging Interest Rate Risk As a consultant to Boca Savings & Loan Association, you notice that a large portion of 15-year fixed-rate mortgages are financed with funds from short-term deposits. You believe the yield curve is useful in indicating the market’s anticipa-tion of future interest rates and that the yield curve is primarily determined by interest rate expectations. At the present time, Boca has not hedged its interest rate risk. Assume that a steep upward-sloping yield curve currently exists.a. Boca asks you to assess its exposure to interest rate
risk. Describe how Boca will be affected by rising interest rates and by a decline in interest rates.
b. Given the information about the yield curve, would you advise Boca to hedge its exposure to interest rate risk? Explain.
c. Explain why your advice to Boca may possibly backfire.
12. Exposure to Interest Rate Risk The following table discloses the interest rate sensitivity of two savings institutions (dollar amounts are in millions).
Interest Sensitivity Period
From From Over Within 1 to 5 5 to 10 10 1 Year Years Years Years
Lawrence S&LInterest-earning assets $ 8,000 $3,000 $7,000 $3,000Interest-bearingliabilities 11,000 6,000 2,000 1,000
Manhattan S&LInterest-earning assets 1,000 1,000 4,000 3,000Interest-bearing liabilities 2,000 2,000 1,000 1,000
Based on this information only, which institu-tion’s stock price would likely be affected more by a given change in interest rates? Justify your opinion.
13. SI Crisis What were some of the more obvious reasons for the savings institution crisis?
14. FIRREA Explain how the Financial Institu-tions Reform, Recovery, and Enforcement Act ( FIRREA) reduced the perceived risk of savings institutions.
15. Background on CUs Who are the owners of credit unions? Explain the tax status of CUs and the rea-son for that status. What is the typical size range of CUs? Give reasons for that range.
16. Sources of CU Funds Describe the main source of funds for credit unions. Why might the average cost of funds to CUs be relatively stable even when market interest rates are volatile?
17. Regulation of CUs Who regulates credit unions? What are the regulators’ powers? Where do CUs obtain deposit insurance?
Rimsa Savings is a savings institution that provided Carson Company with a mortgage for its office build-ing. Rimsa recently offered to refinance the mortgage if Carson Company would prefer a fixed-rate loan rather than an adjustable-rate loan.
Flow of Funds Exercise
Market Participation by Savings Institutions
a. Explain the interaction between Carson Company and Rimsa Savings.
b. Why is Rimsa willing to allow Carson Company to transfer its interest rate risk to Rimsa? (Assume that there is an upward-sloping yield curve.)
21-B4312-AM1.indd 59921-B4312-AM1.indd 599 8/29/07 2:32:35 AM8/29/07 2:32:35 AM
Copyright 2009 Cengage Learning. All Rights Reserved. May not be copied, scanned, or duplicated, in whole or in part.
600 Part 7: Nonbank Operations
in the secondary market to a pension fund, who is the source that is essentially financing the office building? Why would a pension fund be willing to purchase this mortgage in the secondary market?
c. If Rimsa maintains the mortgage on the office building purchased by Carson Company, who is the ultimate source of the money that was provided for the office building? If Rimsa sells the mortgage
Internet/Excel Exercises
1. Assess the recent performance of savings institu-tions using the website http://www2.fdic.gov/hsob/SelectRpt.asp?EntryTyp=20. Click on “Quarterly Banking Profile,” then on “Savings Institution” section, and sum marize the general performance of SIs in the last two years.
2. Retrieve the annual report of Heritage Financial Corporation (ticker symbol is HFWA) or another savings institution of your choice. To access income statement information, go to http://fi nance.yahoo.com, enter the ticker symbol, and click on “Get Quotes.” Then click on “SEC Filings” to retrieve recent income statements. Review the SI’s recent performance. Has its income as a percentage of as-sets increased since the year before? Explain what caused this change over the last year. Has the SI’s net interest margin changed since last year? How has its noninterest income (as a percentage of as-sets) changed over the last year? How have its non-interest expenses changed over the last year? How have its loan loss reserves changed in the last year? Discuss how the SI’s recent strategy and economic
conditions may explain the changes in these com-ponents of its income statement.
3. Go to http://fi nance.yahoo.com/, enter the symbol HFWA (Heritage Financial Corporation), and click on “Get Quotes.” Then, retrieve stock price data at the beginning of the last 20 quarters. Then go to http://research.stlouisfed.org/fred2/ and retrieve interest rate data at the beginning of the last 20 quarters for the three-month Trea-sury bill. Record the data on an Excel spreadsheet. Derive the quarterly return of Heritage Financial. Derive the quarterly change in the interest rate. Ap-ply regression analysis in which the quarterly return of Heritage Financial is the dependent variable and the quarterly change in the interest rate is the in-dependent variable (see Appendix B for more infor-mation about using regression analysis). Is there a positive or negative relationship between the inter-est rate movement and the stock return of Heritage Financial? Is the relationship signifi cant? Offer an explanation for this relationship.
Using a recent issue of The Wall Street Journal, sum-marize an article that discussed the recent performance of a particular savings institution. Does the article
WSJ Exercise
Assessing Performance of Savings Institutions
suggest that the SI’s performance was better or worse than the norm? What reason is given for the unusual level of performance?
21-B4312-AM1.indd 60021-B4312-AM1.indd 600 8/29/07 2:32:36 AM8/29/07 2:32:36 AM
Related Documents