CHAPTER 2.1: CELL MEMBRANE MECHANICS AND ADHESION ©RD Kamm 4/6/15 Chapter 3.1 Cell Membrane Mechanics and Adhesion 3.1.1 Introduction Membranes perform a critical function, providing a selective barrier between the cell interior and the living processes inside, and the lifeless, often inhospitable environment outside. In the simplest of terms, the cell membrane can be thought of as a lipid bilayer that separates the cytoplasmic and extracellular domains. Indeed, our approach to modeling membrane mechanics relies much on this simplification. The true cell membrane, however, is vastly more complex than this simple representation would suggest, and we begin this chapter by describing some of this complexity and its implications to the mechanical properties of the cell. Since the membrane and associated structures behave as an integral structural element of the cell, we next develop the methods for investigating membrane mechanics, both theoretical and experimental. In the last section of this chapter, the means by which the cell adheres to its environment are discussed along with the methods used to probe these adhesive properties through experimentation and analyze the results quantitatively. 3.1.2 Membrane Structure and Biology Membrane composition and organization Although much of the discussion of this chapter will be directed to the outer, limiting cell membrane, it is important to realize that much of the membrane of a cell is intracellular and serves the purpose of partitioning regions in the cell, such as the nucleus or mitochondria, from the cytoplasm. While each type of membrane has its own unique characteristics, their basic 1

Welcome message from author
This document is posted to help you gain knowledge. Please leave a comment to let me know what you think about it! Share it to your friends and learn new things together.
Transcript

CHAPTER 21 CELL MEMBRANE MECHANICS AND ADHESION copyRD Kamm 4615
Chapter 31
Cell Membrane Mechanics and Adhesion
311 Introduction
Membranes perform a critical function providing a selective barrier between the cell interior and
the living processes inside and the lifeless often inhospitable environment outside In the
simplest of terms the cell membrane can be thought of as a lipid bilayer that separates the
cytoplasmic and extracellular domains Indeed our approach to modeling membrane mechanics
relies much on this simplification The true cell membrane however is vastly more complex
than this simple representation would suggest and we begin this chapter by describing some of
this complexity and its implications to the mechanical properties of the cell Since the membrane
and associated structures behave as an integral structural element of the cell we next develop the
methods for investigating membrane mechanics both theoretical and experimental In the last
section of this chapter the means by which the cell adheres to its environment are discussed
along with the methods used to probe these adhesive properties through experimentation and
analyze the results quantitatively
312 Membrane Structure and Biology
Membrane composition and organization
Although much of the discussion of this chapter will be directed to the outer limiting cell
membrane it is important to realize that much of the membrane of a cell is intracellular and
serves the purpose of partitioning regions in the cell such as the nucleus or mitochondria from
the cytoplasm While each type of membrane has its own unique characteristics their basic
1
CHAPTER 21 CELL MEMBRANE MECHANICS AND ADHESION copyRD Kamm 4615
structure remains much the same For that reason despite our focus on the outer or plasma
membrane the material in this chapter applies more generally to all cell-associated membranes
Fig 311 A space-filling model of the lipid bilayer showing the hydrophilic heads (polar head groups) on the outside and the hydrophobic tails pointing in on the interior The total thickness of the bilayer is about 6 nm [Reproduced from Molecular Cell Biology Lodish et al 2000]
When we use the term membrane we are generally referring to the phospholipid bilayer
and the proteins associated with it The phospholipids contained in the membrane are arranged
in two layers or leaflets with their hydrophobic tails pointing inward and their hydrophilic heads
outward Together they constitute a bilayer about 6 nm in thickness (Fig 311) Four
phospholipids account for more than half the lipid in most membranes these are
phosphatidylcholine sphingomyelin phosphatidylserine and phosphatidylethanolamine The
first and second of these are predominantly in the outer leaflet while the third and fourth are
more common in the inner leaflet In addition to these phospholipids the membrane contains
glycolipids and cholesterol While the amount of glycolipid is small constituting only about 2
2
CHAPTER 21 CELL MEMBRANE MECHANICS AND ADHESION copyRD Kamm 4615
of the total lipid content cholesterol is a major membrane constituent roughly 20 by weight a
value that remains quite constant among the different cell types
Several of these lipids are critical for their role in determining membrane structural
integrity These include the four major phospholipids and cholesterol For example both the
bending stiffness and the viscosity of the lipid bilayer sometimes referred to as membrane
fluidity are strongly dependent on the cholesterol content
Other important membrane constituents are the membrane-associated proteins which
account for roughly 50 of the membrane by weight but because of their relatively large
molecular weight only about 1-2 of the number of molecules comprising the membrane
These serve a variety of functions from signaling to the transport of ions and other molecules
across the membrane to the adhesion of the cell to surrounding structures as will be discussed
more later One subclass includes the integral membrane proteins those that penetrate into the
lipid bilayer can be classified according to their means of attachment to the bilayer
bull proteins that attach primarily through interactions with the hydrophobic core (this
subgroup contains most ion channels)
bull transmembrane proteins attached by only one hydrophobic segment (including many
membrane-bound antibodies some receptors of the integrin family and several other
types of receptor)
bull proteins attached to the membrane by lipid anchors or
bull proteins adsorbed to the membrane through interactions with the charged head groups
Some membrane-associated proteins are bound through other proteins (Fig 312) these are
called peripheral proteins and can be made to dissociate from the membrane by introducing
fluids with extreme values of pH or high salt concentrations that disrupt the covalent bonds
typically used for attachment
3
CHAPTER 21 CELL MEMBRANE MECHANICS AND ADHESION copyRD Kamm 4615
Fig 312 Schematic of the lipid bilayer and associated proteins either integral or peripheral [Reproduced from Molecular Cell Biology Lodish et al 2000]
The critical importance of these proteins can be illustrated by describing some of their
many functions One group of proteins serves as ion or water channels and pumps to control the
intracellular ionic concentrations (H+ Na+ Cl+ Mg++ Ca++) In the case of the red blood cell or
erythrocyte for example the cytosol is maintained at a potential approximately -6 mV relative to
the blood plasma Intracellular osmotic pressure (~150 mosm) and pH (~74) are also
maintained within narrow limits Many channels are active ion transporters pumping ions
against a concentration gradient and requiring an external source of energy often by ATP
hydrolysis Others however perform facilitated diffusion meaning that they help to regulate the
exchange of ions across the membrane in the direction of the concentration gradient but require
no external energy One class of these of particular interest in biomechanics includes the
mechanically-sensitive ion channels that open or close under the action of stresses transmitted by
the membrane or via attachments to the cytoskeleton or extracellular matrix One such channel
located in the stereocilia of hair cells in the tympanic membrane mediates the sensation of sound
The mechanism by which forces regulate these channels is discussed in Chapter 33 Other ion
channels are regulated by a change in protein conformation resulting from binding by some
signaling molecule (so-called ligand-gated channels) or by changes in the transmembrane
voltage potential (voltage-gated channels) Much of what we know about these ion channels
comes from experiments using the patch clamp technique in which drawing it into the tip of a
micropipet isolates a small section of membrane This method developed by Neher and
4
CHAPTER 21 CELL MEMBRANE MECHANICS AND ADHESION copyRD Kamm 4615
Sakmann in 1976 has spawned many of the experiments on which our current understanding of
membrane ion transport is based
Other integral membrane proteins are used for adhesion of the cell to surrounding
structures for signaling or for the control of biochemical reactions Discussion of adhesion
proteins will come later in Section 316 Signaling is accomplished in a variety of ways but is
most often mediated by the transfer of molecules across the membrane either directly by
diffusion or via selective channels or by binding of a ligand to a cell surface receptor Each time
a signal is received by means of receptor-ligand binding the result is a conformational change
in the receptor that initiates other biological processes via a signaling cascade involving a host of
other intermediate molecules Not infrequently the reaction initiated by ligand-receptor binding
is with another protein located within the membrane or closely associated with it Being
constrained to two dimensions rather than free to move in three can greatly accelerate reactions
that are diffusion-limited For example the time required for a molecule to reach a target of
diameter dT located a distance L away is approximately L3 (3DdT ) in three dimensions and
(L2 2D)ln(L dT ) in two where D is the diffusion coefficient (Hardt 1979)
Recognizing its fluid-like nature and multi-component structure Singer and Nicolson
proposed the fluid mosaic model for the membrane in 1972 This model emphasizes that the
lipids form a highly fluid-like phase while the proteins tend to aggregate in isolated islands that
are relatively rigidly structured giving rise to a mosaic-like arrangement Both the proteins and
lipids are free to diffuse within the plane of the membrane unless tethered to fixed structures
either internal or external to the cell The fluid-like nature of the membrane especially the lipid
portion accounts for the low resistance to shear deformations in the plane of the membrane In
addition the hydrophobic interior behaves essentially like a hydrocarbon fluid allowing the two
leaflets to slide freely relative to one another
Aside from the lipid bilayer the cell plasma membrane has associated macromolecular
structures on both intra- and extracellular sides giving rise to a three-layer composite
construction On the intracellular side the membrane is physically attached to a cortex or the
cytoskeleton The cortex is a dense filamentous structure that lends stiffness to the membrane
and can also interact with various transmembrane proteins often impeding their free diffusion
either by steric interactions or direct chemical bonding In some cells the cortex is simply a
region of dense cytoskeletal matrix in the vicinity of the bilayer In others it exhibits a distinctly
different structure or composition For example erythrocytes possess a cortex comprised of a
network of spectrin tetramers linked by actin filaments This network is attached to the
membrane by ankyrin and the integral membrane protein band 3 (Fig 313) This spectrin
network accounts for much of the bending stiffness exhibited by the red cell membrane
5
CHAPTER 21 CELL MEMBRANE MECHANICS AND ADHESION copyRD Kamm 4615
Fig 313 Structure of the membrane-associated cortex in an erythrocyte as viewed from the inside of the cell a) Schematic representation showing the arrangement of the spectrin filaments joined by short segments (13 monomers) of actin and tethered to the membrane through ankyrin and band 3 Junctional complexes containing actin tropomyosin adductin and band 41 also bind to band 3 and glycophorin b) An electron micrograph showing the same structures [From Molecular Biology of the Cell Bruce Alberts Dennis Bray Julian Lewis Martin Raff Keith Roberts James D Watson copy 1994]
External to most cells is found a glycocalyx which has been shown to extend as far as 05
μm from the surface of endothelial cells where it forms a compressible barrier separating circulating erythrocytes and leucocytes from the endothelial membrane The glycocalyx is comprised of short oligosaccharide chains glycoproteins glycolipids and high molecular weight proteoglycans all organized into an interconnected network with an overall negative charge Although its function is not completely understood it apparently plays a role in macromolecular transport across the endothelium and is an important factor in the interaction between blood-borne cells and the endothelium Studies have demonstrated that the glycocalyx in a capillary is readily compressed by a passing leukocyte yet is sufficiently rigid to prevent flowing erythrocytes from approaching the endothelial surface (Fig 314)
6
CHAPTER 21 CELL MEMBRANE MECHANICS AND ADHESION copyRD Kamm 4615
Fig 214 Images of a capillary segment in the hamster cremaster muscle with an intact glycocalyx (AB) and with the glycocalyx collapsed by treatment of the vessel with epi-illumination (CD) using either bright field illumination (AC) or fluorescent imaging using a dye too large to penetrate the glycocalyx (70 kD molecular weight FITC-dextran) The capillary wall is visualized by a membrane-specific dye PKH26 in A and C Width of the glycocalyx is indicated by the gap between the erythrocytes and the wall in A and C and by the change in effective capillary diameter before (B) and after (D) epi-illumination In this series capillary diameter increased from 47 to 54 μm suggesting awidth of the glycocalyx of 035 μm [Reproducedfrom Vink amp Duling (Vink and Duling 1996)
313 Membrane Mechanics
For the purpose of analysis we treat the cell membrane as a homogeneous two-dimensional plate
or sheet completely enclosing the cytoplasm The membrane referred to here can be thought of
either as the lipid bilayer by itself or more typically as the bilayer plus the associated cortex of
cytoskeletal filaments and glycocalyx on the extracellular surface In addition though not
explicitly recognized in the analysis transmembrane proteins and their attachments to the
intracellular and extracellular milieu are included in terms of their influence on the continuum
7
CHAPTER 21 CELL MEMBRANE MECHANICS AND ADHESION copyRD Kamm 4615
properties of the model Were it not for these the membrane would exhibit little resistance to
shear deformation
In qualitative terms the lipid bilayer can be thought of as a two-dimensional fluid within
which the individual lipid molecules or other molecules embedded in the membrane are
relatively free to move about by diffusion or directed motion Phospholipid molecules in either
of the two layers resist being pulled apart however so each layer is highly inextensible This
also contributes to the bending stiffness which is low in absolute terms but high for such a thin
layer since bending requires one layer to expand while the other is compressed By contrast the
two layers readily slide relative to each other These qualitative notions are put in more
quantitative terms in the next section
Types of deformation
Any deformation can be thought of in general terms as a superposition of several
simpler deformations For small strains in which linearization is appropriate the principle of
superposition is rigorously valid For larger strains however linear theory breaks down and
superposition can only be used as a rough qualitative guide in visualizing combined influences
Here we present the three primary types of deformation pure extension pure bending and pure
shear Later we also consider the influence of membrane viscosity in time-dependent
deformations
σ2
A
A0
σ1 σ1
x2
σ2
x1 Fig 315 A membrane initially of area A0 subjected to a uniform extensional stress along its edges σ1 = σ2 causing an increase in area to A
Pure extension In discussing the extensional stiffness of the membrane we need to distinguish
the behavior at low tension from that at high tension As you first begin to apply an extensional
8
CHAPTER 21 CELL MEMBRANE MECHANICS AND ADHESION copyRD Kamm 4615
stress at the edges of a lipid bilayer the projected or apparent membrane area first increases
while the actual or true membrane area remains constant This results from the suppression of
out-of-plane undulations Forces acting to resist membrane flattening originate from entropic
effects analogous to those seen in the case of a flexible polymer as its end-to-end distance is
increased ndash many more membrane configurations exist with undulations compared to the single
perfectly flat state Only when these undulations have been eliminated does the true membrane
area proportional to the surface area per molecule group begin to increase and this is associated
with a relatively abrupt increase in extensional stiffness For now we consider only the stiffness
of a flat membrane and leave the discussion of undulations of entropic origin to a later point in
the chapter Hence we initially neglect all entropic effects or equivalently consider the
membrane to be at zero temperature
Based in this assumption consider an infinitesimal plate initially of area A0 = L 20 that is
deformed by a uniform normal stress τ11 = σ1 = τ22 = σ2 applied to its edges (Fig 315) to a
new area A Previously we derived the expressions relating stress and strain which in two
dimensions and in the absence of stresses normal to the x1-x2 plane can be written
E
σ α = 2 (εα + νε β ) (21) 1minus ν
where the length of one edge Lα=L0(1+εα) Note that in this chapter we use the subscripts α β
rather than i j to distinguish stresses and strains in two dimensions from those more generally
in three Thus whereas i and j can be either 1 2 or 3 α and β are restricted to being either 1 or
2 When this stress is uniform in the plane of the membrane (the x1- x2 plane) it can be replaced
without loss of generality by a surface tension Nα (force per unit length) defined as σ α h where h
is the thickness of the membrane These can be combined in the case when N1 = N2 = constant
and consequently ε1 = ε2 = ε to give
Eh
N = ε (22)1 minus ν
In terms of a plate stretched uniformly in both directions we can define the areal strain as
ΔA A minus A 2 2 2
= 0 L0 (1+ ε ) minus L= 0
2 cong 2ε (23)A0 A0 L0
where the last approximation is appropriate for small strains By combining this result with eqn
(22) we can define the area expansion modulus Ke (units of Nm)
9
CHAPTER 21 CELL MEMBRANE MECHANICS AND ADHESION copyRD Kamm 4615
Eh ΔA Δ A
N = equiv K (24)2(1minus ν) A e
0 A0
Note that although we used the continuum structural equations in our analysis the final result
can also be viewed as simply the definition of the area expansion modulus and applies regardless
of whether or not the membrane can be modeled as a continuum
Experimental measurements of Ke lie in the range of 01-1 Nm for various types of lipid
bilayers and about 045 Nm (450 dyncm) for red blood cell membranes (Waugh and Evans
1979) These numbers suggest that cell membranes are quite resistant to extension and for that
reason are often treated as inextensible1 This high resistance to area change is in large part due
to the energy penalty associated with exposing the hydrophobic core of the membrane to water
that occurs as the spacing between individual amphiphilic molecules is increased [for a detailed
description of bilayer structure and thermodynamics see Tanford (1980) or Israelachivili
(1991)] Continuing to increase extensional stress the lipid bilayer eventually ruptures but at
very small extensional strains in the vicinity of 2 to 3 (Mohandas amp Evans 1990) Note that a
bilayer in a lipid vescicle for example stretches primarily by increasing the area per molecule
since recruitment of additional material to the membrane occurs very slowly
Using these expressions we can estimate the level of surface tension at which the
membrane would rupture At a 3 extensional strain (6 areal strain) uniformly applied in the
x1-x2 plane the surface tension at rupture would be about 006 Nm if we use a value near the
higher end of the observed range Ke = 1 Nm Using Laplaces law [see eqn (227)] for the
relationship between the pressure difference (ΔP) across a spherical shell of radius R = 1 μm and
the surface tension in the shell gives us
2N
ΔP = = 12x105 Pa cong 1200cmH 2O R
a remarkably high value of pressure given the thickness of the membrane is only 6 nm
Cells also often exhibit an intrinsic surface tension Reported values are small however
lying in the range of about 10-5 to 10-4 Nm (Sheets Simson et al 1995) For comparison recall
that the surface tension across the interface of a droplet of pure water is about 007 Nm a value
close to the rupture stress of the membrane given above It becomes immediately obvious then
that the tension of a cell membrane must be orders of magnitude smaller than the surface tension
1 This discussion neglects the effects of thermal fluctuations in the membrane that give rise to a much more compliant behavior at the smallest areal strains When surface stress is sufficient to smooth out most thermal fluctuations the cell or vesicle will exhibit the large moduli given here See also Example xx later in this chapter
10
CHAPTER 21 CELL MEMBRANE MECHANICS AND ADHESION copyRD Kamm 4615
of a typical gas-liquid or liquid-liquid interface since it would otherwise give rise to intracellular
pressures on the order of one atmosphere
Pure bending By contrast lipid bilayers exhibit a very low bending stiffness so low that it is
often neglected in models of membrane mechanics It can be important in certain situations
however and is essential for example in analyzing the thermal fluctuations of vesicles discussed
later in this chapter
Bending stiffness arises from the same type of molecular interactions that cause
extensional stiffness When an initially flat bilayer is bent the hydrophilic head groups on the
outside of the bend move further apart while on the inside intermolecular spacing decreases
both represent departures from the equilibrium unstressed state and require energy If the same
forces of interaction are responsible why then is bending stiffness so low While the answer to
this question is not simple one factor is the membrane thickness which you recall is only about
6 nm As the membrane bends therefore the change in the surface area per molecule is
extremely small so the associated extensional strains are also minute
Returning to our simple continuum plate model consider a bending moment applied to
the two ends causing the plate to curve slightly (Fig 316) If the bending is due to moments
applied at the two ends about the x2-axis then the bending moment per unit length is related to
the deflection by
Et 3 ⎛ part 2u ⎞ ⎛ part 2 ⎞
⎜ 3 u
Mα = minus 2 2 ⎟ = minusK B⎜ 32 ⎟ (25)
12(1minus ν ) ⎝ partxα ⎠ ⎝ partxα ⎠
where KB is termed the bending stiffness having units of Nm Implicit in this expression are the
assumptions that there exists a mid-plane (the neutral plane) on which the in-plane stress and
strain are both zero and that straight lines perpendicular to this mid-plane remain straight and
normal to this surface after deformation
Typical values for the bending stiffness KB lie in the range of 10-19 Nm (10-12 dyncm) for
a red blood cell or lipid bilayers (Mohandas amp Evans 1990) This value is larger on the order of
1-2x10-18 Nm (Zhelev Needham et al 1994) for other cell types (eg neutrophils endothelial
cells) that possess a more extensive cortex The methods used to obtain these values will be
described later in this chapter
11
CHAPTER 21 CELL MEMBRANE MECHANICS AND ADHESION copyRD Kamm 4615
Fig 316 Plate subjected to equal moments M1 at the two edges
Example Estimate the moment per unit length acting within an initially flat lipid bilayer (at zero
temperature) associated with a wavelength λ = 5 μm and amplitude ε = 1 μm
Membrane displacement can be approximated by the expression
u3 = ε sin (2πx1 λ) (26)
From eqn (25) above we obtain
2
⎛ 2π ⎞ M1 = KBε sin (2πu )⎝ ⎠ 3 λ (27)λ
Using the values given above the maximum moment per unit length is 0158 pN
Pure shear Shear deformations arise when a membrane is stretched in one direction by a
surface tension N1 (units of forcelength) while the lateral surface contracts under a lesser tension
N2 at constant surface area and in the absence of bending (Fig 317) Surfaces oriented at 45
degrees to the boundaries experience pure shear stresses of magnitude (N1 - N2)2
When subjected to shear stresses in the plane of the membrane a pure lipid bilayer
behaves essentially as a liquid It exhibits a membrane viscosity in that it poses a resisting force
proportional to the rate of shear deformation but only a small shear modulus to static shear
deformations It is not clear in fact whether or not pure lipid bilayers exhibit a non-zero shear
modulus For example the movement of membrane-bound proteins can be described by a
simple diffusion coefficient proportional to the membrane viscosity Typical cell membranes do
exhibit a shear modulus however largely due to the cortex of cytoskeletal filaments that lie on
the intracellular side of the membrane In a red blood cell this matrix as discussed above
12
CHAPTER 21 CELL MEMBRANE MECHANICS AND ADHESION copyRD Kamm 4615
consists of interconnected filamentous spectrin and actin with attachments to the membrane via
ankyrin
N2
N1 N1
N2 Fig 317 A section of membrane subjected to a shear stress of magnitude N1-N22
The equations relating shear stress to shear deformation (Hookes law) from Ch xx can
be applied here
τ12 = τ 21 =2Gε12 (28)
or expressed as a shear force per unit length of membrane
N12 =τ12 h = 2Gε12 = Ksε12 (29)
where we define the membrane shear modulus Ks with units of Nm Typical values lie in the
range of 6-9 x 10⁻⁶ Nm for a red blood cell membrane A pure lipid bilayer exhibits a viscous
resistance to shear deformations characterized by a shear viscosity of about 10-6 Nsm ((Evans
1983))
The 2D elastic plate -- equations of deformation
In the analysis of cellular membranes several unique characteristics need to be taken into
account
1 The membrane is extremely thin relative to its lateral extent If we consider the thickness to
be that of the lipid bilayer by itself then h can be as small as 6 nm compared to a typical cell
dimension on the order of 10s of μm Even if we include the sub-membrane cortex this
13
CHAPTER 21 CELL MEMBRANE MECHANICS AND ADHESION copyRD Kamm 4615
dimension only increases to about 100 nm This tends to favor in-plane stresses over bending
effects2
2 The non-shear deformations are very small with strains of at most a few percent Therefore
linear analysis is appropriate in many situations Note however that nonlinear effects can be
important especially for large shear deformations such as occur in micropipet aspiration of
red blood cells The implications and limitations of this are discussed more fully below
3 The membrane exhibits a very small modulus in plane shear and is often treated as a two-
dimensional liquid While this applies primarily to lipid bilayers when the membrane is
considered to include the cortex greater values of shear modulus can be observed
4 Stresses normal to the membrane are small and can be neglected
5 Membrane motions can be damped either due to viscous dissipation within the bilayer as in
the case of in-plane shear or due to the viscosity of the fluids on the intra- or extracellular
sides of the membrane These latter are especially important when considering motions of
the membrane perpendicular to its plane
6 Inertial effects can be neglected due to the predominance of viscous forces during transient
deformations
With these in mind and acknowledging the limitations of a continuum view of such
structures we treat the membrane as a thin homogeneous plate or membrane in which all the
following must be considered in-plane extension and shear bending viscous damping and
thermal fluctuations
The equations we derive will effectively be integrated through the membrane thickness so
that stresses will be in terms of surface forces (force unit length) These are the in-plane normal
forces (see Fig 318 for definition of the axes and nomenclature) are therefore written as
+ h 2
Nα = int σ α dx3 (210) minus h 2
where h is the membrane thickness and the vertical shearing forces
+ h 2
Vα = (211) minus h
int τα 3dx3
2
The moments acting on the plate edges can be calculated from
2 Whether tension or bending dominates clearly depends on the nature of the experiment If an initially spherical cell is distended tension is most important if the cell shrinks so that the membrane buckles bending effects will be critical
14
CHAPTER 21 CELL MEMBRANE MECHANICS AND ADHESION copyRD Kamm 4615
+h 2
Mα β = int x3τα β dx3 (212)minush 2
x
(c)
Fig 318 (a) A small section of membrane (b) Membrane deflections (c) Nomenclature used in defining the forces acting on a section of membrane (Note that Q is used to represent shear stress in the figure whereas V is used in the text and (xyz) should be (x1x2x3))
In order to distinguish the effects of bending from those giving rise to extension we separate the
normal stress into two parts one representing the mean over the thickness of the membrane
which is simply Nαh and the other representing the deviation from this value denoted as σαprime
Similarly we separate the displacement on the neutral plane unα from that which varies with x3
denoted as uαprime Consequently we can write
N
uα = u n + primeα and = iα u σ α + primeσ α (213)
h
And consistent with the assumption that planar edges initially normal to the membrane remain
planar under bending deformations we have that
15
CHAPTER 21 CELL MEMBRANE MECHANICS AND ADHESION copyRD Kamm 4615
partu uαprime = minus x 3
3 (214)partxα
According to assumption (4) above the relationships between stress and strain become
E σ α = νε β ) α ne β (215)
minus ν2 (ε1 α +
and
E ταβ = εαβ α ne β (216)
(1+ ν )
Since
partuα partunα partu
= αprime ε α = + (217)
partxα partxα partxα
(summation convention not used) We eventually obtain the following expressions for the
bending moment
+h 2 ⎛ part 2 u part 2 ⎞ M 3 u3
α = int σ α x3dx3 = minusKB ne (218)⎜ ⎝
2 + ν ⎟ α β partx 2
minush 2 partxα β ⎠
and
+ h 2 part 2u
M12 = int ε KB (1minus ν) 312 x3dx3 = minus (219)
minus h 2 partx1partx2
where in classical shell theory for continuum materials KB=Eh3(1-ν2) The moments are related
to the shear forces in the plane of the membrane through a moment balance about the x1 axis
giving
partM 12 partM
+ 2 minus V2 = 0 (220)partx1 partx2
so that
part ⎛ part 2 u part 2 u ⎞ part ⎛ part 2 part 2
V = minus 3 + 3 uandV 3 u
K ⎜ ⎟ = minus K ⎜ + 3⎞
2 B ⎟ (221)partx2 ⎝ partx 2 2 ⎠ 1 B 2 2
1 partx2 partx1 ⎝ partx1 partx2 ⎠ A force balance in the direction normal to the membrane yields
16
CHAPTER 21 CELL MEMBRANE MECHANICS AND ADHESION copyRD Kamm 4615
partV1 partV2 part ⎛ partu ⎞ part ⎛ partu ⎞+ + ⎜ N 3 ⎟ + ⎜ N 3 ⎟
2 + p = 0 (222)x 1
part 1 partx2 partx1 ⎝ partx1 ⎠ partx2 ⎝ partx2 ⎠
which upon substitution for V1 and V2 from eqns (221) becomes
⎛ part4u3 part4u part4u3 part part ⎛ ⎞K 3 ⎞ part ⎛ u ⎞
B 4 N 3 partu
+ 2 + minus minus N 3 minus p = 0 (223)⎜ ⎟ ⎜ ⎟ ⎜ ⎟⎝ partx1 partx2partx2 partx4 ⎠ partx ⎝ 1 partx ⎠ partx ⎝ 21 2 2 1 1 2 partx2 ⎠
Recall that the first term in parentheses is due to bending the second and third terms are due to
in-plane extension and the fourth term represents the pressure difference across the membrane
Eqn (223) contains three unknowns the displacement u3 and the two normal forces per
unit length N1 and N2 Fortunately the additional equations required for solution are quite easy
to obtain from simple force balances in the x1 and x2 directions Setting the sum of forces in the
x1 direction equal to zero we obtain (referring to Fig 319)
minus N1(x1) + N1(x1 + dx1)cosθ (x1 + dx1) minus N21 (x2 ) + N21(x2 + dx2 ) = 0 (224)
or
partN1 partN21 partN2 partN + = 0 and similarly + 12 = 0 (225)
partx1 partx2 partx2 partx1
While formidable in its complete form it is reassuring to know that we rarely use eqn
(223) in its entirety and that when certain limiting cases are considered more familiar equations
are obtained It is useful at this stage to consider several of these limits
Fig 319 x1 force balance in the plane of the membrane
17
CHAPTER 21 CELL MEMBRANE MECHANICS AND ADHESION copyRD Kamm 4615
Balance between pressure and surface tension (Laplacersquos Equation) If the in-plane stress is
uniform (Ni=Nj=N) eqn (223) has the form
⎛ part 4u part 4u part 4u ⎞ ⎛ part 2u KB ⎜
3 4 + 2 3 3
2 2 + 4 ⎟ minus N⎜ 3 part 2u
2 + 3 ⎞
2 ⎟ minus p = 0 (226)⎝ partx1 partx1 partx2 partx2 ⎠ ⎝ partx1 partx2 ⎠
and eqn (225) is trivially satisfied If in addition bending stiffness can be neglected then
⎛ part 2 u part 2 ⎞ ⎛ 1 1 ⎞ 3 u
p = minusN ⎜ 3
2 + 2 ⎟ cong N⎜ + ⎟ (227)⎝ partx1 partx2 ⎠ ⎝ R2 R1⎠
for small curvatures where R1 and R2 are the radii of curvature of the membrane about the x1 and
x2 axes respectively This is the well-known Laplacersquos equation with N the surface tension For
a sphere R1 = R2 and the equation simplifies further yielding the equation given on p 10
Balance between pressure and bending Alternatively if all in-plane stresses can be neglected
other than those associated with bending stiffness we obtain the equation generally used for
simple bending of plates and shells
⎛ part 4u part 4u part 4 3 3 u ⎞
KB ⎜ 4 + 2 2 + 3 ⎟ = p (228)
⎝ partx1 partx1 partx2 partx 4 2 2 ⎠
Both of these forms will be used later in this chapter to examine specific problems in cell
membrane mechanics
The conditions under which eqn (226) can be reduced to either (227) or (228) can be
determined by an order of magnitude comparison of the bending and tension terms If we take u
to be a measure of the membrane displacement in the x3 direction and λ to be the characteristic length in the x1 or x2 directions over which u3 varies then the bending term can be shown to scale as K 4 2
Bu λ and the tension term as Nu λ The ratio of these tells us which of the terms dominate in eqn (226) If
KBu λ4 K= B ltlt 1
Nu λ2 Nλ2
then tension dominates and eqn (227) is appropriate Alternatively if
KB gtgt 1 Nλ2
18
CHAPTER 21 CELL MEMBRANE MECHANICS AND ADHESION copyRD Kamm 4615
then bending dominates and eqn (228) should be used If we take values typical of those given
for cells K N = 5x10⁻⁵B = 10-18 Nm Nm λ = 1 μm this ratio equals 002 confirming as we
originally postulated that tension tends of dominate
Nonlinear formulations
Traditionally membrane deformations have been addressed through nonlinear analysis allowing
for large strains especially in shear Here we have chosen to present the linearized equations in
the hope that they will provide clearer insight and for continuity with the approach used in other
chapters of the text For many problems of interest deformations are small and linear theory is
sufficiently accurate In some circumstances however a nonlinear analysis is necessary one
example being the aspiration of a red blood cell membrane into a micropipet For this reason we
present the nonlinear equations in Appendix A for the more advanced reader and to assist in
reading the recent literature on membrane mechanics
Energies of deformation
Although the formulation of the equations of deformation in Section 316 is complete by itself
an alternative approach is often useful in which we consider the strain energy the energy stored
in the membrane due to elastic deformation as a basis for analysis Strain energy is analogous to
the energy stored in a spring by stretching it If the spring is linear with a stiffness k so that the
force F required to lengthen it from x0 to x is k(x-x0) then the energy expended during the
process of lengthening is
x x
U = int Fdx = int k(x minus x0 )dx = 1 2 k(x minus x0)
2 (229)x= x 0 x = x 0
Extensional energy Now consider a section of an elastic membrane of thickness h and lengths
dx1 and dx2 subjected to a uniaxial tension stress σ1 Here as in our previous discussion we
consider two cases first a flat membrane which is being stretched by extensional stresses (the
case at zero temperature) and second the situation in which the surface area of the membrane
projected onto a flat plane increases due to the smoothing of out-of-plane undulations (the
entropic contribution)
As the stress is gradually applied to minimize any dissipative effects the work done by
the external force must equal the gain in elastic energy stored in the plate The work performed
by this stress is
19
CHAPTER 21 CELL MEMBRANE MECHANICS AND ADHESION copyRD Kamm 4615
ε1 ε 1
dU = int σ 1dε 1dx1dx2 dx3 = int Eε1dε1dx1dx2dx3 (230)0 0
By energy conservation the work done in stretching the membrane must be stored as potential
or strain energy in the elastic member Since the right-hand-side of (330) represents the strain
energy in the volume dx1dx2dx3 then the energy per unit volume of membrane is
ε1 ε1
U0 = int σ 1dε1 = int Eε = 1 Eε21dε1 2 1 (231)
0 0
or expressed as energy per unit area of membrane
Ehε2
U 10h = (232)
2 In the somewhat more general case of biaxial strain a similar approach leads to
Eh ⎡ 2 2
( 2 2 ) Eh ⎛ ⎤partu ⎞ uε1 + ε 2 = ⎢⎜
1 ⎛ part
⎟ + ⎜ 2
⎞ U0h = ⎟ ⎥ (233)
2 1( minus ν ) 2 1( minus ν ) ⎢⎝ partx⎣ 1 ⎠ ⎝ partx2 ⎠ ⎥⎦
Note that if the strain is isotropic in that ε1 = ε2 = ε this can also be expressed in terms of the
areal strain with the aid of eqn (23)
2 Eh ⎛ ΔA⎞
U0h = ⎜ ⎟ (234)4 1( minus ν ) ⎝ A0 ⎠
from which it can be seen by eqn (24) that the area expansion modulus has the form
Eh Ke = (235)
2 1( minus ν )
under the assumptions of a homogeneous isotropic elastic membrane This term however only
accounts for the contribution to extensional energy associated with an increase in the surface area
of a membrane Another contribution arises from the change in the membrane surface area
projected onto the x1-x2 plane due to non-uniform displacements perpendicular to the plane of
the membrane in the x3 direction This can be seen from the following one-dimensional
example
Consider a membrane tethered at both ends that exhibits a constant surface tension N
when deformed into a new state defined by u3(x1) Locally the change in length of a segment
initially of length dx is
20
CHAPTER 21 CELL MEMBRANE MECHANICS AND ADHESION copyRD Kamm 4615
( 2 2 dx ) + ( du3 ) minus dx = [1 du3 dx1)2]
12 2 2 + ( dx 1 1
1 minus dx1 asymp (1+ 2 (du3 dx1) )dx1 minus dx1 = 2 (du3 dx ) dx(236) 1 1
[see also Figs 64 and 65 in Boal] The strain is then the change in length over the initial length or
2ε11 = 1
2 (du3 dx1) (237) and the energy per unit area associated with this change in length under a constant tension N is
2 ε N ⎛ partu ⎞
U0h = N1int dε =0
⎜ 3
⎟ (238)2 ⎝ partx1 ⎠
which extending to two dimensions can be written
⎡⎛ ⎞ 2 ⎛ 2⎤ N partu3 partu ⎞U ⎢⎜ ⎟ + ⎜ 3
0h = ⎟ ⎥ (239)2 ⎢⎝ partx1 ⎠ ⎝ partx⎣ 2 ⎠ ⎦ ⎥
It is important to recognize that we now have two expressions associated with the energy of
extension and they represent two distinct phenomena The first [eqn (333)] describes the
energy associated with true areal expansion that is a change in the effective spacing between the
molecules comprising the lipid bilayer The second [eqn (339)] corresponds to the energy
change due to undulations in a membrane with constant intermolecular spacing To see the
distinction between the two consider an experiment in which the pressure inside a cell or a lipid
vesicle is gradually increased by aspiration into a micropipette Initially the projected area of
the membrane rises rapidly with a relatively small increase in membrane tension corresponding
to the smoothing of undulations caused by thermal excitation of the membrane This is followed
at higher tensions by a transition to a regime in which the membrane exhibits a much greater
stiffness corresponding to the situation in which the thermally-induced undulations have been
smoothed out and the true membrane surface area now must increase In the absence of thermal
fluctuations eg at zero temperature only this second regime would be observed [see also
figure from Boal]
Energy of shear deformation Next examine the energy per unit area associated with shear
deformation in the plane of the membrane which can be expressed in the form
2
1 1 2 Gh ⎛ part u1 partu2 ⎞
U0h = 2 hτ12ε12 = 2 hGε12 = ⎜ + ⎟ (240)2 ⎝ partx2 partx1 ⎠
21
CHAPTER 21 CELL MEMBRANE MECHANICS AND ADHESION copyRD Kamm 4615
where we have utilized eqns (28) and (29) to obtain a form similar to that of eqn (234) for
extensional deformation
[See Boal for an alternative form in terms of membrane curvature He also gives a nice
description of bending in bilayer membranes]
Bending energy The contribution due to bending energy is somewhat more difficult to derive
First recognize that only those normal stresses that vary with x3 contribute to the bending
energy that is those contributed by the σ stresses in eqn (213) With this in mind we can
write the expression for the total elastic energy due to bending as
1 1 U = intintint ⎧ [ 2
⎨ ( ) 2 ⎫ σ 1 prime + ( )2
σ 2 prime + 2νσ 1 primeσ prime 2 ] + ( )τ 12 prime ⎬dx (241)⎩2E 2G ⎭ 1dx2dx3
Substituting for the stresses and strains from eqns (215)-(217) this can be re-cast in the
following form
⎧ 2 ⎫K ⎛ 2
part 2 2u ⎡ 2 u part ⎞ part 2u 2 part 2 ⎤ part u ⎛ u ⎞
U = B intint ⎜ 3 3 ⎟ 1 minus ν ) 3 3 2 minus ⎜ 3 ⎟⎨ 2 + 2 minus 2( 2 ⎬dx1dx (242)⎢ ⎥2 ⎝ partx1 partx2 ⎠ partx1 partx2 ⎝ partx1partx2 ⎠ 2
⎩ ⎣ ⎦ ⎭
It can be shown ((Meleard 1998)) that the integral of the second term in the integrand above [the
one multiplied by 2(1-ν)] is globally constant under deformation if the membrane remains a
closed surface with no holes Assuming that to be the case we obtain for the total bending strain
energy
KB ⎛
2 part 2u part 2
= intint ⎜ 3 u2 + 3 ⎞
U ⎟2 dx1dx2 + const (243)
2 ⎝ partx1 partx2 ⎠
Since we typically are concerned with changes in energy the constant will arbitrarily be set to
zero Thus the energy per unit area or energy density of bending deformations can be written
2 K ⎛ part 2 part 2 ⎞
0 = B u⎜
3 uU h 2 + 3
2 ⎟ (244)2 ⎝ partx1 partx2 ⎠
Note that the term in parentheses is proportional to the mean curvature of the surface Often the
surface has a natural mean curvature in the unstressed state If that curvature is c0 the bending
energy expression is modified slightly to the form
22
CHAPTER 21 CELL MEMBRANE MECHANICS AND ADHESION copyRD Kamm 4615
2 K ⎛ part 2 part 2 ⎞
U0 = B u⎜
3 uh 2 + 3
2 minus c0⎟ (245)2 ⎝ partx1 partx2 ⎠
Another common form of this expression is obtained by recognizing that the first two terms in
parentheses represent the linearized form of the sum of the principal curvatures (the largest and
smallest curvatures at a point) denoted c1 and c2 so that eqn (345) can be written
K
U2 B
0h = (c1 + c2 minus c0 ) 2
Although each of these expressions for strain energy density has been derived individually they
of course all contribute in the general situation and are linearly additive In that regard several
points are worthy of note First one can obtain some idea of the relative importance of
extension shear and bending deformations in a given situation simply by comparing their
relative energies just as was done in the last section by comparison of the bending and tension
terms in eqn (226) Not surprisingly the comparison leads to the same expressions we obtained
before for when either bending or tension is dominant Second due to the small shear modulus
of most cell membranes the energy stored in shear deformation can generally be neglected And
finally a comment is warranted concerning the energy due to tension Various simplifying
assumptions can be made depending on the cell type being considered and the nature of the
stress to which the cell (or vesicle) is being subjected but generally the lipid bilayer can be
considered to be of constant area unless it experiences grossly non-physiologic levels of stress
Thus the main contribution to extensional energy is that represented by eqn (339) associated
with the smoothing of membrane undulations
Other Factors Influencing Membrane Motion
Thermal fluctuations Biological membranes of all types can be seen to fluctuate due to
Brownian motion of the surrounding molecules if viewed with sufficient resolution These
fluctuations are in fact often used to measure the membrane bending stiffness since thermal
effects are seen as motions in the membrane of relatively long wavelength favoring bending
energies as compared to extensional or shear (see eqn (223)) To account for these effects it is
customary to add a time-dependent forcing term to eqn (223) η(t) the magnitude of which
scales with kBT We analyze thermal motions later and use them as a means of determining the
bending stiffness of a membrane
23
CHAPTER 21 CELL MEMBRANE MECHANICS AND ADHESION copyRD Kamm 4615
Damping due to external fluids When a membrane fluctuates in a direction perpendicular to its
plane velocities are induced in the surrounding fluids and due to the resulting shear stresses
energy is dissipated These motions are extremely complex to model precisely and depend on
both the nature of the surrounding medium (its rheological properties) and the bounding
geometry In lieu of a complete and rigorous analysis a local damping term is sometimes added
to the membrane force balance equation (eqn (223)) to approximate these effects Its form is
based on the presumption that externally induced velocities scale with the velocity of the wall
and that shear forces in the external fluid scale with the induced shear rates and velocities
Accordingly eqn (223) is modified by the addition of a term of the form μm partu3 partt where μμ is
the effective viscosity of the external fluid The equation that results from the addition of both
thermal forcing and external fluid viscosity is
partu ⎛ part 43 u 4
3 part u part+ 3 part 4u ⎞ part ⎛ ⎞ part ⎛ ⎞
B ⎜ 3 partu u
μm K 4 + 2 2 2 + 4 ⎟ minus ⎜ N3
⎟ minus part 1 ⎜ N
3
partt ⎝ x partx partx partx ⎠ partx ⎝ partx ⎠ partx ⎝ 2 ⎟ = p + η(t) (246)1 1 2 2 1 1 2 partx2 ⎠
An expression of similar form for a linear polymer is sometimes referred to as the Rouse
equation
314 Measurements of Membrane Elastic Parameters
Although the analogy has limitations it is useful at the onset to think of the cell as a fluid-filled
balloon or bag Just as in the case of a balloon the elastic properties of the membrane can be
determined by any experiment in which the membrane tension changes while its area is
measured In the simple example of a spherical balloon tension can be computed from the
inflating pressure and the measured radius the latter also yielding the surface area Ignoring for
now the thermal-induced fluctuations in a real cell membrane (ie assuming the cell to be at zero
temperature) the calculations become particularly simple Furthermore we will consider cells
for which the cytoplasm can be considered to fluid-like having no elasticity We return to
address both issues shortly
Osmotic swelling
Perhaps the simplest method to inflate the cell and measure the membrane elastic properties is to
cause the cell to swell by changing the osmolarity of the external fluid and simultaneously
monitoring the change in cell volume The change in transmembrane pressure mirrors the
24
CHAPTER 21 CELL MEMBRANE MECHANICS AND ADHESION copyRD Kamm 4615
change in osmotic pressure brought about by successive additions of a solute to which the
membrane is impermeable For ions and small molecules the osmotic pressure π can be
calculated from the vant Hoff equation
π = RT sum Ci (247)
i
where Ci are the molar concentrations of all solutes to which the membrane is impermeable For
larger molecules such as proteins their contribution to osmotic pressure is much larger than
indicted by this equation
Consider for example a spherical cell expanded osmotically so that the internal
hydrostatic pressure relative to external pressure is pc Microscopic examination yields a value
for the cell radius Rc Using these values in combination with Laplaces law [eqn (227)] gives
us the tension in this state and eqn (24) provides its relationship to the extensional modulus
p R Δ A
N = c c = Ke (248) 2 A0
The observed change in radius allows calculation of ΔA In practice identification of the reference state at zero pc is problematic due to the presence of thermal fluctuations but if Ke can be assumed constant for relatively small changes in area it is possible to extrapolate back to the zero-stress state from two measurements at elevated pc [Example red blood cell] Micropipet aspiration
One of the first methods used to measure the extensional modulus of the cell membrane involved
drawing a cell slightly deflated into a micropipet simultaneously monitoring the dimensions of
the cell and the pressure in the micropipet (Daily Elson et al 1984) Since on the time scale of
the experiment the volume of the cell could be assumed constant the shape change due to
aspiration of the cell causes increases in both internal pressure and surface tension both of which
are assumed spatially uniform Once the tension is large enough (or the temperature low
enough) to dampen the amplitude of any thermal fluctuations the cell can be treated assuming
that membrane extension is the dominant means by which the pressure drop across the
membrane is balanced [For further discussion on the thermal fluctuations and the relationship
between micropipet pressure and intracellular pressure see Daily and Evans and Rawicz Phys
Rev 1990 See also figure on p 199 of Boal Example the two regimes in membrane stiffness]
For the situation shown in Figxx the cell is drawn into the micropipet to the point at
which the portion of the cell external to the cell is spherical of radius Rc With the assumptions
25
CHAPTER 21 CELL MEMBRANE MECHANICS AND ADHESION copyRD Kamm 4615
stated above the (uniform) pressure within the cell can be related to it surface tension (assumed
uniform) and the radii of curvature of the main body of the cell Rc and the portion inside the
pipet a using Laplaces law [eqn (227)]
pc = 2N Rc = minus Δp + 2N a (249)
where pressures are referenced to the external ambient pressure Reorganizing to solve for
surface tension we obtain
ΔpN = (250)
⎛ 1 1 ⎞ 2⎜ minus ⎟
⎝ a Rc ⎠
The surface area corresponding to a given N is obtained from geometry summing the membrane
surface areas of the cylinder and hemisphere inside the micropipet and the truncated spherical
surface outside yielding for the areal strain the approximate expression
[(a R )2 (a R )3
Δ c minus c cong
]ΔLA
A 2a
Fig xx Micropipet aspiration of a neutrophil
This relationship between N and ΔAA can be used to calculate the area expansion modulus
Eh AK 0
e = = N 2 1( minus ν ) ΔA
where the expression involving Youngrsquos modulus assumes the membrane to be isotropic and
homogeneous The relationship could however be non-linear in that the value of Ke may vary
with the degree of area expansion a linear relationship between N and ΔA yields a constant value for Ke
It is important to note that neither of these approaches osmotic inflation or micropipet aspiration provides us with any information on the bending modulus To be precise bending
26
CHAPTER 21 CELL MEMBRANE MECHANICS AND ADHESION copyRD Kamm 4615
does play a role in the micropipet experiments but the effects are so small as to be negligible and are typically ignored That is not to say that bending is always negligible however as discussed next
Monitoring thermal fluctuations in the membrane
When a cell or lipid vesicle is observed floating free unattached to a substrate it can be seen to
exhibit time-dependent undulations as a result of collisions with the surrounding molecules
undergoing thermal motion In the case of a lipid vesicle with diameter in the range of 10
microns these undulations can be readily observed microscopically In smaller cells such as red
blood cells the motions can be inferred from the flickering phenomenon associated with the light
interference as the cell thickness changes (Zeman Engelhard et al 1990) Since the amplitude of
the membrane undulations depends on the stiffness of the membrane to bending and its surface
tension it is reasonable to expect that measures of this amplitude can be used to infer the
membrane elastic parameters In order to illustrate the method while avoiding some of the
algebraic complexity consider undulations in a flat membrane with significant bending stiffness
and a constant surface tension The relationship between the motion and the elastic properties
can be found by considering the total energy of the membrane obtained by summing the
energies per unit area from eqns (239) and (244) and integrating over the membrane surface
area Am
⎧ 2⎪ K ⎛ 2 2
part 2 u part 2 ⎡ 3 u ⎞
3 N ⎛ partu ⎞ ⎛ int 3 partu ⎞ ⎤⎫
B 3 ⎪
U0hdA = int ⎨ ⎜ 2 + 2 ⎟ + ⎢⎜ ⎟ + ⎜ ⎟ ⎥⎬dA (251) A ⎠ 2
m Am ⎪ 2 ⎝ partx1 partx2 ⎢⎝ partx1 ⎠ ⎝ partx2 ⎠ ⎥⎪ ⎩ ⎣ ⎦⎭
In writing the energy in this form we have omitted the contribution due to shear deformation
consistent with the fluid-like character of a pure lipid bilayer and have taken the surface tension
to be uniform during the deformation In this example membrane surface area changes only as a
result of fluctuations from the mean [u3(xxx2) = 0] configuration that is we now ignore the
contribution due to changes in intermolecular spacing and only consider changes in the area
projected onto the x1-x2 plane
It is convenient to use the method of Fourier transforms to represent the undulations of a
membrane normal to the x1-x2 plane which in two-dimensions leads to [see also class notes on
bending of cytoskeletal filaments alternatively use Fourier series representation]
A A
u3 (x) = u3 (x1 x2 ) = 2 intexp(iq sdot x)b(q)dq =
2 int exp(iq 4 1x1)exp(iq2 x2 )b(q1q2 )dq1dq
π 4π 2
(252)
27
CHAPTER 21 CELL MEMBRANE MECHANICS AND ADHESION copyRD Kamm 4615
where qα = 2π λα is the wavenumber of the particular mode and b(q) is the continuous analogue of the discrete coefficients that multiply each mode in a Fourier series representation
Here the algebra gets complicated so only the results of the analysis will be presented however
those wishing to see a more complete derivation should see (Boal Mechanics of the Cell
Cambridge University Press 2002) Introducing eqn (352) into (351) yields
1 ⎛ A ⎞2
int U q 40hdA = ⎜ ⎟ int (
KB + Nq2 )b(q)b(q)dq (253)2 2 ⎝ π ⎠
where b(q) is the complex conjugate of b(q) Now we invoke a previous result that at equilibrium energy is equally distributed among the various modes and that each mode has an
average energy of kBT2 Taking the ensemble average of eqn (353) and equating the energy of
each mode represented in the result to kBT2 (by the equipartition theorem) leads to
k Aq)b q) = BT
b( (K q4 2 (254)
B + Nq
This is a useful result in itself demonstrating that all modes tend to be suppressed as temperature
falls or as bending stiffness or surface tension rise In addition it shows the tendency for higher
modes to be of smaller amplitude But this equation has further value in that it can be used to
obtain a direct expression for the change in apparent area of a membrane as tension increases
Consider the true surface area of a membrane A represented as the sum of its projected
area and the additional area associated with thermally-induced undulations
⎡ 1 ⎛ 2⎤u ⎞ 2 part ⎛ partu ⎞
A = int dx + ⎢ 3 3 2
int ⎜ ⎢⎝ partx 2 ⎟ + ⎜
⎠ ⎝ partx 2 ⎟ ⎥dx (255)⎠ ⎥
⎣ 1 2 ⎦
Isolating the term representing the area reduction due to thermal fluctuations expressing u3 in
terms of its Fourier transform and taking the ensemble average of the result leads to
1 ⎛ A ⎞2
A minus int dx = ⎜ ⎟ int q 2 b(q)b(q) dq (256)2 ⎝ 2π ⎠
Combing eqn (254) from above with this expression yields
28
CHAPTER 21 CELL MEMBRANE MECHANICS AND ADHESION copyRD Kamm 4615
A minus int dx
kBT dq kBT dq2
= A 8π 2 int =
N int (257)
+ KBq 2 8π 2 N + KBq 2
where in writing the last term we have introduced the relations dq = dq2dθ 2 and int dθ = 2π By a simple substitution z = q2 + (N KB )the integral can be evaluated We do so however
between specified limits on the assumptions that the range of possible wavenumbers is restricted
by the size of the membrane on one hand (q = (πA12)) and the distance between individual lipid molecules on the other (q = πlm) Integrating between these limits results in
⎛ π 2 N ⎞
int dx 2 +A ⎜ ⎟ minus k T l K
= B ln⎜ m B ⎟ (258)A 8πKB ⎜ π 2 N ⎟
⎜ + ⎟ ⎝ A KB ⎠
If we use the area reduction at zero tension as a reference and increase the area from that
condition by progressively increasing membrane tension as in a typical experiment we finally
obtain an expression relating the change in area to the change in tension
⎛ NA ⎞ 1 + A dx A dx ΔA minus int minus ⎟ k ⎛ NA
int k ⎜equiv minus = BT π 2 K
ln ⎜ B T ⎞ 2 ⎟ cong B ln 1 + (259)
Nl ⎜ ⎟A A A 8π KB ⎜ 1 + m ⎟ 8π KB ⎝ π 2 KB ⎠ N = 0 N ⎜ 2 ⎟⎝ π K ⎠ B
where we have used the assumption supported by typical values found from different
experiments that (Nl2 m ) (π 2KB ) ltlt 1
You should recall that this solution was obtained on the assumption that the actual area
of the membrane remained constant and that the reduction in projected or apparent area resulted
from the undulations being progressively smoothed out Once the undulations are eliminated
the only means by which the projected area of the membrane can further increase is by an
increase in the inter-molecular spacing ndash an increase in the actual membrane area When this
occurs we expect to see a transition to the behavior discussed at the beginning of this chapter a
result expressed as
29
CHAPTER 21 CELL MEMBRANE MECHANICS AND ADHESION copyRD Kamm 4615
Fig yy Plots of tension vs normalized surface area for lipid vesicles of different composition Evans amp Rawicz 1990
ΔA N = (260)
A Ke
Thus we have two limiting predictions one for low tensions eqn (259) and another for high
tensions eqn (260) and the transition from one behavior to the other should occur when the
two expressions for ΔAA are of the same magnitude This is supported by experiment (Fig yy) and the results in the two regimes provide a means for estimating the two moduli Ke and KB
30
CHAPTER 21 CELL MEMBRANE MECHANICS AND ADHESION copyRD Kamm 4615
Before leaving this analysis there is one further result that is useful to state although the
derivation is again somewhat involved Once we have the solution for the undulations at a
given level of tension and for given membrane properties the ensemble average displacement
normal to the plane of the membrane can also be computed with the result
⎞
u2 k ⎛= BT NA
3 ln ⎜ 1+ ⎟ (261)4πN ⎝ π 2KB ⎠
Again this supports our intuition that the undulations will be suppressed at low temperature or
high tension And in the limit as N rarr 0 a binomial expansion of the natural log term shows that
the effect of tension drops out and the magnitude of the undulations varies inversely with the
bending stiffness
315 Membrane Fluid Mechanics
Early studies of protein diffusion notably the work of Saffman (Saffman 1976)
examined protein diffusion using an approach akin to that of Einstein in three dimensional space
thereby reducing the problem to one of solving for the mobility b in the equation for diffusivity
D = kBTb (262)
Calculation of the mobility is influenced by the viscous drag on the portion of the protein within
the membrane but also on to the intra- and extracellular domains as well The solution of
interest here is the one applicable in the limit of small μeμm where μe and μm are the external and
membrane viscosities respectively leading to
kBT ⎛ hμm⎞
D = ⎜minusγ + ln ⎟ (263)4πμmh ⎝ aμ e ⎠
where h is the membrane thickness a the radius of the protein (assumed cylindrical) and γ is
Eulers constant (=05772) Membrane viscosity has been estimated from lipid diffusion to be
~2 poise (McCloskey and Poo 1984) When finite mobility is achieved as a result of a finite
domain as for example a circle of radius R the corresponding result is
31
CHAPTER 21 CELL MEMBRANE MECHANICS AND ADHESION copyRD Kamm 4615
k ⎛ 1 D = BT R ⎞ log minus (264)
4πμh ⎝ a 2 ⎠
While this represents a useful point of departure measurements of lateral diffusion in a
membrane have demonstrated a more complex behavior Fluorescence recovery after
photobleaching (FRAP) has enabled the direct tracking of membrane proteins labeled with
fluorescent antibodies More recently single particle tracking methods have been developed
using colloidal gold or a fluorescent particle in conjunction with digital microscopy as well as
controlled movements using microbeads manipulated by an optical trap
From experiments such as these a new picture has emerged While the lateral diffusion
of lipids and a small fraction of trans-membrane proteins satisfy the general form of Saffmans
predictions the predicted diffusivity is greater than that observed experimentally and agrees with
experiments only when a membrane viscosity of 100 poise is used This might be due to the
presence of other proteins in the membrane (Kucik Elson et al 1999) Experiments also show
that many proteins appear to diffuse freely only in small domains typically measuring from 200shy
600 nm remaining confined to these domains for periods on the order of tens of seconds To
explain this behavior the membrane skeleton fence model was proposed (Kusumi Sako et al
1993) in which a membrane-associated matrix constrains the movement of proteins outside of
the domains defined by the matrix filaments Diffusion beyond these barrier filaments can occur
either as a result of random thermal motions of the transmembrane protein matrix filaments or
both or by transient breaks in the filaments Confinement of proteins may play an important role
in rapid and selective signaling Rapid directed motion of membrane-associated proteins has
also been observed and is likely due to active transport by an intracellular actin- or microtubule-
based motor
316 Cell Adhesion
This section deals with how cells adhere to their surroundings and through these sites of
adhesion how they interact with the external world We begin by summarizing the different
types of adhesion their functions and the molecules involved Next we provide a brief
description of the adhesion complexes found in cells and the role of each type Then the
theories that provide a quantitative description of adhesion between single receptor-ligand pairs
are reviewed in the context of the material presented in Chapter xx including the role of thermal
fluctuations Through these theoretical models both the static and dynamic states of adhesion
can be explored for single molecule pairs then for adherent cells Next we develop the different
32
CHAPTER 21 CELL MEMBRANE MECHANICS AND ADHESION copyRD Kamm 4615
approaches that are used to study the adhesion of cells based either on thermodynamics or
mechanics Methods for the measurement of adhesion strength are described providing
estimates for the force that a cell can exert on its surroundings Various examples will be
presented but the adherence of leukocytes to the endothelium and the role of adhesion in cell
migration will receive special attention
Functions of adhesion
Adhesion has been found to be an essential process necessary for a variety of fundamental
cellular functions
bull Structural integrity Adhesion helps to maintain the overall structural integrity of the
tissue in muscle for example it provides the means of force transmission from the cells
to the surrounding matrix to allow contraction In non-contractile cells it still provides
the needed mechanical coupling to the surrounding tissue necessary for a variety of
cellular functions
bull External sensing Adhesion provides a means by which the cell can sense and
subsequently respond to its surroundings Forces transmitted directly to the cell
membrane or to the cytoskeleton via transmembrane proteins may trigger a variety of
biochemical reactions within the cell as we shall see later in Chapter 33
bull Migration Cell-matrix adhesion is an essential element in cell migration a cell propels
its way through tissue or along a surface through a process involving adhesion
contraction and release also described in Chapter 33
bull Regulation of transport Sites of cell-cell adhesion are often important in the regulation
of transport across a cell layer such as in the case of an epithelium or endothelium
bull Communication Sites of mechanical coupling often provide a means of cell-cell
communication as in the case of gap junctions which offer a pathway for the diffusion
of ions and small molecules between adjacent cells
Adhesion molecules
Cells adhere to their surroundings or to an artificial substrate via a wide variety of different
proteins that can be classified into five major families integrins selectins cadherins
immunoglobulins and transmembrane proteoglycans (Table 1) In terms of their mechanism of
attachment to other cells or the external matrix these can be classified as either homophillic ndash
binding to like molecules heterophillic ndash binding to unlike molecules or those that bind to other
cells through an extracellular linker molecule
Integrins one of the largest class of adhesion molecules are primarily used to attach cells
to the extracellular matrix or the basal lamina but are also present in some cell-cell adhesion
33
CHAPTER 21 CELL MEMBRANE MECHANICS AND ADHESION copyRD Kamm 4615
complexes They typically bind to the matrix via the RGD amino acid sequence (arginine
glycine aspartic acid) but can also contain other binding motifs Integrins are heterodimers in
that they always contain an α and a β subunit with the different isoforms determining the specific ligand to which the integrin binds Two specific types of adhesion focal adhesions and hemidesmosomes often contain integrins and the attachments they make can at times be stable but at other times transient so as for example to mediate cell migration The force of adhesion of a single integrin-ligand bond has been measured using atomic force microscopy and found to be in the range of 30-100 pN (Lehenkari and Horton 1999) with a relatively low binding affinity in the range of K ~ 10-6
D to 10-8 molliter By comparison typical cell-surface receptors bind with an affinity in the range of 10-9 to 10-11 molliter Integrins also play an important role in signaling since extracellular integrin binding is known to influence cytoskeletal morphology as well as the state of cell differentiation Adhesion molecules in the selectin family also tend to form transient bonds and are important in leukocyte adhesion and extravasation the migration of the leukocyte through the endothelium and into the tissue Consequently they tend to be found in cells of the circulation and are present both in leukocytes and endothelial cells and are instrumental in adhesion between these two cell-types during leukocyte rolling
Family Location andor Ligands Comments
function recognized
integrins focal adhesions (E) fibronectin relatively low
hemi-desmosomes collagen laminin affinities
leukocyte immunoglobulins (KD~ 10-6-10-8
(spreading) (I) actin filaments molliter)
adhesion primarily
cell-matrix adhesion
but also in some
cell-cell adhesions
selectins circulating cells and carbohydrates require Ca2+
endothelial cells
rolling adhesion
Ig superfamily important in integrins
(immunoglobulin) immune response homophillic
cadherens adherens junctions (E) homophillic require Ca2+
desmosomes (I) actin
34
CHAPTER 21 CELL MEMBRANE MECHANICS AND ADHESION copyRD Kamm 4615
filaments
intermediate
filaments
transmembrane fibroblasts (E) collagen bind various
proteoglycans epithelial cells fibronectin growth factors
(I) actin such as FGF
filaments
heterophillic
Table 1 Cell adhesion molecules and their characteristics
While both integrin and selectin binding is mediated by Ca2+ adhesion via the
immunoglobulin (Ig) superfamily of proteins is Ca2+ independent Some of the most prominent members of this family are the N-CAMs (Neural cell adhesion molecules) and ICAMs (Intracellular cell adhesion molecules) These tend to undergo homophillic bonding but some also bind to members of the integrin family
Cadherens are often expressed in the same cells as the selectins but form much stronger bonds and therefore play an important role in maintaining cell integrity Because of these attributes cadherens are the primary adhesion proteins in desmosomes and adherens junctions the major structural contacts cells form with other cells or the basil lamina These also form homophillic bonds by a Ca2+ dependent mechanism and mediate selective bonding between adjacent cells Cadherens are relatively short as compared to other adhesion molecules being
about 700-750 amino acid residues in length
Types of adhesion complexes
Cells have developed a variety of specialized adhesion complexes each utilizing one or more of
the adhesion molecules of Table 1 and each serving a specific purpose Typically the cell-cell or
cell-surface spacing is in the range of 10-20 nm but this is highly variable ranging from less than
1 nm when controlling transport to over 100 nm in regions where tight control is unnecessary
Below we describe the different types of junctions and where important for function their
mechanical characteristics
Gap junctions Cells need to communicate with their neighbors for a variety of reasons For
example cardiac myocytes transmit signals from cell to cell in order to maintain a synchronous
35
CHAPTER 21 CELL MEMBRANE MECHANICS AND ADHESION copyRD Kamm 4615
wave of contraction This is typically accomplished by providing a pathway for ions and small
signaling molecules between cells called gap junctions (Fig 3110) These minute channels are
typically comprised of a collection of six connexin proteins that cluster together in cylindrical
fashion forming a minute channel that passes molecules and ions less than about 1200 to 2000
MW (15-2 nm) Transport through these channels is regulated and their permeability drops in
the presence of high Ca2+ concentration as when a cell membrane is ruptured or with low pH
Cyclic AMP acting as a second messenger can be exchanged between cells therefore gap
junctions provide a metabolic linkage between neighboring cells and provide a means by which
hormonal stimulation of just one cell can be transmitted to others
Adherens junctions Adherens junctions are belt-like structures that can be though of as the
structural weld that holds two cells together (Fig 3110) Because of their structural role
these junctions formed by homophilic bonding between proteins in the cadheren family are
anchored securely again via the adaptor proteins α β γ-catenin to the cytoskeleton
Desmosomes and Hemidesmosomes If the adherens junctions are the continuous welds between
cells desmosomes are the spot welds Again these serve primarily a structural purpose
joining two neighboring cells via a complex consisting of a dense plaque on the intracellular
sides of both cells extending 15-20 nm into the cell and consisting of a variety of proteins that
attach to keratin filaments part of the intermediate filament network Hemidesmosomes have
similar intracellular structure but attach instead to the basal laminae Based on their different
extracellular attachment sites desmosomes typically link to other cells via cadherens whereas
hemidesmosomes adhere via a type of integrin Both are commonly found in epithelial cells
36
CHAPTER 21 CELL MEMBRANE MECHANICS AND ADHESION copyRD Kamm 4615
Fig 3110 Schematic showing the different types of cell junctions present in an epithelial cell as found in the small intestine Tight junctions near the apical surface essentially prevent the passage of all molecules The spot desmosomes and adherens junctions provide for cell-cell anchoring and the hemidesmosomes for anchoring to the basal lamina Gap junctions provide a means for communication between neighboring cells [Reproduced from Lodish et al Molecular Cell Biology 2000]
Junction type Function Extracellular or Intracellular
adjacent cell attachment
attachment
Adherens structural cell-cell or cell- ECM proteins or actin filaments
matrix cadherins in
adjacent cell
Desmosome structural cell-cell cadherin intermediate
filaments
Hemidesmosome structural cell-matrix basal lamina via intermediate
integrins filaments
Focal adhesions structural cell-matrix ECM proteins actin filaments
via integrins
Tight junction regulate transport between homophillic binding between the
cells and along cell transmembrane proteins occludin or
37
CHAPTER 21 CELL MEMBRANE MECHANICS AND ADHESION copyRD Kamm 4615
membrane claudins
Gap junctions cell-cell communication channels formed by connexin
via ion and small molecule subunits
exchange
Table 2 Adhesion complexes
Focal adhesions A second means by which cells attach to the extracellular matrix is through
focal adhesions These serve a similar function to the hemidesmosomes and share a common
linkage via integrins to the ECM but are attached on the intracellular side instead to the actin
filaments of the cytoskeleton Actin filaments converge at the site of focal adhesions forming
stress fibers strong actin bundles that attach to the β-subunit of the integrins via adapter
proteins such as actinin vinculin and talin Focal adhesions are instrumental in cell migration
and for this purpose need to be easily formed and disrupted as the cell moves forward Release
or de-adhesion of cells is often mediated by a class of peptides called dis-integrins that
competitively bind to the RGD site used by integrins to attach to a variety of matrix molecules
Tight junctions Control of transport is generally mediated by tight junctions that form an
intricate network of seams between two cells (Fig 3111) As their name implies these are the
tightest of the cell-cell junctions and the gaps they leave are often small enough to exclude even
the smallest ions and molecules Formed by homophillic binding between the transmembrane
proteins occluding and claudins tight junctions allow epithelial cells to perform their critical role
in transepithelial transport and provide for maintenance of differences in concentration between
the apical and basal surfaces of these cells Since occludins are not capable of forming rigid
structural bonds with the cytoskeleton they are most often associated in a junctional complex
with adherens junctions or desmosomes that fulfill the structural needs of attachment
38
CHAPTER 21 CELL MEMBRANE MECHANICS AND ADHESION copyRD Kamm 4615
Fig 3111 Tight junctions in an epithelial cell shown schematically (a) in a freeze fracture replica (b) and in a transmission electron micrograph (c) [Reproduced from Alberts et al 1994]
Fig 3112 Two types of bond that attach a cell to the extracellular matrix by means of clusters of integrins On the extracellular side integrins bind to the matrix proteins fibronectin and laminin Inside the cell they attach to the cytoskeleton via adaptor proteins to either actin filaments (focal adhesions) or intermediate filaments (hemidesmosomes) [Reproduced from Lodish et al Molecular Cell Biolology 2000]
Non-specific binding
Cells can adhere to their surroundings by either non-specific or receptor-ligand (specific)
bonding Though both mechanisms are likely active in most situations as we will see receptorshy
39
CHAPTER 21 CELL MEMBRANE MECHANICS AND ADHESION copyRD Kamm 4615
ligand bonding is the stronger of the two by a considerable margin and is therefore the most
relevant biologically In situations for which either the receptors or their ligands are not present
however such as might be the case in certain in vitro experiments non-specific binding can be
important as well
There are essentially three major forms of non-specific attractions to consider
bull Van der Waals ndash These attractive forces arise due to charge interactions in polar
molecules They tend to dominate among the non-specific mechanisms at
intermediate distances around 20-25 nm [see Boal]
bull Electrostatic ndash These interactions can be either attractive or repulsive depending
on the sign of the surface charges and are particularly important during the
approach of two cells since the glycocalyx has a high negative charge density
bull Steric ndash These forces arise due to the steric exclusion of two molecules as they are
brought into close contact In the case of cell-cell interactions steric repulsion is
due to the compression of the two glycocalyx layers and the tendency to resist
compression resulting from osmotic effects and the elasticity of the layer Steric
forces tend to dominate for small separation distances lt 10 nm
In combination these effects combine to produce a net attractive force per unit area of
about 100 Pa at a separation distance of about 25 nm
Adhesion by means of receptor-ligand binding
We can use the analysis of Chapter xx to estimate the strength of a receptor-ligand bond and
based on typical values for bond density calculate the corresponding strength of adhesion
between two cells or between a cell and a surface Recall that the application of force to a
receptor-ligand bond modifies the dissociation rate constant for the binding reaction This effect
can be modeled in several ways but the result obtained by Bell ((Bell 1978)) suggests the
following exponential form for the dissociation rate
0 ⎛ γf ⎞ 0 ⎛ γσ ⎞ kminus = kminus exp⎜ ⎟ = kminus exp⎜ ⎟ (265)
⎝ kBT ⎠ ⎝ NC kBT ⎠
where k0minus is the unforced dissociation rate constant γ is a factor with the units of length that
corresponds roughly with the distance separating the bonded pair at equilibrium NC is the concentration of bonded complex and σ is the average bond force per unit area To determine
40
CHAPTER 21 CELL MEMBRANE MECHANICS AND ADHESION copyRD Kamm 4615
the rate of change of the concentration of bonded pairs one must solve the following rate equation describing the competition between bond formation (first term) and destruction (second term)
dNC ⎛ γσ ⎞
cong k+ (NR minus NC )(NL ) minus kminus NC = k+ (N minus )( 0R NC NL ) minus kminus NC exp⎜ ⎟ (266)
dt ⎝ NC kBT ⎠
where NR and NL are the concentrations of receptors and ligands respectively and we have
assumed that NCltltNL and that all bonds are stressed equally At equilibrium dNCdt=0 and if
the force applied to detach the cell (equal to the average bond stress σ) is increased
incrementally from zero NC will progressively fall to a new equilibrium value At sufficiently
high levels of force however increasing σ further eventually gives rise to a situation in which equilibrium can no longer be achieved through a reduction in NC At that point NC tends toward zero and the cell separates from the surface to which it was attached It can be shown that this
occurs when (Bell 1978)
k 0
α c exp(α + c + 1) = N
k 0 L (267)minus
σ
where α minγ c equiv and σmin is the minimum stress needed to cause detachment For a wide
NRkBT
range of conditions eqn (267) has the approximate solution
⎛ k0 + ⎞
α c cong 07 ln L (268)⎜ 0 N ⎟⎝ kminus ⎠
so that the critical stress for detachment can be expressed as
N 0
σ cong 07 C kBT ⎛ k ⎞ ln⎜
+ min N ⎟ (269)
γ ⎝ k0 L minus ⎠
where NC is determined from setting eqn (266) to zero under these critical conditions
Thermodynamic approach to cell adhesion
Although we focus here on the mechanical aspects of cell adhesion this process can also be
viewed from a thermodynamic perspective In this approach adhesion is considered in terms of
the change in energy specifically the Gibbs free energy G associated with all the individual
receptor-ligand interactions as well as the various non-specific forces of attraction or repulsion
The adhesion of a cell to a given surface then can be viewed as an equilibrium state determined
41
CHAPTER 21 CELL MEMBRANE MECHANICS AND ADHESION copyRD Kamm 4615
by minimization of the free energy If in undergoing a transition from a free state to an adherent
state the system represented by the cell and surface experiences a reduction in free energy ie
ΔGlt0 then adhesion will occur and the equilibrium state of adhesion will be determined by that with the minimum in free energy or the largest value of -ΔG While this approach ignores
many of the subtleties of the interactions and like the analysis above assumes that all receptorshy
ligand interactions are identical from an energetic point of view it is useful in providing some
simple insights as seen in the next two examples
Example Comparison of specific and non-specific adhesive forces Non-specific bonding due
to the combined effects of van der Waals electrostatic and steric forces result in an attractive
stress of approximately 100 Pa Receptor-ligand bonding give rise to forces that can be
estimated from the change in free energy f ~ to 4x10⁻⁴ dynbond = 9x10-11 to 4x10⁻⁹ ΔGr~9x10⁻⁶ Nbond where f is the force required to break the bond and r is a measure of the distance the bond stretches before it breaks Using a typical density of the receptor-ligand complex NC of ~1012-1015 bondsm2 gives a total bond stress of N 1
C x f ~ 9 x 10 to 4x10⁶ Pa The above kinetic approach to estimating bond strength [eqn (269)] gives a value approximately half of that from this equilibrium approach In either case however the conclusion remains the same non-specific binding can under certain circumstances be important since it is comparable to the lowest estimates of receptor-ligand-mediated bond strength but not surprisingly the latter is quite likely to dominate in nearly all practical situations
Example JKR theory for the equilibrium area of adhesion between a cell and substrate
It is well known that cells tend to take on a more flattened shape as the substrate to which they
are attached becomes more strongly adhesive either by coating with a more attractive ligand or
by increasing the concentration of ligand bound to the substrate Conversely less adhesive cells
round up and become more spherical These observations can be explained with the help of a
simple scaling analysis on the assumptions of small deformation of a linear elastic cell
Let the cell be modeled as a homogeneous elastic sphere with elastic modulus E and
initial radius R (Fig 3113) It is then brought into contact with a surface to which it adheres
As the cell adheres it attains a lower energy state characterized by an adhesion energy per unit
area J Formation of a flat adhesion surface however requires deformation within the elastic
cell and an associated increase in the stored elastic energy In Chapter 31 we showed that the
stored elastic energy per unit volume can be written
UE asymp int τεdV asymp int 1 2 Eε 2dV (270)
Vc Vc
42
CHAPTER 21 CELL MEMBRANE MECHANICS AND ADHESION copyRD Kamm 4615
Strain inside the cell can be approximated as the displacement of the cell surface δ divided by the characteristic distance within the cell to which the deformations penetrate a distance that scales with the lateral extent of the contact region 2a so that ε prop δ a where it can easily be shown from the geometry that a 2 asymp 2δR so that ε prop δ R Combining and dropping all numerical constants we obtain the following scaling approximation
δUE prop E ( )δR
3 2 (271)R
An expression for the total energy of the system then can be written
U prop minusJa2 + Eε2a3 prop JδR + Eδ 5 2R1 2 (272) The equilibrium state corresponds to the value of δ having the minimum energy obtain from
partU prop minusJR + Eδ 3 2R1 2 (273)
partδ so that
23 1 3 ⎛ JR12 ⎞ ⎛ JR2 ⎞
δ prop ⎜ ⎟ and a prop ⎜ ⎟ (274)⎝ E ⎠ ⎝ E ⎠
The exact solution to this problem yields the result
⎡ ) 1 3 2 1( minusν 2 ⎤ 9πJR
a = ⎢ ⎥ (275)⎢ 2E ⎥⎣ ⎦
43
CHAPTER 21 CELL MEMBRANE MECHANICS AND ADHESION copyRD Kamm 4615
Elastic modulus E adhesion energy per unit area J
2a
Fig 3113 Experiments to determine the contact area of an iminobiotin functionalized agarosebead on a glass coverslip in water Top Schematic of adherent bead Bottom Results for a range of bead radii Solid line is a fit to the date which obeys the power law a prop R23 consistent with the prediction of JKR theory eqn(276) [Reproduced from (Moy Jiao et al 1999)] This can be compared to the result obtained from a more rigorous analysis
⎡9πJR 2(1minus ν 2 ) 13 ⎤
a = ⎢ ⎥ (276)2E⎢ ⎣ ⎥⎦
and to experimental data obtained from spherical beads made from a 4 agarose gel (Fig 3113)
Models for receptor-mediated adhesion
In Chapter x and in the preceding text we discussed the energetics of bond formation and release
as well as the effect of applied force in altering the energy landscape of the bonded pair and
thereby the rate constants for bond kinetics That analysis has obvious implications to the
44
CHAPTER 21 CELL MEMBRANE MECHANICS AND ADHESION copyRD Kamm 4615
adhesion of cells to substrates the surrounding extracellular matrix and other cells Here we
extend that analysis in the specific case of whole cell adhesion In doing so it will be important
to consider such factors as the distribution type and density of receptor-ligand bonds or
potential bonds and the elastic properties of the structures to which they are anchored On the
intracellular side this involves the series of couplings that link the receptor to the cell In the
simplest case this might simply be a link to the lipid bilayer if the receptor has no intracellular
connections More typically especially for couplings with a structural role it involves a series
of proteins ultimately linking the receptor to the cytoskeleton
The typical setting in vivo is one in which cells adhere to other cells or to the extracellular
matrix Adhesions are more easily probed however through in vitro experiments (described
below) where cell adhesion more often occurs to an artificial substrate mediated through one of
several extracellular proteins that are used to coat the surface Generally either collagen or
fibronectin is used Cells are often adhered to these substrates but to produce a more controlled
environment rigid beads are sometimes coated with the appropriate receptors so that one specific
receptor-ligand interaction can be probed While these systems are useful as models of certain
adhesion phenomena it is important to recognize in the interpretation of these experiments that
when bound to a rigid substrate or bead the binding proteins cannot freely diffuse as they would
in a more natural environment In particular the formation of focal adhesions would not occur in
bead-substrate experiments because the receptors would be constrained from aggregating
It is instructive to begin this discussion with a consideration of a single adhesion bond
for example one linking the actin matrix of the cytoskeleton to a β1 integrin and the integrin
receptor binding to the extracellular matrix beyond the cell membrane (Fig 3114) If the bond
is stressed as for example if the cell experiences a force relative to the ECM it will at first
stretch an amount dictated by the level of force in the bond and the stiffness of the complex
Each bond as well as each protein in the bond complex can be thought of as having a certain
stiffness giving rise to a picture in which several springs are considered connected in series
Forces acting on the adhesion complex are transmitted via this series of bonded proteins between
the CSK and the ECM producing local deformations and stresses in the corresponding matrices
that decay with distance from the adhesion site On the intracellular side these forces are
transmitted via a complex involving vinculin α-actinin paxillin and talin Attachment to the
extracellular matrix is mediated by an RGD sequence (in fibronectin for example) which in turn
has binding sites for collagen and fibrin If the force is sufficiently strong above a certain
threshold value F0 say and applied for a sufficiently long time the bond might be severed (deshy
couple) Typical values of this threshold force lie in the range of 10-100 pN (Evans and Ritchie
1997) but depend as well on the rate at which the force is increased Under more rapid
forcings the threshold is high compared to when the force is increased slowly This simply
45
CHAPTER 21 CELL MEMBRANE MECHANICS AND ADHESION copyRD Kamm 4615
reflects the fact that detachment is a stochastic process and that at any given level of force there
exists a finite probability of detachment and this probability increases with time
Fig 3114 One type of attachment linking the intracellular actin matrix to the extracellular matrix via an integrin complex that involves in addition vinculin α-actinin paxillin and talin (Reproduced from Lodish et al Molecular Cell Biolology 2000)
We need also to consider that in equilibrium a fraction Φ = K(1+K)-1 (where K is the
equilibrium constant) of the receptors will be bound at any given time and that the receptorshy
ligand complexes are continually cycling between the bound and unbound states characterized
by their respective rate constants
On a larger scale numerous adhesion sites typically act in parallel each contributing
some amount to the total adhesion force If the force transmitted by each single adhesion
complex is F and the density of adhesion sites (per unit membrane area) is NC then the stress
acting on the cell is the product F NC This gives a somewhat false impression however as it is
unlikely that each adhesion complex carries an equal force Put another way there exists a local
stress τ that can be thought of as the product of the average force per bond times the bond
density This stress is typically non-uniform In the adhesion of a cell to a flat substrate the
bonds near the periphery of the contact zone determine the strength of the cell against
detachment and when the cell is subjected to a detaching force the stresses are concentrated in
46
CHAPTER 21 CELL MEMBRANE MECHANICS AND ADHESION copyRD Kamm 4615
this peripheral region as depicted in Fig 3115 In the vicinity of the edge of adhesion several
factors will influence the stress distribution including the mechanical properties of the membrane
(in particular the bending stiffness KB) the receptor density the spring constants of the bond
and the bond strength
N
Region of adhesion
x1
Fig 3115 Schematic model of a cell membrane being detached from a substrate by application of a tension force N The membrane is free to the left of the dash-dot line and adherent to the right Forces and moments are transmitted through the membrane which adheres to the membrane through receptor-ligand bonds represented by a continuous distrubution p(x1)
To illustrate consider the following simple model for an adherent cell being peeled away
from its substrate by a force that generates a tension N in the membrane (Fig 3115)
Deformations in the membrane are described by eqn (223) where it can be shown that the
bending term dominates provided KbL2 gtN where L is the characteristic length in the x1 direction
(due to the small length scales involved) and the external membrane force (p in the membrane
equation) is now the non-uniform stress due to adhesion bonds As a simple first approximation
we take p = k(δminusδ0) with δ-δ0 being the amount of stretch in the receptor-ligand bond springs
and k an effective bond spring constant Recognizing that p approaches zero far from the edge
(see Fig 319) the membrane displacement and the spring displacement are related u3 = δ-δ0
Thus eqn (228) is written
⎛ part 4 u
KB⎜ 3
⎞ 4 ⎟ = NC F = NC ku
⎝ partx ⎠ 3 (277)1
This can be solved directly showing that the distance of separation between the cell membrane
and substrate grows in an exponential fashion with distance Even more simply a scaling
47
CHAPTER 21 CELL MEMBRANE MECHANICS AND ADHESION copyRD Kamm 4615
analysis of eqn (277) in which the term on the left is approximated by Kbu3w4 where w is the
characteristic distance over which u3 varies tells us that the stresses are concentrated in a region
of width
K
w prop B4 (278)
NC k
near the cell periphery Similarly we can estimate that the cell membrane will detach from the
substrate if N gt FoNCw where F0 is a measure of the force in a single bond at the time of bond
rupture and that the rate of peeling can be roughly approximated as the product of the
disassociation rate k -- (bondss) from eqn (265) and the distance between bonds (N -12C )
Although this provides some insight into how the peeling rate depends on the various factors it fails to capture the fact that the cell remains in an equilibrium attached state even for non-zero levels of tension reflecting that even under force a balance can exist between the rates of formation and rupture of receptor-ligand complexes (Ra Picart et al 1999)
It is also of interest to note that in the region near the edge of the attachment zone(x1=0
in Fig 3115) the membrane acts as a beam subjected to a moment due to the applied tension
This moment is balanced by a force couple due to tension in the adhesion complexes right
adjacent to the edge in combination with a compressive stress between the cell and substrate a
little further in In typical situations this compressive stress can approach levels as high as one
atmosphere and can act to effectively smooth the membrane and recruit new attachment sights While using these continuum descriptions it is important to keep in mind the true
discrete nature of the individual bonds represented in the model as a continuous adhesive
surface This is brought to light by a simple calculation in which the characteristic length over
which the applied tension is supported w is compared to the inter-receptor spacing N -12C
Using typical values for the parameters NC = 103 complexesμm-2 k = 10-5 to 10-6 Nm Kb = 1 to 2x10-18 Nm we find that w cong 01 to 03 μm and the inter-complex spacing N minus1 2
C cong 003 μm While it is reassuring to see that w is typically less than the inter-complex spacing the difference is small It is therefore not surprising that the actual process of cell peeling is stochastic in nature occurring in a sequence of more-or-less discrete steps with a velocity of peeling that varies widely from the mean
The interplay between receptor-ligand bonding and membrane stiffness also determines whether a cell will spread over a surface or peel away from it under a given tension Membrane bending stiffness acts to maintain the membrane and substrate within close proximity near the edge of contact (Fig 3115) Spreading can occur only if their separation distance is within the extended length of the receptor ligand bond over a distance comparable to the linear spacing
48
CHAPTER 21 CELL MEMBRANE MECHANICS AND ADHESION copyRD Kamm 4615
between neighboring bonds ( N minus1 2 C ) Under high tension the surfaces rapidly diverge and
spreading is prevented if the tension is sufficiently low receptor-ligand bonding can occur and spreading can occur
Measurements of adhesion
A variety of methods have been used to experimentally determine the strength of adhesion either
of individual receptor-ligand bonds or populations of bonds as in the case of entire cells
Whole cell experiments are more common and typically require less experimental
sophistication The drawback of course is that they provide only for estimates of average
properties and require certain assumptions regarding the distribution of cell-substrate adhesive
stress for interpretation to the level of a single bond Several of these methods are described
next
Centrifugal cell adhesion assays In this experiment cells are allowed to attached to a substrate
then are placed in a centrifuge rotating at speed ω positioned a distance r from the center of
rotation and oriented so that the net centrifugal force is acting to separate the cell from the
substrate Using the arrangement shown in Fig 3116 (right) the acceleration of the cells is 2ω r and the net force acting on a cell of volume Vc is F = (ρc minus ρf )ω 2rVc where the fluid and cell densities are ρf and ρc respectively
Interpreting these results we can make several different assumptions each leading to a different estimate for the maximum force experienced by the binding complex If we simply assume that all receptor-ligand complexes support an equal fraction of the total force F then the force per bond is f = F (πa 2NC ) where NC is the concentration of bond complexes However as the cell tears away from the substrate the edge bonds will break first since these experience the greatest level of force An alternative approach then is to assume that the adhesion complexes around the cell circumference support the entire load leading to the estimate f = F 2( πaN 1 2 ) recognizing that N1 2
C C is the average distance between bonds A somewhatmore accurate value for f might be obtained if we assume that all complexes within the distance w given by eqn (278) support the load In any of these cases once the centrifugal force exceeds some critical limit since the number of receptors supporting the load falls as the region of contact becomes smaller the force per bond increases and the cell will rapidly detach
Stochastic variability also needs to be taken into account however since even under a constant load any single bond has a finite probability of failure under a given level of force The equilibrium state of the cell then should be viewed as one in which the rate of bond formation equals the rate of bond breakage with increasing force having the effect of reducing the
49
CHAPTER 21 CELL MEMBRANE MECHANICS AND ADHESION copyRD Kamm 4615
probability that the bond will remain intact These effects can be addressed using the methods described in more detail in Chapter xx Parallel flow assay Another common method for assessing cell adhesion is to plate the cells onto one wall of a parallel flow chamber subject them to a fluid dynamic shear stress and observe at what flow rate the cells begin to release If we ignore flow details in the immediate vicinity of the cell the shear stress can be estimated from the solution for a fully developed (Poiseuille) velocity profile
3V ⎡ y2
⎛ ⎞ ⎤v(y) = ⎢1minus ⎥ (279)
2 ⎝ ⎠ ⎣ ⎢ h ⎥⎦
so that the shear stress acting on the cell is
⎛ dv ⎞ 6μV τw = μ⎜ ⎟ = (280)
⎝ dy ⎠ h y = minush
and the total force can be estimated as F asymp τw Ac where Ac is the surface area of the cell membrane exposed to the flow Consider as an example a flow of culture medium at a rate of 1 mls through a channel of height 01 cm and width 1 cm If the culture medium has a viscosity close to that of water (μ=001 dyns) the shear stress is obtained from eqn (280)
6 sdot (001dyn sdot s) sdot (1ml s) ( 01 sdot10cm2 )τ dyn cm 2w = = 6 = 06Pa
01cm This corresponds roughly with the level of shear stress experience by endothelial cells in the arterial system If we consider that the cell has a surface area with dimensions roughly 100 μm x 10 μm or about 103 μm2 then the total force acting on the cell is obtained by integrating the shear stress over the area of the apical membrane Assuming that the shear stress is uniform the force is simply the product of shear stress and surface area or about 1 nN in the present example Again interpretation of results from such experiments requires careful consideration of the distribution of forces among the individual adhesion complexes In this situation the cell is likely to peel from the upstream edge in much the same manner as occurs in the cell peeling experiment discussed earlier
50
CHAPTER 21 CELL MEMBRANE MECHANICS AND ADHESION copyRD Kamm 4615
Radial flow and spinning disk assays One disadvantage of the parallel flow assay is that all cells are subjected to essentially the same level of shear stress so the flow rate needs to be incrementally varied in order to determine the level of force required for detachment These two systems using an axisymmetric geometry circumvent this problem by producing an easily characterized radial variation in shear stress In the case of the radial flow assay fluid enters through a central channel and flows radially outward through the narrow gap between two circular plates From conservation of mass the mean flow velocity is given by
QV = (281)
2πrh and sufficiently far from the center (rgtgth) the velocity profile is parabolic as in the parallel flow assay and the shear stress is again governed by eqn (280) using (281) for V Q
ω
(Not to scale)
v
h h
Cell layer rc Ce l l layer rc
r r
Fig 3116 Schematic diagram showing the radial flow assay (left) and the spinning disk assay (right) In the radial flow assay shear stress attains a maximum value near the center and falls with increasing radius r whereas in the spinning disk system maximum shear stress is experienced at large r In the spinning disk assay cells are grown on one disk and the opposite disk is rotated at constant speed Provided the rate of rotation is sufficiently small that inertial effects can be neglected the velocity is purely in the circumferential direction and the profile is linear between the two plates so that the shear stress experienced by the cells can easily be computed as
ωr τw = μ (282)
h
51
CHAPTER 21 CELL MEMBRANE MECHANICS AND ADHESION copyRD Kamm 4615
In both of these cases as in the parallel flow assay the total force is obtained by integrating the shear stress over the cell surface and the distribution of force among the adhesion complexes is weighted toward those located near the upstream end of the cell This can also be seen by consideration of the torque exerted by shear stress on the cell that must be balanced by a nonshyuniform contact stress with the substrate that is greatest near the upstream end Single bond adhesion assays Two other assays provide a means of obtaining estimates for the strength of a single adhesion bond without the need for excessive interpretation These rely on an ability to isolate a small number of bonds or even a single bond and infer bond strength from the step-wise nature of the de-adhesion process associated with breakage of discrete bonds One of these methods employs the atomic force microscope coated with the ligand of an adhesion receptor as shown in Fig 3117 The probe tip is gradually brought up to the cell surface until one or more receptor-ligand bonds are formed When the probe tip is withdrawn it moves along a different trajectory on a force-displacement plot reflecting the forces of adhesion These forces are seen to jump between more or less discrete levels as the probe continues to be moved away from the cell with each jump corresponding to the breakage of a single bond (Fig 3117) Using this method the bond strength between integrin receptor and a variety of RGD-containing ligands was found to lie in the range of 30 to 100 pN (Lehenkari and Horton 1999)
Fig 3117 The strength of a single adhesion bond can be measured by bringing a functionalized tip of an AFM probe up to the cell allowing bonds to form then slowly withdrawing the probe Monitoring the differences between the force displacement curve between the forward and reverse motions the forces necessary to break a single receptor-ligand bond can be determined [Reproduced from (Lehenkari and Horton 1999)]
52
CHAPTER 21 CELL MEMBRANE MECHANICS AND ADHESION copyRD Kamm 4615
A second method is similar in that the discrete increments in force are monitored as individual receptor-ligand bonds are broken but the forces are measured by means of changes in the shape of a giant vesicle the membrane of which contains the ligands have been inserted In this case one vesicle is made effectively rigid due for example to a high surface tension A second vesicle containing the adhesion molecules is also drawn partially into a micropipet but is much more complaint than the first The two vesicles are then brought into point contact so that one or a small number of adhesions are formed As the pipets are moved apart the compliant vesicle distorts due to the force of adhesion which it can be shown is related to the change in dimension of the vesicle in the direction of the force thereby serving as a sensitive force transducer measuring forces in the range of single adhesion receptors or between 1 and 100 pN [Evans 1991 37]
(For specific examples of leukocyte rolling and attachment see Orsello or Chang amp Hammer)
[This process is initiated for example by local infection that causes the release of
chemotactic agents in addition to cytokines hellip
Models of this process draw upon many of the concepts discussed in this chapter ]
Transient cell adhesion
Concepts of transient adhesion and release are of particular importance in the case of leukocyte
rolling adhesion and transmigration across the endothelial layer of a blood vessel In addition
cell migration through extracellular matrix or along a substrate requires the ability of the cell to
both form and release adhesions
One problem that has received considerable attention is the interaction between an
adherent or rolling leukocyte and the adhesion receptors on the endothelium These studies are
complicated by the three-dimensional nature of the flow the compliance of the interacting
surfaces and receptor-ligand dynamics In a series of recent studies Hammer and co-workers
(Chang Tees et al 2000) have addressed several of these issues computing the viscous force
and torque acting upon a sphere near to planar wall from the mobility matrix (Hammer and Apte
1992) and using the ldquoBell modelrdquo of receptor binding (Bell 1978) but neglecting the effects of
cell deformation The Bell model relates the dissociation rate constant kr to the force in the
bond f the thermal energy kBT and a parameter with units of length that depends on the
reactivity of the molecule
kr = ko r exp(γf kBT ) (283)
53
CHAPTER 21 CELL MEMBRANE MECHANICS AND ADHESION copyRD Kamm 4615
A Monte Carlo method is employed at each time step in the calculation to determine bond
formation or breakage In these studies the nature of the leukocyte-endothelial interaction is
characterized as firm adhesion rolling adhesion bimodal adhesion or no adhesion and mapped
as a function of the two parameters of the Bell model in Fig 3 The boundaries of the rolling
adhesion regime are identified for a wall shear rate of 100 s-1 (dotted lines) or 30 and 400 s-1
(solid lines) Most literature values for the Bell model parameters for a variety of selectin
receptors (known to be instrumental in leukocyte rolling) correspond to the rolling adhesion
regime for typical shear rate of 100 s-1 An interesting but counterintuitive result from this study
was the observation that as the bond stiffness was increased from the value used in most
calculations (100 dyne cm-1) adhesiveness decreased which the authors attribute to reduced
deflection for a given level of force leading subsequently to more rapid dissociation
Fig 3118 The state diagram for a leukocyte interacting with an endothelial surface for shear rates ranging from 30 to 400 s-1 For low dissociation rates the leukocyte remains adherent to the surface (lower left) As either (γ) or ( ko
r ) [see Eqn (283) for definitions] is increased the cell first adheres firmly then rolls along the wall then completely detaches (upper right) Rolling adhesion is defined as the regime where rolling occurs over some part of the shear rate range between 30 and 400 s-1 Firm adhesion indicates that cells remain attached even at the highest shear rate no adhesion indicates that cells roll at a velocity gt 50 of the velocity of a non-adherent sphere In the bimodal regime cells are either adherent or non-adherent and do not exhibit rolling Dotted curves correspond to these same boundaries for a shear rate of 100 s-1 Reproduced from Chang et al (2000)
54
CHAPTER 21 CELL MEMBRANE MECHANICS AND ADHESION copyRD Kamm 4615
In another recent study using high-resolution video-microscopy (Schmidtke and Diamond
2000) it was demonstrated that a flowing neutrophil can attach to an adherent platelet via
adhesion molecules located in the tips of the microvilli and form long tethers averaging nearly 10
μm in length but ranging up to 40 μm at extensional rates of 6-40 μm s-1 for shear rates ranging
from 100-250 s-1 The mechanics of tether formation is itself a fascinating topic that is still under
intense investigation Readers interested in pursuing this work in more detail are referred to the
several papers (Hochmuth Shao et al 1996 Dai and Sheetz 1998 Dai and Sheetz 1999) that
identify a number of intriguing phenomena
55
CHAPTER 21 CELL MEMBRANE MECHANICS AND ADHESION copyRD Kamm 4615
317 Nomenclature Parameter Definition Units
R - receptor
L - ligand
C - receptor-ligand complex
G - Gibbs free energy Nm
N - membrane tension Nm
NR - total receptor density -3μm-2 in 2D or μm in 3D NL - total ligand density μm-2 in 2D or μm-3 in 3D N in 2D or μm-3μm-2
C - complex density in 3D NRf - free receptor density m-2 in 2D or m-3μ μ in 3D NLf - free ligand density -2 -3μm in 2D or μm in 3D d+ - forward diffusional rate constant 2 -1μm s-1 in 2D or 3 μm s in 3D d -1
- - reverse diffusional rate constant s r+ - forward reaction rate constant s-1
r- - reverse reaction rate constant s-1 D 2 -1
m - membrane diffusion coefficient μm s D - solution diffusion coefficient m2 s -1s μ Kb - bending stiffness Nm K 0 - equilibrium constant or affinity (zero force) M-1 in 3D and 2μm in 2D = k0
+ k0 minus
K - equilibrium constant M-1 in 3D and m2μ in 2D = k+kshy
k0 - association rate constant (zero force) M-1 s-1 in 3D or m-2 -1+ μ s in 2D
k0 - dissociation rate constant (zero force) s-1 minus
k - association rate constant M-1 s-1 in 3D or m-2 -1+ μ s in 2D
kminus - dissociation rate constant s-1 f - force per bond N F - total adhesion force N γ - empirical parameter μm r0 - distance over which energy minimum acts μm E0 - bond energy J k JK-1
B - Boltzmanns constant T - temperature K τ - bond lifetime s
56
CHAPTER 21 CELL MEMBRANE MECHANICS AND ADHESION copyRD Kamm 4615
τ0 - bond lifetime with zero force s σ - adhesion stress N μm-2 κ - spring constant for receptor-ligand bond N μm-1
57
CHAPTER 21 CELL MEMBRANE MECHANICS AND ADHESION copyRD Kamm 4615
References Bell G I (1978) Models for the specific adhesion of cells to cells Science 200 618-627 Caille N O Thoumine et al (2002) Contribution of the nucleus to the mechanical properties
of endothelial cells J Biomech 35(2) 177-87 Chang K C D F Tees et al (2000) The state diagram for cell adhesion under flow
leukocyte rolling and firm adhesion Proc Natl Acad Sci U S A 97(21) 11262-7 Dai J and M P Sheetz (1998) Cell membrane mechanics Methods Cell Biol 55 157-71 Dai J and M P Sheetz (1999) Membrane tether formation from blebbing cells Biophys J
77(6) 3363-70 Daily Elson et al (1984) Determination of the elastic area compressibility modulus of the
erythrocyte membrane Biophys J 45(4) 671-682 Evans E and K Ritchie (1997) Dynamic strength of molecular adhesion bonds Biophys J
72(4) 1541-55 Evans E A (1983) Bending elastic modulus of red blood cell membrane derived from
buckling instability in micropipet aspiration tests Biophys J 43(1) 27-30 Hammer D A and S M Apte (1992) Simulation of cell rolling and adhesion on surfaces in
shear flow general results and analysis of selectin-mediated neutrophil adhesion Biophys J 63(1) 35-57
Hardt S L (1979) Rates of diffusion controlled reactions in one two and three dimensions Biophysical Chemistry 10 239-243
Hochmuth F M J Y Shao et al (1996) Deformation and flow of membrane into tethers extracted from neuronal growth cones Biophys J 70(1) 358-69
Kucik D F E L Elson et al (1999) Weak dependence of mobility of membrane protein aggregates on aggregate size supports a viscous model of retardation of diffusion Biophys J 76(1 Pt 1) 314-22
Kusumi A Y Sako et al (1993) Confined lateral diffusion of membrane receptors as studied by single particle tracking (nanovid microscopy) Effects of calcium-induced differentiation in cultured epithelial cells Biophys J 65(5) 2021-40
Lehenkari P P and M A Horton (1999) Single integrin molecule adhesion forces in intact cells measured by atomic force microscopy Biochem Biophys Res Commun 259(3) 645-50
McCloskey M and M M Poo (1984) Protein diffusion in cell membranes some biological implications Int Rev Cytol 87 19-81
Meleard P Gerbeaud C Bardusco N Mitov MD and Ferdandex-Puente L (1998) Mechanical properties of model membranes studied from shape transformations of giant vesicles Biochimie 80 401-413
Moy V T Y Jiao et al (1999) Adhesion energy of receptor-mediated interaction measured by elastic deformation Biophys J 76(3) 1632-8
Ra H J C Picart et al (1999) Muscle cell peeling from micropatterned collagen direct probing of focal and molecular properties of matrix adhesion J Cell Sci 112 ( Pt 10) 1425-36
Saffman P G (1976) Bownian motion in thin sheets of viscous fluid Journal of Fluid Mechanics 73 593-602
Schmidtke D W and S L Diamond (2000) Direct observation of membrane tethers formed during neutrophil attachment to platelets or P-selectin under physiological flow J Cell Biol 149(3) 719-30
Sheets E D R Simson et al (1995) New insights into membrane dynamics from the analysis of cell surface interactions by physical methods Curr Opin Cell Biol 7(5) 707-14
58
CHAPTER 21 CELL MEMBRANE MECHANICS AND ADHESION copyRD Kamm 4615
Vink H and B R Duling (1996) Identification of distinct luminal domains for macromolecules erythrocytes and leukocytes within mammalian capillaries Circ Res 79(3) 581-9
Waugh R and E A Evans (1979) Thermoelasticity of red blood cell membrane Biophys J 26(1) 115-31
Zeman K H Engelhard et al (1990) Bending undulations and elasticity of the erythrocyte membrane effects of cell shape and membrane organization Eur Biophys J 18(4) 203shy19
Zhelev D V D Needham et al (1994) Role of the membrane cortex in neutrophil deformation in small pipets Biophys J 67(2) 696-705
59
MIT OpenCourseWarehttpocwmitedu
20310J 3053J 6024J 2797J Molecular Cellular and Tissue BiomechanicsSpring 2015
For information about citing these materials or our Terms of Use visit httpocwmiteduterms

CHAPTER 21 CELL MEMBRANE MECHANICS AND ADHESION copyRD Kamm 4615
structure remains much the same For that reason despite our focus on the outer or plasma
membrane the material in this chapter applies more generally to all cell-associated membranes
Fig 311 A space-filling model of the lipid bilayer showing the hydrophilic heads (polar head groups) on the outside and the hydrophobic tails pointing in on the interior The total thickness of the bilayer is about 6 nm [Reproduced from Molecular Cell Biology Lodish et al 2000]
When we use the term membrane we are generally referring to the phospholipid bilayer
and the proteins associated with it The phospholipids contained in the membrane are arranged
in two layers or leaflets with their hydrophobic tails pointing inward and their hydrophilic heads
outward Together they constitute a bilayer about 6 nm in thickness (Fig 311) Four
phospholipids account for more than half the lipid in most membranes these are
phosphatidylcholine sphingomyelin phosphatidylserine and phosphatidylethanolamine The
first and second of these are predominantly in the outer leaflet while the third and fourth are
more common in the inner leaflet In addition to these phospholipids the membrane contains
glycolipids and cholesterol While the amount of glycolipid is small constituting only about 2
2
CHAPTER 21 CELL MEMBRANE MECHANICS AND ADHESION copyRD Kamm 4615
of the total lipid content cholesterol is a major membrane constituent roughly 20 by weight a
value that remains quite constant among the different cell types
Several of these lipids are critical for their role in determining membrane structural
integrity These include the four major phospholipids and cholesterol For example both the
bending stiffness and the viscosity of the lipid bilayer sometimes referred to as membrane
fluidity are strongly dependent on the cholesterol content
Other important membrane constituents are the membrane-associated proteins which
account for roughly 50 of the membrane by weight but because of their relatively large
molecular weight only about 1-2 of the number of molecules comprising the membrane
These serve a variety of functions from signaling to the transport of ions and other molecules
across the membrane to the adhesion of the cell to surrounding structures as will be discussed
more later One subclass includes the integral membrane proteins those that penetrate into the
lipid bilayer can be classified according to their means of attachment to the bilayer
bull proteins that attach primarily through interactions with the hydrophobic core (this
subgroup contains most ion channels)
bull transmembrane proteins attached by only one hydrophobic segment (including many
membrane-bound antibodies some receptors of the integrin family and several other
types of receptor)
bull proteins attached to the membrane by lipid anchors or
bull proteins adsorbed to the membrane through interactions with the charged head groups
Some membrane-associated proteins are bound through other proteins (Fig 312) these are
called peripheral proteins and can be made to dissociate from the membrane by introducing
fluids with extreme values of pH or high salt concentrations that disrupt the covalent bonds
typically used for attachment
3
CHAPTER 21 CELL MEMBRANE MECHANICS AND ADHESION copyRD Kamm 4615
Fig 312 Schematic of the lipid bilayer and associated proteins either integral or peripheral [Reproduced from Molecular Cell Biology Lodish et al 2000]
The critical importance of these proteins can be illustrated by describing some of their
many functions One group of proteins serves as ion or water channels and pumps to control the
intracellular ionic concentrations (H+ Na+ Cl+ Mg++ Ca++) In the case of the red blood cell or
erythrocyte for example the cytosol is maintained at a potential approximately -6 mV relative to
the blood plasma Intracellular osmotic pressure (~150 mosm) and pH (~74) are also
maintained within narrow limits Many channels are active ion transporters pumping ions
against a concentration gradient and requiring an external source of energy often by ATP
hydrolysis Others however perform facilitated diffusion meaning that they help to regulate the
exchange of ions across the membrane in the direction of the concentration gradient but require
no external energy One class of these of particular interest in biomechanics includes the
mechanically-sensitive ion channels that open or close under the action of stresses transmitted by
the membrane or via attachments to the cytoskeleton or extracellular matrix One such channel
located in the stereocilia of hair cells in the tympanic membrane mediates the sensation of sound
The mechanism by which forces regulate these channels is discussed in Chapter 33 Other ion
channels are regulated by a change in protein conformation resulting from binding by some
signaling molecule (so-called ligand-gated channels) or by changes in the transmembrane
voltage potential (voltage-gated channels) Much of what we know about these ion channels
comes from experiments using the patch clamp technique in which drawing it into the tip of a
micropipet isolates a small section of membrane This method developed by Neher and
4
CHAPTER 21 CELL MEMBRANE MECHANICS AND ADHESION copyRD Kamm 4615
Sakmann in 1976 has spawned many of the experiments on which our current understanding of
membrane ion transport is based
Other integral membrane proteins are used for adhesion of the cell to surrounding
structures for signaling or for the control of biochemical reactions Discussion of adhesion
proteins will come later in Section 316 Signaling is accomplished in a variety of ways but is
most often mediated by the transfer of molecules across the membrane either directly by
diffusion or via selective channels or by binding of a ligand to a cell surface receptor Each time
a signal is received by means of receptor-ligand binding the result is a conformational change
in the receptor that initiates other biological processes via a signaling cascade involving a host of
other intermediate molecules Not infrequently the reaction initiated by ligand-receptor binding
is with another protein located within the membrane or closely associated with it Being
constrained to two dimensions rather than free to move in three can greatly accelerate reactions
that are diffusion-limited For example the time required for a molecule to reach a target of
diameter dT located a distance L away is approximately L3 (3DdT ) in three dimensions and
(L2 2D)ln(L dT ) in two where D is the diffusion coefficient (Hardt 1979)
Recognizing its fluid-like nature and multi-component structure Singer and Nicolson
proposed the fluid mosaic model for the membrane in 1972 This model emphasizes that the
lipids form a highly fluid-like phase while the proteins tend to aggregate in isolated islands that
are relatively rigidly structured giving rise to a mosaic-like arrangement Both the proteins and
lipids are free to diffuse within the plane of the membrane unless tethered to fixed structures
either internal or external to the cell The fluid-like nature of the membrane especially the lipid
portion accounts for the low resistance to shear deformations in the plane of the membrane In
addition the hydrophobic interior behaves essentially like a hydrocarbon fluid allowing the two
leaflets to slide freely relative to one another
Aside from the lipid bilayer the cell plasma membrane has associated macromolecular
structures on both intra- and extracellular sides giving rise to a three-layer composite
construction On the intracellular side the membrane is physically attached to a cortex or the
cytoskeleton The cortex is a dense filamentous structure that lends stiffness to the membrane
and can also interact with various transmembrane proteins often impeding their free diffusion
either by steric interactions or direct chemical bonding In some cells the cortex is simply a
region of dense cytoskeletal matrix in the vicinity of the bilayer In others it exhibits a distinctly
different structure or composition For example erythrocytes possess a cortex comprised of a
network of spectrin tetramers linked by actin filaments This network is attached to the
membrane by ankyrin and the integral membrane protein band 3 (Fig 313) This spectrin
network accounts for much of the bending stiffness exhibited by the red cell membrane
5
CHAPTER 21 CELL MEMBRANE MECHANICS AND ADHESION copyRD Kamm 4615
Fig 313 Structure of the membrane-associated cortex in an erythrocyte as viewed from the inside of the cell a) Schematic representation showing the arrangement of the spectrin filaments joined by short segments (13 monomers) of actin and tethered to the membrane through ankyrin and band 3 Junctional complexes containing actin tropomyosin adductin and band 41 also bind to band 3 and glycophorin b) An electron micrograph showing the same structures [From Molecular Biology of the Cell Bruce Alberts Dennis Bray Julian Lewis Martin Raff Keith Roberts James D Watson copy 1994]
External to most cells is found a glycocalyx which has been shown to extend as far as 05
μm from the surface of endothelial cells where it forms a compressible barrier separating circulating erythrocytes and leucocytes from the endothelial membrane The glycocalyx is comprised of short oligosaccharide chains glycoproteins glycolipids and high molecular weight proteoglycans all organized into an interconnected network with an overall negative charge Although its function is not completely understood it apparently plays a role in macromolecular transport across the endothelium and is an important factor in the interaction between blood-borne cells and the endothelium Studies have demonstrated that the glycocalyx in a capillary is readily compressed by a passing leukocyte yet is sufficiently rigid to prevent flowing erythrocytes from approaching the endothelial surface (Fig 314)
6
CHAPTER 21 CELL MEMBRANE MECHANICS AND ADHESION copyRD Kamm 4615
Fig 214 Images of a capillary segment in the hamster cremaster muscle with an intact glycocalyx (AB) and with the glycocalyx collapsed by treatment of the vessel with epi-illumination (CD) using either bright field illumination (AC) or fluorescent imaging using a dye too large to penetrate the glycocalyx (70 kD molecular weight FITC-dextran) The capillary wall is visualized by a membrane-specific dye PKH26 in A and C Width of the glycocalyx is indicated by the gap between the erythrocytes and the wall in A and C and by the change in effective capillary diameter before (B) and after (D) epi-illumination In this series capillary diameter increased from 47 to 54 μm suggesting awidth of the glycocalyx of 035 μm [Reproducedfrom Vink amp Duling (Vink and Duling 1996)
313 Membrane Mechanics
For the purpose of analysis we treat the cell membrane as a homogeneous two-dimensional plate
or sheet completely enclosing the cytoplasm The membrane referred to here can be thought of
either as the lipid bilayer by itself or more typically as the bilayer plus the associated cortex of
cytoskeletal filaments and glycocalyx on the extracellular surface In addition though not
explicitly recognized in the analysis transmembrane proteins and their attachments to the
intracellular and extracellular milieu are included in terms of their influence on the continuum
7
CHAPTER 21 CELL MEMBRANE MECHANICS AND ADHESION copyRD Kamm 4615
properties of the model Were it not for these the membrane would exhibit little resistance to
shear deformation
In qualitative terms the lipid bilayer can be thought of as a two-dimensional fluid within
which the individual lipid molecules or other molecules embedded in the membrane are
relatively free to move about by diffusion or directed motion Phospholipid molecules in either
of the two layers resist being pulled apart however so each layer is highly inextensible This
also contributes to the bending stiffness which is low in absolute terms but high for such a thin
layer since bending requires one layer to expand while the other is compressed By contrast the
two layers readily slide relative to each other These qualitative notions are put in more
quantitative terms in the next section
Types of deformation
Any deformation can be thought of in general terms as a superposition of several
simpler deformations For small strains in which linearization is appropriate the principle of
superposition is rigorously valid For larger strains however linear theory breaks down and
superposition can only be used as a rough qualitative guide in visualizing combined influences
Here we present the three primary types of deformation pure extension pure bending and pure
shear Later we also consider the influence of membrane viscosity in time-dependent
deformations
σ2
A
A0
σ1 σ1
x2
σ2
x1 Fig 315 A membrane initially of area A0 subjected to a uniform extensional stress along its edges σ1 = σ2 causing an increase in area to A
Pure extension In discussing the extensional stiffness of the membrane we need to distinguish
the behavior at low tension from that at high tension As you first begin to apply an extensional
8
CHAPTER 21 CELL MEMBRANE MECHANICS AND ADHESION copyRD Kamm 4615
stress at the edges of a lipid bilayer the projected or apparent membrane area first increases
while the actual or true membrane area remains constant This results from the suppression of
out-of-plane undulations Forces acting to resist membrane flattening originate from entropic
effects analogous to those seen in the case of a flexible polymer as its end-to-end distance is
increased ndash many more membrane configurations exist with undulations compared to the single
perfectly flat state Only when these undulations have been eliminated does the true membrane
area proportional to the surface area per molecule group begin to increase and this is associated
with a relatively abrupt increase in extensional stiffness For now we consider only the stiffness
of a flat membrane and leave the discussion of undulations of entropic origin to a later point in
the chapter Hence we initially neglect all entropic effects or equivalently consider the
membrane to be at zero temperature
Based in this assumption consider an infinitesimal plate initially of area A0 = L 20 that is
deformed by a uniform normal stress τ11 = σ1 = τ22 = σ2 applied to its edges (Fig 315) to a
new area A Previously we derived the expressions relating stress and strain which in two
dimensions and in the absence of stresses normal to the x1-x2 plane can be written
E
σ α = 2 (εα + νε β ) (21) 1minus ν
where the length of one edge Lα=L0(1+εα) Note that in this chapter we use the subscripts α β
rather than i j to distinguish stresses and strains in two dimensions from those more generally
in three Thus whereas i and j can be either 1 2 or 3 α and β are restricted to being either 1 or
2 When this stress is uniform in the plane of the membrane (the x1- x2 plane) it can be replaced
without loss of generality by a surface tension Nα (force per unit length) defined as σ α h where h
is the thickness of the membrane These can be combined in the case when N1 = N2 = constant
and consequently ε1 = ε2 = ε to give
Eh
N = ε (22)1 minus ν
In terms of a plate stretched uniformly in both directions we can define the areal strain as
ΔA A minus A 2 2 2
= 0 L0 (1+ ε ) minus L= 0
2 cong 2ε (23)A0 A0 L0
where the last approximation is appropriate for small strains By combining this result with eqn
(22) we can define the area expansion modulus Ke (units of Nm)
9
CHAPTER 21 CELL MEMBRANE MECHANICS AND ADHESION copyRD Kamm 4615
Eh ΔA Δ A
N = equiv K (24)2(1minus ν) A e
0 A0
Note that although we used the continuum structural equations in our analysis the final result
can also be viewed as simply the definition of the area expansion modulus and applies regardless
of whether or not the membrane can be modeled as a continuum
Experimental measurements of Ke lie in the range of 01-1 Nm for various types of lipid
bilayers and about 045 Nm (450 dyncm) for red blood cell membranes (Waugh and Evans
1979) These numbers suggest that cell membranes are quite resistant to extension and for that
reason are often treated as inextensible1 This high resistance to area change is in large part due
to the energy penalty associated with exposing the hydrophobic core of the membrane to water
that occurs as the spacing between individual amphiphilic molecules is increased [for a detailed
description of bilayer structure and thermodynamics see Tanford (1980) or Israelachivili
(1991)] Continuing to increase extensional stress the lipid bilayer eventually ruptures but at
very small extensional strains in the vicinity of 2 to 3 (Mohandas amp Evans 1990) Note that a
bilayer in a lipid vescicle for example stretches primarily by increasing the area per molecule
since recruitment of additional material to the membrane occurs very slowly
Using these expressions we can estimate the level of surface tension at which the
membrane would rupture At a 3 extensional strain (6 areal strain) uniformly applied in the
x1-x2 plane the surface tension at rupture would be about 006 Nm if we use a value near the
higher end of the observed range Ke = 1 Nm Using Laplaces law [see eqn (227)] for the
relationship between the pressure difference (ΔP) across a spherical shell of radius R = 1 μm and
the surface tension in the shell gives us
2N
ΔP = = 12x105 Pa cong 1200cmH 2O R
a remarkably high value of pressure given the thickness of the membrane is only 6 nm
Cells also often exhibit an intrinsic surface tension Reported values are small however
lying in the range of about 10-5 to 10-4 Nm (Sheets Simson et al 1995) For comparison recall
that the surface tension across the interface of a droplet of pure water is about 007 Nm a value
close to the rupture stress of the membrane given above It becomes immediately obvious then
that the tension of a cell membrane must be orders of magnitude smaller than the surface tension
1 This discussion neglects the effects of thermal fluctuations in the membrane that give rise to a much more compliant behavior at the smallest areal strains When surface stress is sufficient to smooth out most thermal fluctuations the cell or vesicle will exhibit the large moduli given here See also Example xx later in this chapter
10
CHAPTER 21 CELL MEMBRANE MECHANICS AND ADHESION copyRD Kamm 4615
of a typical gas-liquid or liquid-liquid interface since it would otherwise give rise to intracellular
pressures on the order of one atmosphere
Pure bending By contrast lipid bilayers exhibit a very low bending stiffness so low that it is
often neglected in models of membrane mechanics It can be important in certain situations
however and is essential for example in analyzing the thermal fluctuations of vesicles discussed
later in this chapter
Bending stiffness arises from the same type of molecular interactions that cause
extensional stiffness When an initially flat bilayer is bent the hydrophilic head groups on the
outside of the bend move further apart while on the inside intermolecular spacing decreases
both represent departures from the equilibrium unstressed state and require energy If the same
forces of interaction are responsible why then is bending stiffness so low While the answer to
this question is not simple one factor is the membrane thickness which you recall is only about
6 nm As the membrane bends therefore the change in the surface area per molecule is
extremely small so the associated extensional strains are also minute
Returning to our simple continuum plate model consider a bending moment applied to
the two ends causing the plate to curve slightly (Fig 316) If the bending is due to moments
applied at the two ends about the x2-axis then the bending moment per unit length is related to
the deflection by
Et 3 ⎛ part 2u ⎞ ⎛ part 2 ⎞
⎜ 3 u
Mα = minus 2 2 ⎟ = minusK B⎜ 32 ⎟ (25)
12(1minus ν ) ⎝ partxα ⎠ ⎝ partxα ⎠
where KB is termed the bending stiffness having units of Nm Implicit in this expression are the
assumptions that there exists a mid-plane (the neutral plane) on which the in-plane stress and
strain are both zero and that straight lines perpendicular to this mid-plane remain straight and
normal to this surface after deformation
Typical values for the bending stiffness KB lie in the range of 10-19 Nm (10-12 dyncm) for
a red blood cell or lipid bilayers (Mohandas amp Evans 1990) This value is larger on the order of
1-2x10-18 Nm (Zhelev Needham et al 1994) for other cell types (eg neutrophils endothelial
cells) that possess a more extensive cortex The methods used to obtain these values will be
described later in this chapter
11
CHAPTER 21 CELL MEMBRANE MECHANICS AND ADHESION copyRD Kamm 4615
Fig 316 Plate subjected to equal moments M1 at the two edges
Example Estimate the moment per unit length acting within an initially flat lipid bilayer (at zero
temperature) associated with a wavelength λ = 5 μm and amplitude ε = 1 μm
Membrane displacement can be approximated by the expression
u3 = ε sin (2πx1 λ) (26)
From eqn (25) above we obtain
2
⎛ 2π ⎞ M1 = KBε sin (2πu )⎝ ⎠ 3 λ (27)λ
Using the values given above the maximum moment per unit length is 0158 pN
Pure shear Shear deformations arise when a membrane is stretched in one direction by a
surface tension N1 (units of forcelength) while the lateral surface contracts under a lesser tension
N2 at constant surface area and in the absence of bending (Fig 317) Surfaces oriented at 45
degrees to the boundaries experience pure shear stresses of magnitude (N1 - N2)2
When subjected to shear stresses in the plane of the membrane a pure lipid bilayer
behaves essentially as a liquid It exhibits a membrane viscosity in that it poses a resisting force
proportional to the rate of shear deformation but only a small shear modulus to static shear
deformations It is not clear in fact whether or not pure lipid bilayers exhibit a non-zero shear
modulus For example the movement of membrane-bound proteins can be described by a
simple diffusion coefficient proportional to the membrane viscosity Typical cell membranes do
exhibit a shear modulus however largely due to the cortex of cytoskeletal filaments that lie on
the intracellular side of the membrane In a red blood cell this matrix as discussed above
12
CHAPTER 21 CELL MEMBRANE MECHANICS AND ADHESION copyRD Kamm 4615
consists of interconnected filamentous spectrin and actin with attachments to the membrane via
ankyrin
N2
N1 N1
N2 Fig 317 A section of membrane subjected to a shear stress of magnitude N1-N22
The equations relating shear stress to shear deformation (Hookes law) from Ch xx can
be applied here
τ12 = τ 21 =2Gε12 (28)
or expressed as a shear force per unit length of membrane
N12 =τ12 h = 2Gε12 = Ksε12 (29)
where we define the membrane shear modulus Ks with units of Nm Typical values lie in the
range of 6-9 x 10⁻⁶ Nm for a red blood cell membrane A pure lipid bilayer exhibits a viscous
resistance to shear deformations characterized by a shear viscosity of about 10-6 Nsm ((Evans
1983))
The 2D elastic plate -- equations of deformation
In the analysis of cellular membranes several unique characteristics need to be taken into
account
1 The membrane is extremely thin relative to its lateral extent If we consider the thickness to
be that of the lipid bilayer by itself then h can be as small as 6 nm compared to a typical cell
dimension on the order of 10s of μm Even if we include the sub-membrane cortex this
13
CHAPTER 21 CELL MEMBRANE MECHANICS AND ADHESION copyRD Kamm 4615
dimension only increases to about 100 nm This tends to favor in-plane stresses over bending
effects2
2 The non-shear deformations are very small with strains of at most a few percent Therefore
linear analysis is appropriate in many situations Note however that nonlinear effects can be
important especially for large shear deformations such as occur in micropipet aspiration of
red blood cells The implications and limitations of this are discussed more fully below
3 The membrane exhibits a very small modulus in plane shear and is often treated as a two-
dimensional liquid While this applies primarily to lipid bilayers when the membrane is
considered to include the cortex greater values of shear modulus can be observed
4 Stresses normal to the membrane are small and can be neglected
5 Membrane motions can be damped either due to viscous dissipation within the bilayer as in
the case of in-plane shear or due to the viscosity of the fluids on the intra- or extracellular
sides of the membrane These latter are especially important when considering motions of
the membrane perpendicular to its plane
6 Inertial effects can be neglected due to the predominance of viscous forces during transient
deformations
With these in mind and acknowledging the limitations of a continuum view of such
structures we treat the membrane as a thin homogeneous plate or membrane in which all the
following must be considered in-plane extension and shear bending viscous damping and
thermal fluctuations
The equations we derive will effectively be integrated through the membrane thickness so
that stresses will be in terms of surface forces (force unit length) These are the in-plane normal
forces (see Fig 318 for definition of the axes and nomenclature) are therefore written as
+ h 2
Nα = int σ α dx3 (210) minus h 2
where h is the membrane thickness and the vertical shearing forces
+ h 2
Vα = (211) minus h
int τα 3dx3
2
The moments acting on the plate edges can be calculated from
2 Whether tension or bending dominates clearly depends on the nature of the experiment If an initially spherical cell is distended tension is most important if the cell shrinks so that the membrane buckles bending effects will be critical
14
CHAPTER 21 CELL MEMBRANE MECHANICS AND ADHESION copyRD Kamm 4615
+h 2
Mα β = int x3τα β dx3 (212)minush 2
x
(c)
Fig 318 (a) A small section of membrane (b) Membrane deflections (c) Nomenclature used in defining the forces acting on a section of membrane (Note that Q is used to represent shear stress in the figure whereas V is used in the text and (xyz) should be (x1x2x3))
In order to distinguish the effects of bending from those giving rise to extension we separate the
normal stress into two parts one representing the mean over the thickness of the membrane
which is simply Nαh and the other representing the deviation from this value denoted as σαprime
Similarly we separate the displacement on the neutral plane unα from that which varies with x3
denoted as uαprime Consequently we can write
N
uα = u n + primeα and = iα u σ α + primeσ α (213)
h
And consistent with the assumption that planar edges initially normal to the membrane remain
planar under bending deformations we have that
15
CHAPTER 21 CELL MEMBRANE MECHANICS AND ADHESION copyRD Kamm 4615
partu uαprime = minus x 3
3 (214)partxα
According to assumption (4) above the relationships between stress and strain become
E σ α = νε β ) α ne β (215)
minus ν2 (ε1 α +
and
E ταβ = εαβ α ne β (216)
(1+ ν )
Since
partuα partunα partu
= αprime ε α = + (217)
partxα partxα partxα
(summation convention not used) We eventually obtain the following expressions for the
bending moment
+h 2 ⎛ part 2 u part 2 ⎞ M 3 u3
α = int σ α x3dx3 = minusKB ne (218)⎜ ⎝
2 + ν ⎟ α β partx 2
minush 2 partxα β ⎠
and
+ h 2 part 2u
M12 = int ε KB (1minus ν) 312 x3dx3 = minus (219)
minus h 2 partx1partx2
where in classical shell theory for continuum materials KB=Eh3(1-ν2) The moments are related
to the shear forces in the plane of the membrane through a moment balance about the x1 axis
giving
partM 12 partM
+ 2 minus V2 = 0 (220)partx1 partx2
so that
part ⎛ part 2 u part 2 u ⎞ part ⎛ part 2 part 2
V = minus 3 + 3 uandV 3 u
K ⎜ ⎟ = minus K ⎜ + 3⎞
2 B ⎟ (221)partx2 ⎝ partx 2 2 ⎠ 1 B 2 2
1 partx2 partx1 ⎝ partx1 partx2 ⎠ A force balance in the direction normal to the membrane yields
16
CHAPTER 21 CELL MEMBRANE MECHANICS AND ADHESION copyRD Kamm 4615
partV1 partV2 part ⎛ partu ⎞ part ⎛ partu ⎞+ + ⎜ N 3 ⎟ + ⎜ N 3 ⎟
2 + p = 0 (222)x 1
part 1 partx2 partx1 ⎝ partx1 ⎠ partx2 ⎝ partx2 ⎠
which upon substitution for V1 and V2 from eqns (221) becomes
⎛ part4u3 part4u part4u3 part part ⎛ ⎞K 3 ⎞ part ⎛ u ⎞
B 4 N 3 partu
+ 2 + minus minus N 3 minus p = 0 (223)⎜ ⎟ ⎜ ⎟ ⎜ ⎟⎝ partx1 partx2partx2 partx4 ⎠ partx ⎝ 1 partx ⎠ partx ⎝ 21 2 2 1 1 2 partx2 ⎠
Recall that the first term in parentheses is due to bending the second and third terms are due to
in-plane extension and the fourth term represents the pressure difference across the membrane
Eqn (223) contains three unknowns the displacement u3 and the two normal forces per
unit length N1 and N2 Fortunately the additional equations required for solution are quite easy
to obtain from simple force balances in the x1 and x2 directions Setting the sum of forces in the
x1 direction equal to zero we obtain (referring to Fig 319)
minus N1(x1) + N1(x1 + dx1)cosθ (x1 + dx1) minus N21 (x2 ) + N21(x2 + dx2 ) = 0 (224)
or
partN1 partN21 partN2 partN + = 0 and similarly + 12 = 0 (225)
partx1 partx2 partx2 partx1
While formidable in its complete form it is reassuring to know that we rarely use eqn
(223) in its entirety and that when certain limiting cases are considered more familiar equations
are obtained It is useful at this stage to consider several of these limits
Fig 319 x1 force balance in the plane of the membrane
17
CHAPTER 21 CELL MEMBRANE MECHANICS AND ADHESION copyRD Kamm 4615
Balance between pressure and surface tension (Laplacersquos Equation) If the in-plane stress is
uniform (Ni=Nj=N) eqn (223) has the form
⎛ part 4u part 4u part 4u ⎞ ⎛ part 2u KB ⎜
3 4 + 2 3 3
2 2 + 4 ⎟ minus N⎜ 3 part 2u
2 + 3 ⎞
2 ⎟ minus p = 0 (226)⎝ partx1 partx1 partx2 partx2 ⎠ ⎝ partx1 partx2 ⎠
and eqn (225) is trivially satisfied If in addition bending stiffness can be neglected then
⎛ part 2 u part 2 ⎞ ⎛ 1 1 ⎞ 3 u
p = minusN ⎜ 3
2 + 2 ⎟ cong N⎜ + ⎟ (227)⎝ partx1 partx2 ⎠ ⎝ R2 R1⎠
for small curvatures where R1 and R2 are the radii of curvature of the membrane about the x1 and
x2 axes respectively This is the well-known Laplacersquos equation with N the surface tension For
a sphere R1 = R2 and the equation simplifies further yielding the equation given on p 10
Balance between pressure and bending Alternatively if all in-plane stresses can be neglected
other than those associated with bending stiffness we obtain the equation generally used for
simple bending of plates and shells
⎛ part 4u part 4u part 4 3 3 u ⎞
KB ⎜ 4 + 2 2 + 3 ⎟ = p (228)
⎝ partx1 partx1 partx2 partx 4 2 2 ⎠
Both of these forms will be used later in this chapter to examine specific problems in cell
membrane mechanics
The conditions under which eqn (226) can be reduced to either (227) or (228) can be
determined by an order of magnitude comparison of the bending and tension terms If we take u
to be a measure of the membrane displacement in the x3 direction and λ to be the characteristic length in the x1 or x2 directions over which u3 varies then the bending term can be shown to scale as K 4 2
Bu λ and the tension term as Nu λ The ratio of these tells us which of the terms dominate in eqn (226) If
KBu λ4 K= B ltlt 1
Nu λ2 Nλ2
then tension dominates and eqn (227) is appropriate Alternatively if
KB gtgt 1 Nλ2
18
CHAPTER 21 CELL MEMBRANE MECHANICS AND ADHESION copyRD Kamm 4615
then bending dominates and eqn (228) should be used If we take values typical of those given
for cells K N = 5x10⁻⁵B = 10-18 Nm Nm λ = 1 μm this ratio equals 002 confirming as we
originally postulated that tension tends of dominate
Nonlinear formulations
Traditionally membrane deformations have been addressed through nonlinear analysis allowing
for large strains especially in shear Here we have chosen to present the linearized equations in
the hope that they will provide clearer insight and for continuity with the approach used in other
chapters of the text For many problems of interest deformations are small and linear theory is
sufficiently accurate In some circumstances however a nonlinear analysis is necessary one
example being the aspiration of a red blood cell membrane into a micropipet For this reason we
present the nonlinear equations in Appendix A for the more advanced reader and to assist in
reading the recent literature on membrane mechanics
Energies of deformation
Although the formulation of the equations of deformation in Section 316 is complete by itself
an alternative approach is often useful in which we consider the strain energy the energy stored
in the membrane due to elastic deformation as a basis for analysis Strain energy is analogous to
the energy stored in a spring by stretching it If the spring is linear with a stiffness k so that the
force F required to lengthen it from x0 to x is k(x-x0) then the energy expended during the
process of lengthening is
x x
U = int Fdx = int k(x minus x0 )dx = 1 2 k(x minus x0)
2 (229)x= x 0 x = x 0
Extensional energy Now consider a section of an elastic membrane of thickness h and lengths
dx1 and dx2 subjected to a uniaxial tension stress σ1 Here as in our previous discussion we
consider two cases first a flat membrane which is being stretched by extensional stresses (the
case at zero temperature) and second the situation in which the surface area of the membrane
projected onto a flat plane increases due to the smoothing of out-of-plane undulations (the
entropic contribution)
As the stress is gradually applied to minimize any dissipative effects the work done by
the external force must equal the gain in elastic energy stored in the plate The work performed
by this stress is
19
CHAPTER 21 CELL MEMBRANE MECHANICS AND ADHESION copyRD Kamm 4615
ε1 ε 1
dU = int σ 1dε 1dx1dx2 dx3 = int Eε1dε1dx1dx2dx3 (230)0 0
By energy conservation the work done in stretching the membrane must be stored as potential
or strain energy in the elastic member Since the right-hand-side of (330) represents the strain
energy in the volume dx1dx2dx3 then the energy per unit volume of membrane is
ε1 ε1
U0 = int σ 1dε1 = int Eε = 1 Eε21dε1 2 1 (231)
0 0
or expressed as energy per unit area of membrane
Ehε2
U 10h = (232)
2 In the somewhat more general case of biaxial strain a similar approach leads to
Eh ⎡ 2 2
( 2 2 ) Eh ⎛ ⎤partu ⎞ uε1 + ε 2 = ⎢⎜
1 ⎛ part
⎟ + ⎜ 2
⎞ U0h = ⎟ ⎥ (233)
2 1( minus ν ) 2 1( minus ν ) ⎢⎝ partx⎣ 1 ⎠ ⎝ partx2 ⎠ ⎥⎦
Note that if the strain is isotropic in that ε1 = ε2 = ε this can also be expressed in terms of the
areal strain with the aid of eqn (23)
2 Eh ⎛ ΔA⎞
U0h = ⎜ ⎟ (234)4 1( minus ν ) ⎝ A0 ⎠
from which it can be seen by eqn (24) that the area expansion modulus has the form
Eh Ke = (235)
2 1( minus ν )
under the assumptions of a homogeneous isotropic elastic membrane This term however only
accounts for the contribution to extensional energy associated with an increase in the surface area
of a membrane Another contribution arises from the change in the membrane surface area
projected onto the x1-x2 plane due to non-uniform displacements perpendicular to the plane of
the membrane in the x3 direction This can be seen from the following one-dimensional
example
Consider a membrane tethered at both ends that exhibits a constant surface tension N
when deformed into a new state defined by u3(x1) Locally the change in length of a segment
initially of length dx is
20
CHAPTER 21 CELL MEMBRANE MECHANICS AND ADHESION copyRD Kamm 4615
( 2 2 dx ) + ( du3 ) minus dx = [1 du3 dx1)2]
12 2 2 + ( dx 1 1
1 minus dx1 asymp (1+ 2 (du3 dx1) )dx1 minus dx1 = 2 (du3 dx ) dx(236) 1 1
[see also Figs 64 and 65 in Boal] The strain is then the change in length over the initial length or
2ε11 = 1
2 (du3 dx1) (237) and the energy per unit area associated with this change in length under a constant tension N is
2 ε N ⎛ partu ⎞
U0h = N1int dε =0
⎜ 3
⎟ (238)2 ⎝ partx1 ⎠
which extending to two dimensions can be written
⎡⎛ ⎞ 2 ⎛ 2⎤ N partu3 partu ⎞U ⎢⎜ ⎟ + ⎜ 3
0h = ⎟ ⎥ (239)2 ⎢⎝ partx1 ⎠ ⎝ partx⎣ 2 ⎠ ⎦ ⎥
It is important to recognize that we now have two expressions associated with the energy of
extension and they represent two distinct phenomena The first [eqn (333)] describes the
energy associated with true areal expansion that is a change in the effective spacing between the
molecules comprising the lipid bilayer The second [eqn (339)] corresponds to the energy
change due to undulations in a membrane with constant intermolecular spacing To see the
distinction between the two consider an experiment in which the pressure inside a cell or a lipid
vesicle is gradually increased by aspiration into a micropipette Initially the projected area of
the membrane rises rapidly with a relatively small increase in membrane tension corresponding
to the smoothing of undulations caused by thermal excitation of the membrane This is followed
at higher tensions by a transition to a regime in which the membrane exhibits a much greater
stiffness corresponding to the situation in which the thermally-induced undulations have been
smoothed out and the true membrane surface area now must increase In the absence of thermal
fluctuations eg at zero temperature only this second regime would be observed [see also
figure from Boal]
Energy of shear deformation Next examine the energy per unit area associated with shear
deformation in the plane of the membrane which can be expressed in the form
2
1 1 2 Gh ⎛ part u1 partu2 ⎞
U0h = 2 hτ12ε12 = 2 hGε12 = ⎜ + ⎟ (240)2 ⎝ partx2 partx1 ⎠
21
CHAPTER 21 CELL MEMBRANE MECHANICS AND ADHESION copyRD Kamm 4615
where we have utilized eqns (28) and (29) to obtain a form similar to that of eqn (234) for
extensional deformation
[See Boal for an alternative form in terms of membrane curvature He also gives a nice
description of bending in bilayer membranes]
Bending energy The contribution due to bending energy is somewhat more difficult to derive
First recognize that only those normal stresses that vary with x3 contribute to the bending
energy that is those contributed by the σ stresses in eqn (213) With this in mind we can
write the expression for the total elastic energy due to bending as
1 1 U = intintint ⎧ [ 2
⎨ ( ) 2 ⎫ σ 1 prime + ( )2
σ 2 prime + 2νσ 1 primeσ prime 2 ] + ( )τ 12 prime ⎬dx (241)⎩2E 2G ⎭ 1dx2dx3
Substituting for the stresses and strains from eqns (215)-(217) this can be re-cast in the
following form
⎧ 2 ⎫K ⎛ 2
part 2 2u ⎡ 2 u part ⎞ part 2u 2 part 2 ⎤ part u ⎛ u ⎞
U = B intint ⎜ 3 3 ⎟ 1 minus ν ) 3 3 2 minus ⎜ 3 ⎟⎨ 2 + 2 minus 2( 2 ⎬dx1dx (242)⎢ ⎥2 ⎝ partx1 partx2 ⎠ partx1 partx2 ⎝ partx1partx2 ⎠ 2
⎩ ⎣ ⎦ ⎭
It can be shown ((Meleard 1998)) that the integral of the second term in the integrand above [the
one multiplied by 2(1-ν)] is globally constant under deformation if the membrane remains a
closed surface with no holes Assuming that to be the case we obtain for the total bending strain
energy
KB ⎛
2 part 2u part 2
= intint ⎜ 3 u2 + 3 ⎞
U ⎟2 dx1dx2 + const (243)
2 ⎝ partx1 partx2 ⎠
Since we typically are concerned with changes in energy the constant will arbitrarily be set to
zero Thus the energy per unit area or energy density of bending deformations can be written
2 K ⎛ part 2 part 2 ⎞
0 = B u⎜
3 uU h 2 + 3
2 ⎟ (244)2 ⎝ partx1 partx2 ⎠
Note that the term in parentheses is proportional to the mean curvature of the surface Often the
surface has a natural mean curvature in the unstressed state If that curvature is c0 the bending
energy expression is modified slightly to the form
22
CHAPTER 21 CELL MEMBRANE MECHANICS AND ADHESION copyRD Kamm 4615
2 K ⎛ part 2 part 2 ⎞
U0 = B u⎜
3 uh 2 + 3
2 minus c0⎟ (245)2 ⎝ partx1 partx2 ⎠
Another common form of this expression is obtained by recognizing that the first two terms in
parentheses represent the linearized form of the sum of the principal curvatures (the largest and
smallest curvatures at a point) denoted c1 and c2 so that eqn (345) can be written
K
U2 B
0h = (c1 + c2 minus c0 ) 2
Although each of these expressions for strain energy density has been derived individually they
of course all contribute in the general situation and are linearly additive In that regard several
points are worthy of note First one can obtain some idea of the relative importance of
extension shear and bending deformations in a given situation simply by comparing their
relative energies just as was done in the last section by comparison of the bending and tension
terms in eqn (226) Not surprisingly the comparison leads to the same expressions we obtained
before for when either bending or tension is dominant Second due to the small shear modulus
of most cell membranes the energy stored in shear deformation can generally be neglected And
finally a comment is warranted concerning the energy due to tension Various simplifying
assumptions can be made depending on the cell type being considered and the nature of the
stress to which the cell (or vesicle) is being subjected but generally the lipid bilayer can be
considered to be of constant area unless it experiences grossly non-physiologic levels of stress
Thus the main contribution to extensional energy is that represented by eqn (339) associated
with the smoothing of membrane undulations
Other Factors Influencing Membrane Motion
Thermal fluctuations Biological membranes of all types can be seen to fluctuate due to
Brownian motion of the surrounding molecules if viewed with sufficient resolution These
fluctuations are in fact often used to measure the membrane bending stiffness since thermal
effects are seen as motions in the membrane of relatively long wavelength favoring bending
energies as compared to extensional or shear (see eqn (223)) To account for these effects it is
customary to add a time-dependent forcing term to eqn (223) η(t) the magnitude of which
scales with kBT We analyze thermal motions later and use them as a means of determining the
bending stiffness of a membrane
23
CHAPTER 21 CELL MEMBRANE MECHANICS AND ADHESION copyRD Kamm 4615
Damping due to external fluids When a membrane fluctuates in a direction perpendicular to its
plane velocities are induced in the surrounding fluids and due to the resulting shear stresses
energy is dissipated These motions are extremely complex to model precisely and depend on
both the nature of the surrounding medium (its rheological properties) and the bounding
geometry In lieu of a complete and rigorous analysis a local damping term is sometimes added
to the membrane force balance equation (eqn (223)) to approximate these effects Its form is
based on the presumption that externally induced velocities scale with the velocity of the wall
and that shear forces in the external fluid scale with the induced shear rates and velocities
Accordingly eqn (223) is modified by the addition of a term of the form μm partu3 partt where μμ is
the effective viscosity of the external fluid The equation that results from the addition of both
thermal forcing and external fluid viscosity is
partu ⎛ part 43 u 4
3 part u part+ 3 part 4u ⎞ part ⎛ ⎞ part ⎛ ⎞
B ⎜ 3 partu u
μm K 4 + 2 2 2 + 4 ⎟ minus ⎜ N3
⎟ minus part 1 ⎜ N
3
partt ⎝ x partx partx partx ⎠ partx ⎝ partx ⎠ partx ⎝ 2 ⎟ = p + η(t) (246)1 1 2 2 1 1 2 partx2 ⎠
An expression of similar form for a linear polymer is sometimes referred to as the Rouse
equation
314 Measurements of Membrane Elastic Parameters
Although the analogy has limitations it is useful at the onset to think of the cell as a fluid-filled
balloon or bag Just as in the case of a balloon the elastic properties of the membrane can be
determined by any experiment in which the membrane tension changes while its area is
measured In the simple example of a spherical balloon tension can be computed from the
inflating pressure and the measured radius the latter also yielding the surface area Ignoring for
now the thermal-induced fluctuations in a real cell membrane (ie assuming the cell to be at zero
temperature) the calculations become particularly simple Furthermore we will consider cells
for which the cytoplasm can be considered to fluid-like having no elasticity We return to
address both issues shortly
Osmotic swelling
Perhaps the simplest method to inflate the cell and measure the membrane elastic properties is to
cause the cell to swell by changing the osmolarity of the external fluid and simultaneously
monitoring the change in cell volume The change in transmembrane pressure mirrors the
24
CHAPTER 21 CELL MEMBRANE MECHANICS AND ADHESION copyRD Kamm 4615
change in osmotic pressure brought about by successive additions of a solute to which the
membrane is impermeable For ions and small molecules the osmotic pressure π can be
calculated from the vant Hoff equation
π = RT sum Ci (247)
i
where Ci are the molar concentrations of all solutes to which the membrane is impermeable For
larger molecules such as proteins their contribution to osmotic pressure is much larger than
indicted by this equation
Consider for example a spherical cell expanded osmotically so that the internal
hydrostatic pressure relative to external pressure is pc Microscopic examination yields a value
for the cell radius Rc Using these values in combination with Laplaces law [eqn (227)] gives
us the tension in this state and eqn (24) provides its relationship to the extensional modulus
p R Δ A
N = c c = Ke (248) 2 A0
The observed change in radius allows calculation of ΔA In practice identification of the reference state at zero pc is problematic due to the presence of thermal fluctuations but if Ke can be assumed constant for relatively small changes in area it is possible to extrapolate back to the zero-stress state from two measurements at elevated pc [Example red blood cell] Micropipet aspiration
One of the first methods used to measure the extensional modulus of the cell membrane involved
drawing a cell slightly deflated into a micropipet simultaneously monitoring the dimensions of
the cell and the pressure in the micropipet (Daily Elson et al 1984) Since on the time scale of
the experiment the volume of the cell could be assumed constant the shape change due to
aspiration of the cell causes increases in both internal pressure and surface tension both of which
are assumed spatially uniform Once the tension is large enough (or the temperature low
enough) to dampen the amplitude of any thermal fluctuations the cell can be treated assuming
that membrane extension is the dominant means by which the pressure drop across the
membrane is balanced [For further discussion on the thermal fluctuations and the relationship
between micropipet pressure and intracellular pressure see Daily and Evans and Rawicz Phys
Rev 1990 See also figure on p 199 of Boal Example the two regimes in membrane stiffness]
For the situation shown in Figxx the cell is drawn into the micropipet to the point at
which the portion of the cell external to the cell is spherical of radius Rc With the assumptions
25
CHAPTER 21 CELL MEMBRANE MECHANICS AND ADHESION copyRD Kamm 4615
stated above the (uniform) pressure within the cell can be related to it surface tension (assumed
uniform) and the radii of curvature of the main body of the cell Rc and the portion inside the
pipet a using Laplaces law [eqn (227)]
pc = 2N Rc = minus Δp + 2N a (249)
where pressures are referenced to the external ambient pressure Reorganizing to solve for
surface tension we obtain
ΔpN = (250)
⎛ 1 1 ⎞ 2⎜ minus ⎟
⎝ a Rc ⎠
The surface area corresponding to a given N is obtained from geometry summing the membrane
surface areas of the cylinder and hemisphere inside the micropipet and the truncated spherical
surface outside yielding for the areal strain the approximate expression
[(a R )2 (a R )3
Δ c minus c cong
]ΔLA
A 2a
Fig xx Micropipet aspiration of a neutrophil
This relationship between N and ΔAA can be used to calculate the area expansion modulus
Eh AK 0
e = = N 2 1( minus ν ) ΔA
where the expression involving Youngrsquos modulus assumes the membrane to be isotropic and
homogeneous The relationship could however be non-linear in that the value of Ke may vary
with the degree of area expansion a linear relationship between N and ΔA yields a constant value for Ke
It is important to note that neither of these approaches osmotic inflation or micropipet aspiration provides us with any information on the bending modulus To be precise bending
26
CHAPTER 21 CELL MEMBRANE MECHANICS AND ADHESION copyRD Kamm 4615
does play a role in the micropipet experiments but the effects are so small as to be negligible and are typically ignored That is not to say that bending is always negligible however as discussed next
Monitoring thermal fluctuations in the membrane
When a cell or lipid vesicle is observed floating free unattached to a substrate it can be seen to
exhibit time-dependent undulations as a result of collisions with the surrounding molecules
undergoing thermal motion In the case of a lipid vesicle with diameter in the range of 10
microns these undulations can be readily observed microscopically In smaller cells such as red
blood cells the motions can be inferred from the flickering phenomenon associated with the light
interference as the cell thickness changes (Zeman Engelhard et al 1990) Since the amplitude of
the membrane undulations depends on the stiffness of the membrane to bending and its surface
tension it is reasonable to expect that measures of this amplitude can be used to infer the
membrane elastic parameters In order to illustrate the method while avoiding some of the
algebraic complexity consider undulations in a flat membrane with significant bending stiffness
and a constant surface tension The relationship between the motion and the elastic properties
can be found by considering the total energy of the membrane obtained by summing the
energies per unit area from eqns (239) and (244) and integrating over the membrane surface
area Am
⎧ 2⎪ K ⎛ 2 2
part 2 u part 2 ⎡ 3 u ⎞
3 N ⎛ partu ⎞ ⎛ int 3 partu ⎞ ⎤⎫
B 3 ⎪
U0hdA = int ⎨ ⎜ 2 + 2 ⎟ + ⎢⎜ ⎟ + ⎜ ⎟ ⎥⎬dA (251) A ⎠ 2
m Am ⎪ 2 ⎝ partx1 partx2 ⎢⎝ partx1 ⎠ ⎝ partx2 ⎠ ⎥⎪ ⎩ ⎣ ⎦⎭
In writing the energy in this form we have omitted the contribution due to shear deformation
consistent with the fluid-like character of a pure lipid bilayer and have taken the surface tension
to be uniform during the deformation In this example membrane surface area changes only as a
result of fluctuations from the mean [u3(xxx2) = 0] configuration that is we now ignore the
contribution due to changes in intermolecular spacing and only consider changes in the area
projected onto the x1-x2 plane
It is convenient to use the method of Fourier transforms to represent the undulations of a
membrane normal to the x1-x2 plane which in two-dimensions leads to [see also class notes on
bending of cytoskeletal filaments alternatively use Fourier series representation]
A A
u3 (x) = u3 (x1 x2 ) = 2 intexp(iq sdot x)b(q)dq =
2 int exp(iq 4 1x1)exp(iq2 x2 )b(q1q2 )dq1dq
π 4π 2
(252)
27
CHAPTER 21 CELL MEMBRANE MECHANICS AND ADHESION copyRD Kamm 4615
where qα = 2π λα is the wavenumber of the particular mode and b(q) is the continuous analogue of the discrete coefficients that multiply each mode in a Fourier series representation
Here the algebra gets complicated so only the results of the analysis will be presented however
those wishing to see a more complete derivation should see (Boal Mechanics of the Cell
Cambridge University Press 2002) Introducing eqn (352) into (351) yields
1 ⎛ A ⎞2
int U q 40hdA = ⎜ ⎟ int (
KB + Nq2 )b(q)b(q)dq (253)2 2 ⎝ π ⎠
where b(q) is the complex conjugate of b(q) Now we invoke a previous result that at equilibrium energy is equally distributed among the various modes and that each mode has an
average energy of kBT2 Taking the ensemble average of eqn (353) and equating the energy of
each mode represented in the result to kBT2 (by the equipartition theorem) leads to
k Aq)b q) = BT
b( (K q4 2 (254)
B + Nq
This is a useful result in itself demonstrating that all modes tend to be suppressed as temperature
falls or as bending stiffness or surface tension rise In addition it shows the tendency for higher
modes to be of smaller amplitude But this equation has further value in that it can be used to
obtain a direct expression for the change in apparent area of a membrane as tension increases
Consider the true surface area of a membrane A represented as the sum of its projected
area and the additional area associated with thermally-induced undulations
⎡ 1 ⎛ 2⎤u ⎞ 2 part ⎛ partu ⎞
A = int dx + ⎢ 3 3 2
int ⎜ ⎢⎝ partx 2 ⎟ + ⎜
⎠ ⎝ partx 2 ⎟ ⎥dx (255)⎠ ⎥
⎣ 1 2 ⎦
Isolating the term representing the area reduction due to thermal fluctuations expressing u3 in
terms of its Fourier transform and taking the ensemble average of the result leads to
1 ⎛ A ⎞2
A minus int dx = ⎜ ⎟ int q 2 b(q)b(q) dq (256)2 ⎝ 2π ⎠
Combing eqn (254) from above with this expression yields
28
CHAPTER 21 CELL MEMBRANE MECHANICS AND ADHESION copyRD Kamm 4615
A minus int dx
kBT dq kBT dq2
= A 8π 2 int =
N int (257)
+ KBq 2 8π 2 N + KBq 2
where in writing the last term we have introduced the relations dq = dq2dθ 2 and int dθ = 2π By a simple substitution z = q2 + (N KB )the integral can be evaluated We do so however
between specified limits on the assumptions that the range of possible wavenumbers is restricted
by the size of the membrane on one hand (q = (πA12)) and the distance between individual lipid molecules on the other (q = πlm) Integrating between these limits results in
⎛ π 2 N ⎞
int dx 2 +A ⎜ ⎟ minus k T l K
= B ln⎜ m B ⎟ (258)A 8πKB ⎜ π 2 N ⎟
⎜ + ⎟ ⎝ A KB ⎠
If we use the area reduction at zero tension as a reference and increase the area from that
condition by progressively increasing membrane tension as in a typical experiment we finally
obtain an expression relating the change in area to the change in tension
⎛ NA ⎞ 1 + A dx A dx ΔA minus int minus ⎟ k ⎛ NA
int k ⎜equiv minus = BT π 2 K
ln ⎜ B T ⎞ 2 ⎟ cong B ln 1 + (259)
Nl ⎜ ⎟A A A 8π KB ⎜ 1 + m ⎟ 8π KB ⎝ π 2 KB ⎠ N = 0 N ⎜ 2 ⎟⎝ π K ⎠ B
where we have used the assumption supported by typical values found from different
experiments that (Nl2 m ) (π 2KB ) ltlt 1
You should recall that this solution was obtained on the assumption that the actual area
of the membrane remained constant and that the reduction in projected or apparent area resulted
from the undulations being progressively smoothed out Once the undulations are eliminated
the only means by which the projected area of the membrane can further increase is by an
increase in the inter-molecular spacing ndash an increase in the actual membrane area When this
occurs we expect to see a transition to the behavior discussed at the beginning of this chapter a
result expressed as
29
CHAPTER 21 CELL MEMBRANE MECHANICS AND ADHESION copyRD Kamm 4615
Fig yy Plots of tension vs normalized surface area for lipid vesicles of different composition Evans amp Rawicz 1990
ΔA N = (260)
A Ke
Thus we have two limiting predictions one for low tensions eqn (259) and another for high
tensions eqn (260) and the transition from one behavior to the other should occur when the
two expressions for ΔAA are of the same magnitude This is supported by experiment (Fig yy) and the results in the two regimes provide a means for estimating the two moduli Ke and KB
30
CHAPTER 21 CELL MEMBRANE MECHANICS AND ADHESION copyRD Kamm 4615
Before leaving this analysis there is one further result that is useful to state although the
derivation is again somewhat involved Once we have the solution for the undulations at a
given level of tension and for given membrane properties the ensemble average displacement
normal to the plane of the membrane can also be computed with the result
⎞
u2 k ⎛= BT NA
3 ln ⎜ 1+ ⎟ (261)4πN ⎝ π 2KB ⎠
Again this supports our intuition that the undulations will be suppressed at low temperature or
high tension And in the limit as N rarr 0 a binomial expansion of the natural log term shows that
the effect of tension drops out and the magnitude of the undulations varies inversely with the
bending stiffness
315 Membrane Fluid Mechanics
Early studies of protein diffusion notably the work of Saffman (Saffman 1976)
examined protein diffusion using an approach akin to that of Einstein in three dimensional space
thereby reducing the problem to one of solving for the mobility b in the equation for diffusivity
D = kBTb (262)
Calculation of the mobility is influenced by the viscous drag on the portion of the protein within
the membrane but also on to the intra- and extracellular domains as well The solution of
interest here is the one applicable in the limit of small μeμm where μe and μm are the external and
membrane viscosities respectively leading to
kBT ⎛ hμm⎞
D = ⎜minusγ + ln ⎟ (263)4πμmh ⎝ aμ e ⎠
where h is the membrane thickness a the radius of the protein (assumed cylindrical) and γ is
Eulers constant (=05772) Membrane viscosity has been estimated from lipid diffusion to be
~2 poise (McCloskey and Poo 1984) When finite mobility is achieved as a result of a finite
domain as for example a circle of radius R the corresponding result is
31
CHAPTER 21 CELL MEMBRANE MECHANICS AND ADHESION copyRD Kamm 4615
k ⎛ 1 D = BT R ⎞ log minus (264)
4πμh ⎝ a 2 ⎠
While this represents a useful point of departure measurements of lateral diffusion in a
membrane have demonstrated a more complex behavior Fluorescence recovery after
photobleaching (FRAP) has enabled the direct tracking of membrane proteins labeled with
fluorescent antibodies More recently single particle tracking methods have been developed
using colloidal gold or a fluorescent particle in conjunction with digital microscopy as well as
controlled movements using microbeads manipulated by an optical trap
From experiments such as these a new picture has emerged While the lateral diffusion
of lipids and a small fraction of trans-membrane proteins satisfy the general form of Saffmans
predictions the predicted diffusivity is greater than that observed experimentally and agrees with
experiments only when a membrane viscosity of 100 poise is used This might be due to the
presence of other proteins in the membrane (Kucik Elson et al 1999) Experiments also show
that many proteins appear to diffuse freely only in small domains typically measuring from 200shy
600 nm remaining confined to these domains for periods on the order of tens of seconds To
explain this behavior the membrane skeleton fence model was proposed (Kusumi Sako et al
1993) in which a membrane-associated matrix constrains the movement of proteins outside of
the domains defined by the matrix filaments Diffusion beyond these barrier filaments can occur
either as a result of random thermal motions of the transmembrane protein matrix filaments or
both or by transient breaks in the filaments Confinement of proteins may play an important role
in rapid and selective signaling Rapid directed motion of membrane-associated proteins has
also been observed and is likely due to active transport by an intracellular actin- or microtubule-
based motor
316 Cell Adhesion
This section deals with how cells adhere to their surroundings and through these sites of
adhesion how they interact with the external world We begin by summarizing the different
types of adhesion their functions and the molecules involved Next we provide a brief
description of the adhesion complexes found in cells and the role of each type Then the
theories that provide a quantitative description of adhesion between single receptor-ligand pairs
are reviewed in the context of the material presented in Chapter xx including the role of thermal
fluctuations Through these theoretical models both the static and dynamic states of adhesion
can be explored for single molecule pairs then for adherent cells Next we develop the different
32
CHAPTER 21 CELL MEMBRANE MECHANICS AND ADHESION copyRD Kamm 4615
approaches that are used to study the adhesion of cells based either on thermodynamics or
mechanics Methods for the measurement of adhesion strength are described providing
estimates for the force that a cell can exert on its surroundings Various examples will be
presented but the adherence of leukocytes to the endothelium and the role of adhesion in cell
migration will receive special attention
Functions of adhesion
Adhesion has been found to be an essential process necessary for a variety of fundamental
cellular functions
bull Structural integrity Adhesion helps to maintain the overall structural integrity of the
tissue in muscle for example it provides the means of force transmission from the cells
to the surrounding matrix to allow contraction In non-contractile cells it still provides
the needed mechanical coupling to the surrounding tissue necessary for a variety of
cellular functions
bull External sensing Adhesion provides a means by which the cell can sense and
subsequently respond to its surroundings Forces transmitted directly to the cell
membrane or to the cytoskeleton via transmembrane proteins may trigger a variety of
biochemical reactions within the cell as we shall see later in Chapter 33
bull Migration Cell-matrix adhesion is an essential element in cell migration a cell propels
its way through tissue or along a surface through a process involving adhesion
contraction and release also described in Chapter 33
bull Regulation of transport Sites of cell-cell adhesion are often important in the regulation
of transport across a cell layer such as in the case of an epithelium or endothelium
bull Communication Sites of mechanical coupling often provide a means of cell-cell
communication as in the case of gap junctions which offer a pathway for the diffusion
of ions and small molecules between adjacent cells
Adhesion molecules
Cells adhere to their surroundings or to an artificial substrate via a wide variety of different
proteins that can be classified into five major families integrins selectins cadherins
immunoglobulins and transmembrane proteoglycans (Table 1) In terms of their mechanism of
attachment to other cells or the external matrix these can be classified as either homophillic ndash
binding to like molecules heterophillic ndash binding to unlike molecules or those that bind to other
cells through an extracellular linker molecule
Integrins one of the largest class of adhesion molecules are primarily used to attach cells
to the extracellular matrix or the basal lamina but are also present in some cell-cell adhesion
33
CHAPTER 21 CELL MEMBRANE MECHANICS AND ADHESION copyRD Kamm 4615
complexes They typically bind to the matrix via the RGD amino acid sequence (arginine
glycine aspartic acid) but can also contain other binding motifs Integrins are heterodimers in
that they always contain an α and a β subunit with the different isoforms determining the specific ligand to which the integrin binds Two specific types of adhesion focal adhesions and hemidesmosomes often contain integrins and the attachments they make can at times be stable but at other times transient so as for example to mediate cell migration The force of adhesion of a single integrin-ligand bond has been measured using atomic force microscopy and found to be in the range of 30-100 pN (Lehenkari and Horton 1999) with a relatively low binding affinity in the range of K ~ 10-6
D to 10-8 molliter By comparison typical cell-surface receptors bind with an affinity in the range of 10-9 to 10-11 molliter Integrins also play an important role in signaling since extracellular integrin binding is known to influence cytoskeletal morphology as well as the state of cell differentiation Adhesion molecules in the selectin family also tend to form transient bonds and are important in leukocyte adhesion and extravasation the migration of the leukocyte through the endothelium and into the tissue Consequently they tend to be found in cells of the circulation and are present both in leukocytes and endothelial cells and are instrumental in adhesion between these two cell-types during leukocyte rolling
Family Location andor Ligands Comments
function recognized
integrins focal adhesions (E) fibronectin relatively low
hemi-desmosomes collagen laminin affinities
leukocyte immunoglobulins (KD~ 10-6-10-8
(spreading) (I) actin filaments molliter)
adhesion primarily
cell-matrix adhesion
but also in some
cell-cell adhesions
selectins circulating cells and carbohydrates require Ca2+
endothelial cells
rolling adhesion
Ig superfamily important in integrins
(immunoglobulin) immune response homophillic
cadherens adherens junctions (E) homophillic require Ca2+
desmosomes (I) actin
34
CHAPTER 21 CELL MEMBRANE MECHANICS AND ADHESION copyRD Kamm 4615
filaments
intermediate
filaments
transmembrane fibroblasts (E) collagen bind various
proteoglycans epithelial cells fibronectin growth factors
(I) actin such as FGF
filaments
heterophillic
Table 1 Cell adhesion molecules and their characteristics
While both integrin and selectin binding is mediated by Ca2+ adhesion via the
immunoglobulin (Ig) superfamily of proteins is Ca2+ independent Some of the most prominent members of this family are the N-CAMs (Neural cell adhesion molecules) and ICAMs (Intracellular cell adhesion molecules) These tend to undergo homophillic bonding but some also bind to members of the integrin family
Cadherens are often expressed in the same cells as the selectins but form much stronger bonds and therefore play an important role in maintaining cell integrity Because of these attributes cadherens are the primary adhesion proteins in desmosomes and adherens junctions the major structural contacts cells form with other cells or the basil lamina These also form homophillic bonds by a Ca2+ dependent mechanism and mediate selective bonding between adjacent cells Cadherens are relatively short as compared to other adhesion molecules being
about 700-750 amino acid residues in length
Types of adhesion complexes
Cells have developed a variety of specialized adhesion complexes each utilizing one or more of
the adhesion molecules of Table 1 and each serving a specific purpose Typically the cell-cell or
cell-surface spacing is in the range of 10-20 nm but this is highly variable ranging from less than
1 nm when controlling transport to over 100 nm in regions where tight control is unnecessary
Below we describe the different types of junctions and where important for function their
mechanical characteristics
Gap junctions Cells need to communicate with their neighbors for a variety of reasons For
example cardiac myocytes transmit signals from cell to cell in order to maintain a synchronous
35
CHAPTER 21 CELL MEMBRANE MECHANICS AND ADHESION copyRD Kamm 4615
wave of contraction This is typically accomplished by providing a pathway for ions and small
signaling molecules between cells called gap junctions (Fig 3110) These minute channels are
typically comprised of a collection of six connexin proteins that cluster together in cylindrical
fashion forming a minute channel that passes molecules and ions less than about 1200 to 2000
MW (15-2 nm) Transport through these channels is regulated and their permeability drops in
the presence of high Ca2+ concentration as when a cell membrane is ruptured or with low pH
Cyclic AMP acting as a second messenger can be exchanged between cells therefore gap
junctions provide a metabolic linkage between neighboring cells and provide a means by which
hormonal stimulation of just one cell can be transmitted to others
Adherens junctions Adherens junctions are belt-like structures that can be though of as the
structural weld that holds two cells together (Fig 3110) Because of their structural role
these junctions formed by homophilic bonding between proteins in the cadheren family are
anchored securely again via the adaptor proteins α β γ-catenin to the cytoskeleton
Desmosomes and Hemidesmosomes If the adherens junctions are the continuous welds between
cells desmosomes are the spot welds Again these serve primarily a structural purpose
joining two neighboring cells via a complex consisting of a dense plaque on the intracellular
sides of both cells extending 15-20 nm into the cell and consisting of a variety of proteins that
attach to keratin filaments part of the intermediate filament network Hemidesmosomes have
similar intracellular structure but attach instead to the basal laminae Based on their different
extracellular attachment sites desmosomes typically link to other cells via cadherens whereas
hemidesmosomes adhere via a type of integrin Both are commonly found in epithelial cells
36
CHAPTER 21 CELL MEMBRANE MECHANICS AND ADHESION copyRD Kamm 4615
Fig 3110 Schematic showing the different types of cell junctions present in an epithelial cell as found in the small intestine Tight junctions near the apical surface essentially prevent the passage of all molecules The spot desmosomes and adherens junctions provide for cell-cell anchoring and the hemidesmosomes for anchoring to the basal lamina Gap junctions provide a means for communication between neighboring cells [Reproduced from Lodish et al Molecular Cell Biology 2000]
Junction type Function Extracellular or Intracellular
adjacent cell attachment
attachment
Adherens structural cell-cell or cell- ECM proteins or actin filaments
matrix cadherins in
adjacent cell
Desmosome structural cell-cell cadherin intermediate
filaments
Hemidesmosome structural cell-matrix basal lamina via intermediate
integrins filaments
Focal adhesions structural cell-matrix ECM proteins actin filaments
via integrins
Tight junction regulate transport between homophillic binding between the
cells and along cell transmembrane proteins occludin or
37
CHAPTER 21 CELL MEMBRANE MECHANICS AND ADHESION copyRD Kamm 4615
membrane claudins
Gap junctions cell-cell communication channels formed by connexin
via ion and small molecule subunits
exchange
Table 2 Adhesion complexes
Focal adhesions A second means by which cells attach to the extracellular matrix is through
focal adhesions These serve a similar function to the hemidesmosomes and share a common
linkage via integrins to the ECM but are attached on the intracellular side instead to the actin
filaments of the cytoskeleton Actin filaments converge at the site of focal adhesions forming
stress fibers strong actin bundles that attach to the β-subunit of the integrins via adapter
proteins such as actinin vinculin and talin Focal adhesions are instrumental in cell migration
and for this purpose need to be easily formed and disrupted as the cell moves forward Release
or de-adhesion of cells is often mediated by a class of peptides called dis-integrins that
competitively bind to the RGD site used by integrins to attach to a variety of matrix molecules
Tight junctions Control of transport is generally mediated by tight junctions that form an
intricate network of seams between two cells (Fig 3111) As their name implies these are the
tightest of the cell-cell junctions and the gaps they leave are often small enough to exclude even
the smallest ions and molecules Formed by homophillic binding between the transmembrane
proteins occluding and claudins tight junctions allow epithelial cells to perform their critical role
in transepithelial transport and provide for maintenance of differences in concentration between
the apical and basal surfaces of these cells Since occludins are not capable of forming rigid
structural bonds with the cytoskeleton they are most often associated in a junctional complex
with adherens junctions or desmosomes that fulfill the structural needs of attachment
38
CHAPTER 21 CELL MEMBRANE MECHANICS AND ADHESION copyRD Kamm 4615
Fig 3111 Tight junctions in an epithelial cell shown schematically (a) in a freeze fracture replica (b) and in a transmission electron micrograph (c) [Reproduced from Alberts et al 1994]
Fig 3112 Two types of bond that attach a cell to the extracellular matrix by means of clusters of integrins On the extracellular side integrins bind to the matrix proteins fibronectin and laminin Inside the cell they attach to the cytoskeleton via adaptor proteins to either actin filaments (focal adhesions) or intermediate filaments (hemidesmosomes) [Reproduced from Lodish et al Molecular Cell Biolology 2000]
Non-specific binding
Cells can adhere to their surroundings by either non-specific or receptor-ligand (specific)
bonding Though both mechanisms are likely active in most situations as we will see receptorshy
39
CHAPTER 21 CELL MEMBRANE MECHANICS AND ADHESION copyRD Kamm 4615
ligand bonding is the stronger of the two by a considerable margin and is therefore the most
relevant biologically In situations for which either the receptors or their ligands are not present
however such as might be the case in certain in vitro experiments non-specific binding can be
important as well
There are essentially three major forms of non-specific attractions to consider
bull Van der Waals ndash These attractive forces arise due to charge interactions in polar
molecules They tend to dominate among the non-specific mechanisms at
intermediate distances around 20-25 nm [see Boal]
bull Electrostatic ndash These interactions can be either attractive or repulsive depending
on the sign of the surface charges and are particularly important during the
approach of two cells since the glycocalyx has a high negative charge density
bull Steric ndash These forces arise due to the steric exclusion of two molecules as they are
brought into close contact In the case of cell-cell interactions steric repulsion is
due to the compression of the two glycocalyx layers and the tendency to resist
compression resulting from osmotic effects and the elasticity of the layer Steric
forces tend to dominate for small separation distances lt 10 nm
In combination these effects combine to produce a net attractive force per unit area of
about 100 Pa at a separation distance of about 25 nm
Adhesion by means of receptor-ligand binding
We can use the analysis of Chapter xx to estimate the strength of a receptor-ligand bond and
based on typical values for bond density calculate the corresponding strength of adhesion
between two cells or between a cell and a surface Recall that the application of force to a
receptor-ligand bond modifies the dissociation rate constant for the binding reaction This effect
can be modeled in several ways but the result obtained by Bell ((Bell 1978)) suggests the
following exponential form for the dissociation rate
0 ⎛ γf ⎞ 0 ⎛ γσ ⎞ kminus = kminus exp⎜ ⎟ = kminus exp⎜ ⎟ (265)
⎝ kBT ⎠ ⎝ NC kBT ⎠
where k0minus is the unforced dissociation rate constant γ is a factor with the units of length that
corresponds roughly with the distance separating the bonded pair at equilibrium NC is the concentration of bonded complex and σ is the average bond force per unit area To determine
40
CHAPTER 21 CELL MEMBRANE MECHANICS AND ADHESION copyRD Kamm 4615
the rate of change of the concentration of bonded pairs one must solve the following rate equation describing the competition between bond formation (first term) and destruction (second term)
dNC ⎛ γσ ⎞
cong k+ (NR minus NC )(NL ) minus kminus NC = k+ (N minus )( 0R NC NL ) minus kminus NC exp⎜ ⎟ (266)
dt ⎝ NC kBT ⎠
where NR and NL are the concentrations of receptors and ligands respectively and we have
assumed that NCltltNL and that all bonds are stressed equally At equilibrium dNCdt=0 and if
the force applied to detach the cell (equal to the average bond stress σ) is increased
incrementally from zero NC will progressively fall to a new equilibrium value At sufficiently
high levels of force however increasing σ further eventually gives rise to a situation in which equilibrium can no longer be achieved through a reduction in NC At that point NC tends toward zero and the cell separates from the surface to which it was attached It can be shown that this
occurs when (Bell 1978)
k 0
α c exp(α + c + 1) = N
k 0 L (267)minus
σ
where α minγ c equiv and σmin is the minimum stress needed to cause detachment For a wide
NRkBT
range of conditions eqn (267) has the approximate solution
⎛ k0 + ⎞
α c cong 07 ln L (268)⎜ 0 N ⎟⎝ kminus ⎠
so that the critical stress for detachment can be expressed as
N 0
σ cong 07 C kBT ⎛ k ⎞ ln⎜
+ min N ⎟ (269)
γ ⎝ k0 L minus ⎠
where NC is determined from setting eqn (266) to zero under these critical conditions
Thermodynamic approach to cell adhesion
Although we focus here on the mechanical aspects of cell adhesion this process can also be
viewed from a thermodynamic perspective In this approach adhesion is considered in terms of
the change in energy specifically the Gibbs free energy G associated with all the individual
receptor-ligand interactions as well as the various non-specific forces of attraction or repulsion
The adhesion of a cell to a given surface then can be viewed as an equilibrium state determined
41
CHAPTER 21 CELL MEMBRANE MECHANICS AND ADHESION copyRD Kamm 4615
by minimization of the free energy If in undergoing a transition from a free state to an adherent
state the system represented by the cell and surface experiences a reduction in free energy ie
ΔGlt0 then adhesion will occur and the equilibrium state of adhesion will be determined by that with the minimum in free energy or the largest value of -ΔG While this approach ignores
many of the subtleties of the interactions and like the analysis above assumes that all receptorshy
ligand interactions are identical from an energetic point of view it is useful in providing some
simple insights as seen in the next two examples
Example Comparison of specific and non-specific adhesive forces Non-specific bonding due
to the combined effects of van der Waals electrostatic and steric forces result in an attractive
stress of approximately 100 Pa Receptor-ligand bonding give rise to forces that can be
estimated from the change in free energy f ~ to 4x10⁻⁴ dynbond = 9x10-11 to 4x10⁻⁹ ΔGr~9x10⁻⁶ Nbond where f is the force required to break the bond and r is a measure of the distance the bond stretches before it breaks Using a typical density of the receptor-ligand complex NC of ~1012-1015 bondsm2 gives a total bond stress of N 1
C x f ~ 9 x 10 to 4x10⁶ Pa The above kinetic approach to estimating bond strength [eqn (269)] gives a value approximately half of that from this equilibrium approach In either case however the conclusion remains the same non-specific binding can under certain circumstances be important since it is comparable to the lowest estimates of receptor-ligand-mediated bond strength but not surprisingly the latter is quite likely to dominate in nearly all practical situations
Example JKR theory for the equilibrium area of adhesion between a cell and substrate
It is well known that cells tend to take on a more flattened shape as the substrate to which they
are attached becomes more strongly adhesive either by coating with a more attractive ligand or
by increasing the concentration of ligand bound to the substrate Conversely less adhesive cells
round up and become more spherical These observations can be explained with the help of a
simple scaling analysis on the assumptions of small deformation of a linear elastic cell
Let the cell be modeled as a homogeneous elastic sphere with elastic modulus E and
initial radius R (Fig 3113) It is then brought into contact with a surface to which it adheres
As the cell adheres it attains a lower energy state characterized by an adhesion energy per unit
area J Formation of a flat adhesion surface however requires deformation within the elastic
cell and an associated increase in the stored elastic energy In Chapter 31 we showed that the
stored elastic energy per unit volume can be written
UE asymp int τεdV asymp int 1 2 Eε 2dV (270)
Vc Vc
42
CHAPTER 21 CELL MEMBRANE MECHANICS AND ADHESION copyRD Kamm 4615
Strain inside the cell can be approximated as the displacement of the cell surface δ divided by the characteristic distance within the cell to which the deformations penetrate a distance that scales with the lateral extent of the contact region 2a so that ε prop δ a where it can easily be shown from the geometry that a 2 asymp 2δR so that ε prop δ R Combining and dropping all numerical constants we obtain the following scaling approximation
δUE prop E ( )δR
3 2 (271)R
An expression for the total energy of the system then can be written
U prop minusJa2 + Eε2a3 prop JδR + Eδ 5 2R1 2 (272) The equilibrium state corresponds to the value of δ having the minimum energy obtain from
partU prop minusJR + Eδ 3 2R1 2 (273)
partδ so that
23 1 3 ⎛ JR12 ⎞ ⎛ JR2 ⎞
δ prop ⎜ ⎟ and a prop ⎜ ⎟ (274)⎝ E ⎠ ⎝ E ⎠
The exact solution to this problem yields the result
⎡ ) 1 3 2 1( minusν 2 ⎤ 9πJR
a = ⎢ ⎥ (275)⎢ 2E ⎥⎣ ⎦
43
CHAPTER 21 CELL MEMBRANE MECHANICS AND ADHESION copyRD Kamm 4615
Elastic modulus E adhesion energy per unit area J
2a
Fig 3113 Experiments to determine the contact area of an iminobiotin functionalized agarosebead on a glass coverslip in water Top Schematic of adherent bead Bottom Results for a range of bead radii Solid line is a fit to the date which obeys the power law a prop R23 consistent with the prediction of JKR theory eqn(276) [Reproduced from (Moy Jiao et al 1999)] This can be compared to the result obtained from a more rigorous analysis
⎡9πJR 2(1minus ν 2 ) 13 ⎤
a = ⎢ ⎥ (276)2E⎢ ⎣ ⎥⎦
and to experimental data obtained from spherical beads made from a 4 agarose gel (Fig 3113)
Models for receptor-mediated adhesion
In Chapter x and in the preceding text we discussed the energetics of bond formation and release
as well as the effect of applied force in altering the energy landscape of the bonded pair and
thereby the rate constants for bond kinetics That analysis has obvious implications to the
44
CHAPTER 21 CELL MEMBRANE MECHANICS AND ADHESION copyRD Kamm 4615
adhesion of cells to substrates the surrounding extracellular matrix and other cells Here we
extend that analysis in the specific case of whole cell adhesion In doing so it will be important
to consider such factors as the distribution type and density of receptor-ligand bonds or
potential bonds and the elastic properties of the structures to which they are anchored On the
intracellular side this involves the series of couplings that link the receptor to the cell In the
simplest case this might simply be a link to the lipid bilayer if the receptor has no intracellular
connections More typically especially for couplings with a structural role it involves a series
of proteins ultimately linking the receptor to the cytoskeleton
The typical setting in vivo is one in which cells adhere to other cells or to the extracellular
matrix Adhesions are more easily probed however through in vitro experiments (described
below) where cell adhesion more often occurs to an artificial substrate mediated through one of
several extracellular proteins that are used to coat the surface Generally either collagen or
fibronectin is used Cells are often adhered to these substrates but to produce a more controlled
environment rigid beads are sometimes coated with the appropriate receptors so that one specific
receptor-ligand interaction can be probed While these systems are useful as models of certain
adhesion phenomena it is important to recognize in the interpretation of these experiments that
when bound to a rigid substrate or bead the binding proteins cannot freely diffuse as they would
in a more natural environment In particular the formation of focal adhesions would not occur in
bead-substrate experiments because the receptors would be constrained from aggregating
It is instructive to begin this discussion with a consideration of a single adhesion bond
for example one linking the actin matrix of the cytoskeleton to a β1 integrin and the integrin
receptor binding to the extracellular matrix beyond the cell membrane (Fig 3114) If the bond
is stressed as for example if the cell experiences a force relative to the ECM it will at first
stretch an amount dictated by the level of force in the bond and the stiffness of the complex
Each bond as well as each protein in the bond complex can be thought of as having a certain
stiffness giving rise to a picture in which several springs are considered connected in series
Forces acting on the adhesion complex are transmitted via this series of bonded proteins between
the CSK and the ECM producing local deformations and stresses in the corresponding matrices
that decay with distance from the adhesion site On the intracellular side these forces are
transmitted via a complex involving vinculin α-actinin paxillin and talin Attachment to the
extracellular matrix is mediated by an RGD sequence (in fibronectin for example) which in turn
has binding sites for collagen and fibrin If the force is sufficiently strong above a certain
threshold value F0 say and applied for a sufficiently long time the bond might be severed (deshy
couple) Typical values of this threshold force lie in the range of 10-100 pN (Evans and Ritchie
1997) but depend as well on the rate at which the force is increased Under more rapid
forcings the threshold is high compared to when the force is increased slowly This simply
45
CHAPTER 21 CELL MEMBRANE MECHANICS AND ADHESION copyRD Kamm 4615
reflects the fact that detachment is a stochastic process and that at any given level of force there
exists a finite probability of detachment and this probability increases with time
Fig 3114 One type of attachment linking the intracellular actin matrix to the extracellular matrix via an integrin complex that involves in addition vinculin α-actinin paxillin and talin (Reproduced from Lodish et al Molecular Cell Biolology 2000)
We need also to consider that in equilibrium a fraction Φ = K(1+K)-1 (where K is the
equilibrium constant) of the receptors will be bound at any given time and that the receptorshy
ligand complexes are continually cycling between the bound and unbound states characterized
by their respective rate constants
On a larger scale numerous adhesion sites typically act in parallel each contributing
some amount to the total adhesion force If the force transmitted by each single adhesion
complex is F and the density of adhesion sites (per unit membrane area) is NC then the stress
acting on the cell is the product F NC This gives a somewhat false impression however as it is
unlikely that each adhesion complex carries an equal force Put another way there exists a local
stress τ that can be thought of as the product of the average force per bond times the bond
density This stress is typically non-uniform In the adhesion of a cell to a flat substrate the
bonds near the periphery of the contact zone determine the strength of the cell against
detachment and when the cell is subjected to a detaching force the stresses are concentrated in
46
CHAPTER 21 CELL MEMBRANE MECHANICS AND ADHESION copyRD Kamm 4615
this peripheral region as depicted in Fig 3115 In the vicinity of the edge of adhesion several
factors will influence the stress distribution including the mechanical properties of the membrane
(in particular the bending stiffness KB) the receptor density the spring constants of the bond
and the bond strength
N
Region of adhesion
x1
Fig 3115 Schematic model of a cell membrane being detached from a substrate by application of a tension force N The membrane is free to the left of the dash-dot line and adherent to the right Forces and moments are transmitted through the membrane which adheres to the membrane through receptor-ligand bonds represented by a continuous distrubution p(x1)
To illustrate consider the following simple model for an adherent cell being peeled away
from its substrate by a force that generates a tension N in the membrane (Fig 3115)
Deformations in the membrane are described by eqn (223) where it can be shown that the
bending term dominates provided KbL2 gtN where L is the characteristic length in the x1 direction
(due to the small length scales involved) and the external membrane force (p in the membrane
equation) is now the non-uniform stress due to adhesion bonds As a simple first approximation
we take p = k(δminusδ0) with δ-δ0 being the amount of stretch in the receptor-ligand bond springs
and k an effective bond spring constant Recognizing that p approaches zero far from the edge
(see Fig 319) the membrane displacement and the spring displacement are related u3 = δ-δ0
Thus eqn (228) is written
⎛ part 4 u
KB⎜ 3
⎞ 4 ⎟ = NC F = NC ku
⎝ partx ⎠ 3 (277)1
This can be solved directly showing that the distance of separation between the cell membrane
and substrate grows in an exponential fashion with distance Even more simply a scaling
47
CHAPTER 21 CELL MEMBRANE MECHANICS AND ADHESION copyRD Kamm 4615
analysis of eqn (277) in which the term on the left is approximated by Kbu3w4 where w is the
characteristic distance over which u3 varies tells us that the stresses are concentrated in a region
of width
K
w prop B4 (278)
NC k
near the cell periphery Similarly we can estimate that the cell membrane will detach from the
substrate if N gt FoNCw where F0 is a measure of the force in a single bond at the time of bond
rupture and that the rate of peeling can be roughly approximated as the product of the
disassociation rate k -- (bondss) from eqn (265) and the distance between bonds (N -12C )
Although this provides some insight into how the peeling rate depends on the various factors it fails to capture the fact that the cell remains in an equilibrium attached state even for non-zero levels of tension reflecting that even under force a balance can exist between the rates of formation and rupture of receptor-ligand complexes (Ra Picart et al 1999)
It is also of interest to note that in the region near the edge of the attachment zone(x1=0
in Fig 3115) the membrane acts as a beam subjected to a moment due to the applied tension
This moment is balanced by a force couple due to tension in the adhesion complexes right
adjacent to the edge in combination with a compressive stress between the cell and substrate a
little further in In typical situations this compressive stress can approach levels as high as one
atmosphere and can act to effectively smooth the membrane and recruit new attachment sights While using these continuum descriptions it is important to keep in mind the true
discrete nature of the individual bonds represented in the model as a continuous adhesive
surface This is brought to light by a simple calculation in which the characteristic length over
which the applied tension is supported w is compared to the inter-receptor spacing N -12C
Using typical values for the parameters NC = 103 complexesμm-2 k = 10-5 to 10-6 Nm Kb = 1 to 2x10-18 Nm we find that w cong 01 to 03 μm and the inter-complex spacing N minus1 2
C cong 003 μm While it is reassuring to see that w is typically less than the inter-complex spacing the difference is small It is therefore not surprising that the actual process of cell peeling is stochastic in nature occurring in a sequence of more-or-less discrete steps with a velocity of peeling that varies widely from the mean
The interplay between receptor-ligand bonding and membrane stiffness also determines whether a cell will spread over a surface or peel away from it under a given tension Membrane bending stiffness acts to maintain the membrane and substrate within close proximity near the edge of contact (Fig 3115) Spreading can occur only if their separation distance is within the extended length of the receptor ligand bond over a distance comparable to the linear spacing
48
CHAPTER 21 CELL MEMBRANE MECHANICS AND ADHESION copyRD Kamm 4615
between neighboring bonds ( N minus1 2 C ) Under high tension the surfaces rapidly diverge and
spreading is prevented if the tension is sufficiently low receptor-ligand bonding can occur and spreading can occur
Measurements of adhesion
A variety of methods have been used to experimentally determine the strength of adhesion either
of individual receptor-ligand bonds or populations of bonds as in the case of entire cells
Whole cell experiments are more common and typically require less experimental
sophistication The drawback of course is that they provide only for estimates of average
properties and require certain assumptions regarding the distribution of cell-substrate adhesive
stress for interpretation to the level of a single bond Several of these methods are described
next
Centrifugal cell adhesion assays In this experiment cells are allowed to attached to a substrate
then are placed in a centrifuge rotating at speed ω positioned a distance r from the center of
rotation and oriented so that the net centrifugal force is acting to separate the cell from the
substrate Using the arrangement shown in Fig 3116 (right) the acceleration of the cells is 2ω r and the net force acting on a cell of volume Vc is F = (ρc minus ρf )ω 2rVc where the fluid and cell densities are ρf and ρc respectively
Interpreting these results we can make several different assumptions each leading to a different estimate for the maximum force experienced by the binding complex If we simply assume that all receptor-ligand complexes support an equal fraction of the total force F then the force per bond is f = F (πa 2NC ) where NC is the concentration of bond complexes However as the cell tears away from the substrate the edge bonds will break first since these experience the greatest level of force An alternative approach then is to assume that the adhesion complexes around the cell circumference support the entire load leading to the estimate f = F 2( πaN 1 2 ) recognizing that N1 2
C C is the average distance between bonds A somewhatmore accurate value for f might be obtained if we assume that all complexes within the distance w given by eqn (278) support the load In any of these cases once the centrifugal force exceeds some critical limit since the number of receptors supporting the load falls as the region of contact becomes smaller the force per bond increases and the cell will rapidly detach
Stochastic variability also needs to be taken into account however since even under a constant load any single bond has a finite probability of failure under a given level of force The equilibrium state of the cell then should be viewed as one in which the rate of bond formation equals the rate of bond breakage with increasing force having the effect of reducing the
49
CHAPTER 21 CELL MEMBRANE MECHANICS AND ADHESION copyRD Kamm 4615
probability that the bond will remain intact These effects can be addressed using the methods described in more detail in Chapter xx Parallel flow assay Another common method for assessing cell adhesion is to plate the cells onto one wall of a parallel flow chamber subject them to a fluid dynamic shear stress and observe at what flow rate the cells begin to release If we ignore flow details in the immediate vicinity of the cell the shear stress can be estimated from the solution for a fully developed (Poiseuille) velocity profile
3V ⎡ y2
⎛ ⎞ ⎤v(y) = ⎢1minus ⎥ (279)
2 ⎝ ⎠ ⎣ ⎢ h ⎥⎦
so that the shear stress acting on the cell is
⎛ dv ⎞ 6μV τw = μ⎜ ⎟ = (280)
⎝ dy ⎠ h y = minush
and the total force can be estimated as F asymp τw Ac where Ac is the surface area of the cell membrane exposed to the flow Consider as an example a flow of culture medium at a rate of 1 mls through a channel of height 01 cm and width 1 cm If the culture medium has a viscosity close to that of water (μ=001 dyns) the shear stress is obtained from eqn (280)
6 sdot (001dyn sdot s) sdot (1ml s) ( 01 sdot10cm2 )τ dyn cm 2w = = 6 = 06Pa
01cm This corresponds roughly with the level of shear stress experience by endothelial cells in the arterial system If we consider that the cell has a surface area with dimensions roughly 100 μm x 10 μm or about 103 μm2 then the total force acting on the cell is obtained by integrating the shear stress over the area of the apical membrane Assuming that the shear stress is uniform the force is simply the product of shear stress and surface area or about 1 nN in the present example Again interpretation of results from such experiments requires careful consideration of the distribution of forces among the individual adhesion complexes In this situation the cell is likely to peel from the upstream edge in much the same manner as occurs in the cell peeling experiment discussed earlier
50
CHAPTER 21 CELL MEMBRANE MECHANICS AND ADHESION copyRD Kamm 4615
Radial flow and spinning disk assays One disadvantage of the parallel flow assay is that all cells are subjected to essentially the same level of shear stress so the flow rate needs to be incrementally varied in order to determine the level of force required for detachment These two systems using an axisymmetric geometry circumvent this problem by producing an easily characterized radial variation in shear stress In the case of the radial flow assay fluid enters through a central channel and flows radially outward through the narrow gap between two circular plates From conservation of mass the mean flow velocity is given by
QV = (281)
2πrh and sufficiently far from the center (rgtgth) the velocity profile is parabolic as in the parallel flow assay and the shear stress is again governed by eqn (280) using (281) for V Q
ω
(Not to scale)
v
h h
Cell layer rc Ce l l layer rc
r r
Fig 3116 Schematic diagram showing the radial flow assay (left) and the spinning disk assay (right) In the radial flow assay shear stress attains a maximum value near the center and falls with increasing radius r whereas in the spinning disk system maximum shear stress is experienced at large r In the spinning disk assay cells are grown on one disk and the opposite disk is rotated at constant speed Provided the rate of rotation is sufficiently small that inertial effects can be neglected the velocity is purely in the circumferential direction and the profile is linear between the two plates so that the shear stress experienced by the cells can easily be computed as
ωr τw = μ (282)
h
51
CHAPTER 21 CELL MEMBRANE MECHANICS AND ADHESION copyRD Kamm 4615
In both of these cases as in the parallel flow assay the total force is obtained by integrating the shear stress over the cell surface and the distribution of force among the adhesion complexes is weighted toward those located near the upstream end of the cell This can also be seen by consideration of the torque exerted by shear stress on the cell that must be balanced by a nonshyuniform contact stress with the substrate that is greatest near the upstream end Single bond adhesion assays Two other assays provide a means of obtaining estimates for the strength of a single adhesion bond without the need for excessive interpretation These rely on an ability to isolate a small number of bonds or even a single bond and infer bond strength from the step-wise nature of the de-adhesion process associated with breakage of discrete bonds One of these methods employs the atomic force microscope coated with the ligand of an adhesion receptor as shown in Fig 3117 The probe tip is gradually brought up to the cell surface until one or more receptor-ligand bonds are formed When the probe tip is withdrawn it moves along a different trajectory on a force-displacement plot reflecting the forces of adhesion These forces are seen to jump between more or less discrete levels as the probe continues to be moved away from the cell with each jump corresponding to the breakage of a single bond (Fig 3117) Using this method the bond strength between integrin receptor and a variety of RGD-containing ligands was found to lie in the range of 30 to 100 pN (Lehenkari and Horton 1999)
Fig 3117 The strength of a single adhesion bond can be measured by bringing a functionalized tip of an AFM probe up to the cell allowing bonds to form then slowly withdrawing the probe Monitoring the differences between the force displacement curve between the forward and reverse motions the forces necessary to break a single receptor-ligand bond can be determined [Reproduced from (Lehenkari and Horton 1999)]
52
CHAPTER 21 CELL MEMBRANE MECHANICS AND ADHESION copyRD Kamm 4615
A second method is similar in that the discrete increments in force are monitored as individual receptor-ligand bonds are broken but the forces are measured by means of changes in the shape of a giant vesicle the membrane of which contains the ligands have been inserted In this case one vesicle is made effectively rigid due for example to a high surface tension A second vesicle containing the adhesion molecules is also drawn partially into a micropipet but is much more complaint than the first The two vesicles are then brought into point contact so that one or a small number of adhesions are formed As the pipets are moved apart the compliant vesicle distorts due to the force of adhesion which it can be shown is related to the change in dimension of the vesicle in the direction of the force thereby serving as a sensitive force transducer measuring forces in the range of single adhesion receptors or between 1 and 100 pN [Evans 1991 37]
(For specific examples of leukocyte rolling and attachment see Orsello or Chang amp Hammer)
[This process is initiated for example by local infection that causes the release of
chemotactic agents in addition to cytokines hellip
Models of this process draw upon many of the concepts discussed in this chapter ]
Transient cell adhesion
Concepts of transient adhesion and release are of particular importance in the case of leukocyte
rolling adhesion and transmigration across the endothelial layer of a blood vessel In addition
cell migration through extracellular matrix or along a substrate requires the ability of the cell to
both form and release adhesions
One problem that has received considerable attention is the interaction between an
adherent or rolling leukocyte and the adhesion receptors on the endothelium These studies are
complicated by the three-dimensional nature of the flow the compliance of the interacting
surfaces and receptor-ligand dynamics In a series of recent studies Hammer and co-workers
(Chang Tees et al 2000) have addressed several of these issues computing the viscous force
and torque acting upon a sphere near to planar wall from the mobility matrix (Hammer and Apte
1992) and using the ldquoBell modelrdquo of receptor binding (Bell 1978) but neglecting the effects of
cell deformation The Bell model relates the dissociation rate constant kr to the force in the
bond f the thermal energy kBT and a parameter with units of length that depends on the
reactivity of the molecule
kr = ko r exp(γf kBT ) (283)
53
CHAPTER 21 CELL MEMBRANE MECHANICS AND ADHESION copyRD Kamm 4615
A Monte Carlo method is employed at each time step in the calculation to determine bond
formation or breakage In these studies the nature of the leukocyte-endothelial interaction is
characterized as firm adhesion rolling adhesion bimodal adhesion or no adhesion and mapped
as a function of the two parameters of the Bell model in Fig 3 The boundaries of the rolling
adhesion regime are identified for a wall shear rate of 100 s-1 (dotted lines) or 30 and 400 s-1
(solid lines) Most literature values for the Bell model parameters for a variety of selectin
receptors (known to be instrumental in leukocyte rolling) correspond to the rolling adhesion
regime for typical shear rate of 100 s-1 An interesting but counterintuitive result from this study
was the observation that as the bond stiffness was increased from the value used in most
calculations (100 dyne cm-1) adhesiveness decreased which the authors attribute to reduced
deflection for a given level of force leading subsequently to more rapid dissociation
Fig 3118 The state diagram for a leukocyte interacting with an endothelial surface for shear rates ranging from 30 to 400 s-1 For low dissociation rates the leukocyte remains adherent to the surface (lower left) As either (γ) or ( ko
r ) [see Eqn (283) for definitions] is increased the cell first adheres firmly then rolls along the wall then completely detaches (upper right) Rolling adhesion is defined as the regime where rolling occurs over some part of the shear rate range between 30 and 400 s-1 Firm adhesion indicates that cells remain attached even at the highest shear rate no adhesion indicates that cells roll at a velocity gt 50 of the velocity of a non-adherent sphere In the bimodal regime cells are either adherent or non-adherent and do not exhibit rolling Dotted curves correspond to these same boundaries for a shear rate of 100 s-1 Reproduced from Chang et al (2000)
54
CHAPTER 21 CELL MEMBRANE MECHANICS AND ADHESION copyRD Kamm 4615
In another recent study using high-resolution video-microscopy (Schmidtke and Diamond
2000) it was demonstrated that a flowing neutrophil can attach to an adherent platelet via
adhesion molecules located in the tips of the microvilli and form long tethers averaging nearly 10
μm in length but ranging up to 40 μm at extensional rates of 6-40 μm s-1 for shear rates ranging
from 100-250 s-1 The mechanics of tether formation is itself a fascinating topic that is still under
intense investigation Readers interested in pursuing this work in more detail are referred to the
several papers (Hochmuth Shao et al 1996 Dai and Sheetz 1998 Dai and Sheetz 1999) that
identify a number of intriguing phenomena
55
CHAPTER 21 CELL MEMBRANE MECHANICS AND ADHESION copyRD Kamm 4615
317 Nomenclature Parameter Definition Units
R - receptor
L - ligand
C - receptor-ligand complex
G - Gibbs free energy Nm
N - membrane tension Nm
NR - total receptor density -3μm-2 in 2D or μm in 3D NL - total ligand density μm-2 in 2D or μm-3 in 3D N in 2D or μm-3μm-2
C - complex density in 3D NRf - free receptor density m-2 in 2D or m-3μ μ in 3D NLf - free ligand density -2 -3μm in 2D or μm in 3D d+ - forward diffusional rate constant 2 -1μm s-1 in 2D or 3 μm s in 3D d -1
- - reverse diffusional rate constant s r+ - forward reaction rate constant s-1
r- - reverse reaction rate constant s-1 D 2 -1
m - membrane diffusion coefficient μm s D - solution diffusion coefficient m2 s -1s μ Kb - bending stiffness Nm K 0 - equilibrium constant or affinity (zero force) M-1 in 3D and 2μm in 2D = k0
+ k0 minus
K - equilibrium constant M-1 in 3D and m2μ in 2D = k+kshy
k0 - association rate constant (zero force) M-1 s-1 in 3D or m-2 -1+ μ s in 2D
k0 - dissociation rate constant (zero force) s-1 minus
k - association rate constant M-1 s-1 in 3D or m-2 -1+ μ s in 2D
kminus - dissociation rate constant s-1 f - force per bond N F - total adhesion force N γ - empirical parameter μm r0 - distance over which energy minimum acts μm E0 - bond energy J k JK-1
B - Boltzmanns constant T - temperature K τ - bond lifetime s
56
CHAPTER 21 CELL MEMBRANE MECHANICS AND ADHESION copyRD Kamm 4615
τ0 - bond lifetime with zero force s σ - adhesion stress N μm-2 κ - spring constant for receptor-ligand bond N μm-1
57
CHAPTER 21 CELL MEMBRANE MECHANICS AND ADHESION copyRD Kamm 4615
References Bell G I (1978) Models for the specific adhesion of cells to cells Science 200 618-627 Caille N O Thoumine et al (2002) Contribution of the nucleus to the mechanical properties
of endothelial cells J Biomech 35(2) 177-87 Chang K C D F Tees et al (2000) The state diagram for cell adhesion under flow
leukocyte rolling and firm adhesion Proc Natl Acad Sci U S A 97(21) 11262-7 Dai J and M P Sheetz (1998) Cell membrane mechanics Methods Cell Biol 55 157-71 Dai J and M P Sheetz (1999) Membrane tether formation from blebbing cells Biophys J
77(6) 3363-70 Daily Elson et al (1984) Determination of the elastic area compressibility modulus of the
erythrocyte membrane Biophys J 45(4) 671-682 Evans E and K Ritchie (1997) Dynamic strength of molecular adhesion bonds Biophys J
72(4) 1541-55 Evans E A (1983) Bending elastic modulus of red blood cell membrane derived from
buckling instability in micropipet aspiration tests Biophys J 43(1) 27-30 Hammer D A and S M Apte (1992) Simulation of cell rolling and adhesion on surfaces in
shear flow general results and analysis of selectin-mediated neutrophil adhesion Biophys J 63(1) 35-57
Hardt S L (1979) Rates of diffusion controlled reactions in one two and three dimensions Biophysical Chemistry 10 239-243
Hochmuth F M J Y Shao et al (1996) Deformation and flow of membrane into tethers extracted from neuronal growth cones Biophys J 70(1) 358-69
Kucik D F E L Elson et al (1999) Weak dependence of mobility of membrane protein aggregates on aggregate size supports a viscous model of retardation of diffusion Biophys J 76(1 Pt 1) 314-22
Kusumi A Y Sako et al (1993) Confined lateral diffusion of membrane receptors as studied by single particle tracking (nanovid microscopy) Effects of calcium-induced differentiation in cultured epithelial cells Biophys J 65(5) 2021-40
Lehenkari P P and M A Horton (1999) Single integrin molecule adhesion forces in intact cells measured by atomic force microscopy Biochem Biophys Res Commun 259(3) 645-50
McCloskey M and M M Poo (1984) Protein diffusion in cell membranes some biological implications Int Rev Cytol 87 19-81
Meleard P Gerbeaud C Bardusco N Mitov MD and Ferdandex-Puente L (1998) Mechanical properties of model membranes studied from shape transformations of giant vesicles Biochimie 80 401-413
Moy V T Y Jiao et al (1999) Adhesion energy of receptor-mediated interaction measured by elastic deformation Biophys J 76(3) 1632-8
Ra H J C Picart et al (1999) Muscle cell peeling from micropatterned collagen direct probing of focal and molecular properties of matrix adhesion J Cell Sci 112 ( Pt 10) 1425-36
Saffman P G (1976) Bownian motion in thin sheets of viscous fluid Journal of Fluid Mechanics 73 593-602
Schmidtke D W and S L Diamond (2000) Direct observation of membrane tethers formed during neutrophil attachment to platelets or P-selectin under physiological flow J Cell Biol 149(3) 719-30
Sheets E D R Simson et al (1995) New insights into membrane dynamics from the analysis of cell surface interactions by physical methods Curr Opin Cell Biol 7(5) 707-14
58
CHAPTER 21 CELL MEMBRANE MECHANICS AND ADHESION copyRD Kamm 4615
Vink H and B R Duling (1996) Identification of distinct luminal domains for macromolecules erythrocytes and leukocytes within mammalian capillaries Circ Res 79(3) 581-9
Waugh R and E A Evans (1979) Thermoelasticity of red blood cell membrane Biophys J 26(1) 115-31
Zeman K H Engelhard et al (1990) Bending undulations and elasticity of the erythrocyte membrane effects of cell shape and membrane organization Eur Biophys J 18(4) 203shy19
Zhelev D V D Needham et al (1994) Role of the membrane cortex in neutrophil deformation in small pipets Biophys J 67(2) 696-705
59
MIT OpenCourseWarehttpocwmitedu
20310J 3053J 6024J 2797J Molecular Cellular and Tissue BiomechanicsSpring 2015
For information about citing these materials or our Terms of Use visit httpocwmiteduterms
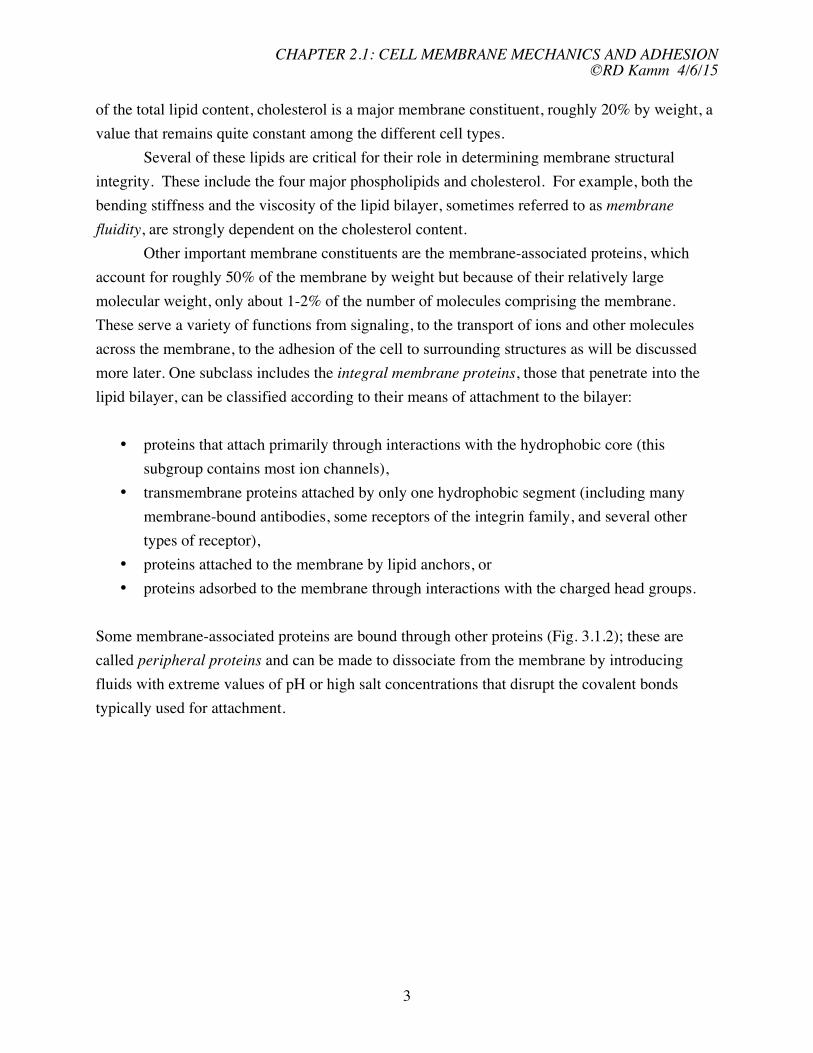
CHAPTER 21 CELL MEMBRANE MECHANICS AND ADHESION copyRD Kamm 4615
Sakmann in 1976 has spawned many of the experiments on which our current understanding of
membrane ion transport is based
Other integral membrane proteins are used for adhesion of the cell to surrounding
structures for signaling or for the control of biochemical reactions Discussion of adhesion
proteins will come later in Section 316 Signaling is accomplished in a variety of ways but is
most often mediated by the transfer of molecules across the membrane either directly by
diffusion or via selective channels or by binding of a ligand to a cell surface receptor Each time
a signal is received by means of receptor-ligand binding the result is a conformational change
in the receptor that initiates other biological processes via a signaling cascade involving a host of
other intermediate molecules Not infrequently the reaction initiated by ligand-receptor binding
is with another protein located within the membrane or closely associated with it Being
constrained to two dimensions rather than free to move in three can greatly accelerate reactions
that are diffusion-limited For example the time required for a molecule to reach a target of
diameter dT located a distance L away is approximately L3 (3DdT ) in three dimensions and
(L2 2D)ln(L dT ) in two where D is the diffusion coefficient (Hardt 1979)
Recognizing its fluid-like nature and multi-component structure Singer and Nicolson
proposed the fluid mosaic model for the membrane in 1972 This model emphasizes that the
lipids form a highly fluid-like phase while the proteins tend to aggregate in isolated islands that
are relatively rigidly structured giving rise to a mosaic-like arrangement Both the proteins and
lipids are free to diffuse within the plane of the membrane unless tethered to fixed structures
either internal or external to the cell The fluid-like nature of the membrane especially the lipid
portion accounts for the low resistance to shear deformations in the plane of the membrane In
addition the hydrophobic interior behaves essentially like a hydrocarbon fluid allowing the two
leaflets to slide freely relative to one another
Aside from the lipid bilayer the cell plasma membrane has associated macromolecular
structures on both intra- and extracellular sides giving rise to a three-layer composite
construction On the intracellular side the membrane is physically attached to a cortex or the
cytoskeleton The cortex is a dense filamentous structure that lends stiffness to the membrane
and can also interact with various transmembrane proteins often impeding their free diffusion
either by steric interactions or direct chemical bonding In some cells the cortex is simply a
region of dense cytoskeletal matrix in the vicinity of the bilayer In others it exhibits a distinctly
different structure or composition For example erythrocytes possess a cortex comprised of a
network of spectrin tetramers linked by actin filaments This network is attached to the
membrane by ankyrin and the integral membrane protein band 3 (Fig 313) This spectrin
network accounts for much of the bending stiffness exhibited by the red cell membrane
5
CHAPTER 21 CELL MEMBRANE MECHANICS AND ADHESION copyRD Kamm 4615
Fig 313 Structure of the membrane-associated cortex in an erythrocyte as viewed from the inside of the cell a) Schematic representation showing the arrangement of the spectrin filaments joined by short segments (13 monomers) of actin and tethered to the membrane through ankyrin and band 3 Junctional complexes containing actin tropomyosin adductin and band 41 also bind to band 3 and glycophorin b) An electron micrograph showing the same structures [From Molecular Biology of the Cell Bruce Alberts Dennis Bray Julian Lewis Martin Raff Keith Roberts James D Watson copy 1994]
External to most cells is found a glycocalyx which has been shown to extend as far as 05
μm from the surface of endothelial cells where it forms a compressible barrier separating circulating erythrocytes and leucocytes from the endothelial membrane The glycocalyx is comprised of short oligosaccharide chains glycoproteins glycolipids and high molecular weight proteoglycans all organized into an interconnected network with an overall negative charge Although its function is not completely understood it apparently plays a role in macromolecular transport across the endothelium and is an important factor in the interaction between blood-borne cells and the endothelium Studies have demonstrated that the glycocalyx in a capillary is readily compressed by a passing leukocyte yet is sufficiently rigid to prevent flowing erythrocytes from approaching the endothelial surface (Fig 314)
6
CHAPTER 21 CELL MEMBRANE MECHANICS AND ADHESION copyRD Kamm 4615
Fig 214 Images of a capillary segment in the hamster cremaster muscle with an intact glycocalyx (AB) and with the glycocalyx collapsed by treatment of the vessel with epi-illumination (CD) using either bright field illumination (AC) or fluorescent imaging using a dye too large to penetrate the glycocalyx (70 kD molecular weight FITC-dextran) The capillary wall is visualized by a membrane-specific dye PKH26 in A and C Width of the glycocalyx is indicated by the gap between the erythrocytes and the wall in A and C and by the change in effective capillary diameter before (B) and after (D) epi-illumination In this series capillary diameter increased from 47 to 54 μm suggesting awidth of the glycocalyx of 035 μm [Reproducedfrom Vink amp Duling (Vink and Duling 1996)
313 Membrane Mechanics
For the purpose of analysis we treat the cell membrane as a homogeneous two-dimensional plate
or sheet completely enclosing the cytoplasm The membrane referred to here can be thought of
either as the lipid bilayer by itself or more typically as the bilayer plus the associated cortex of
cytoskeletal filaments and glycocalyx on the extracellular surface In addition though not
explicitly recognized in the analysis transmembrane proteins and their attachments to the
intracellular and extracellular milieu are included in terms of their influence on the continuum
7
CHAPTER 21 CELL MEMBRANE MECHANICS AND ADHESION copyRD Kamm 4615
properties of the model Were it not for these the membrane would exhibit little resistance to
shear deformation
In qualitative terms the lipid bilayer can be thought of as a two-dimensional fluid within
which the individual lipid molecules or other molecules embedded in the membrane are
relatively free to move about by diffusion or directed motion Phospholipid molecules in either
of the two layers resist being pulled apart however so each layer is highly inextensible This
also contributes to the bending stiffness which is low in absolute terms but high for such a thin
layer since bending requires one layer to expand while the other is compressed By contrast the
two layers readily slide relative to each other These qualitative notions are put in more
quantitative terms in the next section
Types of deformation
Any deformation can be thought of in general terms as a superposition of several
simpler deformations For small strains in which linearization is appropriate the principle of
superposition is rigorously valid For larger strains however linear theory breaks down and
superposition can only be used as a rough qualitative guide in visualizing combined influences
Here we present the three primary types of deformation pure extension pure bending and pure
shear Later we also consider the influence of membrane viscosity in time-dependent
deformations
σ2
A
A0
σ1 σ1
x2
σ2
x1 Fig 315 A membrane initially of area A0 subjected to a uniform extensional stress along its edges σ1 = σ2 causing an increase in area to A
Pure extension In discussing the extensional stiffness of the membrane we need to distinguish
the behavior at low tension from that at high tension As you first begin to apply an extensional
8
CHAPTER 21 CELL MEMBRANE MECHANICS AND ADHESION copyRD Kamm 4615
stress at the edges of a lipid bilayer the projected or apparent membrane area first increases
while the actual or true membrane area remains constant This results from the suppression of
out-of-plane undulations Forces acting to resist membrane flattening originate from entropic
effects analogous to those seen in the case of a flexible polymer as its end-to-end distance is
increased ndash many more membrane configurations exist with undulations compared to the single
perfectly flat state Only when these undulations have been eliminated does the true membrane
area proportional to the surface area per molecule group begin to increase and this is associated
with a relatively abrupt increase in extensional stiffness For now we consider only the stiffness
of a flat membrane and leave the discussion of undulations of entropic origin to a later point in
the chapter Hence we initially neglect all entropic effects or equivalently consider the
membrane to be at zero temperature
Based in this assumption consider an infinitesimal plate initially of area A0 = L 20 that is
deformed by a uniform normal stress τ11 = σ1 = τ22 = σ2 applied to its edges (Fig 315) to a
new area A Previously we derived the expressions relating stress and strain which in two
dimensions and in the absence of stresses normal to the x1-x2 plane can be written
E
σ α = 2 (εα + νε β ) (21) 1minus ν
where the length of one edge Lα=L0(1+εα) Note that in this chapter we use the subscripts α β
rather than i j to distinguish stresses and strains in two dimensions from those more generally
in three Thus whereas i and j can be either 1 2 or 3 α and β are restricted to being either 1 or
2 When this stress is uniform in the plane of the membrane (the x1- x2 plane) it can be replaced
without loss of generality by a surface tension Nα (force per unit length) defined as σ α h where h
is the thickness of the membrane These can be combined in the case when N1 = N2 = constant
and consequently ε1 = ε2 = ε to give
Eh
N = ε (22)1 minus ν
In terms of a plate stretched uniformly in both directions we can define the areal strain as
ΔA A minus A 2 2 2
= 0 L0 (1+ ε ) minus L= 0
2 cong 2ε (23)A0 A0 L0
where the last approximation is appropriate for small strains By combining this result with eqn
(22) we can define the area expansion modulus Ke (units of Nm)
9
CHAPTER 21 CELL MEMBRANE MECHANICS AND ADHESION copyRD Kamm 4615
Eh ΔA Δ A
N = equiv K (24)2(1minus ν) A e
0 A0
Note that although we used the continuum structural equations in our analysis the final result
can also be viewed as simply the definition of the area expansion modulus and applies regardless
of whether or not the membrane can be modeled as a continuum
Experimental measurements of Ke lie in the range of 01-1 Nm for various types of lipid
bilayers and about 045 Nm (450 dyncm) for red blood cell membranes (Waugh and Evans
1979) These numbers suggest that cell membranes are quite resistant to extension and for that
reason are often treated as inextensible1 This high resistance to area change is in large part due
to the energy penalty associated with exposing the hydrophobic core of the membrane to water
that occurs as the spacing between individual amphiphilic molecules is increased [for a detailed
description of bilayer structure and thermodynamics see Tanford (1980) or Israelachivili
(1991)] Continuing to increase extensional stress the lipid bilayer eventually ruptures but at
very small extensional strains in the vicinity of 2 to 3 (Mohandas amp Evans 1990) Note that a
bilayer in a lipid vescicle for example stretches primarily by increasing the area per molecule
since recruitment of additional material to the membrane occurs very slowly
Using these expressions we can estimate the level of surface tension at which the
membrane would rupture At a 3 extensional strain (6 areal strain) uniformly applied in the
x1-x2 plane the surface tension at rupture would be about 006 Nm if we use a value near the
higher end of the observed range Ke = 1 Nm Using Laplaces law [see eqn (227)] for the
relationship between the pressure difference (ΔP) across a spherical shell of radius R = 1 μm and
the surface tension in the shell gives us
2N
ΔP = = 12x105 Pa cong 1200cmH 2O R
a remarkably high value of pressure given the thickness of the membrane is only 6 nm
Cells also often exhibit an intrinsic surface tension Reported values are small however
lying in the range of about 10-5 to 10-4 Nm (Sheets Simson et al 1995) For comparison recall
that the surface tension across the interface of a droplet of pure water is about 007 Nm a value
close to the rupture stress of the membrane given above It becomes immediately obvious then
that the tension of a cell membrane must be orders of magnitude smaller than the surface tension
1 This discussion neglects the effects of thermal fluctuations in the membrane that give rise to a much more compliant behavior at the smallest areal strains When surface stress is sufficient to smooth out most thermal fluctuations the cell or vesicle will exhibit the large moduli given here See also Example xx later in this chapter
10
CHAPTER 21 CELL MEMBRANE MECHANICS AND ADHESION copyRD Kamm 4615
of a typical gas-liquid or liquid-liquid interface since it would otherwise give rise to intracellular
pressures on the order of one atmosphere
Pure bending By contrast lipid bilayers exhibit a very low bending stiffness so low that it is
often neglected in models of membrane mechanics It can be important in certain situations
however and is essential for example in analyzing the thermal fluctuations of vesicles discussed
later in this chapter
Bending stiffness arises from the same type of molecular interactions that cause
extensional stiffness When an initially flat bilayer is bent the hydrophilic head groups on the
outside of the bend move further apart while on the inside intermolecular spacing decreases
both represent departures from the equilibrium unstressed state and require energy If the same
forces of interaction are responsible why then is bending stiffness so low While the answer to
this question is not simple one factor is the membrane thickness which you recall is only about
6 nm As the membrane bends therefore the change in the surface area per molecule is
extremely small so the associated extensional strains are also minute
Returning to our simple continuum plate model consider a bending moment applied to
the two ends causing the plate to curve slightly (Fig 316) If the bending is due to moments
applied at the two ends about the x2-axis then the bending moment per unit length is related to
the deflection by
Et 3 ⎛ part 2u ⎞ ⎛ part 2 ⎞
⎜ 3 u
Mα = minus 2 2 ⎟ = minusK B⎜ 32 ⎟ (25)
12(1minus ν ) ⎝ partxα ⎠ ⎝ partxα ⎠
where KB is termed the bending stiffness having units of Nm Implicit in this expression are the
assumptions that there exists a mid-plane (the neutral plane) on which the in-plane stress and
strain are both zero and that straight lines perpendicular to this mid-plane remain straight and
normal to this surface after deformation
Typical values for the bending stiffness KB lie in the range of 10-19 Nm (10-12 dyncm) for
a red blood cell or lipid bilayers (Mohandas amp Evans 1990) This value is larger on the order of
1-2x10-18 Nm (Zhelev Needham et al 1994) for other cell types (eg neutrophils endothelial
cells) that possess a more extensive cortex The methods used to obtain these values will be
described later in this chapter
11
CHAPTER 21 CELL MEMBRANE MECHANICS AND ADHESION copyRD Kamm 4615
Fig 316 Plate subjected to equal moments M1 at the two edges
Example Estimate the moment per unit length acting within an initially flat lipid bilayer (at zero
temperature) associated with a wavelength λ = 5 μm and amplitude ε = 1 μm
Membrane displacement can be approximated by the expression
u3 = ε sin (2πx1 λ) (26)
From eqn (25) above we obtain
2
⎛ 2π ⎞ M1 = KBε sin (2πu )⎝ ⎠ 3 λ (27)λ
Using the values given above the maximum moment per unit length is 0158 pN
Pure shear Shear deformations arise when a membrane is stretched in one direction by a
surface tension N1 (units of forcelength) while the lateral surface contracts under a lesser tension
N2 at constant surface area and in the absence of bending (Fig 317) Surfaces oriented at 45
degrees to the boundaries experience pure shear stresses of magnitude (N1 - N2)2
When subjected to shear stresses in the plane of the membrane a pure lipid bilayer
behaves essentially as a liquid It exhibits a membrane viscosity in that it poses a resisting force
proportional to the rate of shear deformation but only a small shear modulus to static shear
deformations It is not clear in fact whether or not pure lipid bilayers exhibit a non-zero shear
modulus For example the movement of membrane-bound proteins can be described by a
simple diffusion coefficient proportional to the membrane viscosity Typical cell membranes do
exhibit a shear modulus however largely due to the cortex of cytoskeletal filaments that lie on
the intracellular side of the membrane In a red blood cell this matrix as discussed above
12
CHAPTER 21 CELL MEMBRANE MECHANICS AND ADHESION copyRD Kamm 4615
consists of interconnected filamentous spectrin and actin with attachments to the membrane via
ankyrin
N2
N1 N1
N2 Fig 317 A section of membrane subjected to a shear stress of magnitude N1-N22
The equations relating shear stress to shear deformation (Hookes law) from Ch xx can
be applied here
τ12 = τ 21 =2Gε12 (28)
or expressed as a shear force per unit length of membrane
N12 =τ12 h = 2Gε12 = Ksε12 (29)
where we define the membrane shear modulus Ks with units of Nm Typical values lie in the
range of 6-9 x 10⁻⁶ Nm for a red blood cell membrane A pure lipid bilayer exhibits a viscous
resistance to shear deformations characterized by a shear viscosity of about 10-6 Nsm ((Evans
1983))
The 2D elastic plate -- equations of deformation
In the analysis of cellular membranes several unique characteristics need to be taken into
account
1 The membrane is extremely thin relative to its lateral extent If we consider the thickness to
be that of the lipid bilayer by itself then h can be as small as 6 nm compared to a typical cell
dimension on the order of 10s of μm Even if we include the sub-membrane cortex this
13
CHAPTER 21 CELL MEMBRANE MECHANICS AND ADHESION copyRD Kamm 4615
dimension only increases to about 100 nm This tends to favor in-plane stresses over bending
effects2
2 The non-shear deformations are very small with strains of at most a few percent Therefore
linear analysis is appropriate in many situations Note however that nonlinear effects can be
important especially for large shear deformations such as occur in micropipet aspiration of
red blood cells The implications and limitations of this are discussed more fully below
3 The membrane exhibits a very small modulus in plane shear and is often treated as a two-
dimensional liquid While this applies primarily to lipid bilayers when the membrane is
considered to include the cortex greater values of shear modulus can be observed
4 Stresses normal to the membrane are small and can be neglected
5 Membrane motions can be damped either due to viscous dissipation within the bilayer as in
the case of in-plane shear or due to the viscosity of the fluids on the intra- or extracellular
sides of the membrane These latter are especially important when considering motions of
the membrane perpendicular to its plane
6 Inertial effects can be neglected due to the predominance of viscous forces during transient
deformations
With these in mind and acknowledging the limitations of a continuum view of such
structures we treat the membrane as a thin homogeneous plate or membrane in which all the
following must be considered in-plane extension and shear bending viscous damping and
thermal fluctuations
The equations we derive will effectively be integrated through the membrane thickness so
that stresses will be in terms of surface forces (force unit length) These are the in-plane normal
forces (see Fig 318 for definition of the axes and nomenclature) are therefore written as
+ h 2
Nα = int σ α dx3 (210) minus h 2
where h is the membrane thickness and the vertical shearing forces
+ h 2
Vα = (211) minus h
int τα 3dx3
2
The moments acting on the plate edges can be calculated from
2 Whether tension or bending dominates clearly depends on the nature of the experiment If an initially spherical cell is distended tension is most important if the cell shrinks so that the membrane buckles bending effects will be critical
14
CHAPTER 21 CELL MEMBRANE MECHANICS AND ADHESION copyRD Kamm 4615
+h 2
Mα β = int x3τα β dx3 (212)minush 2
x
(c)
Fig 318 (a) A small section of membrane (b) Membrane deflections (c) Nomenclature used in defining the forces acting on a section of membrane (Note that Q is used to represent shear stress in the figure whereas V is used in the text and (xyz) should be (x1x2x3))
In order to distinguish the effects of bending from those giving rise to extension we separate the
normal stress into two parts one representing the mean over the thickness of the membrane
which is simply Nαh and the other representing the deviation from this value denoted as σαprime
Similarly we separate the displacement on the neutral plane unα from that which varies with x3
denoted as uαprime Consequently we can write
N
uα = u n + primeα and = iα u σ α + primeσ α (213)
h
And consistent with the assumption that planar edges initially normal to the membrane remain
planar under bending deformations we have that
15
CHAPTER 21 CELL MEMBRANE MECHANICS AND ADHESION copyRD Kamm 4615
partu uαprime = minus x 3
3 (214)partxα
According to assumption (4) above the relationships between stress and strain become
E σ α = νε β ) α ne β (215)
minus ν2 (ε1 α +
and
E ταβ = εαβ α ne β (216)
(1+ ν )
Since
partuα partunα partu
= αprime ε α = + (217)
partxα partxα partxα
(summation convention not used) We eventually obtain the following expressions for the
bending moment
+h 2 ⎛ part 2 u part 2 ⎞ M 3 u3
α = int σ α x3dx3 = minusKB ne (218)⎜ ⎝
2 + ν ⎟ α β partx 2
minush 2 partxα β ⎠
and
+ h 2 part 2u
M12 = int ε KB (1minus ν) 312 x3dx3 = minus (219)
minus h 2 partx1partx2
where in classical shell theory for continuum materials KB=Eh3(1-ν2) The moments are related
to the shear forces in the plane of the membrane through a moment balance about the x1 axis
giving
partM 12 partM
+ 2 minus V2 = 0 (220)partx1 partx2
so that
part ⎛ part 2 u part 2 u ⎞ part ⎛ part 2 part 2
V = minus 3 + 3 uandV 3 u
K ⎜ ⎟ = minus K ⎜ + 3⎞
2 B ⎟ (221)partx2 ⎝ partx 2 2 ⎠ 1 B 2 2
1 partx2 partx1 ⎝ partx1 partx2 ⎠ A force balance in the direction normal to the membrane yields
16
CHAPTER 21 CELL MEMBRANE MECHANICS AND ADHESION copyRD Kamm 4615
partV1 partV2 part ⎛ partu ⎞ part ⎛ partu ⎞+ + ⎜ N 3 ⎟ + ⎜ N 3 ⎟
2 + p = 0 (222)x 1
part 1 partx2 partx1 ⎝ partx1 ⎠ partx2 ⎝ partx2 ⎠
which upon substitution for V1 and V2 from eqns (221) becomes
⎛ part4u3 part4u part4u3 part part ⎛ ⎞K 3 ⎞ part ⎛ u ⎞
B 4 N 3 partu
+ 2 + minus minus N 3 minus p = 0 (223)⎜ ⎟ ⎜ ⎟ ⎜ ⎟⎝ partx1 partx2partx2 partx4 ⎠ partx ⎝ 1 partx ⎠ partx ⎝ 21 2 2 1 1 2 partx2 ⎠
Recall that the first term in parentheses is due to bending the second and third terms are due to
in-plane extension and the fourth term represents the pressure difference across the membrane
Eqn (223) contains three unknowns the displacement u3 and the two normal forces per
unit length N1 and N2 Fortunately the additional equations required for solution are quite easy
to obtain from simple force balances in the x1 and x2 directions Setting the sum of forces in the
x1 direction equal to zero we obtain (referring to Fig 319)
minus N1(x1) + N1(x1 + dx1)cosθ (x1 + dx1) minus N21 (x2 ) + N21(x2 + dx2 ) = 0 (224)
or
partN1 partN21 partN2 partN + = 0 and similarly + 12 = 0 (225)
partx1 partx2 partx2 partx1
While formidable in its complete form it is reassuring to know that we rarely use eqn
(223) in its entirety and that when certain limiting cases are considered more familiar equations
are obtained It is useful at this stage to consider several of these limits
Fig 319 x1 force balance in the plane of the membrane
17
CHAPTER 21 CELL MEMBRANE MECHANICS AND ADHESION copyRD Kamm 4615
Balance between pressure and surface tension (Laplacersquos Equation) If the in-plane stress is
uniform (Ni=Nj=N) eqn (223) has the form
⎛ part 4u part 4u part 4u ⎞ ⎛ part 2u KB ⎜
3 4 + 2 3 3
2 2 + 4 ⎟ minus N⎜ 3 part 2u
2 + 3 ⎞
2 ⎟ minus p = 0 (226)⎝ partx1 partx1 partx2 partx2 ⎠ ⎝ partx1 partx2 ⎠
and eqn (225) is trivially satisfied If in addition bending stiffness can be neglected then
⎛ part 2 u part 2 ⎞ ⎛ 1 1 ⎞ 3 u
p = minusN ⎜ 3
2 + 2 ⎟ cong N⎜ + ⎟ (227)⎝ partx1 partx2 ⎠ ⎝ R2 R1⎠
for small curvatures where R1 and R2 are the radii of curvature of the membrane about the x1 and
x2 axes respectively This is the well-known Laplacersquos equation with N the surface tension For
a sphere R1 = R2 and the equation simplifies further yielding the equation given on p 10
Balance between pressure and bending Alternatively if all in-plane stresses can be neglected
other than those associated with bending stiffness we obtain the equation generally used for
simple bending of plates and shells
⎛ part 4u part 4u part 4 3 3 u ⎞
KB ⎜ 4 + 2 2 + 3 ⎟ = p (228)
⎝ partx1 partx1 partx2 partx 4 2 2 ⎠
Both of these forms will be used later in this chapter to examine specific problems in cell
membrane mechanics
The conditions under which eqn (226) can be reduced to either (227) or (228) can be
determined by an order of magnitude comparison of the bending and tension terms If we take u
to be a measure of the membrane displacement in the x3 direction and λ to be the characteristic length in the x1 or x2 directions over which u3 varies then the bending term can be shown to scale as K 4 2
Bu λ and the tension term as Nu λ The ratio of these tells us which of the terms dominate in eqn (226) If
KBu λ4 K= B ltlt 1
Nu λ2 Nλ2
then tension dominates and eqn (227) is appropriate Alternatively if
KB gtgt 1 Nλ2
18
CHAPTER 21 CELL MEMBRANE MECHANICS AND ADHESION copyRD Kamm 4615
then bending dominates and eqn (228) should be used If we take values typical of those given
for cells K N = 5x10⁻⁵B = 10-18 Nm Nm λ = 1 μm this ratio equals 002 confirming as we
originally postulated that tension tends of dominate
Nonlinear formulations
Traditionally membrane deformations have been addressed through nonlinear analysis allowing
for large strains especially in shear Here we have chosen to present the linearized equations in
the hope that they will provide clearer insight and for continuity with the approach used in other
chapters of the text For many problems of interest deformations are small and linear theory is
sufficiently accurate In some circumstances however a nonlinear analysis is necessary one
example being the aspiration of a red blood cell membrane into a micropipet For this reason we
present the nonlinear equations in Appendix A for the more advanced reader and to assist in
reading the recent literature on membrane mechanics
Energies of deformation
Although the formulation of the equations of deformation in Section 316 is complete by itself
an alternative approach is often useful in which we consider the strain energy the energy stored
in the membrane due to elastic deformation as a basis for analysis Strain energy is analogous to
the energy stored in a spring by stretching it If the spring is linear with a stiffness k so that the
force F required to lengthen it from x0 to x is k(x-x0) then the energy expended during the
process of lengthening is
x x
U = int Fdx = int k(x minus x0 )dx = 1 2 k(x minus x0)
2 (229)x= x 0 x = x 0
Extensional energy Now consider a section of an elastic membrane of thickness h and lengths
dx1 and dx2 subjected to a uniaxial tension stress σ1 Here as in our previous discussion we
consider two cases first a flat membrane which is being stretched by extensional stresses (the
case at zero temperature) and second the situation in which the surface area of the membrane
projected onto a flat plane increases due to the smoothing of out-of-plane undulations (the
entropic contribution)
As the stress is gradually applied to minimize any dissipative effects the work done by
the external force must equal the gain in elastic energy stored in the plate The work performed
by this stress is
19
CHAPTER 21 CELL MEMBRANE MECHANICS AND ADHESION copyRD Kamm 4615
ε1 ε 1
dU = int σ 1dε 1dx1dx2 dx3 = int Eε1dε1dx1dx2dx3 (230)0 0
By energy conservation the work done in stretching the membrane must be stored as potential
or strain energy in the elastic member Since the right-hand-side of (330) represents the strain
energy in the volume dx1dx2dx3 then the energy per unit volume of membrane is
ε1 ε1
U0 = int σ 1dε1 = int Eε = 1 Eε21dε1 2 1 (231)
0 0
or expressed as energy per unit area of membrane
Ehε2
U 10h = (232)
2 In the somewhat more general case of biaxial strain a similar approach leads to
Eh ⎡ 2 2
( 2 2 ) Eh ⎛ ⎤partu ⎞ uε1 + ε 2 = ⎢⎜
1 ⎛ part
⎟ + ⎜ 2
⎞ U0h = ⎟ ⎥ (233)
2 1( minus ν ) 2 1( minus ν ) ⎢⎝ partx⎣ 1 ⎠ ⎝ partx2 ⎠ ⎥⎦
Note that if the strain is isotropic in that ε1 = ε2 = ε this can also be expressed in terms of the
areal strain with the aid of eqn (23)
2 Eh ⎛ ΔA⎞
U0h = ⎜ ⎟ (234)4 1( minus ν ) ⎝ A0 ⎠
from which it can be seen by eqn (24) that the area expansion modulus has the form
Eh Ke = (235)
2 1( minus ν )
under the assumptions of a homogeneous isotropic elastic membrane This term however only
accounts for the contribution to extensional energy associated with an increase in the surface area
of a membrane Another contribution arises from the change in the membrane surface area
projected onto the x1-x2 plane due to non-uniform displacements perpendicular to the plane of
the membrane in the x3 direction This can be seen from the following one-dimensional
example
Consider a membrane tethered at both ends that exhibits a constant surface tension N
when deformed into a new state defined by u3(x1) Locally the change in length of a segment
initially of length dx is
20
CHAPTER 21 CELL MEMBRANE MECHANICS AND ADHESION copyRD Kamm 4615
( 2 2 dx ) + ( du3 ) minus dx = [1 du3 dx1)2]
12 2 2 + ( dx 1 1
1 minus dx1 asymp (1+ 2 (du3 dx1) )dx1 minus dx1 = 2 (du3 dx ) dx(236) 1 1
[see also Figs 64 and 65 in Boal] The strain is then the change in length over the initial length or
2ε11 = 1
2 (du3 dx1) (237) and the energy per unit area associated with this change in length under a constant tension N is
2 ε N ⎛ partu ⎞
U0h = N1int dε =0
⎜ 3
⎟ (238)2 ⎝ partx1 ⎠
which extending to two dimensions can be written
⎡⎛ ⎞ 2 ⎛ 2⎤ N partu3 partu ⎞U ⎢⎜ ⎟ + ⎜ 3
0h = ⎟ ⎥ (239)2 ⎢⎝ partx1 ⎠ ⎝ partx⎣ 2 ⎠ ⎦ ⎥
It is important to recognize that we now have two expressions associated with the energy of
extension and they represent two distinct phenomena The first [eqn (333)] describes the
energy associated with true areal expansion that is a change in the effective spacing between the
molecules comprising the lipid bilayer The second [eqn (339)] corresponds to the energy
change due to undulations in a membrane with constant intermolecular spacing To see the
distinction between the two consider an experiment in which the pressure inside a cell or a lipid
vesicle is gradually increased by aspiration into a micropipette Initially the projected area of
the membrane rises rapidly with a relatively small increase in membrane tension corresponding
to the smoothing of undulations caused by thermal excitation of the membrane This is followed
at higher tensions by a transition to a regime in which the membrane exhibits a much greater
stiffness corresponding to the situation in which the thermally-induced undulations have been
smoothed out and the true membrane surface area now must increase In the absence of thermal
fluctuations eg at zero temperature only this second regime would be observed [see also
figure from Boal]
Energy of shear deformation Next examine the energy per unit area associated with shear
deformation in the plane of the membrane which can be expressed in the form
2
1 1 2 Gh ⎛ part u1 partu2 ⎞
U0h = 2 hτ12ε12 = 2 hGε12 = ⎜ + ⎟ (240)2 ⎝ partx2 partx1 ⎠
21
CHAPTER 21 CELL MEMBRANE MECHANICS AND ADHESION copyRD Kamm 4615
where we have utilized eqns (28) and (29) to obtain a form similar to that of eqn (234) for
extensional deformation
[See Boal for an alternative form in terms of membrane curvature He also gives a nice
description of bending in bilayer membranes]
Bending energy The contribution due to bending energy is somewhat more difficult to derive
First recognize that only those normal stresses that vary with x3 contribute to the bending
energy that is those contributed by the σ stresses in eqn (213) With this in mind we can
write the expression for the total elastic energy due to bending as
1 1 U = intintint ⎧ [ 2
⎨ ( ) 2 ⎫ σ 1 prime + ( )2
σ 2 prime + 2νσ 1 primeσ prime 2 ] + ( )τ 12 prime ⎬dx (241)⎩2E 2G ⎭ 1dx2dx3
Substituting for the stresses and strains from eqns (215)-(217) this can be re-cast in the
following form
⎧ 2 ⎫K ⎛ 2
part 2 2u ⎡ 2 u part ⎞ part 2u 2 part 2 ⎤ part u ⎛ u ⎞
U = B intint ⎜ 3 3 ⎟ 1 minus ν ) 3 3 2 minus ⎜ 3 ⎟⎨ 2 + 2 minus 2( 2 ⎬dx1dx (242)⎢ ⎥2 ⎝ partx1 partx2 ⎠ partx1 partx2 ⎝ partx1partx2 ⎠ 2
⎩ ⎣ ⎦ ⎭
It can be shown ((Meleard 1998)) that the integral of the second term in the integrand above [the
one multiplied by 2(1-ν)] is globally constant under deformation if the membrane remains a
closed surface with no holes Assuming that to be the case we obtain for the total bending strain
energy
KB ⎛
2 part 2u part 2
= intint ⎜ 3 u2 + 3 ⎞
U ⎟2 dx1dx2 + const (243)
2 ⎝ partx1 partx2 ⎠
Since we typically are concerned with changes in energy the constant will arbitrarily be set to
zero Thus the energy per unit area or energy density of bending deformations can be written
2 K ⎛ part 2 part 2 ⎞
0 = B u⎜
3 uU h 2 + 3
2 ⎟ (244)2 ⎝ partx1 partx2 ⎠
Note that the term in parentheses is proportional to the mean curvature of the surface Often the
surface has a natural mean curvature in the unstressed state If that curvature is c0 the bending
energy expression is modified slightly to the form
22
CHAPTER 21 CELL MEMBRANE MECHANICS AND ADHESION copyRD Kamm 4615
2 K ⎛ part 2 part 2 ⎞
U0 = B u⎜
3 uh 2 + 3
2 minus c0⎟ (245)2 ⎝ partx1 partx2 ⎠
Another common form of this expression is obtained by recognizing that the first two terms in
parentheses represent the linearized form of the sum of the principal curvatures (the largest and
smallest curvatures at a point) denoted c1 and c2 so that eqn (345) can be written
K
U2 B
0h = (c1 + c2 minus c0 ) 2
Although each of these expressions for strain energy density has been derived individually they
of course all contribute in the general situation and are linearly additive In that regard several
points are worthy of note First one can obtain some idea of the relative importance of
extension shear and bending deformations in a given situation simply by comparing their
relative energies just as was done in the last section by comparison of the bending and tension
terms in eqn (226) Not surprisingly the comparison leads to the same expressions we obtained
before for when either bending or tension is dominant Second due to the small shear modulus
of most cell membranes the energy stored in shear deformation can generally be neglected And
finally a comment is warranted concerning the energy due to tension Various simplifying
assumptions can be made depending on the cell type being considered and the nature of the
stress to which the cell (or vesicle) is being subjected but generally the lipid bilayer can be
considered to be of constant area unless it experiences grossly non-physiologic levels of stress
Thus the main contribution to extensional energy is that represented by eqn (339) associated
with the smoothing of membrane undulations
Other Factors Influencing Membrane Motion
Thermal fluctuations Biological membranes of all types can be seen to fluctuate due to
Brownian motion of the surrounding molecules if viewed with sufficient resolution These
fluctuations are in fact often used to measure the membrane bending stiffness since thermal
effects are seen as motions in the membrane of relatively long wavelength favoring bending
energies as compared to extensional or shear (see eqn (223)) To account for these effects it is
customary to add a time-dependent forcing term to eqn (223) η(t) the magnitude of which
scales with kBT We analyze thermal motions later and use them as a means of determining the
bending stiffness of a membrane
23
CHAPTER 21 CELL MEMBRANE MECHANICS AND ADHESION copyRD Kamm 4615
Damping due to external fluids When a membrane fluctuates in a direction perpendicular to its
plane velocities are induced in the surrounding fluids and due to the resulting shear stresses
energy is dissipated These motions are extremely complex to model precisely and depend on
both the nature of the surrounding medium (its rheological properties) and the bounding
geometry In lieu of a complete and rigorous analysis a local damping term is sometimes added
to the membrane force balance equation (eqn (223)) to approximate these effects Its form is
based on the presumption that externally induced velocities scale with the velocity of the wall
and that shear forces in the external fluid scale with the induced shear rates and velocities
Accordingly eqn (223) is modified by the addition of a term of the form μm partu3 partt where μμ is
the effective viscosity of the external fluid The equation that results from the addition of both
thermal forcing and external fluid viscosity is
partu ⎛ part 43 u 4
3 part u part+ 3 part 4u ⎞ part ⎛ ⎞ part ⎛ ⎞
B ⎜ 3 partu u
μm K 4 + 2 2 2 + 4 ⎟ minus ⎜ N3
⎟ minus part 1 ⎜ N
3
partt ⎝ x partx partx partx ⎠ partx ⎝ partx ⎠ partx ⎝ 2 ⎟ = p + η(t) (246)1 1 2 2 1 1 2 partx2 ⎠
An expression of similar form for a linear polymer is sometimes referred to as the Rouse
equation
314 Measurements of Membrane Elastic Parameters
Although the analogy has limitations it is useful at the onset to think of the cell as a fluid-filled
balloon or bag Just as in the case of a balloon the elastic properties of the membrane can be
determined by any experiment in which the membrane tension changes while its area is
measured In the simple example of a spherical balloon tension can be computed from the
inflating pressure and the measured radius the latter also yielding the surface area Ignoring for
now the thermal-induced fluctuations in a real cell membrane (ie assuming the cell to be at zero
temperature) the calculations become particularly simple Furthermore we will consider cells
for which the cytoplasm can be considered to fluid-like having no elasticity We return to
address both issues shortly
Osmotic swelling
Perhaps the simplest method to inflate the cell and measure the membrane elastic properties is to
cause the cell to swell by changing the osmolarity of the external fluid and simultaneously
monitoring the change in cell volume The change in transmembrane pressure mirrors the
24
CHAPTER 21 CELL MEMBRANE MECHANICS AND ADHESION copyRD Kamm 4615
change in osmotic pressure brought about by successive additions of a solute to which the
membrane is impermeable For ions and small molecules the osmotic pressure π can be
calculated from the vant Hoff equation
π = RT sum Ci (247)
i
where Ci are the molar concentrations of all solutes to which the membrane is impermeable For
larger molecules such as proteins their contribution to osmotic pressure is much larger than
indicted by this equation
Consider for example a spherical cell expanded osmotically so that the internal
hydrostatic pressure relative to external pressure is pc Microscopic examination yields a value
for the cell radius Rc Using these values in combination with Laplaces law [eqn (227)] gives
us the tension in this state and eqn (24) provides its relationship to the extensional modulus
p R Δ A
N = c c = Ke (248) 2 A0
The observed change in radius allows calculation of ΔA In practice identification of the reference state at zero pc is problematic due to the presence of thermal fluctuations but if Ke can be assumed constant for relatively small changes in area it is possible to extrapolate back to the zero-stress state from two measurements at elevated pc [Example red blood cell] Micropipet aspiration
One of the first methods used to measure the extensional modulus of the cell membrane involved
drawing a cell slightly deflated into a micropipet simultaneously monitoring the dimensions of
the cell and the pressure in the micropipet (Daily Elson et al 1984) Since on the time scale of
the experiment the volume of the cell could be assumed constant the shape change due to
aspiration of the cell causes increases in both internal pressure and surface tension both of which
are assumed spatially uniform Once the tension is large enough (or the temperature low
enough) to dampen the amplitude of any thermal fluctuations the cell can be treated assuming
that membrane extension is the dominant means by which the pressure drop across the
membrane is balanced [For further discussion on the thermal fluctuations and the relationship
between micropipet pressure and intracellular pressure see Daily and Evans and Rawicz Phys
Rev 1990 See also figure on p 199 of Boal Example the two regimes in membrane stiffness]
For the situation shown in Figxx the cell is drawn into the micropipet to the point at
which the portion of the cell external to the cell is spherical of radius Rc With the assumptions
25
CHAPTER 21 CELL MEMBRANE MECHANICS AND ADHESION copyRD Kamm 4615
stated above the (uniform) pressure within the cell can be related to it surface tension (assumed
uniform) and the radii of curvature of the main body of the cell Rc and the portion inside the
pipet a using Laplaces law [eqn (227)]
pc = 2N Rc = minus Δp + 2N a (249)
where pressures are referenced to the external ambient pressure Reorganizing to solve for
surface tension we obtain
ΔpN = (250)
⎛ 1 1 ⎞ 2⎜ minus ⎟
⎝ a Rc ⎠
The surface area corresponding to a given N is obtained from geometry summing the membrane
surface areas of the cylinder and hemisphere inside the micropipet and the truncated spherical
surface outside yielding for the areal strain the approximate expression
[(a R )2 (a R )3
Δ c minus c cong
]ΔLA
A 2a
Fig xx Micropipet aspiration of a neutrophil
This relationship between N and ΔAA can be used to calculate the area expansion modulus
Eh AK 0
e = = N 2 1( minus ν ) ΔA
where the expression involving Youngrsquos modulus assumes the membrane to be isotropic and
homogeneous The relationship could however be non-linear in that the value of Ke may vary
with the degree of area expansion a linear relationship between N and ΔA yields a constant value for Ke
It is important to note that neither of these approaches osmotic inflation or micropipet aspiration provides us with any information on the bending modulus To be precise bending
26
CHAPTER 21 CELL MEMBRANE MECHANICS AND ADHESION copyRD Kamm 4615
does play a role in the micropipet experiments but the effects are so small as to be negligible and are typically ignored That is not to say that bending is always negligible however as discussed next
Monitoring thermal fluctuations in the membrane
When a cell or lipid vesicle is observed floating free unattached to a substrate it can be seen to
exhibit time-dependent undulations as a result of collisions with the surrounding molecules
undergoing thermal motion In the case of a lipid vesicle with diameter in the range of 10
microns these undulations can be readily observed microscopically In smaller cells such as red
blood cells the motions can be inferred from the flickering phenomenon associated with the light
interference as the cell thickness changes (Zeman Engelhard et al 1990) Since the amplitude of
the membrane undulations depends on the stiffness of the membrane to bending and its surface
tension it is reasonable to expect that measures of this amplitude can be used to infer the
membrane elastic parameters In order to illustrate the method while avoiding some of the
algebraic complexity consider undulations in a flat membrane with significant bending stiffness
and a constant surface tension The relationship between the motion and the elastic properties
can be found by considering the total energy of the membrane obtained by summing the
energies per unit area from eqns (239) and (244) and integrating over the membrane surface
area Am
⎧ 2⎪ K ⎛ 2 2
part 2 u part 2 ⎡ 3 u ⎞
3 N ⎛ partu ⎞ ⎛ int 3 partu ⎞ ⎤⎫
B 3 ⎪
U0hdA = int ⎨ ⎜ 2 + 2 ⎟ + ⎢⎜ ⎟ + ⎜ ⎟ ⎥⎬dA (251) A ⎠ 2
m Am ⎪ 2 ⎝ partx1 partx2 ⎢⎝ partx1 ⎠ ⎝ partx2 ⎠ ⎥⎪ ⎩ ⎣ ⎦⎭
In writing the energy in this form we have omitted the contribution due to shear deformation
consistent with the fluid-like character of a pure lipid bilayer and have taken the surface tension
to be uniform during the deformation In this example membrane surface area changes only as a
result of fluctuations from the mean [u3(xxx2) = 0] configuration that is we now ignore the
contribution due to changes in intermolecular spacing and only consider changes in the area
projected onto the x1-x2 plane
It is convenient to use the method of Fourier transforms to represent the undulations of a
membrane normal to the x1-x2 plane which in two-dimensions leads to [see also class notes on
bending of cytoskeletal filaments alternatively use Fourier series representation]
A A
u3 (x) = u3 (x1 x2 ) = 2 intexp(iq sdot x)b(q)dq =
2 int exp(iq 4 1x1)exp(iq2 x2 )b(q1q2 )dq1dq
π 4π 2
(252)
27
CHAPTER 21 CELL MEMBRANE MECHANICS AND ADHESION copyRD Kamm 4615
where qα = 2π λα is the wavenumber of the particular mode and b(q) is the continuous analogue of the discrete coefficients that multiply each mode in a Fourier series representation
Here the algebra gets complicated so only the results of the analysis will be presented however
those wishing to see a more complete derivation should see (Boal Mechanics of the Cell
Cambridge University Press 2002) Introducing eqn (352) into (351) yields
1 ⎛ A ⎞2
int U q 40hdA = ⎜ ⎟ int (
KB + Nq2 )b(q)b(q)dq (253)2 2 ⎝ π ⎠
where b(q) is the complex conjugate of b(q) Now we invoke a previous result that at equilibrium energy is equally distributed among the various modes and that each mode has an
average energy of kBT2 Taking the ensemble average of eqn (353) and equating the energy of
each mode represented in the result to kBT2 (by the equipartition theorem) leads to
k Aq)b q) = BT
b( (K q4 2 (254)
B + Nq
This is a useful result in itself demonstrating that all modes tend to be suppressed as temperature
falls or as bending stiffness or surface tension rise In addition it shows the tendency for higher
modes to be of smaller amplitude But this equation has further value in that it can be used to
obtain a direct expression for the change in apparent area of a membrane as tension increases
Consider the true surface area of a membrane A represented as the sum of its projected
area and the additional area associated with thermally-induced undulations
⎡ 1 ⎛ 2⎤u ⎞ 2 part ⎛ partu ⎞
A = int dx + ⎢ 3 3 2
int ⎜ ⎢⎝ partx 2 ⎟ + ⎜
⎠ ⎝ partx 2 ⎟ ⎥dx (255)⎠ ⎥
⎣ 1 2 ⎦
Isolating the term representing the area reduction due to thermal fluctuations expressing u3 in
terms of its Fourier transform and taking the ensemble average of the result leads to
1 ⎛ A ⎞2
A minus int dx = ⎜ ⎟ int q 2 b(q)b(q) dq (256)2 ⎝ 2π ⎠
Combing eqn (254) from above with this expression yields
28
CHAPTER 21 CELL MEMBRANE MECHANICS AND ADHESION copyRD Kamm 4615
A minus int dx
kBT dq kBT dq2
= A 8π 2 int =
N int (257)
+ KBq 2 8π 2 N + KBq 2
where in writing the last term we have introduced the relations dq = dq2dθ 2 and int dθ = 2π By a simple substitution z = q2 + (N KB )the integral can be evaluated We do so however
between specified limits on the assumptions that the range of possible wavenumbers is restricted
by the size of the membrane on one hand (q = (πA12)) and the distance between individual lipid molecules on the other (q = πlm) Integrating between these limits results in
⎛ π 2 N ⎞
int dx 2 +A ⎜ ⎟ minus k T l K
= B ln⎜ m B ⎟ (258)A 8πKB ⎜ π 2 N ⎟
⎜ + ⎟ ⎝ A KB ⎠
If we use the area reduction at zero tension as a reference and increase the area from that
condition by progressively increasing membrane tension as in a typical experiment we finally
obtain an expression relating the change in area to the change in tension
⎛ NA ⎞ 1 + A dx A dx ΔA minus int minus ⎟ k ⎛ NA
int k ⎜equiv minus = BT π 2 K
ln ⎜ B T ⎞ 2 ⎟ cong B ln 1 + (259)
Nl ⎜ ⎟A A A 8π KB ⎜ 1 + m ⎟ 8π KB ⎝ π 2 KB ⎠ N = 0 N ⎜ 2 ⎟⎝ π K ⎠ B
where we have used the assumption supported by typical values found from different
experiments that (Nl2 m ) (π 2KB ) ltlt 1
You should recall that this solution was obtained on the assumption that the actual area
of the membrane remained constant and that the reduction in projected or apparent area resulted
from the undulations being progressively smoothed out Once the undulations are eliminated
the only means by which the projected area of the membrane can further increase is by an
increase in the inter-molecular spacing ndash an increase in the actual membrane area When this
occurs we expect to see a transition to the behavior discussed at the beginning of this chapter a
result expressed as
29
CHAPTER 21 CELL MEMBRANE MECHANICS AND ADHESION copyRD Kamm 4615
Fig yy Plots of tension vs normalized surface area for lipid vesicles of different composition Evans amp Rawicz 1990
ΔA N = (260)
A Ke
Thus we have two limiting predictions one for low tensions eqn (259) and another for high
tensions eqn (260) and the transition from one behavior to the other should occur when the
two expressions for ΔAA are of the same magnitude This is supported by experiment (Fig yy) and the results in the two regimes provide a means for estimating the two moduli Ke and KB
30
CHAPTER 21 CELL MEMBRANE MECHANICS AND ADHESION copyRD Kamm 4615
Before leaving this analysis there is one further result that is useful to state although the
derivation is again somewhat involved Once we have the solution for the undulations at a
given level of tension and for given membrane properties the ensemble average displacement
normal to the plane of the membrane can also be computed with the result
⎞
u2 k ⎛= BT NA
3 ln ⎜ 1+ ⎟ (261)4πN ⎝ π 2KB ⎠
Again this supports our intuition that the undulations will be suppressed at low temperature or
high tension And in the limit as N rarr 0 a binomial expansion of the natural log term shows that
the effect of tension drops out and the magnitude of the undulations varies inversely with the
bending stiffness
315 Membrane Fluid Mechanics
Early studies of protein diffusion notably the work of Saffman (Saffman 1976)
examined protein diffusion using an approach akin to that of Einstein in three dimensional space
thereby reducing the problem to one of solving for the mobility b in the equation for diffusivity
D = kBTb (262)
Calculation of the mobility is influenced by the viscous drag on the portion of the protein within
the membrane but also on to the intra- and extracellular domains as well The solution of
interest here is the one applicable in the limit of small μeμm where μe and μm are the external and
membrane viscosities respectively leading to
kBT ⎛ hμm⎞
D = ⎜minusγ + ln ⎟ (263)4πμmh ⎝ aμ e ⎠
where h is the membrane thickness a the radius of the protein (assumed cylindrical) and γ is
Eulers constant (=05772) Membrane viscosity has been estimated from lipid diffusion to be
~2 poise (McCloskey and Poo 1984) When finite mobility is achieved as a result of a finite
domain as for example a circle of radius R the corresponding result is
31
CHAPTER 21 CELL MEMBRANE MECHANICS AND ADHESION copyRD Kamm 4615
k ⎛ 1 D = BT R ⎞ log minus (264)
4πμh ⎝ a 2 ⎠
While this represents a useful point of departure measurements of lateral diffusion in a
membrane have demonstrated a more complex behavior Fluorescence recovery after
photobleaching (FRAP) has enabled the direct tracking of membrane proteins labeled with
fluorescent antibodies More recently single particle tracking methods have been developed
using colloidal gold or a fluorescent particle in conjunction with digital microscopy as well as
controlled movements using microbeads manipulated by an optical trap
From experiments such as these a new picture has emerged While the lateral diffusion
of lipids and a small fraction of trans-membrane proteins satisfy the general form of Saffmans
predictions the predicted diffusivity is greater than that observed experimentally and agrees with
experiments only when a membrane viscosity of 100 poise is used This might be due to the
presence of other proteins in the membrane (Kucik Elson et al 1999) Experiments also show
that many proteins appear to diffuse freely only in small domains typically measuring from 200shy
600 nm remaining confined to these domains for periods on the order of tens of seconds To
explain this behavior the membrane skeleton fence model was proposed (Kusumi Sako et al
1993) in which a membrane-associated matrix constrains the movement of proteins outside of
the domains defined by the matrix filaments Diffusion beyond these barrier filaments can occur
either as a result of random thermal motions of the transmembrane protein matrix filaments or
both or by transient breaks in the filaments Confinement of proteins may play an important role
in rapid and selective signaling Rapid directed motion of membrane-associated proteins has
also been observed and is likely due to active transport by an intracellular actin- or microtubule-
based motor
316 Cell Adhesion
This section deals with how cells adhere to their surroundings and through these sites of
adhesion how they interact with the external world We begin by summarizing the different
types of adhesion their functions and the molecules involved Next we provide a brief
description of the adhesion complexes found in cells and the role of each type Then the
theories that provide a quantitative description of adhesion between single receptor-ligand pairs
are reviewed in the context of the material presented in Chapter xx including the role of thermal
fluctuations Through these theoretical models both the static and dynamic states of adhesion
can be explored for single molecule pairs then for adherent cells Next we develop the different
32
CHAPTER 21 CELL MEMBRANE MECHANICS AND ADHESION copyRD Kamm 4615
approaches that are used to study the adhesion of cells based either on thermodynamics or
mechanics Methods for the measurement of adhesion strength are described providing
estimates for the force that a cell can exert on its surroundings Various examples will be
presented but the adherence of leukocytes to the endothelium and the role of adhesion in cell
migration will receive special attention
Functions of adhesion
Adhesion has been found to be an essential process necessary for a variety of fundamental
cellular functions
bull Structural integrity Adhesion helps to maintain the overall structural integrity of the
tissue in muscle for example it provides the means of force transmission from the cells
to the surrounding matrix to allow contraction In non-contractile cells it still provides
the needed mechanical coupling to the surrounding tissue necessary for a variety of
cellular functions
bull External sensing Adhesion provides a means by which the cell can sense and
subsequently respond to its surroundings Forces transmitted directly to the cell
membrane or to the cytoskeleton via transmembrane proteins may trigger a variety of
biochemical reactions within the cell as we shall see later in Chapter 33
bull Migration Cell-matrix adhesion is an essential element in cell migration a cell propels
its way through tissue or along a surface through a process involving adhesion
contraction and release also described in Chapter 33
bull Regulation of transport Sites of cell-cell adhesion are often important in the regulation
of transport across a cell layer such as in the case of an epithelium or endothelium
bull Communication Sites of mechanical coupling often provide a means of cell-cell
communication as in the case of gap junctions which offer a pathway for the diffusion
of ions and small molecules between adjacent cells
Adhesion molecules
Cells adhere to their surroundings or to an artificial substrate via a wide variety of different
proteins that can be classified into five major families integrins selectins cadherins
immunoglobulins and transmembrane proteoglycans (Table 1) In terms of their mechanism of
attachment to other cells or the external matrix these can be classified as either homophillic ndash
binding to like molecules heterophillic ndash binding to unlike molecules or those that bind to other
cells through an extracellular linker molecule
Integrins one of the largest class of adhesion molecules are primarily used to attach cells
to the extracellular matrix or the basal lamina but are also present in some cell-cell adhesion
33
CHAPTER 21 CELL MEMBRANE MECHANICS AND ADHESION copyRD Kamm 4615
complexes They typically bind to the matrix via the RGD amino acid sequence (arginine
glycine aspartic acid) but can also contain other binding motifs Integrins are heterodimers in
that they always contain an α and a β subunit with the different isoforms determining the specific ligand to which the integrin binds Two specific types of adhesion focal adhesions and hemidesmosomes often contain integrins and the attachments they make can at times be stable but at other times transient so as for example to mediate cell migration The force of adhesion of a single integrin-ligand bond has been measured using atomic force microscopy and found to be in the range of 30-100 pN (Lehenkari and Horton 1999) with a relatively low binding affinity in the range of K ~ 10-6
D to 10-8 molliter By comparison typical cell-surface receptors bind with an affinity in the range of 10-9 to 10-11 molliter Integrins also play an important role in signaling since extracellular integrin binding is known to influence cytoskeletal morphology as well as the state of cell differentiation Adhesion molecules in the selectin family also tend to form transient bonds and are important in leukocyte adhesion and extravasation the migration of the leukocyte through the endothelium and into the tissue Consequently they tend to be found in cells of the circulation and are present both in leukocytes and endothelial cells and are instrumental in adhesion between these two cell-types during leukocyte rolling
Family Location andor Ligands Comments
function recognized
integrins focal adhesions (E) fibronectin relatively low
hemi-desmosomes collagen laminin affinities
leukocyte immunoglobulins (KD~ 10-6-10-8
(spreading) (I) actin filaments molliter)
adhesion primarily
cell-matrix adhesion
but also in some
cell-cell adhesions
selectins circulating cells and carbohydrates require Ca2+
endothelial cells
rolling adhesion
Ig superfamily important in integrins
(immunoglobulin) immune response homophillic
cadherens adherens junctions (E) homophillic require Ca2+
desmosomes (I) actin
34
CHAPTER 21 CELL MEMBRANE MECHANICS AND ADHESION copyRD Kamm 4615
filaments
intermediate
filaments
transmembrane fibroblasts (E) collagen bind various
proteoglycans epithelial cells fibronectin growth factors
(I) actin such as FGF
filaments
heterophillic
Table 1 Cell adhesion molecules and their characteristics
While both integrin and selectin binding is mediated by Ca2+ adhesion via the
immunoglobulin (Ig) superfamily of proteins is Ca2+ independent Some of the most prominent members of this family are the N-CAMs (Neural cell adhesion molecules) and ICAMs (Intracellular cell adhesion molecules) These tend to undergo homophillic bonding but some also bind to members of the integrin family
Cadherens are often expressed in the same cells as the selectins but form much stronger bonds and therefore play an important role in maintaining cell integrity Because of these attributes cadherens are the primary adhesion proteins in desmosomes and adherens junctions the major structural contacts cells form with other cells or the basil lamina These also form homophillic bonds by a Ca2+ dependent mechanism and mediate selective bonding between adjacent cells Cadherens are relatively short as compared to other adhesion molecules being
about 700-750 amino acid residues in length
Types of adhesion complexes
Cells have developed a variety of specialized adhesion complexes each utilizing one or more of
the adhesion molecules of Table 1 and each serving a specific purpose Typically the cell-cell or
cell-surface spacing is in the range of 10-20 nm but this is highly variable ranging from less than
1 nm when controlling transport to over 100 nm in regions where tight control is unnecessary
Below we describe the different types of junctions and where important for function their
mechanical characteristics
Gap junctions Cells need to communicate with their neighbors for a variety of reasons For
example cardiac myocytes transmit signals from cell to cell in order to maintain a synchronous
35
CHAPTER 21 CELL MEMBRANE MECHANICS AND ADHESION copyRD Kamm 4615
wave of contraction This is typically accomplished by providing a pathway for ions and small
signaling molecules between cells called gap junctions (Fig 3110) These minute channels are
typically comprised of a collection of six connexin proteins that cluster together in cylindrical
fashion forming a minute channel that passes molecules and ions less than about 1200 to 2000
MW (15-2 nm) Transport through these channels is regulated and their permeability drops in
the presence of high Ca2+ concentration as when a cell membrane is ruptured or with low pH
Cyclic AMP acting as a second messenger can be exchanged between cells therefore gap
junctions provide a metabolic linkage between neighboring cells and provide a means by which
hormonal stimulation of just one cell can be transmitted to others
Adherens junctions Adherens junctions are belt-like structures that can be though of as the
structural weld that holds two cells together (Fig 3110) Because of their structural role
these junctions formed by homophilic bonding between proteins in the cadheren family are
anchored securely again via the adaptor proteins α β γ-catenin to the cytoskeleton
Desmosomes and Hemidesmosomes If the adherens junctions are the continuous welds between
cells desmosomes are the spot welds Again these serve primarily a structural purpose
joining two neighboring cells via a complex consisting of a dense plaque on the intracellular
sides of both cells extending 15-20 nm into the cell and consisting of a variety of proteins that
attach to keratin filaments part of the intermediate filament network Hemidesmosomes have
similar intracellular structure but attach instead to the basal laminae Based on their different
extracellular attachment sites desmosomes typically link to other cells via cadherens whereas
hemidesmosomes adhere via a type of integrin Both are commonly found in epithelial cells
36
CHAPTER 21 CELL MEMBRANE MECHANICS AND ADHESION copyRD Kamm 4615
Fig 3110 Schematic showing the different types of cell junctions present in an epithelial cell as found in the small intestine Tight junctions near the apical surface essentially prevent the passage of all molecules The spot desmosomes and adherens junctions provide for cell-cell anchoring and the hemidesmosomes for anchoring to the basal lamina Gap junctions provide a means for communication between neighboring cells [Reproduced from Lodish et al Molecular Cell Biology 2000]
Junction type Function Extracellular or Intracellular
adjacent cell attachment
attachment
Adherens structural cell-cell or cell- ECM proteins or actin filaments
matrix cadherins in
adjacent cell
Desmosome structural cell-cell cadherin intermediate
filaments
Hemidesmosome structural cell-matrix basal lamina via intermediate
integrins filaments
Focal adhesions structural cell-matrix ECM proteins actin filaments
via integrins
Tight junction regulate transport between homophillic binding between the
cells and along cell transmembrane proteins occludin or
37
CHAPTER 21 CELL MEMBRANE MECHANICS AND ADHESION copyRD Kamm 4615
membrane claudins
Gap junctions cell-cell communication channels formed by connexin
via ion and small molecule subunits
exchange
Table 2 Adhesion complexes
Focal adhesions A second means by which cells attach to the extracellular matrix is through
focal adhesions These serve a similar function to the hemidesmosomes and share a common
linkage via integrins to the ECM but are attached on the intracellular side instead to the actin
filaments of the cytoskeleton Actin filaments converge at the site of focal adhesions forming
stress fibers strong actin bundles that attach to the β-subunit of the integrins via adapter
proteins such as actinin vinculin and talin Focal adhesions are instrumental in cell migration
and for this purpose need to be easily formed and disrupted as the cell moves forward Release
or de-adhesion of cells is often mediated by a class of peptides called dis-integrins that
competitively bind to the RGD site used by integrins to attach to a variety of matrix molecules
Tight junctions Control of transport is generally mediated by tight junctions that form an
intricate network of seams between two cells (Fig 3111) As their name implies these are the
tightest of the cell-cell junctions and the gaps they leave are often small enough to exclude even
the smallest ions and molecules Formed by homophillic binding between the transmembrane
proteins occluding and claudins tight junctions allow epithelial cells to perform their critical role
in transepithelial transport and provide for maintenance of differences in concentration between
the apical and basal surfaces of these cells Since occludins are not capable of forming rigid
structural bonds with the cytoskeleton they are most often associated in a junctional complex
with adherens junctions or desmosomes that fulfill the structural needs of attachment
38
CHAPTER 21 CELL MEMBRANE MECHANICS AND ADHESION copyRD Kamm 4615
Fig 3111 Tight junctions in an epithelial cell shown schematically (a) in a freeze fracture replica (b) and in a transmission electron micrograph (c) [Reproduced from Alberts et al 1994]
Fig 3112 Two types of bond that attach a cell to the extracellular matrix by means of clusters of integrins On the extracellular side integrins bind to the matrix proteins fibronectin and laminin Inside the cell they attach to the cytoskeleton via adaptor proteins to either actin filaments (focal adhesions) or intermediate filaments (hemidesmosomes) [Reproduced from Lodish et al Molecular Cell Biolology 2000]
Non-specific binding
Cells can adhere to their surroundings by either non-specific or receptor-ligand (specific)
bonding Though both mechanisms are likely active in most situations as we will see receptorshy
39
CHAPTER 21 CELL MEMBRANE MECHANICS AND ADHESION copyRD Kamm 4615
ligand bonding is the stronger of the two by a considerable margin and is therefore the most
relevant biologically In situations for which either the receptors or their ligands are not present
however such as might be the case in certain in vitro experiments non-specific binding can be
important as well
There are essentially three major forms of non-specific attractions to consider
bull Van der Waals ndash These attractive forces arise due to charge interactions in polar
molecules They tend to dominate among the non-specific mechanisms at
intermediate distances around 20-25 nm [see Boal]
bull Electrostatic ndash These interactions can be either attractive or repulsive depending
on the sign of the surface charges and are particularly important during the
approach of two cells since the glycocalyx has a high negative charge density
bull Steric ndash These forces arise due to the steric exclusion of two molecules as they are
brought into close contact In the case of cell-cell interactions steric repulsion is
due to the compression of the two glycocalyx layers and the tendency to resist
compression resulting from osmotic effects and the elasticity of the layer Steric
forces tend to dominate for small separation distances lt 10 nm
In combination these effects combine to produce a net attractive force per unit area of
about 100 Pa at a separation distance of about 25 nm
Adhesion by means of receptor-ligand binding
We can use the analysis of Chapter xx to estimate the strength of a receptor-ligand bond and
based on typical values for bond density calculate the corresponding strength of adhesion
between two cells or between a cell and a surface Recall that the application of force to a
receptor-ligand bond modifies the dissociation rate constant for the binding reaction This effect
can be modeled in several ways but the result obtained by Bell ((Bell 1978)) suggests the
following exponential form for the dissociation rate
0 ⎛ γf ⎞ 0 ⎛ γσ ⎞ kminus = kminus exp⎜ ⎟ = kminus exp⎜ ⎟ (265)
⎝ kBT ⎠ ⎝ NC kBT ⎠
where k0minus is the unforced dissociation rate constant γ is a factor with the units of length that
corresponds roughly with the distance separating the bonded pair at equilibrium NC is the concentration of bonded complex and σ is the average bond force per unit area To determine
40
CHAPTER 21 CELL MEMBRANE MECHANICS AND ADHESION copyRD Kamm 4615
the rate of change of the concentration of bonded pairs one must solve the following rate equation describing the competition between bond formation (first term) and destruction (second term)
dNC ⎛ γσ ⎞
cong k+ (NR minus NC )(NL ) minus kminus NC = k+ (N minus )( 0R NC NL ) minus kminus NC exp⎜ ⎟ (266)
dt ⎝ NC kBT ⎠
where NR and NL are the concentrations of receptors and ligands respectively and we have
assumed that NCltltNL and that all bonds are stressed equally At equilibrium dNCdt=0 and if
the force applied to detach the cell (equal to the average bond stress σ) is increased
incrementally from zero NC will progressively fall to a new equilibrium value At sufficiently
high levels of force however increasing σ further eventually gives rise to a situation in which equilibrium can no longer be achieved through a reduction in NC At that point NC tends toward zero and the cell separates from the surface to which it was attached It can be shown that this
occurs when (Bell 1978)
k 0
α c exp(α + c + 1) = N
k 0 L (267)minus
σ
where α minγ c equiv and σmin is the minimum stress needed to cause detachment For a wide
NRkBT
range of conditions eqn (267) has the approximate solution
⎛ k0 + ⎞
α c cong 07 ln L (268)⎜ 0 N ⎟⎝ kminus ⎠
so that the critical stress for detachment can be expressed as
N 0
σ cong 07 C kBT ⎛ k ⎞ ln⎜
+ min N ⎟ (269)
γ ⎝ k0 L minus ⎠
where NC is determined from setting eqn (266) to zero under these critical conditions
Thermodynamic approach to cell adhesion
Although we focus here on the mechanical aspects of cell adhesion this process can also be
viewed from a thermodynamic perspective In this approach adhesion is considered in terms of
the change in energy specifically the Gibbs free energy G associated with all the individual
receptor-ligand interactions as well as the various non-specific forces of attraction or repulsion
The adhesion of a cell to a given surface then can be viewed as an equilibrium state determined
41
CHAPTER 21 CELL MEMBRANE MECHANICS AND ADHESION copyRD Kamm 4615
by minimization of the free energy If in undergoing a transition from a free state to an adherent
state the system represented by the cell and surface experiences a reduction in free energy ie
ΔGlt0 then adhesion will occur and the equilibrium state of adhesion will be determined by that with the minimum in free energy or the largest value of -ΔG While this approach ignores
many of the subtleties of the interactions and like the analysis above assumes that all receptorshy
ligand interactions are identical from an energetic point of view it is useful in providing some
simple insights as seen in the next two examples
Example Comparison of specific and non-specific adhesive forces Non-specific bonding due
to the combined effects of van der Waals electrostatic and steric forces result in an attractive
stress of approximately 100 Pa Receptor-ligand bonding give rise to forces that can be
estimated from the change in free energy f ~ to 4x10⁻⁴ dynbond = 9x10-11 to 4x10⁻⁹ ΔGr~9x10⁻⁶ Nbond where f is the force required to break the bond and r is a measure of the distance the bond stretches before it breaks Using a typical density of the receptor-ligand complex NC of ~1012-1015 bondsm2 gives a total bond stress of N 1
C x f ~ 9 x 10 to 4x10⁶ Pa The above kinetic approach to estimating bond strength [eqn (269)] gives a value approximately half of that from this equilibrium approach In either case however the conclusion remains the same non-specific binding can under certain circumstances be important since it is comparable to the lowest estimates of receptor-ligand-mediated bond strength but not surprisingly the latter is quite likely to dominate in nearly all practical situations
Example JKR theory for the equilibrium area of adhesion between a cell and substrate
It is well known that cells tend to take on a more flattened shape as the substrate to which they
are attached becomes more strongly adhesive either by coating with a more attractive ligand or
by increasing the concentration of ligand bound to the substrate Conversely less adhesive cells
round up and become more spherical These observations can be explained with the help of a
simple scaling analysis on the assumptions of small deformation of a linear elastic cell
Let the cell be modeled as a homogeneous elastic sphere with elastic modulus E and
initial radius R (Fig 3113) It is then brought into contact with a surface to which it adheres
As the cell adheres it attains a lower energy state characterized by an adhesion energy per unit
area J Formation of a flat adhesion surface however requires deformation within the elastic
cell and an associated increase in the stored elastic energy In Chapter 31 we showed that the
stored elastic energy per unit volume can be written
UE asymp int τεdV asymp int 1 2 Eε 2dV (270)
Vc Vc
42
CHAPTER 21 CELL MEMBRANE MECHANICS AND ADHESION copyRD Kamm 4615
Strain inside the cell can be approximated as the displacement of the cell surface δ divided by the characteristic distance within the cell to which the deformations penetrate a distance that scales with the lateral extent of the contact region 2a so that ε prop δ a where it can easily be shown from the geometry that a 2 asymp 2δR so that ε prop δ R Combining and dropping all numerical constants we obtain the following scaling approximation
δUE prop E ( )δR
3 2 (271)R
An expression for the total energy of the system then can be written
U prop minusJa2 + Eε2a3 prop JδR + Eδ 5 2R1 2 (272) The equilibrium state corresponds to the value of δ having the minimum energy obtain from
partU prop minusJR + Eδ 3 2R1 2 (273)
partδ so that
23 1 3 ⎛ JR12 ⎞ ⎛ JR2 ⎞
δ prop ⎜ ⎟ and a prop ⎜ ⎟ (274)⎝ E ⎠ ⎝ E ⎠
The exact solution to this problem yields the result
⎡ ) 1 3 2 1( minusν 2 ⎤ 9πJR
a = ⎢ ⎥ (275)⎢ 2E ⎥⎣ ⎦
43
CHAPTER 21 CELL MEMBRANE MECHANICS AND ADHESION copyRD Kamm 4615
Elastic modulus E adhesion energy per unit area J
2a
Fig 3113 Experiments to determine the contact area of an iminobiotin functionalized agarosebead on a glass coverslip in water Top Schematic of adherent bead Bottom Results for a range of bead radii Solid line is a fit to the date which obeys the power law a prop R23 consistent with the prediction of JKR theory eqn(276) [Reproduced from (Moy Jiao et al 1999)] This can be compared to the result obtained from a more rigorous analysis
⎡9πJR 2(1minus ν 2 ) 13 ⎤
a = ⎢ ⎥ (276)2E⎢ ⎣ ⎥⎦
and to experimental data obtained from spherical beads made from a 4 agarose gel (Fig 3113)
Models for receptor-mediated adhesion
In Chapter x and in the preceding text we discussed the energetics of bond formation and release
as well as the effect of applied force in altering the energy landscape of the bonded pair and
thereby the rate constants for bond kinetics That analysis has obvious implications to the
44
CHAPTER 21 CELL MEMBRANE MECHANICS AND ADHESION copyRD Kamm 4615
adhesion of cells to substrates the surrounding extracellular matrix and other cells Here we
extend that analysis in the specific case of whole cell adhesion In doing so it will be important
to consider such factors as the distribution type and density of receptor-ligand bonds or
potential bonds and the elastic properties of the structures to which they are anchored On the
intracellular side this involves the series of couplings that link the receptor to the cell In the
simplest case this might simply be a link to the lipid bilayer if the receptor has no intracellular
connections More typically especially for couplings with a structural role it involves a series
of proteins ultimately linking the receptor to the cytoskeleton
The typical setting in vivo is one in which cells adhere to other cells or to the extracellular
matrix Adhesions are more easily probed however through in vitro experiments (described
below) where cell adhesion more often occurs to an artificial substrate mediated through one of
several extracellular proteins that are used to coat the surface Generally either collagen or
fibronectin is used Cells are often adhered to these substrates but to produce a more controlled
environment rigid beads are sometimes coated with the appropriate receptors so that one specific
receptor-ligand interaction can be probed While these systems are useful as models of certain
adhesion phenomena it is important to recognize in the interpretation of these experiments that
when bound to a rigid substrate or bead the binding proteins cannot freely diffuse as they would
in a more natural environment In particular the formation of focal adhesions would not occur in
bead-substrate experiments because the receptors would be constrained from aggregating
It is instructive to begin this discussion with a consideration of a single adhesion bond
for example one linking the actin matrix of the cytoskeleton to a β1 integrin and the integrin
receptor binding to the extracellular matrix beyond the cell membrane (Fig 3114) If the bond
is stressed as for example if the cell experiences a force relative to the ECM it will at first
stretch an amount dictated by the level of force in the bond and the stiffness of the complex
Each bond as well as each protein in the bond complex can be thought of as having a certain
stiffness giving rise to a picture in which several springs are considered connected in series
Forces acting on the adhesion complex are transmitted via this series of bonded proteins between
the CSK and the ECM producing local deformations and stresses in the corresponding matrices
that decay with distance from the adhesion site On the intracellular side these forces are
transmitted via a complex involving vinculin α-actinin paxillin and talin Attachment to the
extracellular matrix is mediated by an RGD sequence (in fibronectin for example) which in turn
has binding sites for collagen and fibrin If the force is sufficiently strong above a certain
threshold value F0 say and applied for a sufficiently long time the bond might be severed (deshy
couple) Typical values of this threshold force lie in the range of 10-100 pN (Evans and Ritchie
1997) but depend as well on the rate at which the force is increased Under more rapid
forcings the threshold is high compared to when the force is increased slowly This simply
45
CHAPTER 21 CELL MEMBRANE MECHANICS AND ADHESION copyRD Kamm 4615
reflects the fact that detachment is a stochastic process and that at any given level of force there
exists a finite probability of detachment and this probability increases with time
Fig 3114 One type of attachment linking the intracellular actin matrix to the extracellular matrix via an integrin complex that involves in addition vinculin α-actinin paxillin and talin (Reproduced from Lodish et al Molecular Cell Biolology 2000)
We need also to consider that in equilibrium a fraction Φ = K(1+K)-1 (where K is the
equilibrium constant) of the receptors will be bound at any given time and that the receptorshy
ligand complexes are continually cycling between the bound and unbound states characterized
by their respective rate constants
On a larger scale numerous adhesion sites typically act in parallel each contributing
some amount to the total adhesion force If the force transmitted by each single adhesion
complex is F and the density of adhesion sites (per unit membrane area) is NC then the stress
acting on the cell is the product F NC This gives a somewhat false impression however as it is
unlikely that each adhesion complex carries an equal force Put another way there exists a local
stress τ that can be thought of as the product of the average force per bond times the bond
density This stress is typically non-uniform In the adhesion of a cell to a flat substrate the
bonds near the periphery of the contact zone determine the strength of the cell against
detachment and when the cell is subjected to a detaching force the stresses are concentrated in
46
CHAPTER 21 CELL MEMBRANE MECHANICS AND ADHESION copyRD Kamm 4615
this peripheral region as depicted in Fig 3115 In the vicinity of the edge of adhesion several
factors will influence the stress distribution including the mechanical properties of the membrane
(in particular the bending stiffness KB) the receptor density the spring constants of the bond
and the bond strength
N
Region of adhesion
x1
Fig 3115 Schematic model of a cell membrane being detached from a substrate by application of a tension force N The membrane is free to the left of the dash-dot line and adherent to the right Forces and moments are transmitted through the membrane which adheres to the membrane through receptor-ligand bonds represented by a continuous distrubution p(x1)
To illustrate consider the following simple model for an adherent cell being peeled away
from its substrate by a force that generates a tension N in the membrane (Fig 3115)
Deformations in the membrane are described by eqn (223) where it can be shown that the
bending term dominates provided KbL2 gtN where L is the characteristic length in the x1 direction
(due to the small length scales involved) and the external membrane force (p in the membrane
equation) is now the non-uniform stress due to adhesion bonds As a simple first approximation
we take p = k(δminusδ0) with δ-δ0 being the amount of stretch in the receptor-ligand bond springs
and k an effective bond spring constant Recognizing that p approaches zero far from the edge
(see Fig 319) the membrane displacement and the spring displacement are related u3 = δ-δ0
Thus eqn (228) is written
⎛ part 4 u
KB⎜ 3
⎞ 4 ⎟ = NC F = NC ku
⎝ partx ⎠ 3 (277)1
This can be solved directly showing that the distance of separation between the cell membrane
and substrate grows in an exponential fashion with distance Even more simply a scaling
47
CHAPTER 21 CELL MEMBRANE MECHANICS AND ADHESION copyRD Kamm 4615
analysis of eqn (277) in which the term on the left is approximated by Kbu3w4 where w is the
characteristic distance over which u3 varies tells us that the stresses are concentrated in a region
of width
K
w prop B4 (278)
NC k
near the cell periphery Similarly we can estimate that the cell membrane will detach from the
substrate if N gt FoNCw where F0 is a measure of the force in a single bond at the time of bond
rupture and that the rate of peeling can be roughly approximated as the product of the
disassociation rate k -- (bondss) from eqn (265) and the distance between bonds (N -12C )
Although this provides some insight into how the peeling rate depends on the various factors it fails to capture the fact that the cell remains in an equilibrium attached state even for non-zero levels of tension reflecting that even under force a balance can exist between the rates of formation and rupture of receptor-ligand complexes (Ra Picart et al 1999)
It is also of interest to note that in the region near the edge of the attachment zone(x1=0
in Fig 3115) the membrane acts as a beam subjected to a moment due to the applied tension
This moment is balanced by a force couple due to tension in the adhesion complexes right
adjacent to the edge in combination with a compressive stress between the cell and substrate a
little further in In typical situations this compressive stress can approach levels as high as one
atmosphere and can act to effectively smooth the membrane and recruit new attachment sights While using these continuum descriptions it is important to keep in mind the true
discrete nature of the individual bonds represented in the model as a continuous adhesive
surface This is brought to light by a simple calculation in which the characteristic length over
which the applied tension is supported w is compared to the inter-receptor spacing N -12C
Using typical values for the parameters NC = 103 complexesμm-2 k = 10-5 to 10-6 Nm Kb = 1 to 2x10-18 Nm we find that w cong 01 to 03 μm and the inter-complex spacing N minus1 2
C cong 003 μm While it is reassuring to see that w is typically less than the inter-complex spacing the difference is small It is therefore not surprising that the actual process of cell peeling is stochastic in nature occurring in a sequence of more-or-less discrete steps with a velocity of peeling that varies widely from the mean
The interplay between receptor-ligand bonding and membrane stiffness also determines whether a cell will spread over a surface or peel away from it under a given tension Membrane bending stiffness acts to maintain the membrane and substrate within close proximity near the edge of contact (Fig 3115) Spreading can occur only if their separation distance is within the extended length of the receptor ligand bond over a distance comparable to the linear spacing
48
CHAPTER 21 CELL MEMBRANE MECHANICS AND ADHESION copyRD Kamm 4615
between neighboring bonds ( N minus1 2 C ) Under high tension the surfaces rapidly diverge and
spreading is prevented if the tension is sufficiently low receptor-ligand bonding can occur and spreading can occur
Measurements of adhesion
A variety of methods have been used to experimentally determine the strength of adhesion either
of individual receptor-ligand bonds or populations of bonds as in the case of entire cells
Whole cell experiments are more common and typically require less experimental
sophistication The drawback of course is that they provide only for estimates of average
properties and require certain assumptions regarding the distribution of cell-substrate adhesive
stress for interpretation to the level of a single bond Several of these methods are described
next
Centrifugal cell adhesion assays In this experiment cells are allowed to attached to a substrate
then are placed in a centrifuge rotating at speed ω positioned a distance r from the center of
rotation and oriented so that the net centrifugal force is acting to separate the cell from the
substrate Using the arrangement shown in Fig 3116 (right) the acceleration of the cells is 2ω r and the net force acting on a cell of volume Vc is F = (ρc minus ρf )ω 2rVc where the fluid and cell densities are ρf and ρc respectively
Interpreting these results we can make several different assumptions each leading to a different estimate for the maximum force experienced by the binding complex If we simply assume that all receptor-ligand complexes support an equal fraction of the total force F then the force per bond is f = F (πa 2NC ) where NC is the concentration of bond complexes However as the cell tears away from the substrate the edge bonds will break first since these experience the greatest level of force An alternative approach then is to assume that the adhesion complexes around the cell circumference support the entire load leading to the estimate f = F 2( πaN 1 2 ) recognizing that N1 2
C C is the average distance between bonds A somewhatmore accurate value for f might be obtained if we assume that all complexes within the distance w given by eqn (278) support the load In any of these cases once the centrifugal force exceeds some critical limit since the number of receptors supporting the load falls as the region of contact becomes smaller the force per bond increases and the cell will rapidly detach
Stochastic variability also needs to be taken into account however since even under a constant load any single bond has a finite probability of failure under a given level of force The equilibrium state of the cell then should be viewed as one in which the rate of bond formation equals the rate of bond breakage with increasing force having the effect of reducing the
49
CHAPTER 21 CELL MEMBRANE MECHANICS AND ADHESION copyRD Kamm 4615
probability that the bond will remain intact These effects can be addressed using the methods described in more detail in Chapter xx Parallel flow assay Another common method for assessing cell adhesion is to plate the cells onto one wall of a parallel flow chamber subject them to a fluid dynamic shear stress and observe at what flow rate the cells begin to release If we ignore flow details in the immediate vicinity of the cell the shear stress can be estimated from the solution for a fully developed (Poiseuille) velocity profile
3V ⎡ y2
⎛ ⎞ ⎤v(y) = ⎢1minus ⎥ (279)
2 ⎝ ⎠ ⎣ ⎢ h ⎥⎦
so that the shear stress acting on the cell is
⎛ dv ⎞ 6μV τw = μ⎜ ⎟ = (280)
⎝ dy ⎠ h y = minush
and the total force can be estimated as F asymp τw Ac where Ac is the surface area of the cell membrane exposed to the flow Consider as an example a flow of culture medium at a rate of 1 mls through a channel of height 01 cm and width 1 cm If the culture medium has a viscosity close to that of water (μ=001 dyns) the shear stress is obtained from eqn (280)
6 sdot (001dyn sdot s) sdot (1ml s) ( 01 sdot10cm2 )τ dyn cm 2w = = 6 = 06Pa
01cm This corresponds roughly with the level of shear stress experience by endothelial cells in the arterial system If we consider that the cell has a surface area with dimensions roughly 100 μm x 10 μm or about 103 μm2 then the total force acting on the cell is obtained by integrating the shear stress over the area of the apical membrane Assuming that the shear stress is uniform the force is simply the product of shear stress and surface area or about 1 nN in the present example Again interpretation of results from such experiments requires careful consideration of the distribution of forces among the individual adhesion complexes In this situation the cell is likely to peel from the upstream edge in much the same manner as occurs in the cell peeling experiment discussed earlier
50
CHAPTER 21 CELL MEMBRANE MECHANICS AND ADHESION copyRD Kamm 4615
Radial flow and spinning disk assays One disadvantage of the parallel flow assay is that all cells are subjected to essentially the same level of shear stress so the flow rate needs to be incrementally varied in order to determine the level of force required for detachment These two systems using an axisymmetric geometry circumvent this problem by producing an easily characterized radial variation in shear stress In the case of the radial flow assay fluid enters through a central channel and flows radially outward through the narrow gap between two circular plates From conservation of mass the mean flow velocity is given by
QV = (281)
2πrh and sufficiently far from the center (rgtgth) the velocity profile is parabolic as in the parallel flow assay and the shear stress is again governed by eqn (280) using (281) for V Q
ω
(Not to scale)
v
h h
Cell layer rc Ce l l layer rc
r r
Fig 3116 Schematic diagram showing the radial flow assay (left) and the spinning disk assay (right) In the radial flow assay shear stress attains a maximum value near the center and falls with increasing radius r whereas in the spinning disk system maximum shear stress is experienced at large r In the spinning disk assay cells are grown on one disk and the opposite disk is rotated at constant speed Provided the rate of rotation is sufficiently small that inertial effects can be neglected the velocity is purely in the circumferential direction and the profile is linear between the two plates so that the shear stress experienced by the cells can easily be computed as
ωr τw = μ (282)
h
51
CHAPTER 21 CELL MEMBRANE MECHANICS AND ADHESION copyRD Kamm 4615
In both of these cases as in the parallel flow assay the total force is obtained by integrating the shear stress over the cell surface and the distribution of force among the adhesion complexes is weighted toward those located near the upstream end of the cell This can also be seen by consideration of the torque exerted by shear stress on the cell that must be balanced by a nonshyuniform contact stress with the substrate that is greatest near the upstream end Single bond adhesion assays Two other assays provide a means of obtaining estimates for the strength of a single adhesion bond without the need for excessive interpretation These rely on an ability to isolate a small number of bonds or even a single bond and infer bond strength from the step-wise nature of the de-adhesion process associated with breakage of discrete bonds One of these methods employs the atomic force microscope coated with the ligand of an adhesion receptor as shown in Fig 3117 The probe tip is gradually brought up to the cell surface until one or more receptor-ligand bonds are formed When the probe tip is withdrawn it moves along a different trajectory on a force-displacement plot reflecting the forces of adhesion These forces are seen to jump between more or less discrete levels as the probe continues to be moved away from the cell with each jump corresponding to the breakage of a single bond (Fig 3117) Using this method the bond strength between integrin receptor and a variety of RGD-containing ligands was found to lie in the range of 30 to 100 pN (Lehenkari and Horton 1999)
Fig 3117 The strength of a single adhesion bond can be measured by bringing a functionalized tip of an AFM probe up to the cell allowing bonds to form then slowly withdrawing the probe Monitoring the differences between the force displacement curve between the forward and reverse motions the forces necessary to break a single receptor-ligand bond can be determined [Reproduced from (Lehenkari and Horton 1999)]
52
CHAPTER 21 CELL MEMBRANE MECHANICS AND ADHESION copyRD Kamm 4615
A second method is similar in that the discrete increments in force are monitored as individual receptor-ligand bonds are broken but the forces are measured by means of changes in the shape of a giant vesicle the membrane of which contains the ligands have been inserted In this case one vesicle is made effectively rigid due for example to a high surface tension A second vesicle containing the adhesion molecules is also drawn partially into a micropipet but is much more complaint than the first The two vesicles are then brought into point contact so that one or a small number of adhesions are formed As the pipets are moved apart the compliant vesicle distorts due to the force of adhesion which it can be shown is related to the change in dimension of the vesicle in the direction of the force thereby serving as a sensitive force transducer measuring forces in the range of single adhesion receptors or between 1 and 100 pN [Evans 1991 37]
(For specific examples of leukocyte rolling and attachment see Orsello or Chang amp Hammer)
[This process is initiated for example by local infection that causes the release of
chemotactic agents in addition to cytokines hellip
Models of this process draw upon many of the concepts discussed in this chapter ]
Transient cell adhesion
Concepts of transient adhesion and release are of particular importance in the case of leukocyte
rolling adhesion and transmigration across the endothelial layer of a blood vessel In addition
cell migration through extracellular matrix or along a substrate requires the ability of the cell to
both form and release adhesions
One problem that has received considerable attention is the interaction between an
adherent or rolling leukocyte and the adhesion receptors on the endothelium These studies are
complicated by the three-dimensional nature of the flow the compliance of the interacting
surfaces and receptor-ligand dynamics In a series of recent studies Hammer and co-workers
(Chang Tees et al 2000) have addressed several of these issues computing the viscous force
and torque acting upon a sphere near to planar wall from the mobility matrix (Hammer and Apte
1992) and using the ldquoBell modelrdquo of receptor binding (Bell 1978) but neglecting the effects of
cell deformation The Bell model relates the dissociation rate constant kr to the force in the
bond f the thermal energy kBT and a parameter with units of length that depends on the
reactivity of the molecule
kr = ko r exp(γf kBT ) (283)
53
CHAPTER 21 CELL MEMBRANE MECHANICS AND ADHESION copyRD Kamm 4615
A Monte Carlo method is employed at each time step in the calculation to determine bond
formation or breakage In these studies the nature of the leukocyte-endothelial interaction is
characterized as firm adhesion rolling adhesion bimodal adhesion or no adhesion and mapped
as a function of the two parameters of the Bell model in Fig 3 The boundaries of the rolling
adhesion regime are identified for a wall shear rate of 100 s-1 (dotted lines) or 30 and 400 s-1
(solid lines) Most literature values for the Bell model parameters for a variety of selectin
receptors (known to be instrumental in leukocyte rolling) correspond to the rolling adhesion
regime for typical shear rate of 100 s-1 An interesting but counterintuitive result from this study
was the observation that as the bond stiffness was increased from the value used in most
calculations (100 dyne cm-1) adhesiveness decreased which the authors attribute to reduced
deflection for a given level of force leading subsequently to more rapid dissociation
Fig 3118 The state diagram for a leukocyte interacting with an endothelial surface for shear rates ranging from 30 to 400 s-1 For low dissociation rates the leukocyte remains adherent to the surface (lower left) As either (γ) or ( ko
r ) [see Eqn (283) for definitions] is increased the cell first adheres firmly then rolls along the wall then completely detaches (upper right) Rolling adhesion is defined as the regime where rolling occurs over some part of the shear rate range between 30 and 400 s-1 Firm adhesion indicates that cells remain attached even at the highest shear rate no adhesion indicates that cells roll at a velocity gt 50 of the velocity of a non-adherent sphere In the bimodal regime cells are either adherent or non-adherent and do not exhibit rolling Dotted curves correspond to these same boundaries for a shear rate of 100 s-1 Reproduced from Chang et al (2000)
54
CHAPTER 21 CELL MEMBRANE MECHANICS AND ADHESION copyRD Kamm 4615
In another recent study using high-resolution video-microscopy (Schmidtke and Diamond
2000) it was demonstrated that a flowing neutrophil can attach to an adherent platelet via
adhesion molecules located in the tips of the microvilli and form long tethers averaging nearly 10
μm in length but ranging up to 40 μm at extensional rates of 6-40 μm s-1 for shear rates ranging
from 100-250 s-1 The mechanics of tether formation is itself a fascinating topic that is still under
intense investigation Readers interested in pursuing this work in more detail are referred to the
several papers (Hochmuth Shao et al 1996 Dai and Sheetz 1998 Dai and Sheetz 1999) that
identify a number of intriguing phenomena
55
CHAPTER 21 CELL MEMBRANE MECHANICS AND ADHESION copyRD Kamm 4615
317 Nomenclature Parameter Definition Units
R - receptor
L - ligand
C - receptor-ligand complex
G - Gibbs free energy Nm
N - membrane tension Nm
NR - total receptor density -3μm-2 in 2D or μm in 3D NL - total ligand density μm-2 in 2D or μm-3 in 3D N in 2D or μm-3μm-2
C - complex density in 3D NRf - free receptor density m-2 in 2D or m-3μ μ in 3D NLf - free ligand density -2 -3μm in 2D or μm in 3D d+ - forward diffusional rate constant 2 -1μm s-1 in 2D or 3 μm s in 3D d -1
- - reverse diffusional rate constant s r+ - forward reaction rate constant s-1
r- - reverse reaction rate constant s-1 D 2 -1
m - membrane diffusion coefficient μm s D - solution diffusion coefficient m2 s -1s μ Kb - bending stiffness Nm K 0 - equilibrium constant or affinity (zero force) M-1 in 3D and 2μm in 2D = k0
+ k0 minus
K - equilibrium constant M-1 in 3D and m2μ in 2D = k+kshy
k0 - association rate constant (zero force) M-1 s-1 in 3D or m-2 -1+ μ s in 2D
k0 - dissociation rate constant (zero force) s-1 minus
k - association rate constant M-1 s-1 in 3D or m-2 -1+ μ s in 2D
kminus - dissociation rate constant s-1 f - force per bond N F - total adhesion force N γ - empirical parameter μm r0 - distance over which energy minimum acts μm E0 - bond energy J k JK-1
B - Boltzmanns constant T - temperature K τ - bond lifetime s
56
CHAPTER 21 CELL MEMBRANE MECHANICS AND ADHESION copyRD Kamm 4615
τ0 - bond lifetime with zero force s σ - adhesion stress N μm-2 κ - spring constant for receptor-ligand bond N μm-1
57
CHAPTER 21 CELL MEMBRANE MECHANICS AND ADHESION copyRD Kamm 4615
References Bell G I (1978) Models for the specific adhesion of cells to cells Science 200 618-627 Caille N O Thoumine et al (2002) Contribution of the nucleus to the mechanical properties
of endothelial cells J Biomech 35(2) 177-87 Chang K C D F Tees et al (2000) The state diagram for cell adhesion under flow
leukocyte rolling and firm adhesion Proc Natl Acad Sci U S A 97(21) 11262-7 Dai J and M P Sheetz (1998) Cell membrane mechanics Methods Cell Biol 55 157-71 Dai J and M P Sheetz (1999) Membrane tether formation from blebbing cells Biophys J
77(6) 3363-70 Daily Elson et al (1984) Determination of the elastic area compressibility modulus of the
erythrocyte membrane Biophys J 45(4) 671-682 Evans E and K Ritchie (1997) Dynamic strength of molecular adhesion bonds Biophys J
72(4) 1541-55 Evans E A (1983) Bending elastic modulus of red blood cell membrane derived from
buckling instability in micropipet aspiration tests Biophys J 43(1) 27-30 Hammer D A and S M Apte (1992) Simulation of cell rolling and adhesion on surfaces in
shear flow general results and analysis of selectin-mediated neutrophil adhesion Biophys J 63(1) 35-57
Hardt S L (1979) Rates of diffusion controlled reactions in one two and three dimensions Biophysical Chemistry 10 239-243
Hochmuth F M J Y Shao et al (1996) Deformation and flow of membrane into tethers extracted from neuronal growth cones Biophys J 70(1) 358-69
Kucik D F E L Elson et al (1999) Weak dependence of mobility of membrane protein aggregates on aggregate size supports a viscous model of retardation of diffusion Biophys J 76(1 Pt 1) 314-22
Kusumi A Y Sako et al (1993) Confined lateral diffusion of membrane receptors as studied by single particle tracking (nanovid microscopy) Effects of calcium-induced differentiation in cultured epithelial cells Biophys J 65(5) 2021-40
Lehenkari P P and M A Horton (1999) Single integrin molecule adhesion forces in intact cells measured by atomic force microscopy Biochem Biophys Res Commun 259(3) 645-50
McCloskey M and M M Poo (1984) Protein diffusion in cell membranes some biological implications Int Rev Cytol 87 19-81
Meleard P Gerbeaud C Bardusco N Mitov MD and Ferdandex-Puente L (1998) Mechanical properties of model membranes studied from shape transformations of giant vesicles Biochimie 80 401-413
Moy V T Y Jiao et al (1999) Adhesion energy of receptor-mediated interaction measured by elastic deformation Biophys J 76(3) 1632-8
Ra H J C Picart et al (1999) Muscle cell peeling from micropatterned collagen direct probing of focal and molecular properties of matrix adhesion J Cell Sci 112 ( Pt 10) 1425-36
Saffman P G (1976) Bownian motion in thin sheets of viscous fluid Journal of Fluid Mechanics 73 593-602
Schmidtke D W and S L Diamond (2000) Direct observation of membrane tethers formed during neutrophil attachment to platelets or P-selectin under physiological flow J Cell Biol 149(3) 719-30
Sheets E D R Simson et al (1995) New insights into membrane dynamics from the analysis of cell surface interactions by physical methods Curr Opin Cell Biol 7(5) 707-14
58
CHAPTER 21 CELL MEMBRANE MECHANICS AND ADHESION copyRD Kamm 4615
Vink H and B R Duling (1996) Identification of distinct luminal domains for macromolecules erythrocytes and leukocytes within mammalian capillaries Circ Res 79(3) 581-9
Waugh R and E A Evans (1979) Thermoelasticity of red blood cell membrane Biophys J 26(1) 115-31
Zeman K H Engelhard et al (1990) Bending undulations and elasticity of the erythrocyte membrane effects of cell shape and membrane organization Eur Biophys J 18(4) 203shy19
Zhelev D V D Needham et al (1994) Role of the membrane cortex in neutrophil deformation in small pipets Biophys J 67(2) 696-705
59
MIT OpenCourseWarehttpocwmitedu
20310J 3053J 6024J 2797J Molecular Cellular and Tissue BiomechanicsSpring 2015
For information about citing these materials or our Terms of Use visit httpocwmiteduterms
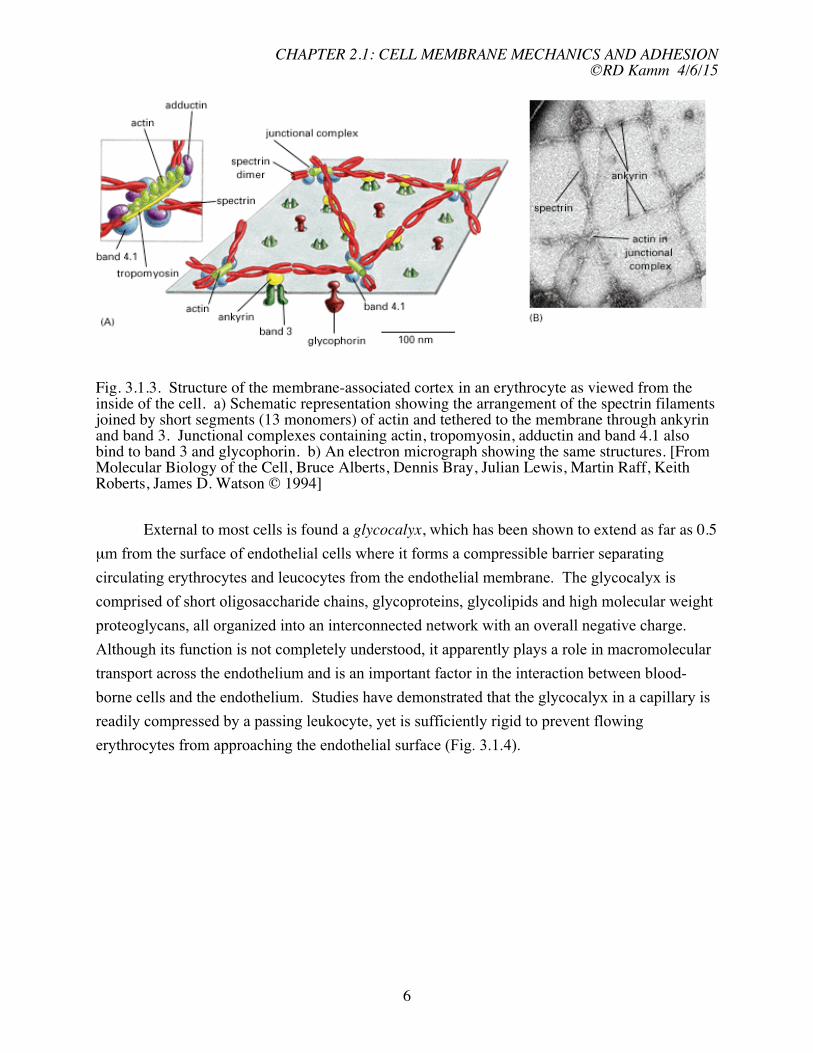
CHAPTER 21 CELL MEMBRANE MECHANICS AND ADHESION copyRD Kamm 4615
properties of the model Were it not for these the membrane would exhibit little resistance to
shear deformation
In qualitative terms the lipid bilayer can be thought of as a two-dimensional fluid within
which the individual lipid molecules or other molecules embedded in the membrane are
relatively free to move about by diffusion or directed motion Phospholipid molecules in either
of the two layers resist being pulled apart however so each layer is highly inextensible This
also contributes to the bending stiffness which is low in absolute terms but high for such a thin
layer since bending requires one layer to expand while the other is compressed By contrast the
two layers readily slide relative to each other These qualitative notions are put in more
quantitative terms in the next section
Types of deformation
Any deformation can be thought of in general terms as a superposition of several
simpler deformations For small strains in which linearization is appropriate the principle of
superposition is rigorously valid For larger strains however linear theory breaks down and
superposition can only be used as a rough qualitative guide in visualizing combined influences
Here we present the three primary types of deformation pure extension pure bending and pure
shear Later we also consider the influence of membrane viscosity in time-dependent
deformations
σ2
A
A0
σ1 σ1
x2
σ2
x1 Fig 315 A membrane initially of area A0 subjected to a uniform extensional stress along its edges σ1 = σ2 causing an increase in area to A
Pure extension In discussing the extensional stiffness of the membrane we need to distinguish
the behavior at low tension from that at high tension As you first begin to apply an extensional
8
CHAPTER 21 CELL MEMBRANE MECHANICS AND ADHESION copyRD Kamm 4615
stress at the edges of a lipid bilayer the projected or apparent membrane area first increases
while the actual or true membrane area remains constant This results from the suppression of
out-of-plane undulations Forces acting to resist membrane flattening originate from entropic
effects analogous to those seen in the case of a flexible polymer as its end-to-end distance is
increased ndash many more membrane configurations exist with undulations compared to the single
perfectly flat state Only when these undulations have been eliminated does the true membrane
area proportional to the surface area per molecule group begin to increase and this is associated
with a relatively abrupt increase in extensional stiffness For now we consider only the stiffness
of a flat membrane and leave the discussion of undulations of entropic origin to a later point in
the chapter Hence we initially neglect all entropic effects or equivalently consider the
membrane to be at zero temperature
Based in this assumption consider an infinitesimal plate initially of area A0 = L 20 that is
deformed by a uniform normal stress τ11 = σ1 = τ22 = σ2 applied to its edges (Fig 315) to a
new area A Previously we derived the expressions relating stress and strain which in two
dimensions and in the absence of stresses normal to the x1-x2 plane can be written
E
σ α = 2 (εα + νε β ) (21) 1minus ν
where the length of one edge Lα=L0(1+εα) Note that in this chapter we use the subscripts α β
rather than i j to distinguish stresses and strains in two dimensions from those more generally
in three Thus whereas i and j can be either 1 2 or 3 α and β are restricted to being either 1 or
2 When this stress is uniform in the plane of the membrane (the x1- x2 plane) it can be replaced
without loss of generality by a surface tension Nα (force per unit length) defined as σ α h where h
is the thickness of the membrane These can be combined in the case when N1 = N2 = constant
and consequently ε1 = ε2 = ε to give
Eh
N = ε (22)1 minus ν
In terms of a plate stretched uniformly in both directions we can define the areal strain as
ΔA A minus A 2 2 2
= 0 L0 (1+ ε ) minus L= 0
2 cong 2ε (23)A0 A0 L0
where the last approximation is appropriate for small strains By combining this result with eqn
(22) we can define the area expansion modulus Ke (units of Nm)
9
CHAPTER 21 CELL MEMBRANE MECHANICS AND ADHESION copyRD Kamm 4615
Eh ΔA Δ A
N = equiv K (24)2(1minus ν) A e
0 A0
Note that although we used the continuum structural equations in our analysis the final result
can also be viewed as simply the definition of the area expansion modulus and applies regardless
of whether or not the membrane can be modeled as a continuum
Experimental measurements of Ke lie in the range of 01-1 Nm for various types of lipid
bilayers and about 045 Nm (450 dyncm) for red blood cell membranes (Waugh and Evans
1979) These numbers suggest that cell membranes are quite resistant to extension and for that
reason are often treated as inextensible1 This high resistance to area change is in large part due
to the energy penalty associated with exposing the hydrophobic core of the membrane to water
that occurs as the spacing between individual amphiphilic molecules is increased [for a detailed
description of bilayer structure and thermodynamics see Tanford (1980) or Israelachivili
(1991)] Continuing to increase extensional stress the lipid bilayer eventually ruptures but at
very small extensional strains in the vicinity of 2 to 3 (Mohandas amp Evans 1990) Note that a
bilayer in a lipid vescicle for example stretches primarily by increasing the area per molecule
since recruitment of additional material to the membrane occurs very slowly
Using these expressions we can estimate the level of surface tension at which the
membrane would rupture At a 3 extensional strain (6 areal strain) uniformly applied in the
x1-x2 plane the surface tension at rupture would be about 006 Nm if we use a value near the
higher end of the observed range Ke = 1 Nm Using Laplaces law [see eqn (227)] for the
relationship between the pressure difference (ΔP) across a spherical shell of radius R = 1 μm and
the surface tension in the shell gives us
2N
ΔP = = 12x105 Pa cong 1200cmH 2O R
a remarkably high value of pressure given the thickness of the membrane is only 6 nm
Cells also often exhibit an intrinsic surface tension Reported values are small however
lying in the range of about 10-5 to 10-4 Nm (Sheets Simson et al 1995) For comparison recall
that the surface tension across the interface of a droplet of pure water is about 007 Nm a value
close to the rupture stress of the membrane given above It becomes immediately obvious then
that the tension of a cell membrane must be orders of magnitude smaller than the surface tension
1 This discussion neglects the effects of thermal fluctuations in the membrane that give rise to a much more compliant behavior at the smallest areal strains When surface stress is sufficient to smooth out most thermal fluctuations the cell or vesicle will exhibit the large moduli given here See also Example xx later in this chapter
10
CHAPTER 21 CELL MEMBRANE MECHANICS AND ADHESION copyRD Kamm 4615
of a typical gas-liquid or liquid-liquid interface since it would otherwise give rise to intracellular
pressures on the order of one atmosphere
Pure bending By contrast lipid bilayers exhibit a very low bending stiffness so low that it is
often neglected in models of membrane mechanics It can be important in certain situations
however and is essential for example in analyzing the thermal fluctuations of vesicles discussed
later in this chapter
Bending stiffness arises from the same type of molecular interactions that cause
extensional stiffness When an initially flat bilayer is bent the hydrophilic head groups on the
outside of the bend move further apart while on the inside intermolecular spacing decreases
both represent departures from the equilibrium unstressed state and require energy If the same
forces of interaction are responsible why then is bending stiffness so low While the answer to
this question is not simple one factor is the membrane thickness which you recall is only about
6 nm As the membrane bends therefore the change in the surface area per molecule is
extremely small so the associated extensional strains are also minute
Returning to our simple continuum plate model consider a bending moment applied to
the two ends causing the plate to curve slightly (Fig 316) If the bending is due to moments
applied at the two ends about the x2-axis then the bending moment per unit length is related to
the deflection by
Et 3 ⎛ part 2u ⎞ ⎛ part 2 ⎞
⎜ 3 u
Mα = minus 2 2 ⎟ = minusK B⎜ 32 ⎟ (25)
12(1minus ν ) ⎝ partxα ⎠ ⎝ partxα ⎠
where KB is termed the bending stiffness having units of Nm Implicit in this expression are the
assumptions that there exists a mid-plane (the neutral plane) on which the in-plane stress and
strain are both zero and that straight lines perpendicular to this mid-plane remain straight and
normal to this surface after deformation
Typical values for the bending stiffness KB lie in the range of 10-19 Nm (10-12 dyncm) for
a red blood cell or lipid bilayers (Mohandas amp Evans 1990) This value is larger on the order of
1-2x10-18 Nm (Zhelev Needham et al 1994) for other cell types (eg neutrophils endothelial
cells) that possess a more extensive cortex The methods used to obtain these values will be
described later in this chapter
11
CHAPTER 21 CELL MEMBRANE MECHANICS AND ADHESION copyRD Kamm 4615
Fig 316 Plate subjected to equal moments M1 at the two edges
Example Estimate the moment per unit length acting within an initially flat lipid bilayer (at zero
temperature) associated with a wavelength λ = 5 μm and amplitude ε = 1 μm
Membrane displacement can be approximated by the expression
u3 = ε sin (2πx1 λ) (26)
From eqn (25) above we obtain
2
⎛ 2π ⎞ M1 = KBε sin (2πu )⎝ ⎠ 3 λ (27)λ
Using the values given above the maximum moment per unit length is 0158 pN
Pure shear Shear deformations arise when a membrane is stretched in one direction by a
surface tension N1 (units of forcelength) while the lateral surface contracts under a lesser tension
N2 at constant surface area and in the absence of bending (Fig 317) Surfaces oriented at 45
degrees to the boundaries experience pure shear stresses of magnitude (N1 - N2)2
When subjected to shear stresses in the plane of the membrane a pure lipid bilayer
behaves essentially as a liquid It exhibits a membrane viscosity in that it poses a resisting force
proportional to the rate of shear deformation but only a small shear modulus to static shear
deformations It is not clear in fact whether or not pure lipid bilayers exhibit a non-zero shear
modulus For example the movement of membrane-bound proteins can be described by a
simple diffusion coefficient proportional to the membrane viscosity Typical cell membranes do
exhibit a shear modulus however largely due to the cortex of cytoskeletal filaments that lie on
the intracellular side of the membrane In a red blood cell this matrix as discussed above
12
CHAPTER 21 CELL MEMBRANE MECHANICS AND ADHESION copyRD Kamm 4615
consists of interconnected filamentous spectrin and actin with attachments to the membrane via
ankyrin
N2
N1 N1
N2 Fig 317 A section of membrane subjected to a shear stress of magnitude N1-N22
The equations relating shear stress to shear deformation (Hookes law) from Ch xx can
be applied here
τ12 = τ 21 =2Gε12 (28)
or expressed as a shear force per unit length of membrane
N12 =τ12 h = 2Gε12 = Ksε12 (29)
where we define the membrane shear modulus Ks with units of Nm Typical values lie in the
range of 6-9 x 10⁻⁶ Nm for a red blood cell membrane A pure lipid bilayer exhibits a viscous
resistance to shear deformations characterized by a shear viscosity of about 10-6 Nsm ((Evans
1983))
The 2D elastic plate -- equations of deformation
In the analysis of cellular membranes several unique characteristics need to be taken into
account
1 The membrane is extremely thin relative to its lateral extent If we consider the thickness to
be that of the lipid bilayer by itself then h can be as small as 6 nm compared to a typical cell
dimension on the order of 10s of μm Even if we include the sub-membrane cortex this
13
CHAPTER 21 CELL MEMBRANE MECHANICS AND ADHESION copyRD Kamm 4615
dimension only increases to about 100 nm This tends to favor in-plane stresses over bending
effects2
2 The non-shear deformations are very small with strains of at most a few percent Therefore
linear analysis is appropriate in many situations Note however that nonlinear effects can be
important especially for large shear deformations such as occur in micropipet aspiration of
red blood cells The implications and limitations of this are discussed more fully below
3 The membrane exhibits a very small modulus in plane shear and is often treated as a two-
dimensional liquid While this applies primarily to lipid bilayers when the membrane is
considered to include the cortex greater values of shear modulus can be observed
4 Stresses normal to the membrane are small and can be neglected
5 Membrane motions can be damped either due to viscous dissipation within the bilayer as in
the case of in-plane shear or due to the viscosity of the fluids on the intra- or extracellular
sides of the membrane These latter are especially important when considering motions of
the membrane perpendicular to its plane
6 Inertial effects can be neglected due to the predominance of viscous forces during transient
deformations
With these in mind and acknowledging the limitations of a continuum view of such
structures we treat the membrane as a thin homogeneous plate or membrane in which all the
following must be considered in-plane extension and shear bending viscous damping and
thermal fluctuations
The equations we derive will effectively be integrated through the membrane thickness so
that stresses will be in terms of surface forces (force unit length) These are the in-plane normal
forces (see Fig 318 for definition of the axes and nomenclature) are therefore written as
+ h 2
Nα = int σ α dx3 (210) minus h 2
where h is the membrane thickness and the vertical shearing forces
+ h 2
Vα = (211) minus h
int τα 3dx3
2
The moments acting on the plate edges can be calculated from
2 Whether tension or bending dominates clearly depends on the nature of the experiment If an initially spherical cell is distended tension is most important if the cell shrinks so that the membrane buckles bending effects will be critical
14
CHAPTER 21 CELL MEMBRANE MECHANICS AND ADHESION copyRD Kamm 4615
+h 2
Mα β = int x3τα β dx3 (212)minush 2
x
(c)
Fig 318 (a) A small section of membrane (b) Membrane deflections (c) Nomenclature used in defining the forces acting on a section of membrane (Note that Q is used to represent shear stress in the figure whereas V is used in the text and (xyz) should be (x1x2x3))
In order to distinguish the effects of bending from those giving rise to extension we separate the
normal stress into two parts one representing the mean over the thickness of the membrane
which is simply Nαh and the other representing the deviation from this value denoted as σαprime
Similarly we separate the displacement on the neutral plane unα from that which varies with x3
denoted as uαprime Consequently we can write
N
uα = u n + primeα and = iα u σ α + primeσ α (213)
h
And consistent with the assumption that planar edges initially normal to the membrane remain
planar under bending deformations we have that
15
CHAPTER 21 CELL MEMBRANE MECHANICS AND ADHESION copyRD Kamm 4615
partu uαprime = minus x 3
3 (214)partxα
According to assumption (4) above the relationships between stress and strain become
E σ α = νε β ) α ne β (215)
minus ν2 (ε1 α +
and
E ταβ = εαβ α ne β (216)
(1+ ν )
Since
partuα partunα partu
= αprime ε α = + (217)
partxα partxα partxα
(summation convention not used) We eventually obtain the following expressions for the
bending moment
+h 2 ⎛ part 2 u part 2 ⎞ M 3 u3
α = int σ α x3dx3 = minusKB ne (218)⎜ ⎝
2 + ν ⎟ α β partx 2
minush 2 partxα β ⎠
and
+ h 2 part 2u
M12 = int ε KB (1minus ν) 312 x3dx3 = minus (219)
minus h 2 partx1partx2
where in classical shell theory for continuum materials KB=Eh3(1-ν2) The moments are related
to the shear forces in the plane of the membrane through a moment balance about the x1 axis
giving
partM 12 partM
+ 2 minus V2 = 0 (220)partx1 partx2
so that
part ⎛ part 2 u part 2 u ⎞ part ⎛ part 2 part 2
V = minus 3 + 3 uandV 3 u
K ⎜ ⎟ = minus K ⎜ + 3⎞
2 B ⎟ (221)partx2 ⎝ partx 2 2 ⎠ 1 B 2 2
1 partx2 partx1 ⎝ partx1 partx2 ⎠ A force balance in the direction normal to the membrane yields
16
CHAPTER 21 CELL MEMBRANE MECHANICS AND ADHESION copyRD Kamm 4615
partV1 partV2 part ⎛ partu ⎞ part ⎛ partu ⎞+ + ⎜ N 3 ⎟ + ⎜ N 3 ⎟
2 + p = 0 (222)x 1
part 1 partx2 partx1 ⎝ partx1 ⎠ partx2 ⎝ partx2 ⎠
which upon substitution for V1 and V2 from eqns (221) becomes
⎛ part4u3 part4u part4u3 part part ⎛ ⎞K 3 ⎞ part ⎛ u ⎞
B 4 N 3 partu
+ 2 + minus minus N 3 minus p = 0 (223)⎜ ⎟ ⎜ ⎟ ⎜ ⎟⎝ partx1 partx2partx2 partx4 ⎠ partx ⎝ 1 partx ⎠ partx ⎝ 21 2 2 1 1 2 partx2 ⎠
Recall that the first term in parentheses is due to bending the second and third terms are due to
in-plane extension and the fourth term represents the pressure difference across the membrane
Eqn (223) contains three unknowns the displacement u3 and the two normal forces per
unit length N1 and N2 Fortunately the additional equations required for solution are quite easy
to obtain from simple force balances in the x1 and x2 directions Setting the sum of forces in the
x1 direction equal to zero we obtain (referring to Fig 319)
minus N1(x1) + N1(x1 + dx1)cosθ (x1 + dx1) minus N21 (x2 ) + N21(x2 + dx2 ) = 0 (224)
or
partN1 partN21 partN2 partN + = 0 and similarly + 12 = 0 (225)
partx1 partx2 partx2 partx1
While formidable in its complete form it is reassuring to know that we rarely use eqn
(223) in its entirety and that when certain limiting cases are considered more familiar equations
are obtained It is useful at this stage to consider several of these limits
Fig 319 x1 force balance in the plane of the membrane
17
CHAPTER 21 CELL MEMBRANE MECHANICS AND ADHESION copyRD Kamm 4615
Balance between pressure and surface tension (Laplacersquos Equation) If the in-plane stress is
uniform (Ni=Nj=N) eqn (223) has the form
⎛ part 4u part 4u part 4u ⎞ ⎛ part 2u KB ⎜
3 4 + 2 3 3
2 2 + 4 ⎟ minus N⎜ 3 part 2u
2 + 3 ⎞
2 ⎟ minus p = 0 (226)⎝ partx1 partx1 partx2 partx2 ⎠ ⎝ partx1 partx2 ⎠
and eqn (225) is trivially satisfied If in addition bending stiffness can be neglected then
⎛ part 2 u part 2 ⎞ ⎛ 1 1 ⎞ 3 u
p = minusN ⎜ 3
2 + 2 ⎟ cong N⎜ + ⎟ (227)⎝ partx1 partx2 ⎠ ⎝ R2 R1⎠
for small curvatures where R1 and R2 are the radii of curvature of the membrane about the x1 and
x2 axes respectively This is the well-known Laplacersquos equation with N the surface tension For
a sphere R1 = R2 and the equation simplifies further yielding the equation given on p 10
Balance between pressure and bending Alternatively if all in-plane stresses can be neglected
other than those associated with bending stiffness we obtain the equation generally used for
simple bending of plates and shells
⎛ part 4u part 4u part 4 3 3 u ⎞
KB ⎜ 4 + 2 2 + 3 ⎟ = p (228)
⎝ partx1 partx1 partx2 partx 4 2 2 ⎠
Both of these forms will be used later in this chapter to examine specific problems in cell
membrane mechanics
The conditions under which eqn (226) can be reduced to either (227) or (228) can be
determined by an order of magnitude comparison of the bending and tension terms If we take u
to be a measure of the membrane displacement in the x3 direction and λ to be the characteristic length in the x1 or x2 directions over which u3 varies then the bending term can be shown to scale as K 4 2
Bu λ and the tension term as Nu λ The ratio of these tells us which of the terms dominate in eqn (226) If
KBu λ4 K= B ltlt 1
Nu λ2 Nλ2
then tension dominates and eqn (227) is appropriate Alternatively if
KB gtgt 1 Nλ2
18
CHAPTER 21 CELL MEMBRANE MECHANICS AND ADHESION copyRD Kamm 4615
then bending dominates and eqn (228) should be used If we take values typical of those given
for cells K N = 5x10⁻⁵B = 10-18 Nm Nm λ = 1 μm this ratio equals 002 confirming as we
originally postulated that tension tends of dominate
Nonlinear formulations
Traditionally membrane deformations have been addressed through nonlinear analysis allowing
for large strains especially in shear Here we have chosen to present the linearized equations in
the hope that they will provide clearer insight and for continuity with the approach used in other
chapters of the text For many problems of interest deformations are small and linear theory is
sufficiently accurate In some circumstances however a nonlinear analysis is necessary one
example being the aspiration of a red blood cell membrane into a micropipet For this reason we
present the nonlinear equations in Appendix A for the more advanced reader and to assist in
reading the recent literature on membrane mechanics
Energies of deformation
Although the formulation of the equations of deformation in Section 316 is complete by itself
an alternative approach is often useful in which we consider the strain energy the energy stored
in the membrane due to elastic deformation as a basis for analysis Strain energy is analogous to
the energy stored in a spring by stretching it If the spring is linear with a stiffness k so that the
force F required to lengthen it from x0 to x is k(x-x0) then the energy expended during the
process of lengthening is
x x
U = int Fdx = int k(x minus x0 )dx = 1 2 k(x minus x0)
2 (229)x= x 0 x = x 0
Extensional energy Now consider a section of an elastic membrane of thickness h and lengths
dx1 and dx2 subjected to a uniaxial tension stress σ1 Here as in our previous discussion we
consider two cases first a flat membrane which is being stretched by extensional stresses (the
case at zero temperature) and second the situation in which the surface area of the membrane
projected onto a flat plane increases due to the smoothing of out-of-plane undulations (the
entropic contribution)
As the stress is gradually applied to minimize any dissipative effects the work done by
the external force must equal the gain in elastic energy stored in the plate The work performed
by this stress is
19
CHAPTER 21 CELL MEMBRANE MECHANICS AND ADHESION copyRD Kamm 4615
ε1 ε 1
dU = int σ 1dε 1dx1dx2 dx3 = int Eε1dε1dx1dx2dx3 (230)0 0
By energy conservation the work done in stretching the membrane must be stored as potential
or strain energy in the elastic member Since the right-hand-side of (330) represents the strain
energy in the volume dx1dx2dx3 then the energy per unit volume of membrane is
ε1 ε1
U0 = int σ 1dε1 = int Eε = 1 Eε21dε1 2 1 (231)
0 0
or expressed as energy per unit area of membrane
Ehε2
U 10h = (232)
2 In the somewhat more general case of biaxial strain a similar approach leads to
Eh ⎡ 2 2
( 2 2 ) Eh ⎛ ⎤partu ⎞ uε1 + ε 2 = ⎢⎜
1 ⎛ part
⎟ + ⎜ 2
⎞ U0h = ⎟ ⎥ (233)
2 1( minus ν ) 2 1( minus ν ) ⎢⎝ partx⎣ 1 ⎠ ⎝ partx2 ⎠ ⎥⎦
Note that if the strain is isotropic in that ε1 = ε2 = ε this can also be expressed in terms of the
areal strain with the aid of eqn (23)
2 Eh ⎛ ΔA⎞
U0h = ⎜ ⎟ (234)4 1( minus ν ) ⎝ A0 ⎠
from which it can be seen by eqn (24) that the area expansion modulus has the form
Eh Ke = (235)
2 1( minus ν )
under the assumptions of a homogeneous isotropic elastic membrane This term however only
accounts for the contribution to extensional energy associated with an increase in the surface area
of a membrane Another contribution arises from the change in the membrane surface area
projected onto the x1-x2 plane due to non-uniform displacements perpendicular to the plane of
the membrane in the x3 direction This can be seen from the following one-dimensional
example
Consider a membrane tethered at both ends that exhibits a constant surface tension N
when deformed into a new state defined by u3(x1) Locally the change in length of a segment
initially of length dx is
20
CHAPTER 21 CELL MEMBRANE MECHANICS AND ADHESION copyRD Kamm 4615
( 2 2 dx ) + ( du3 ) minus dx = [1 du3 dx1)2]
12 2 2 + ( dx 1 1
1 minus dx1 asymp (1+ 2 (du3 dx1) )dx1 minus dx1 = 2 (du3 dx ) dx(236) 1 1
[see also Figs 64 and 65 in Boal] The strain is then the change in length over the initial length or
2ε11 = 1
2 (du3 dx1) (237) and the energy per unit area associated with this change in length under a constant tension N is
2 ε N ⎛ partu ⎞
U0h = N1int dε =0
⎜ 3
⎟ (238)2 ⎝ partx1 ⎠
which extending to two dimensions can be written
⎡⎛ ⎞ 2 ⎛ 2⎤ N partu3 partu ⎞U ⎢⎜ ⎟ + ⎜ 3
0h = ⎟ ⎥ (239)2 ⎢⎝ partx1 ⎠ ⎝ partx⎣ 2 ⎠ ⎦ ⎥
It is important to recognize that we now have two expressions associated with the energy of
extension and they represent two distinct phenomena The first [eqn (333)] describes the
energy associated with true areal expansion that is a change in the effective spacing between the
molecules comprising the lipid bilayer The second [eqn (339)] corresponds to the energy
change due to undulations in a membrane with constant intermolecular spacing To see the
distinction between the two consider an experiment in which the pressure inside a cell or a lipid
vesicle is gradually increased by aspiration into a micropipette Initially the projected area of
the membrane rises rapidly with a relatively small increase in membrane tension corresponding
to the smoothing of undulations caused by thermal excitation of the membrane This is followed
at higher tensions by a transition to a regime in which the membrane exhibits a much greater
stiffness corresponding to the situation in which the thermally-induced undulations have been
smoothed out and the true membrane surface area now must increase In the absence of thermal
fluctuations eg at zero temperature only this second regime would be observed [see also
figure from Boal]
Energy of shear deformation Next examine the energy per unit area associated with shear
deformation in the plane of the membrane which can be expressed in the form
2
1 1 2 Gh ⎛ part u1 partu2 ⎞
U0h = 2 hτ12ε12 = 2 hGε12 = ⎜ + ⎟ (240)2 ⎝ partx2 partx1 ⎠
21
CHAPTER 21 CELL MEMBRANE MECHANICS AND ADHESION copyRD Kamm 4615
where we have utilized eqns (28) and (29) to obtain a form similar to that of eqn (234) for
extensional deformation
[See Boal for an alternative form in terms of membrane curvature He also gives a nice
description of bending in bilayer membranes]
Bending energy The contribution due to bending energy is somewhat more difficult to derive
First recognize that only those normal stresses that vary with x3 contribute to the bending
energy that is those contributed by the σ stresses in eqn (213) With this in mind we can
write the expression for the total elastic energy due to bending as
1 1 U = intintint ⎧ [ 2
⎨ ( ) 2 ⎫ σ 1 prime + ( )2
σ 2 prime + 2νσ 1 primeσ prime 2 ] + ( )τ 12 prime ⎬dx (241)⎩2E 2G ⎭ 1dx2dx3
Substituting for the stresses and strains from eqns (215)-(217) this can be re-cast in the
following form
⎧ 2 ⎫K ⎛ 2
part 2 2u ⎡ 2 u part ⎞ part 2u 2 part 2 ⎤ part u ⎛ u ⎞
U = B intint ⎜ 3 3 ⎟ 1 minus ν ) 3 3 2 minus ⎜ 3 ⎟⎨ 2 + 2 minus 2( 2 ⎬dx1dx (242)⎢ ⎥2 ⎝ partx1 partx2 ⎠ partx1 partx2 ⎝ partx1partx2 ⎠ 2
⎩ ⎣ ⎦ ⎭
It can be shown ((Meleard 1998)) that the integral of the second term in the integrand above [the
one multiplied by 2(1-ν)] is globally constant under deformation if the membrane remains a
closed surface with no holes Assuming that to be the case we obtain for the total bending strain
energy
KB ⎛
2 part 2u part 2
= intint ⎜ 3 u2 + 3 ⎞
U ⎟2 dx1dx2 + const (243)
2 ⎝ partx1 partx2 ⎠
Since we typically are concerned with changes in energy the constant will arbitrarily be set to
zero Thus the energy per unit area or energy density of bending deformations can be written
2 K ⎛ part 2 part 2 ⎞
0 = B u⎜
3 uU h 2 + 3
2 ⎟ (244)2 ⎝ partx1 partx2 ⎠
Note that the term in parentheses is proportional to the mean curvature of the surface Often the
surface has a natural mean curvature in the unstressed state If that curvature is c0 the bending
energy expression is modified slightly to the form
22
CHAPTER 21 CELL MEMBRANE MECHANICS AND ADHESION copyRD Kamm 4615
2 K ⎛ part 2 part 2 ⎞
U0 = B u⎜
3 uh 2 + 3
2 minus c0⎟ (245)2 ⎝ partx1 partx2 ⎠
Another common form of this expression is obtained by recognizing that the first two terms in
parentheses represent the linearized form of the sum of the principal curvatures (the largest and
smallest curvatures at a point) denoted c1 and c2 so that eqn (345) can be written
K
U2 B
0h = (c1 + c2 minus c0 ) 2
Although each of these expressions for strain energy density has been derived individually they
of course all contribute in the general situation and are linearly additive In that regard several
points are worthy of note First one can obtain some idea of the relative importance of
extension shear and bending deformations in a given situation simply by comparing their
relative energies just as was done in the last section by comparison of the bending and tension
terms in eqn (226) Not surprisingly the comparison leads to the same expressions we obtained
before for when either bending or tension is dominant Second due to the small shear modulus
of most cell membranes the energy stored in shear deformation can generally be neglected And
finally a comment is warranted concerning the energy due to tension Various simplifying
assumptions can be made depending on the cell type being considered and the nature of the
stress to which the cell (or vesicle) is being subjected but generally the lipid bilayer can be
considered to be of constant area unless it experiences grossly non-physiologic levels of stress
Thus the main contribution to extensional energy is that represented by eqn (339) associated
with the smoothing of membrane undulations
Other Factors Influencing Membrane Motion
Thermal fluctuations Biological membranes of all types can be seen to fluctuate due to
Brownian motion of the surrounding molecules if viewed with sufficient resolution These
fluctuations are in fact often used to measure the membrane bending stiffness since thermal
effects are seen as motions in the membrane of relatively long wavelength favoring bending
energies as compared to extensional or shear (see eqn (223)) To account for these effects it is
customary to add a time-dependent forcing term to eqn (223) η(t) the magnitude of which
scales with kBT We analyze thermal motions later and use them as a means of determining the
bending stiffness of a membrane
23
CHAPTER 21 CELL MEMBRANE MECHANICS AND ADHESION copyRD Kamm 4615
Damping due to external fluids When a membrane fluctuates in a direction perpendicular to its
plane velocities are induced in the surrounding fluids and due to the resulting shear stresses
energy is dissipated These motions are extremely complex to model precisely and depend on
both the nature of the surrounding medium (its rheological properties) and the bounding
geometry In lieu of a complete and rigorous analysis a local damping term is sometimes added
to the membrane force balance equation (eqn (223)) to approximate these effects Its form is
based on the presumption that externally induced velocities scale with the velocity of the wall
and that shear forces in the external fluid scale with the induced shear rates and velocities
Accordingly eqn (223) is modified by the addition of a term of the form μm partu3 partt where μμ is
the effective viscosity of the external fluid The equation that results from the addition of both
thermal forcing and external fluid viscosity is
partu ⎛ part 43 u 4
3 part u part+ 3 part 4u ⎞ part ⎛ ⎞ part ⎛ ⎞
B ⎜ 3 partu u
μm K 4 + 2 2 2 + 4 ⎟ minus ⎜ N3
⎟ minus part 1 ⎜ N
3
partt ⎝ x partx partx partx ⎠ partx ⎝ partx ⎠ partx ⎝ 2 ⎟ = p + η(t) (246)1 1 2 2 1 1 2 partx2 ⎠
An expression of similar form for a linear polymer is sometimes referred to as the Rouse
equation
314 Measurements of Membrane Elastic Parameters
Although the analogy has limitations it is useful at the onset to think of the cell as a fluid-filled
balloon or bag Just as in the case of a balloon the elastic properties of the membrane can be
determined by any experiment in which the membrane tension changes while its area is
measured In the simple example of a spherical balloon tension can be computed from the
inflating pressure and the measured radius the latter also yielding the surface area Ignoring for
now the thermal-induced fluctuations in a real cell membrane (ie assuming the cell to be at zero
temperature) the calculations become particularly simple Furthermore we will consider cells
for which the cytoplasm can be considered to fluid-like having no elasticity We return to
address both issues shortly
Osmotic swelling
Perhaps the simplest method to inflate the cell and measure the membrane elastic properties is to
cause the cell to swell by changing the osmolarity of the external fluid and simultaneously
monitoring the change in cell volume The change in transmembrane pressure mirrors the
24
CHAPTER 21 CELL MEMBRANE MECHANICS AND ADHESION copyRD Kamm 4615
change in osmotic pressure brought about by successive additions of a solute to which the
membrane is impermeable For ions and small molecules the osmotic pressure π can be
calculated from the vant Hoff equation
π = RT sum Ci (247)
i
where Ci are the molar concentrations of all solutes to which the membrane is impermeable For
larger molecules such as proteins their contribution to osmotic pressure is much larger than
indicted by this equation
Consider for example a spherical cell expanded osmotically so that the internal
hydrostatic pressure relative to external pressure is pc Microscopic examination yields a value
for the cell radius Rc Using these values in combination with Laplaces law [eqn (227)] gives
us the tension in this state and eqn (24) provides its relationship to the extensional modulus
p R Δ A
N = c c = Ke (248) 2 A0
The observed change in radius allows calculation of ΔA In practice identification of the reference state at zero pc is problematic due to the presence of thermal fluctuations but if Ke can be assumed constant for relatively small changes in area it is possible to extrapolate back to the zero-stress state from two measurements at elevated pc [Example red blood cell] Micropipet aspiration
One of the first methods used to measure the extensional modulus of the cell membrane involved
drawing a cell slightly deflated into a micropipet simultaneously monitoring the dimensions of
the cell and the pressure in the micropipet (Daily Elson et al 1984) Since on the time scale of
the experiment the volume of the cell could be assumed constant the shape change due to
aspiration of the cell causes increases in both internal pressure and surface tension both of which
are assumed spatially uniform Once the tension is large enough (or the temperature low
enough) to dampen the amplitude of any thermal fluctuations the cell can be treated assuming
that membrane extension is the dominant means by which the pressure drop across the
membrane is balanced [For further discussion on the thermal fluctuations and the relationship
between micropipet pressure and intracellular pressure see Daily and Evans and Rawicz Phys
Rev 1990 See also figure on p 199 of Boal Example the two regimes in membrane stiffness]
For the situation shown in Figxx the cell is drawn into the micropipet to the point at
which the portion of the cell external to the cell is spherical of radius Rc With the assumptions
25
CHAPTER 21 CELL MEMBRANE MECHANICS AND ADHESION copyRD Kamm 4615
stated above the (uniform) pressure within the cell can be related to it surface tension (assumed
uniform) and the radii of curvature of the main body of the cell Rc and the portion inside the
pipet a using Laplaces law [eqn (227)]
pc = 2N Rc = minus Δp + 2N a (249)
where pressures are referenced to the external ambient pressure Reorganizing to solve for
surface tension we obtain
ΔpN = (250)
⎛ 1 1 ⎞ 2⎜ minus ⎟
⎝ a Rc ⎠
The surface area corresponding to a given N is obtained from geometry summing the membrane
surface areas of the cylinder and hemisphere inside the micropipet and the truncated spherical
surface outside yielding for the areal strain the approximate expression
[(a R )2 (a R )3
Δ c minus c cong
]ΔLA
A 2a
Fig xx Micropipet aspiration of a neutrophil
This relationship between N and ΔAA can be used to calculate the area expansion modulus
Eh AK 0
e = = N 2 1( minus ν ) ΔA
where the expression involving Youngrsquos modulus assumes the membrane to be isotropic and
homogeneous The relationship could however be non-linear in that the value of Ke may vary
with the degree of area expansion a linear relationship between N and ΔA yields a constant value for Ke
It is important to note that neither of these approaches osmotic inflation or micropipet aspiration provides us with any information on the bending modulus To be precise bending
26
CHAPTER 21 CELL MEMBRANE MECHANICS AND ADHESION copyRD Kamm 4615
does play a role in the micropipet experiments but the effects are so small as to be negligible and are typically ignored That is not to say that bending is always negligible however as discussed next
Monitoring thermal fluctuations in the membrane
When a cell or lipid vesicle is observed floating free unattached to a substrate it can be seen to
exhibit time-dependent undulations as a result of collisions with the surrounding molecules
undergoing thermal motion In the case of a lipid vesicle with diameter in the range of 10
microns these undulations can be readily observed microscopically In smaller cells such as red
blood cells the motions can be inferred from the flickering phenomenon associated with the light
interference as the cell thickness changes (Zeman Engelhard et al 1990) Since the amplitude of
the membrane undulations depends on the stiffness of the membrane to bending and its surface
tension it is reasonable to expect that measures of this amplitude can be used to infer the
membrane elastic parameters In order to illustrate the method while avoiding some of the
algebraic complexity consider undulations in a flat membrane with significant bending stiffness
and a constant surface tension The relationship between the motion and the elastic properties
can be found by considering the total energy of the membrane obtained by summing the
energies per unit area from eqns (239) and (244) and integrating over the membrane surface
area Am
⎧ 2⎪ K ⎛ 2 2
part 2 u part 2 ⎡ 3 u ⎞
3 N ⎛ partu ⎞ ⎛ int 3 partu ⎞ ⎤⎫
B 3 ⎪
U0hdA = int ⎨ ⎜ 2 + 2 ⎟ + ⎢⎜ ⎟ + ⎜ ⎟ ⎥⎬dA (251) A ⎠ 2
m Am ⎪ 2 ⎝ partx1 partx2 ⎢⎝ partx1 ⎠ ⎝ partx2 ⎠ ⎥⎪ ⎩ ⎣ ⎦⎭
In writing the energy in this form we have omitted the contribution due to shear deformation
consistent with the fluid-like character of a pure lipid bilayer and have taken the surface tension
to be uniform during the deformation In this example membrane surface area changes only as a
result of fluctuations from the mean [u3(xxx2) = 0] configuration that is we now ignore the
contribution due to changes in intermolecular spacing and only consider changes in the area
projected onto the x1-x2 plane
It is convenient to use the method of Fourier transforms to represent the undulations of a
membrane normal to the x1-x2 plane which in two-dimensions leads to [see also class notes on
bending of cytoskeletal filaments alternatively use Fourier series representation]
A A
u3 (x) = u3 (x1 x2 ) = 2 intexp(iq sdot x)b(q)dq =
2 int exp(iq 4 1x1)exp(iq2 x2 )b(q1q2 )dq1dq
π 4π 2
(252)
27
CHAPTER 21 CELL MEMBRANE MECHANICS AND ADHESION copyRD Kamm 4615
where qα = 2π λα is the wavenumber of the particular mode and b(q) is the continuous analogue of the discrete coefficients that multiply each mode in a Fourier series representation
Here the algebra gets complicated so only the results of the analysis will be presented however
those wishing to see a more complete derivation should see (Boal Mechanics of the Cell
Cambridge University Press 2002) Introducing eqn (352) into (351) yields
1 ⎛ A ⎞2
int U q 40hdA = ⎜ ⎟ int (
KB + Nq2 )b(q)b(q)dq (253)2 2 ⎝ π ⎠
where b(q) is the complex conjugate of b(q) Now we invoke a previous result that at equilibrium energy is equally distributed among the various modes and that each mode has an
average energy of kBT2 Taking the ensemble average of eqn (353) and equating the energy of
each mode represented in the result to kBT2 (by the equipartition theorem) leads to
k Aq)b q) = BT
b( (K q4 2 (254)
B + Nq
This is a useful result in itself demonstrating that all modes tend to be suppressed as temperature
falls or as bending stiffness or surface tension rise In addition it shows the tendency for higher
modes to be of smaller amplitude But this equation has further value in that it can be used to
obtain a direct expression for the change in apparent area of a membrane as tension increases
Consider the true surface area of a membrane A represented as the sum of its projected
area and the additional area associated with thermally-induced undulations
⎡ 1 ⎛ 2⎤u ⎞ 2 part ⎛ partu ⎞
A = int dx + ⎢ 3 3 2
int ⎜ ⎢⎝ partx 2 ⎟ + ⎜
⎠ ⎝ partx 2 ⎟ ⎥dx (255)⎠ ⎥
⎣ 1 2 ⎦
Isolating the term representing the area reduction due to thermal fluctuations expressing u3 in
terms of its Fourier transform and taking the ensemble average of the result leads to
1 ⎛ A ⎞2
A minus int dx = ⎜ ⎟ int q 2 b(q)b(q) dq (256)2 ⎝ 2π ⎠
Combing eqn (254) from above with this expression yields
28
CHAPTER 21 CELL MEMBRANE MECHANICS AND ADHESION copyRD Kamm 4615
A minus int dx
kBT dq kBT dq2
= A 8π 2 int =
N int (257)
+ KBq 2 8π 2 N + KBq 2
where in writing the last term we have introduced the relations dq = dq2dθ 2 and int dθ = 2π By a simple substitution z = q2 + (N KB )the integral can be evaluated We do so however
between specified limits on the assumptions that the range of possible wavenumbers is restricted
by the size of the membrane on one hand (q = (πA12)) and the distance between individual lipid molecules on the other (q = πlm) Integrating between these limits results in
⎛ π 2 N ⎞
int dx 2 +A ⎜ ⎟ minus k T l K
= B ln⎜ m B ⎟ (258)A 8πKB ⎜ π 2 N ⎟
⎜ + ⎟ ⎝ A KB ⎠
If we use the area reduction at zero tension as a reference and increase the area from that
condition by progressively increasing membrane tension as in a typical experiment we finally
obtain an expression relating the change in area to the change in tension
⎛ NA ⎞ 1 + A dx A dx ΔA minus int minus ⎟ k ⎛ NA
int k ⎜equiv minus = BT π 2 K
ln ⎜ B T ⎞ 2 ⎟ cong B ln 1 + (259)
Nl ⎜ ⎟A A A 8π KB ⎜ 1 + m ⎟ 8π KB ⎝ π 2 KB ⎠ N = 0 N ⎜ 2 ⎟⎝ π K ⎠ B
where we have used the assumption supported by typical values found from different
experiments that (Nl2 m ) (π 2KB ) ltlt 1
You should recall that this solution was obtained on the assumption that the actual area
of the membrane remained constant and that the reduction in projected or apparent area resulted
from the undulations being progressively smoothed out Once the undulations are eliminated
the only means by which the projected area of the membrane can further increase is by an
increase in the inter-molecular spacing ndash an increase in the actual membrane area When this
occurs we expect to see a transition to the behavior discussed at the beginning of this chapter a
result expressed as
29
CHAPTER 21 CELL MEMBRANE MECHANICS AND ADHESION copyRD Kamm 4615
Fig yy Plots of tension vs normalized surface area for lipid vesicles of different composition Evans amp Rawicz 1990
ΔA N = (260)
A Ke
Thus we have two limiting predictions one for low tensions eqn (259) and another for high
tensions eqn (260) and the transition from one behavior to the other should occur when the
two expressions for ΔAA are of the same magnitude This is supported by experiment (Fig yy) and the results in the two regimes provide a means for estimating the two moduli Ke and KB
30
CHAPTER 21 CELL MEMBRANE MECHANICS AND ADHESION copyRD Kamm 4615
Before leaving this analysis there is one further result that is useful to state although the
derivation is again somewhat involved Once we have the solution for the undulations at a
given level of tension and for given membrane properties the ensemble average displacement
normal to the plane of the membrane can also be computed with the result
⎞
u2 k ⎛= BT NA
3 ln ⎜ 1+ ⎟ (261)4πN ⎝ π 2KB ⎠
Again this supports our intuition that the undulations will be suppressed at low temperature or
high tension And in the limit as N rarr 0 a binomial expansion of the natural log term shows that
the effect of tension drops out and the magnitude of the undulations varies inversely with the
bending stiffness
315 Membrane Fluid Mechanics
Early studies of protein diffusion notably the work of Saffman (Saffman 1976)
examined protein diffusion using an approach akin to that of Einstein in three dimensional space
thereby reducing the problem to one of solving for the mobility b in the equation for diffusivity
D = kBTb (262)
Calculation of the mobility is influenced by the viscous drag on the portion of the protein within
the membrane but also on to the intra- and extracellular domains as well The solution of
interest here is the one applicable in the limit of small μeμm where μe and μm are the external and
membrane viscosities respectively leading to
kBT ⎛ hμm⎞
D = ⎜minusγ + ln ⎟ (263)4πμmh ⎝ aμ e ⎠
where h is the membrane thickness a the radius of the protein (assumed cylindrical) and γ is
Eulers constant (=05772) Membrane viscosity has been estimated from lipid diffusion to be
~2 poise (McCloskey and Poo 1984) When finite mobility is achieved as a result of a finite
domain as for example a circle of radius R the corresponding result is
31
CHAPTER 21 CELL MEMBRANE MECHANICS AND ADHESION copyRD Kamm 4615
k ⎛ 1 D = BT R ⎞ log minus (264)
4πμh ⎝ a 2 ⎠
While this represents a useful point of departure measurements of lateral diffusion in a
membrane have demonstrated a more complex behavior Fluorescence recovery after
photobleaching (FRAP) has enabled the direct tracking of membrane proteins labeled with
fluorescent antibodies More recently single particle tracking methods have been developed
using colloidal gold or a fluorescent particle in conjunction with digital microscopy as well as
controlled movements using microbeads manipulated by an optical trap
From experiments such as these a new picture has emerged While the lateral diffusion
of lipids and a small fraction of trans-membrane proteins satisfy the general form of Saffmans
predictions the predicted diffusivity is greater than that observed experimentally and agrees with
experiments only when a membrane viscosity of 100 poise is used This might be due to the
presence of other proteins in the membrane (Kucik Elson et al 1999) Experiments also show
that many proteins appear to diffuse freely only in small domains typically measuring from 200shy
600 nm remaining confined to these domains for periods on the order of tens of seconds To
explain this behavior the membrane skeleton fence model was proposed (Kusumi Sako et al
1993) in which a membrane-associated matrix constrains the movement of proteins outside of
the domains defined by the matrix filaments Diffusion beyond these barrier filaments can occur
either as a result of random thermal motions of the transmembrane protein matrix filaments or
both or by transient breaks in the filaments Confinement of proteins may play an important role
in rapid and selective signaling Rapid directed motion of membrane-associated proteins has
also been observed and is likely due to active transport by an intracellular actin- or microtubule-
based motor
316 Cell Adhesion
This section deals with how cells adhere to their surroundings and through these sites of
adhesion how they interact with the external world We begin by summarizing the different
types of adhesion their functions and the molecules involved Next we provide a brief
description of the adhesion complexes found in cells and the role of each type Then the
theories that provide a quantitative description of adhesion between single receptor-ligand pairs
are reviewed in the context of the material presented in Chapter xx including the role of thermal
fluctuations Through these theoretical models both the static and dynamic states of adhesion
can be explored for single molecule pairs then for adherent cells Next we develop the different
32
CHAPTER 21 CELL MEMBRANE MECHANICS AND ADHESION copyRD Kamm 4615
approaches that are used to study the adhesion of cells based either on thermodynamics or
mechanics Methods for the measurement of adhesion strength are described providing
estimates for the force that a cell can exert on its surroundings Various examples will be
presented but the adherence of leukocytes to the endothelium and the role of adhesion in cell
migration will receive special attention
Functions of adhesion
Adhesion has been found to be an essential process necessary for a variety of fundamental
cellular functions
bull Structural integrity Adhesion helps to maintain the overall structural integrity of the
tissue in muscle for example it provides the means of force transmission from the cells
to the surrounding matrix to allow contraction In non-contractile cells it still provides
the needed mechanical coupling to the surrounding tissue necessary for a variety of
cellular functions
bull External sensing Adhesion provides a means by which the cell can sense and
subsequently respond to its surroundings Forces transmitted directly to the cell
membrane or to the cytoskeleton via transmembrane proteins may trigger a variety of
biochemical reactions within the cell as we shall see later in Chapter 33
bull Migration Cell-matrix adhesion is an essential element in cell migration a cell propels
its way through tissue or along a surface through a process involving adhesion
contraction and release also described in Chapter 33
bull Regulation of transport Sites of cell-cell adhesion are often important in the regulation
of transport across a cell layer such as in the case of an epithelium or endothelium
bull Communication Sites of mechanical coupling often provide a means of cell-cell
communication as in the case of gap junctions which offer a pathway for the diffusion
of ions and small molecules between adjacent cells
Adhesion molecules
Cells adhere to their surroundings or to an artificial substrate via a wide variety of different
proteins that can be classified into five major families integrins selectins cadherins
immunoglobulins and transmembrane proteoglycans (Table 1) In terms of their mechanism of
attachment to other cells or the external matrix these can be classified as either homophillic ndash
binding to like molecules heterophillic ndash binding to unlike molecules or those that bind to other
cells through an extracellular linker molecule
Integrins one of the largest class of adhesion molecules are primarily used to attach cells
to the extracellular matrix or the basal lamina but are also present in some cell-cell adhesion
33
CHAPTER 21 CELL MEMBRANE MECHANICS AND ADHESION copyRD Kamm 4615
complexes They typically bind to the matrix via the RGD amino acid sequence (arginine
glycine aspartic acid) but can also contain other binding motifs Integrins are heterodimers in
that they always contain an α and a β subunit with the different isoforms determining the specific ligand to which the integrin binds Two specific types of adhesion focal adhesions and hemidesmosomes often contain integrins and the attachments they make can at times be stable but at other times transient so as for example to mediate cell migration The force of adhesion of a single integrin-ligand bond has been measured using atomic force microscopy and found to be in the range of 30-100 pN (Lehenkari and Horton 1999) with a relatively low binding affinity in the range of K ~ 10-6
D to 10-8 molliter By comparison typical cell-surface receptors bind with an affinity in the range of 10-9 to 10-11 molliter Integrins also play an important role in signaling since extracellular integrin binding is known to influence cytoskeletal morphology as well as the state of cell differentiation Adhesion molecules in the selectin family also tend to form transient bonds and are important in leukocyte adhesion and extravasation the migration of the leukocyte through the endothelium and into the tissue Consequently they tend to be found in cells of the circulation and are present both in leukocytes and endothelial cells and are instrumental in adhesion between these two cell-types during leukocyte rolling
Family Location andor Ligands Comments
function recognized
integrins focal adhesions (E) fibronectin relatively low
hemi-desmosomes collagen laminin affinities
leukocyte immunoglobulins (KD~ 10-6-10-8
(spreading) (I) actin filaments molliter)
adhesion primarily
cell-matrix adhesion
but also in some
cell-cell adhesions
selectins circulating cells and carbohydrates require Ca2+
endothelial cells
rolling adhesion
Ig superfamily important in integrins
(immunoglobulin) immune response homophillic
cadherens adherens junctions (E) homophillic require Ca2+
desmosomes (I) actin
34
CHAPTER 21 CELL MEMBRANE MECHANICS AND ADHESION copyRD Kamm 4615
filaments
intermediate
filaments
transmembrane fibroblasts (E) collagen bind various
proteoglycans epithelial cells fibronectin growth factors
(I) actin such as FGF
filaments
heterophillic
Table 1 Cell adhesion molecules and their characteristics
While both integrin and selectin binding is mediated by Ca2+ adhesion via the
immunoglobulin (Ig) superfamily of proteins is Ca2+ independent Some of the most prominent members of this family are the N-CAMs (Neural cell adhesion molecules) and ICAMs (Intracellular cell adhesion molecules) These tend to undergo homophillic bonding but some also bind to members of the integrin family
Cadherens are often expressed in the same cells as the selectins but form much stronger bonds and therefore play an important role in maintaining cell integrity Because of these attributes cadherens are the primary adhesion proteins in desmosomes and adherens junctions the major structural contacts cells form with other cells or the basil lamina These also form homophillic bonds by a Ca2+ dependent mechanism and mediate selective bonding between adjacent cells Cadherens are relatively short as compared to other adhesion molecules being
about 700-750 amino acid residues in length
Types of adhesion complexes
Cells have developed a variety of specialized adhesion complexes each utilizing one or more of
the adhesion molecules of Table 1 and each serving a specific purpose Typically the cell-cell or
cell-surface spacing is in the range of 10-20 nm but this is highly variable ranging from less than
1 nm when controlling transport to over 100 nm in regions where tight control is unnecessary
Below we describe the different types of junctions and where important for function their
mechanical characteristics
Gap junctions Cells need to communicate with their neighbors for a variety of reasons For
example cardiac myocytes transmit signals from cell to cell in order to maintain a synchronous
35
CHAPTER 21 CELL MEMBRANE MECHANICS AND ADHESION copyRD Kamm 4615
wave of contraction This is typically accomplished by providing a pathway for ions and small
signaling molecules between cells called gap junctions (Fig 3110) These minute channels are
typically comprised of a collection of six connexin proteins that cluster together in cylindrical
fashion forming a minute channel that passes molecules and ions less than about 1200 to 2000
MW (15-2 nm) Transport through these channels is regulated and their permeability drops in
the presence of high Ca2+ concentration as when a cell membrane is ruptured or with low pH
Cyclic AMP acting as a second messenger can be exchanged between cells therefore gap
junctions provide a metabolic linkage between neighboring cells and provide a means by which
hormonal stimulation of just one cell can be transmitted to others
Adherens junctions Adherens junctions are belt-like structures that can be though of as the
structural weld that holds two cells together (Fig 3110) Because of their structural role
these junctions formed by homophilic bonding between proteins in the cadheren family are
anchored securely again via the adaptor proteins α β γ-catenin to the cytoskeleton
Desmosomes and Hemidesmosomes If the adherens junctions are the continuous welds between
cells desmosomes are the spot welds Again these serve primarily a structural purpose
joining two neighboring cells via a complex consisting of a dense plaque on the intracellular
sides of both cells extending 15-20 nm into the cell and consisting of a variety of proteins that
attach to keratin filaments part of the intermediate filament network Hemidesmosomes have
similar intracellular structure but attach instead to the basal laminae Based on their different
extracellular attachment sites desmosomes typically link to other cells via cadherens whereas
hemidesmosomes adhere via a type of integrin Both are commonly found in epithelial cells
36
CHAPTER 21 CELL MEMBRANE MECHANICS AND ADHESION copyRD Kamm 4615
Fig 3110 Schematic showing the different types of cell junctions present in an epithelial cell as found in the small intestine Tight junctions near the apical surface essentially prevent the passage of all molecules The spot desmosomes and adherens junctions provide for cell-cell anchoring and the hemidesmosomes for anchoring to the basal lamina Gap junctions provide a means for communication between neighboring cells [Reproduced from Lodish et al Molecular Cell Biology 2000]
Junction type Function Extracellular or Intracellular
adjacent cell attachment
attachment
Adherens structural cell-cell or cell- ECM proteins or actin filaments
matrix cadherins in
adjacent cell
Desmosome structural cell-cell cadherin intermediate
filaments
Hemidesmosome structural cell-matrix basal lamina via intermediate
integrins filaments
Focal adhesions structural cell-matrix ECM proteins actin filaments
via integrins
Tight junction regulate transport between homophillic binding between the
cells and along cell transmembrane proteins occludin or
37
CHAPTER 21 CELL MEMBRANE MECHANICS AND ADHESION copyRD Kamm 4615
membrane claudins
Gap junctions cell-cell communication channels formed by connexin
via ion and small molecule subunits
exchange
Table 2 Adhesion complexes
Focal adhesions A second means by which cells attach to the extracellular matrix is through
focal adhesions These serve a similar function to the hemidesmosomes and share a common
linkage via integrins to the ECM but are attached on the intracellular side instead to the actin
filaments of the cytoskeleton Actin filaments converge at the site of focal adhesions forming
stress fibers strong actin bundles that attach to the β-subunit of the integrins via adapter
proteins such as actinin vinculin and talin Focal adhesions are instrumental in cell migration
and for this purpose need to be easily formed and disrupted as the cell moves forward Release
or de-adhesion of cells is often mediated by a class of peptides called dis-integrins that
competitively bind to the RGD site used by integrins to attach to a variety of matrix molecules
Tight junctions Control of transport is generally mediated by tight junctions that form an
intricate network of seams between two cells (Fig 3111) As their name implies these are the
tightest of the cell-cell junctions and the gaps they leave are often small enough to exclude even
the smallest ions and molecules Formed by homophillic binding between the transmembrane
proteins occluding and claudins tight junctions allow epithelial cells to perform their critical role
in transepithelial transport and provide for maintenance of differences in concentration between
the apical and basal surfaces of these cells Since occludins are not capable of forming rigid
structural bonds with the cytoskeleton they are most often associated in a junctional complex
with adherens junctions or desmosomes that fulfill the structural needs of attachment
38
CHAPTER 21 CELL MEMBRANE MECHANICS AND ADHESION copyRD Kamm 4615
Fig 3111 Tight junctions in an epithelial cell shown schematically (a) in a freeze fracture replica (b) and in a transmission electron micrograph (c) [Reproduced from Alberts et al 1994]
Fig 3112 Two types of bond that attach a cell to the extracellular matrix by means of clusters of integrins On the extracellular side integrins bind to the matrix proteins fibronectin and laminin Inside the cell they attach to the cytoskeleton via adaptor proteins to either actin filaments (focal adhesions) or intermediate filaments (hemidesmosomes) [Reproduced from Lodish et al Molecular Cell Biolology 2000]
Non-specific binding
Cells can adhere to their surroundings by either non-specific or receptor-ligand (specific)
bonding Though both mechanisms are likely active in most situations as we will see receptorshy
39
CHAPTER 21 CELL MEMBRANE MECHANICS AND ADHESION copyRD Kamm 4615
ligand bonding is the stronger of the two by a considerable margin and is therefore the most
relevant biologically In situations for which either the receptors or their ligands are not present
however such as might be the case in certain in vitro experiments non-specific binding can be
important as well
There are essentially three major forms of non-specific attractions to consider
bull Van der Waals ndash These attractive forces arise due to charge interactions in polar
molecules They tend to dominate among the non-specific mechanisms at
intermediate distances around 20-25 nm [see Boal]
bull Electrostatic ndash These interactions can be either attractive or repulsive depending
on the sign of the surface charges and are particularly important during the
approach of two cells since the glycocalyx has a high negative charge density
bull Steric ndash These forces arise due to the steric exclusion of two molecules as they are
brought into close contact In the case of cell-cell interactions steric repulsion is
due to the compression of the two glycocalyx layers and the tendency to resist
compression resulting from osmotic effects and the elasticity of the layer Steric
forces tend to dominate for small separation distances lt 10 nm
In combination these effects combine to produce a net attractive force per unit area of
about 100 Pa at a separation distance of about 25 nm
Adhesion by means of receptor-ligand binding
We can use the analysis of Chapter xx to estimate the strength of a receptor-ligand bond and
based on typical values for bond density calculate the corresponding strength of adhesion
between two cells or between a cell and a surface Recall that the application of force to a
receptor-ligand bond modifies the dissociation rate constant for the binding reaction This effect
can be modeled in several ways but the result obtained by Bell ((Bell 1978)) suggests the
following exponential form for the dissociation rate
0 ⎛ γf ⎞ 0 ⎛ γσ ⎞ kminus = kminus exp⎜ ⎟ = kminus exp⎜ ⎟ (265)
⎝ kBT ⎠ ⎝ NC kBT ⎠
where k0minus is the unforced dissociation rate constant γ is a factor with the units of length that
corresponds roughly with the distance separating the bonded pair at equilibrium NC is the concentration of bonded complex and σ is the average bond force per unit area To determine
40
CHAPTER 21 CELL MEMBRANE MECHANICS AND ADHESION copyRD Kamm 4615
the rate of change of the concentration of bonded pairs one must solve the following rate equation describing the competition between bond formation (first term) and destruction (second term)
dNC ⎛ γσ ⎞
cong k+ (NR minus NC )(NL ) minus kminus NC = k+ (N minus )( 0R NC NL ) minus kminus NC exp⎜ ⎟ (266)
dt ⎝ NC kBT ⎠
where NR and NL are the concentrations of receptors and ligands respectively and we have
assumed that NCltltNL and that all bonds are stressed equally At equilibrium dNCdt=0 and if
the force applied to detach the cell (equal to the average bond stress σ) is increased
incrementally from zero NC will progressively fall to a new equilibrium value At sufficiently
high levels of force however increasing σ further eventually gives rise to a situation in which equilibrium can no longer be achieved through a reduction in NC At that point NC tends toward zero and the cell separates from the surface to which it was attached It can be shown that this
occurs when (Bell 1978)
k 0
α c exp(α + c + 1) = N
k 0 L (267)minus
σ
where α minγ c equiv and σmin is the minimum stress needed to cause detachment For a wide
NRkBT
range of conditions eqn (267) has the approximate solution
⎛ k0 + ⎞
α c cong 07 ln L (268)⎜ 0 N ⎟⎝ kminus ⎠
so that the critical stress for detachment can be expressed as
N 0
σ cong 07 C kBT ⎛ k ⎞ ln⎜
+ min N ⎟ (269)
γ ⎝ k0 L minus ⎠
where NC is determined from setting eqn (266) to zero under these critical conditions
Thermodynamic approach to cell adhesion
Although we focus here on the mechanical aspects of cell adhesion this process can also be
viewed from a thermodynamic perspective In this approach adhesion is considered in terms of
the change in energy specifically the Gibbs free energy G associated with all the individual
receptor-ligand interactions as well as the various non-specific forces of attraction or repulsion
The adhesion of a cell to a given surface then can be viewed as an equilibrium state determined
41
CHAPTER 21 CELL MEMBRANE MECHANICS AND ADHESION copyRD Kamm 4615
by minimization of the free energy If in undergoing a transition from a free state to an adherent
state the system represented by the cell and surface experiences a reduction in free energy ie
ΔGlt0 then adhesion will occur and the equilibrium state of adhesion will be determined by that with the minimum in free energy or the largest value of -ΔG While this approach ignores
many of the subtleties of the interactions and like the analysis above assumes that all receptorshy
ligand interactions are identical from an energetic point of view it is useful in providing some
simple insights as seen in the next two examples
Example Comparison of specific and non-specific adhesive forces Non-specific bonding due
to the combined effects of van der Waals electrostatic and steric forces result in an attractive
stress of approximately 100 Pa Receptor-ligand bonding give rise to forces that can be
estimated from the change in free energy f ~ to 4x10⁻⁴ dynbond = 9x10-11 to 4x10⁻⁹ ΔGr~9x10⁻⁶ Nbond where f is the force required to break the bond and r is a measure of the distance the bond stretches before it breaks Using a typical density of the receptor-ligand complex NC of ~1012-1015 bondsm2 gives a total bond stress of N 1
C x f ~ 9 x 10 to 4x10⁶ Pa The above kinetic approach to estimating bond strength [eqn (269)] gives a value approximately half of that from this equilibrium approach In either case however the conclusion remains the same non-specific binding can under certain circumstances be important since it is comparable to the lowest estimates of receptor-ligand-mediated bond strength but not surprisingly the latter is quite likely to dominate in nearly all practical situations
Example JKR theory for the equilibrium area of adhesion between a cell and substrate
It is well known that cells tend to take on a more flattened shape as the substrate to which they
are attached becomes more strongly adhesive either by coating with a more attractive ligand or
by increasing the concentration of ligand bound to the substrate Conversely less adhesive cells
round up and become more spherical These observations can be explained with the help of a
simple scaling analysis on the assumptions of small deformation of a linear elastic cell
Let the cell be modeled as a homogeneous elastic sphere with elastic modulus E and
initial radius R (Fig 3113) It is then brought into contact with a surface to which it adheres
As the cell adheres it attains a lower energy state characterized by an adhesion energy per unit
area J Formation of a flat adhesion surface however requires deformation within the elastic
cell and an associated increase in the stored elastic energy In Chapter 31 we showed that the
stored elastic energy per unit volume can be written
UE asymp int τεdV asymp int 1 2 Eε 2dV (270)
Vc Vc
42
CHAPTER 21 CELL MEMBRANE MECHANICS AND ADHESION copyRD Kamm 4615
Strain inside the cell can be approximated as the displacement of the cell surface δ divided by the characteristic distance within the cell to which the deformations penetrate a distance that scales with the lateral extent of the contact region 2a so that ε prop δ a where it can easily be shown from the geometry that a 2 asymp 2δR so that ε prop δ R Combining and dropping all numerical constants we obtain the following scaling approximation
δUE prop E ( )δR
3 2 (271)R
An expression for the total energy of the system then can be written
U prop minusJa2 + Eε2a3 prop JδR + Eδ 5 2R1 2 (272) The equilibrium state corresponds to the value of δ having the minimum energy obtain from
partU prop minusJR + Eδ 3 2R1 2 (273)
partδ so that
23 1 3 ⎛ JR12 ⎞ ⎛ JR2 ⎞
δ prop ⎜ ⎟ and a prop ⎜ ⎟ (274)⎝ E ⎠ ⎝ E ⎠
The exact solution to this problem yields the result
⎡ ) 1 3 2 1( minusν 2 ⎤ 9πJR
a = ⎢ ⎥ (275)⎢ 2E ⎥⎣ ⎦
43
CHAPTER 21 CELL MEMBRANE MECHANICS AND ADHESION copyRD Kamm 4615
Elastic modulus E adhesion energy per unit area J
2a
Fig 3113 Experiments to determine the contact area of an iminobiotin functionalized agarosebead on a glass coverslip in water Top Schematic of adherent bead Bottom Results for a range of bead radii Solid line is a fit to the date which obeys the power law a prop R23 consistent with the prediction of JKR theory eqn(276) [Reproduced from (Moy Jiao et al 1999)] This can be compared to the result obtained from a more rigorous analysis
⎡9πJR 2(1minus ν 2 ) 13 ⎤
a = ⎢ ⎥ (276)2E⎢ ⎣ ⎥⎦
and to experimental data obtained from spherical beads made from a 4 agarose gel (Fig 3113)
Models for receptor-mediated adhesion
In Chapter x and in the preceding text we discussed the energetics of bond formation and release
as well as the effect of applied force in altering the energy landscape of the bonded pair and
thereby the rate constants for bond kinetics That analysis has obvious implications to the
44
CHAPTER 21 CELL MEMBRANE MECHANICS AND ADHESION copyRD Kamm 4615
adhesion of cells to substrates the surrounding extracellular matrix and other cells Here we
extend that analysis in the specific case of whole cell adhesion In doing so it will be important
to consider such factors as the distribution type and density of receptor-ligand bonds or
potential bonds and the elastic properties of the structures to which they are anchored On the
intracellular side this involves the series of couplings that link the receptor to the cell In the
simplest case this might simply be a link to the lipid bilayer if the receptor has no intracellular
connections More typically especially for couplings with a structural role it involves a series
of proteins ultimately linking the receptor to the cytoskeleton
The typical setting in vivo is one in which cells adhere to other cells or to the extracellular
matrix Adhesions are more easily probed however through in vitro experiments (described
below) where cell adhesion more often occurs to an artificial substrate mediated through one of
several extracellular proteins that are used to coat the surface Generally either collagen or
fibronectin is used Cells are often adhered to these substrates but to produce a more controlled
environment rigid beads are sometimes coated with the appropriate receptors so that one specific
receptor-ligand interaction can be probed While these systems are useful as models of certain
adhesion phenomena it is important to recognize in the interpretation of these experiments that
when bound to a rigid substrate or bead the binding proteins cannot freely diffuse as they would
in a more natural environment In particular the formation of focal adhesions would not occur in
bead-substrate experiments because the receptors would be constrained from aggregating
It is instructive to begin this discussion with a consideration of a single adhesion bond
for example one linking the actin matrix of the cytoskeleton to a β1 integrin and the integrin
receptor binding to the extracellular matrix beyond the cell membrane (Fig 3114) If the bond
is stressed as for example if the cell experiences a force relative to the ECM it will at first
stretch an amount dictated by the level of force in the bond and the stiffness of the complex
Each bond as well as each protein in the bond complex can be thought of as having a certain
stiffness giving rise to a picture in which several springs are considered connected in series
Forces acting on the adhesion complex are transmitted via this series of bonded proteins between
the CSK and the ECM producing local deformations and stresses in the corresponding matrices
that decay with distance from the adhesion site On the intracellular side these forces are
transmitted via a complex involving vinculin α-actinin paxillin and talin Attachment to the
extracellular matrix is mediated by an RGD sequence (in fibronectin for example) which in turn
has binding sites for collagen and fibrin If the force is sufficiently strong above a certain
threshold value F0 say and applied for a sufficiently long time the bond might be severed (deshy
couple) Typical values of this threshold force lie in the range of 10-100 pN (Evans and Ritchie
1997) but depend as well on the rate at which the force is increased Under more rapid
forcings the threshold is high compared to when the force is increased slowly This simply
45
CHAPTER 21 CELL MEMBRANE MECHANICS AND ADHESION copyRD Kamm 4615
reflects the fact that detachment is a stochastic process and that at any given level of force there
exists a finite probability of detachment and this probability increases with time
Fig 3114 One type of attachment linking the intracellular actin matrix to the extracellular matrix via an integrin complex that involves in addition vinculin α-actinin paxillin and talin (Reproduced from Lodish et al Molecular Cell Biolology 2000)
We need also to consider that in equilibrium a fraction Φ = K(1+K)-1 (where K is the
equilibrium constant) of the receptors will be bound at any given time and that the receptorshy
ligand complexes are continually cycling between the bound and unbound states characterized
by their respective rate constants
On a larger scale numerous adhesion sites typically act in parallel each contributing
some amount to the total adhesion force If the force transmitted by each single adhesion
complex is F and the density of adhesion sites (per unit membrane area) is NC then the stress
acting on the cell is the product F NC This gives a somewhat false impression however as it is
unlikely that each adhesion complex carries an equal force Put another way there exists a local
stress τ that can be thought of as the product of the average force per bond times the bond
density This stress is typically non-uniform In the adhesion of a cell to a flat substrate the
bonds near the periphery of the contact zone determine the strength of the cell against
detachment and when the cell is subjected to a detaching force the stresses are concentrated in
46
CHAPTER 21 CELL MEMBRANE MECHANICS AND ADHESION copyRD Kamm 4615
this peripheral region as depicted in Fig 3115 In the vicinity of the edge of adhesion several
factors will influence the stress distribution including the mechanical properties of the membrane
(in particular the bending stiffness KB) the receptor density the spring constants of the bond
and the bond strength
N
Region of adhesion
x1
Fig 3115 Schematic model of a cell membrane being detached from a substrate by application of a tension force N The membrane is free to the left of the dash-dot line and adherent to the right Forces and moments are transmitted through the membrane which adheres to the membrane through receptor-ligand bonds represented by a continuous distrubution p(x1)
To illustrate consider the following simple model for an adherent cell being peeled away
from its substrate by a force that generates a tension N in the membrane (Fig 3115)
Deformations in the membrane are described by eqn (223) where it can be shown that the
bending term dominates provided KbL2 gtN where L is the characteristic length in the x1 direction
(due to the small length scales involved) and the external membrane force (p in the membrane
equation) is now the non-uniform stress due to adhesion bonds As a simple first approximation
we take p = k(δminusδ0) with δ-δ0 being the amount of stretch in the receptor-ligand bond springs
and k an effective bond spring constant Recognizing that p approaches zero far from the edge
(see Fig 319) the membrane displacement and the spring displacement are related u3 = δ-δ0
Thus eqn (228) is written
⎛ part 4 u
KB⎜ 3
⎞ 4 ⎟ = NC F = NC ku
⎝ partx ⎠ 3 (277)1
This can be solved directly showing that the distance of separation between the cell membrane
and substrate grows in an exponential fashion with distance Even more simply a scaling
47
CHAPTER 21 CELL MEMBRANE MECHANICS AND ADHESION copyRD Kamm 4615
analysis of eqn (277) in which the term on the left is approximated by Kbu3w4 where w is the
characteristic distance over which u3 varies tells us that the stresses are concentrated in a region
of width
K
w prop B4 (278)
NC k
near the cell periphery Similarly we can estimate that the cell membrane will detach from the
substrate if N gt FoNCw where F0 is a measure of the force in a single bond at the time of bond
rupture and that the rate of peeling can be roughly approximated as the product of the
disassociation rate k -- (bondss) from eqn (265) and the distance between bonds (N -12C )
Although this provides some insight into how the peeling rate depends on the various factors it fails to capture the fact that the cell remains in an equilibrium attached state even for non-zero levels of tension reflecting that even under force a balance can exist between the rates of formation and rupture of receptor-ligand complexes (Ra Picart et al 1999)
It is also of interest to note that in the region near the edge of the attachment zone(x1=0
in Fig 3115) the membrane acts as a beam subjected to a moment due to the applied tension
This moment is balanced by a force couple due to tension in the adhesion complexes right
adjacent to the edge in combination with a compressive stress between the cell and substrate a
little further in In typical situations this compressive stress can approach levels as high as one
atmosphere and can act to effectively smooth the membrane and recruit new attachment sights While using these continuum descriptions it is important to keep in mind the true
discrete nature of the individual bonds represented in the model as a continuous adhesive
surface This is brought to light by a simple calculation in which the characteristic length over
which the applied tension is supported w is compared to the inter-receptor spacing N -12C
Using typical values for the parameters NC = 103 complexesμm-2 k = 10-5 to 10-6 Nm Kb = 1 to 2x10-18 Nm we find that w cong 01 to 03 μm and the inter-complex spacing N minus1 2
C cong 003 μm While it is reassuring to see that w is typically less than the inter-complex spacing the difference is small It is therefore not surprising that the actual process of cell peeling is stochastic in nature occurring in a sequence of more-or-less discrete steps with a velocity of peeling that varies widely from the mean
The interplay between receptor-ligand bonding and membrane stiffness also determines whether a cell will spread over a surface or peel away from it under a given tension Membrane bending stiffness acts to maintain the membrane and substrate within close proximity near the edge of contact (Fig 3115) Spreading can occur only if their separation distance is within the extended length of the receptor ligand bond over a distance comparable to the linear spacing
48
CHAPTER 21 CELL MEMBRANE MECHANICS AND ADHESION copyRD Kamm 4615
between neighboring bonds ( N minus1 2 C ) Under high tension the surfaces rapidly diverge and
spreading is prevented if the tension is sufficiently low receptor-ligand bonding can occur and spreading can occur
Measurements of adhesion
A variety of methods have been used to experimentally determine the strength of adhesion either
of individual receptor-ligand bonds or populations of bonds as in the case of entire cells
Whole cell experiments are more common and typically require less experimental
sophistication The drawback of course is that they provide only for estimates of average
properties and require certain assumptions regarding the distribution of cell-substrate adhesive
stress for interpretation to the level of a single bond Several of these methods are described
next
Centrifugal cell adhesion assays In this experiment cells are allowed to attached to a substrate
then are placed in a centrifuge rotating at speed ω positioned a distance r from the center of
rotation and oriented so that the net centrifugal force is acting to separate the cell from the
substrate Using the arrangement shown in Fig 3116 (right) the acceleration of the cells is 2ω r and the net force acting on a cell of volume Vc is F = (ρc minus ρf )ω 2rVc where the fluid and cell densities are ρf and ρc respectively
Interpreting these results we can make several different assumptions each leading to a different estimate for the maximum force experienced by the binding complex If we simply assume that all receptor-ligand complexes support an equal fraction of the total force F then the force per bond is f = F (πa 2NC ) where NC is the concentration of bond complexes However as the cell tears away from the substrate the edge bonds will break first since these experience the greatest level of force An alternative approach then is to assume that the adhesion complexes around the cell circumference support the entire load leading to the estimate f = F 2( πaN 1 2 ) recognizing that N1 2
C C is the average distance between bonds A somewhatmore accurate value for f might be obtained if we assume that all complexes within the distance w given by eqn (278) support the load In any of these cases once the centrifugal force exceeds some critical limit since the number of receptors supporting the load falls as the region of contact becomes smaller the force per bond increases and the cell will rapidly detach
Stochastic variability also needs to be taken into account however since even under a constant load any single bond has a finite probability of failure under a given level of force The equilibrium state of the cell then should be viewed as one in which the rate of bond formation equals the rate of bond breakage with increasing force having the effect of reducing the
49
CHAPTER 21 CELL MEMBRANE MECHANICS AND ADHESION copyRD Kamm 4615
probability that the bond will remain intact These effects can be addressed using the methods described in more detail in Chapter xx Parallel flow assay Another common method for assessing cell adhesion is to plate the cells onto one wall of a parallel flow chamber subject them to a fluid dynamic shear stress and observe at what flow rate the cells begin to release If we ignore flow details in the immediate vicinity of the cell the shear stress can be estimated from the solution for a fully developed (Poiseuille) velocity profile
3V ⎡ y2
⎛ ⎞ ⎤v(y) = ⎢1minus ⎥ (279)
2 ⎝ ⎠ ⎣ ⎢ h ⎥⎦
so that the shear stress acting on the cell is
⎛ dv ⎞ 6μV τw = μ⎜ ⎟ = (280)
⎝ dy ⎠ h y = minush
and the total force can be estimated as F asymp τw Ac where Ac is the surface area of the cell membrane exposed to the flow Consider as an example a flow of culture medium at a rate of 1 mls through a channel of height 01 cm and width 1 cm If the culture medium has a viscosity close to that of water (μ=001 dyns) the shear stress is obtained from eqn (280)
6 sdot (001dyn sdot s) sdot (1ml s) ( 01 sdot10cm2 )τ dyn cm 2w = = 6 = 06Pa
01cm This corresponds roughly with the level of shear stress experience by endothelial cells in the arterial system If we consider that the cell has a surface area with dimensions roughly 100 μm x 10 μm or about 103 μm2 then the total force acting on the cell is obtained by integrating the shear stress over the area of the apical membrane Assuming that the shear stress is uniform the force is simply the product of shear stress and surface area or about 1 nN in the present example Again interpretation of results from such experiments requires careful consideration of the distribution of forces among the individual adhesion complexes In this situation the cell is likely to peel from the upstream edge in much the same manner as occurs in the cell peeling experiment discussed earlier
50
CHAPTER 21 CELL MEMBRANE MECHANICS AND ADHESION copyRD Kamm 4615
Radial flow and spinning disk assays One disadvantage of the parallel flow assay is that all cells are subjected to essentially the same level of shear stress so the flow rate needs to be incrementally varied in order to determine the level of force required for detachment These two systems using an axisymmetric geometry circumvent this problem by producing an easily characterized radial variation in shear stress In the case of the radial flow assay fluid enters through a central channel and flows radially outward through the narrow gap between two circular plates From conservation of mass the mean flow velocity is given by
QV = (281)
2πrh and sufficiently far from the center (rgtgth) the velocity profile is parabolic as in the parallel flow assay and the shear stress is again governed by eqn (280) using (281) for V Q
ω
(Not to scale)
v
h h
Cell layer rc Ce l l layer rc
r r
Fig 3116 Schematic diagram showing the radial flow assay (left) and the spinning disk assay (right) In the radial flow assay shear stress attains a maximum value near the center and falls with increasing radius r whereas in the spinning disk system maximum shear stress is experienced at large r In the spinning disk assay cells are grown on one disk and the opposite disk is rotated at constant speed Provided the rate of rotation is sufficiently small that inertial effects can be neglected the velocity is purely in the circumferential direction and the profile is linear between the two plates so that the shear stress experienced by the cells can easily be computed as
ωr τw = μ (282)
h
51
CHAPTER 21 CELL MEMBRANE MECHANICS AND ADHESION copyRD Kamm 4615
In both of these cases as in the parallel flow assay the total force is obtained by integrating the shear stress over the cell surface and the distribution of force among the adhesion complexes is weighted toward those located near the upstream end of the cell This can also be seen by consideration of the torque exerted by shear stress on the cell that must be balanced by a nonshyuniform contact stress with the substrate that is greatest near the upstream end Single bond adhesion assays Two other assays provide a means of obtaining estimates for the strength of a single adhesion bond without the need for excessive interpretation These rely on an ability to isolate a small number of bonds or even a single bond and infer bond strength from the step-wise nature of the de-adhesion process associated with breakage of discrete bonds One of these methods employs the atomic force microscope coated with the ligand of an adhesion receptor as shown in Fig 3117 The probe tip is gradually brought up to the cell surface until one or more receptor-ligand bonds are formed When the probe tip is withdrawn it moves along a different trajectory on a force-displacement plot reflecting the forces of adhesion These forces are seen to jump between more or less discrete levels as the probe continues to be moved away from the cell with each jump corresponding to the breakage of a single bond (Fig 3117) Using this method the bond strength between integrin receptor and a variety of RGD-containing ligands was found to lie in the range of 30 to 100 pN (Lehenkari and Horton 1999)
Fig 3117 The strength of a single adhesion bond can be measured by bringing a functionalized tip of an AFM probe up to the cell allowing bonds to form then slowly withdrawing the probe Monitoring the differences between the force displacement curve between the forward and reverse motions the forces necessary to break a single receptor-ligand bond can be determined [Reproduced from (Lehenkari and Horton 1999)]
52
CHAPTER 21 CELL MEMBRANE MECHANICS AND ADHESION copyRD Kamm 4615
A second method is similar in that the discrete increments in force are monitored as individual receptor-ligand bonds are broken but the forces are measured by means of changes in the shape of a giant vesicle the membrane of which contains the ligands have been inserted In this case one vesicle is made effectively rigid due for example to a high surface tension A second vesicle containing the adhesion molecules is also drawn partially into a micropipet but is much more complaint than the first The two vesicles are then brought into point contact so that one or a small number of adhesions are formed As the pipets are moved apart the compliant vesicle distorts due to the force of adhesion which it can be shown is related to the change in dimension of the vesicle in the direction of the force thereby serving as a sensitive force transducer measuring forces in the range of single adhesion receptors or between 1 and 100 pN [Evans 1991 37]
(For specific examples of leukocyte rolling and attachment see Orsello or Chang amp Hammer)
[This process is initiated for example by local infection that causes the release of
chemotactic agents in addition to cytokines hellip
Models of this process draw upon many of the concepts discussed in this chapter ]
Transient cell adhesion
Concepts of transient adhesion and release are of particular importance in the case of leukocyte
rolling adhesion and transmigration across the endothelial layer of a blood vessel In addition
cell migration through extracellular matrix or along a substrate requires the ability of the cell to
both form and release adhesions
One problem that has received considerable attention is the interaction between an
adherent or rolling leukocyte and the adhesion receptors on the endothelium These studies are
complicated by the three-dimensional nature of the flow the compliance of the interacting
surfaces and receptor-ligand dynamics In a series of recent studies Hammer and co-workers
(Chang Tees et al 2000) have addressed several of these issues computing the viscous force
and torque acting upon a sphere near to planar wall from the mobility matrix (Hammer and Apte
1992) and using the ldquoBell modelrdquo of receptor binding (Bell 1978) but neglecting the effects of
cell deformation The Bell model relates the dissociation rate constant kr to the force in the
bond f the thermal energy kBT and a parameter with units of length that depends on the
reactivity of the molecule
kr = ko r exp(γf kBT ) (283)
53
CHAPTER 21 CELL MEMBRANE MECHANICS AND ADHESION copyRD Kamm 4615
A Monte Carlo method is employed at each time step in the calculation to determine bond
formation or breakage In these studies the nature of the leukocyte-endothelial interaction is
characterized as firm adhesion rolling adhesion bimodal adhesion or no adhesion and mapped
as a function of the two parameters of the Bell model in Fig 3 The boundaries of the rolling
adhesion regime are identified for a wall shear rate of 100 s-1 (dotted lines) or 30 and 400 s-1
(solid lines) Most literature values for the Bell model parameters for a variety of selectin
receptors (known to be instrumental in leukocyte rolling) correspond to the rolling adhesion
regime for typical shear rate of 100 s-1 An interesting but counterintuitive result from this study
was the observation that as the bond stiffness was increased from the value used in most
calculations (100 dyne cm-1) adhesiveness decreased which the authors attribute to reduced
deflection for a given level of force leading subsequently to more rapid dissociation
Fig 3118 The state diagram for a leukocyte interacting with an endothelial surface for shear rates ranging from 30 to 400 s-1 For low dissociation rates the leukocyte remains adherent to the surface (lower left) As either (γ) or ( ko
r ) [see Eqn (283) for definitions] is increased the cell first adheres firmly then rolls along the wall then completely detaches (upper right) Rolling adhesion is defined as the regime where rolling occurs over some part of the shear rate range between 30 and 400 s-1 Firm adhesion indicates that cells remain attached even at the highest shear rate no adhesion indicates that cells roll at a velocity gt 50 of the velocity of a non-adherent sphere In the bimodal regime cells are either adherent or non-adherent and do not exhibit rolling Dotted curves correspond to these same boundaries for a shear rate of 100 s-1 Reproduced from Chang et al (2000)
54
CHAPTER 21 CELL MEMBRANE MECHANICS AND ADHESION copyRD Kamm 4615
In another recent study using high-resolution video-microscopy (Schmidtke and Diamond
2000) it was demonstrated that a flowing neutrophil can attach to an adherent platelet via
adhesion molecules located in the tips of the microvilli and form long tethers averaging nearly 10
μm in length but ranging up to 40 μm at extensional rates of 6-40 μm s-1 for shear rates ranging
from 100-250 s-1 The mechanics of tether formation is itself a fascinating topic that is still under
intense investigation Readers interested in pursuing this work in more detail are referred to the
several papers (Hochmuth Shao et al 1996 Dai and Sheetz 1998 Dai and Sheetz 1999) that
identify a number of intriguing phenomena
55
CHAPTER 21 CELL MEMBRANE MECHANICS AND ADHESION copyRD Kamm 4615
317 Nomenclature Parameter Definition Units
R - receptor
L - ligand
C - receptor-ligand complex
G - Gibbs free energy Nm
N - membrane tension Nm
NR - total receptor density -3μm-2 in 2D or μm in 3D NL - total ligand density μm-2 in 2D or μm-3 in 3D N in 2D or μm-3μm-2
C - complex density in 3D NRf - free receptor density m-2 in 2D or m-3μ μ in 3D NLf - free ligand density -2 -3μm in 2D or μm in 3D d+ - forward diffusional rate constant 2 -1μm s-1 in 2D or 3 μm s in 3D d -1
- - reverse diffusional rate constant s r+ - forward reaction rate constant s-1
r- - reverse reaction rate constant s-1 D 2 -1
m - membrane diffusion coefficient μm s D - solution diffusion coefficient m2 s -1s μ Kb - bending stiffness Nm K 0 - equilibrium constant or affinity (zero force) M-1 in 3D and 2μm in 2D = k0
+ k0 minus
K - equilibrium constant M-1 in 3D and m2μ in 2D = k+kshy
k0 - association rate constant (zero force) M-1 s-1 in 3D or m-2 -1+ μ s in 2D
k0 - dissociation rate constant (zero force) s-1 minus
k - association rate constant M-1 s-1 in 3D or m-2 -1+ μ s in 2D
kminus - dissociation rate constant s-1 f - force per bond N F - total adhesion force N γ - empirical parameter μm r0 - distance over which energy minimum acts μm E0 - bond energy J k JK-1
B - Boltzmanns constant T - temperature K τ - bond lifetime s
56
CHAPTER 21 CELL MEMBRANE MECHANICS AND ADHESION copyRD Kamm 4615
τ0 - bond lifetime with zero force s σ - adhesion stress N μm-2 κ - spring constant for receptor-ligand bond N μm-1
57
CHAPTER 21 CELL MEMBRANE MECHANICS AND ADHESION copyRD Kamm 4615
References Bell G I (1978) Models for the specific adhesion of cells to cells Science 200 618-627 Caille N O Thoumine et al (2002) Contribution of the nucleus to the mechanical properties
of endothelial cells J Biomech 35(2) 177-87 Chang K C D F Tees et al (2000) The state diagram for cell adhesion under flow
leukocyte rolling and firm adhesion Proc Natl Acad Sci U S A 97(21) 11262-7 Dai J and M P Sheetz (1998) Cell membrane mechanics Methods Cell Biol 55 157-71 Dai J and M P Sheetz (1999) Membrane tether formation from blebbing cells Biophys J
77(6) 3363-70 Daily Elson et al (1984) Determination of the elastic area compressibility modulus of the
erythrocyte membrane Biophys J 45(4) 671-682 Evans E and K Ritchie (1997) Dynamic strength of molecular adhesion bonds Biophys J
72(4) 1541-55 Evans E A (1983) Bending elastic modulus of red blood cell membrane derived from
buckling instability in micropipet aspiration tests Biophys J 43(1) 27-30 Hammer D A and S M Apte (1992) Simulation of cell rolling and adhesion on surfaces in
shear flow general results and analysis of selectin-mediated neutrophil adhesion Biophys J 63(1) 35-57
Hardt S L (1979) Rates of diffusion controlled reactions in one two and three dimensions Biophysical Chemistry 10 239-243
Hochmuth F M J Y Shao et al (1996) Deformation and flow of membrane into tethers extracted from neuronal growth cones Biophys J 70(1) 358-69
Kucik D F E L Elson et al (1999) Weak dependence of mobility of membrane protein aggregates on aggregate size supports a viscous model of retardation of diffusion Biophys J 76(1 Pt 1) 314-22
Kusumi A Y Sako et al (1993) Confined lateral diffusion of membrane receptors as studied by single particle tracking (nanovid microscopy) Effects of calcium-induced differentiation in cultured epithelial cells Biophys J 65(5) 2021-40
Lehenkari P P and M A Horton (1999) Single integrin molecule adhesion forces in intact cells measured by atomic force microscopy Biochem Biophys Res Commun 259(3) 645-50
McCloskey M and M M Poo (1984) Protein diffusion in cell membranes some biological implications Int Rev Cytol 87 19-81
Meleard P Gerbeaud C Bardusco N Mitov MD and Ferdandex-Puente L (1998) Mechanical properties of model membranes studied from shape transformations of giant vesicles Biochimie 80 401-413
Moy V T Y Jiao et al (1999) Adhesion energy of receptor-mediated interaction measured by elastic deformation Biophys J 76(3) 1632-8
Ra H J C Picart et al (1999) Muscle cell peeling from micropatterned collagen direct probing of focal and molecular properties of matrix adhesion J Cell Sci 112 ( Pt 10) 1425-36
Saffman P G (1976) Bownian motion in thin sheets of viscous fluid Journal of Fluid Mechanics 73 593-602
Schmidtke D W and S L Diamond (2000) Direct observation of membrane tethers formed during neutrophil attachment to platelets or P-selectin under physiological flow J Cell Biol 149(3) 719-30
Sheets E D R Simson et al (1995) New insights into membrane dynamics from the analysis of cell surface interactions by physical methods Curr Opin Cell Biol 7(5) 707-14
58
CHAPTER 21 CELL MEMBRANE MECHANICS AND ADHESION copyRD Kamm 4615
Vink H and B R Duling (1996) Identification of distinct luminal domains for macromolecules erythrocytes and leukocytes within mammalian capillaries Circ Res 79(3) 581-9
Waugh R and E A Evans (1979) Thermoelasticity of red blood cell membrane Biophys J 26(1) 115-31
Zeman K H Engelhard et al (1990) Bending undulations and elasticity of the erythrocyte membrane effects of cell shape and membrane organization Eur Biophys J 18(4) 203shy19
Zhelev D V D Needham et al (1994) Role of the membrane cortex in neutrophil deformation in small pipets Biophys J 67(2) 696-705
59
MIT OpenCourseWarehttpocwmitedu
20310J 3053J 6024J 2797J Molecular Cellular and Tissue BiomechanicsSpring 2015
For information about citing these materials or our Terms of Use visit httpocwmiteduterms
CHAPTER 21 CELL MEMBRANE MECHANICS AND ADHESION copyRD Kamm 4615
stress at the edges of a lipid bilayer the projected or apparent membrane area first increases
while the actual or true membrane area remains constant This results from the suppression of
out-of-plane undulations Forces acting to resist membrane flattening originate from entropic
effects analogous to those seen in the case of a flexible polymer as its end-to-end distance is
increased ndash many more membrane configurations exist with undulations compared to the single
perfectly flat state Only when these undulations have been eliminated does the true membrane
area proportional to the surface area per molecule group begin to increase and this is associated
with a relatively abrupt increase in extensional stiffness For now we consider only the stiffness
of a flat membrane and leave the discussion of undulations of entropic origin to a later point in
the chapter Hence we initially neglect all entropic effects or equivalently consider the
membrane to be at zero temperature
Based in this assumption consider an infinitesimal plate initially of area A0 = L 20 that is
deformed by a uniform normal stress τ11 = σ1 = τ22 = σ2 applied to its edges (Fig 315) to a
new area A Previously we derived the expressions relating stress and strain which in two
dimensions and in the absence of stresses normal to the x1-x2 plane can be written
E
σ α = 2 (εα + νε β ) (21) 1minus ν
where the length of one edge Lα=L0(1+εα) Note that in this chapter we use the subscripts α β
rather than i j to distinguish stresses and strains in two dimensions from those more generally
in three Thus whereas i and j can be either 1 2 or 3 α and β are restricted to being either 1 or
2 When this stress is uniform in the plane of the membrane (the x1- x2 plane) it can be replaced
without loss of generality by a surface tension Nα (force per unit length) defined as σ α h where h
is the thickness of the membrane These can be combined in the case when N1 = N2 = constant
and consequently ε1 = ε2 = ε to give
Eh
N = ε (22)1 minus ν
In terms of a plate stretched uniformly in both directions we can define the areal strain as
ΔA A minus A 2 2 2
= 0 L0 (1+ ε ) minus L= 0
2 cong 2ε (23)A0 A0 L0
where the last approximation is appropriate for small strains By combining this result with eqn
(22) we can define the area expansion modulus Ke (units of Nm)
9
CHAPTER 21 CELL MEMBRANE MECHANICS AND ADHESION copyRD Kamm 4615
Eh ΔA Δ A
N = equiv K (24)2(1minus ν) A e
0 A0
Note that although we used the continuum structural equations in our analysis the final result
can also be viewed as simply the definition of the area expansion modulus and applies regardless
of whether or not the membrane can be modeled as a continuum
Experimental measurements of Ke lie in the range of 01-1 Nm for various types of lipid
bilayers and about 045 Nm (450 dyncm) for red blood cell membranes (Waugh and Evans
1979) These numbers suggest that cell membranes are quite resistant to extension and for that
reason are often treated as inextensible1 This high resistance to area change is in large part due
to the energy penalty associated with exposing the hydrophobic core of the membrane to water
that occurs as the spacing between individual amphiphilic molecules is increased [for a detailed
description of bilayer structure and thermodynamics see Tanford (1980) or Israelachivili
(1991)] Continuing to increase extensional stress the lipid bilayer eventually ruptures but at
very small extensional strains in the vicinity of 2 to 3 (Mohandas amp Evans 1990) Note that a
bilayer in a lipid vescicle for example stretches primarily by increasing the area per molecule
since recruitment of additional material to the membrane occurs very slowly
Using these expressions we can estimate the level of surface tension at which the
membrane would rupture At a 3 extensional strain (6 areal strain) uniformly applied in the
x1-x2 plane the surface tension at rupture would be about 006 Nm if we use a value near the
higher end of the observed range Ke = 1 Nm Using Laplaces law [see eqn (227)] for the
relationship between the pressure difference (ΔP) across a spherical shell of radius R = 1 μm and
the surface tension in the shell gives us
2N
ΔP = = 12x105 Pa cong 1200cmH 2O R
a remarkably high value of pressure given the thickness of the membrane is only 6 nm
Cells also often exhibit an intrinsic surface tension Reported values are small however
lying in the range of about 10-5 to 10-4 Nm (Sheets Simson et al 1995) For comparison recall
that the surface tension across the interface of a droplet of pure water is about 007 Nm a value
close to the rupture stress of the membrane given above It becomes immediately obvious then
that the tension of a cell membrane must be orders of magnitude smaller than the surface tension
1 This discussion neglects the effects of thermal fluctuations in the membrane that give rise to a much more compliant behavior at the smallest areal strains When surface stress is sufficient to smooth out most thermal fluctuations the cell or vesicle will exhibit the large moduli given here See also Example xx later in this chapter
10
CHAPTER 21 CELL MEMBRANE MECHANICS AND ADHESION copyRD Kamm 4615
of a typical gas-liquid or liquid-liquid interface since it would otherwise give rise to intracellular
pressures on the order of one atmosphere
Pure bending By contrast lipid bilayers exhibit a very low bending stiffness so low that it is
often neglected in models of membrane mechanics It can be important in certain situations
however and is essential for example in analyzing the thermal fluctuations of vesicles discussed
later in this chapter
Bending stiffness arises from the same type of molecular interactions that cause
extensional stiffness When an initially flat bilayer is bent the hydrophilic head groups on the
outside of the bend move further apart while on the inside intermolecular spacing decreases
both represent departures from the equilibrium unstressed state and require energy If the same
forces of interaction are responsible why then is bending stiffness so low While the answer to
this question is not simple one factor is the membrane thickness which you recall is only about
6 nm As the membrane bends therefore the change in the surface area per molecule is
extremely small so the associated extensional strains are also minute
Returning to our simple continuum plate model consider a bending moment applied to
the two ends causing the plate to curve slightly (Fig 316) If the bending is due to moments
applied at the two ends about the x2-axis then the bending moment per unit length is related to
the deflection by
Et 3 ⎛ part 2u ⎞ ⎛ part 2 ⎞
⎜ 3 u
Mα = minus 2 2 ⎟ = minusK B⎜ 32 ⎟ (25)
12(1minus ν ) ⎝ partxα ⎠ ⎝ partxα ⎠
where KB is termed the bending stiffness having units of Nm Implicit in this expression are the
assumptions that there exists a mid-plane (the neutral plane) on which the in-plane stress and
strain are both zero and that straight lines perpendicular to this mid-plane remain straight and
normal to this surface after deformation
Typical values for the bending stiffness KB lie in the range of 10-19 Nm (10-12 dyncm) for
a red blood cell or lipid bilayers (Mohandas amp Evans 1990) This value is larger on the order of
1-2x10-18 Nm (Zhelev Needham et al 1994) for other cell types (eg neutrophils endothelial
cells) that possess a more extensive cortex The methods used to obtain these values will be
described later in this chapter
11
CHAPTER 21 CELL MEMBRANE MECHANICS AND ADHESION copyRD Kamm 4615
Fig 316 Plate subjected to equal moments M1 at the two edges
Example Estimate the moment per unit length acting within an initially flat lipid bilayer (at zero
temperature) associated with a wavelength λ = 5 μm and amplitude ε = 1 μm
Membrane displacement can be approximated by the expression
u3 = ε sin (2πx1 λ) (26)
From eqn (25) above we obtain
2
⎛ 2π ⎞ M1 = KBε sin (2πu )⎝ ⎠ 3 λ (27)λ
Using the values given above the maximum moment per unit length is 0158 pN
Pure shear Shear deformations arise when a membrane is stretched in one direction by a
surface tension N1 (units of forcelength) while the lateral surface contracts under a lesser tension
N2 at constant surface area and in the absence of bending (Fig 317) Surfaces oriented at 45
degrees to the boundaries experience pure shear stresses of magnitude (N1 - N2)2
When subjected to shear stresses in the plane of the membrane a pure lipid bilayer
behaves essentially as a liquid It exhibits a membrane viscosity in that it poses a resisting force
proportional to the rate of shear deformation but only a small shear modulus to static shear
deformations It is not clear in fact whether or not pure lipid bilayers exhibit a non-zero shear
modulus For example the movement of membrane-bound proteins can be described by a
simple diffusion coefficient proportional to the membrane viscosity Typical cell membranes do
exhibit a shear modulus however largely due to the cortex of cytoskeletal filaments that lie on
the intracellular side of the membrane In a red blood cell this matrix as discussed above
12
CHAPTER 21 CELL MEMBRANE MECHANICS AND ADHESION copyRD Kamm 4615
consists of interconnected filamentous spectrin and actin with attachments to the membrane via
ankyrin
N2
N1 N1
N2 Fig 317 A section of membrane subjected to a shear stress of magnitude N1-N22
The equations relating shear stress to shear deformation (Hookes law) from Ch xx can
be applied here
τ12 = τ 21 =2Gε12 (28)
or expressed as a shear force per unit length of membrane
N12 =τ12 h = 2Gε12 = Ksε12 (29)
where we define the membrane shear modulus Ks with units of Nm Typical values lie in the
range of 6-9 x 10⁻⁶ Nm for a red blood cell membrane A pure lipid bilayer exhibits a viscous
resistance to shear deformations characterized by a shear viscosity of about 10-6 Nsm ((Evans
1983))
The 2D elastic plate -- equations of deformation
In the analysis of cellular membranes several unique characteristics need to be taken into
account
1 The membrane is extremely thin relative to its lateral extent If we consider the thickness to
be that of the lipid bilayer by itself then h can be as small as 6 nm compared to a typical cell
dimension on the order of 10s of μm Even if we include the sub-membrane cortex this
13
CHAPTER 21 CELL MEMBRANE MECHANICS AND ADHESION copyRD Kamm 4615
dimension only increases to about 100 nm This tends to favor in-plane stresses over bending
effects2
2 The non-shear deformations are very small with strains of at most a few percent Therefore
linear analysis is appropriate in many situations Note however that nonlinear effects can be
important especially for large shear deformations such as occur in micropipet aspiration of
red blood cells The implications and limitations of this are discussed more fully below
3 The membrane exhibits a very small modulus in plane shear and is often treated as a two-
dimensional liquid While this applies primarily to lipid bilayers when the membrane is
considered to include the cortex greater values of shear modulus can be observed
4 Stresses normal to the membrane are small and can be neglected
5 Membrane motions can be damped either due to viscous dissipation within the bilayer as in
the case of in-plane shear or due to the viscosity of the fluids on the intra- or extracellular
sides of the membrane These latter are especially important when considering motions of
the membrane perpendicular to its plane
6 Inertial effects can be neglected due to the predominance of viscous forces during transient
deformations
With these in mind and acknowledging the limitations of a continuum view of such
structures we treat the membrane as a thin homogeneous plate or membrane in which all the
following must be considered in-plane extension and shear bending viscous damping and
thermal fluctuations
The equations we derive will effectively be integrated through the membrane thickness so
that stresses will be in terms of surface forces (force unit length) These are the in-plane normal
forces (see Fig 318 for definition of the axes and nomenclature) are therefore written as
+ h 2
Nα = int σ α dx3 (210) minus h 2
where h is the membrane thickness and the vertical shearing forces
+ h 2
Vα = (211) minus h
int τα 3dx3
2
The moments acting on the plate edges can be calculated from
2 Whether tension or bending dominates clearly depends on the nature of the experiment If an initially spherical cell is distended tension is most important if the cell shrinks so that the membrane buckles bending effects will be critical
14
CHAPTER 21 CELL MEMBRANE MECHANICS AND ADHESION copyRD Kamm 4615
+h 2
Mα β = int x3τα β dx3 (212)minush 2
x
(c)
Fig 318 (a) A small section of membrane (b) Membrane deflections (c) Nomenclature used in defining the forces acting on a section of membrane (Note that Q is used to represent shear stress in the figure whereas V is used in the text and (xyz) should be (x1x2x3))
In order to distinguish the effects of bending from those giving rise to extension we separate the
normal stress into two parts one representing the mean over the thickness of the membrane
which is simply Nαh and the other representing the deviation from this value denoted as σαprime
Similarly we separate the displacement on the neutral plane unα from that which varies with x3
denoted as uαprime Consequently we can write
N
uα = u n + primeα and = iα u σ α + primeσ α (213)
h
And consistent with the assumption that planar edges initially normal to the membrane remain
planar under bending deformations we have that
15
CHAPTER 21 CELL MEMBRANE MECHANICS AND ADHESION copyRD Kamm 4615
partu uαprime = minus x 3
3 (214)partxα
According to assumption (4) above the relationships between stress and strain become
E σ α = νε β ) α ne β (215)
minus ν2 (ε1 α +
and
E ταβ = εαβ α ne β (216)
(1+ ν )
Since
partuα partunα partu
= αprime ε α = + (217)
partxα partxα partxα
(summation convention not used) We eventually obtain the following expressions for the
bending moment
+h 2 ⎛ part 2 u part 2 ⎞ M 3 u3
α = int σ α x3dx3 = minusKB ne (218)⎜ ⎝
2 + ν ⎟ α β partx 2
minush 2 partxα β ⎠
and
+ h 2 part 2u
M12 = int ε KB (1minus ν) 312 x3dx3 = minus (219)
minus h 2 partx1partx2
where in classical shell theory for continuum materials KB=Eh3(1-ν2) The moments are related
to the shear forces in the plane of the membrane through a moment balance about the x1 axis
giving
partM 12 partM
+ 2 minus V2 = 0 (220)partx1 partx2
so that
part ⎛ part 2 u part 2 u ⎞ part ⎛ part 2 part 2
V = minus 3 + 3 uandV 3 u
K ⎜ ⎟ = minus K ⎜ + 3⎞
2 B ⎟ (221)partx2 ⎝ partx 2 2 ⎠ 1 B 2 2
1 partx2 partx1 ⎝ partx1 partx2 ⎠ A force balance in the direction normal to the membrane yields
16
CHAPTER 21 CELL MEMBRANE MECHANICS AND ADHESION copyRD Kamm 4615
partV1 partV2 part ⎛ partu ⎞ part ⎛ partu ⎞+ + ⎜ N 3 ⎟ + ⎜ N 3 ⎟
2 + p = 0 (222)x 1
part 1 partx2 partx1 ⎝ partx1 ⎠ partx2 ⎝ partx2 ⎠
which upon substitution for V1 and V2 from eqns (221) becomes
⎛ part4u3 part4u part4u3 part part ⎛ ⎞K 3 ⎞ part ⎛ u ⎞
B 4 N 3 partu
+ 2 + minus minus N 3 minus p = 0 (223)⎜ ⎟ ⎜ ⎟ ⎜ ⎟⎝ partx1 partx2partx2 partx4 ⎠ partx ⎝ 1 partx ⎠ partx ⎝ 21 2 2 1 1 2 partx2 ⎠
Recall that the first term in parentheses is due to bending the second and third terms are due to
in-plane extension and the fourth term represents the pressure difference across the membrane
Eqn (223) contains three unknowns the displacement u3 and the two normal forces per
unit length N1 and N2 Fortunately the additional equations required for solution are quite easy
to obtain from simple force balances in the x1 and x2 directions Setting the sum of forces in the
x1 direction equal to zero we obtain (referring to Fig 319)
minus N1(x1) + N1(x1 + dx1)cosθ (x1 + dx1) minus N21 (x2 ) + N21(x2 + dx2 ) = 0 (224)
or
partN1 partN21 partN2 partN + = 0 and similarly + 12 = 0 (225)
partx1 partx2 partx2 partx1
While formidable in its complete form it is reassuring to know that we rarely use eqn
(223) in its entirety and that when certain limiting cases are considered more familiar equations
are obtained It is useful at this stage to consider several of these limits
Fig 319 x1 force balance in the plane of the membrane
17
CHAPTER 21 CELL MEMBRANE MECHANICS AND ADHESION copyRD Kamm 4615
Balance between pressure and surface tension (Laplacersquos Equation) If the in-plane stress is
uniform (Ni=Nj=N) eqn (223) has the form
⎛ part 4u part 4u part 4u ⎞ ⎛ part 2u KB ⎜
3 4 + 2 3 3
2 2 + 4 ⎟ minus N⎜ 3 part 2u
2 + 3 ⎞
2 ⎟ minus p = 0 (226)⎝ partx1 partx1 partx2 partx2 ⎠ ⎝ partx1 partx2 ⎠
and eqn (225) is trivially satisfied If in addition bending stiffness can be neglected then
⎛ part 2 u part 2 ⎞ ⎛ 1 1 ⎞ 3 u
p = minusN ⎜ 3
2 + 2 ⎟ cong N⎜ + ⎟ (227)⎝ partx1 partx2 ⎠ ⎝ R2 R1⎠
for small curvatures where R1 and R2 are the radii of curvature of the membrane about the x1 and
x2 axes respectively This is the well-known Laplacersquos equation with N the surface tension For
a sphere R1 = R2 and the equation simplifies further yielding the equation given on p 10
Balance between pressure and bending Alternatively if all in-plane stresses can be neglected
other than those associated with bending stiffness we obtain the equation generally used for
simple bending of plates and shells
⎛ part 4u part 4u part 4 3 3 u ⎞
KB ⎜ 4 + 2 2 + 3 ⎟ = p (228)
⎝ partx1 partx1 partx2 partx 4 2 2 ⎠
Both of these forms will be used later in this chapter to examine specific problems in cell
membrane mechanics
The conditions under which eqn (226) can be reduced to either (227) or (228) can be
determined by an order of magnitude comparison of the bending and tension terms If we take u
to be a measure of the membrane displacement in the x3 direction and λ to be the characteristic length in the x1 or x2 directions over which u3 varies then the bending term can be shown to scale as K 4 2
Bu λ and the tension term as Nu λ The ratio of these tells us which of the terms dominate in eqn (226) If
KBu λ4 K= B ltlt 1
Nu λ2 Nλ2
then tension dominates and eqn (227) is appropriate Alternatively if
KB gtgt 1 Nλ2
18
CHAPTER 21 CELL MEMBRANE MECHANICS AND ADHESION copyRD Kamm 4615
then bending dominates and eqn (228) should be used If we take values typical of those given
for cells K N = 5x10⁻⁵B = 10-18 Nm Nm λ = 1 μm this ratio equals 002 confirming as we
originally postulated that tension tends of dominate
Nonlinear formulations
Traditionally membrane deformations have been addressed through nonlinear analysis allowing
for large strains especially in shear Here we have chosen to present the linearized equations in
the hope that they will provide clearer insight and for continuity with the approach used in other
chapters of the text For many problems of interest deformations are small and linear theory is
sufficiently accurate In some circumstances however a nonlinear analysis is necessary one
example being the aspiration of a red blood cell membrane into a micropipet For this reason we
present the nonlinear equations in Appendix A for the more advanced reader and to assist in
reading the recent literature on membrane mechanics
Energies of deformation
Although the formulation of the equations of deformation in Section 316 is complete by itself
an alternative approach is often useful in which we consider the strain energy the energy stored
in the membrane due to elastic deformation as a basis for analysis Strain energy is analogous to
the energy stored in a spring by stretching it If the spring is linear with a stiffness k so that the
force F required to lengthen it from x0 to x is k(x-x0) then the energy expended during the
process of lengthening is
x x
U = int Fdx = int k(x minus x0 )dx = 1 2 k(x minus x0)
2 (229)x= x 0 x = x 0
Extensional energy Now consider a section of an elastic membrane of thickness h and lengths
dx1 and dx2 subjected to a uniaxial tension stress σ1 Here as in our previous discussion we
consider two cases first a flat membrane which is being stretched by extensional stresses (the
case at zero temperature) and second the situation in which the surface area of the membrane
projected onto a flat plane increases due to the smoothing of out-of-plane undulations (the
entropic contribution)
As the stress is gradually applied to minimize any dissipative effects the work done by
the external force must equal the gain in elastic energy stored in the plate The work performed
by this stress is
19
CHAPTER 21 CELL MEMBRANE MECHANICS AND ADHESION copyRD Kamm 4615
ε1 ε 1
dU = int σ 1dε 1dx1dx2 dx3 = int Eε1dε1dx1dx2dx3 (230)0 0
By energy conservation the work done in stretching the membrane must be stored as potential
or strain energy in the elastic member Since the right-hand-side of (330) represents the strain
energy in the volume dx1dx2dx3 then the energy per unit volume of membrane is
ε1 ε1
U0 = int σ 1dε1 = int Eε = 1 Eε21dε1 2 1 (231)
0 0
or expressed as energy per unit area of membrane
Ehε2
U 10h = (232)
2 In the somewhat more general case of biaxial strain a similar approach leads to
Eh ⎡ 2 2
( 2 2 ) Eh ⎛ ⎤partu ⎞ uε1 + ε 2 = ⎢⎜
1 ⎛ part
⎟ + ⎜ 2
⎞ U0h = ⎟ ⎥ (233)
2 1( minus ν ) 2 1( minus ν ) ⎢⎝ partx⎣ 1 ⎠ ⎝ partx2 ⎠ ⎥⎦
Note that if the strain is isotropic in that ε1 = ε2 = ε this can also be expressed in terms of the
areal strain with the aid of eqn (23)
2 Eh ⎛ ΔA⎞
U0h = ⎜ ⎟ (234)4 1( minus ν ) ⎝ A0 ⎠
from which it can be seen by eqn (24) that the area expansion modulus has the form
Eh Ke = (235)
2 1( minus ν )
under the assumptions of a homogeneous isotropic elastic membrane This term however only
accounts for the contribution to extensional energy associated with an increase in the surface area
of a membrane Another contribution arises from the change in the membrane surface area
projected onto the x1-x2 plane due to non-uniform displacements perpendicular to the plane of
the membrane in the x3 direction This can be seen from the following one-dimensional
example
Consider a membrane tethered at both ends that exhibits a constant surface tension N
when deformed into a new state defined by u3(x1) Locally the change in length of a segment
initially of length dx is
20
CHAPTER 21 CELL MEMBRANE MECHANICS AND ADHESION copyRD Kamm 4615
( 2 2 dx ) + ( du3 ) minus dx = [1 du3 dx1)2]
12 2 2 + ( dx 1 1
1 minus dx1 asymp (1+ 2 (du3 dx1) )dx1 minus dx1 = 2 (du3 dx ) dx(236) 1 1
[see also Figs 64 and 65 in Boal] The strain is then the change in length over the initial length or
2ε11 = 1
2 (du3 dx1) (237) and the energy per unit area associated with this change in length under a constant tension N is
2 ε N ⎛ partu ⎞
U0h = N1int dε =0
⎜ 3
⎟ (238)2 ⎝ partx1 ⎠
which extending to two dimensions can be written
⎡⎛ ⎞ 2 ⎛ 2⎤ N partu3 partu ⎞U ⎢⎜ ⎟ + ⎜ 3
0h = ⎟ ⎥ (239)2 ⎢⎝ partx1 ⎠ ⎝ partx⎣ 2 ⎠ ⎦ ⎥
It is important to recognize that we now have two expressions associated with the energy of
extension and they represent two distinct phenomena The first [eqn (333)] describes the
energy associated with true areal expansion that is a change in the effective spacing between the
molecules comprising the lipid bilayer The second [eqn (339)] corresponds to the energy
change due to undulations in a membrane with constant intermolecular spacing To see the
distinction between the two consider an experiment in which the pressure inside a cell or a lipid
vesicle is gradually increased by aspiration into a micropipette Initially the projected area of
the membrane rises rapidly with a relatively small increase in membrane tension corresponding
to the smoothing of undulations caused by thermal excitation of the membrane This is followed
at higher tensions by a transition to a regime in which the membrane exhibits a much greater
stiffness corresponding to the situation in which the thermally-induced undulations have been
smoothed out and the true membrane surface area now must increase In the absence of thermal
fluctuations eg at zero temperature only this second regime would be observed [see also
figure from Boal]
Energy of shear deformation Next examine the energy per unit area associated with shear
deformation in the plane of the membrane which can be expressed in the form
2
1 1 2 Gh ⎛ part u1 partu2 ⎞
U0h = 2 hτ12ε12 = 2 hGε12 = ⎜ + ⎟ (240)2 ⎝ partx2 partx1 ⎠
21
CHAPTER 21 CELL MEMBRANE MECHANICS AND ADHESION copyRD Kamm 4615
where we have utilized eqns (28) and (29) to obtain a form similar to that of eqn (234) for
extensional deformation
[See Boal for an alternative form in terms of membrane curvature He also gives a nice
description of bending in bilayer membranes]
Bending energy The contribution due to bending energy is somewhat more difficult to derive
First recognize that only those normal stresses that vary with x3 contribute to the bending
energy that is those contributed by the σ stresses in eqn (213) With this in mind we can
write the expression for the total elastic energy due to bending as
1 1 U = intintint ⎧ [ 2
⎨ ( ) 2 ⎫ σ 1 prime + ( )2
σ 2 prime + 2νσ 1 primeσ prime 2 ] + ( )τ 12 prime ⎬dx (241)⎩2E 2G ⎭ 1dx2dx3
Substituting for the stresses and strains from eqns (215)-(217) this can be re-cast in the
following form
⎧ 2 ⎫K ⎛ 2
part 2 2u ⎡ 2 u part ⎞ part 2u 2 part 2 ⎤ part u ⎛ u ⎞
U = B intint ⎜ 3 3 ⎟ 1 minus ν ) 3 3 2 minus ⎜ 3 ⎟⎨ 2 + 2 minus 2( 2 ⎬dx1dx (242)⎢ ⎥2 ⎝ partx1 partx2 ⎠ partx1 partx2 ⎝ partx1partx2 ⎠ 2
⎩ ⎣ ⎦ ⎭
It can be shown ((Meleard 1998)) that the integral of the second term in the integrand above [the
one multiplied by 2(1-ν)] is globally constant under deformation if the membrane remains a
closed surface with no holes Assuming that to be the case we obtain for the total bending strain
energy
KB ⎛
2 part 2u part 2
= intint ⎜ 3 u2 + 3 ⎞
U ⎟2 dx1dx2 + const (243)
2 ⎝ partx1 partx2 ⎠
Since we typically are concerned with changes in energy the constant will arbitrarily be set to
zero Thus the energy per unit area or energy density of bending deformations can be written
2 K ⎛ part 2 part 2 ⎞
0 = B u⎜
3 uU h 2 + 3
2 ⎟ (244)2 ⎝ partx1 partx2 ⎠
Note that the term in parentheses is proportional to the mean curvature of the surface Often the
surface has a natural mean curvature in the unstressed state If that curvature is c0 the bending
energy expression is modified slightly to the form
22
CHAPTER 21 CELL MEMBRANE MECHANICS AND ADHESION copyRD Kamm 4615
2 K ⎛ part 2 part 2 ⎞
U0 = B u⎜
3 uh 2 + 3
2 minus c0⎟ (245)2 ⎝ partx1 partx2 ⎠
Another common form of this expression is obtained by recognizing that the first two terms in
parentheses represent the linearized form of the sum of the principal curvatures (the largest and
smallest curvatures at a point) denoted c1 and c2 so that eqn (345) can be written
K
U2 B
0h = (c1 + c2 minus c0 ) 2
Although each of these expressions for strain energy density has been derived individually they
of course all contribute in the general situation and are linearly additive In that regard several
points are worthy of note First one can obtain some idea of the relative importance of
extension shear and bending deformations in a given situation simply by comparing their
relative energies just as was done in the last section by comparison of the bending and tension
terms in eqn (226) Not surprisingly the comparison leads to the same expressions we obtained
before for when either bending or tension is dominant Second due to the small shear modulus
of most cell membranes the energy stored in shear deformation can generally be neglected And
finally a comment is warranted concerning the energy due to tension Various simplifying
assumptions can be made depending on the cell type being considered and the nature of the
stress to which the cell (or vesicle) is being subjected but generally the lipid bilayer can be
considered to be of constant area unless it experiences grossly non-physiologic levels of stress
Thus the main contribution to extensional energy is that represented by eqn (339) associated
with the smoothing of membrane undulations
Other Factors Influencing Membrane Motion
Thermal fluctuations Biological membranes of all types can be seen to fluctuate due to
Brownian motion of the surrounding molecules if viewed with sufficient resolution These
fluctuations are in fact often used to measure the membrane bending stiffness since thermal
effects are seen as motions in the membrane of relatively long wavelength favoring bending
energies as compared to extensional or shear (see eqn (223)) To account for these effects it is
customary to add a time-dependent forcing term to eqn (223) η(t) the magnitude of which
scales with kBT We analyze thermal motions later and use them as a means of determining the
bending stiffness of a membrane
23
CHAPTER 21 CELL MEMBRANE MECHANICS AND ADHESION copyRD Kamm 4615
Damping due to external fluids When a membrane fluctuates in a direction perpendicular to its
plane velocities are induced in the surrounding fluids and due to the resulting shear stresses
energy is dissipated These motions are extremely complex to model precisely and depend on
both the nature of the surrounding medium (its rheological properties) and the bounding
geometry In lieu of a complete and rigorous analysis a local damping term is sometimes added
to the membrane force balance equation (eqn (223)) to approximate these effects Its form is
based on the presumption that externally induced velocities scale with the velocity of the wall
and that shear forces in the external fluid scale with the induced shear rates and velocities
Accordingly eqn (223) is modified by the addition of a term of the form μm partu3 partt where μμ is
the effective viscosity of the external fluid The equation that results from the addition of both
thermal forcing and external fluid viscosity is
partu ⎛ part 43 u 4
3 part u part+ 3 part 4u ⎞ part ⎛ ⎞ part ⎛ ⎞
B ⎜ 3 partu u
μm K 4 + 2 2 2 + 4 ⎟ minus ⎜ N3
⎟ minus part 1 ⎜ N
3
partt ⎝ x partx partx partx ⎠ partx ⎝ partx ⎠ partx ⎝ 2 ⎟ = p + η(t) (246)1 1 2 2 1 1 2 partx2 ⎠
An expression of similar form for a linear polymer is sometimes referred to as the Rouse
equation
314 Measurements of Membrane Elastic Parameters
Although the analogy has limitations it is useful at the onset to think of the cell as a fluid-filled
balloon or bag Just as in the case of a balloon the elastic properties of the membrane can be
determined by any experiment in which the membrane tension changes while its area is
measured In the simple example of a spherical balloon tension can be computed from the
inflating pressure and the measured radius the latter also yielding the surface area Ignoring for
now the thermal-induced fluctuations in a real cell membrane (ie assuming the cell to be at zero
temperature) the calculations become particularly simple Furthermore we will consider cells
for which the cytoplasm can be considered to fluid-like having no elasticity We return to
address both issues shortly
Osmotic swelling
Perhaps the simplest method to inflate the cell and measure the membrane elastic properties is to
cause the cell to swell by changing the osmolarity of the external fluid and simultaneously
monitoring the change in cell volume The change in transmembrane pressure mirrors the
24
CHAPTER 21 CELL MEMBRANE MECHANICS AND ADHESION copyRD Kamm 4615
change in osmotic pressure brought about by successive additions of a solute to which the
membrane is impermeable For ions and small molecules the osmotic pressure π can be
calculated from the vant Hoff equation
π = RT sum Ci (247)
i
where Ci are the molar concentrations of all solutes to which the membrane is impermeable For
larger molecules such as proteins their contribution to osmotic pressure is much larger than
indicted by this equation
Consider for example a spherical cell expanded osmotically so that the internal
hydrostatic pressure relative to external pressure is pc Microscopic examination yields a value
for the cell radius Rc Using these values in combination with Laplaces law [eqn (227)] gives
us the tension in this state and eqn (24) provides its relationship to the extensional modulus
p R Δ A
N = c c = Ke (248) 2 A0
The observed change in radius allows calculation of ΔA In practice identification of the reference state at zero pc is problematic due to the presence of thermal fluctuations but if Ke can be assumed constant for relatively small changes in area it is possible to extrapolate back to the zero-stress state from two measurements at elevated pc [Example red blood cell] Micropipet aspiration
One of the first methods used to measure the extensional modulus of the cell membrane involved
drawing a cell slightly deflated into a micropipet simultaneously monitoring the dimensions of
the cell and the pressure in the micropipet (Daily Elson et al 1984) Since on the time scale of
the experiment the volume of the cell could be assumed constant the shape change due to
aspiration of the cell causes increases in both internal pressure and surface tension both of which
are assumed spatially uniform Once the tension is large enough (or the temperature low
enough) to dampen the amplitude of any thermal fluctuations the cell can be treated assuming
that membrane extension is the dominant means by which the pressure drop across the
membrane is balanced [For further discussion on the thermal fluctuations and the relationship
between micropipet pressure and intracellular pressure see Daily and Evans and Rawicz Phys
Rev 1990 See also figure on p 199 of Boal Example the two regimes in membrane stiffness]
For the situation shown in Figxx the cell is drawn into the micropipet to the point at
which the portion of the cell external to the cell is spherical of radius Rc With the assumptions
25
CHAPTER 21 CELL MEMBRANE MECHANICS AND ADHESION copyRD Kamm 4615
stated above the (uniform) pressure within the cell can be related to it surface tension (assumed
uniform) and the radii of curvature of the main body of the cell Rc and the portion inside the
pipet a using Laplaces law [eqn (227)]
pc = 2N Rc = minus Δp + 2N a (249)
where pressures are referenced to the external ambient pressure Reorganizing to solve for
surface tension we obtain
ΔpN = (250)
⎛ 1 1 ⎞ 2⎜ minus ⎟
⎝ a Rc ⎠
The surface area corresponding to a given N is obtained from geometry summing the membrane
surface areas of the cylinder and hemisphere inside the micropipet and the truncated spherical
surface outside yielding for the areal strain the approximate expression
[(a R )2 (a R )3
Δ c minus c cong
]ΔLA
A 2a
Fig xx Micropipet aspiration of a neutrophil
This relationship between N and ΔAA can be used to calculate the area expansion modulus
Eh AK 0
e = = N 2 1( minus ν ) ΔA
where the expression involving Youngrsquos modulus assumes the membrane to be isotropic and
homogeneous The relationship could however be non-linear in that the value of Ke may vary
with the degree of area expansion a linear relationship between N and ΔA yields a constant value for Ke
It is important to note that neither of these approaches osmotic inflation or micropipet aspiration provides us with any information on the bending modulus To be precise bending
26
CHAPTER 21 CELL MEMBRANE MECHANICS AND ADHESION copyRD Kamm 4615
does play a role in the micropipet experiments but the effects are so small as to be negligible and are typically ignored That is not to say that bending is always negligible however as discussed next
Monitoring thermal fluctuations in the membrane
When a cell or lipid vesicle is observed floating free unattached to a substrate it can be seen to
exhibit time-dependent undulations as a result of collisions with the surrounding molecules
undergoing thermal motion In the case of a lipid vesicle with diameter in the range of 10
microns these undulations can be readily observed microscopically In smaller cells such as red
blood cells the motions can be inferred from the flickering phenomenon associated with the light
interference as the cell thickness changes (Zeman Engelhard et al 1990) Since the amplitude of
the membrane undulations depends on the stiffness of the membrane to bending and its surface
tension it is reasonable to expect that measures of this amplitude can be used to infer the
membrane elastic parameters In order to illustrate the method while avoiding some of the
algebraic complexity consider undulations in a flat membrane with significant bending stiffness
and a constant surface tension The relationship between the motion and the elastic properties
can be found by considering the total energy of the membrane obtained by summing the
energies per unit area from eqns (239) and (244) and integrating over the membrane surface
area Am
⎧ 2⎪ K ⎛ 2 2
part 2 u part 2 ⎡ 3 u ⎞
3 N ⎛ partu ⎞ ⎛ int 3 partu ⎞ ⎤⎫
B 3 ⎪
U0hdA = int ⎨ ⎜ 2 + 2 ⎟ + ⎢⎜ ⎟ + ⎜ ⎟ ⎥⎬dA (251) A ⎠ 2
m Am ⎪ 2 ⎝ partx1 partx2 ⎢⎝ partx1 ⎠ ⎝ partx2 ⎠ ⎥⎪ ⎩ ⎣ ⎦⎭
In writing the energy in this form we have omitted the contribution due to shear deformation
consistent with the fluid-like character of a pure lipid bilayer and have taken the surface tension
to be uniform during the deformation In this example membrane surface area changes only as a
result of fluctuations from the mean [u3(xxx2) = 0] configuration that is we now ignore the
contribution due to changes in intermolecular spacing and only consider changes in the area
projected onto the x1-x2 plane
It is convenient to use the method of Fourier transforms to represent the undulations of a
membrane normal to the x1-x2 plane which in two-dimensions leads to [see also class notes on
bending of cytoskeletal filaments alternatively use Fourier series representation]
A A
u3 (x) = u3 (x1 x2 ) = 2 intexp(iq sdot x)b(q)dq =
2 int exp(iq 4 1x1)exp(iq2 x2 )b(q1q2 )dq1dq
π 4π 2
(252)
27
CHAPTER 21 CELL MEMBRANE MECHANICS AND ADHESION copyRD Kamm 4615
where qα = 2π λα is the wavenumber of the particular mode and b(q) is the continuous analogue of the discrete coefficients that multiply each mode in a Fourier series representation
Here the algebra gets complicated so only the results of the analysis will be presented however
those wishing to see a more complete derivation should see (Boal Mechanics of the Cell
Cambridge University Press 2002) Introducing eqn (352) into (351) yields
1 ⎛ A ⎞2
int U q 40hdA = ⎜ ⎟ int (
KB + Nq2 )b(q)b(q)dq (253)2 2 ⎝ π ⎠
where b(q) is the complex conjugate of b(q) Now we invoke a previous result that at equilibrium energy is equally distributed among the various modes and that each mode has an
average energy of kBT2 Taking the ensemble average of eqn (353) and equating the energy of
each mode represented in the result to kBT2 (by the equipartition theorem) leads to
k Aq)b q) = BT
b( (K q4 2 (254)
B + Nq
This is a useful result in itself demonstrating that all modes tend to be suppressed as temperature
falls or as bending stiffness or surface tension rise In addition it shows the tendency for higher
modes to be of smaller amplitude But this equation has further value in that it can be used to
obtain a direct expression for the change in apparent area of a membrane as tension increases
Consider the true surface area of a membrane A represented as the sum of its projected
area and the additional area associated with thermally-induced undulations
⎡ 1 ⎛ 2⎤u ⎞ 2 part ⎛ partu ⎞
A = int dx + ⎢ 3 3 2
int ⎜ ⎢⎝ partx 2 ⎟ + ⎜
⎠ ⎝ partx 2 ⎟ ⎥dx (255)⎠ ⎥
⎣ 1 2 ⎦
Isolating the term representing the area reduction due to thermal fluctuations expressing u3 in
terms of its Fourier transform and taking the ensemble average of the result leads to
1 ⎛ A ⎞2
A minus int dx = ⎜ ⎟ int q 2 b(q)b(q) dq (256)2 ⎝ 2π ⎠
Combing eqn (254) from above with this expression yields
28
CHAPTER 21 CELL MEMBRANE MECHANICS AND ADHESION copyRD Kamm 4615
A minus int dx
kBT dq kBT dq2
= A 8π 2 int =
N int (257)
+ KBq 2 8π 2 N + KBq 2
where in writing the last term we have introduced the relations dq = dq2dθ 2 and int dθ = 2π By a simple substitution z = q2 + (N KB )the integral can be evaluated We do so however
between specified limits on the assumptions that the range of possible wavenumbers is restricted
by the size of the membrane on one hand (q = (πA12)) and the distance between individual lipid molecules on the other (q = πlm) Integrating between these limits results in
⎛ π 2 N ⎞
int dx 2 +A ⎜ ⎟ minus k T l K
= B ln⎜ m B ⎟ (258)A 8πKB ⎜ π 2 N ⎟
⎜ + ⎟ ⎝ A KB ⎠
If we use the area reduction at zero tension as a reference and increase the area from that
condition by progressively increasing membrane tension as in a typical experiment we finally
obtain an expression relating the change in area to the change in tension
⎛ NA ⎞ 1 + A dx A dx ΔA minus int minus ⎟ k ⎛ NA
int k ⎜equiv minus = BT π 2 K
ln ⎜ B T ⎞ 2 ⎟ cong B ln 1 + (259)
Nl ⎜ ⎟A A A 8π KB ⎜ 1 + m ⎟ 8π KB ⎝ π 2 KB ⎠ N = 0 N ⎜ 2 ⎟⎝ π K ⎠ B
where we have used the assumption supported by typical values found from different
experiments that (Nl2 m ) (π 2KB ) ltlt 1
You should recall that this solution was obtained on the assumption that the actual area
of the membrane remained constant and that the reduction in projected or apparent area resulted
from the undulations being progressively smoothed out Once the undulations are eliminated
the only means by which the projected area of the membrane can further increase is by an
increase in the inter-molecular spacing ndash an increase in the actual membrane area When this
occurs we expect to see a transition to the behavior discussed at the beginning of this chapter a
result expressed as
29
CHAPTER 21 CELL MEMBRANE MECHANICS AND ADHESION copyRD Kamm 4615
Fig yy Plots of tension vs normalized surface area for lipid vesicles of different composition Evans amp Rawicz 1990
ΔA N = (260)
A Ke
Thus we have two limiting predictions one for low tensions eqn (259) and another for high
tensions eqn (260) and the transition from one behavior to the other should occur when the
two expressions for ΔAA are of the same magnitude This is supported by experiment (Fig yy) and the results in the two regimes provide a means for estimating the two moduli Ke and KB
30
CHAPTER 21 CELL MEMBRANE MECHANICS AND ADHESION copyRD Kamm 4615
Before leaving this analysis there is one further result that is useful to state although the
derivation is again somewhat involved Once we have the solution for the undulations at a
given level of tension and for given membrane properties the ensemble average displacement
normal to the plane of the membrane can also be computed with the result
⎞
u2 k ⎛= BT NA
3 ln ⎜ 1+ ⎟ (261)4πN ⎝ π 2KB ⎠
Again this supports our intuition that the undulations will be suppressed at low temperature or
high tension And in the limit as N rarr 0 a binomial expansion of the natural log term shows that
the effect of tension drops out and the magnitude of the undulations varies inversely with the
bending stiffness
315 Membrane Fluid Mechanics
Early studies of protein diffusion notably the work of Saffman (Saffman 1976)
examined protein diffusion using an approach akin to that of Einstein in three dimensional space
thereby reducing the problem to one of solving for the mobility b in the equation for diffusivity
D = kBTb (262)
Calculation of the mobility is influenced by the viscous drag on the portion of the protein within
the membrane but also on to the intra- and extracellular domains as well The solution of
interest here is the one applicable in the limit of small μeμm where μe and μm are the external and
membrane viscosities respectively leading to
kBT ⎛ hμm⎞
D = ⎜minusγ + ln ⎟ (263)4πμmh ⎝ aμ e ⎠
where h is the membrane thickness a the radius of the protein (assumed cylindrical) and γ is
Eulers constant (=05772) Membrane viscosity has been estimated from lipid diffusion to be
~2 poise (McCloskey and Poo 1984) When finite mobility is achieved as a result of a finite
domain as for example a circle of radius R the corresponding result is
31
CHAPTER 21 CELL MEMBRANE MECHANICS AND ADHESION copyRD Kamm 4615
k ⎛ 1 D = BT R ⎞ log minus (264)
4πμh ⎝ a 2 ⎠
While this represents a useful point of departure measurements of lateral diffusion in a
membrane have demonstrated a more complex behavior Fluorescence recovery after
photobleaching (FRAP) has enabled the direct tracking of membrane proteins labeled with
fluorescent antibodies More recently single particle tracking methods have been developed
using colloidal gold or a fluorescent particle in conjunction with digital microscopy as well as
controlled movements using microbeads manipulated by an optical trap
From experiments such as these a new picture has emerged While the lateral diffusion
of lipids and a small fraction of trans-membrane proteins satisfy the general form of Saffmans
predictions the predicted diffusivity is greater than that observed experimentally and agrees with
experiments only when a membrane viscosity of 100 poise is used This might be due to the
presence of other proteins in the membrane (Kucik Elson et al 1999) Experiments also show
that many proteins appear to diffuse freely only in small domains typically measuring from 200shy
600 nm remaining confined to these domains for periods on the order of tens of seconds To
explain this behavior the membrane skeleton fence model was proposed (Kusumi Sako et al
1993) in which a membrane-associated matrix constrains the movement of proteins outside of
the domains defined by the matrix filaments Diffusion beyond these barrier filaments can occur
either as a result of random thermal motions of the transmembrane protein matrix filaments or
both or by transient breaks in the filaments Confinement of proteins may play an important role
in rapid and selective signaling Rapid directed motion of membrane-associated proteins has
also been observed and is likely due to active transport by an intracellular actin- or microtubule-
based motor
316 Cell Adhesion
This section deals with how cells adhere to their surroundings and through these sites of
adhesion how they interact with the external world We begin by summarizing the different
types of adhesion their functions and the molecules involved Next we provide a brief
description of the adhesion complexes found in cells and the role of each type Then the
theories that provide a quantitative description of adhesion between single receptor-ligand pairs
are reviewed in the context of the material presented in Chapter xx including the role of thermal
fluctuations Through these theoretical models both the static and dynamic states of adhesion
can be explored for single molecule pairs then for adherent cells Next we develop the different
32
CHAPTER 21 CELL MEMBRANE MECHANICS AND ADHESION copyRD Kamm 4615
approaches that are used to study the adhesion of cells based either on thermodynamics or
mechanics Methods for the measurement of adhesion strength are described providing
estimates for the force that a cell can exert on its surroundings Various examples will be
presented but the adherence of leukocytes to the endothelium and the role of adhesion in cell
migration will receive special attention
Functions of adhesion
Adhesion has been found to be an essential process necessary for a variety of fundamental
cellular functions
bull Structural integrity Adhesion helps to maintain the overall structural integrity of the
tissue in muscle for example it provides the means of force transmission from the cells
to the surrounding matrix to allow contraction In non-contractile cells it still provides
the needed mechanical coupling to the surrounding tissue necessary for a variety of
cellular functions
bull External sensing Adhesion provides a means by which the cell can sense and
subsequently respond to its surroundings Forces transmitted directly to the cell
membrane or to the cytoskeleton via transmembrane proteins may trigger a variety of
biochemical reactions within the cell as we shall see later in Chapter 33
bull Migration Cell-matrix adhesion is an essential element in cell migration a cell propels
its way through tissue or along a surface through a process involving adhesion
contraction and release also described in Chapter 33
bull Regulation of transport Sites of cell-cell adhesion are often important in the regulation
of transport across a cell layer such as in the case of an epithelium or endothelium
bull Communication Sites of mechanical coupling often provide a means of cell-cell
communication as in the case of gap junctions which offer a pathway for the diffusion
of ions and small molecules between adjacent cells
Adhesion molecules
Cells adhere to their surroundings or to an artificial substrate via a wide variety of different
proteins that can be classified into five major families integrins selectins cadherins
immunoglobulins and transmembrane proteoglycans (Table 1) In terms of their mechanism of
attachment to other cells or the external matrix these can be classified as either homophillic ndash
binding to like molecules heterophillic ndash binding to unlike molecules or those that bind to other
cells through an extracellular linker molecule
Integrins one of the largest class of adhesion molecules are primarily used to attach cells
to the extracellular matrix or the basal lamina but are also present in some cell-cell adhesion
33
CHAPTER 21 CELL MEMBRANE MECHANICS AND ADHESION copyRD Kamm 4615
complexes They typically bind to the matrix via the RGD amino acid sequence (arginine
glycine aspartic acid) but can also contain other binding motifs Integrins are heterodimers in
that they always contain an α and a β subunit with the different isoforms determining the specific ligand to which the integrin binds Two specific types of adhesion focal adhesions and hemidesmosomes often contain integrins and the attachments they make can at times be stable but at other times transient so as for example to mediate cell migration The force of adhesion of a single integrin-ligand bond has been measured using atomic force microscopy and found to be in the range of 30-100 pN (Lehenkari and Horton 1999) with a relatively low binding affinity in the range of K ~ 10-6
D to 10-8 molliter By comparison typical cell-surface receptors bind with an affinity in the range of 10-9 to 10-11 molliter Integrins also play an important role in signaling since extracellular integrin binding is known to influence cytoskeletal morphology as well as the state of cell differentiation Adhesion molecules in the selectin family also tend to form transient bonds and are important in leukocyte adhesion and extravasation the migration of the leukocyte through the endothelium and into the tissue Consequently they tend to be found in cells of the circulation and are present both in leukocytes and endothelial cells and are instrumental in adhesion between these two cell-types during leukocyte rolling
Family Location andor Ligands Comments
function recognized
integrins focal adhesions (E) fibronectin relatively low
hemi-desmosomes collagen laminin affinities
leukocyte immunoglobulins (KD~ 10-6-10-8
(spreading) (I) actin filaments molliter)
adhesion primarily
cell-matrix adhesion
but also in some
cell-cell adhesions
selectins circulating cells and carbohydrates require Ca2+
endothelial cells
rolling adhesion
Ig superfamily important in integrins
(immunoglobulin) immune response homophillic
cadherens adherens junctions (E) homophillic require Ca2+
desmosomes (I) actin
34
CHAPTER 21 CELL MEMBRANE MECHANICS AND ADHESION copyRD Kamm 4615
filaments
intermediate
filaments
transmembrane fibroblasts (E) collagen bind various
proteoglycans epithelial cells fibronectin growth factors
(I) actin such as FGF
filaments
heterophillic
Table 1 Cell adhesion molecules and their characteristics
While both integrin and selectin binding is mediated by Ca2+ adhesion via the
immunoglobulin (Ig) superfamily of proteins is Ca2+ independent Some of the most prominent members of this family are the N-CAMs (Neural cell adhesion molecules) and ICAMs (Intracellular cell adhesion molecules) These tend to undergo homophillic bonding but some also bind to members of the integrin family
Cadherens are often expressed in the same cells as the selectins but form much stronger bonds and therefore play an important role in maintaining cell integrity Because of these attributes cadherens are the primary adhesion proteins in desmosomes and adherens junctions the major structural contacts cells form with other cells or the basil lamina These also form homophillic bonds by a Ca2+ dependent mechanism and mediate selective bonding between adjacent cells Cadherens are relatively short as compared to other adhesion molecules being
about 700-750 amino acid residues in length
Types of adhesion complexes
Cells have developed a variety of specialized adhesion complexes each utilizing one or more of
the adhesion molecules of Table 1 and each serving a specific purpose Typically the cell-cell or
cell-surface spacing is in the range of 10-20 nm but this is highly variable ranging from less than
1 nm when controlling transport to over 100 nm in regions where tight control is unnecessary
Below we describe the different types of junctions and where important for function their
mechanical characteristics
Gap junctions Cells need to communicate with their neighbors for a variety of reasons For
example cardiac myocytes transmit signals from cell to cell in order to maintain a synchronous
35
CHAPTER 21 CELL MEMBRANE MECHANICS AND ADHESION copyRD Kamm 4615
wave of contraction This is typically accomplished by providing a pathway for ions and small
signaling molecules between cells called gap junctions (Fig 3110) These minute channels are
typically comprised of a collection of six connexin proteins that cluster together in cylindrical
fashion forming a minute channel that passes molecules and ions less than about 1200 to 2000
MW (15-2 nm) Transport through these channels is regulated and their permeability drops in
the presence of high Ca2+ concentration as when a cell membrane is ruptured or with low pH
Cyclic AMP acting as a second messenger can be exchanged between cells therefore gap
junctions provide a metabolic linkage between neighboring cells and provide a means by which
hormonal stimulation of just one cell can be transmitted to others
Adherens junctions Adherens junctions are belt-like structures that can be though of as the
structural weld that holds two cells together (Fig 3110) Because of their structural role
these junctions formed by homophilic bonding between proteins in the cadheren family are
anchored securely again via the adaptor proteins α β γ-catenin to the cytoskeleton
Desmosomes and Hemidesmosomes If the adherens junctions are the continuous welds between
cells desmosomes are the spot welds Again these serve primarily a structural purpose
joining two neighboring cells via a complex consisting of a dense plaque on the intracellular
sides of both cells extending 15-20 nm into the cell and consisting of a variety of proteins that
attach to keratin filaments part of the intermediate filament network Hemidesmosomes have
similar intracellular structure but attach instead to the basal laminae Based on their different
extracellular attachment sites desmosomes typically link to other cells via cadherens whereas
hemidesmosomes adhere via a type of integrin Both are commonly found in epithelial cells
36
CHAPTER 21 CELL MEMBRANE MECHANICS AND ADHESION copyRD Kamm 4615
Fig 3110 Schematic showing the different types of cell junctions present in an epithelial cell as found in the small intestine Tight junctions near the apical surface essentially prevent the passage of all molecules The spot desmosomes and adherens junctions provide for cell-cell anchoring and the hemidesmosomes for anchoring to the basal lamina Gap junctions provide a means for communication between neighboring cells [Reproduced from Lodish et al Molecular Cell Biology 2000]
Junction type Function Extracellular or Intracellular
adjacent cell attachment
attachment
Adherens structural cell-cell or cell- ECM proteins or actin filaments
matrix cadherins in
adjacent cell
Desmosome structural cell-cell cadherin intermediate
filaments
Hemidesmosome structural cell-matrix basal lamina via intermediate
integrins filaments
Focal adhesions structural cell-matrix ECM proteins actin filaments
via integrins
Tight junction regulate transport between homophillic binding between the
cells and along cell transmembrane proteins occludin or
37
CHAPTER 21 CELL MEMBRANE MECHANICS AND ADHESION copyRD Kamm 4615
membrane claudins
Gap junctions cell-cell communication channels formed by connexin
via ion and small molecule subunits
exchange
Table 2 Adhesion complexes
Focal adhesions A second means by which cells attach to the extracellular matrix is through
focal adhesions These serve a similar function to the hemidesmosomes and share a common
linkage via integrins to the ECM but are attached on the intracellular side instead to the actin
filaments of the cytoskeleton Actin filaments converge at the site of focal adhesions forming
stress fibers strong actin bundles that attach to the β-subunit of the integrins via adapter
proteins such as actinin vinculin and talin Focal adhesions are instrumental in cell migration
and for this purpose need to be easily formed and disrupted as the cell moves forward Release
or de-adhesion of cells is often mediated by a class of peptides called dis-integrins that
competitively bind to the RGD site used by integrins to attach to a variety of matrix molecules
Tight junctions Control of transport is generally mediated by tight junctions that form an
intricate network of seams between two cells (Fig 3111) As their name implies these are the
tightest of the cell-cell junctions and the gaps they leave are often small enough to exclude even
the smallest ions and molecules Formed by homophillic binding between the transmembrane
proteins occluding and claudins tight junctions allow epithelial cells to perform their critical role
in transepithelial transport and provide for maintenance of differences in concentration between
the apical and basal surfaces of these cells Since occludins are not capable of forming rigid
structural bonds with the cytoskeleton they are most often associated in a junctional complex
with adherens junctions or desmosomes that fulfill the structural needs of attachment
38
CHAPTER 21 CELL MEMBRANE MECHANICS AND ADHESION copyRD Kamm 4615
Fig 3111 Tight junctions in an epithelial cell shown schematically (a) in a freeze fracture replica (b) and in a transmission electron micrograph (c) [Reproduced from Alberts et al 1994]
Fig 3112 Two types of bond that attach a cell to the extracellular matrix by means of clusters of integrins On the extracellular side integrins bind to the matrix proteins fibronectin and laminin Inside the cell they attach to the cytoskeleton via adaptor proteins to either actin filaments (focal adhesions) or intermediate filaments (hemidesmosomes) [Reproduced from Lodish et al Molecular Cell Biolology 2000]
Non-specific binding
Cells can adhere to their surroundings by either non-specific or receptor-ligand (specific)
bonding Though both mechanisms are likely active in most situations as we will see receptorshy
39
CHAPTER 21 CELL MEMBRANE MECHANICS AND ADHESION copyRD Kamm 4615
ligand bonding is the stronger of the two by a considerable margin and is therefore the most
relevant biologically In situations for which either the receptors or their ligands are not present
however such as might be the case in certain in vitro experiments non-specific binding can be
important as well
There are essentially three major forms of non-specific attractions to consider
bull Van der Waals ndash These attractive forces arise due to charge interactions in polar
molecules They tend to dominate among the non-specific mechanisms at
intermediate distances around 20-25 nm [see Boal]
bull Electrostatic ndash These interactions can be either attractive or repulsive depending
on the sign of the surface charges and are particularly important during the
approach of two cells since the glycocalyx has a high negative charge density
bull Steric ndash These forces arise due to the steric exclusion of two molecules as they are
brought into close contact In the case of cell-cell interactions steric repulsion is
due to the compression of the two glycocalyx layers and the tendency to resist
compression resulting from osmotic effects and the elasticity of the layer Steric
forces tend to dominate for small separation distances lt 10 nm
In combination these effects combine to produce a net attractive force per unit area of
about 100 Pa at a separation distance of about 25 nm
Adhesion by means of receptor-ligand binding
We can use the analysis of Chapter xx to estimate the strength of a receptor-ligand bond and
based on typical values for bond density calculate the corresponding strength of adhesion
between two cells or between a cell and a surface Recall that the application of force to a
receptor-ligand bond modifies the dissociation rate constant for the binding reaction This effect
can be modeled in several ways but the result obtained by Bell ((Bell 1978)) suggests the
following exponential form for the dissociation rate
0 ⎛ γf ⎞ 0 ⎛ γσ ⎞ kminus = kminus exp⎜ ⎟ = kminus exp⎜ ⎟ (265)
⎝ kBT ⎠ ⎝ NC kBT ⎠
where k0minus is the unforced dissociation rate constant γ is a factor with the units of length that
corresponds roughly with the distance separating the bonded pair at equilibrium NC is the concentration of bonded complex and σ is the average bond force per unit area To determine
40
CHAPTER 21 CELL MEMBRANE MECHANICS AND ADHESION copyRD Kamm 4615
the rate of change of the concentration of bonded pairs one must solve the following rate equation describing the competition between bond formation (first term) and destruction (second term)
dNC ⎛ γσ ⎞
cong k+ (NR minus NC )(NL ) minus kminus NC = k+ (N minus )( 0R NC NL ) minus kminus NC exp⎜ ⎟ (266)
dt ⎝ NC kBT ⎠
where NR and NL are the concentrations of receptors and ligands respectively and we have
assumed that NCltltNL and that all bonds are stressed equally At equilibrium dNCdt=0 and if
the force applied to detach the cell (equal to the average bond stress σ) is increased
incrementally from zero NC will progressively fall to a new equilibrium value At sufficiently
high levels of force however increasing σ further eventually gives rise to a situation in which equilibrium can no longer be achieved through a reduction in NC At that point NC tends toward zero and the cell separates from the surface to which it was attached It can be shown that this
occurs when (Bell 1978)
k 0
α c exp(α + c + 1) = N
k 0 L (267)minus
σ
where α minγ c equiv and σmin is the minimum stress needed to cause detachment For a wide
NRkBT
range of conditions eqn (267) has the approximate solution
⎛ k0 + ⎞
α c cong 07 ln L (268)⎜ 0 N ⎟⎝ kminus ⎠
so that the critical stress for detachment can be expressed as
N 0
σ cong 07 C kBT ⎛ k ⎞ ln⎜
+ min N ⎟ (269)
γ ⎝ k0 L minus ⎠
where NC is determined from setting eqn (266) to zero under these critical conditions
Thermodynamic approach to cell adhesion
Although we focus here on the mechanical aspects of cell adhesion this process can also be
viewed from a thermodynamic perspective In this approach adhesion is considered in terms of
the change in energy specifically the Gibbs free energy G associated with all the individual
receptor-ligand interactions as well as the various non-specific forces of attraction or repulsion
The adhesion of a cell to a given surface then can be viewed as an equilibrium state determined
41
CHAPTER 21 CELL MEMBRANE MECHANICS AND ADHESION copyRD Kamm 4615
by minimization of the free energy If in undergoing a transition from a free state to an adherent
state the system represented by the cell and surface experiences a reduction in free energy ie
ΔGlt0 then adhesion will occur and the equilibrium state of adhesion will be determined by that with the minimum in free energy or the largest value of -ΔG While this approach ignores
many of the subtleties of the interactions and like the analysis above assumes that all receptorshy
ligand interactions are identical from an energetic point of view it is useful in providing some
simple insights as seen in the next two examples
Example Comparison of specific and non-specific adhesive forces Non-specific bonding due
to the combined effects of van der Waals electrostatic and steric forces result in an attractive
stress of approximately 100 Pa Receptor-ligand bonding give rise to forces that can be
estimated from the change in free energy f ~ to 4x10⁻⁴ dynbond = 9x10-11 to 4x10⁻⁹ ΔGr~9x10⁻⁶ Nbond where f is the force required to break the bond and r is a measure of the distance the bond stretches before it breaks Using a typical density of the receptor-ligand complex NC of ~1012-1015 bondsm2 gives a total bond stress of N 1
C x f ~ 9 x 10 to 4x10⁶ Pa The above kinetic approach to estimating bond strength [eqn (269)] gives a value approximately half of that from this equilibrium approach In either case however the conclusion remains the same non-specific binding can under certain circumstances be important since it is comparable to the lowest estimates of receptor-ligand-mediated bond strength but not surprisingly the latter is quite likely to dominate in nearly all practical situations
Example JKR theory for the equilibrium area of adhesion between a cell and substrate
It is well known that cells tend to take on a more flattened shape as the substrate to which they
are attached becomes more strongly adhesive either by coating with a more attractive ligand or
by increasing the concentration of ligand bound to the substrate Conversely less adhesive cells
round up and become more spherical These observations can be explained with the help of a
simple scaling analysis on the assumptions of small deformation of a linear elastic cell
Let the cell be modeled as a homogeneous elastic sphere with elastic modulus E and
initial radius R (Fig 3113) It is then brought into contact with a surface to which it adheres
As the cell adheres it attains a lower energy state characterized by an adhesion energy per unit
area J Formation of a flat adhesion surface however requires deformation within the elastic
cell and an associated increase in the stored elastic energy In Chapter 31 we showed that the
stored elastic energy per unit volume can be written
UE asymp int τεdV asymp int 1 2 Eε 2dV (270)
Vc Vc
42
CHAPTER 21 CELL MEMBRANE MECHANICS AND ADHESION copyRD Kamm 4615
Strain inside the cell can be approximated as the displacement of the cell surface δ divided by the characteristic distance within the cell to which the deformations penetrate a distance that scales with the lateral extent of the contact region 2a so that ε prop δ a where it can easily be shown from the geometry that a 2 asymp 2δR so that ε prop δ R Combining and dropping all numerical constants we obtain the following scaling approximation
δUE prop E ( )δR
3 2 (271)R
An expression for the total energy of the system then can be written
U prop minusJa2 + Eε2a3 prop JδR + Eδ 5 2R1 2 (272) The equilibrium state corresponds to the value of δ having the minimum energy obtain from
partU prop minusJR + Eδ 3 2R1 2 (273)
partδ so that
23 1 3 ⎛ JR12 ⎞ ⎛ JR2 ⎞
δ prop ⎜ ⎟ and a prop ⎜ ⎟ (274)⎝ E ⎠ ⎝ E ⎠
The exact solution to this problem yields the result
⎡ ) 1 3 2 1( minusν 2 ⎤ 9πJR
a = ⎢ ⎥ (275)⎢ 2E ⎥⎣ ⎦
43
CHAPTER 21 CELL MEMBRANE MECHANICS AND ADHESION copyRD Kamm 4615
Elastic modulus E adhesion energy per unit area J
2a
Fig 3113 Experiments to determine the contact area of an iminobiotin functionalized agarosebead on a glass coverslip in water Top Schematic of adherent bead Bottom Results for a range of bead radii Solid line is a fit to the date which obeys the power law a prop R23 consistent with the prediction of JKR theory eqn(276) [Reproduced from (Moy Jiao et al 1999)] This can be compared to the result obtained from a more rigorous analysis
⎡9πJR 2(1minus ν 2 ) 13 ⎤
a = ⎢ ⎥ (276)2E⎢ ⎣ ⎥⎦
and to experimental data obtained from spherical beads made from a 4 agarose gel (Fig 3113)
Models for receptor-mediated adhesion
In Chapter x and in the preceding text we discussed the energetics of bond formation and release
as well as the effect of applied force in altering the energy landscape of the bonded pair and
thereby the rate constants for bond kinetics That analysis has obvious implications to the
44
CHAPTER 21 CELL MEMBRANE MECHANICS AND ADHESION copyRD Kamm 4615
adhesion of cells to substrates the surrounding extracellular matrix and other cells Here we
extend that analysis in the specific case of whole cell adhesion In doing so it will be important
to consider such factors as the distribution type and density of receptor-ligand bonds or
potential bonds and the elastic properties of the structures to which they are anchored On the
intracellular side this involves the series of couplings that link the receptor to the cell In the
simplest case this might simply be a link to the lipid bilayer if the receptor has no intracellular
connections More typically especially for couplings with a structural role it involves a series
of proteins ultimately linking the receptor to the cytoskeleton
The typical setting in vivo is one in which cells adhere to other cells or to the extracellular
matrix Adhesions are more easily probed however through in vitro experiments (described
below) where cell adhesion more often occurs to an artificial substrate mediated through one of
several extracellular proteins that are used to coat the surface Generally either collagen or
fibronectin is used Cells are often adhered to these substrates but to produce a more controlled
environment rigid beads are sometimes coated with the appropriate receptors so that one specific
receptor-ligand interaction can be probed While these systems are useful as models of certain
adhesion phenomena it is important to recognize in the interpretation of these experiments that
when bound to a rigid substrate or bead the binding proteins cannot freely diffuse as they would
in a more natural environment In particular the formation of focal adhesions would not occur in
bead-substrate experiments because the receptors would be constrained from aggregating
It is instructive to begin this discussion with a consideration of a single adhesion bond
for example one linking the actin matrix of the cytoskeleton to a β1 integrin and the integrin
receptor binding to the extracellular matrix beyond the cell membrane (Fig 3114) If the bond
is stressed as for example if the cell experiences a force relative to the ECM it will at first
stretch an amount dictated by the level of force in the bond and the stiffness of the complex
Each bond as well as each protein in the bond complex can be thought of as having a certain
stiffness giving rise to a picture in which several springs are considered connected in series
Forces acting on the adhesion complex are transmitted via this series of bonded proteins between
the CSK and the ECM producing local deformations and stresses in the corresponding matrices
that decay with distance from the adhesion site On the intracellular side these forces are
transmitted via a complex involving vinculin α-actinin paxillin and talin Attachment to the
extracellular matrix is mediated by an RGD sequence (in fibronectin for example) which in turn
has binding sites for collagen and fibrin If the force is sufficiently strong above a certain
threshold value F0 say and applied for a sufficiently long time the bond might be severed (deshy
couple) Typical values of this threshold force lie in the range of 10-100 pN (Evans and Ritchie
1997) but depend as well on the rate at which the force is increased Under more rapid
forcings the threshold is high compared to when the force is increased slowly This simply
45
CHAPTER 21 CELL MEMBRANE MECHANICS AND ADHESION copyRD Kamm 4615
reflects the fact that detachment is a stochastic process and that at any given level of force there
exists a finite probability of detachment and this probability increases with time
Fig 3114 One type of attachment linking the intracellular actin matrix to the extracellular matrix via an integrin complex that involves in addition vinculin α-actinin paxillin and talin (Reproduced from Lodish et al Molecular Cell Biolology 2000)
We need also to consider that in equilibrium a fraction Φ = K(1+K)-1 (where K is the
equilibrium constant) of the receptors will be bound at any given time and that the receptorshy
ligand complexes are continually cycling between the bound and unbound states characterized
by their respective rate constants
On a larger scale numerous adhesion sites typically act in parallel each contributing
some amount to the total adhesion force If the force transmitted by each single adhesion
complex is F and the density of adhesion sites (per unit membrane area) is NC then the stress
acting on the cell is the product F NC This gives a somewhat false impression however as it is
unlikely that each adhesion complex carries an equal force Put another way there exists a local
stress τ that can be thought of as the product of the average force per bond times the bond
density This stress is typically non-uniform In the adhesion of a cell to a flat substrate the
bonds near the periphery of the contact zone determine the strength of the cell against
detachment and when the cell is subjected to a detaching force the stresses are concentrated in
46
CHAPTER 21 CELL MEMBRANE MECHANICS AND ADHESION copyRD Kamm 4615
this peripheral region as depicted in Fig 3115 In the vicinity of the edge of adhesion several
factors will influence the stress distribution including the mechanical properties of the membrane
(in particular the bending stiffness KB) the receptor density the spring constants of the bond
and the bond strength
N
Region of adhesion
x1
Fig 3115 Schematic model of a cell membrane being detached from a substrate by application of a tension force N The membrane is free to the left of the dash-dot line and adherent to the right Forces and moments are transmitted through the membrane which adheres to the membrane through receptor-ligand bonds represented by a continuous distrubution p(x1)
To illustrate consider the following simple model for an adherent cell being peeled away
from its substrate by a force that generates a tension N in the membrane (Fig 3115)
Deformations in the membrane are described by eqn (223) where it can be shown that the
bending term dominates provided KbL2 gtN where L is the characteristic length in the x1 direction
(due to the small length scales involved) and the external membrane force (p in the membrane
equation) is now the non-uniform stress due to adhesion bonds As a simple first approximation
we take p = k(δminusδ0) with δ-δ0 being the amount of stretch in the receptor-ligand bond springs
and k an effective bond spring constant Recognizing that p approaches zero far from the edge
(see Fig 319) the membrane displacement and the spring displacement are related u3 = δ-δ0
Thus eqn (228) is written
⎛ part 4 u
KB⎜ 3
⎞ 4 ⎟ = NC F = NC ku
⎝ partx ⎠ 3 (277)1
This can be solved directly showing that the distance of separation between the cell membrane
and substrate grows in an exponential fashion with distance Even more simply a scaling
47
CHAPTER 21 CELL MEMBRANE MECHANICS AND ADHESION copyRD Kamm 4615
analysis of eqn (277) in which the term on the left is approximated by Kbu3w4 where w is the
characteristic distance over which u3 varies tells us that the stresses are concentrated in a region
of width
K
w prop B4 (278)
NC k
near the cell periphery Similarly we can estimate that the cell membrane will detach from the
substrate if N gt FoNCw where F0 is a measure of the force in a single bond at the time of bond
rupture and that the rate of peeling can be roughly approximated as the product of the
disassociation rate k -- (bondss) from eqn (265) and the distance between bonds (N -12C )
Although this provides some insight into how the peeling rate depends on the various factors it fails to capture the fact that the cell remains in an equilibrium attached state even for non-zero levels of tension reflecting that even under force a balance can exist between the rates of formation and rupture of receptor-ligand complexes (Ra Picart et al 1999)
It is also of interest to note that in the region near the edge of the attachment zone(x1=0
in Fig 3115) the membrane acts as a beam subjected to a moment due to the applied tension
This moment is balanced by a force couple due to tension in the adhesion complexes right
adjacent to the edge in combination with a compressive stress between the cell and substrate a
little further in In typical situations this compressive stress can approach levels as high as one
atmosphere and can act to effectively smooth the membrane and recruit new attachment sights While using these continuum descriptions it is important to keep in mind the true
discrete nature of the individual bonds represented in the model as a continuous adhesive
surface This is brought to light by a simple calculation in which the characteristic length over
which the applied tension is supported w is compared to the inter-receptor spacing N -12C
Using typical values for the parameters NC = 103 complexesμm-2 k = 10-5 to 10-6 Nm Kb = 1 to 2x10-18 Nm we find that w cong 01 to 03 μm and the inter-complex spacing N minus1 2
C cong 003 μm While it is reassuring to see that w is typically less than the inter-complex spacing the difference is small It is therefore not surprising that the actual process of cell peeling is stochastic in nature occurring in a sequence of more-or-less discrete steps with a velocity of peeling that varies widely from the mean
The interplay between receptor-ligand bonding and membrane stiffness also determines whether a cell will spread over a surface or peel away from it under a given tension Membrane bending stiffness acts to maintain the membrane and substrate within close proximity near the edge of contact (Fig 3115) Spreading can occur only if their separation distance is within the extended length of the receptor ligand bond over a distance comparable to the linear spacing
48
CHAPTER 21 CELL MEMBRANE MECHANICS AND ADHESION copyRD Kamm 4615
between neighboring bonds ( N minus1 2 C ) Under high tension the surfaces rapidly diverge and
spreading is prevented if the tension is sufficiently low receptor-ligand bonding can occur and spreading can occur
Measurements of adhesion
A variety of methods have been used to experimentally determine the strength of adhesion either
of individual receptor-ligand bonds or populations of bonds as in the case of entire cells
Whole cell experiments are more common and typically require less experimental
sophistication The drawback of course is that they provide only for estimates of average
properties and require certain assumptions regarding the distribution of cell-substrate adhesive
stress for interpretation to the level of a single bond Several of these methods are described
next
Centrifugal cell adhesion assays In this experiment cells are allowed to attached to a substrate
then are placed in a centrifuge rotating at speed ω positioned a distance r from the center of
rotation and oriented so that the net centrifugal force is acting to separate the cell from the
substrate Using the arrangement shown in Fig 3116 (right) the acceleration of the cells is 2ω r and the net force acting on a cell of volume Vc is F = (ρc minus ρf )ω 2rVc where the fluid and cell densities are ρf and ρc respectively
Interpreting these results we can make several different assumptions each leading to a different estimate for the maximum force experienced by the binding complex If we simply assume that all receptor-ligand complexes support an equal fraction of the total force F then the force per bond is f = F (πa 2NC ) where NC is the concentration of bond complexes However as the cell tears away from the substrate the edge bonds will break first since these experience the greatest level of force An alternative approach then is to assume that the adhesion complexes around the cell circumference support the entire load leading to the estimate f = F 2( πaN 1 2 ) recognizing that N1 2
C C is the average distance between bonds A somewhatmore accurate value for f might be obtained if we assume that all complexes within the distance w given by eqn (278) support the load In any of these cases once the centrifugal force exceeds some critical limit since the number of receptors supporting the load falls as the region of contact becomes smaller the force per bond increases and the cell will rapidly detach
Stochastic variability also needs to be taken into account however since even under a constant load any single bond has a finite probability of failure under a given level of force The equilibrium state of the cell then should be viewed as one in which the rate of bond formation equals the rate of bond breakage with increasing force having the effect of reducing the
49
CHAPTER 21 CELL MEMBRANE MECHANICS AND ADHESION copyRD Kamm 4615
probability that the bond will remain intact These effects can be addressed using the methods described in more detail in Chapter xx Parallel flow assay Another common method for assessing cell adhesion is to plate the cells onto one wall of a parallel flow chamber subject them to a fluid dynamic shear stress and observe at what flow rate the cells begin to release If we ignore flow details in the immediate vicinity of the cell the shear stress can be estimated from the solution for a fully developed (Poiseuille) velocity profile
3V ⎡ y2
⎛ ⎞ ⎤v(y) = ⎢1minus ⎥ (279)
2 ⎝ ⎠ ⎣ ⎢ h ⎥⎦
so that the shear stress acting on the cell is
⎛ dv ⎞ 6μV τw = μ⎜ ⎟ = (280)
⎝ dy ⎠ h y = minush
and the total force can be estimated as F asymp τw Ac where Ac is the surface area of the cell membrane exposed to the flow Consider as an example a flow of culture medium at a rate of 1 mls through a channel of height 01 cm and width 1 cm If the culture medium has a viscosity close to that of water (μ=001 dyns) the shear stress is obtained from eqn (280)
6 sdot (001dyn sdot s) sdot (1ml s) ( 01 sdot10cm2 )τ dyn cm 2w = = 6 = 06Pa
01cm This corresponds roughly with the level of shear stress experience by endothelial cells in the arterial system If we consider that the cell has a surface area with dimensions roughly 100 μm x 10 μm or about 103 μm2 then the total force acting on the cell is obtained by integrating the shear stress over the area of the apical membrane Assuming that the shear stress is uniform the force is simply the product of shear stress and surface area or about 1 nN in the present example Again interpretation of results from such experiments requires careful consideration of the distribution of forces among the individual adhesion complexes In this situation the cell is likely to peel from the upstream edge in much the same manner as occurs in the cell peeling experiment discussed earlier
50
CHAPTER 21 CELL MEMBRANE MECHANICS AND ADHESION copyRD Kamm 4615
Radial flow and spinning disk assays One disadvantage of the parallel flow assay is that all cells are subjected to essentially the same level of shear stress so the flow rate needs to be incrementally varied in order to determine the level of force required for detachment These two systems using an axisymmetric geometry circumvent this problem by producing an easily characterized radial variation in shear stress In the case of the radial flow assay fluid enters through a central channel and flows radially outward through the narrow gap between two circular plates From conservation of mass the mean flow velocity is given by
QV = (281)
2πrh and sufficiently far from the center (rgtgth) the velocity profile is parabolic as in the parallel flow assay and the shear stress is again governed by eqn (280) using (281) for V Q
ω
(Not to scale)
v
h h
Cell layer rc Ce l l layer rc
r r
Fig 3116 Schematic diagram showing the radial flow assay (left) and the spinning disk assay (right) In the radial flow assay shear stress attains a maximum value near the center and falls with increasing radius r whereas in the spinning disk system maximum shear stress is experienced at large r In the spinning disk assay cells are grown on one disk and the opposite disk is rotated at constant speed Provided the rate of rotation is sufficiently small that inertial effects can be neglected the velocity is purely in the circumferential direction and the profile is linear between the two plates so that the shear stress experienced by the cells can easily be computed as
ωr τw = μ (282)
h
51
CHAPTER 21 CELL MEMBRANE MECHANICS AND ADHESION copyRD Kamm 4615
In both of these cases as in the parallel flow assay the total force is obtained by integrating the shear stress over the cell surface and the distribution of force among the adhesion complexes is weighted toward those located near the upstream end of the cell This can also be seen by consideration of the torque exerted by shear stress on the cell that must be balanced by a nonshyuniform contact stress with the substrate that is greatest near the upstream end Single bond adhesion assays Two other assays provide a means of obtaining estimates for the strength of a single adhesion bond without the need for excessive interpretation These rely on an ability to isolate a small number of bonds or even a single bond and infer bond strength from the step-wise nature of the de-adhesion process associated with breakage of discrete bonds One of these methods employs the atomic force microscope coated with the ligand of an adhesion receptor as shown in Fig 3117 The probe tip is gradually brought up to the cell surface until one or more receptor-ligand bonds are formed When the probe tip is withdrawn it moves along a different trajectory on a force-displacement plot reflecting the forces of adhesion These forces are seen to jump between more or less discrete levels as the probe continues to be moved away from the cell with each jump corresponding to the breakage of a single bond (Fig 3117) Using this method the bond strength between integrin receptor and a variety of RGD-containing ligands was found to lie in the range of 30 to 100 pN (Lehenkari and Horton 1999)
Fig 3117 The strength of a single adhesion bond can be measured by bringing a functionalized tip of an AFM probe up to the cell allowing bonds to form then slowly withdrawing the probe Monitoring the differences between the force displacement curve between the forward and reverse motions the forces necessary to break a single receptor-ligand bond can be determined [Reproduced from (Lehenkari and Horton 1999)]
52
CHAPTER 21 CELL MEMBRANE MECHANICS AND ADHESION copyRD Kamm 4615
A second method is similar in that the discrete increments in force are monitored as individual receptor-ligand bonds are broken but the forces are measured by means of changes in the shape of a giant vesicle the membrane of which contains the ligands have been inserted In this case one vesicle is made effectively rigid due for example to a high surface tension A second vesicle containing the adhesion molecules is also drawn partially into a micropipet but is much more complaint than the first The two vesicles are then brought into point contact so that one or a small number of adhesions are formed As the pipets are moved apart the compliant vesicle distorts due to the force of adhesion which it can be shown is related to the change in dimension of the vesicle in the direction of the force thereby serving as a sensitive force transducer measuring forces in the range of single adhesion receptors or between 1 and 100 pN [Evans 1991 37]
(For specific examples of leukocyte rolling and attachment see Orsello or Chang amp Hammer)
[This process is initiated for example by local infection that causes the release of
chemotactic agents in addition to cytokines hellip
Models of this process draw upon many of the concepts discussed in this chapter ]
Transient cell adhesion
Concepts of transient adhesion and release are of particular importance in the case of leukocyte
rolling adhesion and transmigration across the endothelial layer of a blood vessel In addition
cell migration through extracellular matrix or along a substrate requires the ability of the cell to
both form and release adhesions
One problem that has received considerable attention is the interaction between an
adherent or rolling leukocyte and the adhesion receptors on the endothelium These studies are
complicated by the three-dimensional nature of the flow the compliance of the interacting
surfaces and receptor-ligand dynamics In a series of recent studies Hammer and co-workers
(Chang Tees et al 2000) have addressed several of these issues computing the viscous force
and torque acting upon a sphere near to planar wall from the mobility matrix (Hammer and Apte
1992) and using the ldquoBell modelrdquo of receptor binding (Bell 1978) but neglecting the effects of
cell deformation The Bell model relates the dissociation rate constant kr to the force in the
bond f the thermal energy kBT and a parameter with units of length that depends on the
reactivity of the molecule
kr = ko r exp(γf kBT ) (283)
53
CHAPTER 21 CELL MEMBRANE MECHANICS AND ADHESION copyRD Kamm 4615
A Monte Carlo method is employed at each time step in the calculation to determine bond
formation or breakage In these studies the nature of the leukocyte-endothelial interaction is
characterized as firm adhesion rolling adhesion bimodal adhesion or no adhesion and mapped
as a function of the two parameters of the Bell model in Fig 3 The boundaries of the rolling
adhesion regime are identified for a wall shear rate of 100 s-1 (dotted lines) or 30 and 400 s-1
(solid lines) Most literature values for the Bell model parameters for a variety of selectin
receptors (known to be instrumental in leukocyte rolling) correspond to the rolling adhesion
regime for typical shear rate of 100 s-1 An interesting but counterintuitive result from this study
was the observation that as the bond stiffness was increased from the value used in most
calculations (100 dyne cm-1) adhesiveness decreased which the authors attribute to reduced
deflection for a given level of force leading subsequently to more rapid dissociation
Fig 3118 The state diagram for a leukocyte interacting with an endothelial surface for shear rates ranging from 30 to 400 s-1 For low dissociation rates the leukocyte remains adherent to the surface (lower left) As either (γ) or ( ko
r ) [see Eqn (283) for definitions] is increased the cell first adheres firmly then rolls along the wall then completely detaches (upper right) Rolling adhesion is defined as the regime where rolling occurs over some part of the shear rate range between 30 and 400 s-1 Firm adhesion indicates that cells remain attached even at the highest shear rate no adhesion indicates that cells roll at a velocity gt 50 of the velocity of a non-adherent sphere In the bimodal regime cells are either adherent or non-adherent and do not exhibit rolling Dotted curves correspond to these same boundaries for a shear rate of 100 s-1 Reproduced from Chang et al (2000)
54
CHAPTER 21 CELL MEMBRANE MECHANICS AND ADHESION copyRD Kamm 4615
In another recent study using high-resolution video-microscopy (Schmidtke and Diamond
2000) it was demonstrated that a flowing neutrophil can attach to an adherent platelet via
adhesion molecules located in the tips of the microvilli and form long tethers averaging nearly 10
μm in length but ranging up to 40 μm at extensional rates of 6-40 μm s-1 for shear rates ranging
from 100-250 s-1 The mechanics of tether formation is itself a fascinating topic that is still under
intense investigation Readers interested in pursuing this work in more detail are referred to the
several papers (Hochmuth Shao et al 1996 Dai and Sheetz 1998 Dai and Sheetz 1999) that
identify a number of intriguing phenomena
55
CHAPTER 21 CELL MEMBRANE MECHANICS AND ADHESION copyRD Kamm 4615
317 Nomenclature Parameter Definition Units
R - receptor
L - ligand
C - receptor-ligand complex
G - Gibbs free energy Nm
N - membrane tension Nm
NR - total receptor density -3μm-2 in 2D or μm in 3D NL - total ligand density μm-2 in 2D or μm-3 in 3D N in 2D or μm-3μm-2
C - complex density in 3D NRf - free receptor density m-2 in 2D or m-3μ μ in 3D NLf - free ligand density -2 -3μm in 2D or μm in 3D d+ - forward diffusional rate constant 2 -1μm s-1 in 2D or 3 μm s in 3D d -1
- - reverse diffusional rate constant s r+ - forward reaction rate constant s-1
r- - reverse reaction rate constant s-1 D 2 -1
m - membrane diffusion coefficient μm s D - solution diffusion coefficient m2 s -1s μ Kb - bending stiffness Nm K 0 - equilibrium constant or affinity (zero force) M-1 in 3D and 2μm in 2D = k0
+ k0 minus
K - equilibrium constant M-1 in 3D and m2μ in 2D = k+kshy
k0 - association rate constant (zero force) M-1 s-1 in 3D or m-2 -1+ μ s in 2D
k0 - dissociation rate constant (zero force) s-1 minus
k - association rate constant M-1 s-1 in 3D or m-2 -1+ μ s in 2D
kminus - dissociation rate constant s-1 f - force per bond N F - total adhesion force N γ - empirical parameter μm r0 - distance over which energy minimum acts μm E0 - bond energy J k JK-1
B - Boltzmanns constant T - temperature K τ - bond lifetime s
56
CHAPTER 21 CELL MEMBRANE MECHANICS AND ADHESION copyRD Kamm 4615
τ0 - bond lifetime with zero force s σ - adhesion stress N μm-2 κ - spring constant for receptor-ligand bond N μm-1
57
CHAPTER 21 CELL MEMBRANE MECHANICS AND ADHESION copyRD Kamm 4615
References Bell G I (1978) Models for the specific adhesion of cells to cells Science 200 618-627 Caille N O Thoumine et al (2002) Contribution of the nucleus to the mechanical properties
of endothelial cells J Biomech 35(2) 177-87 Chang K C D F Tees et al (2000) The state diagram for cell adhesion under flow
leukocyte rolling and firm adhesion Proc Natl Acad Sci U S A 97(21) 11262-7 Dai J and M P Sheetz (1998) Cell membrane mechanics Methods Cell Biol 55 157-71 Dai J and M P Sheetz (1999) Membrane tether formation from blebbing cells Biophys J
77(6) 3363-70 Daily Elson et al (1984) Determination of the elastic area compressibility modulus of the
erythrocyte membrane Biophys J 45(4) 671-682 Evans E and K Ritchie (1997) Dynamic strength of molecular adhesion bonds Biophys J
72(4) 1541-55 Evans E A (1983) Bending elastic modulus of red blood cell membrane derived from
buckling instability in micropipet aspiration tests Biophys J 43(1) 27-30 Hammer D A and S M Apte (1992) Simulation of cell rolling and adhesion on surfaces in
shear flow general results and analysis of selectin-mediated neutrophil adhesion Biophys J 63(1) 35-57
Hardt S L (1979) Rates of diffusion controlled reactions in one two and three dimensions Biophysical Chemistry 10 239-243
Hochmuth F M J Y Shao et al (1996) Deformation and flow of membrane into tethers extracted from neuronal growth cones Biophys J 70(1) 358-69
Kucik D F E L Elson et al (1999) Weak dependence of mobility of membrane protein aggregates on aggregate size supports a viscous model of retardation of diffusion Biophys J 76(1 Pt 1) 314-22
Kusumi A Y Sako et al (1993) Confined lateral diffusion of membrane receptors as studied by single particle tracking (nanovid microscopy) Effects of calcium-induced differentiation in cultured epithelial cells Biophys J 65(5) 2021-40
Lehenkari P P and M A Horton (1999) Single integrin molecule adhesion forces in intact cells measured by atomic force microscopy Biochem Biophys Res Commun 259(3) 645-50
McCloskey M and M M Poo (1984) Protein diffusion in cell membranes some biological implications Int Rev Cytol 87 19-81
Meleard P Gerbeaud C Bardusco N Mitov MD and Ferdandex-Puente L (1998) Mechanical properties of model membranes studied from shape transformations of giant vesicles Biochimie 80 401-413
Moy V T Y Jiao et al (1999) Adhesion energy of receptor-mediated interaction measured by elastic deformation Biophys J 76(3) 1632-8
Ra H J C Picart et al (1999) Muscle cell peeling from micropatterned collagen direct probing of focal and molecular properties of matrix adhesion J Cell Sci 112 ( Pt 10) 1425-36
Saffman P G (1976) Bownian motion in thin sheets of viscous fluid Journal of Fluid Mechanics 73 593-602
Schmidtke D W and S L Diamond (2000) Direct observation of membrane tethers formed during neutrophil attachment to platelets or P-selectin under physiological flow J Cell Biol 149(3) 719-30
Sheets E D R Simson et al (1995) New insights into membrane dynamics from the analysis of cell surface interactions by physical methods Curr Opin Cell Biol 7(5) 707-14
58
CHAPTER 21 CELL MEMBRANE MECHANICS AND ADHESION copyRD Kamm 4615
Vink H and B R Duling (1996) Identification of distinct luminal domains for macromolecules erythrocytes and leukocytes within mammalian capillaries Circ Res 79(3) 581-9
Waugh R and E A Evans (1979) Thermoelasticity of red blood cell membrane Biophys J 26(1) 115-31
Zeman K H Engelhard et al (1990) Bending undulations and elasticity of the erythrocyte membrane effects of cell shape and membrane organization Eur Biophys J 18(4) 203shy19
Zhelev D V D Needham et al (1994) Role of the membrane cortex in neutrophil deformation in small pipets Biophys J 67(2) 696-705
59
MIT OpenCourseWarehttpocwmitedu
20310J 3053J 6024J 2797J Molecular Cellular and Tissue BiomechanicsSpring 2015
For information about citing these materials or our Terms of Use visit httpocwmiteduterms

CHAPTER 21 CELL MEMBRANE MECHANICS AND ADHESION copyRD Kamm 4615
Eh ΔA Δ A
N = equiv K (24)2(1minus ν) A e
0 A0
Note that although we used the continuum structural equations in our analysis the final result
can also be viewed as simply the definition of the area expansion modulus and applies regardless
of whether or not the membrane can be modeled as a continuum
Experimental measurements of Ke lie in the range of 01-1 Nm for various types of lipid
bilayers and about 045 Nm (450 dyncm) for red blood cell membranes (Waugh and Evans
1979) These numbers suggest that cell membranes are quite resistant to extension and for that
reason are often treated as inextensible1 This high resistance to area change is in large part due
to the energy penalty associated with exposing the hydrophobic core of the membrane to water
that occurs as the spacing between individual amphiphilic molecules is increased [for a detailed
description of bilayer structure and thermodynamics see Tanford (1980) or Israelachivili
(1991)] Continuing to increase extensional stress the lipid bilayer eventually ruptures but at
very small extensional strains in the vicinity of 2 to 3 (Mohandas amp Evans 1990) Note that a
bilayer in a lipid vescicle for example stretches primarily by increasing the area per molecule
since recruitment of additional material to the membrane occurs very slowly
Using these expressions we can estimate the level of surface tension at which the
membrane would rupture At a 3 extensional strain (6 areal strain) uniformly applied in the
x1-x2 plane the surface tension at rupture would be about 006 Nm if we use a value near the
higher end of the observed range Ke = 1 Nm Using Laplaces law [see eqn (227)] for the
relationship between the pressure difference (ΔP) across a spherical shell of radius R = 1 μm and
the surface tension in the shell gives us
2N
ΔP = = 12x105 Pa cong 1200cmH 2O R
a remarkably high value of pressure given the thickness of the membrane is only 6 nm
Cells also often exhibit an intrinsic surface tension Reported values are small however
lying in the range of about 10-5 to 10-4 Nm (Sheets Simson et al 1995) For comparison recall
that the surface tension across the interface of a droplet of pure water is about 007 Nm a value
close to the rupture stress of the membrane given above It becomes immediately obvious then
that the tension of a cell membrane must be orders of magnitude smaller than the surface tension
1 This discussion neglects the effects of thermal fluctuations in the membrane that give rise to a much more compliant behavior at the smallest areal strains When surface stress is sufficient to smooth out most thermal fluctuations the cell or vesicle will exhibit the large moduli given here See also Example xx later in this chapter
10
CHAPTER 21 CELL MEMBRANE MECHANICS AND ADHESION copyRD Kamm 4615
of a typical gas-liquid or liquid-liquid interface since it would otherwise give rise to intracellular
pressures on the order of one atmosphere
Pure bending By contrast lipid bilayers exhibit a very low bending stiffness so low that it is
often neglected in models of membrane mechanics It can be important in certain situations
however and is essential for example in analyzing the thermal fluctuations of vesicles discussed
later in this chapter
Bending stiffness arises from the same type of molecular interactions that cause
extensional stiffness When an initially flat bilayer is bent the hydrophilic head groups on the
outside of the bend move further apart while on the inside intermolecular spacing decreases
both represent departures from the equilibrium unstressed state and require energy If the same
forces of interaction are responsible why then is bending stiffness so low While the answer to
this question is not simple one factor is the membrane thickness which you recall is only about
6 nm As the membrane bends therefore the change in the surface area per molecule is
extremely small so the associated extensional strains are also minute
Returning to our simple continuum plate model consider a bending moment applied to
the two ends causing the plate to curve slightly (Fig 316) If the bending is due to moments
applied at the two ends about the x2-axis then the bending moment per unit length is related to
the deflection by
Et 3 ⎛ part 2u ⎞ ⎛ part 2 ⎞
⎜ 3 u
Mα = minus 2 2 ⎟ = minusK B⎜ 32 ⎟ (25)
12(1minus ν ) ⎝ partxα ⎠ ⎝ partxα ⎠
where KB is termed the bending stiffness having units of Nm Implicit in this expression are the
assumptions that there exists a mid-plane (the neutral plane) on which the in-plane stress and
strain are both zero and that straight lines perpendicular to this mid-plane remain straight and
normal to this surface after deformation
Typical values for the bending stiffness KB lie in the range of 10-19 Nm (10-12 dyncm) for
a red blood cell or lipid bilayers (Mohandas amp Evans 1990) This value is larger on the order of
1-2x10-18 Nm (Zhelev Needham et al 1994) for other cell types (eg neutrophils endothelial
cells) that possess a more extensive cortex The methods used to obtain these values will be
described later in this chapter
11
CHAPTER 21 CELL MEMBRANE MECHANICS AND ADHESION copyRD Kamm 4615
Fig 316 Plate subjected to equal moments M1 at the two edges
Example Estimate the moment per unit length acting within an initially flat lipid bilayer (at zero
temperature) associated with a wavelength λ = 5 μm and amplitude ε = 1 μm
Membrane displacement can be approximated by the expression
u3 = ε sin (2πx1 λ) (26)
From eqn (25) above we obtain
2
⎛ 2π ⎞ M1 = KBε sin (2πu )⎝ ⎠ 3 λ (27)λ
Using the values given above the maximum moment per unit length is 0158 pN
Pure shear Shear deformations arise when a membrane is stretched in one direction by a
surface tension N1 (units of forcelength) while the lateral surface contracts under a lesser tension
N2 at constant surface area and in the absence of bending (Fig 317) Surfaces oriented at 45
degrees to the boundaries experience pure shear stresses of magnitude (N1 - N2)2
When subjected to shear stresses in the plane of the membrane a pure lipid bilayer
behaves essentially as a liquid It exhibits a membrane viscosity in that it poses a resisting force
proportional to the rate of shear deformation but only a small shear modulus to static shear
deformations It is not clear in fact whether or not pure lipid bilayers exhibit a non-zero shear
modulus For example the movement of membrane-bound proteins can be described by a
simple diffusion coefficient proportional to the membrane viscosity Typical cell membranes do
exhibit a shear modulus however largely due to the cortex of cytoskeletal filaments that lie on
the intracellular side of the membrane In a red blood cell this matrix as discussed above
12
CHAPTER 21 CELL MEMBRANE MECHANICS AND ADHESION copyRD Kamm 4615
consists of interconnected filamentous spectrin and actin with attachments to the membrane via
ankyrin
N2
N1 N1
N2 Fig 317 A section of membrane subjected to a shear stress of magnitude N1-N22
The equations relating shear stress to shear deformation (Hookes law) from Ch xx can
be applied here
τ12 = τ 21 =2Gε12 (28)
or expressed as a shear force per unit length of membrane
N12 =τ12 h = 2Gε12 = Ksε12 (29)
where we define the membrane shear modulus Ks with units of Nm Typical values lie in the
range of 6-9 x 10⁻⁶ Nm for a red blood cell membrane A pure lipid bilayer exhibits a viscous
resistance to shear deformations characterized by a shear viscosity of about 10-6 Nsm ((Evans
1983))
The 2D elastic plate -- equations of deformation
In the analysis of cellular membranes several unique characteristics need to be taken into
account
1 The membrane is extremely thin relative to its lateral extent If we consider the thickness to
be that of the lipid bilayer by itself then h can be as small as 6 nm compared to a typical cell
dimension on the order of 10s of μm Even if we include the sub-membrane cortex this
13
CHAPTER 21 CELL MEMBRANE MECHANICS AND ADHESION copyRD Kamm 4615
dimension only increases to about 100 nm This tends to favor in-plane stresses over bending
effects2
2 The non-shear deformations are very small with strains of at most a few percent Therefore
linear analysis is appropriate in many situations Note however that nonlinear effects can be
important especially for large shear deformations such as occur in micropipet aspiration of
red blood cells The implications and limitations of this are discussed more fully below
3 The membrane exhibits a very small modulus in plane shear and is often treated as a two-
dimensional liquid While this applies primarily to lipid bilayers when the membrane is
considered to include the cortex greater values of shear modulus can be observed
4 Stresses normal to the membrane are small and can be neglected
5 Membrane motions can be damped either due to viscous dissipation within the bilayer as in
the case of in-plane shear or due to the viscosity of the fluids on the intra- or extracellular
sides of the membrane These latter are especially important when considering motions of
the membrane perpendicular to its plane
6 Inertial effects can be neglected due to the predominance of viscous forces during transient
deformations
With these in mind and acknowledging the limitations of a continuum view of such
structures we treat the membrane as a thin homogeneous plate or membrane in which all the
following must be considered in-plane extension and shear bending viscous damping and
thermal fluctuations
The equations we derive will effectively be integrated through the membrane thickness so
that stresses will be in terms of surface forces (force unit length) These are the in-plane normal
forces (see Fig 318 for definition of the axes and nomenclature) are therefore written as
+ h 2
Nα = int σ α dx3 (210) minus h 2
where h is the membrane thickness and the vertical shearing forces
+ h 2
Vα = (211) minus h
int τα 3dx3
2
The moments acting on the plate edges can be calculated from
2 Whether tension or bending dominates clearly depends on the nature of the experiment If an initially spherical cell is distended tension is most important if the cell shrinks so that the membrane buckles bending effects will be critical
14
CHAPTER 21 CELL MEMBRANE MECHANICS AND ADHESION copyRD Kamm 4615
+h 2
Mα β = int x3τα β dx3 (212)minush 2
x
(c)
Fig 318 (a) A small section of membrane (b) Membrane deflections (c) Nomenclature used in defining the forces acting on a section of membrane (Note that Q is used to represent shear stress in the figure whereas V is used in the text and (xyz) should be (x1x2x3))
In order to distinguish the effects of bending from those giving rise to extension we separate the
normal stress into two parts one representing the mean over the thickness of the membrane
which is simply Nαh and the other representing the deviation from this value denoted as σαprime
Similarly we separate the displacement on the neutral plane unα from that which varies with x3
denoted as uαprime Consequently we can write
N
uα = u n + primeα and = iα u σ α + primeσ α (213)
h
And consistent with the assumption that planar edges initially normal to the membrane remain
planar under bending deformations we have that
15
CHAPTER 21 CELL MEMBRANE MECHANICS AND ADHESION copyRD Kamm 4615
partu uαprime = minus x 3
3 (214)partxα
According to assumption (4) above the relationships between stress and strain become
E σ α = νε β ) α ne β (215)
minus ν2 (ε1 α +
and
E ταβ = εαβ α ne β (216)
(1+ ν )
Since
partuα partunα partu
= αprime ε α = + (217)
partxα partxα partxα
(summation convention not used) We eventually obtain the following expressions for the
bending moment
+h 2 ⎛ part 2 u part 2 ⎞ M 3 u3
α = int σ α x3dx3 = minusKB ne (218)⎜ ⎝
2 + ν ⎟ α β partx 2
minush 2 partxα β ⎠
and
+ h 2 part 2u
M12 = int ε KB (1minus ν) 312 x3dx3 = minus (219)
minus h 2 partx1partx2
where in classical shell theory for continuum materials KB=Eh3(1-ν2) The moments are related
to the shear forces in the plane of the membrane through a moment balance about the x1 axis
giving
partM 12 partM
+ 2 minus V2 = 0 (220)partx1 partx2
so that
part ⎛ part 2 u part 2 u ⎞ part ⎛ part 2 part 2
V = minus 3 + 3 uandV 3 u
K ⎜ ⎟ = minus K ⎜ + 3⎞
2 B ⎟ (221)partx2 ⎝ partx 2 2 ⎠ 1 B 2 2
1 partx2 partx1 ⎝ partx1 partx2 ⎠ A force balance in the direction normal to the membrane yields
16
CHAPTER 21 CELL MEMBRANE MECHANICS AND ADHESION copyRD Kamm 4615
partV1 partV2 part ⎛ partu ⎞ part ⎛ partu ⎞+ + ⎜ N 3 ⎟ + ⎜ N 3 ⎟
2 + p = 0 (222)x 1
part 1 partx2 partx1 ⎝ partx1 ⎠ partx2 ⎝ partx2 ⎠
which upon substitution for V1 and V2 from eqns (221) becomes
⎛ part4u3 part4u part4u3 part part ⎛ ⎞K 3 ⎞ part ⎛ u ⎞
B 4 N 3 partu
+ 2 + minus minus N 3 minus p = 0 (223)⎜ ⎟ ⎜ ⎟ ⎜ ⎟⎝ partx1 partx2partx2 partx4 ⎠ partx ⎝ 1 partx ⎠ partx ⎝ 21 2 2 1 1 2 partx2 ⎠
Recall that the first term in parentheses is due to bending the second and third terms are due to
in-plane extension and the fourth term represents the pressure difference across the membrane
Eqn (223) contains three unknowns the displacement u3 and the two normal forces per
unit length N1 and N2 Fortunately the additional equations required for solution are quite easy
to obtain from simple force balances in the x1 and x2 directions Setting the sum of forces in the
x1 direction equal to zero we obtain (referring to Fig 319)
minus N1(x1) + N1(x1 + dx1)cosθ (x1 + dx1) minus N21 (x2 ) + N21(x2 + dx2 ) = 0 (224)
or
partN1 partN21 partN2 partN + = 0 and similarly + 12 = 0 (225)
partx1 partx2 partx2 partx1
While formidable in its complete form it is reassuring to know that we rarely use eqn
(223) in its entirety and that when certain limiting cases are considered more familiar equations
are obtained It is useful at this stage to consider several of these limits
Fig 319 x1 force balance in the plane of the membrane
17
CHAPTER 21 CELL MEMBRANE MECHANICS AND ADHESION copyRD Kamm 4615
Balance between pressure and surface tension (Laplacersquos Equation) If the in-plane stress is
uniform (Ni=Nj=N) eqn (223) has the form
⎛ part 4u part 4u part 4u ⎞ ⎛ part 2u KB ⎜
3 4 + 2 3 3
2 2 + 4 ⎟ minus N⎜ 3 part 2u
2 + 3 ⎞
2 ⎟ minus p = 0 (226)⎝ partx1 partx1 partx2 partx2 ⎠ ⎝ partx1 partx2 ⎠
and eqn (225) is trivially satisfied If in addition bending stiffness can be neglected then
⎛ part 2 u part 2 ⎞ ⎛ 1 1 ⎞ 3 u
p = minusN ⎜ 3
2 + 2 ⎟ cong N⎜ + ⎟ (227)⎝ partx1 partx2 ⎠ ⎝ R2 R1⎠
for small curvatures where R1 and R2 are the radii of curvature of the membrane about the x1 and
x2 axes respectively This is the well-known Laplacersquos equation with N the surface tension For
a sphere R1 = R2 and the equation simplifies further yielding the equation given on p 10
Balance between pressure and bending Alternatively if all in-plane stresses can be neglected
other than those associated with bending stiffness we obtain the equation generally used for
simple bending of plates and shells
⎛ part 4u part 4u part 4 3 3 u ⎞
KB ⎜ 4 + 2 2 + 3 ⎟ = p (228)
⎝ partx1 partx1 partx2 partx 4 2 2 ⎠
Both of these forms will be used later in this chapter to examine specific problems in cell
membrane mechanics
The conditions under which eqn (226) can be reduced to either (227) or (228) can be
determined by an order of magnitude comparison of the bending and tension terms If we take u
to be a measure of the membrane displacement in the x3 direction and λ to be the characteristic length in the x1 or x2 directions over which u3 varies then the bending term can be shown to scale as K 4 2
Bu λ and the tension term as Nu λ The ratio of these tells us which of the terms dominate in eqn (226) If
KBu λ4 K= B ltlt 1
Nu λ2 Nλ2
then tension dominates and eqn (227) is appropriate Alternatively if
KB gtgt 1 Nλ2
18
CHAPTER 21 CELL MEMBRANE MECHANICS AND ADHESION copyRD Kamm 4615
then bending dominates and eqn (228) should be used If we take values typical of those given
for cells K N = 5x10⁻⁵B = 10-18 Nm Nm λ = 1 μm this ratio equals 002 confirming as we
originally postulated that tension tends of dominate
Nonlinear formulations
Traditionally membrane deformations have been addressed through nonlinear analysis allowing
for large strains especially in shear Here we have chosen to present the linearized equations in
the hope that they will provide clearer insight and for continuity with the approach used in other
chapters of the text For many problems of interest deformations are small and linear theory is
sufficiently accurate In some circumstances however a nonlinear analysis is necessary one
example being the aspiration of a red blood cell membrane into a micropipet For this reason we
present the nonlinear equations in Appendix A for the more advanced reader and to assist in
reading the recent literature on membrane mechanics
Energies of deformation
Although the formulation of the equations of deformation in Section 316 is complete by itself
an alternative approach is often useful in which we consider the strain energy the energy stored
in the membrane due to elastic deformation as a basis for analysis Strain energy is analogous to
the energy stored in a spring by stretching it If the spring is linear with a stiffness k so that the
force F required to lengthen it from x0 to x is k(x-x0) then the energy expended during the
process of lengthening is
x x
U = int Fdx = int k(x minus x0 )dx = 1 2 k(x minus x0)
2 (229)x= x 0 x = x 0
Extensional energy Now consider a section of an elastic membrane of thickness h and lengths
dx1 and dx2 subjected to a uniaxial tension stress σ1 Here as in our previous discussion we
consider two cases first a flat membrane which is being stretched by extensional stresses (the
case at zero temperature) and second the situation in which the surface area of the membrane
projected onto a flat plane increases due to the smoothing of out-of-plane undulations (the
entropic contribution)
As the stress is gradually applied to minimize any dissipative effects the work done by
the external force must equal the gain in elastic energy stored in the plate The work performed
by this stress is
19
CHAPTER 21 CELL MEMBRANE MECHANICS AND ADHESION copyRD Kamm 4615
ε1 ε 1
dU = int σ 1dε 1dx1dx2 dx3 = int Eε1dε1dx1dx2dx3 (230)0 0
By energy conservation the work done in stretching the membrane must be stored as potential
or strain energy in the elastic member Since the right-hand-side of (330) represents the strain
energy in the volume dx1dx2dx3 then the energy per unit volume of membrane is
ε1 ε1
U0 = int σ 1dε1 = int Eε = 1 Eε21dε1 2 1 (231)
0 0
or expressed as energy per unit area of membrane
Ehε2
U 10h = (232)
2 In the somewhat more general case of biaxial strain a similar approach leads to
Eh ⎡ 2 2
( 2 2 ) Eh ⎛ ⎤partu ⎞ uε1 + ε 2 = ⎢⎜
1 ⎛ part
⎟ + ⎜ 2
⎞ U0h = ⎟ ⎥ (233)
2 1( minus ν ) 2 1( minus ν ) ⎢⎝ partx⎣ 1 ⎠ ⎝ partx2 ⎠ ⎥⎦
Note that if the strain is isotropic in that ε1 = ε2 = ε this can also be expressed in terms of the
areal strain with the aid of eqn (23)
2 Eh ⎛ ΔA⎞
U0h = ⎜ ⎟ (234)4 1( minus ν ) ⎝ A0 ⎠
from which it can be seen by eqn (24) that the area expansion modulus has the form
Eh Ke = (235)
2 1( minus ν )
under the assumptions of a homogeneous isotropic elastic membrane This term however only
accounts for the contribution to extensional energy associated with an increase in the surface area
of a membrane Another contribution arises from the change in the membrane surface area
projected onto the x1-x2 plane due to non-uniform displacements perpendicular to the plane of
the membrane in the x3 direction This can be seen from the following one-dimensional
example
Consider a membrane tethered at both ends that exhibits a constant surface tension N
when deformed into a new state defined by u3(x1) Locally the change in length of a segment
initially of length dx is
20
CHAPTER 21 CELL MEMBRANE MECHANICS AND ADHESION copyRD Kamm 4615
( 2 2 dx ) + ( du3 ) minus dx = [1 du3 dx1)2]
12 2 2 + ( dx 1 1
1 minus dx1 asymp (1+ 2 (du3 dx1) )dx1 minus dx1 = 2 (du3 dx ) dx(236) 1 1
[see also Figs 64 and 65 in Boal] The strain is then the change in length over the initial length or
2ε11 = 1
2 (du3 dx1) (237) and the energy per unit area associated with this change in length under a constant tension N is
2 ε N ⎛ partu ⎞
U0h = N1int dε =0
⎜ 3
⎟ (238)2 ⎝ partx1 ⎠
which extending to two dimensions can be written
⎡⎛ ⎞ 2 ⎛ 2⎤ N partu3 partu ⎞U ⎢⎜ ⎟ + ⎜ 3
0h = ⎟ ⎥ (239)2 ⎢⎝ partx1 ⎠ ⎝ partx⎣ 2 ⎠ ⎦ ⎥
It is important to recognize that we now have two expressions associated with the energy of
extension and they represent two distinct phenomena The first [eqn (333)] describes the
energy associated with true areal expansion that is a change in the effective spacing between the
molecules comprising the lipid bilayer The second [eqn (339)] corresponds to the energy
change due to undulations in a membrane with constant intermolecular spacing To see the
distinction between the two consider an experiment in which the pressure inside a cell or a lipid
vesicle is gradually increased by aspiration into a micropipette Initially the projected area of
the membrane rises rapidly with a relatively small increase in membrane tension corresponding
to the smoothing of undulations caused by thermal excitation of the membrane This is followed
at higher tensions by a transition to a regime in which the membrane exhibits a much greater
stiffness corresponding to the situation in which the thermally-induced undulations have been
smoothed out and the true membrane surface area now must increase In the absence of thermal
fluctuations eg at zero temperature only this second regime would be observed [see also
figure from Boal]
Energy of shear deformation Next examine the energy per unit area associated with shear
deformation in the plane of the membrane which can be expressed in the form
2
1 1 2 Gh ⎛ part u1 partu2 ⎞
U0h = 2 hτ12ε12 = 2 hGε12 = ⎜ + ⎟ (240)2 ⎝ partx2 partx1 ⎠
21
CHAPTER 21 CELL MEMBRANE MECHANICS AND ADHESION copyRD Kamm 4615
where we have utilized eqns (28) and (29) to obtain a form similar to that of eqn (234) for
extensional deformation
[See Boal for an alternative form in terms of membrane curvature He also gives a nice
description of bending in bilayer membranes]
Bending energy The contribution due to bending energy is somewhat more difficult to derive
First recognize that only those normal stresses that vary with x3 contribute to the bending
energy that is those contributed by the σ stresses in eqn (213) With this in mind we can
write the expression for the total elastic energy due to bending as
1 1 U = intintint ⎧ [ 2
⎨ ( ) 2 ⎫ σ 1 prime + ( )2
σ 2 prime + 2νσ 1 primeσ prime 2 ] + ( )τ 12 prime ⎬dx (241)⎩2E 2G ⎭ 1dx2dx3
Substituting for the stresses and strains from eqns (215)-(217) this can be re-cast in the
following form
⎧ 2 ⎫K ⎛ 2
part 2 2u ⎡ 2 u part ⎞ part 2u 2 part 2 ⎤ part u ⎛ u ⎞
U = B intint ⎜ 3 3 ⎟ 1 minus ν ) 3 3 2 minus ⎜ 3 ⎟⎨ 2 + 2 minus 2( 2 ⎬dx1dx (242)⎢ ⎥2 ⎝ partx1 partx2 ⎠ partx1 partx2 ⎝ partx1partx2 ⎠ 2
⎩ ⎣ ⎦ ⎭
It can be shown ((Meleard 1998)) that the integral of the second term in the integrand above [the
one multiplied by 2(1-ν)] is globally constant under deformation if the membrane remains a
closed surface with no holes Assuming that to be the case we obtain for the total bending strain
energy
KB ⎛
2 part 2u part 2
= intint ⎜ 3 u2 + 3 ⎞
U ⎟2 dx1dx2 + const (243)
2 ⎝ partx1 partx2 ⎠
Since we typically are concerned with changes in energy the constant will arbitrarily be set to
zero Thus the energy per unit area or energy density of bending deformations can be written
2 K ⎛ part 2 part 2 ⎞
0 = B u⎜
3 uU h 2 + 3
2 ⎟ (244)2 ⎝ partx1 partx2 ⎠
Note that the term in parentheses is proportional to the mean curvature of the surface Often the
surface has a natural mean curvature in the unstressed state If that curvature is c0 the bending
energy expression is modified slightly to the form
22
CHAPTER 21 CELL MEMBRANE MECHANICS AND ADHESION copyRD Kamm 4615
2 K ⎛ part 2 part 2 ⎞
U0 = B u⎜
3 uh 2 + 3
2 minus c0⎟ (245)2 ⎝ partx1 partx2 ⎠
Another common form of this expression is obtained by recognizing that the first two terms in
parentheses represent the linearized form of the sum of the principal curvatures (the largest and
smallest curvatures at a point) denoted c1 and c2 so that eqn (345) can be written
K
U2 B
0h = (c1 + c2 minus c0 ) 2
Although each of these expressions for strain energy density has been derived individually they
of course all contribute in the general situation and are linearly additive In that regard several
points are worthy of note First one can obtain some idea of the relative importance of
extension shear and bending deformations in a given situation simply by comparing their
relative energies just as was done in the last section by comparison of the bending and tension
terms in eqn (226) Not surprisingly the comparison leads to the same expressions we obtained
before for when either bending or tension is dominant Second due to the small shear modulus
of most cell membranes the energy stored in shear deformation can generally be neglected And
finally a comment is warranted concerning the energy due to tension Various simplifying
assumptions can be made depending on the cell type being considered and the nature of the
stress to which the cell (or vesicle) is being subjected but generally the lipid bilayer can be
considered to be of constant area unless it experiences grossly non-physiologic levels of stress
Thus the main contribution to extensional energy is that represented by eqn (339) associated
with the smoothing of membrane undulations
Other Factors Influencing Membrane Motion
Thermal fluctuations Biological membranes of all types can be seen to fluctuate due to
Brownian motion of the surrounding molecules if viewed with sufficient resolution These
fluctuations are in fact often used to measure the membrane bending stiffness since thermal
effects are seen as motions in the membrane of relatively long wavelength favoring bending
energies as compared to extensional or shear (see eqn (223)) To account for these effects it is
customary to add a time-dependent forcing term to eqn (223) η(t) the magnitude of which
scales with kBT We analyze thermal motions later and use them as a means of determining the
bending stiffness of a membrane
23
CHAPTER 21 CELL MEMBRANE MECHANICS AND ADHESION copyRD Kamm 4615
Damping due to external fluids When a membrane fluctuates in a direction perpendicular to its
plane velocities are induced in the surrounding fluids and due to the resulting shear stresses
energy is dissipated These motions are extremely complex to model precisely and depend on
both the nature of the surrounding medium (its rheological properties) and the bounding
geometry In lieu of a complete and rigorous analysis a local damping term is sometimes added
to the membrane force balance equation (eqn (223)) to approximate these effects Its form is
based on the presumption that externally induced velocities scale with the velocity of the wall
and that shear forces in the external fluid scale with the induced shear rates and velocities
Accordingly eqn (223) is modified by the addition of a term of the form μm partu3 partt where μμ is
the effective viscosity of the external fluid The equation that results from the addition of both
thermal forcing and external fluid viscosity is
partu ⎛ part 43 u 4
3 part u part+ 3 part 4u ⎞ part ⎛ ⎞ part ⎛ ⎞
B ⎜ 3 partu u
μm K 4 + 2 2 2 + 4 ⎟ minus ⎜ N3
⎟ minus part 1 ⎜ N
3
partt ⎝ x partx partx partx ⎠ partx ⎝ partx ⎠ partx ⎝ 2 ⎟ = p + η(t) (246)1 1 2 2 1 1 2 partx2 ⎠
An expression of similar form for a linear polymer is sometimes referred to as the Rouse
equation
314 Measurements of Membrane Elastic Parameters
Although the analogy has limitations it is useful at the onset to think of the cell as a fluid-filled
balloon or bag Just as in the case of a balloon the elastic properties of the membrane can be
determined by any experiment in which the membrane tension changes while its area is
measured In the simple example of a spherical balloon tension can be computed from the
inflating pressure and the measured radius the latter also yielding the surface area Ignoring for
now the thermal-induced fluctuations in a real cell membrane (ie assuming the cell to be at zero
temperature) the calculations become particularly simple Furthermore we will consider cells
for which the cytoplasm can be considered to fluid-like having no elasticity We return to
address both issues shortly
Osmotic swelling
Perhaps the simplest method to inflate the cell and measure the membrane elastic properties is to
cause the cell to swell by changing the osmolarity of the external fluid and simultaneously
monitoring the change in cell volume The change in transmembrane pressure mirrors the
24
CHAPTER 21 CELL MEMBRANE MECHANICS AND ADHESION copyRD Kamm 4615
change in osmotic pressure brought about by successive additions of a solute to which the
membrane is impermeable For ions and small molecules the osmotic pressure π can be
calculated from the vant Hoff equation
π = RT sum Ci (247)
i
where Ci are the molar concentrations of all solutes to which the membrane is impermeable For
larger molecules such as proteins their contribution to osmotic pressure is much larger than
indicted by this equation
Consider for example a spherical cell expanded osmotically so that the internal
hydrostatic pressure relative to external pressure is pc Microscopic examination yields a value
for the cell radius Rc Using these values in combination with Laplaces law [eqn (227)] gives
us the tension in this state and eqn (24) provides its relationship to the extensional modulus
p R Δ A
N = c c = Ke (248) 2 A0
The observed change in radius allows calculation of ΔA In practice identification of the reference state at zero pc is problematic due to the presence of thermal fluctuations but if Ke can be assumed constant for relatively small changes in area it is possible to extrapolate back to the zero-stress state from two measurements at elevated pc [Example red blood cell] Micropipet aspiration
One of the first methods used to measure the extensional modulus of the cell membrane involved
drawing a cell slightly deflated into a micropipet simultaneously monitoring the dimensions of
the cell and the pressure in the micropipet (Daily Elson et al 1984) Since on the time scale of
the experiment the volume of the cell could be assumed constant the shape change due to
aspiration of the cell causes increases in both internal pressure and surface tension both of which
are assumed spatially uniform Once the tension is large enough (or the temperature low
enough) to dampen the amplitude of any thermal fluctuations the cell can be treated assuming
that membrane extension is the dominant means by which the pressure drop across the
membrane is balanced [For further discussion on the thermal fluctuations and the relationship
between micropipet pressure and intracellular pressure see Daily and Evans and Rawicz Phys
Rev 1990 See also figure on p 199 of Boal Example the two regimes in membrane stiffness]
For the situation shown in Figxx the cell is drawn into the micropipet to the point at
which the portion of the cell external to the cell is spherical of radius Rc With the assumptions
25
CHAPTER 21 CELL MEMBRANE MECHANICS AND ADHESION copyRD Kamm 4615
stated above the (uniform) pressure within the cell can be related to it surface tension (assumed
uniform) and the radii of curvature of the main body of the cell Rc and the portion inside the
pipet a using Laplaces law [eqn (227)]
pc = 2N Rc = minus Δp + 2N a (249)
where pressures are referenced to the external ambient pressure Reorganizing to solve for
surface tension we obtain
ΔpN = (250)
⎛ 1 1 ⎞ 2⎜ minus ⎟
⎝ a Rc ⎠
The surface area corresponding to a given N is obtained from geometry summing the membrane
surface areas of the cylinder and hemisphere inside the micropipet and the truncated spherical
surface outside yielding for the areal strain the approximate expression
[(a R )2 (a R )3
Δ c minus c cong
]ΔLA
A 2a
Fig xx Micropipet aspiration of a neutrophil
This relationship between N and ΔAA can be used to calculate the area expansion modulus
Eh AK 0
e = = N 2 1( minus ν ) ΔA
where the expression involving Youngrsquos modulus assumes the membrane to be isotropic and
homogeneous The relationship could however be non-linear in that the value of Ke may vary
with the degree of area expansion a linear relationship between N and ΔA yields a constant value for Ke
It is important to note that neither of these approaches osmotic inflation or micropipet aspiration provides us with any information on the bending modulus To be precise bending
26
CHAPTER 21 CELL MEMBRANE MECHANICS AND ADHESION copyRD Kamm 4615
does play a role in the micropipet experiments but the effects are so small as to be negligible and are typically ignored That is not to say that bending is always negligible however as discussed next
Monitoring thermal fluctuations in the membrane
When a cell or lipid vesicle is observed floating free unattached to a substrate it can be seen to
exhibit time-dependent undulations as a result of collisions with the surrounding molecules
undergoing thermal motion In the case of a lipid vesicle with diameter in the range of 10
microns these undulations can be readily observed microscopically In smaller cells such as red
blood cells the motions can be inferred from the flickering phenomenon associated with the light
interference as the cell thickness changes (Zeman Engelhard et al 1990) Since the amplitude of
the membrane undulations depends on the stiffness of the membrane to bending and its surface
tension it is reasonable to expect that measures of this amplitude can be used to infer the
membrane elastic parameters In order to illustrate the method while avoiding some of the
algebraic complexity consider undulations in a flat membrane with significant bending stiffness
and a constant surface tension The relationship between the motion and the elastic properties
can be found by considering the total energy of the membrane obtained by summing the
energies per unit area from eqns (239) and (244) and integrating over the membrane surface
area Am
⎧ 2⎪ K ⎛ 2 2
part 2 u part 2 ⎡ 3 u ⎞
3 N ⎛ partu ⎞ ⎛ int 3 partu ⎞ ⎤⎫
B 3 ⎪
U0hdA = int ⎨ ⎜ 2 + 2 ⎟ + ⎢⎜ ⎟ + ⎜ ⎟ ⎥⎬dA (251) A ⎠ 2
m Am ⎪ 2 ⎝ partx1 partx2 ⎢⎝ partx1 ⎠ ⎝ partx2 ⎠ ⎥⎪ ⎩ ⎣ ⎦⎭
In writing the energy in this form we have omitted the contribution due to shear deformation
consistent with the fluid-like character of a pure lipid bilayer and have taken the surface tension
to be uniform during the deformation In this example membrane surface area changes only as a
result of fluctuations from the mean [u3(xxx2) = 0] configuration that is we now ignore the
contribution due to changes in intermolecular spacing and only consider changes in the area
projected onto the x1-x2 plane
It is convenient to use the method of Fourier transforms to represent the undulations of a
membrane normal to the x1-x2 plane which in two-dimensions leads to [see also class notes on
bending of cytoskeletal filaments alternatively use Fourier series representation]
A A
u3 (x) = u3 (x1 x2 ) = 2 intexp(iq sdot x)b(q)dq =
2 int exp(iq 4 1x1)exp(iq2 x2 )b(q1q2 )dq1dq
π 4π 2
(252)
27
CHAPTER 21 CELL MEMBRANE MECHANICS AND ADHESION copyRD Kamm 4615
where qα = 2π λα is the wavenumber of the particular mode and b(q) is the continuous analogue of the discrete coefficients that multiply each mode in a Fourier series representation
Here the algebra gets complicated so only the results of the analysis will be presented however
those wishing to see a more complete derivation should see (Boal Mechanics of the Cell
Cambridge University Press 2002) Introducing eqn (352) into (351) yields
1 ⎛ A ⎞2
int U q 40hdA = ⎜ ⎟ int (
KB + Nq2 )b(q)b(q)dq (253)2 2 ⎝ π ⎠
where b(q) is the complex conjugate of b(q) Now we invoke a previous result that at equilibrium energy is equally distributed among the various modes and that each mode has an
average energy of kBT2 Taking the ensemble average of eqn (353) and equating the energy of
each mode represented in the result to kBT2 (by the equipartition theorem) leads to
k Aq)b q) = BT
b( (K q4 2 (254)
B + Nq
This is a useful result in itself demonstrating that all modes tend to be suppressed as temperature
falls or as bending stiffness or surface tension rise In addition it shows the tendency for higher
modes to be of smaller amplitude But this equation has further value in that it can be used to
obtain a direct expression for the change in apparent area of a membrane as tension increases
Consider the true surface area of a membrane A represented as the sum of its projected
area and the additional area associated with thermally-induced undulations
⎡ 1 ⎛ 2⎤u ⎞ 2 part ⎛ partu ⎞
A = int dx + ⎢ 3 3 2
int ⎜ ⎢⎝ partx 2 ⎟ + ⎜
⎠ ⎝ partx 2 ⎟ ⎥dx (255)⎠ ⎥
⎣ 1 2 ⎦
Isolating the term representing the area reduction due to thermal fluctuations expressing u3 in
terms of its Fourier transform and taking the ensemble average of the result leads to
1 ⎛ A ⎞2
A minus int dx = ⎜ ⎟ int q 2 b(q)b(q) dq (256)2 ⎝ 2π ⎠
Combing eqn (254) from above with this expression yields
28
CHAPTER 21 CELL MEMBRANE MECHANICS AND ADHESION copyRD Kamm 4615
A minus int dx
kBT dq kBT dq2
= A 8π 2 int =
N int (257)
+ KBq 2 8π 2 N + KBq 2
where in writing the last term we have introduced the relations dq = dq2dθ 2 and int dθ = 2π By a simple substitution z = q2 + (N KB )the integral can be evaluated We do so however
between specified limits on the assumptions that the range of possible wavenumbers is restricted
by the size of the membrane on one hand (q = (πA12)) and the distance between individual lipid molecules on the other (q = πlm) Integrating between these limits results in
⎛ π 2 N ⎞
int dx 2 +A ⎜ ⎟ minus k T l K
= B ln⎜ m B ⎟ (258)A 8πKB ⎜ π 2 N ⎟
⎜ + ⎟ ⎝ A KB ⎠
If we use the area reduction at zero tension as a reference and increase the area from that
condition by progressively increasing membrane tension as in a typical experiment we finally
obtain an expression relating the change in area to the change in tension
⎛ NA ⎞ 1 + A dx A dx ΔA minus int minus ⎟ k ⎛ NA
int k ⎜equiv minus = BT π 2 K
ln ⎜ B T ⎞ 2 ⎟ cong B ln 1 + (259)
Nl ⎜ ⎟A A A 8π KB ⎜ 1 + m ⎟ 8π KB ⎝ π 2 KB ⎠ N = 0 N ⎜ 2 ⎟⎝ π K ⎠ B
where we have used the assumption supported by typical values found from different
experiments that (Nl2 m ) (π 2KB ) ltlt 1
You should recall that this solution was obtained on the assumption that the actual area
of the membrane remained constant and that the reduction in projected or apparent area resulted
from the undulations being progressively smoothed out Once the undulations are eliminated
the only means by which the projected area of the membrane can further increase is by an
increase in the inter-molecular spacing ndash an increase in the actual membrane area When this
occurs we expect to see a transition to the behavior discussed at the beginning of this chapter a
result expressed as
29
CHAPTER 21 CELL MEMBRANE MECHANICS AND ADHESION copyRD Kamm 4615
Fig yy Plots of tension vs normalized surface area for lipid vesicles of different composition Evans amp Rawicz 1990
ΔA N = (260)
A Ke
Thus we have two limiting predictions one for low tensions eqn (259) and another for high
tensions eqn (260) and the transition from one behavior to the other should occur when the
two expressions for ΔAA are of the same magnitude This is supported by experiment (Fig yy) and the results in the two regimes provide a means for estimating the two moduli Ke and KB
30
CHAPTER 21 CELL MEMBRANE MECHANICS AND ADHESION copyRD Kamm 4615
Before leaving this analysis there is one further result that is useful to state although the
derivation is again somewhat involved Once we have the solution for the undulations at a
given level of tension and for given membrane properties the ensemble average displacement
normal to the plane of the membrane can also be computed with the result
⎞
u2 k ⎛= BT NA
3 ln ⎜ 1+ ⎟ (261)4πN ⎝ π 2KB ⎠
Again this supports our intuition that the undulations will be suppressed at low temperature or
high tension And in the limit as N rarr 0 a binomial expansion of the natural log term shows that
the effect of tension drops out and the magnitude of the undulations varies inversely with the
bending stiffness
315 Membrane Fluid Mechanics
Early studies of protein diffusion notably the work of Saffman (Saffman 1976)
examined protein diffusion using an approach akin to that of Einstein in three dimensional space
thereby reducing the problem to one of solving for the mobility b in the equation for diffusivity
D = kBTb (262)
Calculation of the mobility is influenced by the viscous drag on the portion of the protein within
the membrane but also on to the intra- and extracellular domains as well The solution of
interest here is the one applicable in the limit of small μeμm where μe and μm are the external and
membrane viscosities respectively leading to
kBT ⎛ hμm⎞
D = ⎜minusγ + ln ⎟ (263)4πμmh ⎝ aμ e ⎠
where h is the membrane thickness a the radius of the protein (assumed cylindrical) and γ is
Eulers constant (=05772) Membrane viscosity has been estimated from lipid diffusion to be
~2 poise (McCloskey and Poo 1984) When finite mobility is achieved as a result of a finite
domain as for example a circle of radius R the corresponding result is
31
CHAPTER 21 CELL MEMBRANE MECHANICS AND ADHESION copyRD Kamm 4615
k ⎛ 1 D = BT R ⎞ log minus (264)
4πμh ⎝ a 2 ⎠
While this represents a useful point of departure measurements of lateral diffusion in a
membrane have demonstrated a more complex behavior Fluorescence recovery after
photobleaching (FRAP) has enabled the direct tracking of membrane proteins labeled with
fluorescent antibodies More recently single particle tracking methods have been developed
using colloidal gold or a fluorescent particle in conjunction with digital microscopy as well as
controlled movements using microbeads manipulated by an optical trap
From experiments such as these a new picture has emerged While the lateral diffusion
of lipids and a small fraction of trans-membrane proteins satisfy the general form of Saffmans
predictions the predicted diffusivity is greater than that observed experimentally and agrees with
experiments only when a membrane viscosity of 100 poise is used This might be due to the
presence of other proteins in the membrane (Kucik Elson et al 1999) Experiments also show
that many proteins appear to diffuse freely only in small domains typically measuring from 200shy
600 nm remaining confined to these domains for periods on the order of tens of seconds To
explain this behavior the membrane skeleton fence model was proposed (Kusumi Sako et al
1993) in which a membrane-associated matrix constrains the movement of proteins outside of
the domains defined by the matrix filaments Diffusion beyond these barrier filaments can occur
either as a result of random thermal motions of the transmembrane protein matrix filaments or
both or by transient breaks in the filaments Confinement of proteins may play an important role
in rapid and selective signaling Rapid directed motion of membrane-associated proteins has
also been observed and is likely due to active transport by an intracellular actin- or microtubule-
based motor
316 Cell Adhesion
This section deals with how cells adhere to their surroundings and through these sites of
adhesion how they interact with the external world We begin by summarizing the different
types of adhesion their functions and the molecules involved Next we provide a brief
description of the adhesion complexes found in cells and the role of each type Then the
theories that provide a quantitative description of adhesion between single receptor-ligand pairs
are reviewed in the context of the material presented in Chapter xx including the role of thermal
fluctuations Through these theoretical models both the static and dynamic states of adhesion
can be explored for single molecule pairs then for adherent cells Next we develop the different
32
CHAPTER 21 CELL MEMBRANE MECHANICS AND ADHESION copyRD Kamm 4615
approaches that are used to study the adhesion of cells based either on thermodynamics or
mechanics Methods for the measurement of adhesion strength are described providing
estimates for the force that a cell can exert on its surroundings Various examples will be
presented but the adherence of leukocytes to the endothelium and the role of adhesion in cell
migration will receive special attention
Functions of adhesion
Adhesion has been found to be an essential process necessary for a variety of fundamental
cellular functions
bull Structural integrity Adhesion helps to maintain the overall structural integrity of the
tissue in muscle for example it provides the means of force transmission from the cells
to the surrounding matrix to allow contraction In non-contractile cells it still provides
the needed mechanical coupling to the surrounding tissue necessary for a variety of
cellular functions
bull External sensing Adhesion provides a means by which the cell can sense and
subsequently respond to its surroundings Forces transmitted directly to the cell
membrane or to the cytoskeleton via transmembrane proteins may trigger a variety of
biochemical reactions within the cell as we shall see later in Chapter 33
bull Migration Cell-matrix adhesion is an essential element in cell migration a cell propels
its way through tissue or along a surface through a process involving adhesion
contraction and release also described in Chapter 33
bull Regulation of transport Sites of cell-cell adhesion are often important in the regulation
of transport across a cell layer such as in the case of an epithelium or endothelium
bull Communication Sites of mechanical coupling often provide a means of cell-cell
communication as in the case of gap junctions which offer a pathway for the diffusion
of ions and small molecules between adjacent cells
Adhesion molecules
Cells adhere to their surroundings or to an artificial substrate via a wide variety of different
proteins that can be classified into five major families integrins selectins cadherins
immunoglobulins and transmembrane proteoglycans (Table 1) In terms of their mechanism of
attachment to other cells or the external matrix these can be classified as either homophillic ndash
binding to like molecules heterophillic ndash binding to unlike molecules or those that bind to other
cells through an extracellular linker molecule
Integrins one of the largest class of adhesion molecules are primarily used to attach cells
to the extracellular matrix or the basal lamina but are also present in some cell-cell adhesion
33
CHAPTER 21 CELL MEMBRANE MECHANICS AND ADHESION copyRD Kamm 4615
complexes They typically bind to the matrix via the RGD amino acid sequence (arginine
glycine aspartic acid) but can also contain other binding motifs Integrins are heterodimers in
that they always contain an α and a β subunit with the different isoforms determining the specific ligand to which the integrin binds Two specific types of adhesion focal adhesions and hemidesmosomes often contain integrins and the attachments they make can at times be stable but at other times transient so as for example to mediate cell migration The force of adhesion of a single integrin-ligand bond has been measured using atomic force microscopy and found to be in the range of 30-100 pN (Lehenkari and Horton 1999) with a relatively low binding affinity in the range of K ~ 10-6
D to 10-8 molliter By comparison typical cell-surface receptors bind with an affinity in the range of 10-9 to 10-11 molliter Integrins also play an important role in signaling since extracellular integrin binding is known to influence cytoskeletal morphology as well as the state of cell differentiation Adhesion molecules in the selectin family also tend to form transient bonds and are important in leukocyte adhesion and extravasation the migration of the leukocyte through the endothelium and into the tissue Consequently they tend to be found in cells of the circulation and are present both in leukocytes and endothelial cells and are instrumental in adhesion between these two cell-types during leukocyte rolling
Family Location andor Ligands Comments
function recognized
integrins focal adhesions (E) fibronectin relatively low
hemi-desmosomes collagen laminin affinities
leukocyte immunoglobulins (KD~ 10-6-10-8
(spreading) (I) actin filaments molliter)
adhesion primarily
cell-matrix adhesion
but also in some
cell-cell adhesions
selectins circulating cells and carbohydrates require Ca2+
endothelial cells
rolling adhesion
Ig superfamily important in integrins
(immunoglobulin) immune response homophillic
cadherens adherens junctions (E) homophillic require Ca2+
desmosomes (I) actin
34
CHAPTER 21 CELL MEMBRANE MECHANICS AND ADHESION copyRD Kamm 4615
filaments
intermediate
filaments
transmembrane fibroblasts (E) collagen bind various
proteoglycans epithelial cells fibronectin growth factors
(I) actin such as FGF
filaments
heterophillic
Table 1 Cell adhesion molecules and their characteristics
While both integrin and selectin binding is mediated by Ca2+ adhesion via the
immunoglobulin (Ig) superfamily of proteins is Ca2+ independent Some of the most prominent members of this family are the N-CAMs (Neural cell adhesion molecules) and ICAMs (Intracellular cell adhesion molecules) These tend to undergo homophillic bonding but some also bind to members of the integrin family
Cadherens are often expressed in the same cells as the selectins but form much stronger bonds and therefore play an important role in maintaining cell integrity Because of these attributes cadherens are the primary adhesion proteins in desmosomes and adherens junctions the major structural contacts cells form with other cells or the basil lamina These also form homophillic bonds by a Ca2+ dependent mechanism and mediate selective bonding between adjacent cells Cadherens are relatively short as compared to other adhesion molecules being
about 700-750 amino acid residues in length
Types of adhesion complexes
Cells have developed a variety of specialized adhesion complexes each utilizing one or more of
the adhesion molecules of Table 1 and each serving a specific purpose Typically the cell-cell or
cell-surface spacing is in the range of 10-20 nm but this is highly variable ranging from less than
1 nm when controlling transport to over 100 nm in regions where tight control is unnecessary
Below we describe the different types of junctions and where important for function their
mechanical characteristics
Gap junctions Cells need to communicate with their neighbors for a variety of reasons For
example cardiac myocytes transmit signals from cell to cell in order to maintain a synchronous
35
CHAPTER 21 CELL MEMBRANE MECHANICS AND ADHESION copyRD Kamm 4615
wave of contraction This is typically accomplished by providing a pathway for ions and small
signaling molecules between cells called gap junctions (Fig 3110) These minute channels are
typically comprised of a collection of six connexin proteins that cluster together in cylindrical
fashion forming a minute channel that passes molecules and ions less than about 1200 to 2000
MW (15-2 nm) Transport through these channels is regulated and their permeability drops in
the presence of high Ca2+ concentration as when a cell membrane is ruptured or with low pH
Cyclic AMP acting as a second messenger can be exchanged between cells therefore gap
junctions provide a metabolic linkage between neighboring cells and provide a means by which
hormonal stimulation of just one cell can be transmitted to others
Adherens junctions Adherens junctions are belt-like structures that can be though of as the
structural weld that holds two cells together (Fig 3110) Because of their structural role
these junctions formed by homophilic bonding between proteins in the cadheren family are
anchored securely again via the adaptor proteins α β γ-catenin to the cytoskeleton
Desmosomes and Hemidesmosomes If the adherens junctions are the continuous welds between
cells desmosomes are the spot welds Again these serve primarily a structural purpose
joining two neighboring cells via a complex consisting of a dense plaque on the intracellular
sides of both cells extending 15-20 nm into the cell and consisting of a variety of proteins that
attach to keratin filaments part of the intermediate filament network Hemidesmosomes have
similar intracellular structure but attach instead to the basal laminae Based on their different
extracellular attachment sites desmosomes typically link to other cells via cadherens whereas
hemidesmosomes adhere via a type of integrin Both are commonly found in epithelial cells
36
CHAPTER 21 CELL MEMBRANE MECHANICS AND ADHESION copyRD Kamm 4615
Fig 3110 Schematic showing the different types of cell junctions present in an epithelial cell as found in the small intestine Tight junctions near the apical surface essentially prevent the passage of all molecules The spot desmosomes and adherens junctions provide for cell-cell anchoring and the hemidesmosomes for anchoring to the basal lamina Gap junctions provide a means for communication between neighboring cells [Reproduced from Lodish et al Molecular Cell Biology 2000]
Junction type Function Extracellular or Intracellular
adjacent cell attachment
attachment
Adherens structural cell-cell or cell- ECM proteins or actin filaments
matrix cadherins in
adjacent cell
Desmosome structural cell-cell cadherin intermediate
filaments
Hemidesmosome structural cell-matrix basal lamina via intermediate
integrins filaments
Focal adhesions structural cell-matrix ECM proteins actin filaments
via integrins
Tight junction regulate transport between homophillic binding between the
cells and along cell transmembrane proteins occludin or
37
CHAPTER 21 CELL MEMBRANE MECHANICS AND ADHESION copyRD Kamm 4615
membrane claudins
Gap junctions cell-cell communication channels formed by connexin
via ion and small molecule subunits
exchange
Table 2 Adhesion complexes
Focal adhesions A second means by which cells attach to the extracellular matrix is through
focal adhesions These serve a similar function to the hemidesmosomes and share a common
linkage via integrins to the ECM but are attached on the intracellular side instead to the actin
filaments of the cytoskeleton Actin filaments converge at the site of focal adhesions forming
stress fibers strong actin bundles that attach to the β-subunit of the integrins via adapter
proteins such as actinin vinculin and talin Focal adhesions are instrumental in cell migration
and for this purpose need to be easily formed and disrupted as the cell moves forward Release
or de-adhesion of cells is often mediated by a class of peptides called dis-integrins that
competitively bind to the RGD site used by integrins to attach to a variety of matrix molecules
Tight junctions Control of transport is generally mediated by tight junctions that form an
intricate network of seams between two cells (Fig 3111) As their name implies these are the
tightest of the cell-cell junctions and the gaps they leave are often small enough to exclude even
the smallest ions and molecules Formed by homophillic binding between the transmembrane
proteins occluding and claudins tight junctions allow epithelial cells to perform their critical role
in transepithelial transport and provide for maintenance of differences in concentration between
the apical and basal surfaces of these cells Since occludins are not capable of forming rigid
structural bonds with the cytoskeleton they are most often associated in a junctional complex
with adherens junctions or desmosomes that fulfill the structural needs of attachment
38
CHAPTER 21 CELL MEMBRANE MECHANICS AND ADHESION copyRD Kamm 4615
Fig 3111 Tight junctions in an epithelial cell shown schematically (a) in a freeze fracture replica (b) and in a transmission electron micrograph (c) [Reproduced from Alberts et al 1994]
Fig 3112 Two types of bond that attach a cell to the extracellular matrix by means of clusters of integrins On the extracellular side integrins bind to the matrix proteins fibronectin and laminin Inside the cell they attach to the cytoskeleton via adaptor proteins to either actin filaments (focal adhesions) or intermediate filaments (hemidesmosomes) [Reproduced from Lodish et al Molecular Cell Biolology 2000]
Non-specific binding
Cells can adhere to their surroundings by either non-specific or receptor-ligand (specific)
bonding Though both mechanisms are likely active in most situations as we will see receptorshy
39
CHAPTER 21 CELL MEMBRANE MECHANICS AND ADHESION copyRD Kamm 4615
ligand bonding is the stronger of the two by a considerable margin and is therefore the most
relevant biologically In situations for which either the receptors or their ligands are not present
however such as might be the case in certain in vitro experiments non-specific binding can be
important as well
There are essentially three major forms of non-specific attractions to consider
bull Van der Waals ndash These attractive forces arise due to charge interactions in polar
molecules They tend to dominate among the non-specific mechanisms at
intermediate distances around 20-25 nm [see Boal]
bull Electrostatic ndash These interactions can be either attractive or repulsive depending
on the sign of the surface charges and are particularly important during the
approach of two cells since the glycocalyx has a high negative charge density
bull Steric ndash These forces arise due to the steric exclusion of two molecules as they are
brought into close contact In the case of cell-cell interactions steric repulsion is
due to the compression of the two glycocalyx layers and the tendency to resist
compression resulting from osmotic effects and the elasticity of the layer Steric
forces tend to dominate for small separation distances lt 10 nm
In combination these effects combine to produce a net attractive force per unit area of
about 100 Pa at a separation distance of about 25 nm
Adhesion by means of receptor-ligand binding
We can use the analysis of Chapter xx to estimate the strength of a receptor-ligand bond and
based on typical values for bond density calculate the corresponding strength of adhesion
between two cells or between a cell and a surface Recall that the application of force to a
receptor-ligand bond modifies the dissociation rate constant for the binding reaction This effect
can be modeled in several ways but the result obtained by Bell ((Bell 1978)) suggests the
following exponential form for the dissociation rate
0 ⎛ γf ⎞ 0 ⎛ γσ ⎞ kminus = kminus exp⎜ ⎟ = kminus exp⎜ ⎟ (265)
⎝ kBT ⎠ ⎝ NC kBT ⎠
where k0minus is the unforced dissociation rate constant γ is a factor with the units of length that
corresponds roughly with the distance separating the bonded pair at equilibrium NC is the concentration of bonded complex and σ is the average bond force per unit area To determine
40
CHAPTER 21 CELL MEMBRANE MECHANICS AND ADHESION copyRD Kamm 4615
the rate of change of the concentration of bonded pairs one must solve the following rate equation describing the competition between bond formation (first term) and destruction (second term)
dNC ⎛ γσ ⎞
cong k+ (NR minus NC )(NL ) minus kminus NC = k+ (N minus )( 0R NC NL ) minus kminus NC exp⎜ ⎟ (266)
dt ⎝ NC kBT ⎠
where NR and NL are the concentrations of receptors and ligands respectively and we have
assumed that NCltltNL and that all bonds are stressed equally At equilibrium dNCdt=0 and if
the force applied to detach the cell (equal to the average bond stress σ) is increased
incrementally from zero NC will progressively fall to a new equilibrium value At sufficiently
high levels of force however increasing σ further eventually gives rise to a situation in which equilibrium can no longer be achieved through a reduction in NC At that point NC tends toward zero and the cell separates from the surface to which it was attached It can be shown that this
occurs when (Bell 1978)
k 0
α c exp(α + c + 1) = N
k 0 L (267)minus
σ
where α minγ c equiv and σmin is the minimum stress needed to cause detachment For a wide
NRkBT
range of conditions eqn (267) has the approximate solution
⎛ k0 + ⎞
α c cong 07 ln L (268)⎜ 0 N ⎟⎝ kminus ⎠
so that the critical stress for detachment can be expressed as
N 0
σ cong 07 C kBT ⎛ k ⎞ ln⎜
+ min N ⎟ (269)
γ ⎝ k0 L minus ⎠
where NC is determined from setting eqn (266) to zero under these critical conditions
Thermodynamic approach to cell adhesion
Although we focus here on the mechanical aspects of cell adhesion this process can also be
viewed from a thermodynamic perspective In this approach adhesion is considered in terms of
the change in energy specifically the Gibbs free energy G associated with all the individual
receptor-ligand interactions as well as the various non-specific forces of attraction or repulsion
The adhesion of a cell to a given surface then can be viewed as an equilibrium state determined
41
CHAPTER 21 CELL MEMBRANE MECHANICS AND ADHESION copyRD Kamm 4615
by minimization of the free energy If in undergoing a transition from a free state to an adherent
state the system represented by the cell and surface experiences a reduction in free energy ie
ΔGlt0 then adhesion will occur and the equilibrium state of adhesion will be determined by that with the minimum in free energy or the largest value of -ΔG While this approach ignores
many of the subtleties of the interactions and like the analysis above assumes that all receptorshy
ligand interactions are identical from an energetic point of view it is useful in providing some
simple insights as seen in the next two examples
Example Comparison of specific and non-specific adhesive forces Non-specific bonding due
to the combined effects of van der Waals electrostatic and steric forces result in an attractive
stress of approximately 100 Pa Receptor-ligand bonding give rise to forces that can be
estimated from the change in free energy f ~ to 4x10⁻⁴ dynbond = 9x10-11 to 4x10⁻⁹ ΔGr~9x10⁻⁶ Nbond where f is the force required to break the bond and r is a measure of the distance the bond stretches before it breaks Using a typical density of the receptor-ligand complex NC of ~1012-1015 bondsm2 gives a total bond stress of N 1
C x f ~ 9 x 10 to 4x10⁶ Pa The above kinetic approach to estimating bond strength [eqn (269)] gives a value approximately half of that from this equilibrium approach In either case however the conclusion remains the same non-specific binding can under certain circumstances be important since it is comparable to the lowest estimates of receptor-ligand-mediated bond strength but not surprisingly the latter is quite likely to dominate in nearly all practical situations
Example JKR theory for the equilibrium area of adhesion between a cell and substrate
It is well known that cells tend to take on a more flattened shape as the substrate to which they
are attached becomes more strongly adhesive either by coating with a more attractive ligand or
by increasing the concentration of ligand bound to the substrate Conversely less adhesive cells
round up and become more spherical These observations can be explained with the help of a
simple scaling analysis on the assumptions of small deformation of a linear elastic cell
Let the cell be modeled as a homogeneous elastic sphere with elastic modulus E and
initial radius R (Fig 3113) It is then brought into contact with a surface to which it adheres
As the cell adheres it attains a lower energy state characterized by an adhesion energy per unit
area J Formation of a flat adhesion surface however requires deformation within the elastic
cell and an associated increase in the stored elastic energy In Chapter 31 we showed that the
stored elastic energy per unit volume can be written
UE asymp int τεdV asymp int 1 2 Eε 2dV (270)
Vc Vc
42
CHAPTER 21 CELL MEMBRANE MECHANICS AND ADHESION copyRD Kamm 4615
Strain inside the cell can be approximated as the displacement of the cell surface δ divided by the characteristic distance within the cell to which the deformations penetrate a distance that scales with the lateral extent of the contact region 2a so that ε prop δ a where it can easily be shown from the geometry that a 2 asymp 2δR so that ε prop δ R Combining and dropping all numerical constants we obtain the following scaling approximation
δUE prop E ( )δR
3 2 (271)R
An expression for the total energy of the system then can be written
U prop minusJa2 + Eε2a3 prop JδR + Eδ 5 2R1 2 (272) The equilibrium state corresponds to the value of δ having the minimum energy obtain from
partU prop minusJR + Eδ 3 2R1 2 (273)
partδ so that
23 1 3 ⎛ JR12 ⎞ ⎛ JR2 ⎞
δ prop ⎜ ⎟ and a prop ⎜ ⎟ (274)⎝ E ⎠ ⎝ E ⎠
The exact solution to this problem yields the result
⎡ ) 1 3 2 1( minusν 2 ⎤ 9πJR
a = ⎢ ⎥ (275)⎢ 2E ⎥⎣ ⎦
43
CHAPTER 21 CELL MEMBRANE MECHANICS AND ADHESION copyRD Kamm 4615
Elastic modulus E adhesion energy per unit area J
2a
Fig 3113 Experiments to determine the contact area of an iminobiotin functionalized agarosebead on a glass coverslip in water Top Schematic of adherent bead Bottom Results for a range of bead radii Solid line is a fit to the date which obeys the power law a prop R23 consistent with the prediction of JKR theory eqn(276) [Reproduced from (Moy Jiao et al 1999)] This can be compared to the result obtained from a more rigorous analysis
⎡9πJR 2(1minus ν 2 ) 13 ⎤
a = ⎢ ⎥ (276)2E⎢ ⎣ ⎥⎦
and to experimental data obtained from spherical beads made from a 4 agarose gel (Fig 3113)
Models for receptor-mediated adhesion
In Chapter x and in the preceding text we discussed the energetics of bond formation and release
as well as the effect of applied force in altering the energy landscape of the bonded pair and
thereby the rate constants for bond kinetics That analysis has obvious implications to the
44
CHAPTER 21 CELL MEMBRANE MECHANICS AND ADHESION copyRD Kamm 4615
adhesion of cells to substrates the surrounding extracellular matrix and other cells Here we
extend that analysis in the specific case of whole cell adhesion In doing so it will be important
to consider such factors as the distribution type and density of receptor-ligand bonds or
potential bonds and the elastic properties of the structures to which they are anchored On the
intracellular side this involves the series of couplings that link the receptor to the cell In the
simplest case this might simply be a link to the lipid bilayer if the receptor has no intracellular
connections More typically especially for couplings with a structural role it involves a series
of proteins ultimately linking the receptor to the cytoskeleton
The typical setting in vivo is one in which cells adhere to other cells or to the extracellular
matrix Adhesions are more easily probed however through in vitro experiments (described
below) where cell adhesion more often occurs to an artificial substrate mediated through one of
several extracellular proteins that are used to coat the surface Generally either collagen or
fibronectin is used Cells are often adhered to these substrates but to produce a more controlled
environment rigid beads are sometimes coated with the appropriate receptors so that one specific
receptor-ligand interaction can be probed While these systems are useful as models of certain
adhesion phenomena it is important to recognize in the interpretation of these experiments that
when bound to a rigid substrate or bead the binding proteins cannot freely diffuse as they would
in a more natural environment In particular the formation of focal adhesions would not occur in
bead-substrate experiments because the receptors would be constrained from aggregating
It is instructive to begin this discussion with a consideration of a single adhesion bond
for example one linking the actin matrix of the cytoskeleton to a β1 integrin and the integrin
receptor binding to the extracellular matrix beyond the cell membrane (Fig 3114) If the bond
is stressed as for example if the cell experiences a force relative to the ECM it will at first
stretch an amount dictated by the level of force in the bond and the stiffness of the complex
Each bond as well as each protein in the bond complex can be thought of as having a certain
stiffness giving rise to a picture in which several springs are considered connected in series
Forces acting on the adhesion complex are transmitted via this series of bonded proteins between
the CSK and the ECM producing local deformations and stresses in the corresponding matrices
that decay with distance from the adhesion site On the intracellular side these forces are
transmitted via a complex involving vinculin α-actinin paxillin and talin Attachment to the
extracellular matrix is mediated by an RGD sequence (in fibronectin for example) which in turn
has binding sites for collagen and fibrin If the force is sufficiently strong above a certain
threshold value F0 say and applied for a sufficiently long time the bond might be severed (deshy
couple) Typical values of this threshold force lie in the range of 10-100 pN (Evans and Ritchie
1997) but depend as well on the rate at which the force is increased Under more rapid
forcings the threshold is high compared to when the force is increased slowly This simply
45
CHAPTER 21 CELL MEMBRANE MECHANICS AND ADHESION copyRD Kamm 4615
reflects the fact that detachment is a stochastic process and that at any given level of force there
exists a finite probability of detachment and this probability increases with time
Fig 3114 One type of attachment linking the intracellular actin matrix to the extracellular matrix via an integrin complex that involves in addition vinculin α-actinin paxillin and talin (Reproduced from Lodish et al Molecular Cell Biolology 2000)
We need also to consider that in equilibrium a fraction Φ = K(1+K)-1 (where K is the
equilibrium constant) of the receptors will be bound at any given time and that the receptorshy
ligand complexes are continually cycling between the bound and unbound states characterized
by their respective rate constants
On a larger scale numerous adhesion sites typically act in parallel each contributing
some amount to the total adhesion force If the force transmitted by each single adhesion
complex is F and the density of adhesion sites (per unit membrane area) is NC then the stress
acting on the cell is the product F NC This gives a somewhat false impression however as it is
unlikely that each adhesion complex carries an equal force Put another way there exists a local
stress τ that can be thought of as the product of the average force per bond times the bond
density This stress is typically non-uniform In the adhesion of a cell to a flat substrate the
bonds near the periphery of the contact zone determine the strength of the cell against
detachment and when the cell is subjected to a detaching force the stresses are concentrated in
46
CHAPTER 21 CELL MEMBRANE MECHANICS AND ADHESION copyRD Kamm 4615
this peripheral region as depicted in Fig 3115 In the vicinity of the edge of adhesion several
factors will influence the stress distribution including the mechanical properties of the membrane
(in particular the bending stiffness KB) the receptor density the spring constants of the bond
and the bond strength
N
Region of adhesion
x1
Fig 3115 Schematic model of a cell membrane being detached from a substrate by application of a tension force N The membrane is free to the left of the dash-dot line and adherent to the right Forces and moments are transmitted through the membrane which adheres to the membrane through receptor-ligand bonds represented by a continuous distrubution p(x1)
To illustrate consider the following simple model for an adherent cell being peeled away
from its substrate by a force that generates a tension N in the membrane (Fig 3115)
Deformations in the membrane are described by eqn (223) where it can be shown that the
bending term dominates provided KbL2 gtN where L is the characteristic length in the x1 direction
(due to the small length scales involved) and the external membrane force (p in the membrane
equation) is now the non-uniform stress due to adhesion bonds As a simple first approximation
we take p = k(δminusδ0) with δ-δ0 being the amount of stretch in the receptor-ligand bond springs
and k an effective bond spring constant Recognizing that p approaches zero far from the edge
(see Fig 319) the membrane displacement and the spring displacement are related u3 = δ-δ0
Thus eqn (228) is written
⎛ part 4 u
KB⎜ 3
⎞ 4 ⎟ = NC F = NC ku
⎝ partx ⎠ 3 (277)1
This can be solved directly showing that the distance of separation between the cell membrane
and substrate grows in an exponential fashion with distance Even more simply a scaling
47
CHAPTER 21 CELL MEMBRANE MECHANICS AND ADHESION copyRD Kamm 4615
analysis of eqn (277) in which the term on the left is approximated by Kbu3w4 where w is the
characteristic distance over which u3 varies tells us that the stresses are concentrated in a region
of width
K
w prop B4 (278)
NC k
near the cell periphery Similarly we can estimate that the cell membrane will detach from the
substrate if N gt FoNCw where F0 is a measure of the force in a single bond at the time of bond
rupture and that the rate of peeling can be roughly approximated as the product of the
disassociation rate k -- (bondss) from eqn (265) and the distance between bonds (N -12C )
Although this provides some insight into how the peeling rate depends on the various factors it fails to capture the fact that the cell remains in an equilibrium attached state even for non-zero levels of tension reflecting that even under force a balance can exist between the rates of formation and rupture of receptor-ligand complexes (Ra Picart et al 1999)
It is also of interest to note that in the region near the edge of the attachment zone(x1=0
in Fig 3115) the membrane acts as a beam subjected to a moment due to the applied tension
This moment is balanced by a force couple due to tension in the adhesion complexes right
adjacent to the edge in combination with a compressive stress between the cell and substrate a
little further in In typical situations this compressive stress can approach levels as high as one
atmosphere and can act to effectively smooth the membrane and recruit new attachment sights While using these continuum descriptions it is important to keep in mind the true
discrete nature of the individual bonds represented in the model as a continuous adhesive
surface This is brought to light by a simple calculation in which the characteristic length over
which the applied tension is supported w is compared to the inter-receptor spacing N -12C
Using typical values for the parameters NC = 103 complexesμm-2 k = 10-5 to 10-6 Nm Kb = 1 to 2x10-18 Nm we find that w cong 01 to 03 μm and the inter-complex spacing N minus1 2
C cong 003 μm While it is reassuring to see that w is typically less than the inter-complex spacing the difference is small It is therefore not surprising that the actual process of cell peeling is stochastic in nature occurring in a sequence of more-or-less discrete steps with a velocity of peeling that varies widely from the mean
The interplay between receptor-ligand bonding and membrane stiffness also determines whether a cell will spread over a surface or peel away from it under a given tension Membrane bending stiffness acts to maintain the membrane and substrate within close proximity near the edge of contact (Fig 3115) Spreading can occur only if their separation distance is within the extended length of the receptor ligand bond over a distance comparable to the linear spacing
48
CHAPTER 21 CELL MEMBRANE MECHANICS AND ADHESION copyRD Kamm 4615
between neighboring bonds ( N minus1 2 C ) Under high tension the surfaces rapidly diverge and
spreading is prevented if the tension is sufficiently low receptor-ligand bonding can occur and spreading can occur
Measurements of adhesion
A variety of methods have been used to experimentally determine the strength of adhesion either
of individual receptor-ligand bonds or populations of bonds as in the case of entire cells
Whole cell experiments are more common and typically require less experimental
sophistication The drawback of course is that they provide only for estimates of average
properties and require certain assumptions regarding the distribution of cell-substrate adhesive
stress for interpretation to the level of a single bond Several of these methods are described
next
Centrifugal cell adhesion assays In this experiment cells are allowed to attached to a substrate
then are placed in a centrifuge rotating at speed ω positioned a distance r from the center of
rotation and oriented so that the net centrifugal force is acting to separate the cell from the
substrate Using the arrangement shown in Fig 3116 (right) the acceleration of the cells is 2ω r and the net force acting on a cell of volume Vc is F = (ρc minus ρf )ω 2rVc where the fluid and cell densities are ρf and ρc respectively
Interpreting these results we can make several different assumptions each leading to a different estimate for the maximum force experienced by the binding complex If we simply assume that all receptor-ligand complexes support an equal fraction of the total force F then the force per bond is f = F (πa 2NC ) where NC is the concentration of bond complexes However as the cell tears away from the substrate the edge bonds will break first since these experience the greatest level of force An alternative approach then is to assume that the adhesion complexes around the cell circumference support the entire load leading to the estimate f = F 2( πaN 1 2 ) recognizing that N1 2
C C is the average distance between bonds A somewhatmore accurate value for f might be obtained if we assume that all complexes within the distance w given by eqn (278) support the load In any of these cases once the centrifugal force exceeds some critical limit since the number of receptors supporting the load falls as the region of contact becomes smaller the force per bond increases and the cell will rapidly detach
Stochastic variability also needs to be taken into account however since even under a constant load any single bond has a finite probability of failure under a given level of force The equilibrium state of the cell then should be viewed as one in which the rate of bond formation equals the rate of bond breakage with increasing force having the effect of reducing the
49
CHAPTER 21 CELL MEMBRANE MECHANICS AND ADHESION copyRD Kamm 4615
probability that the bond will remain intact These effects can be addressed using the methods described in more detail in Chapter xx Parallel flow assay Another common method for assessing cell adhesion is to plate the cells onto one wall of a parallel flow chamber subject them to a fluid dynamic shear stress and observe at what flow rate the cells begin to release If we ignore flow details in the immediate vicinity of the cell the shear stress can be estimated from the solution for a fully developed (Poiseuille) velocity profile
3V ⎡ y2
⎛ ⎞ ⎤v(y) = ⎢1minus ⎥ (279)
2 ⎝ ⎠ ⎣ ⎢ h ⎥⎦
so that the shear stress acting on the cell is
⎛ dv ⎞ 6μV τw = μ⎜ ⎟ = (280)
⎝ dy ⎠ h y = minush
and the total force can be estimated as F asymp τw Ac where Ac is the surface area of the cell membrane exposed to the flow Consider as an example a flow of culture medium at a rate of 1 mls through a channel of height 01 cm and width 1 cm If the culture medium has a viscosity close to that of water (μ=001 dyns) the shear stress is obtained from eqn (280)
6 sdot (001dyn sdot s) sdot (1ml s) ( 01 sdot10cm2 )τ dyn cm 2w = = 6 = 06Pa
01cm This corresponds roughly with the level of shear stress experience by endothelial cells in the arterial system If we consider that the cell has a surface area with dimensions roughly 100 μm x 10 μm or about 103 μm2 then the total force acting on the cell is obtained by integrating the shear stress over the area of the apical membrane Assuming that the shear stress is uniform the force is simply the product of shear stress and surface area or about 1 nN in the present example Again interpretation of results from such experiments requires careful consideration of the distribution of forces among the individual adhesion complexes In this situation the cell is likely to peel from the upstream edge in much the same manner as occurs in the cell peeling experiment discussed earlier
50
CHAPTER 21 CELL MEMBRANE MECHANICS AND ADHESION copyRD Kamm 4615
Radial flow and spinning disk assays One disadvantage of the parallel flow assay is that all cells are subjected to essentially the same level of shear stress so the flow rate needs to be incrementally varied in order to determine the level of force required for detachment These two systems using an axisymmetric geometry circumvent this problem by producing an easily characterized radial variation in shear stress In the case of the radial flow assay fluid enters through a central channel and flows radially outward through the narrow gap between two circular plates From conservation of mass the mean flow velocity is given by
QV = (281)
2πrh and sufficiently far from the center (rgtgth) the velocity profile is parabolic as in the parallel flow assay and the shear stress is again governed by eqn (280) using (281) for V Q
ω
(Not to scale)
v
h h
Cell layer rc Ce l l layer rc
r r
Fig 3116 Schematic diagram showing the radial flow assay (left) and the spinning disk assay (right) In the radial flow assay shear stress attains a maximum value near the center and falls with increasing radius r whereas in the spinning disk system maximum shear stress is experienced at large r In the spinning disk assay cells are grown on one disk and the opposite disk is rotated at constant speed Provided the rate of rotation is sufficiently small that inertial effects can be neglected the velocity is purely in the circumferential direction and the profile is linear between the two plates so that the shear stress experienced by the cells can easily be computed as
ωr τw = μ (282)
h
51
CHAPTER 21 CELL MEMBRANE MECHANICS AND ADHESION copyRD Kamm 4615
In both of these cases as in the parallel flow assay the total force is obtained by integrating the shear stress over the cell surface and the distribution of force among the adhesion complexes is weighted toward those located near the upstream end of the cell This can also be seen by consideration of the torque exerted by shear stress on the cell that must be balanced by a nonshyuniform contact stress with the substrate that is greatest near the upstream end Single bond adhesion assays Two other assays provide a means of obtaining estimates for the strength of a single adhesion bond without the need for excessive interpretation These rely on an ability to isolate a small number of bonds or even a single bond and infer bond strength from the step-wise nature of the de-adhesion process associated with breakage of discrete bonds One of these methods employs the atomic force microscope coated with the ligand of an adhesion receptor as shown in Fig 3117 The probe tip is gradually brought up to the cell surface until one or more receptor-ligand bonds are formed When the probe tip is withdrawn it moves along a different trajectory on a force-displacement plot reflecting the forces of adhesion These forces are seen to jump between more or less discrete levels as the probe continues to be moved away from the cell with each jump corresponding to the breakage of a single bond (Fig 3117) Using this method the bond strength between integrin receptor and a variety of RGD-containing ligands was found to lie in the range of 30 to 100 pN (Lehenkari and Horton 1999)
Fig 3117 The strength of a single adhesion bond can be measured by bringing a functionalized tip of an AFM probe up to the cell allowing bonds to form then slowly withdrawing the probe Monitoring the differences between the force displacement curve between the forward and reverse motions the forces necessary to break a single receptor-ligand bond can be determined [Reproduced from (Lehenkari and Horton 1999)]
52
CHAPTER 21 CELL MEMBRANE MECHANICS AND ADHESION copyRD Kamm 4615
A second method is similar in that the discrete increments in force are monitored as individual receptor-ligand bonds are broken but the forces are measured by means of changes in the shape of a giant vesicle the membrane of which contains the ligands have been inserted In this case one vesicle is made effectively rigid due for example to a high surface tension A second vesicle containing the adhesion molecules is also drawn partially into a micropipet but is much more complaint than the first The two vesicles are then brought into point contact so that one or a small number of adhesions are formed As the pipets are moved apart the compliant vesicle distorts due to the force of adhesion which it can be shown is related to the change in dimension of the vesicle in the direction of the force thereby serving as a sensitive force transducer measuring forces in the range of single adhesion receptors or between 1 and 100 pN [Evans 1991 37]
(For specific examples of leukocyte rolling and attachment see Orsello or Chang amp Hammer)
[This process is initiated for example by local infection that causes the release of
chemotactic agents in addition to cytokines hellip
Models of this process draw upon many of the concepts discussed in this chapter ]
Transient cell adhesion
Concepts of transient adhesion and release are of particular importance in the case of leukocyte
rolling adhesion and transmigration across the endothelial layer of a blood vessel In addition
cell migration through extracellular matrix or along a substrate requires the ability of the cell to
both form and release adhesions
One problem that has received considerable attention is the interaction between an
adherent or rolling leukocyte and the adhesion receptors on the endothelium These studies are
complicated by the three-dimensional nature of the flow the compliance of the interacting
surfaces and receptor-ligand dynamics In a series of recent studies Hammer and co-workers
(Chang Tees et al 2000) have addressed several of these issues computing the viscous force
and torque acting upon a sphere near to planar wall from the mobility matrix (Hammer and Apte
1992) and using the ldquoBell modelrdquo of receptor binding (Bell 1978) but neglecting the effects of
cell deformation The Bell model relates the dissociation rate constant kr to the force in the
bond f the thermal energy kBT and a parameter with units of length that depends on the
reactivity of the molecule
kr = ko r exp(γf kBT ) (283)
53
CHAPTER 21 CELL MEMBRANE MECHANICS AND ADHESION copyRD Kamm 4615
A Monte Carlo method is employed at each time step in the calculation to determine bond
formation or breakage In these studies the nature of the leukocyte-endothelial interaction is
characterized as firm adhesion rolling adhesion bimodal adhesion or no adhesion and mapped
as a function of the two parameters of the Bell model in Fig 3 The boundaries of the rolling
adhesion regime are identified for a wall shear rate of 100 s-1 (dotted lines) or 30 and 400 s-1
(solid lines) Most literature values for the Bell model parameters for a variety of selectin
receptors (known to be instrumental in leukocyte rolling) correspond to the rolling adhesion
regime for typical shear rate of 100 s-1 An interesting but counterintuitive result from this study
was the observation that as the bond stiffness was increased from the value used in most
calculations (100 dyne cm-1) adhesiveness decreased which the authors attribute to reduced
deflection for a given level of force leading subsequently to more rapid dissociation
Fig 3118 The state diagram for a leukocyte interacting with an endothelial surface for shear rates ranging from 30 to 400 s-1 For low dissociation rates the leukocyte remains adherent to the surface (lower left) As either (γ) or ( ko
r ) [see Eqn (283) for definitions] is increased the cell first adheres firmly then rolls along the wall then completely detaches (upper right) Rolling adhesion is defined as the regime where rolling occurs over some part of the shear rate range between 30 and 400 s-1 Firm adhesion indicates that cells remain attached even at the highest shear rate no adhesion indicates that cells roll at a velocity gt 50 of the velocity of a non-adherent sphere In the bimodal regime cells are either adherent or non-adherent and do not exhibit rolling Dotted curves correspond to these same boundaries for a shear rate of 100 s-1 Reproduced from Chang et al (2000)
54
CHAPTER 21 CELL MEMBRANE MECHANICS AND ADHESION copyRD Kamm 4615
In another recent study using high-resolution video-microscopy (Schmidtke and Diamond
2000) it was demonstrated that a flowing neutrophil can attach to an adherent platelet via
adhesion molecules located in the tips of the microvilli and form long tethers averaging nearly 10
μm in length but ranging up to 40 μm at extensional rates of 6-40 μm s-1 for shear rates ranging
from 100-250 s-1 The mechanics of tether formation is itself a fascinating topic that is still under
intense investigation Readers interested in pursuing this work in more detail are referred to the
several papers (Hochmuth Shao et al 1996 Dai and Sheetz 1998 Dai and Sheetz 1999) that
identify a number of intriguing phenomena
55
CHAPTER 21 CELL MEMBRANE MECHANICS AND ADHESION copyRD Kamm 4615
317 Nomenclature Parameter Definition Units
R - receptor
L - ligand
C - receptor-ligand complex
G - Gibbs free energy Nm
N - membrane tension Nm
NR - total receptor density -3μm-2 in 2D or μm in 3D NL - total ligand density μm-2 in 2D or μm-3 in 3D N in 2D or μm-3μm-2
C - complex density in 3D NRf - free receptor density m-2 in 2D or m-3μ μ in 3D NLf - free ligand density -2 -3μm in 2D or μm in 3D d+ - forward diffusional rate constant 2 -1μm s-1 in 2D or 3 μm s in 3D d -1
- - reverse diffusional rate constant s r+ - forward reaction rate constant s-1
r- - reverse reaction rate constant s-1 D 2 -1
m - membrane diffusion coefficient μm s D - solution diffusion coefficient m2 s -1s μ Kb - bending stiffness Nm K 0 - equilibrium constant or affinity (zero force) M-1 in 3D and 2μm in 2D = k0
+ k0 minus
K - equilibrium constant M-1 in 3D and m2μ in 2D = k+kshy
k0 - association rate constant (zero force) M-1 s-1 in 3D or m-2 -1+ μ s in 2D
k0 - dissociation rate constant (zero force) s-1 minus
k - association rate constant M-1 s-1 in 3D or m-2 -1+ μ s in 2D
kminus - dissociation rate constant s-1 f - force per bond N F - total adhesion force N γ - empirical parameter μm r0 - distance over which energy minimum acts μm E0 - bond energy J k JK-1
B - Boltzmanns constant T - temperature K τ - bond lifetime s
56
CHAPTER 21 CELL MEMBRANE MECHANICS AND ADHESION copyRD Kamm 4615
τ0 - bond lifetime with zero force s σ - adhesion stress N μm-2 κ - spring constant for receptor-ligand bond N μm-1
57
CHAPTER 21 CELL MEMBRANE MECHANICS AND ADHESION copyRD Kamm 4615
References Bell G I (1978) Models for the specific adhesion of cells to cells Science 200 618-627 Caille N O Thoumine et al (2002) Contribution of the nucleus to the mechanical properties
of endothelial cells J Biomech 35(2) 177-87 Chang K C D F Tees et al (2000) The state diagram for cell adhesion under flow
leukocyte rolling and firm adhesion Proc Natl Acad Sci U S A 97(21) 11262-7 Dai J and M P Sheetz (1998) Cell membrane mechanics Methods Cell Biol 55 157-71 Dai J and M P Sheetz (1999) Membrane tether formation from blebbing cells Biophys J
77(6) 3363-70 Daily Elson et al (1984) Determination of the elastic area compressibility modulus of the
erythrocyte membrane Biophys J 45(4) 671-682 Evans E and K Ritchie (1997) Dynamic strength of molecular adhesion bonds Biophys J
72(4) 1541-55 Evans E A (1983) Bending elastic modulus of red blood cell membrane derived from
buckling instability in micropipet aspiration tests Biophys J 43(1) 27-30 Hammer D A and S M Apte (1992) Simulation of cell rolling and adhesion on surfaces in
shear flow general results and analysis of selectin-mediated neutrophil adhesion Biophys J 63(1) 35-57
Hardt S L (1979) Rates of diffusion controlled reactions in one two and three dimensions Biophysical Chemistry 10 239-243
Hochmuth F M J Y Shao et al (1996) Deformation and flow of membrane into tethers extracted from neuronal growth cones Biophys J 70(1) 358-69
Kucik D F E L Elson et al (1999) Weak dependence of mobility of membrane protein aggregates on aggregate size supports a viscous model of retardation of diffusion Biophys J 76(1 Pt 1) 314-22
Kusumi A Y Sako et al (1993) Confined lateral diffusion of membrane receptors as studied by single particle tracking (nanovid microscopy) Effects of calcium-induced differentiation in cultured epithelial cells Biophys J 65(5) 2021-40
Lehenkari P P and M A Horton (1999) Single integrin molecule adhesion forces in intact cells measured by atomic force microscopy Biochem Biophys Res Commun 259(3) 645-50
McCloskey M and M M Poo (1984) Protein diffusion in cell membranes some biological implications Int Rev Cytol 87 19-81
Meleard P Gerbeaud C Bardusco N Mitov MD and Ferdandex-Puente L (1998) Mechanical properties of model membranes studied from shape transformations of giant vesicles Biochimie 80 401-413
Moy V T Y Jiao et al (1999) Adhesion energy of receptor-mediated interaction measured by elastic deformation Biophys J 76(3) 1632-8
Ra H J C Picart et al (1999) Muscle cell peeling from micropatterned collagen direct probing of focal and molecular properties of matrix adhesion J Cell Sci 112 ( Pt 10) 1425-36
Saffman P G (1976) Bownian motion in thin sheets of viscous fluid Journal of Fluid Mechanics 73 593-602
Schmidtke D W and S L Diamond (2000) Direct observation of membrane tethers formed during neutrophil attachment to platelets or P-selectin under physiological flow J Cell Biol 149(3) 719-30
Sheets E D R Simson et al (1995) New insights into membrane dynamics from the analysis of cell surface interactions by physical methods Curr Opin Cell Biol 7(5) 707-14
58
CHAPTER 21 CELL MEMBRANE MECHANICS AND ADHESION copyRD Kamm 4615
Vink H and B R Duling (1996) Identification of distinct luminal domains for macromolecules erythrocytes and leukocytes within mammalian capillaries Circ Res 79(3) 581-9
Waugh R and E A Evans (1979) Thermoelasticity of red blood cell membrane Biophys J 26(1) 115-31
Zeman K H Engelhard et al (1990) Bending undulations and elasticity of the erythrocyte membrane effects of cell shape and membrane organization Eur Biophys J 18(4) 203shy19
Zhelev D V D Needham et al (1994) Role of the membrane cortex in neutrophil deformation in small pipets Biophys J 67(2) 696-705
59
MIT OpenCourseWarehttpocwmitedu
20310J 3053J 6024J 2797J Molecular Cellular and Tissue BiomechanicsSpring 2015
For information about citing these materials or our Terms of Use visit httpocwmiteduterms
CHAPTER 21 CELL MEMBRANE MECHANICS AND ADHESION copyRD Kamm 4615
of a typical gas-liquid or liquid-liquid interface since it would otherwise give rise to intracellular
pressures on the order of one atmosphere
Pure bending By contrast lipid bilayers exhibit a very low bending stiffness so low that it is
often neglected in models of membrane mechanics It can be important in certain situations
however and is essential for example in analyzing the thermal fluctuations of vesicles discussed
later in this chapter
Bending stiffness arises from the same type of molecular interactions that cause
extensional stiffness When an initially flat bilayer is bent the hydrophilic head groups on the
outside of the bend move further apart while on the inside intermolecular spacing decreases
both represent departures from the equilibrium unstressed state and require energy If the same
forces of interaction are responsible why then is bending stiffness so low While the answer to
this question is not simple one factor is the membrane thickness which you recall is only about
6 nm As the membrane bends therefore the change in the surface area per molecule is
extremely small so the associated extensional strains are also minute
Returning to our simple continuum plate model consider a bending moment applied to
the two ends causing the plate to curve slightly (Fig 316) If the bending is due to moments
applied at the two ends about the x2-axis then the bending moment per unit length is related to
the deflection by
Et 3 ⎛ part 2u ⎞ ⎛ part 2 ⎞
⎜ 3 u
Mα = minus 2 2 ⎟ = minusK B⎜ 32 ⎟ (25)
12(1minus ν ) ⎝ partxα ⎠ ⎝ partxα ⎠
where KB is termed the bending stiffness having units of Nm Implicit in this expression are the
assumptions that there exists a mid-plane (the neutral plane) on which the in-plane stress and
strain are both zero and that straight lines perpendicular to this mid-plane remain straight and
normal to this surface after deformation
Typical values for the bending stiffness KB lie in the range of 10-19 Nm (10-12 dyncm) for
a red blood cell or lipid bilayers (Mohandas amp Evans 1990) This value is larger on the order of
1-2x10-18 Nm (Zhelev Needham et al 1994) for other cell types (eg neutrophils endothelial
cells) that possess a more extensive cortex The methods used to obtain these values will be
described later in this chapter
11
CHAPTER 21 CELL MEMBRANE MECHANICS AND ADHESION copyRD Kamm 4615
Fig 316 Plate subjected to equal moments M1 at the two edges
Example Estimate the moment per unit length acting within an initially flat lipid bilayer (at zero
temperature) associated with a wavelength λ = 5 μm and amplitude ε = 1 μm
Membrane displacement can be approximated by the expression
u3 = ε sin (2πx1 λ) (26)
From eqn (25) above we obtain
2
⎛ 2π ⎞ M1 = KBε sin (2πu )⎝ ⎠ 3 λ (27)λ
Using the values given above the maximum moment per unit length is 0158 pN
Pure shear Shear deformations arise when a membrane is stretched in one direction by a
surface tension N1 (units of forcelength) while the lateral surface contracts under a lesser tension
N2 at constant surface area and in the absence of bending (Fig 317) Surfaces oriented at 45
degrees to the boundaries experience pure shear stresses of magnitude (N1 - N2)2
When subjected to shear stresses in the plane of the membrane a pure lipid bilayer
behaves essentially as a liquid It exhibits a membrane viscosity in that it poses a resisting force
proportional to the rate of shear deformation but only a small shear modulus to static shear
deformations It is not clear in fact whether or not pure lipid bilayers exhibit a non-zero shear
modulus For example the movement of membrane-bound proteins can be described by a
simple diffusion coefficient proportional to the membrane viscosity Typical cell membranes do
exhibit a shear modulus however largely due to the cortex of cytoskeletal filaments that lie on
the intracellular side of the membrane In a red blood cell this matrix as discussed above
12
CHAPTER 21 CELL MEMBRANE MECHANICS AND ADHESION copyRD Kamm 4615
consists of interconnected filamentous spectrin and actin with attachments to the membrane via
ankyrin
N2
N1 N1
N2 Fig 317 A section of membrane subjected to a shear stress of magnitude N1-N22
The equations relating shear stress to shear deformation (Hookes law) from Ch xx can
be applied here
τ12 = τ 21 =2Gε12 (28)
or expressed as a shear force per unit length of membrane
N12 =τ12 h = 2Gε12 = Ksε12 (29)
where we define the membrane shear modulus Ks with units of Nm Typical values lie in the
range of 6-9 x 10⁻⁶ Nm for a red blood cell membrane A pure lipid bilayer exhibits a viscous
resistance to shear deformations characterized by a shear viscosity of about 10-6 Nsm ((Evans
1983))
The 2D elastic plate -- equations of deformation
In the analysis of cellular membranes several unique characteristics need to be taken into
account
1 The membrane is extremely thin relative to its lateral extent If we consider the thickness to
be that of the lipid bilayer by itself then h can be as small as 6 nm compared to a typical cell
dimension on the order of 10s of μm Even if we include the sub-membrane cortex this
13
CHAPTER 21 CELL MEMBRANE MECHANICS AND ADHESION copyRD Kamm 4615
dimension only increases to about 100 nm This tends to favor in-plane stresses over bending
effects2
2 The non-shear deformations are very small with strains of at most a few percent Therefore
linear analysis is appropriate in many situations Note however that nonlinear effects can be
important especially for large shear deformations such as occur in micropipet aspiration of
red blood cells The implications and limitations of this are discussed more fully below
3 The membrane exhibits a very small modulus in plane shear and is often treated as a two-
dimensional liquid While this applies primarily to lipid bilayers when the membrane is
considered to include the cortex greater values of shear modulus can be observed
4 Stresses normal to the membrane are small and can be neglected
5 Membrane motions can be damped either due to viscous dissipation within the bilayer as in
the case of in-plane shear or due to the viscosity of the fluids on the intra- or extracellular
sides of the membrane These latter are especially important when considering motions of
the membrane perpendicular to its plane
6 Inertial effects can be neglected due to the predominance of viscous forces during transient
deformations
With these in mind and acknowledging the limitations of a continuum view of such
structures we treat the membrane as a thin homogeneous plate or membrane in which all the
following must be considered in-plane extension and shear bending viscous damping and
thermal fluctuations
The equations we derive will effectively be integrated through the membrane thickness so
that stresses will be in terms of surface forces (force unit length) These are the in-plane normal
forces (see Fig 318 for definition of the axes and nomenclature) are therefore written as
+ h 2
Nα = int σ α dx3 (210) minus h 2
where h is the membrane thickness and the vertical shearing forces
+ h 2
Vα = (211) minus h
int τα 3dx3
2
The moments acting on the plate edges can be calculated from
2 Whether tension or bending dominates clearly depends on the nature of the experiment If an initially spherical cell is distended tension is most important if the cell shrinks so that the membrane buckles bending effects will be critical
14
CHAPTER 21 CELL MEMBRANE MECHANICS AND ADHESION copyRD Kamm 4615
+h 2
Mα β = int x3τα β dx3 (212)minush 2
x
(c)
Fig 318 (a) A small section of membrane (b) Membrane deflections (c) Nomenclature used in defining the forces acting on a section of membrane (Note that Q is used to represent shear stress in the figure whereas V is used in the text and (xyz) should be (x1x2x3))
In order to distinguish the effects of bending from those giving rise to extension we separate the
normal stress into two parts one representing the mean over the thickness of the membrane
which is simply Nαh and the other representing the deviation from this value denoted as σαprime
Similarly we separate the displacement on the neutral plane unα from that which varies with x3
denoted as uαprime Consequently we can write
N
uα = u n + primeα and = iα u σ α + primeσ α (213)
h
And consistent with the assumption that planar edges initially normal to the membrane remain
planar under bending deformations we have that
15
CHAPTER 21 CELL MEMBRANE MECHANICS AND ADHESION copyRD Kamm 4615
partu uαprime = minus x 3
3 (214)partxα
According to assumption (4) above the relationships between stress and strain become
E σ α = νε β ) α ne β (215)
minus ν2 (ε1 α +
and
E ταβ = εαβ α ne β (216)
(1+ ν )
Since
partuα partunα partu
= αprime ε α = + (217)
partxα partxα partxα
(summation convention not used) We eventually obtain the following expressions for the
bending moment
+h 2 ⎛ part 2 u part 2 ⎞ M 3 u3
α = int σ α x3dx3 = minusKB ne (218)⎜ ⎝
2 + ν ⎟ α β partx 2
minush 2 partxα β ⎠
and
+ h 2 part 2u
M12 = int ε KB (1minus ν) 312 x3dx3 = minus (219)
minus h 2 partx1partx2
where in classical shell theory for continuum materials KB=Eh3(1-ν2) The moments are related
to the shear forces in the plane of the membrane through a moment balance about the x1 axis
giving
partM 12 partM
+ 2 minus V2 = 0 (220)partx1 partx2
so that
part ⎛ part 2 u part 2 u ⎞ part ⎛ part 2 part 2
V = minus 3 + 3 uandV 3 u
K ⎜ ⎟ = minus K ⎜ + 3⎞
2 B ⎟ (221)partx2 ⎝ partx 2 2 ⎠ 1 B 2 2
1 partx2 partx1 ⎝ partx1 partx2 ⎠ A force balance in the direction normal to the membrane yields
16
CHAPTER 21 CELL MEMBRANE MECHANICS AND ADHESION copyRD Kamm 4615
partV1 partV2 part ⎛ partu ⎞ part ⎛ partu ⎞+ + ⎜ N 3 ⎟ + ⎜ N 3 ⎟
2 + p = 0 (222)x 1
part 1 partx2 partx1 ⎝ partx1 ⎠ partx2 ⎝ partx2 ⎠
which upon substitution for V1 and V2 from eqns (221) becomes
⎛ part4u3 part4u part4u3 part part ⎛ ⎞K 3 ⎞ part ⎛ u ⎞
B 4 N 3 partu
+ 2 + minus minus N 3 minus p = 0 (223)⎜ ⎟ ⎜ ⎟ ⎜ ⎟⎝ partx1 partx2partx2 partx4 ⎠ partx ⎝ 1 partx ⎠ partx ⎝ 21 2 2 1 1 2 partx2 ⎠
Recall that the first term in parentheses is due to bending the second and third terms are due to
in-plane extension and the fourth term represents the pressure difference across the membrane
Eqn (223) contains three unknowns the displacement u3 and the two normal forces per
unit length N1 and N2 Fortunately the additional equations required for solution are quite easy
to obtain from simple force balances in the x1 and x2 directions Setting the sum of forces in the
x1 direction equal to zero we obtain (referring to Fig 319)
minus N1(x1) + N1(x1 + dx1)cosθ (x1 + dx1) minus N21 (x2 ) + N21(x2 + dx2 ) = 0 (224)
or
partN1 partN21 partN2 partN + = 0 and similarly + 12 = 0 (225)
partx1 partx2 partx2 partx1
While formidable in its complete form it is reassuring to know that we rarely use eqn
(223) in its entirety and that when certain limiting cases are considered more familiar equations
are obtained It is useful at this stage to consider several of these limits
Fig 319 x1 force balance in the plane of the membrane
17
CHAPTER 21 CELL MEMBRANE MECHANICS AND ADHESION copyRD Kamm 4615
Balance between pressure and surface tension (Laplacersquos Equation) If the in-plane stress is
uniform (Ni=Nj=N) eqn (223) has the form
⎛ part 4u part 4u part 4u ⎞ ⎛ part 2u KB ⎜
3 4 + 2 3 3
2 2 + 4 ⎟ minus N⎜ 3 part 2u
2 + 3 ⎞
2 ⎟ minus p = 0 (226)⎝ partx1 partx1 partx2 partx2 ⎠ ⎝ partx1 partx2 ⎠
and eqn (225) is trivially satisfied If in addition bending stiffness can be neglected then
⎛ part 2 u part 2 ⎞ ⎛ 1 1 ⎞ 3 u
p = minusN ⎜ 3
2 + 2 ⎟ cong N⎜ + ⎟ (227)⎝ partx1 partx2 ⎠ ⎝ R2 R1⎠
for small curvatures where R1 and R2 are the radii of curvature of the membrane about the x1 and
x2 axes respectively This is the well-known Laplacersquos equation with N the surface tension For
a sphere R1 = R2 and the equation simplifies further yielding the equation given on p 10
Balance between pressure and bending Alternatively if all in-plane stresses can be neglected
other than those associated with bending stiffness we obtain the equation generally used for
simple bending of plates and shells
⎛ part 4u part 4u part 4 3 3 u ⎞
KB ⎜ 4 + 2 2 + 3 ⎟ = p (228)
⎝ partx1 partx1 partx2 partx 4 2 2 ⎠
Both of these forms will be used later in this chapter to examine specific problems in cell
membrane mechanics
The conditions under which eqn (226) can be reduced to either (227) or (228) can be
determined by an order of magnitude comparison of the bending and tension terms If we take u
to be a measure of the membrane displacement in the x3 direction and λ to be the characteristic length in the x1 or x2 directions over which u3 varies then the bending term can be shown to scale as K 4 2
Bu λ and the tension term as Nu λ The ratio of these tells us which of the terms dominate in eqn (226) If
KBu λ4 K= B ltlt 1
Nu λ2 Nλ2
then tension dominates and eqn (227) is appropriate Alternatively if
KB gtgt 1 Nλ2
18
CHAPTER 21 CELL MEMBRANE MECHANICS AND ADHESION copyRD Kamm 4615
then bending dominates and eqn (228) should be used If we take values typical of those given
for cells K N = 5x10⁻⁵B = 10-18 Nm Nm λ = 1 μm this ratio equals 002 confirming as we
originally postulated that tension tends of dominate
Nonlinear formulations
Traditionally membrane deformations have been addressed through nonlinear analysis allowing
for large strains especially in shear Here we have chosen to present the linearized equations in
the hope that they will provide clearer insight and for continuity with the approach used in other
chapters of the text For many problems of interest deformations are small and linear theory is
sufficiently accurate In some circumstances however a nonlinear analysis is necessary one
example being the aspiration of a red blood cell membrane into a micropipet For this reason we
present the nonlinear equations in Appendix A for the more advanced reader and to assist in
reading the recent literature on membrane mechanics
Energies of deformation
Although the formulation of the equations of deformation in Section 316 is complete by itself
an alternative approach is often useful in which we consider the strain energy the energy stored
in the membrane due to elastic deformation as a basis for analysis Strain energy is analogous to
the energy stored in a spring by stretching it If the spring is linear with a stiffness k so that the
force F required to lengthen it from x0 to x is k(x-x0) then the energy expended during the
process of lengthening is
x x
U = int Fdx = int k(x minus x0 )dx = 1 2 k(x minus x0)
2 (229)x= x 0 x = x 0
Extensional energy Now consider a section of an elastic membrane of thickness h and lengths
dx1 and dx2 subjected to a uniaxial tension stress σ1 Here as in our previous discussion we
consider two cases first a flat membrane which is being stretched by extensional stresses (the
case at zero temperature) and second the situation in which the surface area of the membrane
projected onto a flat plane increases due to the smoothing of out-of-plane undulations (the
entropic contribution)
As the stress is gradually applied to minimize any dissipative effects the work done by
the external force must equal the gain in elastic energy stored in the plate The work performed
by this stress is
19
CHAPTER 21 CELL MEMBRANE MECHANICS AND ADHESION copyRD Kamm 4615
ε1 ε 1
dU = int σ 1dε 1dx1dx2 dx3 = int Eε1dε1dx1dx2dx3 (230)0 0
By energy conservation the work done in stretching the membrane must be stored as potential
or strain energy in the elastic member Since the right-hand-side of (330) represents the strain
energy in the volume dx1dx2dx3 then the energy per unit volume of membrane is
ε1 ε1
U0 = int σ 1dε1 = int Eε = 1 Eε21dε1 2 1 (231)
0 0
or expressed as energy per unit area of membrane
Ehε2
U 10h = (232)
2 In the somewhat more general case of biaxial strain a similar approach leads to
Eh ⎡ 2 2
( 2 2 ) Eh ⎛ ⎤partu ⎞ uε1 + ε 2 = ⎢⎜
1 ⎛ part
⎟ + ⎜ 2
⎞ U0h = ⎟ ⎥ (233)
2 1( minus ν ) 2 1( minus ν ) ⎢⎝ partx⎣ 1 ⎠ ⎝ partx2 ⎠ ⎥⎦
Note that if the strain is isotropic in that ε1 = ε2 = ε this can also be expressed in terms of the
areal strain with the aid of eqn (23)
2 Eh ⎛ ΔA⎞
U0h = ⎜ ⎟ (234)4 1( minus ν ) ⎝ A0 ⎠
from which it can be seen by eqn (24) that the area expansion modulus has the form
Eh Ke = (235)
2 1( minus ν )
under the assumptions of a homogeneous isotropic elastic membrane This term however only
accounts for the contribution to extensional energy associated with an increase in the surface area
of a membrane Another contribution arises from the change in the membrane surface area
projected onto the x1-x2 plane due to non-uniform displacements perpendicular to the plane of
the membrane in the x3 direction This can be seen from the following one-dimensional
example
Consider a membrane tethered at both ends that exhibits a constant surface tension N
when deformed into a new state defined by u3(x1) Locally the change in length of a segment
initially of length dx is
20
CHAPTER 21 CELL MEMBRANE MECHANICS AND ADHESION copyRD Kamm 4615
( 2 2 dx ) + ( du3 ) minus dx = [1 du3 dx1)2]
12 2 2 + ( dx 1 1
1 minus dx1 asymp (1+ 2 (du3 dx1) )dx1 minus dx1 = 2 (du3 dx ) dx(236) 1 1
[see also Figs 64 and 65 in Boal] The strain is then the change in length over the initial length or
2ε11 = 1
2 (du3 dx1) (237) and the energy per unit area associated with this change in length under a constant tension N is
2 ε N ⎛ partu ⎞
U0h = N1int dε =0
⎜ 3
⎟ (238)2 ⎝ partx1 ⎠
which extending to two dimensions can be written
⎡⎛ ⎞ 2 ⎛ 2⎤ N partu3 partu ⎞U ⎢⎜ ⎟ + ⎜ 3
0h = ⎟ ⎥ (239)2 ⎢⎝ partx1 ⎠ ⎝ partx⎣ 2 ⎠ ⎦ ⎥
It is important to recognize that we now have two expressions associated with the energy of
extension and they represent two distinct phenomena The first [eqn (333)] describes the
energy associated with true areal expansion that is a change in the effective spacing between the
molecules comprising the lipid bilayer The second [eqn (339)] corresponds to the energy
change due to undulations in a membrane with constant intermolecular spacing To see the
distinction between the two consider an experiment in which the pressure inside a cell or a lipid
vesicle is gradually increased by aspiration into a micropipette Initially the projected area of
the membrane rises rapidly with a relatively small increase in membrane tension corresponding
to the smoothing of undulations caused by thermal excitation of the membrane This is followed
at higher tensions by a transition to a regime in which the membrane exhibits a much greater
stiffness corresponding to the situation in which the thermally-induced undulations have been
smoothed out and the true membrane surface area now must increase In the absence of thermal
fluctuations eg at zero temperature only this second regime would be observed [see also
figure from Boal]
Energy of shear deformation Next examine the energy per unit area associated with shear
deformation in the plane of the membrane which can be expressed in the form
2
1 1 2 Gh ⎛ part u1 partu2 ⎞
U0h = 2 hτ12ε12 = 2 hGε12 = ⎜ + ⎟ (240)2 ⎝ partx2 partx1 ⎠
21
CHAPTER 21 CELL MEMBRANE MECHANICS AND ADHESION copyRD Kamm 4615
where we have utilized eqns (28) and (29) to obtain a form similar to that of eqn (234) for
extensional deformation
[See Boal for an alternative form in terms of membrane curvature He also gives a nice
description of bending in bilayer membranes]
Bending energy The contribution due to bending energy is somewhat more difficult to derive
First recognize that only those normal stresses that vary with x3 contribute to the bending
energy that is those contributed by the σ stresses in eqn (213) With this in mind we can
write the expression for the total elastic energy due to bending as
1 1 U = intintint ⎧ [ 2
⎨ ( ) 2 ⎫ σ 1 prime + ( )2
σ 2 prime + 2νσ 1 primeσ prime 2 ] + ( )τ 12 prime ⎬dx (241)⎩2E 2G ⎭ 1dx2dx3
Substituting for the stresses and strains from eqns (215)-(217) this can be re-cast in the
following form
⎧ 2 ⎫K ⎛ 2
part 2 2u ⎡ 2 u part ⎞ part 2u 2 part 2 ⎤ part u ⎛ u ⎞
U = B intint ⎜ 3 3 ⎟ 1 minus ν ) 3 3 2 minus ⎜ 3 ⎟⎨ 2 + 2 minus 2( 2 ⎬dx1dx (242)⎢ ⎥2 ⎝ partx1 partx2 ⎠ partx1 partx2 ⎝ partx1partx2 ⎠ 2
⎩ ⎣ ⎦ ⎭
It can be shown ((Meleard 1998)) that the integral of the second term in the integrand above [the
one multiplied by 2(1-ν)] is globally constant under deformation if the membrane remains a
closed surface with no holes Assuming that to be the case we obtain for the total bending strain
energy
KB ⎛
2 part 2u part 2
= intint ⎜ 3 u2 + 3 ⎞
U ⎟2 dx1dx2 + const (243)
2 ⎝ partx1 partx2 ⎠
Since we typically are concerned with changes in energy the constant will arbitrarily be set to
zero Thus the energy per unit area or energy density of bending deformations can be written
2 K ⎛ part 2 part 2 ⎞
0 = B u⎜
3 uU h 2 + 3
2 ⎟ (244)2 ⎝ partx1 partx2 ⎠
Note that the term in parentheses is proportional to the mean curvature of the surface Often the
surface has a natural mean curvature in the unstressed state If that curvature is c0 the bending
energy expression is modified slightly to the form
22
CHAPTER 21 CELL MEMBRANE MECHANICS AND ADHESION copyRD Kamm 4615
2 K ⎛ part 2 part 2 ⎞
U0 = B u⎜
3 uh 2 + 3
2 minus c0⎟ (245)2 ⎝ partx1 partx2 ⎠
Another common form of this expression is obtained by recognizing that the first two terms in
parentheses represent the linearized form of the sum of the principal curvatures (the largest and
smallest curvatures at a point) denoted c1 and c2 so that eqn (345) can be written
K
U2 B
0h = (c1 + c2 minus c0 ) 2
Although each of these expressions for strain energy density has been derived individually they
of course all contribute in the general situation and are linearly additive In that regard several
points are worthy of note First one can obtain some idea of the relative importance of
extension shear and bending deformations in a given situation simply by comparing their
relative energies just as was done in the last section by comparison of the bending and tension
terms in eqn (226) Not surprisingly the comparison leads to the same expressions we obtained
before for when either bending or tension is dominant Second due to the small shear modulus
of most cell membranes the energy stored in shear deformation can generally be neglected And
finally a comment is warranted concerning the energy due to tension Various simplifying
assumptions can be made depending on the cell type being considered and the nature of the
stress to which the cell (or vesicle) is being subjected but generally the lipid bilayer can be
considered to be of constant area unless it experiences grossly non-physiologic levels of stress
Thus the main contribution to extensional energy is that represented by eqn (339) associated
with the smoothing of membrane undulations
Other Factors Influencing Membrane Motion
Thermal fluctuations Biological membranes of all types can be seen to fluctuate due to
Brownian motion of the surrounding molecules if viewed with sufficient resolution These
fluctuations are in fact often used to measure the membrane bending stiffness since thermal
effects are seen as motions in the membrane of relatively long wavelength favoring bending
energies as compared to extensional or shear (see eqn (223)) To account for these effects it is
customary to add a time-dependent forcing term to eqn (223) η(t) the magnitude of which
scales with kBT We analyze thermal motions later and use them as a means of determining the
bending stiffness of a membrane
23
CHAPTER 21 CELL MEMBRANE MECHANICS AND ADHESION copyRD Kamm 4615
Damping due to external fluids When a membrane fluctuates in a direction perpendicular to its
plane velocities are induced in the surrounding fluids and due to the resulting shear stresses
energy is dissipated These motions are extremely complex to model precisely and depend on
both the nature of the surrounding medium (its rheological properties) and the bounding
geometry In lieu of a complete and rigorous analysis a local damping term is sometimes added
to the membrane force balance equation (eqn (223)) to approximate these effects Its form is
based on the presumption that externally induced velocities scale with the velocity of the wall
and that shear forces in the external fluid scale with the induced shear rates and velocities
Accordingly eqn (223) is modified by the addition of a term of the form μm partu3 partt where μμ is
the effective viscosity of the external fluid The equation that results from the addition of both
thermal forcing and external fluid viscosity is
partu ⎛ part 43 u 4
3 part u part+ 3 part 4u ⎞ part ⎛ ⎞ part ⎛ ⎞
B ⎜ 3 partu u
μm K 4 + 2 2 2 + 4 ⎟ minus ⎜ N3
⎟ minus part 1 ⎜ N
3
partt ⎝ x partx partx partx ⎠ partx ⎝ partx ⎠ partx ⎝ 2 ⎟ = p + η(t) (246)1 1 2 2 1 1 2 partx2 ⎠
An expression of similar form for a linear polymer is sometimes referred to as the Rouse
equation
314 Measurements of Membrane Elastic Parameters
Although the analogy has limitations it is useful at the onset to think of the cell as a fluid-filled
balloon or bag Just as in the case of a balloon the elastic properties of the membrane can be
determined by any experiment in which the membrane tension changes while its area is
measured In the simple example of a spherical balloon tension can be computed from the
inflating pressure and the measured radius the latter also yielding the surface area Ignoring for
now the thermal-induced fluctuations in a real cell membrane (ie assuming the cell to be at zero
temperature) the calculations become particularly simple Furthermore we will consider cells
for which the cytoplasm can be considered to fluid-like having no elasticity We return to
address both issues shortly
Osmotic swelling
Perhaps the simplest method to inflate the cell and measure the membrane elastic properties is to
cause the cell to swell by changing the osmolarity of the external fluid and simultaneously
monitoring the change in cell volume The change in transmembrane pressure mirrors the
24
CHAPTER 21 CELL MEMBRANE MECHANICS AND ADHESION copyRD Kamm 4615
change in osmotic pressure brought about by successive additions of a solute to which the
membrane is impermeable For ions and small molecules the osmotic pressure π can be
calculated from the vant Hoff equation
π = RT sum Ci (247)
i
where Ci are the molar concentrations of all solutes to which the membrane is impermeable For
larger molecules such as proteins their contribution to osmotic pressure is much larger than
indicted by this equation
Consider for example a spherical cell expanded osmotically so that the internal
hydrostatic pressure relative to external pressure is pc Microscopic examination yields a value
for the cell radius Rc Using these values in combination with Laplaces law [eqn (227)] gives
us the tension in this state and eqn (24) provides its relationship to the extensional modulus
p R Δ A
N = c c = Ke (248) 2 A0
The observed change in radius allows calculation of ΔA In practice identification of the reference state at zero pc is problematic due to the presence of thermal fluctuations but if Ke can be assumed constant for relatively small changes in area it is possible to extrapolate back to the zero-stress state from two measurements at elevated pc [Example red blood cell] Micropipet aspiration
One of the first methods used to measure the extensional modulus of the cell membrane involved
drawing a cell slightly deflated into a micropipet simultaneously monitoring the dimensions of
the cell and the pressure in the micropipet (Daily Elson et al 1984) Since on the time scale of
the experiment the volume of the cell could be assumed constant the shape change due to
aspiration of the cell causes increases in both internal pressure and surface tension both of which
are assumed spatially uniform Once the tension is large enough (or the temperature low
enough) to dampen the amplitude of any thermal fluctuations the cell can be treated assuming
that membrane extension is the dominant means by which the pressure drop across the
membrane is balanced [For further discussion on the thermal fluctuations and the relationship
between micropipet pressure and intracellular pressure see Daily and Evans and Rawicz Phys
Rev 1990 See also figure on p 199 of Boal Example the two regimes in membrane stiffness]
For the situation shown in Figxx the cell is drawn into the micropipet to the point at
which the portion of the cell external to the cell is spherical of radius Rc With the assumptions
25
CHAPTER 21 CELL MEMBRANE MECHANICS AND ADHESION copyRD Kamm 4615
stated above the (uniform) pressure within the cell can be related to it surface tension (assumed
uniform) and the radii of curvature of the main body of the cell Rc and the portion inside the
pipet a using Laplaces law [eqn (227)]
pc = 2N Rc = minus Δp + 2N a (249)
where pressures are referenced to the external ambient pressure Reorganizing to solve for
surface tension we obtain
ΔpN = (250)
⎛ 1 1 ⎞ 2⎜ minus ⎟
⎝ a Rc ⎠
The surface area corresponding to a given N is obtained from geometry summing the membrane
surface areas of the cylinder and hemisphere inside the micropipet and the truncated spherical
surface outside yielding for the areal strain the approximate expression
[(a R )2 (a R )3
Δ c minus c cong
]ΔLA
A 2a
Fig xx Micropipet aspiration of a neutrophil
This relationship between N and ΔAA can be used to calculate the area expansion modulus
Eh AK 0
e = = N 2 1( minus ν ) ΔA
where the expression involving Youngrsquos modulus assumes the membrane to be isotropic and
homogeneous The relationship could however be non-linear in that the value of Ke may vary
with the degree of area expansion a linear relationship between N and ΔA yields a constant value for Ke
It is important to note that neither of these approaches osmotic inflation or micropipet aspiration provides us with any information on the bending modulus To be precise bending
26
CHAPTER 21 CELL MEMBRANE MECHANICS AND ADHESION copyRD Kamm 4615
does play a role in the micropipet experiments but the effects are so small as to be negligible and are typically ignored That is not to say that bending is always negligible however as discussed next
Monitoring thermal fluctuations in the membrane
When a cell or lipid vesicle is observed floating free unattached to a substrate it can be seen to
exhibit time-dependent undulations as a result of collisions with the surrounding molecules
undergoing thermal motion In the case of a lipid vesicle with diameter in the range of 10
microns these undulations can be readily observed microscopically In smaller cells such as red
blood cells the motions can be inferred from the flickering phenomenon associated with the light
interference as the cell thickness changes (Zeman Engelhard et al 1990) Since the amplitude of
the membrane undulations depends on the stiffness of the membrane to bending and its surface
tension it is reasonable to expect that measures of this amplitude can be used to infer the
membrane elastic parameters In order to illustrate the method while avoiding some of the
algebraic complexity consider undulations in a flat membrane with significant bending stiffness
and a constant surface tension The relationship between the motion and the elastic properties
can be found by considering the total energy of the membrane obtained by summing the
energies per unit area from eqns (239) and (244) and integrating over the membrane surface
area Am
⎧ 2⎪ K ⎛ 2 2
part 2 u part 2 ⎡ 3 u ⎞
3 N ⎛ partu ⎞ ⎛ int 3 partu ⎞ ⎤⎫
B 3 ⎪
U0hdA = int ⎨ ⎜ 2 + 2 ⎟ + ⎢⎜ ⎟ + ⎜ ⎟ ⎥⎬dA (251) A ⎠ 2
m Am ⎪ 2 ⎝ partx1 partx2 ⎢⎝ partx1 ⎠ ⎝ partx2 ⎠ ⎥⎪ ⎩ ⎣ ⎦⎭
In writing the energy in this form we have omitted the contribution due to shear deformation
consistent with the fluid-like character of a pure lipid bilayer and have taken the surface tension
to be uniform during the deformation In this example membrane surface area changes only as a
result of fluctuations from the mean [u3(xxx2) = 0] configuration that is we now ignore the
contribution due to changes in intermolecular spacing and only consider changes in the area
projected onto the x1-x2 plane
It is convenient to use the method of Fourier transforms to represent the undulations of a
membrane normal to the x1-x2 plane which in two-dimensions leads to [see also class notes on
bending of cytoskeletal filaments alternatively use Fourier series representation]
A A
u3 (x) = u3 (x1 x2 ) = 2 intexp(iq sdot x)b(q)dq =
2 int exp(iq 4 1x1)exp(iq2 x2 )b(q1q2 )dq1dq
π 4π 2
(252)
27
CHAPTER 21 CELL MEMBRANE MECHANICS AND ADHESION copyRD Kamm 4615
where qα = 2π λα is the wavenumber of the particular mode and b(q) is the continuous analogue of the discrete coefficients that multiply each mode in a Fourier series representation
Here the algebra gets complicated so only the results of the analysis will be presented however
those wishing to see a more complete derivation should see (Boal Mechanics of the Cell
Cambridge University Press 2002) Introducing eqn (352) into (351) yields
1 ⎛ A ⎞2
int U q 40hdA = ⎜ ⎟ int (
KB + Nq2 )b(q)b(q)dq (253)2 2 ⎝ π ⎠
where b(q) is the complex conjugate of b(q) Now we invoke a previous result that at equilibrium energy is equally distributed among the various modes and that each mode has an
average energy of kBT2 Taking the ensemble average of eqn (353) and equating the energy of
each mode represented in the result to kBT2 (by the equipartition theorem) leads to
k Aq)b q) = BT
b( (K q4 2 (254)
B + Nq
This is a useful result in itself demonstrating that all modes tend to be suppressed as temperature
falls or as bending stiffness or surface tension rise In addition it shows the tendency for higher
modes to be of smaller amplitude But this equation has further value in that it can be used to
obtain a direct expression for the change in apparent area of a membrane as tension increases
Consider the true surface area of a membrane A represented as the sum of its projected
area and the additional area associated with thermally-induced undulations
⎡ 1 ⎛ 2⎤u ⎞ 2 part ⎛ partu ⎞
A = int dx + ⎢ 3 3 2
int ⎜ ⎢⎝ partx 2 ⎟ + ⎜
⎠ ⎝ partx 2 ⎟ ⎥dx (255)⎠ ⎥
⎣ 1 2 ⎦
Isolating the term representing the area reduction due to thermal fluctuations expressing u3 in
terms of its Fourier transform and taking the ensemble average of the result leads to
1 ⎛ A ⎞2
A minus int dx = ⎜ ⎟ int q 2 b(q)b(q) dq (256)2 ⎝ 2π ⎠
Combing eqn (254) from above with this expression yields
28
CHAPTER 21 CELL MEMBRANE MECHANICS AND ADHESION copyRD Kamm 4615
A minus int dx
kBT dq kBT dq2
= A 8π 2 int =
N int (257)
+ KBq 2 8π 2 N + KBq 2
where in writing the last term we have introduced the relations dq = dq2dθ 2 and int dθ = 2π By a simple substitution z = q2 + (N KB )the integral can be evaluated We do so however
between specified limits on the assumptions that the range of possible wavenumbers is restricted
by the size of the membrane on one hand (q = (πA12)) and the distance between individual lipid molecules on the other (q = πlm) Integrating between these limits results in
⎛ π 2 N ⎞
int dx 2 +A ⎜ ⎟ minus k T l K
= B ln⎜ m B ⎟ (258)A 8πKB ⎜ π 2 N ⎟
⎜ + ⎟ ⎝ A KB ⎠
If we use the area reduction at zero tension as a reference and increase the area from that
condition by progressively increasing membrane tension as in a typical experiment we finally
obtain an expression relating the change in area to the change in tension
⎛ NA ⎞ 1 + A dx A dx ΔA minus int minus ⎟ k ⎛ NA
int k ⎜equiv minus = BT π 2 K
ln ⎜ B T ⎞ 2 ⎟ cong B ln 1 + (259)
Nl ⎜ ⎟A A A 8π KB ⎜ 1 + m ⎟ 8π KB ⎝ π 2 KB ⎠ N = 0 N ⎜ 2 ⎟⎝ π K ⎠ B
where we have used the assumption supported by typical values found from different
experiments that (Nl2 m ) (π 2KB ) ltlt 1
You should recall that this solution was obtained on the assumption that the actual area
of the membrane remained constant and that the reduction in projected or apparent area resulted
from the undulations being progressively smoothed out Once the undulations are eliminated
the only means by which the projected area of the membrane can further increase is by an
increase in the inter-molecular spacing ndash an increase in the actual membrane area When this
occurs we expect to see a transition to the behavior discussed at the beginning of this chapter a
result expressed as
29
CHAPTER 21 CELL MEMBRANE MECHANICS AND ADHESION copyRD Kamm 4615
Fig yy Plots of tension vs normalized surface area for lipid vesicles of different composition Evans amp Rawicz 1990
ΔA N = (260)
A Ke
Thus we have two limiting predictions one for low tensions eqn (259) and another for high
tensions eqn (260) and the transition from one behavior to the other should occur when the
two expressions for ΔAA are of the same magnitude This is supported by experiment (Fig yy) and the results in the two regimes provide a means for estimating the two moduli Ke and KB
30
CHAPTER 21 CELL MEMBRANE MECHANICS AND ADHESION copyRD Kamm 4615
Before leaving this analysis there is one further result that is useful to state although the
derivation is again somewhat involved Once we have the solution for the undulations at a
given level of tension and for given membrane properties the ensemble average displacement
normal to the plane of the membrane can also be computed with the result
⎞
u2 k ⎛= BT NA
3 ln ⎜ 1+ ⎟ (261)4πN ⎝ π 2KB ⎠
Again this supports our intuition that the undulations will be suppressed at low temperature or
high tension And in the limit as N rarr 0 a binomial expansion of the natural log term shows that
the effect of tension drops out and the magnitude of the undulations varies inversely with the
bending stiffness
315 Membrane Fluid Mechanics
Early studies of protein diffusion notably the work of Saffman (Saffman 1976)
examined protein diffusion using an approach akin to that of Einstein in three dimensional space
thereby reducing the problem to one of solving for the mobility b in the equation for diffusivity
D = kBTb (262)
Calculation of the mobility is influenced by the viscous drag on the portion of the protein within
the membrane but also on to the intra- and extracellular domains as well The solution of
interest here is the one applicable in the limit of small μeμm where μe and μm are the external and
membrane viscosities respectively leading to
kBT ⎛ hμm⎞
D = ⎜minusγ + ln ⎟ (263)4πμmh ⎝ aμ e ⎠
where h is the membrane thickness a the radius of the protein (assumed cylindrical) and γ is
Eulers constant (=05772) Membrane viscosity has been estimated from lipid diffusion to be
~2 poise (McCloskey and Poo 1984) When finite mobility is achieved as a result of a finite
domain as for example a circle of radius R the corresponding result is
31
CHAPTER 21 CELL MEMBRANE MECHANICS AND ADHESION copyRD Kamm 4615
k ⎛ 1 D = BT R ⎞ log minus (264)
4πμh ⎝ a 2 ⎠
While this represents a useful point of departure measurements of lateral diffusion in a
membrane have demonstrated a more complex behavior Fluorescence recovery after
photobleaching (FRAP) has enabled the direct tracking of membrane proteins labeled with
fluorescent antibodies More recently single particle tracking methods have been developed
using colloidal gold or a fluorescent particle in conjunction with digital microscopy as well as
controlled movements using microbeads manipulated by an optical trap
From experiments such as these a new picture has emerged While the lateral diffusion
of lipids and a small fraction of trans-membrane proteins satisfy the general form of Saffmans
predictions the predicted diffusivity is greater than that observed experimentally and agrees with
experiments only when a membrane viscosity of 100 poise is used This might be due to the
presence of other proteins in the membrane (Kucik Elson et al 1999) Experiments also show
that many proteins appear to diffuse freely only in small domains typically measuring from 200shy
600 nm remaining confined to these domains for periods on the order of tens of seconds To
explain this behavior the membrane skeleton fence model was proposed (Kusumi Sako et al
1993) in which a membrane-associated matrix constrains the movement of proteins outside of
the domains defined by the matrix filaments Diffusion beyond these barrier filaments can occur
either as a result of random thermal motions of the transmembrane protein matrix filaments or
both or by transient breaks in the filaments Confinement of proteins may play an important role
in rapid and selective signaling Rapid directed motion of membrane-associated proteins has
also been observed and is likely due to active transport by an intracellular actin- or microtubule-
based motor
316 Cell Adhesion
This section deals with how cells adhere to their surroundings and through these sites of
adhesion how they interact with the external world We begin by summarizing the different
types of adhesion their functions and the molecules involved Next we provide a brief
description of the adhesion complexes found in cells and the role of each type Then the
theories that provide a quantitative description of adhesion between single receptor-ligand pairs
are reviewed in the context of the material presented in Chapter xx including the role of thermal
fluctuations Through these theoretical models both the static and dynamic states of adhesion
can be explored for single molecule pairs then for adherent cells Next we develop the different
32
CHAPTER 21 CELL MEMBRANE MECHANICS AND ADHESION copyRD Kamm 4615
approaches that are used to study the adhesion of cells based either on thermodynamics or
mechanics Methods for the measurement of adhesion strength are described providing
estimates for the force that a cell can exert on its surroundings Various examples will be
presented but the adherence of leukocytes to the endothelium and the role of adhesion in cell
migration will receive special attention
Functions of adhesion
Adhesion has been found to be an essential process necessary for a variety of fundamental
cellular functions
bull Structural integrity Adhesion helps to maintain the overall structural integrity of the
tissue in muscle for example it provides the means of force transmission from the cells
to the surrounding matrix to allow contraction In non-contractile cells it still provides
the needed mechanical coupling to the surrounding tissue necessary for a variety of
cellular functions
bull External sensing Adhesion provides a means by which the cell can sense and
subsequently respond to its surroundings Forces transmitted directly to the cell
membrane or to the cytoskeleton via transmembrane proteins may trigger a variety of
biochemical reactions within the cell as we shall see later in Chapter 33
bull Migration Cell-matrix adhesion is an essential element in cell migration a cell propels
its way through tissue or along a surface through a process involving adhesion
contraction and release also described in Chapter 33
bull Regulation of transport Sites of cell-cell adhesion are often important in the regulation
of transport across a cell layer such as in the case of an epithelium or endothelium
bull Communication Sites of mechanical coupling often provide a means of cell-cell
communication as in the case of gap junctions which offer a pathway for the diffusion
of ions and small molecules between adjacent cells
Adhesion molecules
Cells adhere to their surroundings or to an artificial substrate via a wide variety of different
proteins that can be classified into five major families integrins selectins cadherins
immunoglobulins and transmembrane proteoglycans (Table 1) In terms of their mechanism of
attachment to other cells or the external matrix these can be classified as either homophillic ndash
binding to like molecules heterophillic ndash binding to unlike molecules or those that bind to other
cells through an extracellular linker molecule
Integrins one of the largest class of adhesion molecules are primarily used to attach cells
to the extracellular matrix or the basal lamina but are also present in some cell-cell adhesion
33
CHAPTER 21 CELL MEMBRANE MECHANICS AND ADHESION copyRD Kamm 4615
complexes They typically bind to the matrix via the RGD amino acid sequence (arginine
glycine aspartic acid) but can also contain other binding motifs Integrins are heterodimers in
that they always contain an α and a β subunit with the different isoforms determining the specific ligand to which the integrin binds Two specific types of adhesion focal adhesions and hemidesmosomes often contain integrins and the attachments they make can at times be stable but at other times transient so as for example to mediate cell migration The force of adhesion of a single integrin-ligand bond has been measured using atomic force microscopy and found to be in the range of 30-100 pN (Lehenkari and Horton 1999) with a relatively low binding affinity in the range of K ~ 10-6
D to 10-8 molliter By comparison typical cell-surface receptors bind with an affinity in the range of 10-9 to 10-11 molliter Integrins also play an important role in signaling since extracellular integrin binding is known to influence cytoskeletal morphology as well as the state of cell differentiation Adhesion molecules in the selectin family also tend to form transient bonds and are important in leukocyte adhesion and extravasation the migration of the leukocyte through the endothelium and into the tissue Consequently they tend to be found in cells of the circulation and are present both in leukocytes and endothelial cells and are instrumental in adhesion between these two cell-types during leukocyte rolling
Family Location andor Ligands Comments
function recognized
integrins focal adhesions (E) fibronectin relatively low
hemi-desmosomes collagen laminin affinities
leukocyte immunoglobulins (KD~ 10-6-10-8
(spreading) (I) actin filaments molliter)
adhesion primarily
cell-matrix adhesion
but also in some
cell-cell adhesions
selectins circulating cells and carbohydrates require Ca2+
endothelial cells
rolling adhesion
Ig superfamily important in integrins
(immunoglobulin) immune response homophillic
cadherens adherens junctions (E) homophillic require Ca2+
desmosomes (I) actin
34
CHAPTER 21 CELL MEMBRANE MECHANICS AND ADHESION copyRD Kamm 4615
filaments
intermediate
filaments
transmembrane fibroblasts (E) collagen bind various
proteoglycans epithelial cells fibronectin growth factors
(I) actin such as FGF
filaments
heterophillic
Table 1 Cell adhesion molecules and their characteristics
While both integrin and selectin binding is mediated by Ca2+ adhesion via the
immunoglobulin (Ig) superfamily of proteins is Ca2+ independent Some of the most prominent members of this family are the N-CAMs (Neural cell adhesion molecules) and ICAMs (Intracellular cell adhesion molecules) These tend to undergo homophillic bonding but some also bind to members of the integrin family
Cadherens are often expressed in the same cells as the selectins but form much stronger bonds and therefore play an important role in maintaining cell integrity Because of these attributes cadherens are the primary adhesion proteins in desmosomes and adherens junctions the major structural contacts cells form with other cells or the basil lamina These also form homophillic bonds by a Ca2+ dependent mechanism and mediate selective bonding between adjacent cells Cadherens are relatively short as compared to other adhesion molecules being
about 700-750 amino acid residues in length
Types of adhesion complexes
Cells have developed a variety of specialized adhesion complexes each utilizing one or more of
the adhesion molecules of Table 1 and each serving a specific purpose Typically the cell-cell or
cell-surface spacing is in the range of 10-20 nm but this is highly variable ranging from less than
1 nm when controlling transport to over 100 nm in regions where tight control is unnecessary
Below we describe the different types of junctions and where important for function their
mechanical characteristics
Gap junctions Cells need to communicate with their neighbors for a variety of reasons For
example cardiac myocytes transmit signals from cell to cell in order to maintain a synchronous
35
CHAPTER 21 CELL MEMBRANE MECHANICS AND ADHESION copyRD Kamm 4615
wave of contraction This is typically accomplished by providing a pathway for ions and small
signaling molecules between cells called gap junctions (Fig 3110) These minute channels are
typically comprised of a collection of six connexin proteins that cluster together in cylindrical
fashion forming a minute channel that passes molecules and ions less than about 1200 to 2000
MW (15-2 nm) Transport through these channels is regulated and their permeability drops in
the presence of high Ca2+ concentration as when a cell membrane is ruptured or with low pH
Cyclic AMP acting as a second messenger can be exchanged between cells therefore gap
junctions provide a metabolic linkage between neighboring cells and provide a means by which
hormonal stimulation of just one cell can be transmitted to others
Adherens junctions Adherens junctions are belt-like structures that can be though of as the
structural weld that holds two cells together (Fig 3110) Because of their structural role
these junctions formed by homophilic bonding between proteins in the cadheren family are
anchored securely again via the adaptor proteins α β γ-catenin to the cytoskeleton
Desmosomes and Hemidesmosomes If the adherens junctions are the continuous welds between
cells desmosomes are the spot welds Again these serve primarily a structural purpose
joining two neighboring cells via a complex consisting of a dense plaque on the intracellular
sides of both cells extending 15-20 nm into the cell and consisting of a variety of proteins that
attach to keratin filaments part of the intermediate filament network Hemidesmosomes have
similar intracellular structure but attach instead to the basal laminae Based on their different
extracellular attachment sites desmosomes typically link to other cells via cadherens whereas
hemidesmosomes adhere via a type of integrin Both are commonly found in epithelial cells
36
CHAPTER 21 CELL MEMBRANE MECHANICS AND ADHESION copyRD Kamm 4615
Fig 3110 Schematic showing the different types of cell junctions present in an epithelial cell as found in the small intestine Tight junctions near the apical surface essentially prevent the passage of all molecules The spot desmosomes and adherens junctions provide for cell-cell anchoring and the hemidesmosomes for anchoring to the basal lamina Gap junctions provide a means for communication between neighboring cells [Reproduced from Lodish et al Molecular Cell Biology 2000]
Junction type Function Extracellular or Intracellular
adjacent cell attachment
attachment
Adherens structural cell-cell or cell- ECM proteins or actin filaments
matrix cadherins in
adjacent cell
Desmosome structural cell-cell cadherin intermediate
filaments
Hemidesmosome structural cell-matrix basal lamina via intermediate
integrins filaments
Focal adhesions structural cell-matrix ECM proteins actin filaments
via integrins
Tight junction regulate transport between homophillic binding between the
cells and along cell transmembrane proteins occludin or
37
CHAPTER 21 CELL MEMBRANE MECHANICS AND ADHESION copyRD Kamm 4615
membrane claudins
Gap junctions cell-cell communication channels formed by connexin
via ion and small molecule subunits
exchange
Table 2 Adhesion complexes
Focal adhesions A second means by which cells attach to the extracellular matrix is through
focal adhesions These serve a similar function to the hemidesmosomes and share a common
linkage via integrins to the ECM but are attached on the intracellular side instead to the actin
filaments of the cytoskeleton Actin filaments converge at the site of focal adhesions forming
stress fibers strong actin bundles that attach to the β-subunit of the integrins via adapter
proteins such as actinin vinculin and talin Focal adhesions are instrumental in cell migration
and for this purpose need to be easily formed and disrupted as the cell moves forward Release
or de-adhesion of cells is often mediated by a class of peptides called dis-integrins that
competitively bind to the RGD site used by integrins to attach to a variety of matrix molecules
Tight junctions Control of transport is generally mediated by tight junctions that form an
intricate network of seams between two cells (Fig 3111) As their name implies these are the
tightest of the cell-cell junctions and the gaps they leave are often small enough to exclude even
the smallest ions and molecules Formed by homophillic binding between the transmembrane
proteins occluding and claudins tight junctions allow epithelial cells to perform their critical role
in transepithelial transport and provide for maintenance of differences in concentration between
the apical and basal surfaces of these cells Since occludins are not capable of forming rigid
structural bonds with the cytoskeleton they are most often associated in a junctional complex
with adherens junctions or desmosomes that fulfill the structural needs of attachment
38
CHAPTER 21 CELL MEMBRANE MECHANICS AND ADHESION copyRD Kamm 4615
Fig 3111 Tight junctions in an epithelial cell shown schematically (a) in a freeze fracture replica (b) and in a transmission electron micrograph (c) [Reproduced from Alberts et al 1994]
Fig 3112 Two types of bond that attach a cell to the extracellular matrix by means of clusters of integrins On the extracellular side integrins bind to the matrix proteins fibronectin and laminin Inside the cell they attach to the cytoskeleton via adaptor proteins to either actin filaments (focal adhesions) or intermediate filaments (hemidesmosomes) [Reproduced from Lodish et al Molecular Cell Biolology 2000]
Non-specific binding
Cells can adhere to their surroundings by either non-specific or receptor-ligand (specific)
bonding Though both mechanisms are likely active in most situations as we will see receptorshy
39
CHAPTER 21 CELL MEMBRANE MECHANICS AND ADHESION copyRD Kamm 4615
ligand bonding is the stronger of the two by a considerable margin and is therefore the most
relevant biologically In situations for which either the receptors or their ligands are not present
however such as might be the case in certain in vitro experiments non-specific binding can be
important as well
There are essentially three major forms of non-specific attractions to consider
bull Van der Waals ndash These attractive forces arise due to charge interactions in polar
molecules They tend to dominate among the non-specific mechanisms at
intermediate distances around 20-25 nm [see Boal]
bull Electrostatic ndash These interactions can be either attractive or repulsive depending
on the sign of the surface charges and are particularly important during the
approach of two cells since the glycocalyx has a high negative charge density
bull Steric ndash These forces arise due to the steric exclusion of two molecules as they are
brought into close contact In the case of cell-cell interactions steric repulsion is
due to the compression of the two glycocalyx layers and the tendency to resist
compression resulting from osmotic effects and the elasticity of the layer Steric
forces tend to dominate for small separation distances lt 10 nm
In combination these effects combine to produce a net attractive force per unit area of
about 100 Pa at a separation distance of about 25 nm
Adhesion by means of receptor-ligand binding
We can use the analysis of Chapter xx to estimate the strength of a receptor-ligand bond and
based on typical values for bond density calculate the corresponding strength of adhesion
between two cells or between a cell and a surface Recall that the application of force to a
receptor-ligand bond modifies the dissociation rate constant for the binding reaction This effect
can be modeled in several ways but the result obtained by Bell ((Bell 1978)) suggests the
following exponential form for the dissociation rate
0 ⎛ γf ⎞ 0 ⎛ γσ ⎞ kminus = kminus exp⎜ ⎟ = kminus exp⎜ ⎟ (265)
⎝ kBT ⎠ ⎝ NC kBT ⎠
where k0minus is the unforced dissociation rate constant γ is a factor with the units of length that
corresponds roughly with the distance separating the bonded pair at equilibrium NC is the concentration of bonded complex and σ is the average bond force per unit area To determine
40
CHAPTER 21 CELL MEMBRANE MECHANICS AND ADHESION copyRD Kamm 4615
the rate of change of the concentration of bonded pairs one must solve the following rate equation describing the competition between bond formation (first term) and destruction (second term)
dNC ⎛ γσ ⎞
cong k+ (NR minus NC )(NL ) minus kminus NC = k+ (N minus )( 0R NC NL ) minus kminus NC exp⎜ ⎟ (266)
dt ⎝ NC kBT ⎠
where NR and NL are the concentrations of receptors and ligands respectively and we have
assumed that NCltltNL and that all bonds are stressed equally At equilibrium dNCdt=0 and if
the force applied to detach the cell (equal to the average bond stress σ) is increased
incrementally from zero NC will progressively fall to a new equilibrium value At sufficiently
high levels of force however increasing σ further eventually gives rise to a situation in which equilibrium can no longer be achieved through a reduction in NC At that point NC tends toward zero and the cell separates from the surface to which it was attached It can be shown that this
occurs when (Bell 1978)
k 0
α c exp(α + c + 1) = N
k 0 L (267)minus
σ
where α minγ c equiv and σmin is the minimum stress needed to cause detachment For a wide
NRkBT
range of conditions eqn (267) has the approximate solution
⎛ k0 + ⎞
α c cong 07 ln L (268)⎜ 0 N ⎟⎝ kminus ⎠
so that the critical stress for detachment can be expressed as
N 0
σ cong 07 C kBT ⎛ k ⎞ ln⎜
+ min N ⎟ (269)
γ ⎝ k0 L minus ⎠
where NC is determined from setting eqn (266) to zero under these critical conditions
Thermodynamic approach to cell adhesion
Although we focus here on the mechanical aspects of cell adhesion this process can also be
viewed from a thermodynamic perspective In this approach adhesion is considered in terms of
the change in energy specifically the Gibbs free energy G associated with all the individual
receptor-ligand interactions as well as the various non-specific forces of attraction or repulsion
The adhesion of a cell to a given surface then can be viewed as an equilibrium state determined
41
CHAPTER 21 CELL MEMBRANE MECHANICS AND ADHESION copyRD Kamm 4615
by minimization of the free energy If in undergoing a transition from a free state to an adherent
state the system represented by the cell and surface experiences a reduction in free energy ie
ΔGlt0 then adhesion will occur and the equilibrium state of adhesion will be determined by that with the minimum in free energy or the largest value of -ΔG While this approach ignores
many of the subtleties of the interactions and like the analysis above assumes that all receptorshy
ligand interactions are identical from an energetic point of view it is useful in providing some
simple insights as seen in the next two examples
Example Comparison of specific and non-specific adhesive forces Non-specific bonding due
to the combined effects of van der Waals electrostatic and steric forces result in an attractive
stress of approximately 100 Pa Receptor-ligand bonding give rise to forces that can be
estimated from the change in free energy f ~ to 4x10⁻⁴ dynbond = 9x10-11 to 4x10⁻⁹ ΔGr~9x10⁻⁶ Nbond where f is the force required to break the bond and r is a measure of the distance the bond stretches before it breaks Using a typical density of the receptor-ligand complex NC of ~1012-1015 bondsm2 gives a total bond stress of N 1
C x f ~ 9 x 10 to 4x10⁶ Pa The above kinetic approach to estimating bond strength [eqn (269)] gives a value approximately half of that from this equilibrium approach In either case however the conclusion remains the same non-specific binding can under certain circumstances be important since it is comparable to the lowest estimates of receptor-ligand-mediated bond strength but not surprisingly the latter is quite likely to dominate in nearly all practical situations
Example JKR theory for the equilibrium area of adhesion between a cell and substrate
It is well known that cells tend to take on a more flattened shape as the substrate to which they
are attached becomes more strongly adhesive either by coating with a more attractive ligand or
by increasing the concentration of ligand bound to the substrate Conversely less adhesive cells
round up and become more spherical These observations can be explained with the help of a
simple scaling analysis on the assumptions of small deformation of a linear elastic cell
Let the cell be modeled as a homogeneous elastic sphere with elastic modulus E and
initial radius R (Fig 3113) It is then brought into contact with a surface to which it adheres
As the cell adheres it attains a lower energy state characterized by an adhesion energy per unit
area J Formation of a flat adhesion surface however requires deformation within the elastic
cell and an associated increase in the stored elastic energy In Chapter 31 we showed that the
stored elastic energy per unit volume can be written
UE asymp int τεdV asymp int 1 2 Eε 2dV (270)
Vc Vc
42
CHAPTER 21 CELL MEMBRANE MECHANICS AND ADHESION copyRD Kamm 4615
Strain inside the cell can be approximated as the displacement of the cell surface δ divided by the characteristic distance within the cell to which the deformations penetrate a distance that scales with the lateral extent of the contact region 2a so that ε prop δ a where it can easily be shown from the geometry that a 2 asymp 2δR so that ε prop δ R Combining and dropping all numerical constants we obtain the following scaling approximation
δUE prop E ( )δR
3 2 (271)R
An expression for the total energy of the system then can be written
U prop minusJa2 + Eε2a3 prop JδR + Eδ 5 2R1 2 (272) The equilibrium state corresponds to the value of δ having the minimum energy obtain from
partU prop minusJR + Eδ 3 2R1 2 (273)
partδ so that
23 1 3 ⎛ JR12 ⎞ ⎛ JR2 ⎞
δ prop ⎜ ⎟ and a prop ⎜ ⎟ (274)⎝ E ⎠ ⎝ E ⎠
The exact solution to this problem yields the result
⎡ ) 1 3 2 1( minusν 2 ⎤ 9πJR
a = ⎢ ⎥ (275)⎢ 2E ⎥⎣ ⎦
43
CHAPTER 21 CELL MEMBRANE MECHANICS AND ADHESION copyRD Kamm 4615
Elastic modulus E adhesion energy per unit area J
2a
Fig 3113 Experiments to determine the contact area of an iminobiotin functionalized agarosebead on a glass coverslip in water Top Schematic of adherent bead Bottom Results for a range of bead radii Solid line is a fit to the date which obeys the power law a prop R23 consistent with the prediction of JKR theory eqn(276) [Reproduced from (Moy Jiao et al 1999)] This can be compared to the result obtained from a more rigorous analysis
⎡9πJR 2(1minus ν 2 ) 13 ⎤
a = ⎢ ⎥ (276)2E⎢ ⎣ ⎥⎦
and to experimental data obtained from spherical beads made from a 4 agarose gel (Fig 3113)
Models for receptor-mediated adhesion
In Chapter x and in the preceding text we discussed the energetics of bond formation and release
as well as the effect of applied force in altering the energy landscape of the bonded pair and
thereby the rate constants for bond kinetics That analysis has obvious implications to the
44
CHAPTER 21 CELL MEMBRANE MECHANICS AND ADHESION copyRD Kamm 4615
adhesion of cells to substrates the surrounding extracellular matrix and other cells Here we
extend that analysis in the specific case of whole cell adhesion In doing so it will be important
to consider such factors as the distribution type and density of receptor-ligand bonds or
potential bonds and the elastic properties of the structures to which they are anchored On the
intracellular side this involves the series of couplings that link the receptor to the cell In the
simplest case this might simply be a link to the lipid bilayer if the receptor has no intracellular
connections More typically especially for couplings with a structural role it involves a series
of proteins ultimately linking the receptor to the cytoskeleton
The typical setting in vivo is one in which cells adhere to other cells or to the extracellular
matrix Adhesions are more easily probed however through in vitro experiments (described
below) where cell adhesion more often occurs to an artificial substrate mediated through one of
several extracellular proteins that are used to coat the surface Generally either collagen or
fibronectin is used Cells are often adhered to these substrates but to produce a more controlled
environment rigid beads are sometimes coated with the appropriate receptors so that one specific
receptor-ligand interaction can be probed While these systems are useful as models of certain
adhesion phenomena it is important to recognize in the interpretation of these experiments that
when bound to a rigid substrate or bead the binding proteins cannot freely diffuse as they would
in a more natural environment In particular the formation of focal adhesions would not occur in
bead-substrate experiments because the receptors would be constrained from aggregating
It is instructive to begin this discussion with a consideration of a single adhesion bond
for example one linking the actin matrix of the cytoskeleton to a β1 integrin and the integrin
receptor binding to the extracellular matrix beyond the cell membrane (Fig 3114) If the bond
is stressed as for example if the cell experiences a force relative to the ECM it will at first
stretch an amount dictated by the level of force in the bond and the stiffness of the complex
Each bond as well as each protein in the bond complex can be thought of as having a certain
stiffness giving rise to a picture in which several springs are considered connected in series
Forces acting on the adhesion complex are transmitted via this series of bonded proteins between
the CSK and the ECM producing local deformations and stresses in the corresponding matrices
that decay with distance from the adhesion site On the intracellular side these forces are
transmitted via a complex involving vinculin α-actinin paxillin and talin Attachment to the
extracellular matrix is mediated by an RGD sequence (in fibronectin for example) which in turn
has binding sites for collagen and fibrin If the force is sufficiently strong above a certain
threshold value F0 say and applied for a sufficiently long time the bond might be severed (deshy
couple) Typical values of this threshold force lie in the range of 10-100 pN (Evans and Ritchie
1997) but depend as well on the rate at which the force is increased Under more rapid
forcings the threshold is high compared to when the force is increased slowly This simply
45
CHAPTER 21 CELL MEMBRANE MECHANICS AND ADHESION copyRD Kamm 4615
reflects the fact that detachment is a stochastic process and that at any given level of force there
exists a finite probability of detachment and this probability increases with time
Fig 3114 One type of attachment linking the intracellular actin matrix to the extracellular matrix via an integrin complex that involves in addition vinculin α-actinin paxillin and talin (Reproduced from Lodish et al Molecular Cell Biolology 2000)
We need also to consider that in equilibrium a fraction Φ = K(1+K)-1 (where K is the
equilibrium constant) of the receptors will be bound at any given time and that the receptorshy
ligand complexes are continually cycling between the bound and unbound states characterized
by their respective rate constants
On a larger scale numerous adhesion sites typically act in parallel each contributing
some amount to the total adhesion force If the force transmitted by each single adhesion
complex is F and the density of adhesion sites (per unit membrane area) is NC then the stress
acting on the cell is the product F NC This gives a somewhat false impression however as it is
unlikely that each adhesion complex carries an equal force Put another way there exists a local
stress τ that can be thought of as the product of the average force per bond times the bond
density This stress is typically non-uniform In the adhesion of a cell to a flat substrate the
bonds near the periphery of the contact zone determine the strength of the cell against
detachment and when the cell is subjected to a detaching force the stresses are concentrated in
46
CHAPTER 21 CELL MEMBRANE MECHANICS AND ADHESION copyRD Kamm 4615
this peripheral region as depicted in Fig 3115 In the vicinity of the edge of adhesion several
factors will influence the stress distribution including the mechanical properties of the membrane
(in particular the bending stiffness KB) the receptor density the spring constants of the bond
and the bond strength
N
Region of adhesion
x1
Fig 3115 Schematic model of a cell membrane being detached from a substrate by application of a tension force N The membrane is free to the left of the dash-dot line and adherent to the right Forces and moments are transmitted through the membrane which adheres to the membrane through receptor-ligand bonds represented by a continuous distrubution p(x1)
To illustrate consider the following simple model for an adherent cell being peeled away
from its substrate by a force that generates a tension N in the membrane (Fig 3115)
Deformations in the membrane are described by eqn (223) where it can be shown that the
bending term dominates provided KbL2 gtN where L is the characteristic length in the x1 direction
(due to the small length scales involved) and the external membrane force (p in the membrane
equation) is now the non-uniform stress due to adhesion bonds As a simple first approximation
we take p = k(δminusδ0) with δ-δ0 being the amount of stretch in the receptor-ligand bond springs
and k an effective bond spring constant Recognizing that p approaches zero far from the edge
(see Fig 319) the membrane displacement and the spring displacement are related u3 = δ-δ0
Thus eqn (228) is written
⎛ part 4 u
KB⎜ 3
⎞ 4 ⎟ = NC F = NC ku
⎝ partx ⎠ 3 (277)1
This can be solved directly showing that the distance of separation between the cell membrane
and substrate grows in an exponential fashion with distance Even more simply a scaling
47
CHAPTER 21 CELL MEMBRANE MECHANICS AND ADHESION copyRD Kamm 4615
analysis of eqn (277) in which the term on the left is approximated by Kbu3w4 where w is the
characteristic distance over which u3 varies tells us that the stresses are concentrated in a region
of width
K
w prop B4 (278)
NC k
near the cell periphery Similarly we can estimate that the cell membrane will detach from the
substrate if N gt FoNCw where F0 is a measure of the force in a single bond at the time of bond
rupture and that the rate of peeling can be roughly approximated as the product of the
disassociation rate k -- (bondss) from eqn (265) and the distance between bonds (N -12C )
Although this provides some insight into how the peeling rate depends on the various factors it fails to capture the fact that the cell remains in an equilibrium attached state even for non-zero levels of tension reflecting that even under force a balance can exist between the rates of formation and rupture of receptor-ligand complexes (Ra Picart et al 1999)
It is also of interest to note that in the region near the edge of the attachment zone(x1=0
in Fig 3115) the membrane acts as a beam subjected to a moment due to the applied tension
This moment is balanced by a force couple due to tension in the adhesion complexes right
adjacent to the edge in combination with a compressive stress between the cell and substrate a
little further in In typical situations this compressive stress can approach levels as high as one
atmosphere and can act to effectively smooth the membrane and recruit new attachment sights While using these continuum descriptions it is important to keep in mind the true
discrete nature of the individual bonds represented in the model as a continuous adhesive
surface This is brought to light by a simple calculation in which the characteristic length over
which the applied tension is supported w is compared to the inter-receptor spacing N -12C
Using typical values for the parameters NC = 103 complexesμm-2 k = 10-5 to 10-6 Nm Kb = 1 to 2x10-18 Nm we find that w cong 01 to 03 μm and the inter-complex spacing N minus1 2
C cong 003 μm While it is reassuring to see that w is typically less than the inter-complex spacing the difference is small It is therefore not surprising that the actual process of cell peeling is stochastic in nature occurring in a sequence of more-or-less discrete steps with a velocity of peeling that varies widely from the mean
The interplay between receptor-ligand bonding and membrane stiffness also determines whether a cell will spread over a surface or peel away from it under a given tension Membrane bending stiffness acts to maintain the membrane and substrate within close proximity near the edge of contact (Fig 3115) Spreading can occur only if their separation distance is within the extended length of the receptor ligand bond over a distance comparable to the linear spacing
48
CHAPTER 21 CELL MEMBRANE MECHANICS AND ADHESION copyRD Kamm 4615
between neighboring bonds ( N minus1 2 C ) Under high tension the surfaces rapidly diverge and
spreading is prevented if the tension is sufficiently low receptor-ligand bonding can occur and spreading can occur
Measurements of adhesion
A variety of methods have been used to experimentally determine the strength of adhesion either
of individual receptor-ligand bonds or populations of bonds as in the case of entire cells
Whole cell experiments are more common and typically require less experimental
sophistication The drawback of course is that they provide only for estimates of average
properties and require certain assumptions regarding the distribution of cell-substrate adhesive
stress for interpretation to the level of a single bond Several of these methods are described
next
Centrifugal cell adhesion assays In this experiment cells are allowed to attached to a substrate
then are placed in a centrifuge rotating at speed ω positioned a distance r from the center of
rotation and oriented so that the net centrifugal force is acting to separate the cell from the
substrate Using the arrangement shown in Fig 3116 (right) the acceleration of the cells is 2ω r and the net force acting on a cell of volume Vc is F = (ρc minus ρf )ω 2rVc where the fluid and cell densities are ρf and ρc respectively
Interpreting these results we can make several different assumptions each leading to a different estimate for the maximum force experienced by the binding complex If we simply assume that all receptor-ligand complexes support an equal fraction of the total force F then the force per bond is f = F (πa 2NC ) where NC is the concentration of bond complexes However as the cell tears away from the substrate the edge bonds will break first since these experience the greatest level of force An alternative approach then is to assume that the adhesion complexes around the cell circumference support the entire load leading to the estimate f = F 2( πaN 1 2 ) recognizing that N1 2
C C is the average distance between bonds A somewhatmore accurate value for f might be obtained if we assume that all complexes within the distance w given by eqn (278) support the load In any of these cases once the centrifugal force exceeds some critical limit since the number of receptors supporting the load falls as the region of contact becomes smaller the force per bond increases and the cell will rapidly detach
Stochastic variability also needs to be taken into account however since even under a constant load any single bond has a finite probability of failure under a given level of force The equilibrium state of the cell then should be viewed as one in which the rate of bond formation equals the rate of bond breakage with increasing force having the effect of reducing the
49
CHAPTER 21 CELL MEMBRANE MECHANICS AND ADHESION copyRD Kamm 4615
probability that the bond will remain intact These effects can be addressed using the methods described in more detail in Chapter xx Parallel flow assay Another common method for assessing cell adhesion is to plate the cells onto one wall of a parallel flow chamber subject them to a fluid dynamic shear stress and observe at what flow rate the cells begin to release If we ignore flow details in the immediate vicinity of the cell the shear stress can be estimated from the solution for a fully developed (Poiseuille) velocity profile
3V ⎡ y2
⎛ ⎞ ⎤v(y) = ⎢1minus ⎥ (279)
2 ⎝ ⎠ ⎣ ⎢ h ⎥⎦
so that the shear stress acting on the cell is
⎛ dv ⎞ 6μV τw = μ⎜ ⎟ = (280)
⎝ dy ⎠ h y = minush
and the total force can be estimated as F asymp τw Ac where Ac is the surface area of the cell membrane exposed to the flow Consider as an example a flow of culture medium at a rate of 1 mls through a channel of height 01 cm and width 1 cm If the culture medium has a viscosity close to that of water (μ=001 dyns) the shear stress is obtained from eqn (280)
6 sdot (001dyn sdot s) sdot (1ml s) ( 01 sdot10cm2 )τ dyn cm 2w = = 6 = 06Pa
01cm This corresponds roughly with the level of shear stress experience by endothelial cells in the arterial system If we consider that the cell has a surface area with dimensions roughly 100 μm x 10 μm or about 103 μm2 then the total force acting on the cell is obtained by integrating the shear stress over the area of the apical membrane Assuming that the shear stress is uniform the force is simply the product of shear stress and surface area or about 1 nN in the present example Again interpretation of results from such experiments requires careful consideration of the distribution of forces among the individual adhesion complexes In this situation the cell is likely to peel from the upstream edge in much the same manner as occurs in the cell peeling experiment discussed earlier
50
CHAPTER 21 CELL MEMBRANE MECHANICS AND ADHESION copyRD Kamm 4615
Radial flow and spinning disk assays One disadvantage of the parallel flow assay is that all cells are subjected to essentially the same level of shear stress so the flow rate needs to be incrementally varied in order to determine the level of force required for detachment These two systems using an axisymmetric geometry circumvent this problem by producing an easily characterized radial variation in shear stress In the case of the radial flow assay fluid enters through a central channel and flows radially outward through the narrow gap between two circular plates From conservation of mass the mean flow velocity is given by
QV = (281)
2πrh and sufficiently far from the center (rgtgth) the velocity profile is parabolic as in the parallel flow assay and the shear stress is again governed by eqn (280) using (281) for V Q
ω
(Not to scale)
v
h h
Cell layer rc Ce l l layer rc
r r
Fig 3116 Schematic diagram showing the radial flow assay (left) and the spinning disk assay (right) In the radial flow assay shear stress attains a maximum value near the center and falls with increasing radius r whereas in the spinning disk system maximum shear stress is experienced at large r In the spinning disk assay cells are grown on one disk and the opposite disk is rotated at constant speed Provided the rate of rotation is sufficiently small that inertial effects can be neglected the velocity is purely in the circumferential direction and the profile is linear between the two plates so that the shear stress experienced by the cells can easily be computed as
ωr τw = μ (282)
h
51
CHAPTER 21 CELL MEMBRANE MECHANICS AND ADHESION copyRD Kamm 4615
In both of these cases as in the parallel flow assay the total force is obtained by integrating the shear stress over the cell surface and the distribution of force among the adhesion complexes is weighted toward those located near the upstream end of the cell This can also be seen by consideration of the torque exerted by shear stress on the cell that must be balanced by a nonshyuniform contact stress with the substrate that is greatest near the upstream end Single bond adhesion assays Two other assays provide a means of obtaining estimates for the strength of a single adhesion bond without the need for excessive interpretation These rely on an ability to isolate a small number of bonds or even a single bond and infer bond strength from the step-wise nature of the de-adhesion process associated with breakage of discrete bonds One of these methods employs the atomic force microscope coated with the ligand of an adhesion receptor as shown in Fig 3117 The probe tip is gradually brought up to the cell surface until one or more receptor-ligand bonds are formed When the probe tip is withdrawn it moves along a different trajectory on a force-displacement plot reflecting the forces of adhesion These forces are seen to jump between more or less discrete levels as the probe continues to be moved away from the cell with each jump corresponding to the breakage of a single bond (Fig 3117) Using this method the bond strength between integrin receptor and a variety of RGD-containing ligands was found to lie in the range of 30 to 100 pN (Lehenkari and Horton 1999)
Fig 3117 The strength of a single adhesion bond can be measured by bringing a functionalized tip of an AFM probe up to the cell allowing bonds to form then slowly withdrawing the probe Monitoring the differences between the force displacement curve between the forward and reverse motions the forces necessary to break a single receptor-ligand bond can be determined [Reproduced from (Lehenkari and Horton 1999)]
52
CHAPTER 21 CELL MEMBRANE MECHANICS AND ADHESION copyRD Kamm 4615
A second method is similar in that the discrete increments in force are monitored as individual receptor-ligand bonds are broken but the forces are measured by means of changes in the shape of a giant vesicle the membrane of which contains the ligands have been inserted In this case one vesicle is made effectively rigid due for example to a high surface tension A second vesicle containing the adhesion molecules is also drawn partially into a micropipet but is much more complaint than the first The two vesicles are then brought into point contact so that one or a small number of adhesions are formed As the pipets are moved apart the compliant vesicle distorts due to the force of adhesion which it can be shown is related to the change in dimension of the vesicle in the direction of the force thereby serving as a sensitive force transducer measuring forces in the range of single adhesion receptors or between 1 and 100 pN [Evans 1991 37]
(For specific examples of leukocyte rolling and attachment see Orsello or Chang amp Hammer)
[This process is initiated for example by local infection that causes the release of
chemotactic agents in addition to cytokines hellip
Models of this process draw upon many of the concepts discussed in this chapter ]
Transient cell adhesion
Concepts of transient adhesion and release are of particular importance in the case of leukocyte
rolling adhesion and transmigration across the endothelial layer of a blood vessel In addition
cell migration through extracellular matrix or along a substrate requires the ability of the cell to
both form and release adhesions
One problem that has received considerable attention is the interaction between an
adherent or rolling leukocyte and the adhesion receptors on the endothelium These studies are
complicated by the three-dimensional nature of the flow the compliance of the interacting
surfaces and receptor-ligand dynamics In a series of recent studies Hammer and co-workers
(Chang Tees et al 2000) have addressed several of these issues computing the viscous force
and torque acting upon a sphere near to planar wall from the mobility matrix (Hammer and Apte
1992) and using the ldquoBell modelrdquo of receptor binding (Bell 1978) but neglecting the effects of
cell deformation The Bell model relates the dissociation rate constant kr to the force in the
bond f the thermal energy kBT and a parameter with units of length that depends on the
reactivity of the molecule
kr = ko r exp(γf kBT ) (283)
53
CHAPTER 21 CELL MEMBRANE MECHANICS AND ADHESION copyRD Kamm 4615
A Monte Carlo method is employed at each time step in the calculation to determine bond
formation or breakage In these studies the nature of the leukocyte-endothelial interaction is
characterized as firm adhesion rolling adhesion bimodal adhesion or no adhesion and mapped
as a function of the two parameters of the Bell model in Fig 3 The boundaries of the rolling
adhesion regime are identified for a wall shear rate of 100 s-1 (dotted lines) or 30 and 400 s-1
(solid lines) Most literature values for the Bell model parameters for a variety of selectin
receptors (known to be instrumental in leukocyte rolling) correspond to the rolling adhesion
regime for typical shear rate of 100 s-1 An interesting but counterintuitive result from this study
was the observation that as the bond stiffness was increased from the value used in most
calculations (100 dyne cm-1) adhesiveness decreased which the authors attribute to reduced
deflection for a given level of force leading subsequently to more rapid dissociation
Fig 3118 The state diagram for a leukocyte interacting with an endothelial surface for shear rates ranging from 30 to 400 s-1 For low dissociation rates the leukocyte remains adherent to the surface (lower left) As either (γ) or ( ko
r ) [see Eqn (283) for definitions] is increased the cell first adheres firmly then rolls along the wall then completely detaches (upper right) Rolling adhesion is defined as the regime where rolling occurs over some part of the shear rate range between 30 and 400 s-1 Firm adhesion indicates that cells remain attached even at the highest shear rate no adhesion indicates that cells roll at a velocity gt 50 of the velocity of a non-adherent sphere In the bimodal regime cells are either adherent or non-adherent and do not exhibit rolling Dotted curves correspond to these same boundaries for a shear rate of 100 s-1 Reproduced from Chang et al (2000)
54
CHAPTER 21 CELL MEMBRANE MECHANICS AND ADHESION copyRD Kamm 4615
In another recent study using high-resolution video-microscopy (Schmidtke and Diamond
2000) it was demonstrated that a flowing neutrophil can attach to an adherent platelet via
adhesion molecules located in the tips of the microvilli and form long tethers averaging nearly 10
μm in length but ranging up to 40 μm at extensional rates of 6-40 μm s-1 for shear rates ranging
from 100-250 s-1 The mechanics of tether formation is itself a fascinating topic that is still under
intense investigation Readers interested in pursuing this work in more detail are referred to the
several papers (Hochmuth Shao et al 1996 Dai and Sheetz 1998 Dai and Sheetz 1999) that
identify a number of intriguing phenomena
55
CHAPTER 21 CELL MEMBRANE MECHANICS AND ADHESION copyRD Kamm 4615
317 Nomenclature Parameter Definition Units
R - receptor
L - ligand
C - receptor-ligand complex
G - Gibbs free energy Nm
N - membrane tension Nm
NR - total receptor density -3μm-2 in 2D or μm in 3D NL - total ligand density μm-2 in 2D or μm-3 in 3D N in 2D or μm-3μm-2
C - complex density in 3D NRf - free receptor density m-2 in 2D or m-3μ μ in 3D NLf - free ligand density -2 -3μm in 2D or μm in 3D d+ - forward diffusional rate constant 2 -1μm s-1 in 2D or 3 μm s in 3D d -1
- - reverse diffusional rate constant s r+ - forward reaction rate constant s-1
r- - reverse reaction rate constant s-1 D 2 -1
m - membrane diffusion coefficient μm s D - solution diffusion coefficient m2 s -1s μ Kb - bending stiffness Nm K 0 - equilibrium constant or affinity (zero force) M-1 in 3D and 2μm in 2D = k0
+ k0 minus
K - equilibrium constant M-1 in 3D and m2μ in 2D = k+kshy
k0 - association rate constant (zero force) M-1 s-1 in 3D or m-2 -1+ μ s in 2D
k0 - dissociation rate constant (zero force) s-1 minus
k - association rate constant M-1 s-1 in 3D or m-2 -1+ μ s in 2D
kminus - dissociation rate constant s-1 f - force per bond N F - total adhesion force N γ - empirical parameter μm r0 - distance over which energy minimum acts μm E0 - bond energy J k JK-1
B - Boltzmanns constant T - temperature K τ - bond lifetime s
56
CHAPTER 21 CELL MEMBRANE MECHANICS AND ADHESION copyRD Kamm 4615
τ0 - bond lifetime with zero force s σ - adhesion stress N μm-2 κ - spring constant for receptor-ligand bond N μm-1
57
CHAPTER 21 CELL MEMBRANE MECHANICS AND ADHESION copyRD Kamm 4615
References Bell G I (1978) Models for the specific adhesion of cells to cells Science 200 618-627 Caille N O Thoumine et al (2002) Contribution of the nucleus to the mechanical properties
of endothelial cells J Biomech 35(2) 177-87 Chang K C D F Tees et al (2000) The state diagram for cell adhesion under flow
leukocyte rolling and firm adhesion Proc Natl Acad Sci U S A 97(21) 11262-7 Dai J and M P Sheetz (1998) Cell membrane mechanics Methods Cell Biol 55 157-71 Dai J and M P Sheetz (1999) Membrane tether formation from blebbing cells Biophys J
77(6) 3363-70 Daily Elson et al (1984) Determination of the elastic area compressibility modulus of the
erythrocyte membrane Biophys J 45(4) 671-682 Evans E and K Ritchie (1997) Dynamic strength of molecular adhesion bonds Biophys J
72(4) 1541-55 Evans E A (1983) Bending elastic modulus of red blood cell membrane derived from
buckling instability in micropipet aspiration tests Biophys J 43(1) 27-30 Hammer D A and S M Apte (1992) Simulation of cell rolling and adhesion on surfaces in
shear flow general results and analysis of selectin-mediated neutrophil adhesion Biophys J 63(1) 35-57
Hardt S L (1979) Rates of diffusion controlled reactions in one two and three dimensions Biophysical Chemistry 10 239-243
Hochmuth F M J Y Shao et al (1996) Deformation and flow of membrane into tethers extracted from neuronal growth cones Biophys J 70(1) 358-69
Kucik D F E L Elson et al (1999) Weak dependence of mobility of membrane protein aggregates on aggregate size supports a viscous model of retardation of diffusion Biophys J 76(1 Pt 1) 314-22
Kusumi A Y Sako et al (1993) Confined lateral diffusion of membrane receptors as studied by single particle tracking (nanovid microscopy) Effects of calcium-induced differentiation in cultured epithelial cells Biophys J 65(5) 2021-40
Lehenkari P P and M A Horton (1999) Single integrin molecule adhesion forces in intact cells measured by atomic force microscopy Biochem Biophys Res Commun 259(3) 645-50
McCloskey M and M M Poo (1984) Protein diffusion in cell membranes some biological implications Int Rev Cytol 87 19-81
Meleard P Gerbeaud C Bardusco N Mitov MD and Ferdandex-Puente L (1998) Mechanical properties of model membranes studied from shape transformations of giant vesicles Biochimie 80 401-413
Moy V T Y Jiao et al (1999) Adhesion energy of receptor-mediated interaction measured by elastic deformation Biophys J 76(3) 1632-8
Ra H J C Picart et al (1999) Muscle cell peeling from micropatterned collagen direct probing of focal and molecular properties of matrix adhesion J Cell Sci 112 ( Pt 10) 1425-36
Saffman P G (1976) Bownian motion in thin sheets of viscous fluid Journal of Fluid Mechanics 73 593-602
Schmidtke D W and S L Diamond (2000) Direct observation of membrane tethers formed during neutrophil attachment to platelets or P-selectin under physiological flow J Cell Biol 149(3) 719-30
Sheets E D R Simson et al (1995) New insights into membrane dynamics from the analysis of cell surface interactions by physical methods Curr Opin Cell Biol 7(5) 707-14
58
CHAPTER 21 CELL MEMBRANE MECHANICS AND ADHESION copyRD Kamm 4615
Vink H and B R Duling (1996) Identification of distinct luminal domains for macromolecules erythrocytes and leukocytes within mammalian capillaries Circ Res 79(3) 581-9
Waugh R and E A Evans (1979) Thermoelasticity of red blood cell membrane Biophys J 26(1) 115-31
Zeman K H Engelhard et al (1990) Bending undulations and elasticity of the erythrocyte membrane effects of cell shape and membrane organization Eur Biophys J 18(4) 203shy19
Zhelev D V D Needham et al (1994) Role of the membrane cortex in neutrophil deformation in small pipets Biophys J 67(2) 696-705
59
MIT OpenCourseWarehttpocwmitedu
20310J 3053J 6024J 2797J Molecular Cellular and Tissue BiomechanicsSpring 2015
For information about citing these materials or our Terms of Use visit httpocwmiteduterms
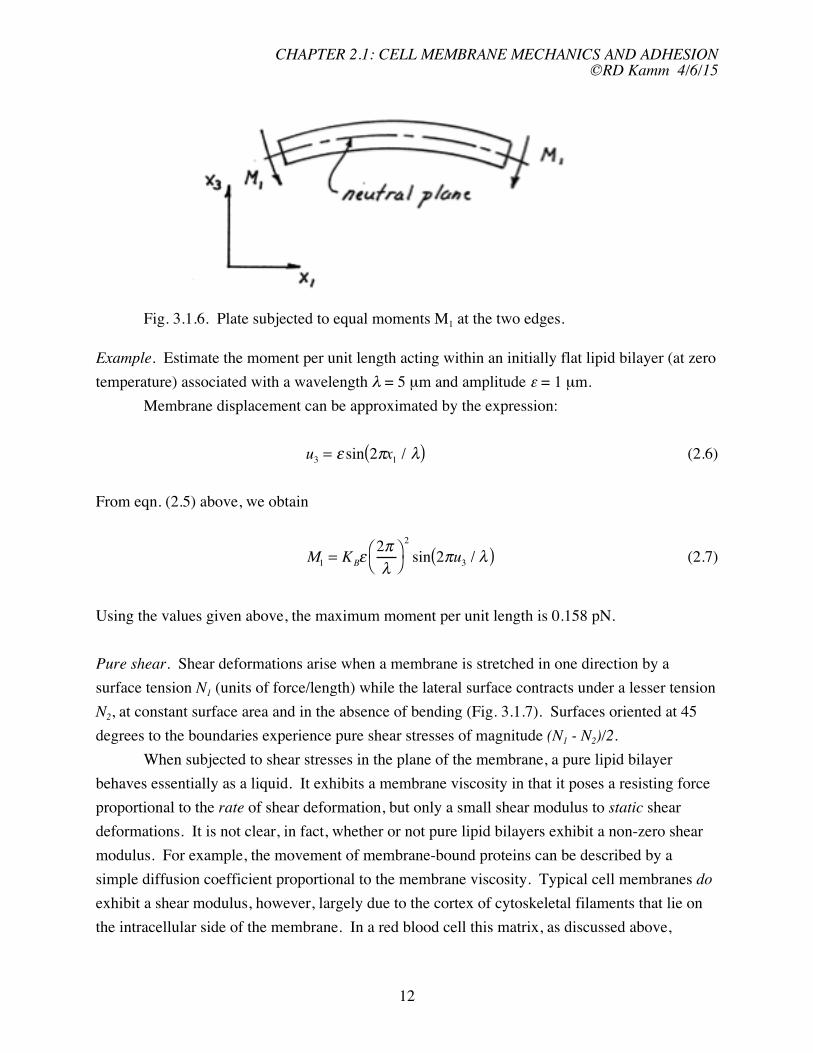
CHAPTER 21 CELL MEMBRANE MECHANICS AND ADHESION copyRD Kamm 4615
Fig 316 Plate subjected to equal moments M1 at the two edges
Example Estimate the moment per unit length acting within an initially flat lipid bilayer (at zero
temperature) associated with a wavelength λ = 5 μm and amplitude ε = 1 μm
Membrane displacement can be approximated by the expression
u3 = ε sin (2πx1 λ) (26)
From eqn (25) above we obtain
2
⎛ 2π ⎞ M1 = KBε sin (2πu )⎝ ⎠ 3 λ (27)λ
Using the values given above the maximum moment per unit length is 0158 pN
Pure shear Shear deformations arise when a membrane is stretched in one direction by a
surface tension N1 (units of forcelength) while the lateral surface contracts under a lesser tension
N2 at constant surface area and in the absence of bending (Fig 317) Surfaces oriented at 45
degrees to the boundaries experience pure shear stresses of magnitude (N1 - N2)2
When subjected to shear stresses in the plane of the membrane a pure lipid bilayer
behaves essentially as a liquid It exhibits a membrane viscosity in that it poses a resisting force
proportional to the rate of shear deformation but only a small shear modulus to static shear
deformations It is not clear in fact whether or not pure lipid bilayers exhibit a non-zero shear
modulus For example the movement of membrane-bound proteins can be described by a
simple diffusion coefficient proportional to the membrane viscosity Typical cell membranes do
exhibit a shear modulus however largely due to the cortex of cytoskeletal filaments that lie on
the intracellular side of the membrane In a red blood cell this matrix as discussed above
12
CHAPTER 21 CELL MEMBRANE MECHANICS AND ADHESION copyRD Kamm 4615
consists of interconnected filamentous spectrin and actin with attachments to the membrane via
ankyrin
N2
N1 N1
N2 Fig 317 A section of membrane subjected to a shear stress of magnitude N1-N22
The equations relating shear stress to shear deformation (Hookes law) from Ch xx can
be applied here
τ12 = τ 21 =2Gε12 (28)
or expressed as a shear force per unit length of membrane
N12 =τ12 h = 2Gε12 = Ksε12 (29)
where we define the membrane shear modulus Ks with units of Nm Typical values lie in the
range of 6-9 x 10⁻⁶ Nm for a red blood cell membrane A pure lipid bilayer exhibits a viscous
resistance to shear deformations characterized by a shear viscosity of about 10-6 Nsm ((Evans
1983))
The 2D elastic plate -- equations of deformation
In the analysis of cellular membranes several unique characteristics need to be taken into
account
1 The membrane is extremely thin relative to its lateral extent If we consider the thickness to
be that of the lipid bilayer by itself then h can be as small as 6 nm compared to a typical cell
dimension on the order of 10s of μm Even if we include the sub-membrane cortex this
13
CHAPTER 21 CELL MEMBRANE MECHANICS AND ADHESION copyRD Kamm 4615
dimension only increases to about 100 nm This tends to favor in-plane stresses over bending
effects2
2 The non-shear deformations are very small with strains of at most a few percent Therefore
linear analysis is appropriate in many situations Note however that nonlinear effects can be
important especially for large shear deformations such as occur in micropipet aspiration of
red blood cells The implications and limitations of this are discussed more fully below
3 The membrane exhibits a very small modulus in plane shear and is often treated as a two-
dimensional liquid While this applies primarily to lipid bilayers when the membrane is
considered to include the cortex greater values of shear modulus can be observed
4 Stresses normal to the membrane are small and can be neglected
5 Membrane motions can be damped either due to viscous dissipation within the bilayer as in
the case of in-plane shear or due to the viscosity of the fluids on the intra- or extracellular
sides of the membrane These latter are especially important when considering motions of
the membrane perpendicular to its plane
6 Inertial effects can be neglected due to the predominance of viscous forces during transient
deformations
With these in mind and acknowledging the limitations of a continuum view of such
structures we treat the membrane as a thin homogeneous plate or membrane in which all the
following must be considered in-plane extension and shear bending viscous damping and
thermal fluctuations
The equations we derive will effectively be integrated through the membrane thickness so
that stresses will be in terms of surface forces (force unit length) These are the in-plane normal
forces (see Fig 318 for definition of the axes and nomenclature) are therefore written as
+ h 2
Nα = int σ α dx3 (210) minus h 2
where h is the membrane thickness and the vertical shearing forces
+ h 2
Vα = (211) minus h
int τα 3dx3
2
The moments acting on the plate edges can be calculated from
2 Whether tension or bending dominates clearly depends on the nature of the experiment If an initially spherical cell is distended tension is most important if the cell shrinks so that the membrane buckles bending effects will be critical
14
CHAPTER 21 CELL MEMBRANE MECHANICS AND ADHESION copyRD Kamm 4615
+h 2
Mα β = int x3τα β dx3 (212)minush 2
x
(c)
Fig 318 (a) A small section of membrane (b) Membrane deflections (c) Nomenclature used in defining the forces acting on a section of membrane (Note that Q is used to represent shear stress in the figure whereas V is used in the text and (xyz) should be (x1x2x3))
In order to distinguish the effects of bending from those giving rise to extension we separate the
normal stress into two parts one representing the mean over the thickness of the membrane
which is simply Nαh and the other representing the deviation from this value denoted as σαprime
Similarly we separate the displacement on the neutral plane unα from that which varies with x3
denoted as uαprime Consequently we can write
N
uα = u n + primeα and = iα u σ α + primeσ α (213)
h
And consistent with the assumption that planar edges initially normal to the membrane remain
planar under bending deformations we have that
15
CHAPTER 21 CELL MEMBRANE MECHANICS AND ADHESION copyRD Kamm 4615
partu uαprime = minus x 3
3 (214)partxα
According to assumption (4) above the relationships between stress and strain become
E σ α = νε β ) α ne β (215)
minus ν2 (ε1 α +
and
E ταβ = εαβ α ne β (216)
(1+ ν )
Since
partuα partunα partu
= αprime ε α = + (217)
partxα partxα partxα
(summation convention not used) We eventually obtain the following expressions for the
bending moment
+h 2 ⎛ part 2 u part 2 ⎞ M 3 u3
α = int σ α x3dx3 = minusKB ne (218)⎜ ⎝
2 + ν ⎟ α β partx 2
minush 2 partxα β ⎠
and
+ h 2 part 2u
M12 = int ε KB (1minus ν) 312 x3dx3 = minus (219)
minus h 2 partx1partx2
where in classical shell theory for continuum materials KB=Eh3(1-ν2) The moments are related
to the shear forces in the plane of the membrane through a moment balance about the x1 axis
giving
partM 12 partM
+ 2 minus V2 = 0 (220)partx1 partx2
so that
part ⎛ part 2 u part 2 u ⎞ part ⎛ part 2 part 2
V = minus 3 + 3 uandV 3 u
K ⎜ ⎟ = minus K ⎜ + 3⎞
2 B ⎟ (221)partx2 ⎝ partx 2 2 ⎠ 1 B 2 2
1 partx2 partx1 ⎝ partx1 partx2 ⎠ A force balance in the direction normal to the membrane yields
16
CHAPTER 21 CELL MEMBRANE MECHANICS AND ADHESION copyRD Kamm 4615
partV1 partV2 part ⎛ partu ⎞ part ⎛ partu ⎞+ + ⎜ N 3 ⎟ + ⎜ N 3 ⎟
2 + p = 0 (222)x 1
part 1 partx2 partx1 ⎝ partx1 ⎠ partx2 ⎝ partx2 ⎠
which upon substitution for V1 and V2 from eqns (221) becomes
⎛ part4u3 part4u part4u3 part part ⎛ ⎞K 3 ⎞ part ⎛ u ⎞
B 4 N 3 partu
+ 2 + minus minus N 3 minus p = 0 (223)⎜ ⎟ ⎜ ⎟ ⎜ ⎟⎝ partx1 partx2partx2 partx4 ⎠ partx ⎝ 1 partx ⎠ partx ⎝ 21 2 2 1 1 2 partx2 ⎠
Recall that the first term in parentheses is due to bending the second and third terms are due to
in-plane extension and the fourth term represents the pressure difference across the membrane
Eqn (223) contains three unknowns the displacement u3 and the two normal forces per
unit length N1 and N2 Fortunately the additional equations required for solution are quite easy
to obtain from simple force balances in the x1 and x2 directions Setting the sum of forces in the
x1 direction equal to zero we obtain (referring to Fig 319)
minus N1(x1) + N1(x1 + dx1)cosθ (x1 + dx1) minus N21 (x2 ) + N21(x2 + dx2 ) = 0 (224)
or
partN1 partN21 partN2 partN + = 0 and similarly + 12 = 0 (225)
partx1 partx2 partx2 partx1
While formidable in its complete form it is reassuring to know that we rarely use eqn
(223) in its entirety and that when certain limiting cases are considered more familiar equations
are obtained It is useful at this stage to consider several of these limits
Fig 319 x1 force balance in the plane of the membrane
17
CHAPTER 21 CELL MEMBRANE MECHANICS AND ADHESION copyRD Kamm 4615
Balance between pressure and surface tension (Laplacersquos Equation) If the in-plane stress is
uniform (Ni=Nj=N) eqn (223) has the form
⎛ part 4u part 4u part 4u ⎞ ⎛ part 2u KB ⎜
3 4 + 2 3 3
2 2 + 4 ⎟ minus N⎜ 3 part 2u
2 + 3 ⎞
2 ⎟ minus p = 0 (226)⎝ partx1 partx1 partx2 partx2 ⎠ ⎝ partx1 partx2 ⎠
and eqn (225) is trivially satisfied If in addition bending stiffness can be neglected then
⎛ part 2 u part 2 ⎞ ⎛ 1 1 ⎞ 3 u
p = minusN ⎜ 3
2 + 2 ⎟ cong N⎜ + ⎟ (227)⎝ partx1 partx2 ⎠ ⎝ R2 R1⎠
for small curvatures where R1 and R2 are the radii of curvature of the membrane about the x1 and
x2 axes respectively This is the well-known Laplacersquos equation with N the surface tension For
a sphere R1 = R2 and the equation simplifies further yielding the equation given on p 10
Balance between pressure and bending Alternatively if all in-plane stresses can be neglected
other than those associated with bending stiffness we obtain the equation generally used for
simple bending of plates and shells
⎛ part 4u part 4u part 4 3 3 u ⎞
KB ⎜ 4 + 2 2 + 3 ⎟ = p (228)
⎝ partx1 partx1 partx2 partx 4 2 2 ⎠
Both of these forms will be used later in this chapter to examine specific problems in cell
membrane mechanics
The conditions under which eqn (226) can be reduced to either (227) or (228) can be
determined by an order of magnitude comparison of the bending and tension terms If we take u
to be a measure of the membrane displacement in the x3 direction and λ to be the characteristic length in the x1 or x2 directions over which u3 varies then the bending term can be shown to scale as K 4 2
Bu λ and the tension term as Nu λ The ratio of these tells us which of the terms dominate in eqn (226) If
KBu λ4 K= B ltlt 1
Nu λ2 Nλ2
then tension dominates and eqn (227) is appropriate Alternatively if
KB gtgt 1 Nλ2
18
CHAPTER 21 CELL MEMBRANE MECHANICS AND ADHESION copyRD Kamm 4615
then bending dominates and eqn (228) should be used If we take values typical of those given
for cells K N = 5x10⁻⁵B = 10-18 Nm Nm λ = 1 μm this ratio equals 002 confirming as we
originally postulated that tension tends of dominate
Nonlinear formulations
Traditionally membrane deformations have been addressed through nonlinear analysis allowing
for large strains especially in shear Here we have chosen to present the linearized equations in
the hope that they will provide clearer insight and for continuity with the approach used in other
chapters of the text For many problems of interest deformations are small and linear theory is
sufficiently accurate In some circumstances however a nonlinear analysis is necessary one
example being the aspiration of a red blood cell membrane into a micropipet For this reason we
present the nonlinear equations in Appendix A for the more advanced reader and to assist in
reading the recent literature on membrane mechanics
Energies of deformation
Although the formulation of the equations of deformation in Section 316 is complete by itself
an alternative approach is often useful in which we consider the strain energy the energy stored
in the membrane due to elastic deformation as a basis for analysis Strain energy is analogous to
the energy stored in a spring by stretching it If the spring is linear with a stiffness k so that the
force F required to lengthen it from x0 to x is k(x-x0) then the energy expended during the
process of lengthening is
x x
U = int Fdx = int k(x minus x0 )dx = 1 2 k(x minus x0)
2 (229)x= x 0 x = x 0
Extensional energy Now consider a section of an elastic membrane of thickness h and lengths
dx1 and dx2 subjected to a uniaxial tension stress σ1 Here as in our previous discussion we
consider two cases first a flat membrane which is being stretched by extensional stresses (the
case at zero temperature) and second the situation in which the surface area of the membrane
projected onto a flat plane increases due to the smoothing of out-of-plane undulations (the
entropic contribution)
As the stress is gradually applied to minimize any dissipative effects the work done by
the external force must equal the gain in elastic energy stored in the plate The work performed
by this stress is
19
CHAPTER 21 CELL MEMBRANE MECHANICS AND ADHESION copyRD Kamm 4615
ε1 ε 1
dU = int σ 1dε 1dx1dx2 dx3 = int Eε1dε1dx1dx2dx3 (230)0 0
By energy conservation the work done in stretching the membrane must be stored as potential
or strain energy in the elastic member Since the right-hand-side of (330) represents the strain
energy in the volume dx1dx2dx3 then the energy per unit volume of membrane is
ε1 ε1
U0 = int σ 1dε1 = int Eε = 1 Eε21dε1 2 1 (231)
0 0
or expressed as energy per unit area of membrane
Ehε2
U 10h = (232)
2 In the somewhat more general case of biaxial strain a similar approach leads to
Eh ⎡ 2 2
( 2 2 ) Eh ⎛ ⎤partu ⎞ uε1 + ε 2 = ⎢⎜
1 ⎛ part
⎟ + ⎜ 2
⎞ U0h = ⎟ ⎥ (233)
2 1( minus ν ) 2 1( minus ν ) ⎢⎝ partx⎣ 1 ⎠ ⎝ partx2 ⎠ ⎥⎦
Note that if the strain is isotropic in that ε1 = ε2 = ε this can also be expressed in terms of the
areal strain with the aid of eqn (23)
2 Eh ⎛ ΔA⎞
U0h = ⎜ ⎟ (234)4 1( minus ν ) ⎝ A0 ⎠
from which it can be seen by eqn (24) that the area expansion modulus has the form
Eh Ke = (235)
2 1( minus ν )
under the assumptions of a homogeneous isotropic elastic membrane This term however only
accounts for the contribution to extensional energy associated with an increase in the surface area
of a membrane Another contribution arises from the change in the membrane surface area
projected onto the x1-x2 plane due to non-uniform displacements perpendicular to the plane of
the membrane in the x3 direction This can be seen from the following one-dimensional
example
Consider a membrane tethered at both ends that exhibits a constant surface tension N
when deformed into a new state defined by u3(x1) Locally the change in length of a segment
initially of length dx is
20
CHAPTER 21 CELL MEMBRANE MECHANICS AND ADHESION copyRD Kamm 4615
( 2 2 dx ) + ( du3 ) minus dx = [1 du3 dx1)2]
12 2 2 + ( dx 1 1
1 minus dx1 asymp (1+ 2 (du3 dx1) )dx1 minus dx1 = 2 (du3 dx ) dx(236) 1 1
[see also Figs 64 and 65 in Boal] The strain is then the change in length over the initial length or
2ε11 = 1
2 (du3 dx1) (237) and the energy per unit area associated with this change in length under a constant tension N is
2 ε N ⎛ partu ⎞
U0h = N1int dε =0
⎜ 3
⎟ (238)2 ⎝ partx1 ⎠
which extending to two dimensions can be written
⎡⎛ ⎞ 2 ⎛ 2⎤ N partu3 partu ⎞U ⎢⎜ ⎟ + ⎜ 3
0h = ⎟ ⎥ (239)2 ⎢⎝ partx1 ⎠ ⎝ partx⎣ 2 ⎠ ⎦ ⎥
It is important to recognize that we now have two expressions associated with the energy of
extension and they represent two distinct phenomena The first [eqn (333)] describes the
energy associated with true areal expansion that is a change in the effective spacing between the
molecules comprising the lipid bilayer The second [eqn (339)] corresponds to the energy
change due to undulations in a membrane with constant intermolecular spacing To see the
distinction between the two consider an experiment in which the pressure inside a cell or a lipid
vesicle is gradually increased by aspiration into a micropipette Initially the projected area of
the membrane rises rapidly with a relatively small increase in membrane tension corresponding
to the smoothing of undulations caused by thermal excitation of the membrane This is followed
at higher tensions by a transition to a regime in which the membrane exhibits a much greater
stiffness corresponding to the situation in which the thermally-induced undulations have been
smoothed out and the true membrane surface area now must increase In the absence of thermal
fluctuations eg at zero temperature only this second regime would be observed [see also
figure from Boal]
Energy of shear deformation Next examine the energy per unit area associated with shear
deformation in the plane of the membrane which can be expressed in the form
2
1 1 2 Gh ⎛ part u1 partu2 ⎞
U0h = 2 hτ12ε12 = 2 hGε12 = ⎜ + ⎟ (240)2 ⎝ partx2 partx1 ⎠
21
CHAPTER 21 CELL MEMBRANE MECHANICS AND ADHESION copyRD Kamm 4615
where we have utilized eqns (28) and (29) to obtain a form similar to that of eqn (234) for
extensional deformation
[See Boal for an alternative form in terms of membrane curvature He also gives a nice
description of bending in bilayer membranes]
Bending energy The contribution due to bending energy is somewhat more difficult to derive
First recognize that only those normal stresses that vary with x3 contribute to the bending
energy that is those contributed by the σ stresses in eqn (213) With this in mind we can
write the expression for the total elastic energy due to bending as
1 1 U = intintint ⎧ [ 2
⎨ ( ) 2 ⎫ σ 1 prime + ( )2
σ 2 prime + 2νσ 1 primeσ prime 2 ] + ( )τ 12 prime ⎬dx (241)⎩2E 2G ⎭ 1dx2dx3
Substituting for the stresses and strains from eqns (215)-(217) this can be re-cast in the
following form
⎧ 2 ⎫K ⎛ 2
part 2 2u ⎡ 2 u part ⎞ part 2u 2 part 2 ⎤ part u ⎛ u ⎞
U = B intint ⎜ 3 3 ⎟ 1 minus ν ) 3 3 2 minus ⎜ 3 ⎟⎨ 2 + 2 minus 2( 2 ⎬dx1dx (242)⎢ ⎥2 ⎝ partx1 partx2 ⎠ partx1 partx2 ⎝ partx1partx2 ⎠ 2
⎩ ⎣ ⎦ ⎭
It can be shown ((Meleard 1998)) that the integral of the second term in the integrand above [the
one multiplied by 2(1-ν)] is globally constant under deformation if the membrane remains a
closed surface with no holes Assuming that to be the case we obtain for the total bending strain
energy
KB ⎛
2 part 2u part 2
= intint ⎜ 3 u2 + 3 ⎞
U ⎟2 dx1dx2 + const (243)
2 ⎝ partx1 partx2 ⎠
Since we typically are concerned with changes in energy the constant will arbitrarily be set to
zero Thus the energy per unit area or energy density of bending deformations can be written
2 K ⎛ part 2 part 2 ⎞
0 = B u⎜
3 uU h 2 + 3
2 ⎟ (244)2 ⎝ partx1 partx2 ⎠
Note that the term in parentheses is proportional to the mean curvature of the surface Often the
surface has a natural mean curvature in the unstressed state If that curvature is c0 the bending
energy expression is modified slightly to the form
22
CHAPTER 21 CELL MEMBRANE MECHANICS AND ADHESION copyRD Kamm 4615
2 K ⎛ part 2 part 2 ⎞
U0 = B u⎜
3 uh 2 + 3
2 minus c0⎟ (245)2 ⎝ partx1 partx2 ⎠
Another common form of this expression is obtained by recognizing that the first two terms in
parentheses represent the linearized form of the sum of the principal curvatures (the largest and
smallest curvatures at a point) denoted c1 and c2 so that eqn (345) can be written
K
U2 B
0h = (c1 + c2 minus c0 ) 2
Although each of these expressions for strain energy density has been derived individually they
of course all contribute in the general situation and are linearly additive In that regard several
points are worthy of note First one can obtain some idea of the relative importance of
extension shear and bending deformations in a given situation simply by comparing their
relative energies just as was done in the last section by comparison of the bending and tension
terms in eqn (226) Not surprisingly the comparison leads to the same expressions we obtained
before for when either bending or tension is dominant Second due to the small shear modulus
of most cell membranes the energy stored in shear deformation can generally be neglected And
finally a comment is warranted concerning the energy due to tension Various simplifying
assumptions can be made depending on the cell type being considered and the nature of the
stress to which the cell (or vesicle) is being subjected but generally the lipid bilayer can be
considered to be of constant area unless it experiences grossly non-physiologic levels of stress
Thus the main contribution to extensional energy is that represented by eqn (339) associated
with the smoothing of membrane undulations
Other Factors Influencing Membrane Motion
Thermal fluctuations Biological membranes of all types can be seen to fluctuate due to
Brownian motion of the surrounding molecules if viewed with sufficient resolution These
fluctuations are in fact often used to measure the membrane bending stiffness since thermal
effects are seen as motions in the membrane of relatively long wavelength favoring bending
energies as compared to extensional or shear (see eqn (223)) To account for these effects it is
customary to add a time-dependent forcing term to eqn (223) η(t) the magnitude of which
scales with kBT We analyze thermal motions later and use them as a means of determining the
bending stiffness of a membrane
23
CHAPTER 21 CELL MEMBRANE MECHANICS AND ADHESION copyRD Kamm 4615
Damping due to external fluids When a membrane fluctuates in a direction perpendicular to its
plane velocities are induced in the surrounding fluids and due to the resulting shear stresses
energy is dissipated These motions are extremely complex to model precisely and depend on
both the nature of the surrounding medium (its rheological properties) and the bounding
geometry In lieu of a complete and rigorous analysis a local damping term is sometimes added
to the membrane force balance equation (eqn (223)) to approximate these effects Its form is
based on the presumption that externally induced velocities scale with the velocity of the wall
and that shear forces in the external fluid scale with the induced shear rates and velocities
Accordingly eqn (223) is modified by the addition of a term of the form μm partu3 partt where μμ is
the effective viscosity of the external fluid The equation that results from the addition of both
thermal forcing and external fluid viscosity is
partu ⎛ part 43 u 4
3 part u part+ 3 part 4u ⎞ part ⎛ ⎞ part ⎛ ⎞
B ⎜ 3 partu u
μm K 4 + 2 2 2 + 4 ⎟ minus ⎜ N3
⎟ minus part 1 ⎜ N
3
partt ⎝ x partx partx partx ⎠ partx ⎝ partx ⎠ partx ⎝ 2 ⎟ = p + η(t) (246)1 1 2 2 1 1 2 partx2 ⎠
An expression of similar form for a linear polymer is sometimes referred to as the Rouse
equation
314 Measurements of Membrane Elastic Parameters
Although the analogy has limitations it is useful at the onset to think of the cell as a fluid-filled
balloon or bag Just as in the case of a balloon the elastic properties of the membrane can be
determined by any experiment in which the membrane tension changes while its area is
measured In the simple example of a spherical balloon tension can be computed from the
inflating pressure and the measured radius the latter also yielding the surface area Ignoring for
now the thermal-induced fluctuations in a real cell membrane (ie assuming the cell to be at zero
temperature) the calculations become particularly simple Furthermore we will consider cells
for which the cytoplasm can be considered to fluid-like having no elasticity We return to
address both issues shortly
Osmotic swelling
Perhaps the simplest method to inflate the cell and measure the membrane elastic properties is to
cause the cell to swell by changing the osmolarity of the external fluid and simultaneously
monitoring the change in cell volume The change in transmembrane pressure mirrors the
24
CHAPTER 21 CELL MEMBRANE MECHANICS AND ADHESION copyRD Kamm 4615
change in osmotic pressure brought about by successive additions of a solute to which the
membrane is impermeable For ions and small molecules the osmotic pressure π can be
calculated from the vant Hoff equation
π = RT sum Ci (247)
i
where Ci are the molar concentrations of all solutes to which the membrane is impermeable For
larger molecules such as proteins their contribution to osmotic pressure is much larger than
indicted by this equation
Consider for example a spherical cell expanded osmotically so that the internal
hydrostatic pressure relative to external pressure is pc Microscopic examination yields a value
for the cell radius Rc Using these values in combination with Laplaces law [eqn (227)] gives
us the tension in this state and eqn (24) provides its relationship to the extensional modulus
p R Δ A
N = c c = Ke (248) 2 A0
The observed change in radius allows calculation of ΔA In practice identification of the reference state at zero pc is problematic due to the presence of thermal fluctuations but if Ke can be assumed constant for relatively small changes in area it is possible to extrapolate back to the zero-stress state from two measurements at elevated pc [Example red blood cell] Micropipet aspiration
One of the first methods used to measure the extensional modulus of the cell membrane involved
drawing a cell slightly deflated into a micropipet simultaneously monitoring the dimensions of
the cell and the pressure in the micropipet (Daily Elson et al 1984) Since on the time scale of
the experiment the volume of the cell could be assumed constant the shape change due to
aspiration of the cell causes increases in both internal pressure and surface tension both of which
are assumed spatially uniform Once the tension is large enough (or the temperature low
enough) to dampen the amplitude of any thermal fluctuations the cell can be treated assuming
that membrane extension is the dominant means by which the pressure drop across the
membrane is balanced [For further discussion on the thermal fluctuations and the relationship
between micropipet pressure and intracellular pressure see Daily and Evans and Rawicz Phys
Rev 1990 See also figure on p 199 of Boal Example the two regimes in membrane stiffness]
For the situation shown in Figxx the cell is drawn into the micropipet to the point at
which the portion of the cell external to the cell is spherical of radius Rc With the assumptions
25
CHAPTER 21 CELL MEMBRANE MECHANICS AND ADHESION copyRD Kamm 4615
stated above the (uniform) pressure within the cell can be related to it surface tension (assumed
uniform) and the radii of curvature of the main body of the cell Rc and the portion inside the
pipet a using Laplaces law [eqn (227)]
pc = 2N Rc = minus Δp + 2N a (249)
where pressures are referenced to the external ambient pressure Reorganizing to solve for
surface tension we obtain
ΔpN = (250)
⎛ 1 1 ⎞ 2⎜ minus ⎟
⎝ a Rc ⎠
The surface area corresponding to a given N is obtained from geometry summing the membrane
surface areas of the cylinder and hemisphere inside the micropipet and the truncated spherical
surface outside yielding for the areal strain the approximate expression
[(a R )2 (a R )3
Δ c minus c cong
]ΔLA
A 2a
Fig xx Micropipet aspiration of a neutrophil
This relationship between N and ΔAA can be used to calculate the area expansion modulus
Eh AK 0
e = = N 2 1( minus ν ) ΔA
where the expression involving Youngrsquos modulus assumes the membrane to be isotropic and
homogeneous The relationship could however be non-linear in that the value of Ke may vary
with the degree of area expansion a linear relationship between N and ΔA yields a constant value for Ke
It is important to note that neither of these approaches osmotic inflation or micropipet aspiration provides us with any information on the bending modulus To be precise bending
26
CHAPTER 21 CELL MEMBRANE MECHANICS AND ADHESION copyRD Kamm 4615
does play a role in the micropipet experiments but the effects are so small as to be negligible and are typically ignored That is not to say that bending is always negligible however as discussed next
Monitoring thermal fluctuations in the membrane
When a cell or lipid vesicle is observed floating free unattached to a substrate it can be seen to
exhibit time-dependent undulations as a result of collisions with the surrounding molecules
undergoing thermal motion In the case of a lipid vesicle with diameter in the range of 10
microns these undulations can be readily observed microscopically In smaller cells such as red
blood cells the motions can be inferred from the flickering phenomenon associated with the light
interference as the cell thickness changes (Zeman Engelhard et al 1990) Since the amplitude of
the membrane undulations depends on the stiffness of the membrane to bending and its surface
tension it is reasonable to expect that measures of this amplitude can be used to infer the
membrane elastic parameters In order to illustrate the method while avoiding some of the
algebraic complexity consider undulations in a flat membrane with significant bending stiffness
and a constant surface tension The relationship between the motion and the elastic properties
can be found by considering the total energy of the membrane obtained by summing the
energies per unit area from eqns (239) and (244) and integrating over the membrane surface
area Am
⎧ 2⎪ K ⎛ 2 2
part 2 u part 2 ⎡ 3 u ⎞
3 N ⎛ partu ⎞ ⎛ int 3 partu ⎞ ⎤⎫
B 3 ⎪
U0hdA = int ⎨ ⎜ 2 + 2 ⎟ + ⎢⎜ ⎟ + ⎜ ⎟ ⎥⎬dA (251) A ⎠ 2
m Am ⎪ 2 ⎝ partx1 partx2 ⎢⎝ partx1 ⎠ ⎝ partx2 ⎠ ⎥⎪ ⎩ ⎣ ⎦⎭
In writing the energy in this form we have omitted the contribution due to shear deformation
consistent with the fluid-like character of a pure lipid bilayer and have taken the surface tension
to be uniform during the deformation In this example membrane surface area changes only as a
result of fluctuations from the mean [u3(xxx2) = 0] configuration that is we now ignore the
contribution due to changes in intermolecular spacing and only consider changes in the area
projected onto the x1-x2 plane
It is convenient to use the method of Fourier transforms to represent the undulations of a
membrane normal to the x1-x2 plane which in two-dimensions leads to [see also class notes on
bending of cytoskeletal filaments alternatively use Fourier series representation]
A A
u3 (x) = u3 (x1 x2 ) = 2 intexp(iq sdot x)b(q)dq =
2 int exp(iq 4 1x1)exp(iq2 x2 )b(q1q2 )dq1dq
π 4π 2
(252)
27
CHAPTER 21 CELL MEMBRANE MECHANICS AND ADHESION copyRD Kamm 4615
where qα = 2π λα is the wavenumber of the particular mode and b(q) is the continuous analogue of the discrete coefficients that multiply each mode in a Fourier series representation
Here the algebra gets complicated so only the results of the analysis will be presented however
those wishing to see a more complete derivation should see (Boal Mechanics of the Cell
Cambridge University Press 2002) Introducing eqn (352) into (351) yields
1 ⎛ A ⎞2
int U q 40hdA = ⎜ ⎟ int (
KB + Nq2 )b(q)b(q)dq (253)2 2 ⎝ π ⎠
where b(q) is the complex conjugate of b(q) Now we invoke a previous result that at equilibrium energy is equally distributed among the various modes and that each mode has an
average energy of kBT2 Taking the ensemble average of eqn (353) and equating the energy of
each mode represented in the result to kBT2 (by the equipartition theorem) leads to
k Aq)b q) = BT
b( (K q4 2 (254)
B + Nq
This is a useful result in itself demonstrating that all modes tend to be suppressed as temperature
falls or as bending stiffness or surface tension rise In addition it shows the tendency for higher
modes to be of smaller amplitude But this equation has further value in that it can be used to
obtain a direct expression for the change in apparent area of a membrane as tension increases
Consider the true surface area of a membrane A represented as the sum of its projected
area and the additional area associated with thermally-induced undulations
⎡ 1 ⎛ 2⎤u ⎞ 2 part ⎛ partu ⎞
A = int dx + ⎢ 3 3 2
int ⎜ ⎢⎝ partx 2 ⎟ + ⎜
⎠ ⎝ partx 2 ⎟ ⎥dx (255)⎠ ⎥
⎣ 1 2 ⎦
Isolating the term representing the area reduction due to thermal fluctuations expressing u3 in
terms of its Fourier transform and taking the ensemble average of the result leads to
1 ⎛ A ⎞2
A minus int dx = ⎜ ⎟ int q 2 b(q)b(q) dq (256)2 ⎝ 2π ⎠
Combing eqn (254) from above with this expression yields
28
CHAPTER 21 CELL MEMBRANE MECHANICS AND ADHESION copyRD Kamm 4615
A minus int dx
kBT dq kBT dq2
= A 8π 2 int =
N int (257)
+ KBq 2 8π 2 N + KBq 2
where in writing the last term we have introduced the relations dq = dq2dθ 2 and int dθ = 2π By a simple substitution z = q2 + (N KB )the integral can be evaluated We do so however
between specified limits on the assumptions that the range of possible wavenumbers is restricted
by the size of the membrane on one hand (q = (πA12)) and the distance between individual lipid molecules on the other (q = πlm) Integrating between these limits results in
⎛ π 2 N ⎞
int dx 2 +A ⎜ ⎟ minus k T l K
= B ln⎜ m B ⎟ (258)A 8πKB ⎜ π 2 N ⎟
⎜ + ⎟ ⎝ A KB ⎠
If we use the area reduction at zero tension as a reference and increase the area from that
condition by progressively increasing membrane tension as in a typical experiment we finally
obtain an expression relating the change in area to the change in tension
⎛ NA ⎞ 1 + A dx A dx ΔA minus int minus ⎟ k ⎛ NA
int k ⎜equiv minus = BT π 2 K
ln ⎜ B T ⎞ 2 ⎟ cong B ln 1 + (259)
Nl ⎜ ⎟A A A 8π KB ⎜ 1 + m ⎟ 8π KB ⎝ π 2 KB ⎠ N = 0 N ⎜ 2 ⎟⎝ π K ⎠ B
where we have used the assumption supported by typical values found from different
experiments that (Nl2 m ) (π 2KB ) ltlt 1
You should recall that this solution was obtained on the assumption that the actual area
of the membrane remained constant and that the reduction in projected or apparent area resulted
from the undulations being progressively smoothed out Once the undulations are eliminated
the only means by which the projected area of the membrane can further increase is by an
increase in the inter-molecular spacing ndash an increase in the actual membrane area When this
occurs we expect to see a transition to the behavior discussed at the beginning of this chapter a
result expressed as
29
CHAPTER 21 CELL MEMBRANE MECHANICS AND ADHESION copyRD Kamm 4615
Fig yy Plots of tension vs normalized surface area for lipid vesicles of different composition Evans amp Rawicz 1990
ΔA N = (260)
A Ke
Thus we have two limiting predictions one for low tensions eqn (259) and another for high
tensions eqn (260) and the transition from one behavior to the other should occur when the
two expressions for ΔAA are of the same magnitude This is supported by experiment (Fig yy) and the results in the two regimes provide a means for estimating the two moduli Ke and KB
30
CHAPTER 21 CELL MEMBRANE MECHANICS AND ADHESION copyRD Kamm 4615
Before leaving this analysis there is one further result that is useful to state although the
derivation is again somewhat involved Once we have the solution for the undulations at a
given level of tension and for given membrane properties the ensemble average displacement
normal to the plane of the membrane can also be computed with the result
⎞
u2 k ⎛= BT NA
3 ln ⎜ 1+ ⎟ (261)4πN ⎝ π 2KB ⎠
Again this supports our intuition that the undulations will be suppressed at low temperature or
high tension And in the limit as N rarr 0 a binomial expansion of the natural log term shows that
the effect of tension drops out and the magnitude of the undulations varies inversely with the
bending stiffness
315 Membrane Fluid Mechanics
Early studies of protein diffusion notably the work of Saffman (Saffman 1976)
examined protein diffusion using an approach akin to that of Einstein in three dimensional space
thereby reducing the problem to one of solving for the mobility b in the equation for diffusivity
D = kBTb (262)
Calculation of the mobility is influenced by the viscous drag on the portion of the protein within
the membrane but also on to the intra- and extracellular domains as well The solution of
interest here is the one applicable in the limit of small μeμm where μe and μm are the external and
membrane viscosities respectively leading to
kBT ⎛ hμm⎞
D = ⎜minusγ + ln ⎟ (263)4πμmh ⎝ aμ e ⎠
where h is the membrane thickness a the radius of the protein (assumed cylindrical) and γ is
Eulers constant (=05772) Membrane viscosity has been estimated from lipid diffusion to be
~2 poise (McCloskey and Poo 1984) When finite mobility is achieved as a result of a finite
domain as for example a circle of radius R the corresponding result is
31
CHAPTER 21 CELL MEMBRANE MECHANICS AND ADHESION copyRD Kamm 4615
k ⎛ 1 D = BT R ⎞ log minus (264)
4πμh ⎝ a 2 ⎠
While this represents a useful point of departure measurements of lateral diffusion in a
membrane have demonstrated a more complex behavior Fluorescence recovery after
photobleaching (FRAP) has enabled the direct tracking of membrane proteins labeled with
fluorescent antibodies More recently single particle tracking methods have been developed
using colloidal gold or a fluorescent particle in conjunction with digital microscopy as well as
controlled movements using microbeads manipulated by an optical trap
From experiments such as these a new picture has emerged While the lateral diffusion
of lipids and a small fraction of trans-membrane proteins satisfy the general form of Saffmans
predictions the predicted diffusivity is greater than that observed experimentally and agrees with
experiments only when a membrane viscosity of 100 poise is used This might be due to the
presence of other proteins in the membrane (Kucik Elson et al 1999) Experiments also show
that many proteins appear to diffuse freely only in small domains typically measuring from 200shy
600 nm remaining confined to these domains for periods on the order of tens of seconds To
explain this behavior the membrane skeleton fence model was proposed (Kusumi Sako et al
1993) in which a membrane-associated matrix constrains the movement of proteins outside of
the domains defined by the matrix filaments Diffusion beyond these barrier filaments can occur
either as a result of random thermal motions of the transmembrane protein matrix filaments or
both or by transient breaks in the filaments Confinement of proteins may play an important role
in rapid and selective signaling Rapid directed motion of membrane-associated proteins has
also been observed and is likely due to active transport by an intracellular actin- or microtubule-
based motor
316 Cell Adhesion
This section deals with how cells adhere to their surroundings and through these sites of
adhesion how they interact with the external world We begin by summarizing the different
types of adhesion their functions and the molecules involved Next we provide a brief
description of the adhesion complexes found in cells and the role of each type Then the
theories that provide a quantitative description of adhesion between single receptor-ligand pairs
are reviewed in the context of the material presented in Chapter xx including the role of thermal
fluctuations Through these theoretical models both the static and dynamic states of adhesion
can be explored for single molecule pairs then for adherent cells Next we develop the different
32
CHAPTER 21 CELL MEMBRANE MECHANICS AND ADHESION copyRD Kamm 4615
approaches that are used to study the adhesion of cells based either on thermodynamics or
mechanics Methods for the measurement of adhesion strength are described providing
estimates for the force that a cell can exert on its surroundings Various examples will be
presented but the adherence of leukocytes to the endothelium and the role of adhesion in cell
migration will receive special attention
Functions of adhesion
Adhesion has been found to be an essential process necessary for a variety of fundamental
cellular functions
bull Structural integrity Adhesion helps to maintain the overall structural integrity of the
tissue in muscle for example it provides the means of force transmission from the cells
to the surrounding matrix to allow contraction In non-contractile cells it still provides
the needed mechanical coupling to the surrounding tissue necessary for a variety of
cellular functions
bull External sensing Adhesion provides a means by which the cell can sense and
subsequently respond to its surroundings Forces transmitted directly to the cell
membrane or to the cytoskeleton via transmembrane proteins may trigger a variety of
biochemical reactions within the cell as we shall see later in Chapter 33
bull Migration Cell-matrix adhesion is an essential element in cell migration a cell propels
its way through tissue or along a surface through a process involving adhesion
contraction and release also described in Chapter 33
bull Regulation of transport Sites of cell-cell adhesion are often important in the regulation
of transport across a cell layer such as in the case of an epithelium or endothelium
bull Communication Sites of mechanical coupling often provide a means of cell-cell
communication as in the case of gap junctions which offer a pathway for the diffusion
of ions and small molecules between adjacent cells
Adhesion molecules
Cells adhere to their surroundings or to an artificial substrate via a wide variety of different
proteins that can be classified into five major families integrins selectins cadherins
immunoglobulins and transmembrane proteoglycans (Table 1) In terms of their mechanism of
attachment to other cells or the external matrix these can be classified as either homophillic ndash
binding to like molecules heterophillic ndash binding to unlike molecules or those that bind to other
cells through an extracellular linker molecule
Integrins one of the largest class of adhesion molecules are primarily used to attach cells
to the extracellular matrix or the basal lamina but are also present in some cell-cell adhesion
33
CHAPTER 21 CELL MEMBRANE MECHANICS AND ADHESION copyRD Kamm 4615
complexes They typically bind to the matrix via the RGD amino acid sequence (arginine
glycine aspartic acid) but can also contain other binding motifs Integrins are heterodimers in
that they always contain an α and a β subunit with the different isoforms determining the specific ligand to which the integrin binds Two specific types of adhesion focal adhesions and hemidesmosomes often contain integrins and the attachments they make can at times be stable but at other times transient so as for example to mediate cell migration The force of adhesion of a single integrin-ligand bond has been measured using atomic force microscopy and found to be in the range of 30-100 pN (Lehenkari and Horton 1999) with a relatively low binding affinity in the range of K ~ 10-6
D to 10-8 molliter By comparison typical cell-surface receptors bind with an affinity in the range of 10-9 to 10-11 molliter Integrins also play an important role in signaling since extracellular integrin binding is known to influence cytoskeletal morphology as well as the state of cell differentiation Adhesion molecules in the selectin family also tend to form transient bonds and are important in leukocyte adhesion and extravasation the migration of the leukocyte through the endothelium and into the tissue Consequently they tend to be found in cells of the circulation and are present both in leukocytes and endothelial cells and are instrumental in adhesion between these two cell-types during leukocyte rolling
Family Location andor Ligands Comments
function recognized
integrins focal adhesions (E) fibronectin relatively low
hemi-desmosomes collagen laminin affinities
leukocyte immunoglobulins (KD~ 10-6-10-8
(spreading) (I) actin filaments molliter)
adhesion primarily
cell-matrix adhesion
but also in some
cell-cell adhesions
selectins circulating cells and carbohydrates require Ca2+
endothelial cells
rolling adhesion
Ig superfamily important in integrins
(immunoglobulin) immune response homophillic
cadherens adherens junctions (E) homophillic require Ca2+
desmosomes (I) actin
34
CHAPTER 21 CELL MEMBRANE MECHANICS AND ADHESION copyRD Kamm 4615
filaments
intermediate
filaments
transmembrane fibroblasts (E) collagen bind various
proteoglycans epithelial cells fibronectin growth factors
(I) actin such as FGF
filaments
heterophillic
Table 1 Cell adhesion molecules and their characteristics
While both integrin and selectin binding is mediated by Ca2+ adhesion via the
immunoglobulin (Ig) superfamily of proteins is Ca2+ independent Some of the most prominent members of this family are the N-CAMs (Neural cell adhesion molecules) and ICAMs (Intracellular cell adhesion molecules) These tend to undergo homophillic bonding but some also bind to members of the integrin family
Cadherens are often expressed in the same cells as the selectins but form much stronger bonds and therefore play an important role in maintaining cell integrity Because of these attributes cadherens are the primary adhesion proteins in desmosomes and adherens junctions the major structural contacts cells form with other cells or the basil lamina These also form homophillic bonds by a Ca2+ dependent mechanism and mediate selective bonding between adjacent cells Cadherens are relatively short as compared to other adhesion molecules being
about 700-750 amino acid residues in length
Types of adhesion complexes
Cells have developed a variety of specialized adhesion complexes each utilizing one or more of
the adhesion molecules of Table 1 and each serving a specific purpose Typically the cell-cell or
cell-surface spacing is in the range of 10-20 nm but this is highly variable ranging from less than
1 nm when controlling transport to over 100 nm in regions where tight control is unnecessary
Below we describe the different types of junctions and where important for function their
mechanical characteristics
Gap junctions Cells need to communicate with their neighbors for a variety of reasons For
example cardiac myocytes transmit signals from cell to cell in order to maintain a synchronous
35
CHAPTER 21 CELL MEMBRANE MECHANICS AND ADHESION copyRD Kamm 4615
wave of contraction This is typically accomplished by providing a pathway for ions and small
signaling molecules between cells called gap junctions (Fig 3110) These minute channels are
typically comprised of a collection of six connexin proteins that cluster together in cylindrical
fashion forming a minute channel that passes molecules and ions less than about 1200 to 2000
MW (15-2 nm) Transport through these channels is regulated and their permeability drops in
the presence of high Ca2+ concentration as when a cell membrane is ruptured or with low pH
Cyclic AMP acting as a second messenger can be exchanged between cells therefore gap
junctions provide a metabolic linkage between neighboring cells and provide a means by which
hormonal stimulation of just one cell can be transmitted to others
Adherens junctions Adherens junctions are belt-like structures that can be though of as the
structural weld that holds two cells together (Fig 3110) Because of their structural role
these junctions formed by homophilic bonding between proteins in the cadheren family are
anchored securely again via the adaptor proteins α β γ-catenin to the cytoskeleton
Desmosomes and Hemidesmosomes If the adherens junctions are the continuous welds between
cells desmosomes are the spot welds Again these serve primarily a structural purpose
joining two neighboring cells via a complex consisting of a dense plaque on the intracellular
sides of both cells extending 15-20 nm into the cell and consisting of a variety of proteins that
attach to keratin filaments part of the intermediate filament network Hemidesmosomes have
similar intracellular structure but attach instead to the basal laminae Based on their different
extracellular attachment sites desmosomes typically link to other cells via cadherens whereas
hemidesmosomes adhere via a type of integrin Both are commonly found in epithelial cells
36
CHAPTER 21 CELL MEMBRANE MECHANICS AND ADHESION copyRD Kamm 4615
Fig 3110 Schematic showing the different types of cell junctions present in an epithelial cell as found in the small intestine Tight junctions near the apical surface essentially prevent the passage of all molecules The spot desmosomes and adherens junctions provide for cell-cell anchoring and the hemidesmosomes for anchoring to the basal lamina Gap junctions provide a means for communication between neighboring cells [Reproduced from Lodish et al Molecular Cell Biology 2000]
Junction type Function Extracellular or Intracellular
adjacent cell attachment
attachment
Adherens structural cell-cell or cell- ECM proteins or actin filaments
matrix cadherins in
adjacent cell
Desmosome structural cell-cell cadherin intermediate
filaments
Hemidesmosome structural cell-matrix basal lamina via intermediate
integrins filaments
Focal adhesions structural cell-matrix ECM proteins actin filaments
via integrins
Tight junction regulate transport between homophillic binding between the
cells and along cell transmembrane proteins occludin or
37
CHAPTER 21 CELL MEMBRANE MECHANICS AND ADHESION copyRD Kamm 4615
membrane claudins
Gap junctions cell-cell communication channels formed by connexin
via ion and small molecule subunits
exchange
Table 2 Adhesion complexes
Focal adhesions A second means by which cells attach to the extracellular matrix is through
focal adhesions These serve a similar function to the hemidesmosomes and share a common
linkage via integrins to the ECM but are attached on the intracellular side instead to the actin
filaments of the cytoskeleton Actin filaments converge at the site of focal adhesions forming
stress fibers strong actin bundles that attach to the β-subunit of the integrins via adapter
proteins such as actinin vinculin and talin Focal adhesions are instrumental in cell migration
and for this purpose need to be easily formed and disrupted as the cell moves forward Release
or de-adhesion of cells is often mediated by a class of peptides called dis-integrins that
competitively bind to the RGD site used by integrins to attach to a variety of matrix molecules
Tight junctions Control of transport is generally mediated by tight junctions that form an
intricate network of seams between two cells (Fig 3111) As their name implies these are the
tightest of the cell-cell junctions and the gaps they leave are often small enough to exclude even
the smallest ions and molecules Formed by homophillic binding between the transmembrane
proteins occluding and claudins tight junctions allow epithelial cells to perform their critical role
in transepithelial transport and provide for maintenance of differences in concentration between
the apical and basal surfaces of these cells Since occludins are not capable of forming rigid
structural bonds with the cytoskeleton they are most often associated in a junctional complex
with adherens junctions or desmosomes that fulfill the structural needs of attachment
38
CHAPTER 21 CELL MEMBRANE MECHANICS AND ADHESION copyRD Kamm 4615
Fig 3111 Tight junctions in an epithelial cell shown schematically (a) in a freeze fracture replica (b) and in a transmission electron micrograph (c) [Reproduced from Alberts et al 1994]
Fig 3112 Two types of bond that attach a cell to the extracellular matrix by means of clusters of integrins On the extracellular side integrins bind to the matrix proteins fibronectin and laminin Inside the cell they attach to the cytoskeleton via adaptor proteins to either actin filaments (focal adhesions) or intermediate filaments (hemidesmosomes) [Reproduced from Lodish et al Molecular Cell Biolology 2000]
Non-specific binding
Cells can adhere to their surroundings by either non-specific or receptor-ligand (specific)
bonding Though both mechanisms are likely active in most situations as we will see receptorshy
39
CHAPTER 21 CELL MEMBRANE MECHANICS AND ADHESION copyRD Kamm 4615
ligand bonding is the stronger of the two by a considerable margin and is therefore the most
relevant biologically In situations for which either the receptors or their ligands are not present
however such as might be the case in certain in vitro experiments non-specific binding can be
important as well
There are essentially three major forms of non-specific attractions to consider
bull Van der Waals ndash These attractive forces arise due to charge interactions in polar
molecules They tend to dominate among the non-specific mechanisms at
intermediate distances around 20-25 nm [see Boal]
bull Electrostatic ndash These interactions can be either attractive or repulsive depending
on the sign of the surface charges and are particularly important during the
approach of two cells since the glycocalyx has a high negative charge density
bull Steric ndash These forces arise due to the steric exclusion of two molecules as they are
brought into close contact In the case of cell-cell interactions steric repulsion is
due to the compression of the two glycocalyx layers and the tendency to resist
compression resulting from osmotic effects and the elasticity of the layer Steric
forces tend to dominate for small separation distances lt 10 nm
In combination these effects combine to produce a net attractive force per unit area of
about 100 Pa at a separation distance of about 25 nm
Adhesion by means of receptor-ligand binding
We can use the analysis of Chapter xx to estimate the strength of a receptor-ligand bond and
based on typical values for bond density calculate the corresponding strength of adhesion
between two cells or between a cell and a surface Recall that the application of force to a
receptor-ligand bond modifies the dissociation rate constant for the binding reaction This effect
can be modeled in several ways but the result obtained by Bell ((Bell 1978)) suggests the
following exponential form for the dissociation rate
0 ⎛ γf ⎞ 0 ⎛ γσ ⎞ kminus = kminus exp⎜ ⎟ = kminus exp⎜ ⎟ (265)
⎝ kBT ⎠ ⎝ NC kBT ⎠
where k0minus is the unforced dissociation rate constant γ is a factor with the units of length that
corresponds roughly with the distance separating the bonded pair at equilibrium NC is the concentration of bonded complex and σ is the average bond force per unit area To determine
40
CHAPTER 21 CELL MEMBRANE MECHANICS AND ADHESION copyRD Kamm 4615
the rate of change of the concentration of bonded pairs one must solve the following rate equation describing the competition between bond formation (first term) and destruction (second term)
dNC ⎛ γσ ⎞
cong k+ (NR minus NC )(NL ) minus kminus NC = k+ (N minus )( 0R NC NL ) minus kminus NC exp⎜ ⎟ (266)
dt ⎝ NC kBT ⎠
where NR and NL are the concentrations of receptors and ligands respectively and we have
assumed that NCltltNL and that all bonds are stressed equally At equilibrium dNCdt=0 and if
the force applied to detach the cell (equal to the average bond stress σ) is increased
incrementally from zero NC will progressively fall to a new equilibrium value At sufficiently
high levels of force however increasing σ further eventually gives rise to a situation in which equilibrium can no longer be achieved through a reduction in NC At that point NC tends toward zero and the cell separates from the surface to which it was attached It can be shown that this
occurs when (Bell 1978)
k 0
α c exp(α + c + 1) = N
k 0 L (267)minus
σ
where α minγ c equiv and σmin is the minimum stress needed to cause detachment For a wide
NRkBT
range of conditions eqn (267) has the approximate solution
⎛ k0 + ⎞
α c cong 07 ln L (268)⎜ 0 N ⎟⎝ kminus ⎠
so that the critical stress for detachment can be expressed as
N 0
σ cong 07 C kBT ⎛ k ⎞ ln⎜
+ min N ⎟ (269)
γ ⎝ k0 L minus ⎠
where NC is determined from setting eqn (266) to zero under these critical conditions
Thermodynamic approach to cell adhesion
Although we focus here on the mechanical aspects of cell adhesion this process can also be
viewed from a thermodynamic perspective In this approach adhesion is considered in terms of
the change in energy specifically the Gibbs free energy G associated with all the individual
receptor-ligand interactions as well as the various non-specific forces of attraction or repulsion
The adhesion of a cell to a given surface then can be viewed as an equilibrium state determined
41
CHAPTER 21 CELL MEMBRANE MECHANICS AND ADHESION copyRD Kamm 4615
by minimization of the free energy If in undergoing a transition from a free state to an adherent
state the system represented by the cell and surface experiences a reduction in free energy ie
ΔGlt0 then adhesion will occur and the equilibrium state of adhesion will be determined by that with the minimum in free energy or the largest value of -ΔG While this approach ignores
many of the subtleties of the interactions and like the analysis above assumes that all receptorshy
ligand interactions are identical from an energetic point of view it is useful in providing some
simple insights as seen in the next two examples
Example Comparison of specific and non-specific adhesive forces Non-specific bonding due
to the combined effects of van der Waals electrostatic and steric forces result in an attractive
stress of approximately 100 Pa Receptor-ligand bonding give rise to forces that can be
estimated from the change in free energy f ~ to 4x10⁻⁴ dynbond = 9x10-11 to 4x10⁻⁹ ΔGr~9x10⁻⁶ Nbond where f is the force required to break the bond and r is a measure of the distance the bond stretches before it breaks Using a typical density of the receptor-ligand complex NC of ~1012-1015 bondsm2 gives a total bond stress of N 1
C x f ~ 9 x 10 to 4x10⁶ Pa The above kinetic approach to estimating bond strength [eqn (269)] gives a value approximately half of that from this equilibrium approach In either case however the conclusion remains the same non-specific binding can under certain circumstances be important since it is comparable to the lowest estimates of receptor-ligand-mediated bond strength but not surprisingly the latter is quite likely to dominate in nearly all practical situations
Example JKR theory for the equilibrium area of adhesion between a cell and substrate
It is well known that cells tend to take on a more flattened shape as the substrate to which they
are attached becomes more strongly adhesive either by coating with a more attractive ligand or
by increasing the concentration of ligand bound to the substrate Conversely less adhesive cells
round up and become more spherical These observations can be explained with the help of a
simple scaling analysis on the assumptions of small deformation of a linear elastic cell
Let the cell be modeled as a homogeneous elastic sphere with elastic modulus E and
initial radius R (Fig 3113) It is then brought into contact with a surface to which it adheres
As the cell adheres it attains a lower energy state characterized by an adhesion energy per unit
area J Formation of a flat adhesion surface however requires deformation within the elastic
cell and an associated increase in the stored elastic energy In Chapter 31 we showed that the
stored elastic energy per unit volume can be written
UE asymp int τεdV asymp int 1 2 Eε 2dV (270)
Vc Vc
42
CHAPTER 21 CELL MEMBRANE MECHANICS AND ADHESION copyRD Kamm 4615
Strain inside the cell can be approximated as the displacement of the cell surface δ divided by the characteristic distance within the cell to which the deformations penetrate a distance that scales with the lateral extent of the contact region 2a so that ε prop δ a where it can easily be shown from the geometry that a 2 asymp 2δR so that ε prop δ R Combining and dropping all numerical constants we obtain the following scaling approximation
δUE prop E ( )δR
3 2 (271)R
An expression for the total energy of the system then can be written
U prop minusJa2 + Eε2a3 prop JδR + Eδ 5 2R1 2 (272) The equilibrium state corresponds to the value of δ having the minimum energy obtain from
partU prop minusJR + Eδ 3 2R1 2 (273)
partδ so that
23 1 3 ⎛ JR12 ⎞ ⎛ JR2 ⎞
δ prop ⎜ ⎟ and a prop ⎜ ⎟ (274)⎝ E ⎠ ⎝ E ⎠
The exact solution to this problem yields the result
⎡ ) 1 3 2 1( minusν 2 ⎤ 9πJR
a = ⎢ ⎥ (275)⎢ 2E ⎥⎣ ⎦
43
CHAPTER 21 CELL MEMBRANE MECHANICS AND ADHESION copyRD Kamm 4615
Elastic modulus E adhesion energy per unit area J
2a
Fig 3113 Experiments to determine the contact area of an iminobiotin functionalized agarosebead on a glass coverslip in water Top Schematic of adherent bead Bottom Results for a range of bead radii Solid line is a fit to the date which obeys the power law a prop R23 consistent with the prediction of JKR theory eqn(276) [Reproduced from (Moy Jiao et al 1999)] This can be compared to the result obtained from a more rigorous analysis
⎡9πJR 2(1minus ν 2 ) 13 ⎤
a = ⎢ ⎥ (276)2E⎢ ⎣ ⎥⎦
and to experimental data obtained from spherical beads made from a 4 agarose gel (Fig 3113)
Models for receptor-mediated adhesion
In Chapter x and in the preceding text we discussed the energetics of bond formation and release
as well as the effect of applied force in altering the energy landscape of the bonded pair and
thereby the rate constants for bond kinetics That analysis has obvious implications to the
44
CHAPTER 21 CELL MEMBRANE MECHANICS AND ADHESION copyRD Kamm 4615
adhesion of cells to substrates the surrounding extracellular matrix and other cells Here we
extend that analysis in the specific case of whole cell adhesion In doing so it will be important
to consider such factors as the distribution type and density of receptor-ligand bonds or
potential bonds and the elastic properties of the structures to which they are anchored On the
intracellular side this involves the series of couplings that link the receptor to the cell In the
simplest case this might simply be a link to the lipid bilayer if the receptor has no intracellular
connections More typically especially for couplings with a structural role it involves a series
of proteins ultimately linking the receptor to the cytoskeleton
The typical setting in vivo is one in which cells adhere to other cells or to the extracellular
matrix Adhesions are more easily probed however through in vitro experiments (described
below) where cell adhesion more often occurs to an artificial substrate mediated through one of
several extracellular proteins that are used to coat the surface Generally either collagen or
fibronectin is used Cells are often adhered to these substrates but to produce a more controlled
environment rigid beads are sometimes coated with the appropriate receptors so that one specific
receptor-ligand interaction can be probed While these systems are useful as models of certain
adhesion phenomena it is important to recognize in the interpretation of these experiments that
when bound to a rigid substrate or bead the binding proteins cannot freely diffuse as they would
in a more natural environment In particular the formation of focal adhesions would not occur in
bead-substrate experiments because the receptors would be constrained from aggregating
It is instructive to begin this discussion with a consideration of a single adhesion bond
for example one linking the actin matrix of the cytoskeleton to a β1 integrin and the integrin
receptor binding to the extracellular matrix beyond the cell membrane (Fig 3114) If the bond
is stressed as for example if the cell experiences a force relative to the ECM it will at first
stretch an amount dictated by the level of force in the bond and the stiffness of the complex
Each bond as well as each protein in the bond complex can be thought of as having a certain
stiffness giving rise to a picture in which several springs are considered connected in series
Forces acting on the adhesion complex are transmitted via this series of bonded proteins between
the CSK and the ECM producing local deformations and stresses in the corresponding matrices
that decay with distance from the adhesion site On the intracellular side these forces are
transmitted via a complex involving vinculin α-actinin paxillin and talin Attachment to the
extracellular matrix is mediated by an RGD sequence (in fibronectin for example) which in turn
has binding sites for collagen and fibrin If the force is sufficiently strong above a certain
threshold value F0 say and applied for a sufficiently long time the bond might be severed (deshy
couple) Typical values of this threshold force lie in the range of 10-100 pN (Evans and Ritchie
1997) but depend as well on the rate at which the force is increased Under more rapid
forcings the threshold is high compared to when the force is increased slowly This simply
45
CHAPTER 21 CELL MEMBRANE MECHANICS AND ADHESION copyRD Kamm 4615
reflects the fact that detachment is a stochastic process and that at any given level of force there
exists a finite probability of detachment and this probability increases with time
Fig 3114 One type of attachment linking the intracellular actin matrix to the extracellular matrix via an integrin complex that involves in addition vinculin α-actinin paxillin and talin (Reproduced from Lodish et al Molecular Cell Biolology 2000)
We need also to consider that in equilibrium a fraction Φ = K(1+K)-1 (where K is the
equilibrium constant) of the receptors will be bound at any given time and that the receptorshy
ligand complexes are continually cycling between the bound and unbound states characterized
by their respective rate constants
On a larger scale numerous adhesion sites typically act in parallel each contributing
some amount to the total adhesion force If the force transmitted by each single adhesion
complex is F and the density of adhesion sites (per unit membrane area) is NC then the stress
acting on the cell is the product F NC This gives a somewhat false impression however as it is
unlikely that each adhesion complex carries an equal force Put another way there exists a local
stress τ that can be thought of as the product of the average force per bond times the bond
density This stress is typically non-uniform In the adhesion of a cell to a flat substrate the
bonds near the periphery of the contact zone determine the strength of the cell against
detachment and when the cell is subjected to a detaching force the stresses are concentrated in
46
CHAPTER 21 CELL MEMBRANE MECHANICS AND ADHESION copyRD Kamm 4615
this peripheral region as depicted in Fig 3115 In the vicinity of the edge of adhesion several
factors will influence the stress distribution including the mechanical properties of the membrane
(in particular the bending stiffness KB) the receptor density the spring constants of the bond
and the bond strength
N
Region of adhesion
x1
Fig 3115 Schematic model of a cell membrane being detached from a substrate by application of a tension force N The membrane is free to the left of the dash-dot line and adherent to the right Forces and moments are transmitted through the membrane which adheres to the membrane through receptor-ligand bonds represented by a continuous distrubution p(x1)
To illustrate consider the following simple model for an adherent cell being peeled away
from its substrate by a force that generates a tension N in the membrane (Fig 3115)
Deformations in the membrane are described by eqn (223) where it can be shown that the
bending term dominates provided KbL2 gtN where L is the characteristic length in the x1 direction
(due to the small length scales involved) and the external membrane force (p in the membrane
equation) is now the non-uniform stress due to adhesion bonds As a simple first approximation
we take p = k(δminusδ0) with δ-δ0 being the amount of stretch in the receptor-ligand bond springs
and k an effective bond spring constant Recognizing that p approaches zero far from the edge
(see Fig 319) the membrane displacement and the spring displacement are related u3 = δ-δ0
Thus eqn (228) is written
⎛ part 4 u
KB⎜ 3
⎞ 4 ⎟ = NC F = NC ku
⎝ partx ⎠ 3 (277)1
This can be solved directly showing that the distance of separation between the cell membrane
and substrate grows in an exponential fashion with distance Even more simply a scaling
47
CHAPTER 21 CELL MEMBRANE MECHANICS AND ADHESION copyRD Kamm 4615
analysis of eqn (277) in which the term on the left is approximated by Kbu3w4 where w is the
characteristic distance over which u3 varies tells us that the stresses are concentrated in a region
of width
K
w prop B4 (278)
NC k
near the cell periphery Similarly we can estimate that the cell membrane will detach from the
substrate if N gt FoNCw where F0 is a measure of the force in a single bond at the time of bond
rupture and that the rate of peeling can be roughly approximated as the product of the
disassociation rate k -- (bondss) from eqn (265) and the distance between bonds (N -12C )
Although this provides some insight into how the peeling rate depends on the various factors it fails to capture the fact that the cell remains in an equilibrium attached state even for non-zero levels of tension reflecting that even under force a balance can exist between the rates of formation and rupture of receptor-ligand complexes (Ra Picart et al 1999)
It is also of interest to note that in the region near the edge of the attachment zone(x1=0
in Fig 3115) the membrane acts as a beam subjected to a moment due to the applied tension
This moment is balanced by a force couple due to tension in the adhesion complexes right
adjacent to the edge in combination with a compressive stress between the cell and substrate a
little further in In typical situations this compressive stress can approach levels as high as one
atmosphere and can act to effectively smooth the membrane and recruit new attachment sights While using these continuum descriptions it is important to keep in mind the true
discrete nature of the individual bonds represented in the model as a continuous adhesive
surface This is brought to light by a simple calculation in which the characteristic length over
which the applied tension is supported w is compared to the inter-receptor spacing N -12C
Using typical values for the parameters NC = 103 complexesμm-2 k = 10-5 to 10-6 Nm Kb = 1 to 2x10-18 Nm we find that w cong 01 to 03 μm and the inter-complex spacing N minus1 2
C cong 003 μm While it is reassuring to see that w is typically less than the inter-complex spacing the difference is small It is therefore not surprising that the actual process of cell peeling is stochastic in nature occurring in a sequence of more-or-less discrete steps with a velocity of peeling that varies widely from the mean
The interplay between receptor-ligand bonding and membrane stiffness also determines whether a cell will spread over a surface or peel away from it under a given tension Membrane bending stiffness acts to maintain the membrane and substrate within close proximity near the edge of contact (Fig 3115) Spreading can occur only if their separation distance is within the extended length of the receptor ligand bond over a distance comparable to the linear spacing
48
CHAPTER 21 CELL MEMBRANE MECHANICS AND ADHESION copyRD Kamm 4615
between neighboring bonds ( N minus1 2 C ) Under high tension the surfaces rapidly diverge and
spreading is prevented if the tension is sufficiently low receptor-ligand bonding can occur and spreading can occur
Measurements of adhesion
A variety of methods have been used to experimentally determine the strength of adhesion either
of individual receptor-ligand bonds or populations of bonds as in the case of entire cells
Whole cell experiments are more common and typically require less experimental
sophistication The drawback of course is that they provide only for estimates of average
properties and require certain assumptions regarding the distribution of cell-substrate adhesive
stress for interpretation to the level of a single bond Several of these methods are described
next
Centrifugal cell adhesion assays In this experiment cells are allowed to attached to a substrate
then are placed in a centrifuge rotating at speed ω positioned a distance r from the center of
rotation and oriented so that the net centrifugal force is acting to separate the cell from the
substrate Using the arrangement shown in Fig 3116 (right) the acceleration of the cells is 2ω r and the net force acting on a cell of volume Vc is F = (ρc minus ρf )ω 2rVc where the fluid and cell densities are ρf and ρc respectively
Interpreting these results we can make several different assumptions each leading to a different estimate for the maximum force experienced by the binding complex If we simply assume that all receptor-ligand complexes support an equal fraction of the total force F then the force per bond is f = F (πa 2NC ) where NC is the concentration of bond complexes However as the cell tears away from the substrate the edge bonds will break first since these experience the greatest level of force An alternative approach then is to assume that the adhesion complexes around the cell circumference support the entire load leading to the estimate f = F 2( πaN 1 2 ) recognizing that N1 2
C C is the average distance between bonds A somewhatmore accurate value for f might be obtained if we assume that all complexes within the distance w given by eqn (278) support the load In any of these cases once the centrifugal force exceeds some critical limit since the number of receptors supporting the load falls as the region of contact becomes smaller the force per bond increases and the cell will rapidly detach
Stochastic variability also needs to be taken into account however since even under a constant load any single bond has a finite probability of failure under a given level of force The equilibrium state of the cell then should be viewed as one in which the rate of bond formation equals the rate of bond breakage with increasing force having the effect of reducing the
49
CHAPTER 21 CELL MEMBRANE MECHANICS AND ADHESION copyRD Kamm 4615
probability that the bond will remain intact These effects can be addressed using the methods described in more detail in Chapter xx Parallel flow assay Another common method for assessing cell adhesion is to plate the cells onto one wall of a parallel flow chamber subject them to a fluid dynamic shear stress and observe at what flow rate the cells begin to release If we ignore flow details in the immediate vicinity of the cell the shear stress can be estimated from the solution for a fully developed (Poiseuille) velocity profile
3V ⎡ y2
⎛ ⎞ ⎤v(y) = ⎢1minus ⎥ (279)
2 ⎝ ⎠ ⎣ ⎢ h ⎥⎦
so that the shear stress acting on the cell is
⎛ dv ⎞ 6μV τw = μ⎜ ⎟ = (280)
⎝ dy ⎠ h y = minush
and the total force can be estimated as F asymp τw Ac where Ac is the surface area of the cell membrane exposed to the flow Consider as an example a flow of culture medium at a rate of 1 mls through a channel of height 01 cm and width 1 cm If the culture medium has a viscosity close to that of water (μ=001 dyns) the shear stress is obtained from eqn (280)
6 sdot (001dyn sdot s) sdot (1ml s) ( 01 sdot10cm2 )τ dyn cm 2w = = 6 = 06Pa
01cm This corresponds roughly with the level of shear stress experience by endothelial cells in the arterial system If we consider that the cell has a surface area with dimensions roughly 100 μm x 10 μm or about 103 μm2 then the total force acting on the cell is obtained by integrating the shear stress over the area of the apical membrane Assuming that the shear stress is uniform the force is simply the product of shear stress and surface area or about 1 nN in the present example Again interpretation of results from such experiments requires careful consideration of the distribution of forces among the individual adhesion complexes In this situation the cell is likely to peel from the upstream edge in much the same manner as occurs in the cell peeling experiment discussed earlier
50
CHAPTER 21 CELL MEMBRANE MECHANICS AND ADHESION copyRD Kamm 4615
Radial flow and spinning disk assays One disadvantage of the parallel flow assay is that all cells are subjected to essentially the same level of shear stress so the flow rate needs to be incrementally varied in order to determine the level of force required for detachment These two systems using an axisymmetric geometry circumvent this problem by producing an easily characterized radial variation in shear stress In the case of the radial flow assay fluid enters through a central channel and flows radially outward through the narrow gap between two circular plates From conservation of mass the mean flow velocity is given by
QV = (281)
2πrh and sufficiently far from the center (rgtgth) the velocity profile is parabolic as in the parallel flow assay and the shear stress is again governed by eqn (280) using (281) for V Q
ω
(Not to scale)
v
h h
Cell layer rc Ce l l layer rc
r r
Fig 3116 Schematic diagram showing the radial flow assay (left) and the spinning disk assay (right) In the radial flow assay shear stress attains a maximum value near the center and falls with increasing radius r whereas in the spinning disk system maximum shear stress is experienced at large r In the spinning disk assay cells are grown on one disk and the opposite disk is rotated at constant speed Provided the rate of rotation is sufficiently small that inertial effects can be neglected the velocity is purely in the circumferential direction and the profile is linear between the two plates so that the shear stress experienced by the cells can easily be computed as
ωr τw = μ (282)
h
51
CHAPTER 21 CELL MEMBRANE MECHANICS AND ADHESION copyRD Kamm 4615
In both of these cases as in the parallel flow assay the total force is obtained by integrating the shear stress over the cell surface and the distribution of force among the adhesion complexes is weighted toward those located near the upstream end of the cell This can also be seen by consideration of the torque exerted by shear stress on the cell that must be balanced by a nonshyuniform contact stress with the substrate that is greatest near the upstream end Single bond adhesion assays Two other assays provide a means of obtaining estimates for the strength of a single adhesion bond without the need for excessive interpretation These rely on an ability to isolate a small number of bonds or even a single bond and infer bond strength from the step-wise nature of the de-adhesion process associated with breakage of discrete bonds One of these methods employs the atomic force microscope coated with the ligand of an adhesion receptor as shown in Fig 3117 The probe tip is gradually brought up to the cell surface until one or more receptor-ligand bonds are formed When the probe tip is withdrawn it moves along a different trajectory on a force-displacement plot reflecting the forces of adhesion These forces are seen to jump between more or less discrete levels as the probe continues to be moved away from the cell with each jump corresponding to the breakage of a single bond (Fig 3117) Using this method the bond strength between integrin receptor and a variety of RGD-containing ligands was found to lie in the range of 30 to 100 pN (Lehenkari and Horton 1999)
Fig 3117 The strength of a single adhesion bond can be measured by bringing a functionalized tip of an AFM probe up to the cell allowing bonds to form then slowly withdrawing the probe Monitoring the differences between the force displacement curve between the forward and reverse motions the forces necessary to break a single receptor-ligand bond can be determined [Reproduced from (Lehenkari and Horton 1999)]
52
CHAPTER 21 CELL MEMBRANE MECHANICS AND ADHESION copyRD Kamm 4615
A second method is similar in that the discrete increments in force are monitored as individual receptor-ligand bonds are broken but the forces are measured by means of changes in the shape of a giant vesicle the membrane of which contains the ligands have been inserted In this case one vesicle is made effectively rigid due for example to a high surface tension A second vesicle containing the adhesion molecules is also drawn partially into a micropipet but is much more complaint than the first The two vesicles are then brought into point contact so that one or a small number of adhesions are formed As the pipets are moved apart the compliant vesicle distorts due to the force of adhesion which it can be shown is related to the change in dimension of the vesicle in the direction of the force thereby serving as a sensitive force transducer measuring forces in the range of single adhesion receptors or between 1 and 100 pN [Evans 1991 37]
(For specific examples of leukocyte rolling and attachment see Orsello or Chang amp Hammer)
[This process is initiated for example by local infection that causes the release of
chemotactic agents in addition to cytokines hellip
Models of this process draw upon many of the concepts discussed in this chapter ]
Transient cell adhesion
Concepts of transient adhesion and release are of particular importance in the case of leukocyte
rolling adhesion and transmigration across the endothelial layer of a blood vessel In addition
cell migration through extracellular matrix or along a substrate requires the ability of the cell to
both form and release adhesions
One problem that has received considerable attention is the interaction between an
adherent or rolling leukocyte and the adhesion receptors on the endothelium These studies are
complicated by the three-dimensional nature of the flow the compliance of the interacting
surfaces and receptor-ligand dynamics In a series of recent studies Hammer and co-workers
(Chang Tees et al 2000) have addressed several of these issues computing the viscous force
and torque acting upon a sphere near to planar wall from the mobility matrix (Hammer and Apte
1992) and using the ldquoBell modelrdquo of receptor binding (Bell 1978) but neglecting the effects of
cell deformation The Bell model relates the dissociation rate constant kr to the force in the
bond f the thermal energy kBT and a parameter with units of length that depends on the
reactivity of the molecule
kr = ko r exp(γf kBT ) (283)
53
CHAPTER 21 CELL MEMBRANE MECHANICS AND ADHESION copyRD Kamm 4615
A Monte Carlo method is employed at each time step in the calculation to determine bond
formation or breakage In these studies the nature of the leukocyte-endothelial interaction is
characterized as firm adhesion rolling adhesion bimodal adhesion or no adhesion and mapped
as a function of the two parameters of the Bell model in Fig 3 The boundaries of the rolling
adhesion regime are identified for a wall shear rate of 100 s-1 (dotted lines) or 30 and 400 s-1
(solid lines) Most literature values for the Bell model parameters for a variety of selectin
receptors (known to be instrumental in leukocyte rolling) correspond to the rolling adhesion
regime for typical shear rate of 100 s-1 An interesting but counterintuitive result from this study
was the observation that as the bond stiffness was increased from the value used in most
calculations (100 dyne cm-1) adhesiveness decreased which the authors attribute to reduced
deflection for a given level of force leading subsequently to more rapid dissociation
Fig 3118 The state diagram for a leukocyte interacting with an endothelial surface for shear rates ranging from 30 to 400 s-1 For low dissociation rates the leukocyte remains adherent to the surface (lower left) As either (γ) or ( ko
r ) [see Eqn (283) for definitions] is increased the cell first adheres firmly then rolls along the wall then completely detaches (upper right) Rolling adhesion is defined as the regime where rolling occurs over some part of the shear rate range between 30 and 400 s-1 Firm adhesion indicates that cells remain attached even at the highest shear rate no adhesion indicates that cells roll at a velocity gt 50 of the velocity of a non-adherent sphere In the bimodal regime cells are either adherent or non-adherent and do not exhibit rolling Dotted curves correspond to these same boundaries for a shear rate of 100 s-1 Reproduced from Chang et al (2000)
54
CHAPTER 21 CELL MEMBRANE MECHANICS AND ADHESION copyRD Kamm 4615
In another recent study using high-resolution video-microscopy (Schmidtke and Diamond
2000) it was demonstrated that a flowing neutrophil can attach to an adherent platelet via
adhesion molecules located in the tips of the microvilli and form long tethers averaging nearly 10
μm in length but ranging up to 40 μm at extensional rates of 6-40 μm s-1 for shear rates ranging
from 100-250 s-1 The mechanics of tether formation is itself a fascinating topic that is still under
intense investigation Readers interested in pursuing this work in more detail are referred to the
several papers (Hochmuth Shao et al 1996 Dai and Sheetz 1998 Dai and Sheetz 1999) that
identify a number of intriguing phenomena
55
CHAPTER 21 CELL MEMBRANE MECHANICS AND ADHESION copyRD Kamm 4615
317 Nomenclature Parameter Definition Units
R - receptor
L - ligand
C - receptor-ligand complex
G - Gibbs free energy Nm
N - membrane tension Nm
NR - total receptor density -3μm-2 in 2D or μm in 3D NL - total ligand density μm-2 in 2D or μm-3 in 3D N in 2D or μm-3μm-2
C - complex density in 3D NRf - free receptor density m-2 in 2D or m-3μ μ in 3D NLf - free ligand density -2 -3μm in 2D or μm in 3D d+ - forward diffusional rate constant 2 -1μm s-1 in 2D or 3 μm s in 3D d -1
- - reverse diffusional rate constant s r+ - forward reaction rate constant s-1
r- - reverse reaction rate constant s-1 D 2 -1
m - membrane diffusion coefficient μm s D - solution diffusion coefficient m2 s -1s μ Kb - bending stiffness Nm K 0 - equilibrium constant or affinity (zero force) M-1 in 3D and 2μm in 2D = k0
+ k0 minus
K - equilibrium constant M-1 in 3D and m2μ in 2D = k+kshy
k0 - association rate constant (zero force) M-1 s-1 in 3D or m-2 -1+ μ s in 2D
k0 - dissociation rate constant (zero force) s-1 minus
k - association rate constant M-1 s-1 in 3D or m-2 -1+ μ s in 2D
kminus - dissociation rate constant s-1 f - force per bond N F - total adhesion force N γ - empirical parameter μm r0 - distance over which energy minimum acts μm E0 - bond energy J k JK-1
B - Boltzmanns constant T - temperature K τ - bond lifetime s
56
CHAPTER 21 CELL MEMBRANE MECHANICS AND ADHESION copyRD Kamm 4615
τ0 - bond lifetime with zero force s σ - adhesion stress N μm-2 κ - spring constant for receptor-ligand bond N μm-1
57
CHAPTER 21 CELL MEMBRANE MECHANICS AND ADHESION copyRD Kamm 4615
References Bell G I (1978) Models for the specific adhesion of cells to cells Science 200 618-627 Caille N O Thoumine et al (2002) Contribution of the nucleus to the mechanical properties
of endothelial cells J Biomech 35(2) 177-87 Chang K C D F Tees et al (2000) The state diagram for cell adhesion under flow
leukocyte rolling and firm adhesion Proc Natl Acad Sci U S A 97(21) 11262-7 Dai J and M P Sheetz (1998) Cell membrane mechanics Methods Cell Biol 55 157-71 Dai J and M P Sheetz (1999) Membrane tether formation from blebbing cells Biophys J
77(6) 3363-70 Daily Elson et al (1984) Determination of the elastic area compressibility modulus of the
erythrocyte membrane Biophys J 45(4) 671-682 Evans E and K Ritchie (1997) Dynamic strength of molecular adhesion bonds Biophys J
72(4) 1541-55 Evans E A (1983) Bending elastic modulus of red blood cell membrane derived from
buckling instability in micropipet aspiration tests Biophys J 43(1) 27-30 Hammer D A and S M Apte (1992) Simulation of cell rolling and adhesion on surfaces in
shear flow general results and analysis of selectin-mediated neutrophil adhesion Biophys J 63(1) 35-57
Hardt S L (1979) Rates of diffusion controlled reactions in one two and three dimensions Biophysical Chemistry 10 239-243
Hochmuth F M J Y Shao et al (1996) Deformation and flow of membrane into tethers extracted from neuronal growth cones Biophys J 70(1) 358-69
Kucik D F E L Elson et al (1999) Weak dependence of mobility of membrane protein aggregates on aggregate size supports a viscous model of retardation of diffusion Biophys J 76(1 Pt 1) 314-22
Kusumi A Y Sako et al (1993) Confined lateral diffusion of membrane receptors as studied by single particle tracking (nanovid microscopy) Effects of calcium-induced differentiation in cultured epithelial cells Biophys J 65(5) 2021-40
Lehenkari P P and M A Horton (1999) Single integrin molecule adhesion forces in intact cells measured by atomic force microscopy Biochem Biophys Res Commun 259(3) 645-50
McCloskey M and M M Poo (1984) Protein diffusion in cell membranes some biological implications Int Rev Cytol 87 19-81
Meleard P Gerbeaud C Bardusco N Mitov MD and Ferdandex-Puente L (1998) Mechanical properties of model membranes studied from shape transformations of giant vesicles Biochimie 80 401-413
Moy V T Y Jiao et al (1999) Adhesion energy of receptor-mediated interaction measured by elastic deformation Biophys J 76(3) 1632-8
Ra H J C Picart et al (1999) Muscle cell peeling from micropatterned collagen direct probing of focal and molecular properties of matrix adhesion J Cell Sci 112 ( Pt 10) 1425-36
Saffman P G (1976) Bownian motion in thin sheets of viscous fluid Journal of Fluid Mechanics 73 593-602
Schmidtke D W and S L Diamond (2000) Direct observation of membrane tethers formed during neutrophil attachment to platelets or P-selectin under physiological flow J Cell Biol 149(3) 719-30
Sheets E D R Simson et al (1995) New insights into membrane dynamics from the analysis of cell surface interactions by physical methods Curr Opin Cell Biol 7(5) 707-14
58
CHAPTER 21 CELL MEMBRANE MECHANICS AND ADHESION copyRD Kamm 4615
Vink H and B R Duling (1996) Identification of distinct luminal domains for macromolecules erythrocytes and leukocytes within mammalian capillaries Circ Res 79(3) 581-9
Waugh R and E A Evans (1979) Thermoelasticity of red blood cell membrane Biophys J 26(1) 115-31
Zeman K H Engelhard et al (1990) Bending undulations and elasticity of the erythrocyte membrane effects of cell shape and membrane organization Eur Biophys J 18(4) 203shy19
Zhelev D V D Needham et al (1994) Role of the membrane cortex in neutrophil deformation in small pipets Biophys J 67(2) 696-705
59
MIT OpenCourseWarehttpocwmitedu
20310J 3053J 6024J 2797J Molecular Cellular and Tissue BiomechanicsSpring 2015
For information about citing these materials or our Terms of Use visit httpocwmiteduterms
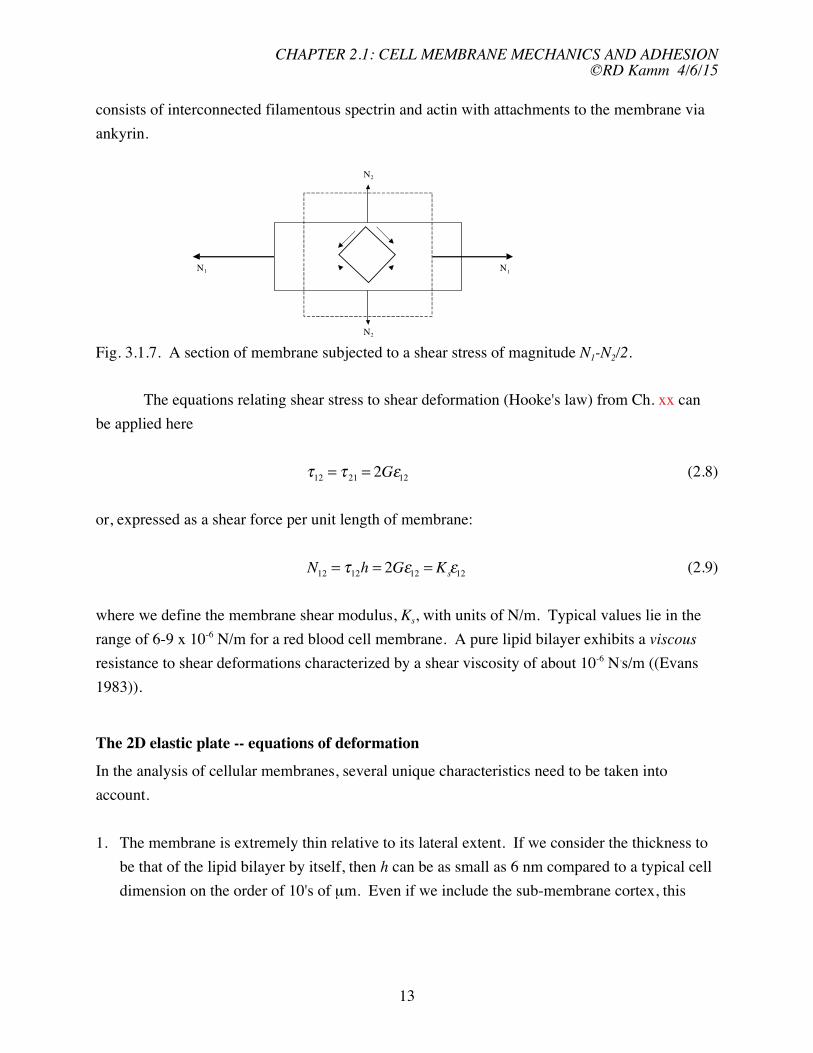
CHAPTER 21 CELL MEMBRANE MECHANICS AND ADHESION copyRD Kamm 4615
+h 2
Mα β = int x3τα β dx3 (212)minush 2
x
(c)
Fig 318 (a) A small section of membrane (b) Membrane deflections (c) Nomenclature used in defining the forces acting on a section of membrane (Note that Q is used to represent shear stress in the figure whereas V is used in the text and (xyz) should be (x1x2x3))
In order to distinguish the effects of bending from those giving rise to extension we separate the
normal stress into two parts one representing the mean over the thickness of the membrane
which is simply Nαh and the other representing the deviation from this value denoted as σαprime
Similarly we separate the displacement on the neutral plane unα from that which varies with x3
denoted as uαprime Consequently we can write
N
uα = u n + primeα and = iα u σ α + primeσ α (213)
h
And consistent with the assumption that planar edges initially normal to the membrane remain
planar under bending deformations we have that
15
CHAPTER 21 CELL MEMBRANE MECHANICS AND ADHESION copyRD Kamm 4615
partu uαprime = minus x 3
3 (214)partxα
According to assumption (4) above the relationships between stress and strain become
E σ α = νε β ) α ne β (215)
minus ν2 (ε1 α +
and
E ταβ = εαβ α ne β (216)
(1+ ν )
Since
partuα partunα partu
= αprime ε α = + (217)
partxα partxα partxα
(summation convention not used) We eventually obtain the following expressions for the
bending moment
+h 2 ⎛ part 2 u part 2 ⎞ M 3 u3
α = int σ α x3dx3 = minusKB ne (218)⎜ ⎝
2 + ν ⎟ α β partx 2
minush 2 partxα β ⎠
and
+ h 2 part 2u
M12 = int ε KB (1minus ν) 312 x3dx3 = minus (219)
minus h 2 partx1partx2
where in classical shell theory for continuum materials KB=Eh3(1-ν2) The moments are related
to the shear forces in the plane of the membrane through a moment balance about the x1 axis
giving
partM 12 partM
+ 2 minus V2 = 0 (220)partx1 partx2
so that
part ⎛ part 2 u part 2 u ⎞ part ⎛ part 2 part 2
V = minus 3 + 3 uandV 3 u
K ⎜ ⎟ = minus K ⎜ + 3⎞
2 B ⎟ (221)partx2 ⎝ partx 2 2 ⎠ 1 B 2 2
1 partx2 partx1 ⎝ partx1 partx2 ⎠ A force balance in the direction normal to the membrane yields
16
CHAPTER 21 CELL MEMBRANE MECHANICS AND ADHESION copyRD Kamm 4615
partV1 partV2 part ⎛ partu ⎞ part ⎛ partu ⎞+ + ⎜ N 3 ⎟ + ⎜ N 3 ⎟
2 + p = 0 (222)x 1
part 1 partx2 partx1 ⎝ partx1 ⎠ partx2 ⎝ partx2 ⎠
which upon substitution for V1 and V2 from eqns (221) becomes
⎛ part4u3 part4u part4u3 part part ⎛ ⎞K 3 ⎞ part ⎛ u ⎞
B 4 N 3 partu
+ 2 + minus minus N 3 minus p = 0 (223)⎜ ⎟ ⎜ ⎟ ⎜ ⎟⎝ partx1 partx2partx2 partx4 ⎠ partx ⎝ 1 partx ⎠ partx ⎝ 21 2 2 1 1 2 partx2 ⎠
Recall that the first term in parentheses is due to bending the second and third terms are due to
in-plane extension and the fourth term represents the pressure difference across the membrane
Eqn (223) contains three unknowns the displacement u3 and the two normal forces per
unit length N1 and N2 Fortunately the additional equations required for solution are quite easy
to obtain from simple force balances in the x1 and x2 directions Setting the sum of forces in the
x1 direction equal to zero we obtain (referring to Fig 319)
minus N1(x1) + N1(x1 + dx1)cosθ (x1 + dx1) minus N21 (x2 ) + N21(x2 + dx2 ) = 0 (224)
or
partN1 partN21 partN2 partN + = 0 and similarly + 12 = 0 (225)
partx1 partx2 partx2 partx1
While formidable in its complete form it is reassuring to know that we rarely use eqn
(223) in its entirety and that when certain limiting cases are considered more familiar equations
are obtained It is useful at this stage to consider several of these limits
Fig 319 x1 force balance in the plane of the membrane
17
CHAPTER 21 CELL MEMBRANE MECHANICS AND ADHESION copyRD Kamm 4615
Balance between pressure and surface tension (Laplacersquos Equation) If the in-plane stress is
uniform (Ni=Nj=N) eqn (223) has the form
⎛ part 4u part 4u part 4u ⎞ ⎛ part 2u KB ⎜
3 4 + 2 3 3
2 2 + 4 ⎟ minus N⎜ 3 part 2u
2 + 3 ⎞
2 ⎟ minus p = 0 (226)⎝ partx1 partx1 partx2 partx2 ⎠ ⎝ partx1 partx2 ⎠
and eqn (225) is trivially satisfied If in addition bending stiffness can be neglected then
⎛ part 2 u part 2 ⎞ ⎛ 1 1 ⎞ 3 u
p = minusN ⎜ 3
2 + 2 ⎟ cong N⎜ + ⎟ (227)⎝ partx1 partx2 ⎠ ⎝ R2 R1⎠
for small curvatures where R1 and R2 are the radii of curvature of the membrane about the x1 and
x2 axes respectively This is the well-known Laplacersquos equation with N the surface tension For
a sphere R1 = R2 and the equation simplifies further yielding the equation given on p 10
Balance between pressure and bending Alternatively if all in-plane stresses can be neglected
other than those associated with bending stiffness we obtain the equation generally used for
simple bending of plates and shells
⎛ part 4u part 4u part 4 3 3 u ⎞
KB ⎜ 4 + 2 2 + 3 ⎟ = p (228)
⎝ partx1 partx1 partx2 partx 4 2 2 ⎠
Both of these forms will be used later in this chapter to examine specific problems in cell
membrane mechanics
The conditions under which eqn (226) can be reduced to either (227) or (228) can be
determined by an order of magnitude comparison of the bending and tension terms If we take u
to be a measure of the membrane displacement in the x3 direction and λ to be the characteristic length in the x1 or x2 directions over which u3 varies then the bending term can be shown to scale as K 4 2
Bu λ and the tension term as Nu λ The ratio of these tells us which of the terms dominate in eqn (226) If
KBu λ4 K= B ltlt 1
Nu λ2 Nλ2
then tension dominates and eqn (227) is appropriate Alternatively if
KB gtgt 1 Nλ2
18
CHAPTER 21 CELL MEMBRANE MECHANICS AND ADHESION copyRD Kamm 4615
then bending dominates and eqn (228) should be used If we take values typical of those given
for cells K N = 5x10⁻⁵B = 10-18 Nm Nm λ = 1 μm this ratio equals 002 confirming as we
originally postulated that tension tends of dominate
Nonlinear formulations
Traditionally membrane deformations have been addressed through nonlinear analysis allowing
for large strains especially in shear Here we have chosen to present the linearized equations in
the hope that they will provide clearer insight and for continuity with the approach used in other
chapters of the text For many problems of interest deformations are small and linear theory is
sufficiently accurate In some circumstances however a nonlinear analysis is necessary one
example being the aspiration of a red blood cell membrane into a micropipet For this reason we
present the nonlinear equations in Appendix A for the more advanced reader and to assist in
reading the recent literature on membrane mechanics
Energies of deformation
Although the formulation of the equations of deformation in Section 316 is complete by itself
an alternative approach is often useful in which we consider the strain energy the energy stored
in the membrane due to elastic deformation as a basis for analysis Strain energy is analogous to
the energy stored in a spring by stretching it If the spring is linear with a stiffness k so that the
force F required to lengthen it from x0 to x is k(x-x0) then the energy expended during the
process of lengthening is
x x
U = int Fdx = int k(x minus x0 )dx = 1 2 k(x minus x0)
2 (229)x= x 0 x = x 0
Extensional energy Now consider a section of an elastic membrane of thickness h and lengths
dx1 and dx2 subjected to a uniaxial tension stress σ1 Here as in our previous discussion we
consider two cases first a flat membrane which is being stretched by extensional stresses (the
case at zero temperature) and second the situation in which the surface area of the membrane
projected onto a flat plane increases due to the smoothing of out-of-plane undulations (the
entropic contribution)
As the stress is gradually applied to minimize any dissipative effects the work done by
the external force must equal the gain in elastic energy stored in the plate The work performed
by this stress is
19
CHAPTER 21 CELL MEMBRANE MECHANICS AND ADHESION copyRD Kamm 4615
ε1 ε 1
dU = int σ 1dε 1dx1dx2 dx3 = int Eε1dε1dx1dx2dx3 (230)0 0
By energy conservation the work done in stretching the membrane must be stored as potential
or strain energy in the elastic member Since the right-hand-side of (330) represents the strain
energy in the volume dx1dx2dx3 then the energy per unit volume of membrane is
ε1 ε1
U0 = int σ 1dε1 = int Eε = 1 Eε21dε1 2 1 (231)
0 0
or expressed as energy per unit area of membrane
Ehε2
U 10h = (232)
2 In the somewhat more general case of biaxial strain a similar approach leads to
Eh ⎡ 2 2
( 2 2 ) Eh ⎛ ⎤partu ⎞ uε1 + ε 2 = ⎢⎜
1 ⎛ part
⎟ + ⎜ 2
⎞ U0h = ⎟ ⎥ (233)
2 1( minus ν ) 2 1( minus ν ) ⎢⎝ partx⎣ 1 ⎠ ⎝ partx2 ⎠ ⎥⎦
Note that if the strain is isotropic in that ε1 = ε2 = ε this can also be expressed in terms of the
areal strain with the aid of eqn (23)
2 Eh ⎛ ΔA⎞
U0h = ⎜ ⎟ (234)4 1( minus ν ) ⎝ A0 ⎠
from which it can be seen by eqn (24) that the area expansion modulus has the form
Eh Ke = (235)
2 1( minus ν )
under the assumptions of a homogeneous isotropic elastic membrane This term however only
accounts for the contribution to extensional energy associated with an increase in the surface area
of a membrane Another contribution arises from the change in the membrane surface area
projected onto the x1-x2 plane due to non-uniform displacements perpendicular to the plane of
the membrane in the x3 direction This can be seen from the following one-dimensional
example
Consider a membrane tethered at both ends that exhibits a constant surface tension N
when deformed into a new state defined by u3(x1) Locally the change in length of a segment
initially of length dx is
20
CHAPTER 21 CELL MEMBRANE MECHANICS AND ADHESION copyRD Kamm 4615
( 2 2 dx ) + ( du3 ) minus dx = [1 du3 dx1)2]
12 2 2 + ( dx 1 1
1 minus dx1 asymp (1+ 2 (du3 dx1) )dx1 minus dx1 = 2 (du3 dx ) dx(236) 1 1
[see also Figs 64 and 65 in Boal] The strain is then the change in length over the initial length or
2ε11 = 1
2 (du3 dx1) (237) and the energy per unit area associated with this change in length under a constant tension N is
2 ε N ⎛ partu ⎞
U0h = N1int dε =0
⎜ 3
⎟ (238)2 ⎝ partx1 ⎠
which extending to two dimensions can be written
⎡⎛ ⎞ 2 ⎛ 2⎤ N partu3 partu ⎞U ⎢⎜ ⎟ + ⎜ 3
0h = ⎟ ⎥ (239)2 ⎢⎝ partx1 ⎠ ⎝ partx⎣ 2 ⎠ ⎦ ⎥
It is important to recognize that we now have two expressions associated with the energy of
extension and they represent two distinct phenomena The first [eqn (333)] describes the
energy associated with true areal expansion that is a change in the effective spacing between the
molecules comprising the lipid bilayer The second [eqn (339)] corresponds to the energy
change due to undulations in a membrane with constant intermolecular spacing To see the
distinction between the two consider an experiment in which the pressure inside a cell or a lipid
vesicle is gradually increased by aspiration into a micropipette Initially the projected area of
the membrane rises rapidly with a relatively small increase in membrane tension corresponding
to the smoothing of undulations caused by thermal excitation of the membrane This is followed
at higher tensions by a transition to a regime in which the membrane exhibits a much greater
stiffness corresponding to the situation in which the thermally-induced undulations have been
smoothed out and the true membrane surface area now must increase In the absence of thermal
fluctuations eg at zero temperature only this second regime would be observed [see also
figure from Boal]
Energy of shear deformation Next examine the energy per unit area associated with shear
deformation in the plane of the membrane which can be expressed in the form
2
1 1 2 Gh ⎛ part u1 partu2 ⎞
U0h = 2 hτ12ε12 = 2 hGε12 = ⎜ + ⎟ (240)2 ⎝ partx2 partx1 ⎠
21
CHAPTER 21 CELL MEMBRANE MECHANICS AND ADHESION copyRD Kamm 4615
where we have utilized eqns (28) and (29) to obtain a form similar to that of eqn (234) for
extensional deformation
[See Boal for an alternative form in terms of membrane curvature He also gives a nice
description of bending in bilayer membranes]
Bending energy The contribution due to bending energy is somewhat more difficult to derive
First recognize that only those normal stresses that vary with x3 contribute to the bending
energy that is those contributed by the σ stresses in eqn (213) With this in mind we can
write the expression for the total elastic energy due to bending as
1 1 U = intintint ⎧ [ 2
⎨ ( ) 2 ⎫ σ 1 prime + ( )2
σ 2 prime + 2νσ 1 primeσ prime 2 ] + ( )τ 12 prime ⎬dx (241)⎩2E 2G ⎭ 1dx2dx3
Substituting for the stresses and strains from eqns (215)-(217) this can be re-cast in the
following form
⎧ 2 ⎫K ⎛ 2
part 2 2u ⎡ 2 u part ⎞ part 2u 2 part 2 ⎤ part u ⎛ u ⎞
U = B intint ⎜ 3 3 ⎟ 1 minus ν ) 3 3 2 minus ⎜ 3 ⎟⎨ 2 + 2 minus 2( 2 ⎬dx1dx (242)⎢ ⎥2 ⎝ partx1 partx2 ⎠ partx1 partx2 ⎝ partx1partx2 ⎠ 2
⎩ ⎣ ⎦ ⎭
It can be shown ((Meleard 1998)) that the integral of the second term in the integrand above [the
one multiplied by 2(1-ν)] is globally constant under deformation if the membrane remains a
closed surface with no holes Assuming that to be the case we obtain for the total bending strain
energy
KB ⎛
2 part 2u part 2
= intint ⎜ 3 u2 + 3 ⎞
U ⎟2 dx1dx2 + const (243)
2 ⎝ partx1 partx2 ⎠
Since we typically are concerned with changes in energy the constant will arbitrarily be set to
zero Thus the energy per unit area or energy density of bending deformations can be written
2 K ⎛ part 2 part 2 ⎞
0 = B u⎜
3 uU h 2 + 3
2 ⎟ (244)2 ⎝ partx1 partx2 ⎠
Note that the term in parentheses is proportional to the mean curvature of the surface Often the
surface has a natural mean curvature in the unstressed state If that curvature is c0 the bending
energy expression is modified slightly to the form
22
CHAPTER 21 CELL MEMBRANE MECHANICS AND ADHESION copyRD Kamm 4615
2 K ⎛ part 2 part 2 ⎞
U0 = B u⎜
3 uh 2 + 3
2 minus c0⎟ (245)2 ⎝ partx1 partx2 ⎠
Another common form of this expression is obtained by recognizing that the first two terms in
parentheses represent the linearized form of the sum of the principal curvatures (the largest and
smallest curvatures at a point) denoted c1 and c2 so that eqn (345) can be written
K
U2 B
0h = (c1 + c2 minus c0 ) 2
Although each of these expressions for strain energy density has been derived individually they
of course all contribute in the general situation and are linearly additive In that regard several
points are worthy of note First one can obtain some idea of the relative importance of
extension shear and bending deformations in a given situation simply by comparing their
relative energies just as was done in the last section by comparison of the bending and tension
terms in eqn (226) Not surprisingly the comparison leads to the same expressions we obtained
before for when either bending or tension is dominant Second due to the small shear modulus
of most cell membranes the energy stored in shear deformation can generally be neglected And
finally a comment is warranted concerning the energy due to tension Various simplifying
assumptions can be made depending on the cell type being considered and the nature of the
stress to which the cell (or vesicle) is being subjected but generally the lipid bilayer can be
considered to be of constant area unless it experiences grossly non-physiologic levels of stress
Thus the main contribution to extensional energy is that represented by eqn (339) associated
with the smoothing of membrane undulations
Other Factors Influencing Membrane Motion
Thermal fluctuations Biological membranes of all types can be seen to fluctuate due to
Brownian motion of the surrounding molecules if viewed with sufficient resolution These
fluctuations are in fact often used to measure the membrane bending stiffness since thermal
effects are seen as motions in the membrane of relatively long wavelength favoring bending
energies as compared to extensional or shear (see eqn (223)) To account for these effects it is
customary to add a time-dependent forcing term to eqn (223) η(t) the magnitude of which
scales with kBT We analyze thermal motions later and use them as a means of determining the
bending stiffness of a membrane
23
CHAPTER 21 CELL MEMBRANE MECHANICS AND ADHESION copyRD Kamm 4615
Damping due to external fluids When a membrane fluctuates in a direction perpendicular to its
plane velocities are induced in the surrounding fluids and due to the resulting shear stresses
energy is dissipated These motions are extremely complex to model precisely and depend on
both the nature of the surrounding medium (its rheological properties) and the bounding
geometry In lieu of a complete and rigorous analysis a local damping term is sometimes added
to the membrane force balance equation (eqn (223)) to approximate these effects Its form is
based on the presumption that externally induced velocities scale with the velocity of the wall
and that shear forces in the external fluid scale with the induced shear rates and velocities
Accordingly eqn (223) is modified by the addition of a term of the form μm partu3 partt where μμ is
the effective viscosity of the external fluid The equation that results from the addition of both
thermal forcing and external fluid viscosity is
partu ⎛ part 43 u 4
3 part u part+ 3 part 4u ⎞ part ⎛ ⎞ part ⎛ ⎞
B ⎜ 3 partu u
μm K 4 + 2 2 2 + 4 ⎟ minus ⎜ N3
⎟ minus part 1 ⎜ N
3
partt ⎝ x partx partx partx ⎠ partx ⎝ partx ⎠ partx ⎝ 2 ⎟ = p + η(t) (246)1 1 2 2 1 1 2 partx2 ⎠
An expression of similar form for a linear polymer is sometimes referred to as the Rouse
equation
314 Measurements of Membrane Elastic Parameters
Although the analogy has limitations it is useful at the onset to think of the cell as a fluid-filled
balloon or bag Just as in the case of a balloon the elastic properties of the membrane can be
determined by any experiment in which the membrane tension changes while its area is
measured In the simple example of a spherical balloon tension can be computed from the
inflating pressure and the measured radius the latter also yielding the surface area Ignoring for
now the thermal-induced fluctuations in a real cell membrane (ie assuming the cell to be at zero
temperature) the calculations become particularly simple Furthermore we will consider cells
for which the cytoplasm can be considered to fluid-like having no elasticity We return to
address both issues shortly
Osmotic swelling
Perhaps the simplest method to inflate the cell and measure the membrane elastic properties is to
cause the cell to swell by changing the osmolarity of the external fluid and simultaneously
monitoring the change in cell volume The change in transmembrane pressure mirrors the
24
CHAPTER 21 CELL MEMBRANE MECHANICS AND ADHESION copyRD Kamm 4615
change in osmotic pressure brought about by successive additions of a solute to which the
membrane is impermeable For ions and small molecules the osmotic pressure π can be
calculated from the vant Hoff equation
π = RT sum Ci (247)
i
where Ci are the molar concentrations of all solutes to which the membrane is impermeable For
larger molecules such as proteins their contribution to osmotic pressure is much larger than
indicted by this equation
Consider for example a spherical cell expanded osmotically so that the internal
hydrostatic pressure relative to external pressure is pc Microscopic examination yields a value
for the cell radius Rc Using these values in combination with Laplaces law [eqn (227)] gives
us the tension in this state and eqn (24) provides its relationship to the extensional modulus
p R Δ A
N = c c = Ke (248) 2 A0
The observed change in radius allows calculation of ΔA In practice identification of the reference state at zero pc is problematic due to the presence of thermal fluctuations but if Ke can be assumed constant for relatively small changes in area it is possible to extrapolate back to the zero-stress state from two measurements at elevated pc [Example red blood cell] Micropipet aspiration
One of the first methods used to measure the extensional modulus of the cell membrane involved
drawing a cell slightly deflated into a micropipet simultaneously monitoring the dimensions of
the cell and the pressure in the micropipet (Daily Elson et al 1984) Since on the time scale of
the experiment the volume of the cell could be assumed constant the shape change due to
aspiration of the cell causes increases in both internal pressure and surface tension both of which
are assumed spatially uniform Once the tension is large enough (or the temperature low
enough) to dampen the amplitude of any thermal fluctuations the cell can be treated assuming
that membrane extension is the dominant means by which the pressure drop across the
membrane is balanced [For further discussion on the thermal fluctuations and the relationship
between micropipet pressure and intracellular pressure see Daily and Evans and Rawicz Phys
Rev 1990 See also figure on p 199 of Boal Example the two regimes in membrane stiffness]
For the situation shown in Figxx the cell is drawn into the micropipet to the point at
which the portion of the cell external to the cell is spherical of radius Rc With the assumptions
25
CHAPTER 21 CELL MEMBRANE MECHANICS AND ADHESION copyRD Kamm 4615
stated above the (uniform) pressure within the cell can be related to it surface tension (assumed
uniform) and the radii of curvature of the main body of the cell Rc and the portion inside the
pipet a using Laplaces law [eqn (227)]
pc = 2N Rc = minus Δp + 2N a (249)
where pressures are referenced to the external ambient pressure Reorganizing to solve for
surface tension we obtain
ΔpN = (250)
⎛ 1 1 ⎞ 2⎜ minus ⎟
⎝ a Rc ⎠
The surface area corresponding to a given N is obtained from geometry summing the membrane
surface areas of the cylinder and hemisphere inside the micropipet and the truncated spherical
surface outside yielding for the areal strain the approximate expression
[(a R )2 (a R )3
Δ c minus c cong
]ΔLA
A 2a
Fig xx Micropipet aspiration of a neutrophil
This relationship between N and ΔAA can be used to calculate the area expansion modulus
Eh AK 0
e = = N 2 1( minus ν ) ΔA
where the expression involving Youngrsquos modulus assumes the membrane to be isotropic and
homogeneous The relationship could however be non-linear in that the value of Ke may vary
with the degree of area expansion a linear relationship between N and ΔA yields a constant value for Ke
It is important to note that neither of these approaches osmotic inflation or micropipet aspiration provides us with any information on the bending modulus To be precise bending
26
CHAPTER 21 CELL MEMBRANE MECHANICS AND ADHESION copyRD Kamm 4615
does play a role in the micropipet experiments but the effects are so small as to be negligible and are typically ignored That is not to say that bending is always negligible however as discussed next
Monitoring thermal fluctuations in the membrane
When a cell or lipid vesicle is observed floating free unattached to a substrate it can be seen to
exhibit time-dependent undulations as a result of collisions with the surrounding molecules
undergoing thermal motion In the case of a lipid vesicle with diameter in the range of 10
microns these undulations can be readily observed microscopically In smaller cells such as red
blood cells the motions can be inferred from the flickering phenomenon associated with the light
interference as the cell thickness changes (Zeman Engelhard et al 1990) Since the amplitude of
the membrane undulations depends on the stiffness of the membrane to bending and its surface
tension it is reasonable to expect that measures of this amplitude can be used to infer the
membrane elastic parameters In order to illustrate the method while avoiding some of the
algebraic complexity consider undulations in a flat membrane with significant bending stiffness
and a constant surface tension The relationship between the motion and the elastic properties
can be found by considering the total energy of the membrane obtained by summing the
energies per unit area from eqns (239) and (244) and integrating over the membrane surface
area Am
⎧ 2⎪ K ⎛ 2 2
part 2 u part 2 ⎡ 3 u ⎞
3 N ⎛ partu ⎞ ⎛ int 3 partu ⎞ ⎤⎫
B 3 ⎪
U0hdA = int ⎨ ⎜ 2 + 2 ⎟ + ⎢⎜ ⎟ + ⎜ ⎟ ⎥⎬dA (251) A ⎠ 2
m Am ⎪ 2 ⎝ partx1 partx2 ⎢⎝ partx1 ⎠ ⎝ partx2 ⎠ ⎥⎪ ⎩ ⎣ ⎦⎭
In writing the energy in this form we have omitted the contribution due to shear deformation
consistent with the fluid-like character of a pure lipid bilayer and have taken the surface tension
to be uniform during the deformation In this example membrane surface area changes only as a
result of fluctuations from the mean [u3(xxx2) = 0] configuration that is we now ignore the
contribution due to changes in intermolecular spacing and only consider changes in the area
projected onto the x1-x2 plane
It is convenient to use the method of Fourier transforms to represent the undulations of a
membrane normal to the x1-x2 plane which in two-dimensions leads to [see also class notes on
bending of cytoskeletal filaments alternatively use Fourier series representation]
A A
u3 (x) = u3 (x1 x2 ) = 2 intexp(iq sdot x)b(q)dq =
2 int exp(iq 4 1x1)exp(iq2 x2 )b(q1q2 )dq1dq
π 4π 2
(252)
27
CHAPTER 21 CELL MEMBRANE MECHANICS AND ADHESION copyRD Kamm 4615
where qα = 2π λα is the wavenumber of the particular mode and b(q) is the continuous analogue of the discrete coefficients that multiply each mode in a Fourier series representation
Here the algebra gets complicated so only the results of the analysis will be presented however
those wishing to see a more complete derivation should see (Boal Mechanics of the Cell
Cambridge University Press 2002) Introducing eqn (352) into (351) yields
1 ⎛ A ⎞2
int U q 40hdA = ⎜ ⎟ int (
KB + Nq2 )b(q)b(q)dq (253)2 2 ⎝ π ⎠
where b(q) is the complex conjugate of b(q) Now we invoke a previous result that at equilibrium energy is equally distributed among the various modes and that each mode has an
average energy of kBT2 Taking the ensemble average of eqn (353) and equating the energy of
each mode represented in the result to kBT2 (by the equipartition theorem) leads to
k Aq)b q) = BT
b( (K q4 2 (254)
B + Nq
This is a useful result in itself demonstrating that all modes tend to be suppressed as temperature
falls or as bending stiffness or surface tension rise In addition it shows the tendency for higher
modes to be of smaller amplitude But this equation has further value in that it can be used to
obtain a direct expression for the change in apparent area of a membrane as tension increases
Consider the true surface area of a membrane A represented as the sum of its projected
area and the additional area associated with thermally-induced undulations
⎡ 1 ⎛ 2⎤u ⎞ 2 part ⎛ partu ⎞
A = int dx + ⎢ 3 3 2
int ⎜ ⎢⎝ partx 2 ⎟ + ⎜
⎠ ⎝ partx 2 ⎟ ⎥dx (255)⎠ ⎥
⎣ 1 2 ⎦
Isolating the term representing the area reduction due to thermal fluctuations expressing u3 in
terms of its Fourier transform and taking the ensemble average of the result leads to
1 ⎛ A ⎞2
A minus int dx = ⎜ ⎟ int q 2 b(q)b(q) dq (256)2 ⎝ 2π ⎠
Combing eqn (254) from above with this expression yields
28
CHAPTER 21 CELL MEMBRANE MECHANICS AND ADHESION copyRD Kamm 4615
A minus int dx
kBT dq kBT dq2
= A 8π 2 int =
N int (257)
+ KBq 2 8π 2 N + KBq 2
where in writing the last term we have introduced the relations dq = dq2dθ 2 and int dθ = 2π By a simple substitution z = q2 + (N KB )the integral can be evaluated We do so however
between specified limits on the assumptions that the range of possible wavenumbers is restricted
by the size of the membrane on one hand (q = (πA12)) and the distance between individual lipid molecules on the other (q = πlm) Integrating between these limits results in
⎛ π 2 N ⎞
int dx 2 +A ⎜ ⎟ minus k T l K
= B ln⎜ m B ⎟ (258)A 8πKB ⎜ π 2 N ⎟
⎜ + ⎟ ⎝ A KB ⎠
If we use the area reduction at zero tension as a reference and increase the area from that
condition by progressively increasing membrane tension as in a typical experiment we finally
obtain an expression relating the change in area to the change in tension
⎛ NA ⎞ 1 + A dx A dx ΔA minus int minus ⎟ k ⎛ NA
int k ⎜equiv minus = BT π 2 K
ln ⎜ B T ⎞ 2 ⎟ cong B ln 1 + (259)
Nl ⎜ ⎟A A A 8π KB ⎜ 1 + m ⎟ 8π KB ⎝ π 2 KB ⎠ N = 0 N ⎜ 2 ⎟⎝ π K ⎠ B
where we have used the assumption supported by typical values found from different
experiments that (Nl2 m ) (π 2KB ) ltlt 1
You should recall that this solution was obtained on the assumption that the actual area
of the membrane remained constant and that the reduction in projected or apparent area resulted
from the undulations being progressively smoothed out Once the undulations are eliminated
the only means by which the projected area of the membrane can further increase is by an
increase in the inter-molecular spacing ndash an increase in the actual membrane area When this
occurs we expect to see a transition to the behavior discussed at the beginning of this chapter a
result expressed as
29
CHAPTER 21 CELL MEMBRANE MECHANICS AND ADHESION copyRD Kamm 4615
Fig yy Plots of tension vs normalized surface area for lipid vesicles of different composition Evans amp Rawicz 1990
ΔA N = (260)
A Ke
Thus we have two limiting predictions one for low tensions eqn (259) and another for high
tensions eqn (260) and the transition from one behavior to the other should occur when the
two expressions for ΔAA are of the same magnitude This is supported by experiment (Fig yy) and the results in the two regimes provide a means for estimating the two moduli Ke and KB
30
CHAPTER 21 CELL MEMBRANE MECHANICS AND ADHESION copyRD Kamm 4615
Before leaving this analysis there is one further result that is useful to state although the
derivation is again somewhat involved Once we have the solution for the undulations at a
given level of tension and for given membrane properties the ensemble average displacement
normal to the plane of the membrane can also be computed with the result
⎞
u2 k ⎛= BT NA
3 ln ⎜ 1+ ⎟ (261)4πN ⎝ π 2KB ⎠
Again this supports our intuition that the undulations will be suppressed at low temperature or
high tension And in the limit as N rarr 0 a binomial expansion of the natural log term shows that
the effect of tension drops out and the magnitude of the undulations varies inversely with the
bending stiffness
315 Membrane Fluid Mechanics
Early studies of protein diffusion notably the work of Saffman (Saffman 1976)
examined protein diffusion using an approach akin to that of Einstein in three dimensional space
thereby reducing the problem to one of solving for the mobility b in the equation for diffusivity
D = kBTb (262)
Calculation of the mobility is influenced by the viscous drag on the portion of the protein within
the membrane but also on to the intra- and extracellular domains as well The solution of
interest here is the one applicable in the limit of small μeμm where μe and μm are the external and
membrane viscosities respectively leading to
kBT ⎛ hμm⎞
D = ⎜minusγ + ln ⎟ (263)4πμmh ⎝ aμ e ⎠
where h is the membrane thickness a the radius of the protein (assumed cylindrical) and γ is
Eulers constant (=05772) Membrane viscosity has been estimated from lipid diffusion to be
~2 poise (McCloskey and Poo 1984) When finite mobility is achieved as a result of a finite
domain as for example a circle of radius R the corresponding result is
31
CHAPTER 21 CELL MEMBRANE MECHANICS AND ADHESION copyRD Kamm 4615
k ⎛ 1 D = BT R ⎞ log minus (264)
4πμh ⎝ a 2 ⎠
While this represents a useful point of departure measurements of lateral diffusion in a
membrane have demonstrated a more complex behavior Fluorescence recovery after
photobleaching (FRAP) has enabled the direct tracking of membrane proteins labeled with
fluorescent antibodies More recently single particle tracking methods have been developed
using colloidal gold or a fluorescent particle in conjunction with digital microscopy as well as
controlled movements using microbeads manipulated by an optical trap
From experiments such as these a new picture has emerged While the lateral diffusion
of lipids and a small fraction of trans-membrane proteins satisfy the general form of Saffmans
predictions the predicted diffusivity is greater than that observed experimentally and agrees with
experiments only when a membrane viscosity of 100 poise is used This might be due to the
presence of other proteins in the membrane (Kucik Elson et al 1999) Experiments also show
that many proteins appear to diffuse freely only in small domains typically measuring from 200shy
600 nm remaining confined to these domains for periods on the order of tens of seconds To
explain this behavior the membrane skeleton fence model was proposed (Kusumi Sako et al
1993) in which a membrane-associated matrix constrains the movement of proteins outside of
the domains defined by the matrix filaments Diffusion beyond these barrier filaments can occur
either as a result of random thermal motions of the transmembrane protein matrix filaments or
both or by transient breaks in the filaments Confinement of proteins may play an important role
in rapid and selective signaling Rapid directed motion of membrane-associated proteins has
also been observed and is likely due to active transport by an intracellular actin- or microtubule-
based motor
316 Cell Adhesion
This section deals with how cells adhere to their surroundings and through these sites of
adhesion how they interact with the external world We begin by summarizing the different
types of adhesion their functions and the molecules involved Next we provide a brief
description of the adhesion complexes found in cells and the role of each type Then the
theories that provide a quantitative description of adhesion between single receptor-ligand pairs
are reviewed in the context of the material presented in Chapter xx including the role of thermal
fluctuations Through these theoretical models both the static and dynamic states of adhesion
can be explored for single molecule pairs then for adherent cells Next we develop the different
32
CHAPTER 21 CELL MEMBRANE MECHANICS AND ADHESION copyRD Kamm 4615
approaches that are used to study the adhesion of cells based either on thermodynamics or
mechanics Methods for the measurement of adhesion strength are described providing
estimates for the force that a cell can exert on its surroundings Various examples will be
presented but the adherence of leukocytes to the endothelium and the role of adhesion in cell
migration will receive special attention
Functions of adhesion
Adhesion has been found to be an essential process necessary for a variety of fundamental
cellular functions
bull Structural integrity Adhesion helps to maintain the overall structural integrity of the
tissue in muscle for example it provides the means of force transmission from the cells
to the surrounding matrix to allow contraction In non-contractile cells it still provides
the needed mechanical coupling to the surrounding tissue necessary for a variety of
cellular functions
bull External sensing Adhesion provides a means by which the cell can sense and
subsequently respond to its surroundings Forces transmitted directly to the cell
membrane or to the cytoskeleton via transmembrane proteins may trigger a variety of
biochemical reactions within the cell as we shall see later in Chapter 33
bull Migration Cell-matrix adhesion is an essential element in cell migration a cell propels
its way through tissue or along a surface through a process involving adhesion
contraction and release also described in Chapter 33
bull Regulation of transport Sites of cell-cell adhesion are often important in the regulation
of transport across a cell layer such as in the case of an epithelium or endothelium
bull Communication Sites of mechanical coupling often provide a means of cell-cell
communication as in the case of gap junctions which offer a pathway for the diffusion
of ions and small molecules between adjacent cells
Adhesion molecules
Cells adhere to their surroundings or to an artificial substrate via a wide variety of different
proteins that can be classified into five major families integrins selectins cadherins
immunoglobulins and transmembrane proteoglycans (Table 1) In terms of their mechanism of
attachment to other cells or the external matrix these can be classified as either homophillic ndash
binding to like molecules heterophillic ndash binding to unlike molecules or those that bind to other
cells through an extracellular linker molecule
Integrins one of the largest class of adhesion molecules are primarily used to attach cells
to the extracellular matrix or the basal lamina but are also present in some cell-cell adhesion
33
CHAPTER 21 CELL MEMBRANE MECHANICS AND ADHESION copyRD Kamm 4615
complexes They typically bind to the matrix via the RGD amino acid sequence (arginine
glycine aspartic acid) but can also contain other binding motifs Integrins are heterodimers in
that they always contain an α and a β subunit with the different isoforms determining the specific ligand to which the integrin binds Two specific types of adhesion focal adhesions and hemidesmosomes often contain integrins and the attachments they make can at times be stable but at other times transient so as for example to mediate cell migration The force of adhesion of a single integrin-ligand bond has been measured using atomic force microscopy and found to be in the range of 30-100 pN (Lehenkari and Horton 1999) with a relatively low binding affinity in the range of K ~ 10-6
D to 10-8 molliter By comparison typical cell-surface receptors bind with an affinity in the range of 10-9 to 10-11 molliter Integrins also play an important role in signaling since extracellular integrin binding is known to influence cytoskeletal morphology as well as the state of cell differentiation Adhesion molecules in the selectin family also tend to form transient bonds and are important in leukocyte adhesion and extravasation the migration of the leukocyte through the endothelium and into the tissue Consequently they tend to be found in cells of the circulation and are present both in leukocytes and endothelial cells and are instrumental in adhesion between these two cell-types during leukocyte rolling
Family Location andor Ligands Comments
function recognized
integrins focal adhesions (E) fibronectin relatively low
hemi-desmosomes collagen laminin affinities
leukocyte immunoglobulins (KD~ 10-6-10-8
(spreading) (I) actin filaments molliter)
adhesion primarily
cell-matrix adhesion
but also in some
cell-cell adhesions
selectins circulating cells and carbohydrates require Ca2+
endothelial cells
rolling adhesion
Ig superfamily important in integrins
(immunoglobulin) immune response homophillic
cadherens adherens junctions (E) homophillic require Ca2+
desmosomes (I) actin
34
CHAPTER 21 CELL MEMBRANE MECHANICS AND ADHESION copyRD Kamm 4615
filaments
intermediate
filaments
transmembrane fibroblasts (E) collagen bind various
proteoglycans epithelial cells fibronectin growth factors
(I) actin such as FGF
filaments
heterophillic
Table 1 Cell adhesion molecules and their characteristics
While both integrin and selectin binding is mediated by Ca2+ adhesion via the
immunoglobulin (Ig) superfamily of proteins is Ca2+ independent Some of the most prominent members of this family are the N-CAMs (Neural cell adhesion molecules) and ICAMs (Intracellular cell adhesion molecules) These tend to undergo homophillic bonding but some also bind to members of the integrin family
Cadherens are often expressed in the same cells as the selectins but form much stronger bonds and therefore play an important role in maintaining cell integrity Because of these attributes cadherens are the primary adhesion proteins in desmosomes and adherens junctions the major structural contacts cells form with other cells or the basil lamina These also form homophillic bonds by a Ca2+ dependent mechanism and mediate selective bonding between adjacent cells Cadherens are relatively short as compared to other adhesion molecules being
about 700-750 amino acid residues in length
Types of adhesion complexes
Cells have developed a variety of specialized adhesion complexes each utilizing one or more of
the adhesion molecules of Table 1 and each serving a specific purpose Typically the cell-cell or
cell-surface spacing is in the range of 10-20 nm but this is highly variable ranging from less than
1 nm when controlling transport to over 100 nm in regions where tight control is unnecessary
Below we describe the different types of junctions and where important for function their
mechanical characteristics
Gap junctions Cells need to communicate with their neighbors for a variety of reasons For
example cardiac myocytes transmit signals from cell to cell in order to maintain a synchronous
35
CHAPTER 21 CELL MEMBRANE MECHANICS AND ADHESION copyRD Kamm 4615
wave of contraction This is typically accomplished by providing a pathway for ions and small
signaling molecules between cells called gap junctions (Fig 3110) These minute channels are
typically comprised of a collection of six connexin proteins that cluster together in cylindrical
fashion forming a minute channel that passes molecules and ions less than about 1200 to 2000
MW (15-2 nm) Transport through these channels is regulated and their permeability drops in
the presence of high Ca2+ concentration as when a cell membrane is ruptured or with low pH
Cyclic AMP acting as a second messenger can be exchanged between cells therefore gap
junctions provide a metabolic linkage between neighboring cells and provide a means by which
hormonal stimulation of just one cell can be transmitted to others
Adherens junctions Adherens junctions are belt-like structures that can be though of as the
structural weld that holds two cells together (Fig 3110) Because of their structural role
these junctions formed by homophilic bonding between proteins in the cadheren family are
anchored securely again via the adaptor proteins α β γ-catenin to the cytoskeleton
Desmosomes and Hemidesmosomes If the adherens junctions are the continuous welds between
cells desmosomes are the spot welds Again these serve primarily a structural purpose
joining two neighboring cells via a complex consisting of a dense plaque on the intracellular
sides of both cells extending 15-20 nm into the cell and consisting of a variety of proteins that
attach to keratin filaments part of the intermediate filament network Hemidesmosomes have
similar intracellular structure but attach instead to the basal laminae Based on their different
extracellular attachment sites desmosomes typically link to other cells via cadherens whereas
hemidesmosomes adhere via a type of integrin Both are commonly found in epithelial cells
36
CHAPTER 21 CELL MEMBRANE MECHANICS AND ADHESION copyRD Kamm 4615
Fig 3110 Schematic showing the different types of cell junctions present in an epithelial cell as found in the small intestine Tight junctions near the apical surface essentially prevent the passage of all molecules The spot desmosomes and adherens junctions provide for cell-cell anchoring and the hemidesmosomes for anchoring to the basal lamina Gap junctions provide a means for communication between neighboring cells [Reproduced from Lodish et al Molecular Cell Biology 2000]
Junction type Function Extracellular or Intracellular
adjacent cell attachment
attachment
Adherens structural cell-cell or cell- ECM proteins or actin filaments
matrix cadherins in
adjacent cell
Desmosome structural cell-cell cadherin intermediate
filaments
Hemidesmosome structural cell-matrix basal lamina via intermediate
integrins filaments
Focal adhesions structural cell-matrix ECM proteins actin filaments
via integrins
Tight junction regulate transport between homophillic binding between the
cells and along cell transmembrane proteins occludin or
37
CHAPTER 21 CELL MEMBRANE MECHANICS AND ADHESION copyRD Kamm 4615
membrane claudins
Gap junctions cell-cell communication channels formed by connexin
via ion and small molecule subunits
exchange
Table 2 Adhesion complexes
Focal adhesions A second means by which cells attach to the extracellular matrix is through
focal adhesions These serve a similar function to the hemidesmosomes and share a common
linkage via integrins to the ECM but are attached on the intracellular side instead to the actin
filaments of the cytoskeleton Actin filaments converge at the site of focal adhesions forming
stress fibers strong actin bundles that attach to the β-subunit of the integrins via adapter
proteins such as actinin vinculin and talin Focal adhesions are instrumental in cell migration
and for this purpose need to be easily formed and disrupted as the cell moves forward Release
or de-adhesion of cells is often mediated by a class of peptides called dis-integrins that
competitively bind to the RGD site used by integrins to attach to a variety of matrix molecules
Tight junctions Control of transport is generally mediated by tight junctions that form an
intricate network of seams between two cells (Fig 3111) As their name implies these are the
tightest of the cell-cell junctions and the gaps they leave are often small enough to exclude even
the smallest ions and molecules Formed by homophillic binding between the transmembrane
proteins occluding and claudins tight junctions allow epithelial cells to perform their critical role
in transepithelial transport and provide for maintenance of differences in concentration between
the apical and basal surfaces of these cells Since occludins are not capable of forming rigid
structural bonds with the cytoskeleton they are most often associated in a junctional complex
with adherens junctions or desmosomes that fulfill the structural needs of attachment
38
CHAPTER 21 CELL MEMBRANE MECHANICS AND ADHESION copyRD Kamm 4615
Fig 3111 Tight junctions in an epithelial cell shown schematically (a) in a freeze fracture replica (b) and in a transmission electron micrograph (c) [Reproduced from Alberts et al 1994]
Fig 3112 Two types of bond that attach a cell to the extracellular matrix by means of clusters of integrins On the extracellular side integrins bind to the matrix proteins fibronectin and laminin Inside the cell they attach to the cytoskeleton via adaptor proteins to either actin filaments (focal adhesions) or intermediate filaments (hemidesmosomes) [Reproduced from Lodish et al Molecular Cell Biolology 2000]
Non-specific binding
Cells can adhere to their surroundings by either non-specific or receptor-ligand (specific)
bonding Though both mechanisms are likely active in most situations as we will see receptorshy
39
CHAPTER 21 CELL MEMBRANE MECHANICS AND ADHESION copyRD Kamm 4615
ligand bonding is the stronger of the two by a considerable margin and is therefore the most
relevant biologically In situations for which either the receptors or their ligands are not present
however such as might be the case in certain in vitro experiments non-specific binding can be
important as well
There are essentially three major forms of non-specific attractions to consider
bull Van der Waals ndash These attractive forces arise due to charge interactions in polar
molecules They tend to dominate among the non-specific mechanisms at
intermediate distances around 20-25 nm [see Boal]
bull Electrostatic ndash These interactions can be either attractive or repulsive depending
on the sign of the surface charges and are particularly important during the
approach of two cells since the glycocalyx has a high negative charge density
bull Steric ndash These forces arise due to the steric exclusion of two molecules as they are
brought into close contact In the case of cell-cell interactions steric repulsion is
due to the compression of the two glycocalyx layers and the tendency to resist
compression resulting from osmotic effects and the elasticity of the layer Steric
forces tend to dominate for small separation distances lt 10 nm
In combination these effects combine to produce a net attractive force per unit area of
about 100 Pa at a separation distance of about 25 nm
Adhesion by means of receptor-ligand binding
We can use the analysis of Chapter xx to estimate the strength of a receptor-ligand bond and
based on typical values for bond density calculate the corresponding strength of adhesion
between two cells or between a cell and a surface Recall that the application of force to a
receptor-ligand bond modifies the dissociation rate constant for the binding reaction This effect
can be modeled in several ways but the result obtained by Bell ((Bell 1978)) suggests the
following exponential form for the dissociation rate
0 ⎛ γf ⎞ 0 ⎛ γσ ⎞ kminus = kminus exp⎜ ⎟ = kminus exp⎜ ⎟ (265)
⎝ kBT ⎠ ⎝ NC kBT ⎠
where k0minus is the unforced dissociation rate constant γ is a factor with the units of length that
corresponds roughly with the distance separating the bonded pair at equilibrium NC is the concentration of bonded complex and σ is the average bond force per unit area To determine
40
CHAPTER 21 CELL MEMBRANE MECHANICS AND ADHESION copyRD Kamm 4615
the rate of change of the concentration of bonded pairs one must solve the following rate equation describing the competition between bond formation (first term) and destruction (second term)
dNC ⎛ γσ ⎞
cong k+ (NR minus NC )(NL ) minus kminus NC = k+ (N minus )( 0R NC NL ) minus kminus NC exp⎜ ⎟ (266)
dt ⎝ NC kBT ⎠
where NR and NL are the concentrations of receptors and ligands respectively and we have
assumed that NCltltNL and that all bonds are stressed equally At equilibrium dNCdt=0 and if
the force applied to detach the cell (equal to the average bond stress σ) is increased
incrementally from zero NC will progressively fall to a new equilibrium value At sufficiently
high levels of force however increasing σ further eventually gives rise to a situation in which equilibrium can no longer be achieved through a reduction in NC At that point NC tends toward zero and the cell separates from the surface to which it was attached It can be shown that this
occurs when (Bell 1978)
k 0
α c exp(α + c + 1) = N
k 0 L (267)minus
σ
where α minγ c equiv and σmin is the minimum stress needed to cause detachment For a wide
NRkBT
range of conditions eqn (267) has the approximate solution
⎛ k0 + ⎞
α c cong 07 ln L (268)⎜ 0 N ⎟⎝ kminus ⎠
so that the critical stress for detachment can be expressed as
N 0
σ cong 07 C kBT ⎛ k ⎞ ln⎜
+ min N ⎟ (269)
γ ⎝ k0 L minus ⎠
where NC is determined from setting eqn (266) to zero under these critical conditions
Thermodynamic approach to cell adhesion
Although we focus here on the mechanical aspects of cell adhesion this process can also be
viewed from a thermodynamic perspective In this approach adhesion is considered in terms of
the change in energy specifically the Gibbs free energy G associated with all the individual
receptor-ligand interactions as well as the various non-specific forces of attraction or repulsion
The adhesion of a cell to a given surface then can be viewed as an equilibrium state determined
41
CHAPTER 21 CELL MEMBRANE MECHANICS AND ADHESION copyRD Kamm 4615
by minimization of the free energy If in undergoing a transition from a free state to an adherent
state the system represented by the cell and surface experiences a reduction in free energy ie
ΔGlt0 then adhesion will occur and the equilibrium state of adhesion will be determined by that with the minimum in free energy or the largest value of -ΔG While this approach ignores
many of the subtleties of the interactions and like the analysis above assumes that all receptorshy
ligand interactions are identical from an energetic point of view it is useful in providing some
simple insights as seen in the next two examples
Example Comparison of specific and non-specific adhesive forces Non-specific bonding due
to the combined effects of van der Waals electrostatic and steric forces result in an attractive
stress of approximately 100 Pa Receptor-ligand bonding give rise to forces that can be
estimated from the change in free energy f ~ to 4x10⁻⁴ dynbond = 9x10-11 to 4x10⁻⁹ ΔGr~9x10⁻⁶ Nbond where f is the force required to break the bond and r is a measure of the distance the bond stretches before it breaks Using a typical density of the receptor-ligand complex NC of ~1012-1015 bondsm2 gives a total bond stress of N 1
C x f ~ 9 x 10 to 4x10⁶ Pa The above kinetic approach to estimating bond strength [eqn (269)] gives a value approximately half of that from this equilibrium approach In either case however the conclusion remains the same non-specific binding can under certain circumstances be important since it is comparable to the lowest estimates of receptor-ligand-mediated bond strength but not surprisingly the latter is quite likely to dominate in nearly all practical situations
Example JKR theory for the equilibrium area of adhesion between a cell and substrate
It is well known that cells tend to take on a more flattened shape as the substrate to which they
are attached becomes more strongly adhesive either by coating with a more attractive ligand or
by increasing the concentration of ligand bound to the substrate Conversely less adhesive cells
round up and become more spherical These observations can be explained with the help of a
simple scaling analysis on the assumptions of small deformation of a linear elastic cell
Let the cell be modeled as a homogeneous elastic sphere with elastic modulus E and
initial radius R (Fig 3113) It is then brought into contact with a surface to which it adheres
As the cell adheres it attains a lower energy state characterized by an adhesion energy per unit
area J Formation of a flat adhesion surface however requires deformation within the elastic
cell and an associated increase in the stored elastic energy In Chapter 31 we showed that the
stored elastic energy per unit volume can be written
UE asymp int τεdV asymp int 1 2 Eε 2dV (270)
Vc Vc
42
CHAPTER 21 CELL MEMBRANE MECHANICS AND ADHESION copyRD Kamm 4615
Strain inside the cell can be approximated as the displacement of the cell surface δ divided by the characteristic distance within the cell to which the deformations penetrate a distance that scales with the lateral extent of the contact region 2a so that ε prop δ a where it can easily be shown from the geometry that a 2 asymp 2δR so that ε prop δ R Combining and dropping all numerical constants we obtain the following scaling approximation
δUE prop E ( )δR
3 2 (271)R
An expression for the total energy of the system then can be written
U prop minusJa2 + Eε2a3 prop JδR + Eδ 5 2R1 2 (272) The equilibrium state corresponds to the value of δ having the minimum energy obtain from
partU prop minusJR + Eδ 3 2R1 2 (273)
partδ so that
23 1 3 ⎛ JR12 ⎞ ⎛ JR2 ⎞
δ prop ⎜ ⎟ and a prop ⎜ ⎟ (274)⎝ E ⎠ ⎝ E ⎠
The exact solution to this problem yields the result
⎡ ) 1 3 2 1( minusν 2 ⎤ 9πJR
a = ⎢ ⎥ (275)⎢ 2E ⎥⎣ ⎦
43
CHAPTER 21 CELL MEMBRANE MECHANICS AND ADHESION copyRD Kamm 4615
Elastic modulus E adhesion energy per unit area J
2a
Fig 3113 Experiments to determine the contact area of an iminobiotin functionalized agarosebead on a glass coverslip in water Top Schematic of adherent bead Bottom Results for a range of bead radii Solid line is a fit to the date which obeys the power law a prop R23 consistent with the prediction of JKR theory eqn(276) [Reproduced from (Moy Jiao et al 1999)] This can be compared to the result obtained from a more rigorous analysis
⎡9πJR 2(1minus ν 2 ) 13 ⎤
a = ⎢ ⎥ (276)2E⎢ ⎣ ⎥⎦
and to experimental data obtained from spherical beads made from a 4 agarose gel (Fig 3113)
Models for receptor-mediated adhesion
In Chapter x and in the preceding text we discussed the energetics of bond formation and release
as well as the effect of applied force in altering the energy landscape of the bonded pair and
thereby the rate constants for bond kinetics That analysis has obvious implications to the
44
CHAPTER 21 CELL MEMBRANE MECHANICS AND ADHESION copyRD Kamm 4615
adhesion of cells to substrates the surrounding extracellular matrix and other cells Here we
extend that analysis in the specific case of whole cell adhesion In doing so it will be important
to consider such factors as the distribution type and density of receptor-ligand bonds or
potential bonds and the elastic properties of the structures to which they are anchored On the
intracellular side this involves the series of couplings that link the receptor to the cell In the
simplest case this might simply be a link to the lipid bilayer if the receptor has no intracellular
connections More typically especially for couplings with a structural role it involves a series
of proteins ultimately linking the receptor to the cytoskeleton
The typical setting in vivo is one in which cells adhere to other cells or to the extracellular
matrix Adhesions are more easily probed however through in vitro experiments (described
below) where cell adhesion more often occurs to an artificial substrate mediated through one of
several extracellular proteins that are used to coat the surface Generally either collagen or
fibronectin is used Cells are often adhered to these substrates but to produce a more controlled
environment rigid beads are sometimes coated with the appropriate receptors so that one specific
receptor-ligand interaction can be probed While these systems are useful as models of certain
adhesion phenomena it is important to recognize in the interpretation of these experiments that
when bound to a rigid substrate or bead the binding proteins cannot freely diffuse as they would
in a more natural environment In particular the formation of focal adhesions would not occur in
bead-substrate experiments because the receptors would be constrained from aggregating
It is instructive to begin this discussion with a consideration of a single adhesion bond
for example one linking the actin matrix of the cytoskeleton to a β1 integrin and the integrin
receptor binding to the extracellular matrix beyond the cell membrane (Fig 3114) If the bond
is stressed as for example if the cell experiences a force relative to the ECM it will at first
stretch an amount dictated by the level of force in the bond and the stiffness of the complex
Each bond as well as each protein in the bond complex can be thought of as having a certain
stiffness giving rise to a picture in which several springs are considered connected in series
Forces acting on the adhesion complex are transmitted via this series of bonded proteins between
the CSK and the ECM producing local deformations and stresses in the corresponding matrices
that decay with distance from the adhesion site On the intracellular side these forces are
transmitted via a complex involving vinculin α-actinin paxillin and talin Attachment to the
extracellular matrix is mediated by an RGD sequence (in fibronectin for example) which in turn
has binding sites for collagen and fibrin If the force is sufficiently strong above a certain
threshold value F0 say and applied for a sufficiently long time the bond might be severed (deshy
couple) Typical values of this threshold force lie in the range of 10-100 pN (Evans and Ritchie
1997) but depend as well on the rate at which the force is increased Under more rapid
forcings the threshold is high compared to when the force is increased slowly This simply
45
CHAPTER 21 CELL MEMBRANE MECHANICS AND ADHESION copyRD Kamm 4615
reflects the fact that detachment is a stochastic process and that at any given level of force there
exists a finite probability of detachment and this probability increases with time
Fig 3114 One type of attachment linking the intracellular actin matrix to the extracellular matrix via an integrin complex that involves in addition vinculin α-actinin paxillin and talin (Reproduced from Lodish et al Molecular Cell Biolology 2000)
We need also to consider that in equilibrium a fraction Φ = K(1+K)-1 (where K is the
equilibrium constant) of the receptors will be bound at any given time and that the receptorshy
ligand complexes are continually cycling between the bound and unbound states characterized
by their respective rate constants
On a larger scale numerous adhesion sites typically act in parallel each contributing
some amount to the total adhesion force If the force transmitted by each single adhesion
complex is F and the density of adhesion sites (per unit membrane area) is NC then the stress
acting on the cell is the product F NC This gives a somewhat false impression however as it is
unlikely that each adhesion complex carries an equal force Put another way there exists a local
stress τ that can be thought of as the product of the average force per bond times the bond
density This stress is typically non-uniform In the adhesion of a cell to a flat substrate the
bonds near the periphery of the contact zone determine the strength of the cell against
detachment and when the cell is subjected to a detaching force the stresses are concentrated in
46
CHAPTER 21 CELL MEMBRANE MECHANICS AND ADHESION copyRD Kamm 4615
this peripheral region as depicted in Fig 3115 In the vicinity of the edge of adhesion several
factors will influence the stress distribution including the mechanical properties of the membrane
(in particular the bending stiffness KB) the receptor density the spring constants of the bond
and the bond strength
N
Region of adhesion
x1
Fig 3115 Schematic model of a cell membrane being detached from a substrate by application of a tension force N The membrane is free to the left of the dash-dot line and adherent to the right Forces and moments are transmitted through the membrane which adheres to the membrane through receptor-ligand bonds represented by a continuous distrubution p(x1)
To illustrate consider the following simple model for an adherent cell being peeled away
from its substrate by a force that generates a tension N in the membrane (Fig 3115)
Deformations in the membrane are described by eqn (223) where it can be shown that the
bending term dominates provided KbL2 gtN where L is the characteristic length in the x1 direction
(due to the small length scales involved) and the external membrane force (p in the membrane
equation) is now the non-uniform stress due to adhesion bonds As a simple first approximation
we take p = k(δminusδ0) with δ-δ0 being the amount of stretch in the receptor-ligand bond springs
and k an effective bond spring constant Recognizing that p approaches zero far from the edge
(see Fig 319) the membrane displacement and the spring displacement are related u3 = δ-δ0
Thus eqn (228) is written
⎛ part 4 u
KB⎜ 3
⎞ 4 ⎟ = NC F = NC ku
⎝ partx ⎠ 3 (277)1
This can be solved directly showing that the distance of separation between the cell membrane
and substrate grows in an exponential fashion with distance Even more simply a scaling
47
CHAPTER 21 CELL MEMBRANE MECHANICS AND ADHESION copyRD Kamm 4615
analysis of eqn (277) in which the term on the left is approximated by Kbu3w4 where w is the
characteristic distance over which u3 varies tells us that the stresses are concentrated in a region
of width
K
w prop B4 (278)
NC k
near the cell periphery Similarly we can estimate that the cell membrane will detach from the
substrate if N gt FoNCw where F0 is a measure of the force in a single bond at the time of bond
rupture and that the rate of peeling can be roughly approximated as the product of the
disassociation rate k -- (bondss) from eqn (265) and the distance between bonds (N -12C )
Although this provides some insight into how the peeling rate depends on the various factors it fails to capture the fact that the cell remains in an equilibrium attached state even for non-zero levels of tension reflecting that even under force a balance can exist between the rates of formation and rupture of receptor-ligand complexes (Ra Picart et al 1999)
It is also of interest to note that in the region near the edge of the attachment zone(x1=0
in Fig 3115) the membrane acts as a beam subjected to a moment due to the applied tension
This moment is balanced by a force couple due to tension in the adhesion complexes right
adjacent to the edge in combination with a compressive stress between the cell and substrate a
little further in In typical situations this compressive stress can approach levels as high as one
atmosphere and can act to effectively smooth the membrane and recruit new attachment sights While using these continuum descriptions it is important to keep in mind the true
discrete nature of the individual bonds represented in the model as a continuous adhesive
surface This is brought to light by a simple calculation in which the characteristic length over
which the applied tension is supported w is compared to the inter-receptor spacing N -12C
Using typical values for the parameters NC = 103 complexesμm-2 k = 10-5 to 10-6 Nm Kb = 1 to 2x10-18 Nm we find that w cong 01 to 03 μm and the inter-complex spacing N minus1 2
C cong 003 μm While it is reassuring to see that w is typically less than the inter-complex spacing the difference is small It is therefore not surprising that the actual process of cell peeling is stochastic in nature occurring in a sequence of more-or-less discrete steps with a velocity of peeling that varies widely from the mean
The interplay between receptor-ligand bonding and membrane stiffness also determines whether a cell will spread over a surface or peel away from it under a given tension Membrane bending stiffness acts to maintain the membrane and substrate within close proximity near the edge of contact (Fig 3115) Spreading can occur only if their separation distance is within the extended length of the receptor ligand bond over a distance comparable to the linear spacing
48
CHAPTER 21 CELL MEMBRANE MECHANICS AND ADHESION copyRD Kamm 4615
between neighboring bonds ( N minus1 2 C ) Under high tension the surfaces rapidly diverge and
spreading is prevented if the tension is sufficiently low receptor-ligand bonding can occur and spreading can occur
Measurements of adhesion
A variety of methods have been used to experimentally determine the strength of adhesion either
of individual receptor-ligand bonds or populations of bonds as in the case of entire cells
Whole cell experiments are more common and typically require less experimental
sophistication The drawback of course is that they provide only for estimates of average
properties and require certain assumptions regarding the distribution of cell-substrate adhesive
stress for interpretation to the level of a single bond Several of these methods are described
next
Centrifugal cell adhesion assays In this experiment cells are allowed to attached to a substrate
then are placed in a centrifuge rotating at speed ω positioned a distance r from the center of
rotation and oriented so that the net centrifugal force is acting to separate the cell from the
substrate Using the arrangement shown in Fig 3116 (right) the acceleration of the cells is 2ω r and the net force acting on a cell of volume Vc is F = (ρc minus ρf )ω 2rVc where the fluid and cell densities are ρf and ρc respectively
Interpreting these results we can make several different assumptions each leading to a different estimate for the maximum force experienced by the binding complex If we simply assume that all receptor-ligand complexes support an equal fraction of the total force F then the force per bond is f = F (πa 2NC ) where NC is the concentration of bond complexes However as the cell tears away from the substrate the edge bonds will break first since these experience the greatest level of force An alternative approach then is to assume that the adhesion complexes around the cell circumference support the entire load leading to the estimate f = F 2( πaN 1 2 ) recognizing that N1 2
C C is the average distance between bonds A somewhatmore accurate value for f might be obtained if we assume that all complexes within the distance w given by eqn (278) support the load In any of these cases once the centrifugal force exceeds some critical limit since the number of receptors supporting the load falls as the region of contact becomes smaller the force per bond increases and the cell will rapidly detach
Stochastic variability also needs to be taken into account however since even under a constant load any single bond has a finite probability of failure under a given level of force The equilibrium state of the cell then should be viewed as one in which the rate of bond formation equals the rate of bond breakage with increasing force having the effect of reducing the
49
CHAPTER 21 CELL MEMBRANE MECHANICS AND ADHESION copyRD Kamm 4615
probability that the bond will remain intact These effects can be addressed using the methods described in more detail in Chapter xx Parallel flow assay Another common method for assessing cell adhesion is to plate the cells onto one wall of a parallel flow chamber subject them to a fluid dynamic shear stress and observe at what flow rate the cells begin to release If we ignore flow details in the immediate vicinity of the cell the shear stress can be estimated from the solution for a fully developed (Poiseuille) velocity profile
3V ⎡ y2
⎛ ⎞ ⎤v(y) = ⎢1minus ⎥ (279)
2 ⎝ ⎠ ⎣ ⎢ h ⎥⎦
so that the shear stress acting on the cell is
⎛ dv ⎞ 6μV τw = μ⎜ ⎟ = (280)
⎝ dy ⎠ h y = minush
and the total force can be estimated as F asymp τw Ac where Ac is the surface area of the cell membrane exposed to the flow Consider as an example a flow of culture medium at a rate of 1 mls through a channel of height 01 cm and width 1 cm If the culture medium has a viscosity close to that of water (μ=001 dyns) the shear stress is obtained from eqn (280)
6 sdot (001dyn sdot s) sdot (1ml s) ( 01 sdot10cm2 )τ dyn cm 2w = = 6 = 06Pa
01cm This corresponds roughly with the level of shear stress experience by endothelial cells in the arterial system If we consider that the cell has a surface area with dimensions roughly 100 μm x 10 μm or about 103 μm2 then the total force acting on the cell is obtained by integrating the shear stress over the area of the apical membrane Assuming that the shear stress is uniform the force is simply the product of shear stress and surface area or about 1 nN in the present example Again interpretation of results from such experiments requires careful consideration of the distribution of forces among the individual adhesion complexes In this situation the cell is likely to peel from the upstream edge in much the same manner as occurs in the cell peeling experiment discussed earlier
50
CHAPTER 21 CELL MEMBRANE MECHANICS AND ADHESION copyRD Kamm 4615
Radial flow and spinning disk assays One disadvantage of the parallel flow assay is that all cells are subjected to essentially the same level of shear stress so the flow rate needs to be incrementally varied in order to determine the level of force required for detachment These two systems using an axisymmetric geometry circumvent this problem by producing an easily characterized radial variation in shear stress In the case of the radial flow assay fluid enters through a central channel and flows radially outward through the narrow gap between two circular plates From conservation of mass the mean flow velocity is given by
QV = (281)
2πrh and sufficiently far from the center (rgtgth) the velocity profile is parabolic as in the parallel flow assay and the shear stress is again governed by eqn (280) using (281) for V Q
ω
(Not to scale)
v
h h
Cell layer rc Ce l l layer rc
r r
Fig 3116 Schematic diagram showing the radial flow assay (left) and the spinning disk assay (right) In the radial flow assay shear stress attains a maximum value near the center and falls with increasing radius r whereas in the spinning disk system maximum shear stress is experienced at large r In the spinning disk assay cells are grown on one disk and the opposite disk is rotated at constant speed Provided the rate of rotation is sufficiently small that inertial effects can be neglected the velocity is purely in the circumferential direction and the profile is linear between the two plates so that the shear stress experienced by the cells can easily be computed as
ωr τw = μ (282)
h
51
CHAPTER 21 CELL MEMBRANE MECHANICS AND ADHESION copyRD Kamm 4615
In both of these cases as in the parallel flow assay the total force is obtained by integrating the shear stress over the cell surface and the distribution of force among the adhesion complexes is weighted toward those located near the upstream end of the cell This can also be seen by consideration of the torque exerted by shear stress on the cell that must be balanced by a nonshyuniform contact stress with the substrate that is greatest near the upstream end Single bond adhesion assays Two other assays provide a means of obtaining estimates for the strength of a single adhesion bond without the need for excessive interpretation These rely on an ability to isolate a small number of bonds or even a single bond and infer bond strength from the step-wise nature of the de-adhesion process associated with breakage of discrete bonds One of these methods employs the atomic force microscope coated with the ligand of an adhesion receptor as shown in Fig 3117 The probe tip is gradually brought up to the cell surface until one or more receptor-ligand bonds are formed When the probe tip is withdrawn it moves along a different trajectory on a force-displacement plot reflecting the forces of adhesion These forces are seen to jump between more or less discrete levels as the probe continues to be moved away from the cell with each jump corresponding to the breakage of a single bond (Fig 3117) Using this method the bond strength between integrin receptor and a variety of RGD-containing ligands was found to lie in the range of 30 to 100 pN (Lehenkari and Horton 1999)
Fig 3117 The strength of a single adhesion bond can be measured by bringing a functionalized tip of an AFM probe up to the cell allowing bonds to form then slowly withdrawing the probe Monitoring the differences between the force displacement curve between the forward and reverse motions the forces necessary to break a single receptor-ligand bond can be determined [Reproduced from (Lehenkari and Horton 1999)]
52
CHAPTER 21 CELL MEMBRANE MECHANICS AND ADHESION copyRD Kamm 4615
A second method is similar in that the discrete increments in force are monitored as individual receptor-ligand bonds are broken but the forces are measured by means of changes in the shape of a giant vesicle the membrane of which contains the ligands have been inserted In this case one vesicle is made effectively rigid due for example to a high surface tension A second vesicle containing the adhesion molecules is also drawn partially into a micropipet but is much more complaint than the first The two vesicles are then brought into point contact so that one or a small number of adhesions are formed As the pipets are moved apart the compliant vesicle distorts due to the force of adhesion which it can be shown is related to the change in dimension of the vesicle in the direction of the force thereby serving as a sensitive force transducer measuring forces in the range of single adhesion receptors or between 1 and 100 pN [Evans 1991 37]
(For specific examples of leukocyte rolling and attachment see Orsello or Chang amp Hammer)
[This process is initiated for example by local infection that causes the release of
chemotactic agents in addition to cytokines hellip
Models of this process draw upon many of the concepts discussed in this chapter ]
Transient cell adhesion
Concepts of transient adhesion and release are of particular importance in the case of leukocyte
rolling adhesion and transmigration across the endothelial layer of a blood vessel In addition
cell migration through extracellular matrix or along a substrate requires the ability of the cell to
both form and release adhesions
One problem that has received considerable attention is the interaction between an
adherent or rolling leukocyte and the adhesion receptors on the endothelium These studies are
complicated by the three-dimensional nature of the flow the compliance of the interacting
surfaces and receptor-ligand dynamics In a series of recent studies Hammer and co-workers
(Chang Tees et al 2000) have addressed several of these issues computing the viscous force
and torque acting upon a sphere near to planar wall from the mobility matrix (Hammer and Apte
1992) and using the ldquoBell modelrdquo of receptor binding (Bell 1978) but neglecting the effects of
cell deformation The Bell model relates the dissociation rate constant kr to the force in the
bond f the thermal energy kBT and a parameter with units of length that depends on the
reactivity of the molecule
kr = ko r exp(γf kBT ) (283)
53
CHAPTER 21 CELL MEMBRANE MECHANICS AND ADHESION copyRD Kamm 4615
A Monte Carlo method is employed at each time step in the calculation to determine bond
formation or breakage In these studies the nature of the leukocyte-endothelial interaction is
characterized as firm adhesion rolling adhesion bimodal adhesion or no adhesion and mapped
as a function of the two parameters of the Bell model in Fig 3 The boundaries of the rolling
adhesion regime are identified for a wall shear rate of 100 s-1 (dotted lines) or 30 and 400 s-1
(solid lines) Most literature values for the Bell model parameters for a variety of selectin
receptors (known to be instrumental in leukocyte rolling) correspond to the rolling adhesion
regime for typical shear rate of 100 s-1 An interesting but counterintuitive result from this study
was the observation that as the bond stiffness was increased from the value used in most
calculations (100 dyne cm-1) adhesiveness decreased which the authors attribute to reduced
deflection for a given level of force leading subsequently to more rapid dissociation
Fig 3118 The state diagram for a leukocyte interacting with an endothelial surface for shear rates ranging from 30 to 400 s-1 For low dissociation rates the leukocyte remains adherent to the surface (lower left) As either (γ) or ( ko
r ) [see Eqn (283) for definitions] is increased the cell first adheres firmly then rolls along the wall then completely detaches (upper right) Rolling adhesion is defined as the regime where rolling occurs over some part of the shear rate range between 30 and 400 s-1 Firm adhesion indicates that cells remain attached even at the highest shear rate no adhesion indicates that cells roll at a velocity gt 50 of the velocity of a non-adherent sphere In the bimodal regime cells are either adherent or non-adherent and do not exhibit rolling Dotted curves correspond to these same boundaries for a shear rate of 100 s-1 Reproduced from Chang et al (2000)
54
CHAPTER 21 CELL MEMBRANE MECHANICS AND ADHESION copyRD Kamm 4615
In another recent study using high-resolution video-microscopy (Schmidtke and Diamond
2000) it was demonstrated that a flowing neutrophil can attach to an adherent platelet via
adhesion molecules located in the tips of the microvilli and form long tethers averaging nearly 10
μm in length but ranging up to 40 μm at extensional rates of 6-40 μm s-1 for shear rates ranging
from 100-250 s-1 The mechanics of tether formation is itself a fascinating topic that is still under
intense investigation Readers interested in pursuing this work in more detail are referred to the
several papers (Hochmuth Shao et al 1996 Dai and Sheetz 1998 Dai and Sheetz 1999) that
identify a number of intriguing phenomena
55
CHAPTER 21 CELL MEMBRANE MECHANICS AND ADHESION copyRD Kamm 4615
317 Nomenclature Parameter Definition Units
R - receptor
L - ligand
C - receptor-ligand complex
G - Gibbs free energy Nm
N - membrane tension Nm
NR - total receptor density -3μm-2 in 2D or μm in 3D NL - total ligand density μm-2 in 2D or μm-3 in 3D N in 2D or μm-3μm-2
C - complex density in 3D NRf - free receptor density m-2 in 2D or m-3μ μ in 3D NLf - free ligand density -2 -3μm in 2D or μm in 3D d+ - forward diffusional rate constant 2 -1μm s-1 in 2D or 3 μm s in 3D d -1
- - reverse diffusional rate constant s r+ - forward reaction rate constant s-1
r- - reverse reaction rate constant s-1 D 2 -1
m - membrane diffusion coefficient μm s D - solution diffusion coefficient m2 s -1s μ Kb - bending stiffness Nm K 0 - equilibrium constant or affinity (zero force) M-1 in 3D and 2μm in 2D = k0
+ k0 minus
K - equilibrium constant M-1 in 3D and m2μ in 2D = k+kshy
k0 - association rate constant (zero force) M-1 s-1 in 3D or m-2 -1+ μ s in 2D
k0 - dissociation rate constant (zero force) s-1 minus
k - association rate constant M-1 s-1 in 3D or m-2 -1+ μ s in 2D
kminus - dissociation rate constant s-1 f - force per bond N F - total adhesion force N γ - empirical parameter μm r0 - distance over which energy minimum acts μm E0 - bond energy J k JK-1
B - Boltzmanns constant T - temperature K τ - bond lifetime s
56
CHAPTER 21 CELL MEMBRANE MECHANICS AND ADHESION copyRD Kamm 4615
τ0 - bond lifetime with zero force s σ - adhesion stress N μm-2 κ - spring constant for receptor-ligand bond N μm-1
57
CHAPTER 21 CELL MEMBRANE MECHANICS AND ADHESION copyRD Kamm 4615
References Bell G I (1978) Models for the specific adhesion of cells to cells Science 200 618-627 Caille N O Thoumine et al (2002) Contribution of the nucleus to the mechanical properties
of endothelial cells J Biomech 35(2) 177-87 Chang K C D F Tees et al (2000) The state diagram for cell adhesion under flow
leukocyte rolling and firm adhesion Proc Natl Acad Sci U S A 97(21) 11262-7 Dai J and M P Sheetz (1998) Cell membrane mechanics Methods Cell Biol 55 157-71 Dai J and M P Sheetz (1999) Membrane tether formation from blebbing cells Biophys J
77(6) 3363-70 Daily Elson et al (1984) Determination of the elastic area compressibility modulus of the
erythrocyte membrane Biophys J 45(4) 671-682 Evans E and K Ritchie (1997) Dynamic strength of molecular adhesion bonds Biophys J
72(4) 1541-55 Evans E A (1983) Bending elastic modulus of red blood cell membrane derived from
buckling instability in micropipet aspiration tests Biophys J 43(1) 27-30 Hammer D A and S M Apte (1992) Simulation of cell rolling and adhesion on surfaces in
shear flow general results and analysis of selectin-mediated neutrophil adhesion Biophys J 63(1) 35-57
Hardt S L (1979) Rates of diffusion controlled reactions in one two and three dimensions Biophysical Chemistry 10 239-243
Hochmuth F M J Y Shao et al (1996) Deformation and flow of membrane into tethers extracted from neuronal growth cones Biophys J 70(1) 358-69
Kucik D F E L Elson et al (1999) Weak dependence of mobility of membrane protein aggregates on aggregate size supports a viscous model of retardation of diffusion Biophys J 76(1 Pt 1) 314-22
Kusumi A Y Sako et al (1993) Confined lateral diffusion of membrane receptors as studied by single particle tracking (nanovid microscopy) Effects of calcium-induced differentiation in cultured epithelial cells Biophys J 65(5) 2021-40
Lehenkari P P and M A Horton (1999) Single integrin molecule adhesion forces in intact cells measured by atomic force microscopy Biochem Biophys Res Commun 259(3) 645-50
McCloskey M and M M Poo (1984) Protein diffusion in cell membranes some biological implications Int Rev Cytol 87 19-81
Meleard P Gerbeaud C Bardusco N Mitov MD and Ferdandex-Puente L (1998) Mechanical properties of model membranes studied from shape transformations of giant vesicles Biochimie 80 401-413
Moy V T Y Jiao et al (1999) Adhesion energy of receptor-mediated interaction measured by elastic deformation Biophys J 76(3) 1632-8
Ra H J C Picart et al (1999) Muscle cell peeling from micropatterned collagen direct probing of focal and molecular properties of matrix adhesion J Cell Sci 112 ( Pt 10) 1425-36
Saffman P G (1976) Bownian motion in thin sheets of viscous fluid Journal of Fluid Mechanics 73 593-602
Schmidtke D W and S L Diamond (2000) Direct observation of membrane tethers formed during neutrophil attachment to platelets or P-selectin under physiological flow J Cell Biol 149(3) 719-30
Sheets E D R Simson et al (1995) New insights into membrane dynamics from the analysis of cell surface interactions by physical methods Curr Opin Cell Biol 7(5) 707-14
58
CHAPTER 21 CELL MEMBRANE MECHANICS AND ADHESION copyRD Kamm 4615
Vink H and B R Duling (1996) Identification of distinct luminal domains for macromolecules erythrocytes and leukocytes within mammalian capillaries Circ Res 79(3) 581-9
Waugh R and E A Evans (1979) Thermoelasticity of red blood cell membrane Biophys J 26(1) 115-31
Zeman K H Engelhard et al (1990) Bending undulations and elasticity of the erythrocyte membrane effects of cell shape and membrane organization Eur Biophys J 18(4) 203shy19
Zhelev D V D Needham et al (1994) Role of the membrane cortex in neutrophil deformation in small pipets Biophys J 67(2) 696-705
59
MIT OpenCourseWarehttpocwmitedu
20310J 3053J 6024J 2797J Molecular Cellular and Tissue BiomechanicsSpring 2015
For information about citing these materials or our Terms of Use visit httpocwmiteduterms
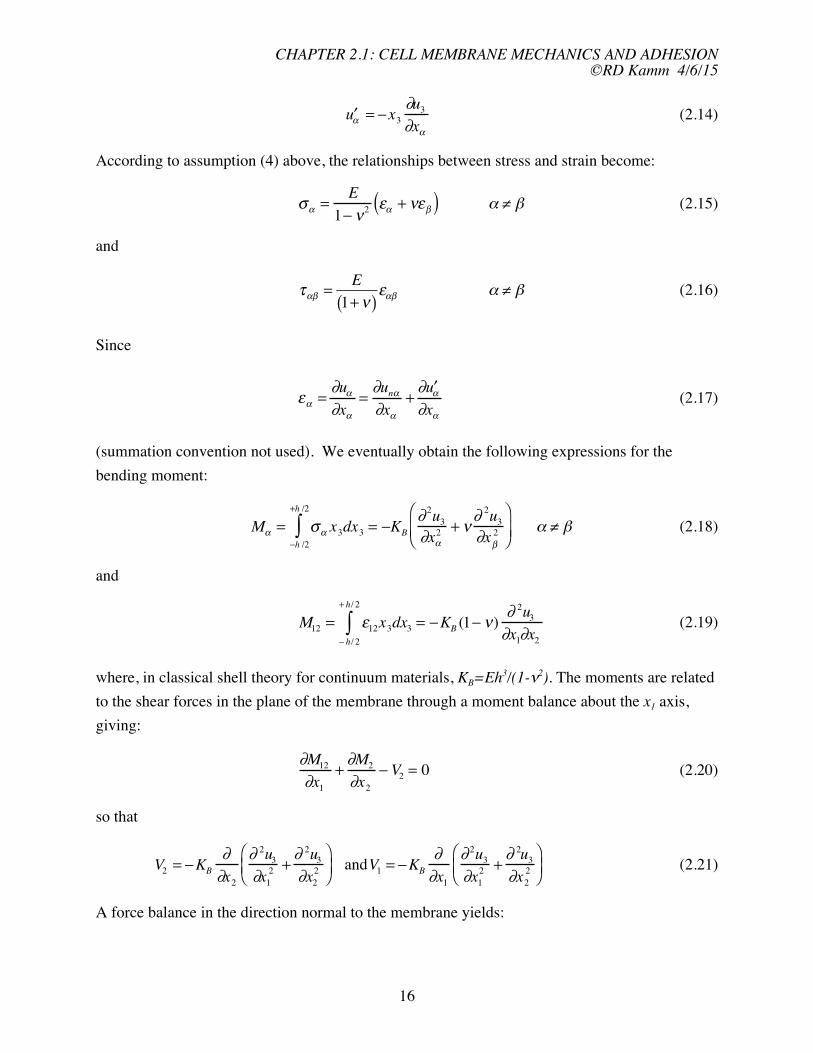
CHAPTER 21 CELL MEMBRANE MECHANICS AND ADHESION copyRD Kamm 4615
( 2 2 dx ) + ( du3 ) minus dx = [1 du3 dx1)2]
12 2 2 + ( dx 1 1
1 minus dx1 asymp (1+ 2 (du3 dx1) )dx1 minus dx1 = 2 (du3 dx ) dx(236) 1 1
[see also Figs 64 and 65 in Boal] The strain is then the change in length over the initial length or
2ε11 = 1
2 (du3 dx1) (237) and the energy per unit area associated with this change in length under a constant tension N is
2 ε N ⎛ partu ⎞
U0h = N1int dε =0
⎜ 3
⎟ (238)2 ⎝ partx1 ⎠
which extending to two dimensions can be written
⎡⎛ ⎞ 2 ⎛ 2⎤ N partu3 partu ⎞U ⎢⎜ ⎟ + ⎜ 3
0h = ⎟ ⎥ (239)2 ⎢⎝ partx1 ⎠ ⎝ partx⎣ 2 ⎠ ⎦ ⎥
It is important to recognize that we now have two expressions associated with the energy of
extension and they represent two distinct phenomena The first [eqn (333)] describes the
energy associated with true areal expansion that is a change in the effective spacing between the
molecules comprising the lipid bilayer The second [eqn (339)] corresponds to the energy
change due to undulations in a membrane with constant intermolecular spacing To see the
distinction between the two consider an experiment in which the pressure inside a cell or a lipid
vesicle is gradually increased by aspiration into a micropipette Initially the projected area of
the membrane rises rapidly with a relatively small increase in membrane tension corresponding
to the smoothing of undulations caused by thermal excitation of the membrane This is followed
at higher tensions by a transition to a regime in which the membrane exhibits a much greater
stiffness corresponding to the situation in which the thermally-induced undulations have been
smoothed out and the true membrane surface area now must increase In the absence of thermal
fluctuations eg at zero temperature only this second regime would be observed [see also
figure from Boal]
Energy of shear deformation Next examine the energy per unit area associated with shear
deformation in the plane of the membrane which can be expressed in the form
2
1 1 2 Gh ⎛ part u1 partu2 ⎞
U0h = 2 hτ12ε12 = 2 hGε12 = ⎜ + ⎟ (240)2 ⎝ partx2 partx1 ⎠
21
CHAPTER 21 CELL MEMBRANE MECHANICS AND ADHESION copyRD Kamm 4615
where we have utilized eqns (28) and (29) to obtain a form similar to that of eqn (234) for
extensional deformation
[See Boal for an alternative form in terms of membrane curvature He also gives a nice
description of bending in bilayer membranes]
Bending energy The contribution due to bending energy is somewhat more difficult to derive
First recognize that only those normal stresses that vary with x3 contribute to the bending
energy that is those contributed by the σ stresses in eqn (213) With this in mind we can
write the expression for the total elastic energy due to bending as
1 1 U = intintint ⎧ [ 2
⎨ ( ) 2 ⎫ σ 1 prime + ( )2
σ 2 prime + 2νσ 1 primeσ prime 2 ] + ( )τ 12 prime ⎬dx (241)⎩2E 2G ⎭ 1dx2dx3
Substituting for the stresses and strains from eqns (215)-(217) this can be re-cast in the
following form
⎧ 2 ⎫K ⎛ 2
part 2 2u ⎡ 2 u part ⎞ part 2u 2 part 2 ⎤ part u ⎛ u ⎞
U = B intint ⎜ 3 3 ⎟ 1 minus ν ) 3 3 2 minus ⎜ 3 ⎟⎨ 2 + 2 minus 2( 2 ⎬dx1dx (242)⎢ ⎥2 ⎝ partx1 partx2 ⎠ partx1 partx2 ⎝ partx1partx2 ⎠ 2
⎩ ⎣ ⎦ ⎭
It can be shown ((Meleard 1998)) that the integral of the second term in the integrand above [the
one multiplied by 2(1-ν)] is globally constant under deformation if the membrane remains a
closed surface with no holes Assuming that to be the case we obtain for the total bending strain
energy
KB ⎛
2 part 2u part 2
= intint ⎜ 3 u2 + 3 ⎞
U ⎟2 dx1dx2 + const (243)
2 ⎝ partx1 partx2 ⎠
Since we typically are concerned with changes in energy the constant will arbitrarily be set to
zero Thus the energy per unit area or energy density of bending deformations can be written
2 K ⎛ part 2 part 2 ⎞
0 = B u⎜
3 uU h 2 + 3
2 ⎟ (244)2 ⎝ partx1 partx2 ⎠
Note that the term in parentheses is proportional to the mean curvature of the surface Often the
surface has a natural mean curvature in the unstressed state If that curvature is c0 the bending
energy expression is modified slightly to the form
22
CHAPTER 21 CELL MEMBRANE MECHANICS AND ADHESION copyRD Kamm 4615
2 K ⎛ part 2 part 2 ⎞
U0 = B u⎜
3 uh 2 + 3
2 minus c0⎟ (245)2 ⎝ partx1 partx2 ⎠
Another common form of this expression is obtained by recognizing that the first two terms in
parentheses represent the linearized form of the sum of the principal curvatures (the largest and
smallest curvatures at a point) denoted c1 and c2 so that eqn (345) can be written
K
U2 B
0h = (c1 + c2 minus c0 ) 2
Although each of these expressions for strain energy density has been derived individually they
of course all contribute in the general situation and are linearly additive In that regard several
points are worthy of note First one can obtain some idea of the relative importance of
extension shear and bending deformations in a given situation simply by comparing their
relative energies just as was done in the last section by comparison of the bending and tension
terms in eqn (226) Not surprisingly the comparison leads to the same expressions we obtained
before for when either bending or tension is dominant Second due to the small shear modulus
of most cell membranes the energy stored in shear deformation can generally be neglected And
finally a comment is warranted concerning the energy due to tension Various simplifying
assumptions can be made depending on the cell type being considered and the nature of the
stress to which the cell (or vesicle) is being subjected but generally the lipid bilayer can be
considered to be of constant area unless it experiences grossly non-physiologic levels of stress
Thus the main contribution to extensional energy is that represented by eqn (339) associated
with the smoothing of membrane undulations
Other Factors Influencing Membrane Motion
Thermal fluctuations Biological membranes of all types can be seen to fluctuate due to
Brownian motion of the surrounding molecules if viewed with sufficient resolution These
fluctuations are in fact often used to measure the membrane bending stiffness since thermal
effects are seen as motions in the membrane of relatively long wavelength favoring bending
energies as compared to extensional or shear (see eqn (223)) To account for these effects it is
customary to add a time-dependent forcing term to eqn (223) η(t) the magnitude of which
scales with kBT We analyze thermal motions later and use them as a means of determining the
bending stiffness of a membrane
23
CHAPTER 21 CELL MEMBRANE MECHANICS AND ADHESION copyRD Kamm 4615
Damping due to external fluids When a membrane fluctuates in a direction perpendicular to its
plane velocities are induced in the surrounding fluids and due to the resulting shear stresses
energy is dissipated These motions are extremely complex to model precisely and depend on
both the nature of the surrounding medium (its rheological properties) and the bounding
geometry In lieu of a complete and rigorous analysis a local damping term is sometimes added
to the membrane force balance equation (eqn (223)) to approximate these effects Its form is
based on the presumption that externally induced velocities scale with the velocity of the wall
and that shear forces in the external fluid scale with the induced shear rates and velocities
Accordingly eqn (223) is modified by the addition of a term of the form μm partu3 partt where μμ is
the effective viscosity of the external fluid The equation that results from the addition of both
thermal forcing and external fluid viscosity is
partu ⎛ part 43 u 4
3 part u part+ 3 part 4u ⎞ part ⎛ ⎞ part ⎛ ⎞
B ⎜ 3 partu u
μm K 4 + 2 2 2 + 4 ⎟ minus ⎜ N3
⎟ minus part 1 ⎜ N
3
partt ⎝ x partx partx partx ⎠ partx ⎝ partx ⎠ partx ⎝ 2 ⎟ = p + η(t) (246)1 1 2 2 1 1 2 partx2 ⎠
An expression of similar form for a linear polymer is sometimes referred to as the Rouse
equation
314 Measurements of Membrane Elastic Parameters
Although the analogy has limitations it is useful at the onset to think of the cell as a fluid-filled
balloon or bag Just as in the case of a balloon the elastic properties of the membrane can be
determined by any experiment in which the membrane tension changes while its area is
measured In the simple example of a spherical balloon tension can be computed from the
inflating pressure and the measured radius the latter also yielding the surface area Ignoring for
now the thermal-induced fluctuations in a real cell membrane (ie assuming the cell to be at zero
temperature) the calculations become particularly simple Furthermore we will consider cells
for which the cytoplasm can be considered to fluid-like having no elasticity We return to
address both issues shortly
Osmotic swelling
Perhaps the simplest method to inflate the cell and measure the membrane elastic properties is to
cause the cell to swell by changing the osmolarity of the external fluid and simultaneously
monitoring the change in cell volume The change in transmembrane pressure mirrors the
24
CHAPTER 21 CELL MEMBRANE MECHANICS AND ADHESION copyRD Kamm 4615
change in osmotic pressure brought about by successive additions of a solute to which the
membrane is impermeable For ions and small molecules the osmotic pressure π can be
calculated from the vant Hoff equation
π = RT sum Ci (247)
i
where Ci are the molar concentrations of all solutes to which the membrane is impermeable For
larger molecules such as proteins their contribution to osmotic pressure is much larger than
indicted by this equation
Consider for example a spherical cell expanded osmotically so that the internal
hydrostatic pressure relative to external pressure is pc Microscopic examination yields a value
for the cell radius Rc Using these values in combination with Laplaces law [eqn (227)] gives
us the tension in this state and eqn (24) provides its relationship to the extensional modulus
p R Δ A
N = c c = Ke (248) 2 A0
The observed change in radius allows calculation of ΔA In practice identification of the reference state at zero pc is problematic due to the presence of thermal fluctuations but if Ke can be assumed constant for relatively small changes in area it is possible to extrapolate back to the zero-stress state from two measurements at elevated pc [Example red blood cell] Micropipet aspiration
One of the first methods used to measure the extensional modulus of the cell membrane involved
drawing a cell slightly deflated into a micropipet simultaneously monitoring the dimensions of
the cell and the pressure in the micropipet (Daily Elson et al 1984) Since on the time scale of
the experiment the volume of the cell could be assumed constant the shape change due to
aspiration of the cell causes increases in both internal pressure and surface tension both of which
are assumed spatially uniform Once the tension is large enough (or the temperature low
enough) to dampen the amplitude of any thermal fluctuations the cell can be treated assuming
that membrane extension is the dominant means by which the pressure drop across the
membrane is balanced [For further discussion on the thermal fluctuations and the relationship
between micropipet pressure and intracellular pressure see Daily and Evans and Rawicz Phys
Rev 1990 See also figure on p 199 of Boal Example the two regimes in membrane stiffness]
For the situation shown in Figxx the cell is drawn into the micropipet to the point at
which the portion of the cell external to the cell is spherical of radius Rc With the assumptions
25
CHAPTER 21 CELL MEMBRANE MECHANICS AND ADHESION copyRD Kamm 4615
stated above the (uniform) pressure within the cell can be related to it surface tension (assumed
uniform) and the radii of curvature of the main body of the cell Rc and the portion inside the
pipet a using Laplaces law [eqn (227)]
pc = 2N Rc = minus Δp + 2N a (249)
where pressures are referenced to the external ambient pressure Reorganizing to solve for
surface tension we obtain
ΔpN = (250)
⎛ 1 1 ⎞ 2⎜ minus ⎟
⎝ a Rc ⎠
The surface area corresponding to a given N is obtained from geometry summing the membrane
surface areas of the cylinder and hemisphere inside the micropipet and the truncated spherical
surface outside yielding for the areal strain the approximate expression
[(a R )2 (a R )3
Δ c minus c cong
]ΔLA
A 2a
Fig xx Micropipet aspiration of a neutrophil
This relationship between N and ΔAA can be used to calculate the area expansion modulus
Eh AK 0
e = = N 2 1( minus ν ) ΔA
where the expression involving Youngrsquos modulus assumes the membrane to be isotropic and
homogeneous The relationship could however be non-linear in that the value of Ke may vary
with the degree of area expansion a linear relationship between N and ΔA yields a constant value for Ke
It is important to note that neither of these approaches osmotic inflation or micropipet aspiration provides us with any information on the bending modulus To be precise bending
26
CHAPTER 21 CELL MEMBRANE MECHANICS AND ADHESION copyRD Kamm 4615
does play a role in the micropipet experiments but the effects are so small as to be negligible and are typically ignored That is not to say that bending is always negligible however as discussed next
Monitoring thermal fluctuations in the membrane
When a cell or lipid vesicle is observed floating free unattached to a substrate it can be seen to
exhibit time-dependent undulations as a result of collisions with the surrounding molecules
undergoing thermal motion In the case of a lipid vesicle with diameter in the range of 10
microns these undulations can be readily observed microscopically In smaller cells such as red
blood cells the motions can be inferred from the flickering phenomenon associated with the light
interference as the cell thickness changes (Zeman Engelhard et al 1990) Since the amplitude of
the membrane undulations depends on the stiffness of the membrane to bending and its surface
tension it is reasonable to expect that measures of this amplitude can be used to infer the
membrane elastic parameters In order to illustrate the method while avoiding some of the
algebraic complexity consider undulations in a flat membrane with significant bending stiffness
and a constant surface tension The relationship between the motion and the elastic properties
can be found by considering the total energy of the membrane obtained by summing the
energies per unit area from eqns (239) and (244) and integrating over the membrane surface
area Am
⎧ 2⎪ K ⎛ 2 2
part 2 u part 2 ⎡ 3 u ⎞
3 N ⎛ partu ⎞ ⎛ int 3 partu ⎞ ⎤⎫
B 3 ⎪
U0hdA = int ⎨ ⎜ 2 + 2 ⎟ + ⎢⎜ ⎟ + ⎜ ⎟ ⎥⎬dA (251) A ⎠ 2
m Am ⎪ 2 ⎝ partx1 partx2 ⎢⎝ partx1 ⎠ ⎝ partx2 ⎠ ⎥⎪ ⎩ ⎣ ⎦⎭
In writing the energy in this form we have omitted the contribution due to shear deformation
consistent with the fluid-like character of a pure lipid bilayer and have taken the surface tension
to be uniform during the deformation In this example membrane surface area changes only as a
result of fluctuations from the mean [u3(xxx2) = 0] configuration that is we now ignore the
contribution due to changes in intermolecular spacing and only consider changes in the area
projected onto the x1-x2 plane
It is convenient to use the method of Fourier transforms to represent the undulations of a
membrane normal to the x1-x2 plane which in two-dimensions leads to [see also class notes on
bending of cytoskeletal filaments alternatively use Fourier series representation]
A A
u3 (x) = u3 (x1 x2 ) = 2 intexp(iq sdot x)b(q)dq =
2 int exp(iq 4 1x1)exp(iq2 x2 )b(q1q2 )dq1dq
π 4π 2
(252)
27
CHAPTER 21 CELL MEMBRANE MECHANICS AND ADHESION copyRD Kamm 4615
where qα = 2π λα is the wavenumber of the particular mode and b(q) is the continuous analogue of the discrete coefficients that multiply each mode in a Fourier series representation
Here the algebra gets complicated so only the results of the analysis will be presented however
those wishing to see a more complete derivation should see (Boal Mechanics of the Cell
Cambridge University Press 2002) Introducing eqn (352) into (351) yields
1 ⎛ A ⎞2
int U q 40hdA = ⎜ ⎟ int (
KB + Nq2 )b(q)b(q)dq (253)2 2 ⎝ π ⎠
where b(q) is the complex conjugate of b(q) Now we invoke a previous result that at equilibrium energy is equally distributed among the various modes and that each mode has an
average energy of kBT2 Taking the ensemble average of eqn (353) and equating the energy of
each mode represented in the result to kBT2 (by the equipartition theorem) leads to
k Aq)b q) = BT
b( (K q4 2 (254)
B + Nq
This is a useful result in itself demonstrating that all modes tend to be suppressed as temperature
falls or as bending stiffness or surface tension rise In addition it shows the tendency for higher
modes to be of smaller amplitude But this equation has further value in that it can be used to
obtain a direct expression for the change in apparent area of a membrane as tension increases
Consider the true surface area of a membrane A represented as the sum of its projected
area and the additional area associated with thermally-induced undulations
⎡ 1 ⎛ 2⎤u ⎞ 2 part ⎛ partu ⎞
A = int dx + ⎢ 3 3 2
int ⎜ ⎢⎝ partx 2 ⎟ + ⎜
⎠ ⎝ partx 2 ⎟ ⎥dx (255)⎠ ⎥
⎣ 1 2 ⎦
Isolating the term representing the area reduction due to thermal fluctuations expressing u3 in
terms of its Fourier transform and taking the ensemble average of the result leads to
1 ⎛ A ⎞2
A minus int dx = ⎜ ⎟ int q 2 b(q)b(q) dq (256)2 ⎝ 2π ⎠
Combing eqn (254) from above with this expression yields
28
CHAPTER 21 CELL MEMBRANE MECHANICS AND ADHESION copyRD Kamm 4615
A minus int dx
kBT dq kBT dq2
= A 8π 2 int =
N int (257)
+ KBq 2 8π 2 N + KBq 2
where in writing the last term we have introduced the relations dq = dq2dθ 2 and int dθ = 2π By a simple substitution z = q2 + (N KB )the integral can be evaluated We do so however
between specified limits on the assumptions that the range of possible wavenumbers is restricted
by the size of the membrane on one hand (q = (πA12)) and the distance between individual lipid molecules on the other (q = πlm) Integrating between these limits results in
⎛ π 2 N ⎞
int dx 2 +A ⎜ ⎟ minus k T l K
= B ln⎜ m B ⎟ (258)A 8πKB ⎜ π 2 N ⎟
⎜ + ⎟ ⎝ A KB ⎠
If we use the area reduction at zero tension as a reference and increase the area from that
condition by progressively increasing membrane tension as in a typical experiment we finally
obtain an expression relating the change in area to the change in tension
⎛ NA ⎞ 1 + A dx A dx ΔA minus int minus ⎟ k ⎛ NA
int k ⎜equiv minus = BT π 2 K
ln ⎜ B T ⎞ 2 ⎟ cong B ln 1 + (259)
Nl ⎜ ⎟A A A 8π KB ⎜ 1 + m ⎟ 8π KB ⎝ π 2 KB ⎠ N = 0 N ⎜ 2 ⎟⎝ π K ⎠ B
where we have used the assumption supported by typical values found from different
experiments that (Nl2 m ) (π 2KB ) ltlt 1
You should recall that this solution was obtained on the assumption that the actual area
of the membrane remained constant and that the reduction in projected or apparent area resulted
from the undulations being progressively smoothed out Once the undulations are eliminated
the only means by which the projected area of the membrane can further increase is by an
increase in the inter-molecular spacing ndash an increase in the actual membrane area When this
occurs we expect to see a transition to the behavior discussed at the beginning of this chapter a
result expressed as
29
CHAPTER 21 CELL MEMBRANE MECHANICS AND ADHESION copyRD Kamm 4615
Fig yy Plots of tension vs normalized surface area for lipid vesicles of different composition Evans amp Rawicz 1990
ΔA N = (260)
A Ke
Thus we have two limiting predictions one for low tensions eqn (259) and another for high
tensions eqn (260) and the transition from one behavior to the other should occur when the
two expressions for ΔAA are of the same magnitude This is supported by experiment (Fig yy) and the results in the two regimes provide a means for estimating the two moduli Ke and KB
30
CHAPTER 21 CELL MEMBRANE MECHANICS AND ADHESION copyRD Kamm 4615
Before leaving this analysis there is one further result that is useful to state although the
derivation is again somewhat involved Once we have the solution for the undulations at a
given level of tension and for given membrane properties the ensemble average displacement
normal to the plane of the membrane can also be computed with the result
⎞
u2 k ⎛= BT NA
3 ln ⎜ 1+ ⎟ (261)4πN ⎝ π 2KB ⎠
Again this supports our intuition that the undulations will be suppressed at low temperature or
high tension And in the limit as N rarr 0 a binomial expansion of the natural log term shows that
the effect of tension drops out and the magnitude of the undulations varies inversely with the
bending stiffness
315 Membrane Fluid Mechanics
Early studies of protein diffusion notably the work of Saffman (Saffman 1976)
examined protein diffusion using an approach akin to that of Einstein in three dimensional space
thereby reducing the problem to one of solving for the mobility b in the equation for diffusivity
D = kBTb (262)
Calculation of the mobility is influenced by the viscous drag on the portion of the protein within
the membrane but also on to the intra- and extracellular domains as well The solution of
interest here is the one applicable in the limit of small μeμm where μe and μm are the external and
membrane viscosities respectively leading to
kBT ⎛ hμm⎞
D = ⎜minusγ + ln ⎟ (263)4πμmh ⎝ aμ e ⎠
where h is the membrane thickness a the radius of the protein (assumed cylindrical) and γ is
Eulers constant (=05772) Membrane viscosity has been estimated from lipid diffusion to be
~2 poise (McCloskey and Poo 1984) When finite mobility is achieved as a result of a finite
domain as for example a circle of radius R the corresponding result is
31
CHAPTER 21 CELL MEMBRANE MECHANICS AND ADHESION copyRD Kamm 4615
k ⎛ 1 D = BT R ⎞ log minus (264)
4πμh ⎝ a 2 ⎠
While this represents a useful point of departure measurements of lateral diffusion in a
membrane have demonstrated a more complex behavior Fluorescence recovery after
photobleaching (FRAP) has enabled the direct tracking of membrane proteins labeled with
fluorescent antibodies More recently single particle tracking methods have been developed
using colloidal gold or a fluorescent particle in conjunction with digital microscopy as well as
controlled movements using microbeads manipulated by an optical trap
From experiments such as these a new picture has emerged While the lateral diffusion
of lipids and a small fraction of trans-membrane proteins satisfy the general form of Saffmans
predictions the predicted diffusivity is greater than that observed experimentally and agrees with
experiments only when a membrane viscosity of 100 poise is used This might be due to the
presence of other proteins in the membrane (Kucik Elson et al 1999) Experiments also show
that many proteins appear to diffuse freely only in small domains typically measuring from 200shy
600 nm remaining confined to these domains for periods on the order of tens of seconds To
explain this behavior the membrane skeleton fence model was proposed (Kusumi Sako et al
1993) in which a membrane-associated matrix constrains the movement of proteins outside of
the domains defined by the matrix filaments Diffusion beyond these barrier filaments can occur
either as a result of random thermal motions of the transmembrane protein matrix filaments or
both or by transient breaks in the filaments Confinement of proteins may play an important role
in rapid and selective signaling Rapid directed motion of membrane-associated proteins has
also been observed and is likely due to active transport by an intracellular actin- or microtubule-
based motor
316 Cell Adhesion
This section deals with how cells adhere to their surroundings and through these sites of
adhesion how they interact with the external world We begin by summarizing the different
types of adhesion their functions and the molecules involved Next we provide a brief
description of the adhesion complexes found in cells and the role of each type Then the
theories that provide a quantitative description of adhesion between single receptor-ligand pairs
are reviewed in the context of the material presented in Chapter xx including the role of thermal
fluctuations Through these theoretical models both the static and dynamic states of adhesion
can be explored for single molecule pairs then for adherent cells Next we develop the different
32
CHAPTER 21 CELL MEMBRANE MECHANICS AND ADHESION copyRD Kamm 4615
approaches that are used to study the adhesion of cells based either on thermodynamics or
mechanics Methods for the measurement of adhesion strength are described providing
estimates for the force that a cell can exert on its surroundings Various examples will be
presented but the adherence of leukocytes to the endothelium and the role of adhesion in cell
migration will receive special attention
Functions of adhesion
Adhesion has been found to be an essential process necessary for a variety of fundamental
cellular functions
bull Structural integrity Adhesion helps to maintain the overall structural integrity of the
tissue in muscle for example it provides the means of force transmission from the cells
to the surrounding matrix to allow contraction In non-contractile cells it still provides
the needed mechanical coupling to the surrounding tissue necessary for a variety of
cellular functions
bull External sensing Adhesion provides a means by which the cell can sense and
subsequently respond to its surroundings Forces transmitted directly to the cell
membrane or to the cytoskeleton via transmembrane proteins may trigger a variety of
biochemical reactions within the cell as we shall see later in Chapter 33
bull Migration Cell-matrix adhesion is an essential element in cell migration a cell propels
its way through tissue or along a surface through a process involving adhesion
contraction and release also described in Chapter 33
bull Regulation of transport Sites of cell-cell adhesion are often important in the regulation
of transport across a cell layer such as in the case of an epithelium or endothelium
bull Communication Sites of mechanical coupling often provide a means of cell-cell
communication as in the case of gap junctions which offer a pathway for the diffusion
of ions and small molecules between adjacent cells
Adhesion molecules
Cells adhere to their surroundings or to an artificial substrate via a wide variety of different
proteins that can be classified into five major families integrins selectins cadherins
immunoglobulins and transmembrane proteoglycans (Table 1) In terms of their mechanism of
attachment to other cells or the external matrix these can be classified as either homophillic ndash
binding to like molecules heterophillic ndash binding to unlike molecules or those that bind to other
cells through an extracellular linker molecule
Integrins one of the largest class of adhesion molecules are primarily used to attach cells
to the extracellular matrix or the basal lamina but are also present in some cell-cell adhesion
33
CHAPTER 21 CELL MEMBRANE MECHANICS AND ADHESION copyRD Kamm 4615
complexes They typically bind to the matrix via the RGD amino acid sequence (arginine
glycine aspartic acid) but can also contain other binding motifs Integrins are heterodimers in
that they always contain an α and a β subunit with the different isoforms determining the specific ligand to which the integrin binds Two specific types of adhesion focal adhesions and hemidesmosomes often contain integrins and the attachments they make can at times be stable but at other times transient so as for example to mediate cell migration The force of adhesion of a single integrin-ligand bond has been measured using atomic force microscopy and found to be in the range of 30-100 pN (Lehenkari and Horton 1999) with a relatively low binding affinity in the range of K ~ 10-6
D to 10-8 molliter By comparison typical cell-surface receptors bind with an affinity in the range of 10-9 to 10-11 molliter Integrins also play an important role in signaling since extracellular integrin binding is known to influence cytoskeletal morphology as well as the state of cell differentiation Adhesion molecules in the selectin family also tend to form transient bonds and are important in leukocyte adhesion and extravasation the migration of the leukocyte through the endothelium and into the tissue Consequently they tend to be found in cells of the circulation and are present both in leukocytes and endothelial cells and are instrumental in adhesion between these two cell-types during leukocyte rolling
Family Location andor Ligands Comments
function recognized
integrins focal adhesions (E) fibronectin relatively low
hemi-desmosomes collagen laminin affinities
leukocyte immunoglobulins (KD~ 10-6-10-8
(spreading) (I) actin filaments molliter)
adhesion primarily
cell-matrix adhesion
but also in some
cell-cell adhesions
selectins circulating cells and carbohydrates require Ca2+
endothelial cells
rolling adhesion
Ig superfamily important in integrins
(immunoglobulin) immune response homophillic
cadherens adherens junctions (E) homophillic require Ca2+
desmosomes (I) actin
34
CHAPTER 21 CELL MEMBRANE MECHANICS AND ADHESION copyRD Kamm 4615
filaments
intermediate
filaments
transmembrane fibroblasts (E) collagen bind various
proteoglycans epithelial cells fibronectin growth factors
(I) actin such as FGF
filaments
heterophillic
Table 1 Cell adhesion molecules and their characteristics
While both integrin and selectin binding is mediated by Ca2+ adhesion via the
immunoglobulin (Ig) superfamily of proteins is Ca2+ independent Some of the most prominent members of this family are the N-CAMs (Neural cell adhesion molecules) and ICAMs (Intracellular cell adhesion molecules) These tend to undergo homophillic bonding but some also bind to members of the integrin family
Cadherens are often expressed in the same cells as the selectins but form much stronger bonds and therefore play an important role in maintaining cell integrity Because of these attributes cadherens are the primary adhesion proteins in desmosomes and adherens junctions the major structural contacts cells form with other cells or the basil lamina These also form homophillic bonds by a Ca2+ dependent mechanism and mediate selective bonding between adjacent cells Cadherens are relatively short as compared to other adhesion molecules being
about 700-750 amino acid residues in length
Types of adhesion complexes
Cells have developed a variety of specialized adhesion complexes each utilizing one or more of
the adhesion molecules of Table 1 and each serving a specific purpose Typically the cell-cell or
cell-surface spacing is in the range of 10-20 nm but this is highly variable ranging from less than
1 nm when controlling transport to over 100 nm in regions where tight control is unnecessary
Below we describe the different types of junctions and where important for function their
mechanical characteristics
Gap junctions Cells need to communicate with their neighbors for a variety of reasons For
example cardiac myocytes transmit signals from cell to cell in order to maintain a synchronous
35
CHAPTER 21 CELL MEMBRANE MECHANICS AND ADHESION copyRD Kamm 4615
wave of contraction This is typically accomplished by providing a pathway for ions and small
signaling molecules between cells called gap junctions (Fig 3110) These minute channels are
typically comprised of a collection of six connexin proteins that cluster together in cylindrical
fashion forming a minute channel that passes molecules and ions less than about 1200 to 2000
MW (15-2 nm) Transport through these channels is regulated and their permeability drops in
the presence of high Ca2+ concentration as when a cell membrane is ruptured or with low pH
Cyclic AMP acting as a second messenger can be exchanged between cells therefore gap
junctions provide a metabolic linkage between neighboring cells and provide a means by which
hormonal stimulation of just one cell can be transmitted to others
Adherens junctions Adherens junctions are belt-like structures that can be though of as the
structural weld that holds two cells together (Fig 3110) Because of their structural role
these junctions formed by homophilic bonding between proteins in the cadheren family are
anchored securely again via the adaptor proteins α β γ-catenin to the cytoskeleton
Desmosomes and Hemidesmosomes If the adherens junctions are the continuous welds between
cells desmosomes are the spot welds Again these serve primarily a structural purpose
joining two neighboring cells via a complex consisting of a dense plaque on the intracellular
sides of both cells extending 15-20 nm into the cell and consisting of a variety of proteins that
attach to keratin filaments part of the intermediate filament network Hemidesmosomes have
similar intracellular structure but attach instead to the basal laminae Based on their different
extracellular attachment sites desmosomes typically link to other cells via cadherens whereas
hemidesmosomes adhere via a type of integrin Both are commonly found in epithelial cells
36
CHAPTER 21 CELL MEMBRANE MECHANICS AND ADHESION copyRD Kamm 4615
Fig 3110 Schematic showing the different types of cell junctions present in an epithelial cell as found in the small intestine Tight junctions near the apical surface essentially prevent the passage of all molecules The spot desmosomes and adherens junctions provide for cell-cell anchoring and the hemidesmosomes for anchoring to the basal lamina Gap junctions provide a means for communication between neighboring cells [Reproduced from Lodish et al Molecular Cell Biology 2000]
Junction type Function Extracellular or Intracellular
adjacent cell attachment
attachment
Adherens structural cell-cell or cell- ECM proteins or actin filaments
matrix cadherins in
adjacent cell
Desmosome structural cell-cell cadherin intermediate
filaments
Hemidesmosome structural cell-matrix basal lamina via intermediate
integrins filaments
Focal adhesions structural cell-matrix ECM proteins actin filaments
via integrins
Tight junction regulate transport between homophillic binding between the
cells and along cell transmembrane proteins occludin or
37
CHAPTER 21 CELL MEMBRANE MECHANICS AND ADHESION copyRD Kamm 4615
membrane claudins
Gap junctions cell-cell communication channels formed by connexin
via ion and small molecule subunits
exchange
Table 2 Adhesion complexes
Focal adhesions A second means by which cells attach to the extracellular matrix is through
focal adhesions These serve a similar function to the hemidesmosomes and share a common
linkage via integrins to the ECM but are attached on the intracellular side instead to the actin
filaments of the cytoskeleton Actin filaments converge at the site of focal adhesions forming
stress fibers strong actin bundles that attach to the β-subunit of the integrins via adapter
proteins such as actinin vinculin and talin Focal adhesions are instrumental in cell migration
and for this purpose need to be easily formed and disrupted as the cell moves forward Release
or de-adhesion of cells is often mediated by a class of peptides called dis-integrins that
competitively bind to the RGD site used by integrins to attach to a variety of matrix molecules
Tight junctions Control of transport is generally mediated by tight junctions that form an
intricate network of seams between two cells (Fig 3111) As their name implies these are the
tightest of the cell-cell junctions and the gaps they leave are often small enough to exclude even
the smallest ions and molecules Formed by homophillic binding between the transmembrane
proteins occluding and claudins tight junctions allow epithelial cells to perform their critical role
in transepithelial transport and provide for maintenance of differences in concentration between
the apical and basal surfaces of these cells Since occludins are not capable of forming rigid
structural bonds with the cytoskeleton they are most often associated in a junctional complex
with adherens junctions or desmosomes that fulfill the structural needs of attachment
38
CHAPTER 21 CELL MEMBRANE MECHANICS AND ADHESION copyRD Kamm 4615
Fig 3111 Tight junctions in an epithelial cell shown schematically (a) in a freeze fracture replica (b) and in a transmission electron micrograph (c) [Reproduced from Alberts et al 1994]
Fig 3112 Two types of bond that attach a cell to the extracellular matrix by means of clusters of integrins On the extracellular side integrins bind to the matrix proteins fibronectin and laminin Inside the cell they attach to the cytoskeleton via adaptor proteins to either actin filaments (focal adhesions) or intermediate filaments (hemidesmosomes) [Reproduced from Lodish et al Molecular Cell Biolology 2000]
Non-specific binding
Cells can adhere to their surroundings by either non-specific or receptor-ligand (specific)
bonding Though both mechanisms are likely active in most situations as we will see receptorshy
39
CHAPTER 21 CELL MEMBRANE MECHANICS AND ADHESION copyRD Kamm 4615
ligand bonding is the stronger of the two by a considerable margin and is therefore the most
relevant biologically In situations for which either the receptors or their ligands are not present
however such as might be the case in certain in vitro experiments non-specific binding can be
important as well
There are essentially three major forms of non-specific attractions to consider
bull Van der Waals ndash These attractive forces arise due to charge interactions in polar
molecules They tend to dominate among the non-specific mechanisms at
intermediate distances around 20-25 nm [see Boal]
bull Electrostatic ndash These interactions can be either attractive or repulsive depending
on the sign of the surface charges and are particularly important during the
approach of two cells since the glycocalyx has a high negative charge density
bull Steric ndash These forces arise due to the steric exclusion of two molecules as they are
brought into close contact In the case of cell-cell interactions steric repulsion is
due to the compression of the two glycocalyx layers and the tendency to resist
compression resulting from osmotic effects and the elasticity of the layer Steric
forces tend to dominate for small separation distances lt 10 nm
In combination these effects combine to produce a net attractive force per unit area of
about 100 Pa at a separation distance of about 25 nm
Adhesion by means of receptor-ligand binding
We can use the analysis of Chapter xx to estimate the strength of a receptor-ligand bond and
based on typical values for bond density calculate the corresponding strength of adhesion
between two cells or between a cell and a surface Recall that the application of force to a
receptor-ligand bond modifies the dissociation rate constant for the binding reaction This effect
can be modeled in several ways but the result obtained by Bell ((Bell 1978)) suggests the
following exponential form for the dissociation rate
0 ⎛ γf ⎞ 0 ⎛ γσ ⎞ kminus = kminus exp⎜ ⎟ = kminus exp⎜ ⎟ (265)
⎝ kBT ⎠ ⎝ NC kBT ⎠
where k0minus is the unforced dissociation rate constant γ is a factor with the units of length that
corresponds roughly with the distance separating the bonded pair at equilibrium NC is the concentration of bonded complex and σ is the average bond force per unit area To determine
40
CHAPTER 21 CELL MEMBRANE MECHANICS AND ADHESION copyRD Kamm 4615
the rate of change of the concentration of bonded pairs one must solve the following rate equation describing the competition between bond formation (first term) and destruction (second term)
dNC ⎛ γσ ⎞
cong k+ (NR minus NC )(NL ) minus kminus NC = k+ (N minus )( 0R NC NL ) minus kminus NC exp⎜ ⎟ (266)
dt ⎝ NC kBT ⎠
where NR and NL are the concentrations of receptors and ligands respectively and we have
assumed that NCltltNL and that all bonds are stressed equally At equilibrium dNCdt=0 and if
the force applied to detach the cell (equal to the average bond stress σ) is increased
incrementally from zero NC will progressively fall to a new equilibrium value At sufficiently
high levels of force however increasing σ further eventually gives rise to a situation in which equilibrium can no longer be achieved through a reduction in NC At that point NC tends toward zero and the cell separates from the surface to which it was attached It can be shown that this
occurs when (Bell 1978)
k 0
α c exp(α + c + 1) = N
k 0 L (267)minus
σ
where α minγ c equiv and σmin is the minimum stress needed to cause detachment For a wide
NRkBT
range of conditions eqn (267) has the approximate solution
⎛ k0 + ⎞
α c cong 07 ln L (268)⎜ 0 N ⎟⎝ kminus ⎠
so that the critical stress for detachment can be expressed as
N 0
σ cong 07 C kBT ⎛ k ⎞ ln⎜
+ min N ⎟ (269)
γ ⎝ k0 L minus ⎠
where NC is determined from setting eqn (266) to zero under these critical conditions
Thermodynamic approach to cell adhesion
Although we focus here on the mechanical aspects of cell adhesion this process can also be
viewed from a thermodynamic perspective In this approach adhesion is considered in terms of
the change in energy specifically the Gibbs free energy G associated with all the individual
receptor-ligand interactions as well as the various non-specific forces of attraction or repulsion
The adhesion of a cell to a given surface then can be viewed as an equilibrium state determined
41
CHAPTER 21 CELL MEMBRANE MECHANICS AND ADHESION copyRD Kamm 4615
by minimization of the free energy If in undergoing a transition from a free state to an adherent
state the system represented by the cell and surface experiences a reduction in free energy ie
ΔGlt0 then adhesion will occur and the equilibrium state of adhesion will be determined by that with the minimum in free energy or the largest value of -ΔG While this approach ignores
many of the subtleties of the interactions and like the analysis above assumes that all receptorshy
ligand interactions are identical from an energetic point of view it is useful in providing some
simple insights as seen in the next two examples
Example Comparison of specific and non-specific adhesive forces Non-specific bonding due
to the combined effects of van der Waals electrostatic and steric forces result in an attractive
stress of approximately 100 Pa Receptor-ligand bonding give rise to forces that can be
estimated from the change in free energy f ~ to 4x10⁻⁴ dynbond = 9x10-11 to 4x10⁻⁹ ΔGr~9x10⁻⁶ Nbond where f is the force required to break the bond and r is a measure of the distance the bond stretches before it breaks Using a typical density of the receptor-ligand complex NC of ~1012-1015 bondsm2 gives a total bond stress of N 1
C x f ~ 9 x 10 to 4x10⁶ Pa The above kinetic approach to estimating bond strength [eqn (269)] gives a value approximately half of that from this equilibrium approach In either case however the conclusion remains the same non-specific binding can under certain circumstances be important since it is comparable to the lowest estimates of receptor-ligand-mediated bond strength but not surprisingly the latter is quite likely to dominate in nearly all practical situations
Example JKR theory for the equilibrium area of adhesion between a cell and substrate
It is well known that cells tend to take on a more flattened shape as the substrate to which they
are attached becomes more strongly adhesive either by coating with a more attractive ligand or
by increasing the concentration of ligand bound to the substrate Conversely less adhesive cells
round up and become more spherical These observations can be explained with the help of a
simple scaling analysis on the assumptions of small deformation of a linear elastic cell
Let the cell be modeled as a homogeneous elastic sphere with elastic modulus E and
initial radius R (Fig 3113) It is then brought into contact with a surface to which it adheres
As the cell adheres it attains a lower energy state characterized by an adhesion energy per unit
area J Formation of a flat adhesion surface however requires deformation within the elastic
cell and an associated increase in the stored elastic energy In Chapter 31 we showed that the
stored elastic energy per unit volume can be written
UE asymp int τεdV asymp int 1 2 Eε 2dV (270)
Vc Vc
42
CHAPTER 21 CELL MEMBRANE MECHANICS AND ADHESION copyRD Kamm 4615
Strain inside the cell can be approximated as the displacement of the cell surface δ divided by the characteristic distance within the cell to which the deformations penetrate a distance that scales with the lateral extent of the contact region 2a so that ε prop δ a where it can easily be shown from the geometry that a 2 asymp 2δR so that ε prop δ R Combining and dropping all numerical constants we obtain the following scaling approximation
δUE prop E ( )δR
3 2 (271)R
An expression for the total energy of the system then can be written
U prop minusJa2 + Eε2a3 prop JδR + Eδ 5 2R1 2 (272) The equilibrium state corresponds to the value of δ having the minimum energy obtain from
partU prop minusJR + Eδ 3 2R1 2 (273)
partδ so that
23 1 3 ⎛ JR12 ⎞ ⎛ JR2 ⎞
δ prop ⎜ ⎟ and a prop ⎜ ⎟ (274)⎝ E ⎠ ⎝ E ⎠
The exact solution to this problem yields the result
⎡ ) 1 3 2 1( minusν 2 ⎤ 9πJR
a = ⎢ ⎥ (275)⎢ 2E ⎥⎣ ⎦
43
CHAPTER 21 CELL MEMBRANE MECHANICS AND ADHESION copyRD Kamm 4615
Elastic modulus E adhesion energy per unit area J
2a
Fig 3113 Experiments to determine the contact area of an iminobiotin functionalized agarosebead on a glass coverslip in water Top Schematic of adherent bead Bottom Results for a range of bead radii Solid line is a fit to the date which obeys the power law a prop R23 consistent with the prediction of JKR theory eqn(276) [Reproduced from (Moy Jiao et al 1999)] This can be compared to the result obtained from a more rigorous analysis
⎡9πJR 2(1minus ν 2 ) 13 ⎤
a = ⎢ ⎥ (276)2E⎢ ⎣ ⎥⎦
and to experimental data obtained from spherical beads made from a 4 agarose gel (Fig 3113)
Models for receptor-mediated adhesion
In Chapter x and in the preceding text we discussed the energetics of bond formation and release
as well as the effect of applied force in altering the energy landscape of the bonded pair and
thereby the rate constants for bond kinetics That analysis has obvious implications to the
44
CHAPTER 21 CELL MEMBRANE MECHANICS AND ADHESION copyRD Kamm 4615
adhesion of cells to substrates the surrounding extracellular matrix and other cells Here we
extend that analysis in the specific case of whole cell adhesion In doing so it will be important
to consider such factors as the distribution type and density of receptor-ligand bonds or
potential bonds and the elastic properties of the structures to which they are anchored On the
intracellular side this involves the series of couplings that link the receptor to the cell In the
simplest case this might simply be a link to the lipid bilayer if the receptor has no intracellular
connections More typically especially for couplings with a structural role it involves a series
of proteins ultimately linking the receptor to the cytoskeleton
The typical setting in vivo is one in which cells adhere to other cells or to the extracellular
matrix Adhesions are more easily probed however through in vitro experiments (described
below) where cell adhesion more often occurs to an artificial substrate mediated through one of
several extracellular proteins that are used to coat the surface Generally either collagen or
fibronectin is used Cells are often adhered to these substrates but to produce a more controlled
environment rigid beads are sometimes coated with the appropriate receptors so that one specific
receptor-ligand interaction can be probed While these systems are useful as models of certain
adhesion phenomena it is important to recognize in the interpretation of these experiments that
when bound to a rigid substrate or bead the binding proteins cannot freely diffuse as they would
in a more natural environment In particular the formation of focal adhesions would not occur in
bead-substrate experiments because the receptors would be constrained from aggregating
It is instructive to begin this discussion with a consideration of a single adhesion bond
for example one linking the actin matrix of the cytoskeleton to a β1 integrin and the integrin
receptor binding to the extracellular matrix beyond the cell membrane (Fig 3114) If the bond
is stressed as for example if the cell experiences a force relative to the ECM it will at first
stretch an amount dictated by the level of force in the bond and the stiffness of the complex
Each bond as well as each protein in the bond complex can be thought of as having a certain
stiffness giving rise to a picture in which several springs are considered connected in series
Forces acting on the adhesion complex are transmitted via this series of bonded proteins between
the CSK and the ECM producing local deformations and stresses in the corresponding matrices
that decay with distance from the adhesion site On the intracellular side these forces are
transmitted via a complex involving vinculin α-actinin paxillin and talin Attachment to the
extracellular matrix is mediated by an RGD sequence (in fibronectin for example) which in turn
has binding sites for collagen and fibrin If the force is sufficiently strong above a certain
threshold value F0 say and applied for a sufficiently long time the bond might be severed (deshy
couple) Typical values of this threshold force lie in the range of 10-100 pN (Evans and Ritchie
1997) but depend as well on the rate at which the force is increased Under more rapid
forcings the threshold is high compared to when the force is increased slowly This simply
45
CHAPTER 21 CELL MEMBRANE MECHANICS AND ADHESION copyRD Kamm 4615
reflects the fact that detachment is a stochastic process and that at any given level of force there
exists a finite probability of detachment and this probability increases with time
Fig 3114 One type of attachment linking the intracellular actin matrix to the extracellular matrix via an integrin complex that involves in addition vinculin α-actinin paxillin and talin (Reproduced from Lodish et al Molecular Cell Biolology 2000)
We need also to consider that in equilibrium a fraction Φ = K(1+K)-1 (where K is the
equilibrium constant) of the receptors will be bound at any given time and that the receptorshy
ligand complexes are continually cycling between the bound and unbound states characterized
by their respective rate constants
On a larger scale numerous adhesion sites typically act in parallel each contributing
some amount to the total adhesion force If the force transmitted by each single adhesion
complex is F and the density of adhesion sites (per unit membrane area) is NC then the stress
acting on the cell is the product F NC This gives a somewhat false impression however as it is
unlikely that each adhesion complex carries an equal force Put another way there exists a local
stress τ that can be thought of as the product of the average force per bond times the bond
density This stress is typically non-uniform In the adhesion of a cell to a flat substrate the
bonds near the periphery of the contact zone determine the strength of the cell against
detachment and when the cell is subjected to a detaching force the stresses are concentrated in
46
CHAPTER 21 CELL MEMBRANE MECHANICS AND ADHESION copyRD Kamm 4615
this peripheral region as depicted in Fig 3115 In the vicinity of the edge of adhesion several
factors will influence the stress distribution including the mechanical properties of the membrane
(in particular the bending stiffness KB) the receptor density the spring constants of the bond
and the bond strength
N
Region of adhesion
x1
Fig 3115 Schematic model of a cell membrane being detached from a substrate by application of a tension force N The membrane is free to the left of the dash-dot line and adherent to the right Forces and moments are transmitted through the membrane which adheres to the membrane through receptor-ligand bonds represented by a continuous distrubution p(x1)
To illustrate consider the following simple model for an adherent cell being peeled away
from its substrate by a force that generates a tension N in the membrane (Fig 3115)
Deformations in the membrane are described by eqn (223) where it can be shown that the
bending term dominates provided KbL2 gtN where L is the characteristic length in the x1 direction
(due to the small length scales involved) and the external membrane force (p in the membrane
equation) is now the non-uniform stress due to adhesion bonds As a simple first approximation
we take p = k(δminusδ0) with δ-δ0 being the amount of stretch in the receptor-ligand bond springs
and k an effective bond spring constant Recognizing that p approaches zero far from the edge
(see Fig 319) the membrane displacement and the spring displacement are related u3 = δ-δ0
Thus eqn (228) is written
⎛ part 4 u
KB⎜ 3
⎞ 4 ⎟ = NC F = NC ku
⎝ partx ⎠ 3 (277)1
This can be solved directly showing that the distance of separation between the cell membrane
and substrate grows in an exponential fashion with distance Even more simply a scaling
47
CHAPTER 21 CELL MEMBRANE MECHANICS AND ADHESION copyRD Kamm 4615
analysis of eqn (277) in which the term on the left is approximated by Kbu3w4 where w is the
characteristic distance over which u3 varies tells us that the stresses are concentrated in a region
of width
K
w prop B4 (278)
NC k
near the cell periphery Similarly we can estimate that the cell membrane will detach from the
substrate if N gt FoNCw where F0 is a measure of the force in a single bond at the time of bond
rupture and that the rate of peeling can be roughly approximated as the product of the
disassociation rate k -- (bondss) from eqn (265) and the distance between bonds (N -12C )
Although this provides some insight into how the peeling rate depends on the various factors it fails to capture the fact that the cell remains in an equilibrium attached state even for non-zero levels of tension reflecting that even under force a balance can exist between the rates of formation and rupture of receptor-ligand complexes (Ra Picart et al 1999)
It is also of interest to note that in the region near the edge of the attachment zone(x1=0
in Fig 3115) the membrane acts as a beam subjected to a moment due to the applied tension
This moment is balanced by a force couple due to tension in the adhesion complexes right
adjacent to the edge in combination with a compressive stress between the cell and substrate a
little further in In typical situations this compressive stress can approach levels as high as one
atmosphere and can act to effectively smooth the membrane and recruit new attachment sights While using these continuum descriptions it is important to keep in mind the true
discrete nature of the individual bonds represented in the model as a continuous adhesive
surface This is brought to light by a simple calculation in which the characteristic length over
which the applied tension is supported w is compared to the inter-receptor spacing N -12C
Using typical values for the parameters NC = 103 complexesμm-2 k = 10-5 to 10-6 Nm Kb = 1 to 2x10-18 Nm we find that w cong 01 to 03 μm and the inter-complex spacing N minus1 2
C cong 003 μm While it is reassuring to see that w is typically less than the inter-complex spacing the difference is small It is therefore not surprising that the actual process of cell peeling is stochastic in nature occurring in a sequence of more-or-less discrete steps with a velocity of peeling that varies widely from the mean
The interplay between receptor-ligand bonding and membrane stiffness also determines whether a cell will spread over a surface or peel away from it under a given tension Membrane bending stiffness acts to maintain the membrane and substrate within close proximity near the edge of contact (Fig 3115) Spreading can occur only if their separation distance is within the extended length of the receptor ligand bond over a distance comparable to the linear spacing
48
CHAPTER 21 CELL MEMBRANE MECHANICS AND ADHESION copyRD Kamm 4615
between neighboring bonds ( N minus1 2 C ) Under high tension the surfaces rapidly diverge and
spreading is prevented if the tension is sufficiently low receptor-ligand bonding can occur and spreading can occur
Measurements of adhesion
A variety of methods have been used to experimentally determine the strength of adhesion either
of individual receptor-ligand bonds or populations of bonds as in the case of entire cells
Whole cell experiments are more common and typically require less experimental
sophistication The drawback of course is that they provide only for estimates of average
properties and require certain assumptions regarding the distribution of cell-substrate adhesive
stress for interpretation to the level of a single bond Several of these methods are described
next
Centrifugal cell adhesion assays In this experiment cells are allowed to attached to a substrate
then are placed in a centrifuge rotating at speed ω positioned a distance r from the center of
rotation and oriented so that the net centrifugal force is acting to separate the cell from the
substrate Using the arrangement shown in Fig 3116 (right) the acceleration of the cells is 2ω r and the net force acting on a cell of volume Vc is F = (ρc minus ρf )ω 2rVc where the fluid and cell densities are ρf and ρc respectively
Interpreting these results we can make several different assumptions each leading to a different estimate for the maximum force experienced by the binding complex If we simply assume that all receptor-ligand complexes support an equal fraction of the total force F then the force per bond is f = F (πa 2NC ) where NC is the concentration of bond complexes However as the cell tears away from the substrate the edge bonds will break first since these experience the greatest level of force An alternative approach then is to assume that the adhesion complexes around the cell circumference support the entire load leading to the estimate f = F 2( πaN 1 2 ) recognizing that N1 2
C C is the average distance between bonds A somewhatmore accurate value for f might be obtained if we assume that all complexes within the distance w given by eqn (278) support the load In any of these cases once the centrifugal force exceeds some critical limit since the number of receptors supporting the load falls as the region of contact becomes smaller the force per bond increases and the cell will rapidly detach
Stochastic variability also needs to be taken into account however since even under a constant load any single bond has a finite probability of failure under a given level of force The equilibrium state of the cell then should be viewed as one in which the rate of bond formation equals the rate of bond breakage with increasing force having the effect of reducing the
49
CHAPTER 21 CELL MEMBRANE MECHANICS AND ADHESION copyRD Kamm 4615
probability that the bond will remain intact These effects can be addressed using the methods described in more detail in Chapter xx Parallel flow assay Another common method for assessing cell adhesion is to plate the cells onto one wall of a parallel flow chamber subject them to a fluid dynamic shear stress and observe at what flow rate the cells begin to release If we ignore flow details in the immediate vicinity of the cell the shear stress can be estimated from the solution for a fully developed (Poiseuille) velocity profile
3V ⎡ y2
⎛ ⎞ ⎤v(y) = ⎢1minus ⎥ (279)
2 ⎝ ⎠ ⎣ ⎢ h ⎥⎦
so that the shear stress acting on the cell is
⎛ dv ⎞ 6μV τw = μ⎜ ⎟ = (280)
⎝ dy ⎠ h y = minush
and the total force can be estimated as F asymp τw Ac where Ac is the surface area of the cell membrane exposed to the flow Consider as an example a flow of culture medium at a rate of 1 mls through a channel of height 01 cm and width 1 cm If the culture medium has a viscosity close to that of water (μ=001 dyns) the shear stress is obtained from eqn (280)
6 sdot (001dyn sdot s) sdot (1ml s) ( 01 sdot10cm2 )τ dyn cm 2w = = 6 = 06Pa
01cm This corresponds roughly with the level of shear stress experience by endothelial cells in the arterial system If we consider that the cell has a surface area with dimensions roughly 100 μm x 10 μm or about 103 μm2 then the total force acting on the cell is obtained by integrating the shear stress over the area of the apical membrane Assuming that the shear stress is uniform the force is simply the product of shear stress and surface area or about 1 nN in the present example Again interpretation of results from such experiments requires careful consideration of the distribution of forces among the individual adhesion complexes In this situation the cell is likely to peel from the upstream edge in much the same manner as occurs in the cell peeling experiment discussed earlier
50
CHAPTER 21 CELL MEMBRANE MECHANICS AND ADHESION copyRD Kamm 4615
Radial flow and spinning disk assays One disadvantage of the parallel flow assay is that all cells are subjected to essentially the same level of shear stress so the flow rate needs to be incrementally varied in order to determine the level of force required for detachment These two systems using an axisymmetric geometry circumvent this problem by producing an easily characterized radial variation in shear stress In the case of the radial flow assay fluid enters through a central channel and flows radially outward through the narrow gap between two circular plates From conservation of mass the mean flow velocity is given by
QV = (281)
2πrh and sufficiently far from the center (rgtgth) the velocity profile is parabolic as in the parallel flow assay and the shear stress is again governed by eqn (280) using (281) for V Q
ω
(Not to scale)
v
h h
Cell layer rc Ce l l layer rc
r r
Fig 3116 Schematic diagram showing the radial flow assay (left) and the spinning disk assay (right) In the radial flow assay shear stress attains a maximum value near the center and falls with increasing radius r whereas in the spinning disk system maximum shear stress is experienced at large r In the spinning disk assay cells are grown on one disk and the opposite disk is rotated at constant speed Provided the rate of rotation is sufficiently small that inertial effects can be neglected the velocity is purely in the circumferential direction and the profile is linear between the two plates so that the shear stress experienced by the cells can easily be computed as
ωr τw = μ (282)
h
51
CHAPTER 21 CELL MEMBRANE MECHANICS AND ADHESION copyRD Kamm 4615
In both of these cases as in the parallel flow assay the total force is obtained by integrating the shear stress over the cell surface and the distribution of force among the adhesion complexes is weighted toward those located near the upstream end of the cell This can also be seen by consideration of the torque exerted by shear stress on the cell that must be balanced by a nonshyuniform contact stress with the substrate that is greatest near the upstream end Single bond adhesion assays Two other assays provide a means of obtaining estimates for the strength of a single adhesion bond without the need for excessive interpretation These rely on an ability to isolate a small number of bonds or even a single bond and infer bond strength from the step-wise nature of the de-adhesion process associated with breakage of discrete bonds One of these methods employs the atomic force microscope coated with the ligand of an adhesion receptor as shown in Fig 3117 The probe tip is gradually brought up to the cell surface until one or more receptor-ligand bonds are formed When the probe tip is withdrawn it moves along a different trajectory on a force-displacement plot reflecting the forces of adhesion These forces are seen to jump between more or less discrete levels as the probe continues to be moved away from the cell with each jump corresponding to the breakage of a single bond (Fig 3117) Using this method the bond strength between integrin receptor and a variety of RGD-containing ligands was found to lie in the range of 30 to 100 pN (Lehenkari and Horton 1999)
Fig 3117 The strength of a single adhesion bond can be measured by bringing a functionalized tip of an AFM probe up to the cell allowing bonds to form then slowly withdrawing the probe Monitoring the differences between the force displacement curve between the forward and reverse motions the forces necessary to break a single receptor-ligand bond can be determined [Reproduced from (Lehenkari and Horton 1999)]
52
CHAPTER 21 CELL MEMBRANE MECHANICS AND ADHESION copyRD Kamm 4615
A second method is similar in that the discrete increments in force are monitored as individual receptor-ligand bonds are broken but the forces are measured by means of changes in the shape of a giant vesicle the membrane of which contains the ligands have been inserted In this case one vesicle is made effectively rigid due for example to a high surface tension A second vesicle containing the adhesion molecules is also drawn partially into a micropipet but is much more complaint than the first The two vesicles are then brought into point contact so that one or a small number of adhesions are formed As the pipets are moved apart the compliant vesicle distorts due to the force of adhesion which it can be shown is related to the change in dimension of the vesicle in the direction of the force thereby serving as a sensitive force transducer measuring forces in the range of single adhesion receptors or between 1 and 100 pN [Evans 1991 37]
(For specific examples of leukocyte rolling and attachment see Orsello or Chang amp Hammer)
[This process is initiated for example by local infection that causes the release of
chemotactic agents in addition to cytokines hellip
Models of this process draw upon many of the concepts discussed in this chapter ]
Transient cell adhesion
Concepts of transient adhesion and release are of particular importance in the case of leukocyte
rolling adhesion and transmigration across the endothelial layer of a blood vessel In addition
cell migration through extracellular matrix or along a substrate requires the ability of the cell to
both form and release adhesions
One problem that has received considerable attention is the interaction between an
adherent or rolling leukocyte and the adhesion receptors on the endothelium These studies are
complicated by the three-dimensional nature of the flow the compliance of the interacting
surfaces and receptor-ligand dynamics In a series of recent studies Hammer and co-workers
(Chang Tees et al 2000) have addressed several of these issues computing the viscous force
and torque acting upon a sphere near to planar wall from the mobility matrix (Hammer and Apte
1992) and using the ldquoBell modelrdquo of receptor binding (Bell 1978) but neglecting the effects of
cell deformation The Bell model relates the dissociation rate constant kr to the force in the
bond f the thermal energy kBT and a parameter with units of length that depends on the
reactivity of the molecule
kr = ko r exp(γf kBT ) (283)
53
CHAPTER 21 CELL MEMBRANE MECHANICS AND ADHESION copyRD Kamm 4615
A Monte Carlo method is employed at each time step in the calculation to determine bond
formation or breakage In these studies the nature of the leukocyte-endothelial interaction is
characterized as firm adhesion rolling adhesion bimodal adhesion or no adhesion and mapped
as a function of the two parameters of the Bell model in Fig 3 The boundaries of the rolling
adhesion regime are identified for a wall shear rate of 100 s-1 (dotted lines) or 30 and 400 s-1
(solid lines) Most literature values for the Bell model parameters for a variety of selectin
receptors (known to be instrumental in leukocyte rolling) correspond to the rolling adhesion
regime for typical shear rate of 100 s-1 An interesting but counterintuitive result from this study
was the observation that as the bond stiffness was increased from the value used in most
calculations (100 dyne cm-1) adhesiveness decreased which the authors attribute to reduced
deflection for a given level of force leading subsequently to more rapid dissociation
Fig 3118 The state diagram for a leukocyte interacting with an endothelial surface for shear rates ranging from 30 to 400 s-1 For low dissociation rates the leukocyte remains adherent to the surface (lower left) As either (γ) or ( ko
r ) [see Eqn (283) for definitions] is increased the cell first adheres firmly then rolls along the wall then completely detaches (upper right) Rolling adhesion is defined as the regime where rolling occurs over some part of the shear rate range between 30 and 400 s-1 Firm adhesion indicates that cells remain attached even at the highest shear rate no adhesion indicates that cells roll at a velocity gt 50 of the velocity of a non-adherent sphere In the bimodal regime cells are either adherent or non-adherent and do not exhibit rolling Dotted curves correspond to these same boundaries for a shear rate of 100 s-1 Reproduced from Chang et al (2000)
54
CHAPTER 21 CELL MEMBRANE MECHANICS AND ADHESION copyRD Kamm 4615
In another recent study using high-resolution video-microscopy (Schmidtke and Diamond
2000) it was demonstrated that a flowing neutrophil can attach to an adherent platelet via
adhesion molecules located in the tips of the microvilli and form long tethers averaging nearly 10
μm in length but ranging up to 40 μm at extensional rates of 6-40 μm s-1 for shear rates ranging
from 100-250 s-1 The mechanics of tether formation is itself a fascinating topic that is still under
intense investigation Readers interested in pursuing this work in more detail are referred to the
several papers (Hochmuth Shao et al 1996 Dai and Sheetz 1998 Dai and Sheetz 1999) that
identify a number of intriguing phenomena
55
CHAPTER 21 CELL MEMBRANE MECHANICS AND ADHESION copyRD Kamm 4615
317 Nomenclature Parameter Definition Units
R - receptor
L - ligand
C - receptor-ligand complex
G - Gibbs free energy Nm
N - membrane tension Nm
NR - total receptor density -3μm-2 in 2D or μm in 3D NL - total ligand density μm-2 in 2D or μm-3 in 3D N in 2D or μm-3μm-2
C - complex density in 3D NRf - free receptor density m-2 in 2D or m-3μ μ in 3D NLf - free ligand density -2 -3μm in 2D or μm in 3D d+ - forward diffusional rate constant 2 -1μm s-1 in 2D or 3 μm s in 3D d -1
- - reverse diffusional rate constant s r+ - forward reaction rate constant s-1
r- - reverse reaction rate constant s-1 D 2 -1
m - membrane diffusion coefficient μm s D - solution diffusion coefficient m2 s -1s μ Kb - bending stiffness Nm K 0 - equilibrium constant or affinity (zero force) M-1 in 3D and 2μm in 2D = k0
+ k0 minus
K - equilibrium constant M-1 in 3D and m2μ in 2D = k+kshy
k0 - association rate constant (zero force) M-1 s-1 in 3D or m-2 -1+ μ s in 2D
k0 - dissociation rate constant (zero force) s-1 minus
k - association rate constant M-1 s-1 in 3D or m-2 -1+ μ s in 2D
kminus - dissociation rate constant s-1 f - force per bond N F - total adhesion force N γ - empirical parameter μm r0 - distance over which energy minimum acts μm E0 - bond energy J k JK-1
B - Boltzmanns constant T - temperature K τ - bond lifetime s
56
CHAPTER 21 CELL MEMBRANE MECHANICS AND ADHESION copyRD Kamm 4615
τ0 - bond lifetime with zero force s σ - adhesion stress N μm-2 κ - spring constant for receptor-ligand bond N μm-1
57
CHAPTER 21 CELL MEMBRANE MECHANICS AND ADHESION copyRD Kamm 4615
References Bell G I (1978) Models for the specific adhesion of cells to cells Science 200 618-627 Caille N O Thoumine et al (2002) Contribution of the nucleus to the mechanical properties
of endothelial cells J Biomech 35(2) 177-87 Chang K C D F Tees et al (2000) The state diagram for cell adhesion under flow
leukocyte rolling and firm adhesion Proc Natl Acad Sci U S A 97(21) 11262-7 Dai J and M P Sheetz (1998) Cell membrane mechanics Methods Cell Biol 55 157-71 Dai J and M P Sheetz (1999) Membrane tether formation from blebbing cells Biophys J
77(6) 3363-70 Daily Elson et al (1984) Determination of the elastic area compressibility modulus of the
erythrocyte membrane Biophys J 45(4) 671-682 Evans E and K Ritchie (1997) Dynamic strength of molecular adhesion bonds Biophys J
72(4) 1541-55 Evans E A (1983) Bending elastic modulus of red blood cell membrane derived from
buckling instability in micropipet aspiration tests Biophys J 43(1) 27-30 Hammer D A and S M Apte (1992) Simulation of cell rolling and adhesion on surfaces in
shear flow general results and analysis of selectin-mediated neutrophil adhesion Biophys J 63(1) 35-57
Hardt S L (1979) Rates of diffusion controlled reactions in one two and three dimensions Biophysical Chemistry 10 239-243
Hochmuth F M J Y Shao et al (1996) Deformation and flow of membrane into tethers extracted from neuronal growth cones Biophys J 70(1) 358-69
Kucik D F E L Elson et al (1999) Weak dependence of mobility of membrane protein aggregates on aggregate size supports a viscous model of retardation of diffusion Biophys J 76(1 Pt 1) 314-22
Kusumi A Y Sako et al (1993) Confined lateral diffusion of membrane receptors as studied by single particle tracking (nanovid microscopy) Effects of calcium-induced differentiation in cultured epithelial cells Biophys J 65(5) 2021-40
Lehenkari P P and M A Horton (1999) Single integrin molecule adhesion forces in intact cells measured by atomic force microscopy Biochem Biophys Res Commun 259(3) 645-50
McCloskey M and M M Poo (1984) Protein diffusion in cell membranes some biological implications Int Rev Cytol 87 19-81
Meleard P Gerbeaud C Bardusco N Mitov MD and Ferdandex-Puente L (1998) Mechanical properties of model membranes studied from shape transformations of giant vesicles Biochimie 80 401-413
Moy V T Y Jiao et al (1999) Adhesion energy of receptor-mediated interaction measured by elastic deformation Biophys J 76(3) 1632-8
Ra H J C Picart et al (1999) Muscle cell peeling from micropatterned collagen direct probing of focal and molecular properties of matrix adhesion J Cell Sci 112 ( Pt 10) 1425-36
Saffman P G (1976) Bownian motion in thin sheets of viscous fluid Journal of Fluid Mechanics 73 593-602
Schmidtke D W and S L Diamond (2000) Direct observation of membrane tethers formed during neutrophil attachment to platelets or P-selectin under physiological flow J Cell Biol 149(3) 719-30
Sheets E D R Simson et al (1995) New insights into membrane dynamics from the analysis of cell surface interactions by physical methods Curr Opin Cell Biol 7(5) 707-14
58
CHAPTER 21 CELL MEMBRANE MECHANICS AND ADHESION copyRD Kamm 4615
Vink H and B R Duling (1996) Identification of distinct luminal domains for macromolecules erythrocytes and leukocytes within mammalian capillaries Circ Res 79(3) 581-9
Waugh R and E A Evans (1979) Thermoelasticity of red blood cell membrane Biophys J 26(1) 115-31
Zeman K H Engelhard et al (1990) Bending undulations and elasticity of the erythrocyte membrane effects of cell shape and membrane organization Eur Biophys J 18(4) 203shy19
Zhelev D V D Needham et al (1994) Role of the membrane cortex in neutrophil deformation in small pipets Biophys J 67(2) 696-705
59
MIT OpenCourseWarehttpocwmitedu
20310J 3053J 6024J 2797J Molecular Cellular and Tissue BiomechanicsSpring 2015
For information about citing these materials or our Terms of Use visit httpocwmiteduterms
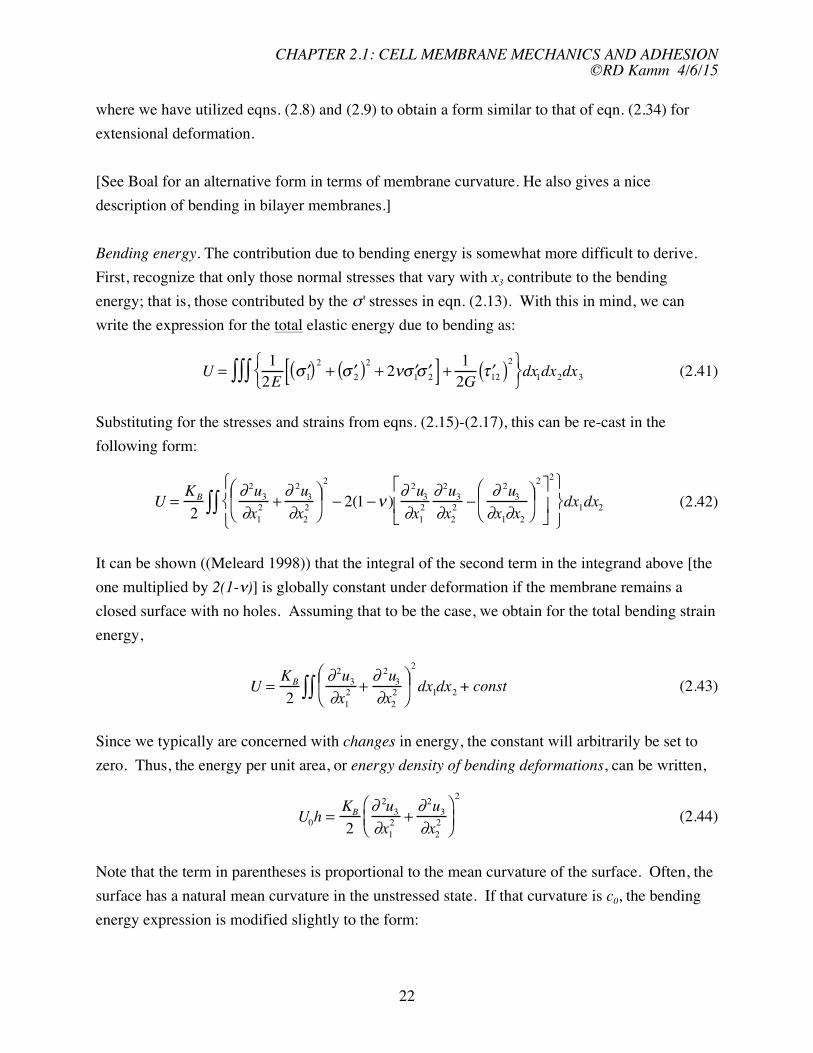
CHAPTER 21 CELL MEMBRANE MECHANICS AND ADHESION copyRD Kamm 4615
where we have utilized eqns (28) and (29) to obtain a form similar to that of eqn (234) for
extensional deformation
[See Boal for an alternative form in terms of membrane curvature He also gives a nice
description of bending in bilayer membranes]
Bending energy The contribution due to bending energy is somewhat more difficult to derive
First recognize that only those normal stresses that vary with x3 contribute to the bending
energy that is those contributed by the σ stresses in eqn (213) With this in mind we can
write the expression for the total elastic energy due to bending as
1 1 U = intintint ⎧ [ 2
⎨ ( ) 2 ⎫ σ 1 prime + ( )2
σ 2 prime + 2νσ 1 primeσ prime 2 ] + ( )τ 12 prime ⎬dx (241)⎩2E 2G ⎭ 1dx2dx3
Substituting for the stresses and strains from eqns (215)-(217) this can be re-cast in the
following form
⎧ 2 ⎫K ⎛ 2
part 2 2u ⎡ 2 u part ⎞ part 2u 2 part 2 ⎤ part u ⎛ u ⎞
U = B intint ⎜ 3 3 ⎟ 1 minus ν ) 3 3 2 minus ⎜ 3 ⎟⎨ 2 + 2 minus 2( 2 ⎬dx1dx (242)⎢ ⎥2 ⎝ partx1 partx2 ⎠ partx1 partx2 ⎝ partx1partx2 ⎠ 2
⎩ ⎣ ⎦ ⎭
It can be shown ((Meleard 1998)) that the integral of the second term in the integrand above [the
one multiplied by 2(1-ν)] is globally constant under deformation if the membrane remains a
closed surface with no holes Assuming that to be the case we obtain for the total bending strain
energy
KB ⎛
2 part 2u part 2
= intint ⎜ 3 u2 + 3 ⎞
U ⎟2 dx1dx2 + const (243)
2 ⎝ partx1 partx2 ⎠
Since we typically are concerned with changes in energy the constant will arbitrarily be set to
zero Thus the energy per unit area or energy density of bending deformations can be written
2 K ⎛ part 2 part 2 ⎞
0 = B u⎜
3 uU h 2 + 3
2 ⎟ (244)2 ⎝ partx1 partx2 ⎠
Note that the term in parentheses is proportional to the mean curvature of the surface Often the
surface has a natural mean curvature in the unstressed state If that curvature is c0 the bending
energy expression is modified slightly to the form
22
CHAPTER 21 CELL MEMBRANE MECHANICS AND ADHESION copyRD Kamm 4615
2 K ⎛ part 2 part 2 ⎞
U0 = B u⎜
3 uh 2 + 3
2 minus c0⎟ (245)2 ⎝ partx1 partx2 ⎠
Another common form of this expression is obtained by recognizing that the first two terms in
parentheses represent the linearized form of the sum of the principal curvatures (the largest and
smallest curvatures at a point) denoted c1 and c2 so that eqn (345) can be written
K
U2 B
0h = (c1 + c2 minus c0 ) 2
Although each of these expressions for strain energy density has been derived individually they
of course all contribute in the general situation and are linearly additive In that regard several
points are worthy of note First one can obtain some idea of the relative importance of
extension shear and bending deformations in a given situation simply by comparing their
relative energies just as was done in the last section by comparison of the bending and tension
terms in eqn (226) Not surprisingly the comparison leads to the same expressions we obtained
before for when either bending or tension is dominant Second due to the small shear modulus
of most cell membranes the energy stored in shear deformation can generally be neglected And
finally a comment is warranted concerning the energy due to tension Various simplifying
assumptions can be made depending on the cell type being considered and the nature of the
stress to which the cell (or vesicle) is being subjected but generally the lipid bilayer can be
considered to be of constant area unless it experiences grossly non-physiologic levels of stress
Thus the main contribution to extensional energy is that represented by eqn (339) associated
with the smoothing of membrane undulations
Other Factors Influencing Membrane Motion
Thermal fluctuations Biological membranes of all types can be seen to fluctuate due to
Brownian motion of the surrounding molecules if viewed with sufficient resolution These
fluctuations are in fact often used to measure the membrane bending stiffness since thermal
effects are seen as motions in the membrane of relatively long wavelength favoring bending
energies as compared to extensional or shear (see eqn (223)) To account for these effects it is
customary to add a time-dependent forcing term to eqn (223) η(t) the magnitude of which
scales with kBT We analyze thermal motions later and use them as a means of determining the
bending stiffness of a membrane
23
CHAPTER 21 CELL MEMBRANE MECHANICS AND ADHESION copyRD Kamm 4615
Damping due to external fluids When a membrane fluctuates in a direction perpendicular to its
plane velocities are induced in the surrounding fluids and due to the resulting shear stresses
energy is dissipated These motions are extremely complex to model precisely and depend on
both the nature of the surrounding medium (its rheological properties) and the bounding
geometry In lieu of a complete and rigorous analysis a local damping term is sometimes added
to the membrane force balance equation (eqn (223)) to approximate these effects Its form is
based on the presumption that externally induced velocities scale with the velocity of the wall
and that shear forces in the external fluid scale with the induced shear rates and velocities
Accordingly eqn (223) is modified by the addition of a term of the form μm partu3 partt where μμ is
the effective viscosity of the external fluid The equation that results from the addition of both
thermal forcing and external fluid viscosity is
partu ⎛ part 43 u 4
3 part u part+ 3 part 4u ⎞ part ⎛ ⎞ part ⎛ ⎞
B ⎜ 3 partu u
μm K 4 + 2 2 2 + 4 ⎟ minus ⎜ N3
⎟ minus part 1 ⎜ N
3
partt ⎝ x partx partx partx ⎠ partx ⎝ partx ⎠ partx ⎝ 2 ⎟ = p + η(t) (246)1 1 2 2 1 1 2 partx2 ⎠
An expression of similar form for a linear polymer is sometimes referred to as the Rouse
equation
314 Measurements of Membrane Elastic Parameters
Although the analogy has limitations it is useful at the onset to think of the cell as a fluid-filled
balloon or bag Just as in the case of a balloon the elastic properties of the membrane can be
determined by any experiment in which the membrane tension changes while its area is
measured In the simple example of a spherical balloon tension can be computed from the
inflating pressure and the measured radius the latter also yielding the surface area Ignoring for
now the thermal-induced fluctuations in a real cell membrane (ie assuming the cell to be at zero
temperature) the calculations become particularly simple Furthermore we will consider cells
for which the cytoplasm can be considered to fluid-like having no elasticity We return to
address both issues shortly
Osmotic swelling
Perhaps the simplest method to inflate the cell and measure the membrane elastic properties is to
cause the cell to swell by changing the osmolarity of the external fluid and simultaneously
monitoring the change in cell volume The change in transmembrane pressure mirrors the
24
CHAPTER 21 CELL MEMBRANE MECHANICS AND ADHESION copyRD Kamm 4615
change in osmotic pressure brought about by successive additions of a solute to which the
membrane is impermeable For ions and small molecules the osmotic pressure π can be
calculated from the vant Hoff equation
π = RT sum Ci (247)
i
where Ci are the molar concentrations of all solutes to which the membrane is impermeable For
larger molecules such as proteins their contribution to osmotic pressure is much larger than
indicted by this equation
Consider for example a spherical cell expanded osmotically so that the internal
hydrostatic pressure relative to external pressure is pc Microscopic examination yields a value
for the cell radius Rc Using these values in combination with Laplaces law [eqn (227)] gives
us the tension in this state and eqn (24) provides its relationship to the extensional modulus
p R Δ A
N = c c = Ke (248) 2 A0
The observed change in radius allows calculation of ΔA In practice identification of the reference state at zero pc is problematic due to the presence of thermal fluctuations but if Ke can be assumed constant for relatively small changes in area it is possible to extrapolate back to the zero-stress state from two measurements at elevated pc [Example red blood cell] Micropipet aspiration
One of the first methods used to measure the extensional modulus of the cell membrane involved
drawing a cell slightly deflated into a micropipet simultaneously monitoring the dimensions of
the cell and the pressure in the micropipet (Daily Elson et al 1984) Since on the time scale of
the experiment the volume of the cell could be assumed constant the shape change due to
aspiration of the cell causes increases in both internal pressure and surface tension both of which
are assumed spatially uniform Once the tension is large enough (or the temperature low
enough) to dampen the amplitude of any thermal fluctuations the cell can be treated assuming
that membrane extension is the dominant means by which the pressure drop across the
membrane is balanced [For further discussion on the thermal fluctuations and the relationship
between micropipet pressure and intracellular pressure see Daily and Evans and Rawicz Phys
Rev 1990 See also figure on p 199 of Boal Example the two regimes in membrane stiffness]
For the situation shown in Figxx the cell is drawn into the micropipet to the point at
which the portion of the cell external to the cell is spherical of radius Rc With the assumptions
25
CHAPTER 21 CELL MEMBRANE MECHANICS AND ADHESION copyRD Kamm 4615
stated above the (uniform) pressure within the cell can be related to it surface tension (assumed
uniform) and the radii of curvature of the main body of the cell Rc and the portion inside the
pipet a using Laplaces law [eqn (227)]
pc = 2N Rc = minus Δp + 2N a (249)
where pressures are referenced to the external ambient pressure Reorganizing to solve for
surface tension we obtain
ΔpN = (250)
⎛ 1 1 ⎞ 2⎜ minus ⎟
⎝ a Rc ⎠
The surface area corresponding to a given N is obtained from geometry summing the membrane
surface areas of the cylinder and hemisphere inside the micropipet and the truncated spherical
surface outside yielding for the areal strain the approximate expression
[(a R )2 (a R )3
Δ c minus c cong
]ΔLA
A 2a
Fig xx Micropipet aspiration of a neutrophil
This relationship between N and ΔAA can be used to calculate the area expansion modulus
Eh AK 0
e = = N 2 1( minus ν ) ΔA
where the expression involving Youngrsquos modulus assumes the membrane to be isotropic and
homogeneous The relationship could however be non-linear in that the value of Ke may vary
with the degree of area expansion a linear relationship between N and ΔA yields a constant value for Ke
It is important to note that neither of these approaches osmotic inflation or micropipet aspiration provides us with any information on the bending modulus To be precise bending
26
CHAPTER 21 CELL MEMBRANE MECHANICS AND ADHESION copyRD Kamm 4615
does play a role in the micropipet experiments but the effects are so small as to be negligible and are typically ignored That is not to say that bending is always negligible however as discussed next
Monitoring thermal fluctuations in the membrane
When a cell or lipid vesicle is observed floating free unattached to a substrate it can be seen to
exhibit time-dependent undulations as a result of collisions with the surrounding molecules
undergoing thermal motion In the case of a lipid vesicle with diameter in the range of 10
microns these undulations can be readily observed microscopically In smaller cells such as red
blood cells the motions can be inferred from the flickering phenomenon associated with the light
interference as the cell thickness changes (Zeman Engelhard et al 1990) Since the amplitude of
the membrane undulations depends on the stiffness of the membrane to bending and its surface
tension it is reasonable to expect that measures of this amplitude can be used to infer the
membrane elastic parameters In order to illustrate the method while avoiding some of the
algebraic complexity consider undulations in a flat membrane with significant bending stiffness
and a constant surface tension The relationship between the motion and the elastic properties
can be found by considering the total energy of the membrane obtained by summing the
energies per unit area from eqns (239) and (244) and integrating over the membrane surface
area Am
⎧ 2⎪ K ⎛ 2 2
part 2 u part 2 ⎡ 3 u ⎞
3 N ⎛ partu ⎞ ⎛ int 3 partu ⎞ ⎤⎫
B 3 ⎪
U0hdA = int ⎨ ⎜ 2 + 2 ⎟ + ⎢⎜ ⎟ + ⎜ ⎟ ⎥⎬dA (251) A ⎠ 2
m Am ⎪ 2 ⎝ partx1 partx2 ⎢⎝ partx1 ⎠ ⎝ partx2 ⎠ ⎥⎪ ⎩ ⎣ ⎦⎭
In writing the energy in this form we have omitted the contribution due to shear deformation
consistent with the fluid-like character of a pure lipid bilayer and have taken the surface tension
to be uniform during the deformation In this example membrane surface area changes only as a
result of fluctuations from the mean [u3(xxx2) = 0] configuration that is we now ignore the
contribution due to changes in intermolecular spacing and only consider changes in the area
projected onto the x1-x2 plane
It is convenient to use the method of Fourier transforms to represent the undulations of a
membrane normal to the x1-x2 plane which in two-dimensions leads to [see also class notes on
bending of cytoskeletal filaments alternatively use Fourier series representation]
A A
u3 (x) = u3 (x1 x2 ) = 2 intexp(iq sdot x)b(q)dq =
2 int exp(iq 4 1x1)exp(iq2 x2 )b(q1q2 )dq1dq
π 4π 2
(252)
27
CHAPTER 21 CELL MEMBRANE MECHANICS AND ADHESION copyRD Kamm 4615
where qα = 2π λα is the wavenumber of the particular mode and b(q) is the continuous analogue of the discrete coefficients that multiply each mode in a Fourier series representation
Here the algebra gets complicated so only the results of the analysis will be presented however
those wishing to see a more complete derivation should see (Boal Mechanics of the Cell
Cambridge University Press 2002) Introducing eqn (352) into (351) yields
1 ⎛ A ⎞2
int U q 40hdA = ⎜ ⎟ int (
KB + Nq2 )b(q)b(q)dq (253)2 2 ⎝ π ⎠
where b(q) is the complex conjugate of b(q) Now we invoke a previous result that at equilibrium energy is equally distributed among the various modes and that each mode has an
average energy of kBT2 Taking the ensemble average of eqn (353) and equating the energy of
each mode represented in the result to kBT2 (by the equipartition theorem) leads to
k Aq)b q) = BT
b( (K q4 2 (254)
B + Nq
This is a useful result in itself demonstrating that all modes tend to be suppressed as temperature
falls or as bending stiffness or surface tension rise In addition it shows the tendency for higher
modes to be of smaller amplitude But this equation has further value in that it can be used to
obtain a direct expression for the change in apparent area of a membrane as tension increases
Consider the true surface area of a membrane A represented as the sum of its projected
area and the additional area associated with thermally-induced undulations
⎡ 1 ⎛ 2⎤u ⎞ 2 part ⎛ partu ⎞
A = int dx + ⎢ 3 3 2
int ⎜ ⎢⎝ partx 2 ⎟ + ⎜
⎠ ⎝ partx 2 ⎟ ⎥dx (255)⎠ ⎥
⎣ 1 2 ⎦
Isolating the term representing the area reduction due to thermal fluctuations expressing u3 in
terms of its Fourier transform and taking the ensemble average of the result leads to
1 ⎛ A ⎞2
A minus int dx = ⎜ ⎟ int q 2 b(q)b(q) dq (256)2 ⎝ 2π ⎠
Combing eqn (254) from above with this expression yields
28
CHAPTER 21 CELL MEMBRANE MECHANICS AND ADHESION copyRD Kamm 4615
A minus int dx
kBT dq kBT dq2
= A 8π 2 int =
N int (257)
+ KBq 2 8π 2 N + KBq 2
where in writing the last term we have introduced the relations dq = dq2dθ 2 and int dθ = 2π By a simple substitution z = q2 + (N KB )the integral can be evaluated We do so however
between specified limits on the assumptions that the range of possible wavenumbers is restricted
by the size of the membrane on one hand (q = (πA12)) and the distance between individual lipid molecules on the other (q = πlm) Integrating between these limits results in
⎛ π 2 N ⎞
int dx 2 +A ⎜ ⎟ minus k T l K
= B ln⎜ m B ⎟ (258)A 8πKB ⎜ π 2 N ⎟
⎜ + ⎟ ⎝ A KB ⎠
If we use the area reduction at zero tension as a reference and increase the area from that
condition by progressively increasing membrane tension as in a typical experiment we finally
obtain an expression relating the change in area to the change in tension
⎛ NA ⎞ 1 + A dx A dx ΔA minus int minus ⎟ k ⎛ NA
int k ⎜equiv minus = BT π 2 K
ln ⎜ B T ⎞ 2 ⎟ cong B ln 1 + (259)
Nl ⎜ ⎟A A A 8π KB ⎜ 1 + m ⎟ 8π KB ⎝ π 2 KB ⎠ N = 0 N ⎜ 2 ⎟⎝ π K ⎠ B
where we have used the assumption supported by typical values found from different
experiments that (Nl2 m ) (π 2KB ) ltlt 1
You should recall that this solution was obtained on the assumption that the actual area
of the membrane remained constant and that the reduction in projected or apparent area resulted
from the undulations being progressively smoothed out Once the undulations are eliminated
the only means by which the projected area of the membrane can further increase is by an
increase in the inter-molecular spacing ndash an increase in the actual membrane area When this
occurs we expect to see a transition to the behavior discussed at the beginning of this chapter a
result expressed as
29
CHAPTER 21 CELL MEMBRANE MECHANICS AND ADHESION copyRD Kamm 4615
Fig yy Plots of tension vs normalized surface area for lipid vesicles of different composition Evans amp Rawicz 1990
ΔA N = (260)
A Ke
Thus we have two limiting predictions one for low tensions eqn (259) and another for high
tensions eqn (260) and the transition from one behavior to the other should occur when the
two expressions for ΔAA are of the same magnitude This is supported by experiment (Fig yy) and the results in the two regimes provide a means for estimating the two moduli Ke and KB
30
CHAPTER 21 CELL MEMBRANE MECHANICS AND ADHESION copyRD Kamm 4615
Before leaving this analysis there is one further result that is useful to state although the
derivation is again somewhat involved Once we have the solution for the undulations at a
given level of tension and for given membrane properties the ensemble average displacement
normal to the plane of the membrane can also be computed with the result
⎞
u2 k ⎛= BT NA
3 ln ⎜ 1+ ⎟ (261)4πN ⎝ π 2KB ⎠
Again this supports our intuition that the undulations will be suppressed at low temperature or
high tension And in the limit as N rarr 0 a binomial expansion of the natural log term shows that
the effect of tension drops out and the magnitude of the undulations varies inversely with the
bending stiffness
315 Membrane Fluid Mechanics
Early studies of protein diffusion notably the work of Saffman (Saffman 1976)
examined protein diffusion using an approach akin to that of Einstein in three dimensional space
thereby reducing the problem to one of solving for the mobility b in the equation for diffusivity
D = kBTb (262)
Calculation of the mobility is influenced by the viscous drag on the portion of the protein within
the membrane but also on to the intra- and extracellular domains as well The solution of
interest here is the one applicable in the limit of small μeμm where μe and μm are the external and
membrane viscosities respectively leading to
kBT ⎛ hμm⎞
D = ⎜minusγ + ln ⎟ (263)4πμmh ⎝ aμ e ⎠
where h is the membrane thickness a the radius of the protein (assumed cylindrical) and γ is
Eulers constant (=05772) Membrane viscosity has been estimated from lipid diffusion to be
~2 poise (McCloskey and Poo 1984) When finite mobility is achieved as a result of a finite
domain as for example a circle of radius R the corresponding result is
31
CHAPTER 21 CELL MEMBRANE MECHANICS AND ADHESION copyRD Kamm 4615
k ⎛ 1 D = BT R ⎞ log minus (264)
4πμh ⎝ a 2 ⎠
While this represents a useful point of departure measurements of lateral diffusion in a
membrane have demonstrated a more complex behavior Fluorescence recovery after
photobleaching (FRAP) has enabled the direct tracking of membrane proteins labeled with
fluorescent antibodies More recently single particle tracking methods have been developed
using colloidal gold or a fluorescent particle in conjunction with digital microscopy as well as
controlled movements using microbeads manipulated by an optical trap
From experiments such as these a new picture has emerged While the lateral diffusion
of lipids and a small fraction of trans-membrane proteins satisfy the general form of Saffmans
predictions the predicted diffusivity is greater than that observed experimentally and agrees with
experiments only when a membrane viscosity of 100 poise is used This might be due to the
presence of other proteins in the membrane (Kucik Elson et al 1999) Experiments also show
that many proteins appear to diffuse freely only in small domains typically measuring from 200shy
600 nm remaining confined to these domains for periods on the order of tens of seconds To
explain this behavior the membrane skeleton fence model was proposed (Kusumi Sako et al
1993) in which a membrane-associated matrix constrains the movement of proteins outside of
the domains defined by the matrix filaments Diffusion beyond these barrier filaments can occur
either as a result of random thermal motions of the transmembrane protein matrix filaments or
both or by transient breaks in the filaments Confinement of proteins may play an important role
in rapid and selective signaling Rapid directed motion of membrane-associated proteins has
also been observed and is likely due to active transport by an intracellular actin- or microtubule-
based motor
316 Cell Adhesion
This section deals with how cells adhere to their surroundings and through these sites of
adhesion how they interact with the external world We begin by summarizing the different
types of adhesion their functions and the molecules involved Next we provide a brief
description of the adhesion complexes found in cells and the role of each type Then the
theories that provide a quantitative description of adhesion between single receptor-ligand pairs
are reviewed in the context of the material presented in Chapter xx including the role of thermal
fluctuations Through these theoretical models both the static and dynamic states of adhesion
can be explored for single molecule pairs then for adherent cells Next we develop the different
32
CHAPTER 21 CELL MEMBRANE MECHANICS AND ADHESION copyRD Kamm 4615
approaches that are used to study the adhesion of cells based either on thermodynamics or
mechanics Methods for the measurement of adhesion strength are described providing
estimates for the force that a cell can exert on its surroundings Various examples will be
presented but the adherence of leukocytes to the endothelium and the role of adhesion in cell
migration will receive special attention
Functions of adhesion
Adhesion has been found to be an essential process necessary for a variety of fundamental
cellular functions
bull Structural integrity Adhesion helps to maintain the overall structural integrity of the
tissue in muscle for example it provides the means of force transmission from the cells
to the surrounding matrix to allow contraction In non-contractile cells it still provides
the needed mechanical coupling to the surrounding tissue necessary for a variety of
cellular functions
bull External sensing Adhesion provides a means by which the cell can sense and
subsequently respond to its surroundings Forces transmitted directly to the cell
membrane or to the cytoskeleton via transmembrane proteins may trigger a variety of
biochemical reactions within the cell as we shall see later in Chapter 33
bull Migration Cell-matrix adhesion is an essential element in cell migration a cell propels
its way through tissue or along a surface through a process involving adhesion
contraction and release also described in Chapter 33
bull Regulation of transport Sites of cell-cell adhesion are often important in the regulation
of transport across a cell layer such as in the case of an epithelium or endothelium
bull Communication Sites of mechanical coupling often provide a means of cell-cell
communication as in the case of gap junctions which offer a pathway for the diffusion
of ions and small molecules between adjacent cells
Adhesion molecules
Cells adhere to their surroundings or to an artificial substrate via a wide variety of different
proteins that can be classified into five major families integrins selectins cadherins
immunoglobulins and transmembrane proteoglycans (Table 1) In terms of their mechanism of
attachment to other cells or the external matrix these can be classified as either homophillic ndash
binding to like molecules heterophillic ndash binding to unlike molecules or those that bind to other
cells through an extracellular linker molecule
Integrins one of the largest class of adhesion molecules are primarily used to attach cells
to the extracellular matrix or the basal lamina but are also present in some cell-cell adhesion
33
CHAPTER 21 CELL MEMBRANE MECHANICS AND ADHESION copyRD Kamm 4615
complexes They typically bind to the matrix via the RGD amino acid sequence (arginine
glycine aspartic acid) but can also contain other binding motifs Integrins are heterodimers in
that they always contain an α and a β subunit with the different isoforms determining the specific ligand to which the integrin binds Two specific types of adhesion focal adhesions and hemidesmosomes often contain integrins and the attachments they make can at times be stable but at other times transient so as for example to mediate cell migration The force of adhesion of a single integrin-ligand bond has been measured using atomic force microscopy and found to be in the range of 30-100 pN (Lehenkari and Horton 1999) with a relatively low binding affinity in the range of K ~ 10-6
D to 10-8 molliter By comparison typical cell-surface receptors bind with an affinity in the range of 10-9 to 10-11 molliter Integrins also play an important role in signaling since extracellular integrin binding is known to influence cytoskeletal morphology as well as the state of cell differentiation Adhesion molecules in the selectin family also tend to form transient bonds and are important in leukocyte adhesion and extravasation the migration of the leukocyte through the endothelium and into the tissue Consequently they tend to be found in cells of the circulation and are present both in leukocytes and endothelial cells and are instrumental in adhesion between these two cell-types during leukocyte rolling
Family Location andor Ligands Comments
function recognized
integrins focal adhesions (E) fibronectin relatively low
hemi-desmosomes collagen laminin affinities
leukocyte immunoglobulins (KD~ 10-6-10-8
(spreading) (I) actin filaments molliter)
adhesion primarily
cell-matrix adhesion
but also in some
cell-cell adhesions
selectins circulating cells and carbohydrates require Ca2+
endothelial cells
rolling adhesion
Ig superfamily important in integrins
(immunoglobulin) immune response homophillic
cadherens adherens junctions (E) homophillic require Ca2+
desmosomes (I) actin
34
CHAPTER 21 CELL MEMBRANE MECHANICS AND ADHESION copyRD Kamm 4615
filaments
intermediate
filaments
transmembrane fibroblasts (E) collagen bind various
proteoglycans epithelial cells fibronectin growth factors
(I) actin such as FGF
filaments
heterophillic
Table 1 Cell adhesion molecules and their characteristics
While both integrin and selectin binding is mediated by Ca2+ adhesion via the
immunoglobulin (Ig) superfamily of proteins is Ca2+ independent Some of the most prominent members of this family are the N-CAMs (Neural cell adhesion molecules) and ICAMs (Intracellular cell adhesion molecules) These tend to undergo homophillic bonding but some also bind to members of the integrin family
Cadherens are often expressed in the same cells as the selectins but form much stronger bonds and therefore play an important role in maintaining cell integrity Because of these attributes cadherens are the primary adhesion proteins in desmosomes and adherens junctions the major structural contacts cells form with other cells or the basil lamina These also form homophillic bonds by a Ca2+ dependent mechanism and mediate selective bonding between adjacent cells Cadherens are relatively short as compared to other adhesion molecules being
about 700-750 amino acid residues in length
Types of adhesion complexes
Cells have developed a variety of specialized adhesion complexes each utilizing one or more of
the adhesion molecules of Table 1 and each serving a specific purpose Typically the cell-cell or
cell-surface spacing is in the range of 10-20 nm but this is highly variable ranging from less than
1 nm when controlling transport to over 100 nm in regions where tight control is unnecessary
Below we describe the different types of junctions and where important for function their
mechanical characteristics
Gap junctions Cells need to communicate with their neighbors for a variety of reasons For
example cardiac myocytes transmit signals from cell to cell in order to maintain a synchronous
35
CHAPTER 21 CELL MEMBRANE MECHANICS AND ADHESION copyRD Kamm 4615
wave of contraction This is typically accomplished by providing a pathway for ions and small
signaling molecules between cells called gap junctions (Fig 3110) These minute channels are
typically comprised of a collection of six connexin proteins that cluster together in cylindrical
fashion forming a minute channel that passes molecules and ions less than about 1200 to 2000
MW (15-2 nm) Transport through these channels is regulated and their permeability drops in
the presence of high Ca2+ concentration as when a cell membrane is ruptured or with low pH
Cyclic AMP acting as a second messenger can be exchanged between cells therefore gap
junctions provide a metabolic linkage between neighboring cells and provide a means by which
hormonal stimulation of just one cell can be transmitted to others
Adherens junctions Adherens junctions are belt-like structures that can be though of as the
structural weld that holds two cells together (Fig 3110) Because of their structural role
these junctions formed by homophilic bonding between proteins in the cadheren family are
anchored securely again via the adaptor proteins α β γ-catenin to the cytoskeleton
Desmosomes and Hemidesmosomes If the adherens junctions are the continuous welds between
cells desmosomes are the spot welds Again these serve primarily a structural purpose
joining two neighboring cells via a complex consisting of a dense plaque on the intracellular
sides of both cells extending 15-20 nm into the cell and consisting of a variety of proteins that
attach to keratin filaments part of the intermediate filament network Hemidesmosomes have
similar intracellular structure but attach instead to the basal laminae Based on their different
extracellular attachment sites desmosomes typically link to other cells via cadherens whereas
hemidesmosomes adhere via a type of integrin Both are commonly found in epithelial cells
36
CHAPTER 21 CELL MEMBRANE MECHANICS AND ADHESION copyRD Kamm 4615
Fig 3110 Schematic showing the different types of cell junctions present in an epithelial cell as found in the small intestine Tight junctions near the apical surface essentially prevent the passage of all molecules The spot desmosomes and adherens junctions provide for cell-cell anchoring and the hemidesmosomes for anchoring to the basal lamina Gap junctions provide a means for communication between neighboring cells [Reproduced from Lodish et al Molecular Cell Biology 2000]
Junction type Function Extracellular or Intracellular
adjacent cell attachment
attachment
Adherens structural cell-cell or cell- ECM proteins or actin filaments
matrix cadherins in
adjacent cell
Desmosome structural cell-cell cadherin intermediate
filaments
Hemidesmosome structural cell-matrix basal lamina via intermediate
integrins filaments
Focal adhesions structural cell-matrix ECM proteins actin filaments
via integrins
Tight junction regulate transport between homophillic binding between the
cells and along cell transmembrane proteins occludin or
37
CHAPTER 21 CELL MEMBRANE MECHANICS AND ADHESION copyRD Kamm 4615
membrane claudins
Gap junctions cell-cell communication channels formed by connexin
via ion and small molecule subunits
exchange
Table 2 Adhesion complexes
Focal adhesions A second means by which cells attach to the extracellular matrix is through
focal adhesions These serve a similar function to the hemidesmosomes and share a common
linkage via integrins to the ECM but are attached on the intracellular side instead to the actin
filaments of the cytoskeleton Actin filaments converge at the site of focal adhesions forming
stress fibers strong actin bundles that attach to the β-subunit of the integrins via adapter
proteins such as actinin vinculin and talin Focal adhesions are instrumental in cell migration
and for this purpose need to be easily formed and disrupted as the cell moves forward Release
or de-adhesion of cells is often mediated by a class of peptides called dis-integrins that
competitively bind to the RGD site used by integrins to attach to a variety of matrix molecules
Tight junctions Control of transport is generally mediated by tight junctions that form an
intricate network of seams between two cells (Fig 3111) As their name implies these are the
tightest of the cell-cell junctions and the gaps they leave are often small enough to exclude even
the smallest ions and molecules Formed by homophillic binding between the transmembrane
proteins occluding and claudins tight junctions allow epithelial cells to perform their critical role
in transepithelial transport and provide for maintenance of differences in concentration between
the apical and basal surfaces of these cells Since occludins are not capable of forming rigid
structural bonds with the cytoskeleton they are most often associated in a junctional complex
with adherens junctions or desmosomes that fulfill the structural needs of attachment
38
CHAPTER 21 CELL MEMBRANE MECHANICS AND ADHESION copyRD Kamm 4615
Fig 3111 Tight junctions in an epithelial cell shown schematically (a) in a freeze fracture replica (b) and in a transmission electron micrograph (c) [Reproduced from Alberts et al 1994]
Fig 3112 Two types of bond that attach a cell to the extracellular matrix by means of clusters of integrins On the extracellular side integrins bind to the matrix proteins fibronectin and laminin Inside the cell they attach to the cytoskeleton via adaptor proteins to either actin filaments (focal adhesions) or intermediate filaments (hemidesmosomes) [Reproduced from Lodish et al Molecular Cell Biolology 2000]
Non-specific binding
Cells can adhere to their surroundings by either non-specific or receptor-ligand (specific)
bonding Though both mechanisms are likely active in most situations as we will see receptorshy
39
CHAPTER 21 CELL MEMBRANE MECHANICS AND ADHESION copyRD Kamm 4615
ligand bonding is the stronger of the two by a considerable margin and is therefore the most
relevant biologically In situations for which either the receptors or their ligands are not present
however such as might be the case in certain in vitro experiments non-specific binding can be
important as well
There are essentially three major forms of non-specific attractions to consider
bull Van der Waals ndash These attractive forces arise due to charge interactions in polar
molecules They tend to dominate among the non-specific mechanisms at
intermediate distances around 20-25 nm [see Boal]
bull Electrostatic ndash These interactions can be either attractive or repulsive depending
on the sign of the surface charges and are particularly important during the
approach of two cells since the glycocalyx has a high negative charge density
bull Steric ndash These forces arise due to the steric exclusion of two molecules as they are
brought into close contact In the case of cell-cell interactions steric repulsion is
due to the compression of the two glycocalyx layers and the tendency to resist
compression resulting from osmotic effects and the elasticity of the layer Steric
forces tend to dominate for small separation distances lt 10 nm
In combination these effects combine to produce a net attractive force per unit area of
about 100 Pa at a separation distance of about 25 nm
Adhesion by means of receptor-ligand binding
We can use the analysis of Chapter xx to estimate the strength of a receptor-ligand bond and
based on typical values for bond density calculate the corresponding strength of adhesion
between two cells or between a cell and a surface Recall that the application of force to a
receptor-ligand bond modifies the dissociation rate constant for the binding reaction This effect
can be modeled in several ways but the result obtained by Bell ((Bell 1978)) suggests the
following exponential form for the dissociation rate
0 ⎛ γf ⎞ 0 ⎛ γσ ⎞ kminus = kminus exp⎜ ⎟ = kminus exp⎜ ⎟ (265)
⎝ kBT ⎠ ⎝ NC kBT ⎠
where k0minus is the unforced dissociation rate constant γ is a factor with the units of length that
corresponds roughly with the distance separating the bonded pair at equilibrium NC is the concentration of bonded complex and σ is the average bond force per unit area To determine
40
CHAPTER 21 CELL MEMBRANE MECHANICS AND ADHESION copyRD Kamm 4615
the rate of change of the concentration of bonded pairs one must solve the following rate equation describing the competition between bond formation (first term) and destruction (second term)
dNC ⎛ γσ ⎞
cong k+ (NR minus NC )(NL ) minus kminus NC = k+ (N minus )( 0R NC NL ) minus kminus NC exp⎜ ⎟ (266)
dt ⎝ NC kBT ⎠
where NR and NL are the concentrations of receptors and ligands respectively and we have
assumed that NCltltNL and that all bonds are stressed equally At equilibrium dNCdt=0 and if
the force applied to detach the cell (equal to the average bond stress σ) is increased
incrementally from zero NC will progressively fall to a new equilibrium value At sufficiently
high levels of force however increasing σ further eventually gives rise to a situation in which equilibrium can no longer be achieved through a reduction in NC At that point NC tends toward zero and the cell separates from the surface to which it was attached It can be shown that this
occurs when (Bell 1978)
k 0
α c exp(α + c + 1) = N
k 0 L (267)minus
σ
where α minγ c equiv and σmin is the minimum stress needed to cause detachment For a wide
NRkBT
range of conditions eqn (267) has the approximate solution
⎛ k0 + ⎞
α c cong 07 ln L (268)⎜ 0 N ⎟⎝ kminus ⎠
so that the critical stress for detachment can be expressed as
N 0
σ cong 07 C kBT ⎛ k ⎞ ln⎜
+ min N ⎟ (269)
γ ⎝ k0 L minus ⎠
where NC is determined from setting eqn (266) to zero under these critical conditions
Thermodynamic approach to cell adhesion
Although we focus here on the mechanical aspects of cell adhesion this process can also be
viewed from a thermodynamic perspective In this approach adhesion is considered in terms of
the change in energy specifically the Gibbs free energy G associated with all the individual
receptor-ligand interactions as well as the various non-specific forces of attraction or repulsion
The adhesion of a cell to a given surface then can be viewed as an equilibrium state determined
41
CHAPTER 21 CELL MEMBRANE MECHANICS AND ADHESION copyRD Kamm 4615
by minimization of the free energy If in undergoing a transition from a free state to an adherent
state the system represented by the cell and surface experiences a reduction in free energy ie
ΔGlt0 then adhesion will occur and the equilibrium state of adhesion will be determined by that with the minimum in free energy or the largest value of -ΔG While this approach ignores
many of the subtleties of the interactions and like the analysis above assumes that all receptorshy
ligand interactions are identical from an energetic point of view it is useful in providing some
simple insights as seen in the next two examples
Example Comparison of specific and non-specific adhesive forces Non-specific bonding due
to the combined effects of van der Waals electrostatic and steric forces result in an attractive
stress of approximately 100 Pa Receptor-ligand bonding give rise to forces that can be
estimated from the change in free energy f ~ to 4x10⁻⁴ dynbond = 9x10-11 to 4x10⁻⁹ ΔGr~9x10⁻⁶ Nbond where f is the force required to break the bond and r is a measure of the distance the bond stretches before it breaks Using a typical density of the receptor-ligand complex NC of ~1012-1015 bondsm2 gives a total bond stress of N 1
C x f ~ 9 x 10 to 4x10⁶ Pa The above kinetic approach to estimating bond strength [eqn (269)] gives a value approximately half of that from this equilibrium approach In either case however the conclusion remains the same non-specific binding can under certain circumstances be important since it is comparable to the lowest estimates of receptor-ligand-mediated bond strength but not surprisingly the latter is quite likely to dominate in nearly all practical situations
Example JKR theory for the equilibrium area of adhesion between a cell and substrate
It is well known that cells tend to take on a more flattened shape as the substrate to which they
are attached becomes more strongly adhesive either by coating with a more attractive ligand or
by increasing the concentration of ligand bound to the substrate Conversely less adhesive cells
round up and become more spherical These observations can be explained with the help of a
simple scaling analysis on the assumptions of small deformation of a linear elastic cell
Let the cell be modeled as a homogeneous elastic sphere with elastic modulus E and
initial radius R (Fig 3113) It is then brought into contact with a surface to which it adheres
As the cell adheres it attains a lower energy state characterized by an adhesion energy per unit
area J Formation of a flat adhesion surface however requires deformation within the elastic
cell and an associated increase in the stored elastic energy In Chapter 31 we showed that the
stored elastic energy per unit volume can be written
UE asymp int τεdV asymp int 1 2 Eε 2dV (270)
Vc Vc
42
CHAPTER 21 CELL MEMBRANE MECHANICS AND ADHESION copyRD Kamm 4615
Strain inside the cell can be approximated as the displacement of the cell surface δ divided by the characteristic distance within the cell to which the deformations penetrate a distance that scales with the lateral extent of the contact region 2a so that ε prop δ a where it can easily be shown from the geometry that a 2 asymp 2δR so that ε prop δ R Combining and dropping all numerical constants we obtain the following scaling approximation
δUE prop E ( )δR
3 2 (271)R
An expression for the total energy of the system then can be written
U prop minusJa2 + Eε2a3 prop JδR + Eδ 5 2R1 2 (272) The equilibrium state corresponds to the value of δ having the minimum energy obtain from
partU prop minusJR + Eδ 3 2R1 2 (273)
partδ so that
23 1 3 ⎛ JR12 ⎞ ⎛ JR2 ⎞
δ prop ⎜ ⎟ and a prop ⎜ ⎟ (274)⎝ E ⎠ ⎝ E ⎠
The exact solution to this problem yields the result
⎡ ) 1 3 2 1( minusν 2 ⎤ 9πJR
a = ⎢ ⎥ (275)⎢ 2E ⎥⎣ ⎦
43
CHAPTER 21 CELL MEMBRANE MECHANICS AND ADHESION copyRD Kamm 4615
Elastic modulus E adhesion energy per unit area J
2a
Fig 3113 Experiments to determine the contact area of an iminobiotin functionalized agarosebead on a glass coverslip in water Top Schematic of adherent bead Bottom Results for a range of bead radii Solid line is a fit to the date which obeys the power law a prop R23 consistent with the prediction of JKR theory eqn(276) [Reproduced from (Moy Jiao et al 1999)] This can be compared to the result obtained from a more rigorous analysis
⎡9πJR 2(1minus ν 2 ) 13 ⎤
a = ⎢ ⎥ (276)2E⎢ ⎣ ⎥⎦
and to experimental data obtained from spherical beads made from a 4 agarose gel (Fig 3113)
Models for receptor-mediated adhesion
In Chapter x and in the preceding text we discussed the energetics of bond formation and release
as well as the effect of applied force in altering the energy landscape of the bonded pair and
thereby the rate constants for bond kinetics That analysis has obvious implications to the
44
CHAPTER 21 CELL MEMBRANE MECHANICS AND ADHESION copyRD Kamm 4615
adhesion of cells to substrates the surrounding extracellular matrix and other cells Here we
extend that analysis in the specific case of whole cell adhesion In doing so it will be important
to consider such factors as the distribution type and density of receptor-ligand bonds or
potential bonds and the elastic properties of the structures to which they are anchored On the
intracellular side this involves the series of couplings that link the receptor to the cell In the
simplest case this might simply be a link to the lipid bilayer if the receptor has no intracellular
connections More typically especially for couplings with a structural role it involves a series
of proteins ultimately linking the receptor to the cytoskeleton
The typical setting in vivo is one in which cells adhere to other cells or to the extracellular
matrix Adhesions are more easily probed however through in vitro experiments (described
below) where cell adhesion more often occurs to an artificial substrate mediated through one of
several extracellular proteins that are used to coat the surface Generally either collagen or
fibronectin is used Cells are often adhered to these substrates but to produce a more controlled
environment rigid beads are sometimes coated with the appropriate receptors so that one specific
receptor-ligand interaction can be probed While these systems are useful as models of certain
adhesion phenomena it is important to recognize in the interpretation of these experiments that
when bound to a rigid substrate or bead the binding proteins cannot freely diffuse as they would
in a more natural environment In particular the formation of focal adhesions would not occur in
bead-substrate experiments because the receptors would be constrained from aggregating
It is instructive to begin this discussion with a consideration of a single adhesion bond
for example one linking the actin matrix of the cytoskeleton to a β1 integrin and the integrin
receptor binding to the extracellular matrix beyond the cell membrane (Fig 3114) If the bond
is stressed as for example if the cell experiences a force relative to the ECM it will at first
stretch an amount dictated by the level of force in the bond and the stiffness of the complex
Each bond as well as each protein in the bond complex can be thought of as having a certain
stiffness giving rise to a picture in which several springs are considered connected in series
Forces acting on the adhesion complex are transmitted via this series of bonded proteins between
the CSK and the ECM producing local deformations and stresses in the corresponding matrices
that decay with distance from the adhesion site On the intracellular side these forces are
transmitted via a complex involving vinculin α-actinin paxillin and talin Attachment to the
extracellular matrix is mediated by an RGD sequence (in fibronectin for example) which in turn
has binding sites for collagen and fibrin If the force is sufficiently strong above a certain
threshold value F0 say and applied for a sufficiently long time the bond might be severed (deshy
couple) Typical values of this threshold force lie in the range of 10-100 pN (Evans and Ritchie
1997) but depend as well on the rate at which the force is increased Under more rapid
forcings the threshold is high compared to when the force is increased slowly This simply
45
CHAPTER 21 CELL MEMBRANE MECHANICS AND ADHESION copyRD Kamm 4615
reflects the fact that detachment is a stochastic process and that at any given level of force there
exists a finite probability of detachment and this probability increases with time
Fig 3114 One type of attachment linking the intracellular actin matrix to the extracellular matrix via an integrin complex that involves in addition vinculin α-actinin paxillin and talin (Reproduced from Lodish et al Molecular Cell Biolology 2000)
We need also to consider that in equilibrium a fraction Φ = K(1+K)-1 (where K is the
equilibrium constant) of the receptors will be bound at any given time and that the receptorshy
ligand complexes are continually cycling between the bound and unbound states characterized
by their respective rate constants
On a larger scale numerous adhesion sites typically act in parallel each contributing
some amount to the total adhesion force If the force transmitted by each single adhesion
complex is F and the density of adhesion sites (per unit membrane area) is NC then the stress
acting on the cell is the product F NC This gives a somewhat false impression however as it is
unlikely that each adhesion complex carries an equal force Put another way there exists a local
stress τ that can be thought of as the product of the average force per bond times the bond
density This stress is typically non-uniform In the adhesion of a cell to a flat substrate the
bonds near the periphery of the contact zone determine the strength of the cell against
detachment and when the cell is subjected to a detaching force the stresses are concentrated in
46
CHAPTER 21 CELL MEMBRANE MECHANICS AND ADHESION copyRD Kamm 4615
this peripheral region as depicted in Fig 3115 In the vicinity of the edge of adhesion several
factors will influence the stress distribution including the mechanical properties of the membrane
(in particular the bending stiffness KB) the receptor density the spring constants of the bond
and the bond strength
N
Region of adhesion
x1
Fig 3115 Schematic model of a cell membrane being detached from a substrate by application of a tension force N The membrane is free to the left of the dash-dot line and adherent to the right Forces and moments are transmitted through the membrane which adheres to the membrane through receptor-ligand bonds represented by a continuous distrubution p(x1)
To illustrate consider the following simple model for an adherent cell being peeled away
from its substrate by a force that generates a tension N in the membrane (Fig 3115)
Deformations in the membrane are described by eqn (223) where it can be shown that the
bending term dominates provided KbL2 gtN where L is the characteristic length in the x1 direction
(due to the small length scales involved) and the external membrane force (p in the membrane
equation) is now the non-uniform stress due to adhesion bonds As a simple first approximation
we take p = k(δminusδ0) with δ-δ0 being the amount of stretch in the receptor-ligand bond springs
and k an effective bond spring constant Recognizing that p approaches zero far from the edge
(see Fig 319) the membrane displacement and the spring displacement are related u3 = δ-δ0
Thus eqn (228) is written
⎛ part 4 u
KB⎜ 3
⎞ 4 ⎟ = NC F = NC ku
⎝ partx ⎠ 3 (277)1
This can be solved directly showing that the distance of separation between the cell membrane
and substrate grows in an exponential fashion with distance Even more simply a scaling
47
CHAPTER 21 CELL MEMBRANE MECHANICS AND ADHESION copyRD Kamm 4615
analysis of eqn (277) in which the term on the left is approximated by Kbu3w4 where w is the
characteristic distance over which u3 varies tells us that the stresses are concentrated in a region
of width
K
w prop B4 (278)
NC k
near the cell periphery Similarly we can estimate that the cell membrane will detach from the
substrate if N gt FoNCw where F0 is a measure of the force in a single bond at the time of bond
rupture and that the rate of peeling can be roughly approximated as the product of the
disassociation rate k -- (bondss) from eqn (265) and the distance between bonds (N -12C )
Although this provides some insight into how the peeling rate depends on the various factors it fails to capture the fact that the cell remains in an equilibrium attached state even for non-zero levels of tension reflecting that even under force a balance can exist between the rates of formation and rupture of receptor-ligand complexes (Ra Picart et al 1999)
It is also of interest to note that in the region near the edge of the attachment zone(x1=0
in Fig 3115) the membrane acts as a beam subjected to a moment due to the applied tension
This moment is balanced by a force couple due to tension in the adhesion complexes right
adjacent to the edge in combination with a compressive stress between the cell and substrate a
little further in In typical situations this compressive stress can approach levels as high as one
atmosphere and can act to effectively smooth the membrane and recruit new attachment sights While using these continuum descriptions it is important to keep in mind the true
discrete nature of the individual bonds represented in the model as a continuous adhesive
surface This is brought to light by a simple calculation in which the characteristic length over
which the applied tension is supported w is compared to the inter-receptor spacing N -12C
Using typical values for the parameters NC = 103 complexesμm-2 k = 10-5 to 10-6 Nm Kb = 1 to 2x10-18 Nm we find that w cong 01 to 03 μm and the inter-complex spacing N minus1 2
C cong 003 μm While it is reassuring to see that w is typically less than the inter-complex spacing the difference is small It is therefore not surprising that the actual process of cell peeling is stochastic in nature occurring in a sequence of more-or-less discrete steps with a velocity of peeling that varies widely from the mean
The interplay between receptor-ligand bonding and membrane stiffness also determines whether a cell will spread over a surface or peel away from it under a given tension Membrane bending stiffness acts to maintain the membrane and substrate within close proximity near the edge of contact (Fig 3115) Spreading can occur only if their separation distance is within the extended length of the receptor ligand bond over a distance comparable to the linear spacing
48
CHAPTER 21 CELL MEMBRANE MECHANICS AND ADHESION copyRD Kamm 4615
between neighboring bonds ( N minus1 2 C ) Under high tension the surfaces rapidly diverge and
spreading is prevented if the tension is sufficiently low receptor-ligand bonding can occur and spreading can occur
Measurements of adhesion
A variety of methods have been used to experimentally determine the strength of adhesion either
of individual receptor-ligand bonds or populations of bonds as in the case of entire cells
Whole cell experiments are more common and typically require less experimental
sophistication The drawback of course is that they provide only for estimates of average
properties and require certain assumptions regarding the distribution of cell-substrate adhesive
stress for interpretation to the level of a single bond Several of these methods are described
next
Centrifugal cell adhesion assays In this experiment cells are allowed to attached to a substrate
then are placed in a centrifuge rotating at speed ω positioned a distance r from the center of
rotation and oriented so that the net centrifugal force is acting to separate the cell from the
substrate Using the arrangement shown in Fig 3116 (right) the acceleration of the cells is 2ω r and the net force acting on a cell of volume Vc is F = (ρc minus ρf )ω 2rVc where the fluid and cell densities are ρf and ρc respectively
Interpreting these results we can make several different assumptions each leading to a different estimate for the maximum force experienced by the binding complex If we simply assume that all receptor-ligand complexes support an equal fraction of the total force F then the force per bond is f = F (πa 2NC ) where NC is the concentration of bond complexes However as the cell tears away from the substrate the edge bonds will break first since these experience the greatest level of force An alternative approach then is to assume that the adhesion complexes around the cell circumference support the entire load leading to the estimate f = F 2( πaN 1 2 ) recognizing that N1 2
C C is the average distance between bonds A somewhatmore accurate value for f might be obtained if we assume that all complexes within the distance w given by eqn (278) support the load In any of these cases once the centrifugal force exceeds some critical limit since the number of receptors supporting the load falls as the region of contact becomes smaller the force per bond increases and the cell will rapidly detach
Stochastic variability also needs to be taken into account however since even under a constant load any single bond has a finite probability of failure under a given level of force The equilibrium state of the cell then should be viewed as one in which the rate of bond formation equals the rate of bond breakage with increasing force having the effect of reducing the
49
CHAPTER 21 CELL MEMBRANE MECHANICS AND ADHESION copyRD Kamm 4615
probability that the bond will remain intact These effects can be addressed using the methods described in more detail in Chapter xx Parallel flow assay Another common method for assessing cell adhesion is to plate the cells onto one wall of a parallel flow chamber subject them to a fluid dynamic shear stress and observe at what flow rate the cells begin to release If we ignore flow details in the immediate vicinity of the cell the shear stress can be estimated from the solution for a fully developed (Poiseuille) velocity profile
3V ⎡ y2
⎛ ⎞ ⎤v(y) = ⎢1minus ⎥ (279)
2 ⎝ ⎠ ⎣ ⎢ h ⎥⎦
so that the shear stress acting on the cell is
⎛ dv ⎞ 6μV τw = μ⎜ ⎟ = (280)
⎝ dy ⎠ h y = minush
and the total force can be estimated as F asymp τw Ac where Ac is the surface area of the cell membrane exposed to the flow Consider as an example a flow of culture medium at a rate of 1 mls through a channel of height 01 cm and width 1 cm If the culture medium has a viscosity close to that of water (μ=001 dyns) the shear stress is obtained from eqn (280)
6 sdot (001dyn sdot s) sdot (1ml s) ( 01 sdot10cm2 )τ dyn cm 2w = = 6 = 06Pa
01cm This corresponds roughly with the level of shear stress experience by endothelial cells in the arterial system If we consider that the cell has a surface area with dimensions roughly 100 μm x 10 μm or about 103 μm2 then the total force acting on the cell is obtained by integrating the shear stress over the area of the apical membrane Assuming that the shear stress is uniform the force is simply the product of shear stress and surface area or about 1 nN in the present example Again interpretation of results from such experiments requires careful consideration of the distribution of forces among the individual adhesion complexes In this situation the cell is likely to peel from the upstream edge in much the same manner as occurs in the cell peeling experiment discussed earlier
50
CHAPTER 21 CELL MEMBRANE MECHANICS AND ADHESION copyRD Kamm 4615
Radial flow and spinning disk assays One disadvantage of the parallel flow assay is that all cells are subjected to essentially the same level of shear stress so the flow rate needs to be incrementally varied in order to determine the level of force required for detachment These two systems using an axisymmetric geometry circumvent this problem by producing an easily characterized radial variation in shear stress In the case of the radial flow assay fluid enters through a central channel and flows radially outward through the narrow gap between two circular plates From conservation of mass the mean flow velocity is given by
QV = (281)
2πrh and sufficiently far from the center (rgtgth) the velocity profile is parabolic as in the parallel flow assay and the shear stress is again governed by eqn (280) using (281) for V Q
ω
(Not to scale)
v
h h
Cell layer rc Ce l l layer rc
r r
Fig 3116 Schematic diagram showing the radial flow assay (left) and the spinning disk assay (right) In the radial flow assay shear stress attains a maximum value near the center and falls with increasing radius r whereas in the spinning disk system maximum shear stress is experienced at large r In the spinning disk assay cells are grown on one disk and the opposite disk is rotated at constant speed Provided the rate of rotation is sufficiently small that inertial effects can be neglected the velocity is purely in the circumferential direction and the profile is linear between the two plates so that the shear stress experienced by the cells can easily be computed as
ωr τw = μ (282)
h
51
CHAPTER 21 CELL MEMBRANE MECHANICS AND ADHESION copyRD Kamm 4615
In both of these cases as in the parallel flow assay the total force is obtained by integrating the shear stress over the cell surface and the distribution of force among the adhesion complexes is weighted toward those located near the upstream end of the cell This can also be seen by consideration of the torque exerted by shear stress on the cell that must be balanced by a nonshyuniform contact stress with the substrate that is greatest near the upstream end Single bond adhesion assays Two other assays provide a means of obtaining estimates for the strength of a single adhesion bond without the need for excessive interpretation These rely on an ability to isolate a small number of bonds or even a single bond and infer bond strength from the step-wise nature of the de-adhesion process associated with breakage of discrete bonds One of these methods employs the atomic force microscope coated with the ligand of an adhesion receptor as shown in Fig 3117 The probe tip is gradually brought up to the cell surface until one or more receptor-ligand bonds are formed When the probe tip is withdrawn it moves along a different trajectory on a force-displacement plot reflecting the forces of adhesion These forces are seen to jump between more or less discrete levels as the probe continues to be moved away from the cell with each jump corresponding to the breakage of a single bond (Fig 3117) Using this method the bond strength between integrin receptor and a variety of RGD-containing ligands was found to lie in the range of 30 to 100 pN (Lehenkari and Horton 1999)
Fig 3117 The strength of a single adhesion bond can be measured by bringing a functionalized tip of an AFM probe up to the cell allowing bonds to form then slowly withdrawing the probe Monitoring the differences between the force displacement curve between the forward and reverse motions the forces necessary to break a single receptor-ligand bond can be determined [Reproduced from (Lehenkari and Horton 1999)]
52
CHAPTER 21 CELL MEMBRANE MECHANICS AND ADHESION copyRD Kamm 4615
A second method is similar in that the discrete increments in force are monitored as individual receptor-ligand bonds are broken but the forces are measured by means of changes in the shape of a giant vesicle the membrane of which contains the ligands have been inserted In this case one vesicle is made effectively rigid due for example to a high surface tension A second vesicle containing the adhesion molecules is also drawn partially into a micropipet but is much more complaint than the first The two vesicles are then brought into point contact so that one or a small number of adhesions are formed As the pipets are moved apart the compliant vesicle distorts due to the force of adhesion which it can be shown is related to the change in dimension of the vesicle in the direction of the force thereby serving as a sensitive force transducer measuring forces in the range of single adhesion receptors or between 1 and 100 pN [Evans 1991 37]
(For specific examples of leukocyte rolling and attachment see Orsello or Chang amp Hammer)
[This process is initiated for example by local infection that causes the release of
chemotactic agents in addition to cytokines hellip
Models of this process draw upon many of the concepts discussed in this chapter ]
Transient cell adhesion
Concepts of transient adhesion and release are of particular importance in the case of leukocyte
rolling adhesion and transmigration across the endothelial layer of a blood vessel In addition
cell migration through extracellular matrix or along a substrate requires the ability of the cell to
both form and release adhesions
One problem that has received considerable attention is the interaction between an
adherent or rolling leukocyte and the adhesion receptors on the endothelium These studies are
complicated by the three-dimensional nature of the flow the compliance of the interacting
surfaces and receptor-ligand dynamics In a series of recent studies Hammer and co-workers
(Chang Tees et al 2000) have addressed several of these issues computing the viscous force
and torque acting upon a sphere near to planar wall from the mobility matrix (Hammer and Apte
1992) and using the ldquoBell modelrdquo of receptor binding (Bell 1978) but neglecting the effects of
cell deformation The Bell model relates the dissociation rate constant kr to the force in the
bond f the thermal energy kBT and a parameter with units of length that depends on the
reactivity of the molecule
kr = ko r exp(γf kBT ) (283)
53
CHAPTER 21 CELL MEMBRANE MECHANICS AND ADHESION copyRD Kamm 4615
A Monte Carlo method is employed at each time step in the calculation to determine bond
formation or breakage In these studies the nature of the leukocyte-endothelial interaction is
characterized as firm adhesion rolling adhesion bimodal adhesion or no adhesion and mapped
as a function of the two parameters of the Bell model in Fig 3 The boundaries of the rolling
adhesion regime are identified for a wall shear rate of 100 s-1 (dotted lines) or 30 and 400 s-1
(solid lines) Most literature values for the Bell model parameters for a variety of selectin
receptors (known to be instrumental in leukocyte rolling) correspond to the rolling adhesion
regime for typical shear rate of 100 s-1 An interesting but counterintuitive result from this study
was the observation that as the bond stiffness was increased from the value used in most
calculations (100 dyne cm-1) adhesiveness decreased which the authors attribute to reduced
deflection for a given level of force leading subsequently to more rapid dissociation
Fig 3118 The state diagram for a leukocyte interacting with an endothelial surface for shear rates ranging from 30 to 400 s-1 For low dissociation rates the leukocyte remains adherent to the surface (lower left) As either (γ) or ( ko
r ) [see Eqn (283) for definitions] is increased the cell first adheres firmly then rolls along the wall then completely detaches (upper right) Rolling adhesion is defined as the regime where rolling occurs over some part of the shear rate range between 30 and 400 s-1 Firm adhesion indicates that cells remain attached even at the highest shear rate no adhesion indicates that cells roll at a velocity gt 50 of the velocity of a non-adherent sphere In the bimodal regime cells are either adherent or non-adherent and do not exhibit rolling Dotted curves correspond to these same boundaries for a shear rate of 100 s-1 Reproduced from Chang et al (2000)
54
CHAPTER 21 CELL MEMBRANE MECHANICS AND ADHESION copyRD Kamm 4615
In another recent study using high-resolution video-microscopy (Schmidtke and Diamond
2000) it was demonstrated that a flowing neutrophil can attach to an adherent platelet via
adhesion molecules located in the tips of the microvilli and form long tethers averaging nearly 10
μm in length but ranging up to 40 μm at extensional rates of 6-40 μm s-1 for shear rates ranging
from 100-250 s-1 The mechanics of tether formation is itself a fascinating topic that is still under
intense investigation Readers interested in pursuing this work in more detail are referred to the
several papers (Hochmuth Shao et al 1996 Dai and Sheetz 1998 Dai and Sheetz 1999) that
identify a number of intriguing phenomena
55
CHAPTER 21 CELL MEMBRANE MECHANICS AND ADHESION copyRD Kamm 4615
317 Nomenclature Parameter Definition Units
R - receptor
L - ligand
C - receptor-ligand complex
G - Gibbs free energy Nm
N - membrane tension Nm
NR - total receptor density -3μm-2 in 2D or μm in 3D NL - total ligand density μm-2 in 2D or μm-3 in 3D N in 2D or μm-3μm-2
C - complex density in 3D NRf - free receptor density m-2 in 2D or m-3μ μ in 3D NLf - free ligand density -2 -3μm in 2D or μm in 3D d+ - forward diffusional rate constant 2 -1μm s-1 in 2D or 3 μm s in 3D d -1
- - reverse diffusional rate constant s r+ - forward reaction rate constant s-1
r- - reverse reaction rate constant s-1 D 2 -1
m - membrane diffusion coefficient μm s D - solution diffusion coefficient m2 s -1s μ Kb - bending stiffness Nm K 0 - equilibrium constant or affinity (zero force) M-1 in 3D and 2μm in 2D = k0
+ k0 minus
K - equilibrium constant M-1 in 3D and m2μ in 2D = k+kshy
k0 - association rate constant (zero force) M-1 s-1 in 3D or m-2 -1+ μ s in 2D
k0 - dissociation rate constant (zero force) s-1 minus
k - association rate constant M-1 s-1 in 3D or m-2 -1+ μ s in 2D
kminus - dissociation rate constant s-1 f - force per bond N F - total adhesion force N γ - empirical parameter μm r0 - distance over which energy minimum acts μm E0 - bond energy J k JK-1
B - Boltzmanns constant T - temperature K τ - bond lifetime s
56
CHAPTER 21 CELL MEMBRANE MECHANICS AND ADHESION copyRD Kamm 4615
τ0 - bond lifetime with zero force s σ - adhesion stress N μm-2 κ - spring constant for receptor-ligand bond N μm-1
57
CHAPTER 21 CELL MEMBRANE MECHANICS AND ADHESION copyRD Kamm 4615
References Bell G I (1978) Models for the specific adhesion of cells to cells Science 200 618-627 Caille N O Thoumine et al (2002) Contribution of the nucleus to the mechanical properties
of endothelial cells J Biomech 35(2) 177-87 Chang K C D F Tees et al (2000) The state diagram for cell adhesion under flow
leukocyte rolling and firm adhesion Proc Natl Acad Sci U S A 97(21) 11262-7 Dai J and M P Sheetz (1998) Cell membrane mechanics Methods Cell Biol 55 157-71 Dai J and M P Sheetz (1999) Membrane tether formation from blebbing cells Biophys J
77(6) 3363-70 Daily Elson et al (1984) Determination of the elastic area compressibility modulus of the
erythrocyte membrane Biophys J 45(4) 671-682 Evans E and K Ritchie (1997) Dynamic strength of molecular adhesion bonds Biophys J
72(4) 1541-55 Evans E A (1983) Bending elastic modulus of red blood cell membrane derived from
buckling instability in micropipet aspiration tests Biophys J 43(1) 27-30 Hammer D A and S M Apte (1992) Simulation of cell rolling and adhesion on surfaces in
shear flow general results and analysis of selectin-mediated neutrophil adhesion Biophys J 63(1) 35-57
Hardt S L (1979) Rates of diffusion controlled reactions in one two and three dimensions Biophysical Chemistry 10 239-243
Hochmuth F M J Y Shao et al (1996) Deformation and flow of membrane into tethers extracted from neuronal growth cones Biophys J 70(1) 358-69
Kucik D F E L Elson et al (1999) Weak dependence of mobility of membrane protein aggregates on aggregate size supports a viscous model of retardation of diffusion Biophys J 76(1 Pt 1) 314-22
Kusumi A Y Sako et al (1993) Confined lateral diffusion of membrane receptors as studied by single particle tracking (nanovid microscopy) Effects of calcium-induced differentiation in cultured epithelial cells Biophys J 65(5) 2021-40
Lehenkari P P and M A Horton (1999) Single integrin molecule adhesion forces in intact cells measured by atomic force microscopy Biochem Biophys Res Commun 259(3) 645-50
McCloskey M and M M Poo (1984) Protein diffusion in cell membranes some biological implications Int Rev Cytol 87 19-81
Meleard P Gerbeaud C Bardusco N Mitov MD and Ferdandex-Puente L (1998) Mechanical properties of model membranes studied from shape transformations of giant vesicles Biochimie 80 401-413
Moy V T Y Jiao et al (1999) Adhesion energy of receptor-mediated interaction measured by elastic deformation Biophys J 76(3) 1632-8
Ra H J C Picart et al (1999) Muscle cell peeling from micropatterned collagen direct probing of focal and molecular properties of matrix adhesion J Cell Sci 112 ( Pt 10) 1425-36
Saffman P G (1976) Bownian motion in thin sheets of viscous fluid Journal of Fluid Mechanics 73 593-602
Schmidtke D W and S L Diamond (2000) Direct observation of membrane tethers formed during neutrophil attachment to platelets or P-selectin under physiological flow J Cell Biol 149(3) 719-30
Sheets E D R Simson et al (1995) New insights into membrane dynamics from the analysis of cell surface interactions by physical methods Curr Opin Cell Biol 7(5) 707-14
58
CHAPTER 21 CELL MEMBRANE MECHANICS AND ADHESION copyRD Kamm 4615
Vink H and B R Duling (1996) Identification of distinct luminal domains for macromolecules erythrocytes and leukocytes within mammalian capillaries Circ Res 79(3) 581-9
Waugh R and E A Evans (1979) Thermoelasticity of red blood cell membrane Biophys J 26(1) 115-31
Zeman K H Engelhard et al (1990) Bending undulations and elasticity of the erythrocyte membrane effects of cell shape and membrane organization Eur Biophys J 18(4) 203shy19
Zhelev D V D Needham et al (1994) Role of the membrane cortex in neutrophil deformation in small pipets Biophys J 67(2) 696-705
59
MIT OpenCourseWarehttpocwmitedu
20310J 3053J 6024J 2797J Molecular Cellular and Tissue BiomechanicsSpring 2015
For information about citing these materials or our Terms of Use visit httpocwmiteduterms
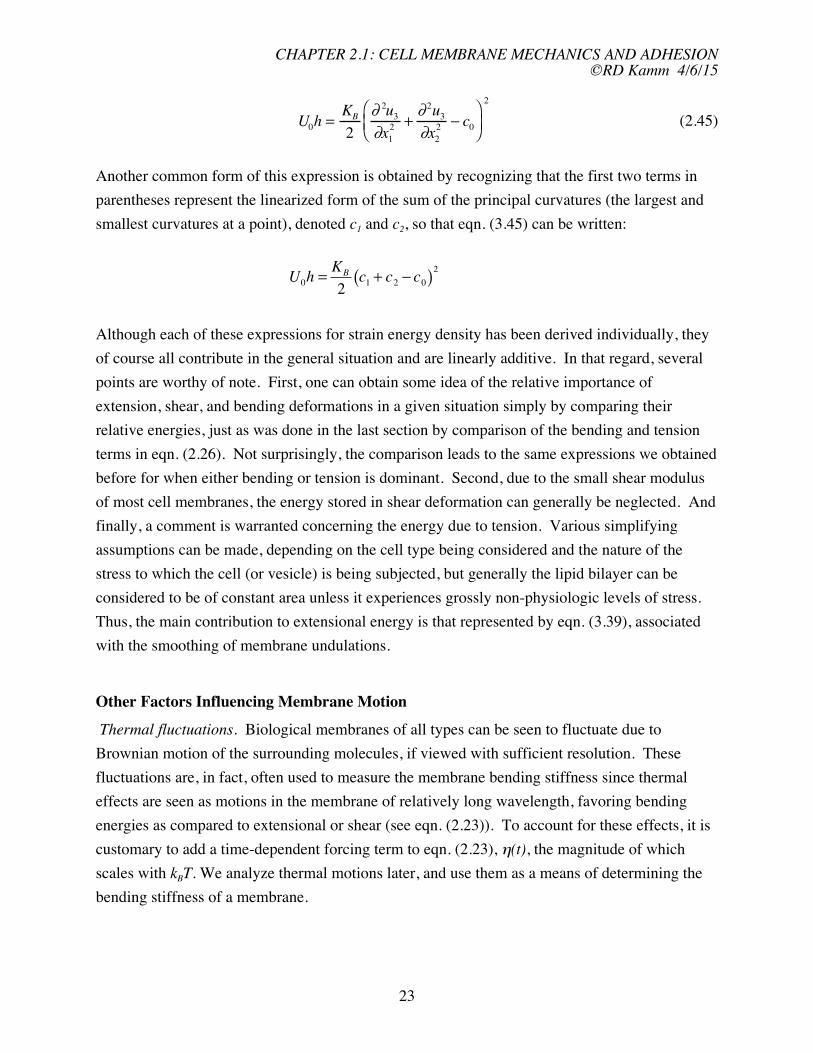
CHAPTER 21 CELL MEMBRANE MECHANICS AND ADHESION copyRD Kamm 4615
2 K ⎛ part 2 part 2 ⎞
U0 = B u⎜
3 uh 2 + 3
2 minus c0⎟ (245)2 ⎝ partx1 partx2 ⎠
Another common form of this expression is obtained by recognizing that the first two terms in
parentheses represent the linearized form of the sum of the principal curvatures (the largest and
smallest curvatures at a point) denoted c1 and c2 so that eqn (345) can be written
K
U2 B
0h = (c1 + c2 minus c0 ) 2
Although each of these expressions for strain energy density has been derived individually they
of course all contribute in the general situation and are linearly additive In that regard several
points are worthy of note First one can obtain some idea of the relative importance of
extension shear and bending deformations in a given situation simply by comparing their
relative energies just as was done in the last section by comparison of the bending and tension
terms in eqn (226) Not surprisingly the comparison leads to the same expressions we obtained
before for when either bending or tension is dominant Second due to the small shear modulus
of most cell membranes the energy stored in shear deformation can generally be neglected And
finally a comment is warranted concerning the energy due to tension Various simplifying
assumptions can be made depending on the cell type being considered and the nature of the
stress to which the cell (or vesicle) is being subjected but generally the lipid bilayer can be
considered to be of constant area unless it experiences grossly non-physiologic levels of stress
Thus the main contribution to extensional energy is that represented by eqn (339) associated
with the smoothing of membrane undulations
Other Factors Influencing Membrane Motion
Thermal fluctuations Biological membranes of all types can be seen to fluctuate due to
Brownian motion of the surrounding molecules if viewed with sufficient resolution These
fluctuations are in fact often used to measure the membrane bending stiffness since thermal
effects are seen as motions in the membrane of relatively long wavelength favoring bending
energies as compared to extensional or shear (see eqn (223)) To account for these effects it is
customary to add a time-dependent forcing term to eqn (223) η(t) the magnitude of which
scales with kBT We analyze thermal motions later and use them as a means of determining the
bending stiffness of a membrane
23
CHAPTER 21 CELL MEMBRANE MECHANICS AND ADHESION copyRD Kamm 4615
Damping due to external fluids When a membrane fluctuates in a direction perpendicular to its
plane velocities are induced in the surrounding fluids and due to the resulting shear stresses
energy is dissipated These motions are extremely complex to model precisely and depend on
both the nature of the surrounding medium (its rheological properties) and the bounding
geometry In lieu of a complete and rigorous analysis a local damping term is sometimes added
to the membrane force balance equation (eqn (223)) to approximate these effects Its form is
based on the presumption that externally induced velocities scale with the velocity of the wall
and that shear forces in the external fluid scale with the induced shear rates and velocities
Accordingly eqn (223) is modified by the addition of a term of the form μm partu3 partt where μμ is
the effective viscosity of the external fluid The equation that results from the addition of both
thermal forcing and external fluid viscosity is
partu ⎛ part 43 u 4
3 part u part+ 3 part 4u ⎞ part ⎛ ⎞ part ⎛ ⎞
B ⎜ 3 partu u
μm K 4 + 2 2 2 + 4 ⎟ minus ⎜ N3
⎟ minus part 1 ⎜ N
3
partt ⎝ x partx partx partx ⎠ partx ⎝ partx ⎠ partx ⎝ 2 ⎟ = p + η(t) (246)1 1 2 2 1 1 2 partx2 ⎠
An expression of similar form for a linear polymer is sometimes referred to as the Rouse
equation
314 Measurements of Membrane Elastic Parameters
Although the analogy has limitations it is useful at the onset to think of the cell as a fluid-filled
balloon or bag Just as in the case of a balloon the elastic properties of the membrane can be
determined by any experiment in which the membrane tension changes while its area is
measured In the simple example of a spherical balloon tension can be computed from the
inflating pressure and the measured radius the latter also yielding the surface area Ignoring for
now the thermal-induced fluctuations in a real cell membrane (ie assuming the cell to be at zero
temperature) the calculations become particularly simple Furthermore we will consider cells
for which the cytoplasm can be considered to fluid-like having no elasticity We return to
address both issues shortly
Osmotic swelling
Perhaps the simplest method to inflate the cell and measure the membrane elastic properties is to
cause the cell to swell by changing the osmolarity of the external fluid and simultaneously
monitoring the change in cell volume The change in transmembrane pressure mirrors the
24
CHAPTER 21 CELL MEMBRANE MECHANICS AND ADHESION copyRD Kamm 4615
change in osmotic pressure brought about by successive additions of a solute to which the
membrane is impermeable For ions and small molecules the osmotic pressure π can be
calculated from the vant Hoff equation
π = RT sum Ci (247)
i
where Ci are the molar concentrations of all solutes to which the membrane is impermeable For
larger molecules such as proteins their contribution to osmotic pressure is much larger than
indicted by this equation
Consider for example a spherical cell expanded osmotically so that the internal
hydrostatic pressure relative to external pressure is pc Microscopic examination yields a value
for the cell radius Rc Using these values in combination with Laplaces law [eqn (227)] gives
us the tension in this state and eqn (24) provides its relationship to the extensional modulus
p R Δ A
N = c c = Ke (248) 2 A0
The observed change in radius allows calculation of ΔA In practice identification of the reference state at zero pc is problematic due to the presence of thermal fluctuations but if Ke can be assumed constant for relatively small changes in area it is possible to extrapolate back to the zero-stress state from two measurements at elevated pc [Example red blood cell] Micropipet aspiration
One of the first methods used to measure the extensional modulus of the cell membrane involved
drawing a cell slightly deflated into a micropipet simultaneously monitoring the dimensions of
the cell and the pressure in the micropipet (Daily Elson et al 1984) Since on the time scale of
the experiment the volume of the cell could be assumed constant the shape change due to
aspiration of the cell causes increases in both internal pressure and surface tension both of which
are assumed spatially uniform Once the tension is large enough (or the temperature low
enough) to dampen the amplitude of any thermal fluctuations the cell can be treated assuming
that membrane extension is the dominant means by which the pressure drop across the
membrane is balanced [For further discussion on the thermal fluctuations and the relationship
between micropipet pressure and intracellular pressure see Daily and Evans and Rawicz Phys
Rev 1990 See also figure on p 199 of Boal Example the two regimes in membrane stiffness]
For the situation shown in Figxx the cell is drawn into the micropipet to the point at
which the portion of the cell external to the cell is spherical of radius Rc With the assumptions
25
CHAPTER 21 CELL MEMBRANE MECHANICS AND ADHESION copyRD Kamm 4615
stated above the (uniform) pressure within the cell can be related to it surface tension (assumed
uniform) and the radii of curvature of the main body of the cell Rc and the portion inside the
pipet a using Laplaces law [eqn (227)]
pc = 2N Rc = minus Δp + 2N a (249)
where pressures are referenced to the external ambient pressure Reorganizing to solve for
surface tension we obtain
ΔpN = (250)
⎛ 1 1 ⎞ 2⎜ minus ⎟
⎝ a Rc ⎠
The surface area corresponding to a given N is obtained from geometry summing the membrane
surface areas of the cylinder and hemisphere inside the micropipet and the truncated spherical
surface outside yielding for the areal strain the approximate expression
[(a R )2 (a R )3
Δ c minus c cong
]ΔLA
A 2a
Fig xx Micropipet aspiration of a neutrophil
This relationship between N and ΔAA can be used to calculate the area expansion modulus
Eh AK 0
e = = N 2 1( minus ν ) ΔA
where the expression involving Youngrsquos modulus assumes the membrane to be isotropic and
homogeneous The relationship could however be non-linear in that the value of Ke may vary
with the degree of area expansion a linear relationship between N and ΔA yields a constant value for Ke
It is important to note that neither of these approaches osmotic inflation or micropipet aspiration provides us with any information on the bending modulus To be precise bending
26
CHAPTER 21 CELL MEMBRANE MECHANICS AND ADHESION copyRD Kamm 4615
does play a role in the micropipet experiments but the effects are so small as to be negligible and are typically ignored That is not to say that bending is always negligible however as discussed next
Monitoring thermal fluctuations in the membrane
When a cell or lipid vesicle is observed floating free unattached to a substrate it can be seen to
exhibit time-dependent undulations as a result of collisions with the surrounding molecules
undergoing thermal motion In the case of a lipid vesicle with diameter in the range of 10
microns these undulations can be readily observed microscopically In smaller cells such as red
blood cells the motions can be inferred from the flickering phenomenon associated with the light
interference as the cell thickness changes (Zeman Engelhard et al 1990) Since the amplitude of
the membrane undulations depends on the stiffness of the membrane to bending and its surface
tension it is reasonable to expect that measures of this amplitude can be used to infer the
membrane elastic parameters In order to illustrate the method while avoiding some of the
algebraic complexity consider undulations in a flat membrane with significant bending stiffness
and a constant surface tension The relationship between the motion and the elastic properties
can be found by considering the total energy of the membrane obtained by summing the
energies per unit area from eqns (239) and (244) and integrating over the membrane surface
area Am
⎧ 2⎪ K ⎛ 2 2
part 2 u part 2 ⎡ 3 u ⎞
3 N ⎛ partu ⎞ ⎛ int 3 partu ⎞ ⎤⎫
B 3 ⎪
U0hdA = int ⎨ ⎜ 2 + 2 ⎟ + ⎢⎜ ⎟ + ⎜ ⎟ ⎥⎬dA (251) A ⎠ 2
m Am ⎪ 2 ⎝ partx1 partx2 ⎢⎝ partx1 ⎠ ⎝ partx2 ⎠ ⎥⎪ ⎩ ⎣ ⎦⎭
In writing the energy in this form we have omitted the contribution due to shear deformation
consistent with the fluid-like character of a pure lipid bilayer and have taken the surface tension
to be uniform during the deformation In this example membrane surface area changes only as a
result of fluctuations from the mean [u3(xxx2) = 0] configuration that is we now ignore the
contribution due to changes in intermolecular spacing and only consider changes in the area
projected onto the x1-x2 plane
It is convenient to use the method of Fourier transforms to represent the undulations of a
membrane normal to the x1-x2 plane which in two-dimensions leads to [see also class notes on
bending of cytoskeletal filaments alternatively use Fourier series representation]
A A
u3 (x) = u3 (x1 x2 ) = 2 intexp(iq sdot x)b(q)dq =
2 int exp(iq 4 1x1)exp(iq2 x2 )b(q1q2 )dq1dq
π 4π 2
(252)
27
CHAPTER 21 CELL MEMBRANE MECHANICS AND ADHESION copyRD Kamm 4615
where qα = 2π λα is the wavenumber of the particular mode and b(q) is the continuous analogue of the discrete coefficients that multiply each mode in a Fourier series representation
Here the algebra gets complicated so only the results of the analysis will be presented however
those wishing to see a more complete derivation should see (Boal Mechanics of the Cell
Cambridge University Press 2002) Introducing eqn (352) into (351) yields
1 ⎛ A ⎞2
int U q 40hdA = ⎜ ⎟ int (
KB + Nq2 )b(q)b(q)dq (253)2 2 ⎝ π ⎠
where b(q) is the complex conjugate of b(q) Now we invoke a previous result that at equilibrium energy is equally distributed among the various modes and that each mode has an
average energy of kBT2 Taking the ensemble average of eqn (353) and equating the energy of
each mode represented in the result to kBT2 (by the equipartition theorem) leads to
k Aq)b q) = BT
b( (K q4 2 (254)
B + Nq
This is a useful result in itself demonstrating that all modes tend to be suppressed as temperature
falls or as bending stiffness or surface tension rise In addition it shows the tendency for higher
modes to be of smaller amplitude But this equation has further value in that it can be used to
obtain a direct expression for the change in apparent area of a membrane as tension increases
Consider the true surface area of a membrane A represented as the sum of its projected
area and the additional area associated with thermally-induced undulations
⎡ 1 ⎛ 2⎤u ⎞ 2 part ⎛ partu ⎞
A = int dx + ⎢ 3 3 2
int ⎜ ⎢⎝ partx 2 ⎟ + ⎜
⎠ ⎝ partx 2 ⎟ ⎥dx (255)⎠ ⎥
⎣ 1 2 ⎦
Isolating the term representing the area reduction due to thermal fluctuations expressing u3 in
terms of its Fourier transform and taking the ensemble average of the result leads to
1 ⎛ A ⎞2
A minus int dx = ⎜ ⎟ int q 2 b(q)b(q) dq (256)2 ⎝ 2π ⎠
Combing eqn (254) from above with this expression yields
28
CHAPTER 21 CELL MEMBRANE MECHANICS AND ADHESION copyRD Kamm 4615
A minus int dx
kBT dq kBT dq2
= A 8π 2 int =
N int (257)
+ KBq 2 8π 2 N + KBq 2
where in writing the last term we have introduced the relations dq = dq2dθ 2 and int dθ = 2π By a simple substitution z = q2 + (N KB )the integral can be evaluated We do so however
between specified limits on the assumptions that the range of possible wavenumbers is restricted
by the size of the membrane on one hand (q = (πA12)) and the distance between individual lipid molecules on the other (q = πlm) Integrating between these limits results in
⎛ π 2 N ⎞
int dx 2 +A ⎜ ⎟ minus k T l K
= B ln⎜ m B ⎟ (258)A 8πKB ⎜ π 2 N ⎟
⎜ + ⎟ ⎝ A KB ⎠
If we use the area reduction at zero tension as a reference and increase the area from that
condition by progressively increasing membrane tension as in a typical experiment we finally
obtain an expression relating the change in area to the change in tension
⎛ NA ⎞ 1 + A dx A dx ΔA minus int minus ⎟ k ⎛ NA
int k ⎜equiv minus = BT π 2 K
ln ⎜ B T ⎞ 2 ⎟ cong B ln 1 + (259)
Nl ⎜ ⎟A A A 8π KB ⎜ 1 + m ⎟ 8π KB ⎝ π 2 KB ⎠ N = 0 N ⎜ 2 ⎟⎝ π K ⎠ B
where we have used the assumption supported by typical values found from different
experiments that (Nl2 m ) (π 2KB ) ltlt 1
You should recall that this solution was obtained on the assumption that the actual area
of the membrane remained constant and that the reduction in projected or apparent area resulted
from the undulations being progressively smoothed out Once the undulations are eliminated
the only means by which the projected area of the membrane can further increase is by an
increase in the inter-molecular spacing ndash an increase in the actual membrane area When this
occurs we expect to see a transition to the behavior discussed at the beginning of this chapter a
result expressed as
29
CHAPTER 21 CELL MEMBRANE MECHANICS AND ADHESION copyRD Kamm 4615
Fig yy Plots of tension vs normalized surface area for lipid vesicles of different composition Evans amp Rawicz 1990
ΔA N = (260)
A Ke
Thus we have two limiting predictions one for low tensions eqn (259) and another for high
tensions eqn (260) and the transition from one behavior to the other should occur when the
two expressions for ΔAA are of the same magnitude This is supported by experiment (Fig yy) and the results in the two regimes provide a means for estimating the two moduli Ke and KB
30
CHAPTER 21 CELL MEMBRANE MECHANICS AND ADHESION copyRD Kamm 4615
Before leaving this analysis there is one further result that is useful to state although the
derivation is again somewhat involved Once we have the solution for the undulations at a
given level of tension and for given membrane properties the ensemble average displacement
normal to the plane of the membrane can also be computed with the result
⎞
u2 k ⎛= BT NA
3 ln ⎜ 1+ ⎟ (261)4πN ⎝ π 2KB ⎠
Again this supports our intuition that the undulations will be suppressed at low temperature or
high tension And in the limit as N rarr 0 a binomial expansion of the natural log term shows that
the effect of tension drops out and the magnitude of the undulations varies inversely with the
bending stiffness
315 Membrane Fluid Mechanics
Early studies of protein diffusion notably the work of Saffman (Saffman 1976)
examined protein diffusion using an approach akin to that of Einstein in three dimensional space
thereby reducing the problem to one of solving for the mobility b in the equation for diffusivity
D = kBTb (262)
Calculation of the mobility is influenced by the viscous drag on the portion of the protein within
the membrane but also on to the intra- and extracellular domains as well The solution of
interest here is the one applicable in the limit of small μeμm where μe and μm are the external and
membrane viscosities respectively leading to
kBT ⎛ hμm⎞
D = ⎜minusγ + ln ⎟ (263)4πμmh ⎝ aμ e ⎠
where h is the membrane thickness a the radius of the protein (assumed cylindrical) and γ is
Eulers constant (=05772) Membrane viscosity has been estimated from lipid diffusion to be
~2 poise (McCloskey and Poo 1984) When finite mobility is achieved as a result of a finite
domain as for example a circle of radius R the corresponding result is
31
CHAPTER 21 CELL MEMBRANE MECHANICS AND ADHESION copyRD Kamm 4615
k ⎛ 1 D = BT R ⎞ log minus (264)
4πμh ⎝ a 2 ⎠
While this represents a useful point of departure measurements of lateral diffusion in a
membrane have demonstrated a more complex behavior Fluorescence recovery after
photobleaching (FRAP) has enabled the direct tracking of membrane proteins labeled with
fluorescent antibodies More recently single particle tracking methods have been developed
using colloidal gold or a fluorescent particle in conjunction with digital microscopy as well as
controlled movements using microbeads manipulated by an optical trap
From experiments such as these a new picture has emerged While the lateral diffusion
of lipids and a small fraction of trans-membrane proteins satisfy the general form of Saffmans
predictions the predicted diffusivity is greater than that observed experimentally and agrees with
experiments only when a membrane viscosity of 100 poise is used This might be due to the
presence of other proteins in the membrane (Kucik Elson et al 1999) Experiments also show
that many proteins appear to diffuse freely only in small domains typically measuring from 200shy
600 nm remaining confined to these domains for periods on the order of tens of seconds To
explain this behavior the membrane skeleton fence model was proposed (Kusumi Sako et al
1993) in which a membrane-associated matrix constrains the movement of proteins outside of
the domains defined by the matrix filaments Diffusion beyond these barrier filaments can occur
either as a result of random thermal motions of the transmembrane protein matrix filaments or
both or by transient breaks in the filaments Confinement of proteins may play an important role
in rapid and selective signaling Rapid directed motion of membrane-associated proteins has
also been observed and is likely due to active transport by an intracellular actin- or microtubule-
based motor
316 Cell Adhesion
This section deals with how cells adhere to their surroundings and through these sites of
adhesion how they interact with the external world We begin by summarizing the different
types of adhesion their functions and the molecules involved Next we provide a brief
description of the adhesion complexes found in cells and the role of each type Then the
theories that provide a quantitative description of adhesion between single receptor-ligand pairs
are reviewed in the context of the material presented in Chapter xx including the role of thermal
fluctuations Through these theoretical models both the static and dynamic states of adhesion
can be explored for single molecule pairs then for adherent cells Next we develop the different
32
CHAPTER 21 CELL MEMBRANE MECHANICS AND ADHESION copyRD Kamm 4615
approaches that are used to study the adhesion of cells based either on thermodynamics or
mechanics Methods for the measurement of adhesion strength are described providing
estimates for the force that a cell can exert on its surroundings Various examples will be
presented but the adherence of leukocytes to the endothelium and the role of adhesion in cell
migration will receive special attention
Functions of adhesion
Adhesion has been found to be an essential process necessary for a variety of fundamental
cellular functions
bull Structural integrity Adhesion helps to maintain the overall structural integrity of the
tissue in muscle for example it provides the means of force transmission from the cells
to the surrounding matrix to allow contraction In non-contractile cells it still provides
the needed mechanical coupling to the surrounding tissue necessary for a variety of
cellular functions
bull External sensing Adhesion provides a means by which the cell can sense and
subsequently respond to its surroundings Forces transmitted directly to the cell
membrane or to the cytoskeleton via transmembrane proteins may trigger a variety of
biochemical reactions within the cell as we shall see later in Chapter 33
bull Migration Cell-matrix adhesion is an essential element in cell migration a cell propels
its way through tissue or along a surface through a process involving adhesion
contraction and release also described in Chapter 33
bull Regulation of transport Sites of cell-cell adhesion are often important in the regulation
of transport across a cell layer such as in the case of an epithelium or endothelium
bull Communication Sites of mechanical coupling often provide a means of cell-cell
communication as in the case of gap junctions which offer a pathway for the diffusion
of ions and small molecules between adjacent cells
Adhesion molecules
Cells adhere to their surroundings or to an artificial substrate via a wide variety of different
proteins that can be classified into five major families integrins selectins cadherins
immunoglobulins and transmembrane proteoglycans (Table 1) In terms of their mechanism of
attachment to other cells or the external matrix these can be classified as either homophillic ndash
binding to like molecules heterophillic ndash binding to unlike molecules or those that bind to other
cells through an extracellular linker molecule
Integrins one of the largest class of adhesion molecules are primarily used to attach cells
to the extracellular matrix or the basal lamina but are also present in some cell-cell adhesion
33
CHAPTER 21 CELL MEMBRANE MECHANICS AND ADHESION copyRD Kamm 4615
complexes They typically bind to the matrix via the RGD amino acid sequence (arginine
glycine aspartic acid) but can also contain other binding motifs Integrins are heterodimers in
that they always contain an α and a β subunit with the different isoforms determining the specific ligand to which the integrin binds Two specific types of adhesion focal adhesions and hemidesmosomes often contain integrins and the attachments they make can at times be stable but at other times transient so as for example to mediate cell migration The force of adhesion of a single integrin-ligand bond has been measured using atomic force microscopy and found to be in the range of 30-100 pN (Lehenkari and Horton 1999) with a relatively low binding affinity in the range of K ~ 10-6
D to 10-8 molliter By comparison typical cell-surface receptors bind with an affinity in the range of 10-9 to 10-11 molliter Integrins also play an important role in signaling since extracellular integrin binding is known to influence cytoskeletal morphology as well as the state of cell differentiation Adhesion molecules in the selectin family also tend to form transient bonds and are important in leukocyte adhesion and extravasation the migration of the leukocyte through the endothelium and into the tissue Consequently they tend to be found in cells of the circulation and are present both in leukocytes and endothelial cells and are instrumental in adhesion between these two cell-types during leukocyte rolling
Family Location andor Ligands Comments
function recognized
integrins focal adhesions (E) fibronectin relatively low
hemi-desmosomes collagen laminin affinities
leukocyte immunoglobulins (KD~ 10-6-10-8
(spreading) (I) actin filaments molliter)
adhesion primarily
cell-matrix adhesion
but also in some
cell-cell adhesions
selectins circulating cells and carbohydrates require Ca2+
endothelial cells
rolling adhesion
Ig superfamily important in integrins
(immunoglobulin) immune response homophillic
cadherens adherens junctions (E) homophillic require Ca2+
desmosomes (I) actin
34
CHAPTER 21 CELL MEMBRANE MECHANICS AND ADHESION copyRD Kamm 4615
filaments
intermediate
filaments
transmembrane fibroblasts (E) collagen bind various
proteoglycans epithelial cells fibronectin growth factors
(I) actin such as FGF
filaments
heterophillic
Table 1 Cell adhesion molecules and their characteristics
While both integrin and selectin binding is mediated by Ca2+ adhesion via the
immunoglobulin (Ig) superfamily of proteins is Ca2+ independent Some of the most prominent members of this family are the N-CAMs (Neural cell adhesion molecules) and ICAMs (Intracellular cell adhesion molecules) These tend to undergo homophillic bonding but some also bind to members of the integrin family
Cadherens are often expressed in the same cells as the selectins but form much stronger bonds and therefore play an important role in maintaining cell integrity Because of these attributes cadherens are the primary adhesion proteins in desmosomes and adherens junctions the major structural contacts cells form with other cells or the basil lamina These also form homophillic bonds by a Ca2+ dependent mechanism and mediate selective bonding between adjacent cells Cadherens are relatively short as compared to other adhesion molecules being
about 700-750 amino acid residues in length
Types of adhesion complexes
Cells have developed a variety of specialized adhesion complexes each utilizing one or more of
the adhesion molecules of Table 1 and each serving a specific purpose Typically the cell-cell or
cell-surface spacing is in the range of 10-20 nm but this is highly variable ranging from less than
1 nm when controlling transport to over 100 nm in regions where tight control is unnecessary
Below we describe the different types of junctions and where important for function their
mechanical characteristics
Gap junctions Cells need to communicate with their neighbors for a variety of reasons For
example cardiac myocytes transmit signals from cell to cell in order to maintain a synchronous
35
CHAPTER 21 CELL MEMBRANE MECHANICS AND ADHESION copyRD Kamm 4615
wave of contraction This is typically accomplished by providing a pathway for ions and small
signaling molecules between cells called gap junctions (Fig 3110) These minute channels are
typically comprised of a collection of six connexin proteins that cluster together in cylindrical
fashion forming a minute channel that passes molecules and ions less than about 1200 to 2000
MW (15-2 nm) Transport through these channels is regulated and their permeability drops in
the presence of high Ca2+ concentration as when a cell membrane is ruptured or with low pH
Cyclic AMP acting as a second messenger can be exchanged between cells therefore gap
junctions provide a metabolic linkage between neighboring cells and provide a means by which
hormonal stimulation of just one cell can be transmitted to others
Adherens junctions Adherens junctions are belt-like structures that can be though of as the
structural weld that holds two cells together (Fig 3110) Because of their structural role
these junctions formed by homophilic bonding between proteins in the cadheren family are
anchored securely again via the adaptor proteins α β γ-catenin to the cytoskeleton
Desmosomes and Hemidesmosomes If the adherens junctions are the continuous welds between
cells desmosomes are the spot welds Again these serve primarily a structural purpose
joining two neighboring cells via a complex consisting of a dense plaque on the intracellular
sides of both cells extending 15-20 nm into the cell and consisting of a variety of proteins that
attach to keratin filaments part of the intermediate filament network Hemidesmosomes have
similar intracellular structure but attach instead to the basal laminae Based on their different
extracellular attachment sites desmosomes typically link to other cells via cadherens whereas
hemidesmosomes adhere via a type of integrin Both are commonly found in epithelial cells
36
CHAPTER 21 CELL MEMBRANE MECHANICS AND ADHESION copyRD Kamm 4615
Fig 3110 Schematic showing the different types of cell junctions present in an epithelial cell as found in the small intestine Tight junctions near the apical surface essentially prevent the passage of all molecules The spot desmosomes and adherens junctions provide for cell-cell anchoring and the hemidesmosomes for anchoring to the basal lamina Gap junctions provide a means for communication between neighboring cells [Reproduced from Lodish et al Molecular Cell Biology 2000]
Junction type Function Extracellular or Intracellular
adjacent cell attachment
attachment
Adherens structural cell-cell or cell- ECM proteins or actin filaments
matrix cadherins in
adjacent cell
Desmosome structural cell-cell cadherin intermediate
filaments
Hemidesmosome structural cell-matrix basal lamina via intermediate
integrins filaments
Focal adhesions structural cell-matrix ECM proteins actin filaments
via integrins
Tight junction regulate transport between homophillic binding between the
cells and along cell transmembrane proteins occludin or
37
CHAPTER 21 CELL MEMBRANE MECHANICS AND ADHESION copyRD Kamm 4615
membrane claudins
Gap junctions cell-cell communication channels formed by connexin
via ion and small molecule subunits
exchange
Table 2 Adhesion complexes
Focal adhesions A second means by which cells attach to the extracellular matrix is through
focal adhesions These serve a similar function to the hemidesmosomes and share a common
linkage via integrins to the ECM but are attached on the intracellular side instead to the actin
filaments of the cytoskeleton Actin filaments converge at the site of focal adhesions forming
stress fibers strong actin bundles that attach to the β-subunit of the integrins via adapter
proteins such as actinin vinculin and talin Focal adhesions are instrumental in cell migration
and for this purpose need to be easily formed and disrupted as the cell moves forward Release
or de-adhesion of cells is often mediated by a class of peptides called dis-integrins that
competitively bind to the RGD site used by integrins to attach to a variety of matrix molecules
Tight junctions Control of transport is generally mediated by tight junctions that form an
intricate network of seams between two cells (Fig 3111) As their name implies these are the
tightest of the cell-cell junctions and the gaps they leave are often small enough to exclude even
the smallest ions and molecules Formed by homophillic binding between the transmembrane
proteins occluding and claudins tight junctions allow epithelial cells to perform their critical role
in transepithelial transport and provide for maintenance of differences in concentration between
the apical and basal surfaces of these cells Since occludins are not capable of forming rigid
structural bonds with the cytoskeleton they are most often associated in a junctional complex
with adherens junctions or desmosomes that fulfill the structural needs of attachment
38
CHAPTER 21 CELL MEMBRANE MECHANICS AND ADHESION copyRD Kamm 4615
Fig 3111 Tight junctions in an epithelial cell shown schematically (a) in a freeze fracture replica (b) and in a transmission electron micrograph (c) [Reproduced from Alberts et al 1994]
Fig 3112 Two types of bond that attach a cell to the extracellular matrix by means of clusters of integrins On the extracellular side integrins bind to the matrix proteins fibronectin and laminin Inside the cell they attach to the cytoskeleton via adaptor proteins to either actin filaments (focal adhesions) or intermediate filaments (hemidesmosomes) [Reproduced from Lodish et al Molecular Cell Biolology 2000]
Non-specific binding
Cells can adhere to their surroundings by either non-specific or receptor-ligand (specific)
bonding Though both mechanisms are likely active in most situations as we will see receptorshy
39
CHAPTER 21 CELL MEMBRANE MECHANICS AND ADHESION copyRD Kamm 4615
ligand bonding is the stronger of the two by a considerable margin and is therefore the most
relevant biologically In situations for which either the receptors or their ligands are not present
however such as might be the case in certain in vitro experiments non-specific binding can be
important as well
There are essentially three major forms of non-specific attractions to consider
bull Van der Waals ndash These attractive forces arise due to charge interactions in polar
molecules They tend to dominate among the non-specific mechanisms at
intermediate distances around 20-25 nm [see Boal]
bull Electrostatic ndash These interactions can be either attractive or repulsive depending
on the sign of the surface charges and are particularly important during the
approach of two cells since the glycocalyx has a high negative charge density
bull Steric ndash These forces arise due to the steric exclusion of two molecules as they are
brought into close contact In the case of cell-cell interactions steric repulsion is
due to the compression of the two glycocalyx layers and the tendency to resist
compression resulting from osmotic effects and the elasticity of the layer Steric
forces tend to dominate for small separation distances lt 10 nm
In combination these effects combine to produce a net attractive force per unit area of
about 100 Pa at a separation distance of about 25 nm
Adhesion by means of receptor-ligand binding
We can use the analysis of Chapter xx to estimate the strength of a receptor-ligand bond and
based on typical values for bond density calculate the corresponding strength of adhesion
between two cells or between a cell and a surface Recall that the application of force to a
receptor-ligand bond modifies the dissociation rate constant for the binding reaction This effect
can be modeled in several ways but the result obtained by Bell ((Bell 1978)) suggests the
following exponential form for the dissociation rate
0 ⎛ γf ⎞ 0 ⎛ γσ ⎞ kminus = kminus exp⎜ ⎟ = kminus exp⎜ ⎟ (265)
⎝ kBT ⎠ ⎝ NC kBT ⎠
where k0minus is the unforced dissociation rate constant γ is a factor with the units of length that
corresponds roughly with the distance separating the bonded pair at equilibrium NC is the concentration of bonded complex and σ is the average bond force per unit area To determine
40
CHAPTER 21 CELL MEMBRANE MECHANICS AND ADHESION copyRD Kamm 4615
the rate of change of the concentration of bonded pairs one must solve the following rate equation describing the competition between bond formation (first term) and destruction (second term)
dNC ⎛ γσ ⎞
cong k+ (NR minus NC )(NL ) minus kminus NC = k+ (N minus )( 0R NC NL ) minus kminus NC exp⎜ ⎟ (266)
dt ⎝ NC kBT ⎠
where NR and NL are the concentrations of receptors and ligands respectively and we have
assumed that NCltltNL and that all bonds are stressed equally At equilibrium dNCdt=0 and if
the force applied to detach the cell (equal to the average bond stress σ) is increased
incrementally from zero NC will progressively fall to a new equilibrium value At sufficiently
high levels of force however increasing σ further eventually gives rise to a situation in which equilibrium can no longer be achieved through a reduction in NC At that point NC tends toward zero and the cell separates from the surface to which it was attached It can be shown that this
occurs when (Bell 1978)
k 0
α c exp(α + c + 1) = N
k 0 L (267)minus
σ
where α minγ c equiv and σmin is the minimum stress needed to cause detachment For a wide
NRkBT
range of conditions eqn (267) has the approximate solution
⎛ k0 + ⎞
α c cong 07 ln L (268)⎜ 0 N ⎟⎝ kminus ⎠
so that the critical stress for detachment can be expressed as
N 0
σ cong 07 C kBT ⎛ k ⎞ ln⎜
+ min N ⎟ (269)
γ ⎝ k0 L minus ⎠
where NC is determined from setting eqn (266) to zero under these critical conditions
Thermodynamic approach to cell adhesion
Although we focus here on the mechanical aspects of cell adhesion this process can also be
viewed from a thermodynamic perspective In this approach adhesion is considered in terms of
the change in energy specifically the Gibbs free energy G associated with all the individual
receptor-ligand interactions as well as the various non-specific forces of attraction or repulsion
The adhesion of a cell to a given surface then can be viewed as an equilibrium state determined
41
CHAPTER 21 CELL MEMBRANE MECHANICS AND ADHESION copyRD Kamm 4615
by minimization of the free energy If in undergoing a transition from a free state to an adherent
state the system represented by the cell and surface experiences a reduction in free energy ie
ΔGlt0 then adhesion will occur and the equilibrium state of adhesion will be determined by that with the minimum in free energy or the largest value of -ΔG While this approach ignores
many of the subtleties of the interactions and like the analysis above assumes that all receptorshy
ligand interactions are identical from an energetic point of view it is useful in providing some
simple insights as seen in the next two examples
Example Comparison of specific and non-specific adhesive forces Non-specific bonding due
to the combined effects of van der Waals electrostatic and steric forces result in an attractive
stress of approximately 100 Pa Receptor-ligand bonding give rise to forces that can be
estimated from the change in free energy f ~ to 4x10⁻⁴ dynbond = 9x10-11 to 4x10⁻⁹ ΔGr~9x10⁻⁶ Nbond where f is the force required to break the bond and r is a measure of the distance the bond stretches before it breaks Using a typical density of the receptor-ligand complex NC of ~1012-1015 bondsm2 gives a total bond stress of N 1
C x f ~ 9 x 10 to 4x10⁶ Pa The above kinetic approach to estimating bond strength [eqn (269)] gives a value approximately half of that from this equilibrium approach In either case however the conclusion remains the same non-specific binding can under certain circumstances be important since it is comparable to the lowest estimates of receptor-ligand-mediated bond strength but not surprisingly the latter is quite likely to dominate in nearly all practical situations
Example JKR theory for the equilibrium area of adhesion between a cell and substrate
It is well known that cells tend to take on a more flattened shape as the substrate to which they
are attached becomes more strongly adhesive either by coating with a more attractive ligand or
by increasing the concentration of ligand bound to the substrate Conversely less adhesive cells
round up and become more spherical These observations can be explained with the help of a
simple scaling analysis on the assumptions of small deformation of a linear elastic cell
Let the cell be modeled as a homogeneous elastic sphere with elastic modulus E and
initial radius R (Fig 3113) It is then brought into contact with a surface to which it adheres
As the cell adheres it attains a lower energy state characterized by an adhesion energy per unit
area J Formation of a flat adhesion surface however requires deformation within the elastic
cell and an associated increase in the stored elastic energy In Chapter 31 we showed that the
stored elastic energy per unit volume can be written
UE asymp int τεdV asymp int 1 2 Eε 2dV (270)
Vc Vc
42
CHAPTER 21 CELL MEMBRANE MECHANICS AND ADHESION copyRD Kamm 4615
Strain inside the cell can be approximated as the displacement of the cell surface δ divided by the characteristic distance within the cell to which the deformations penetrate a distance that scales with the lateral extent of the contact region 2a so that ε prop δ a where it can easily be shown from the geometry that a 2 asymp 2δR so that ε prop δ R Combining and dropping all numerical constants we obtain the following scaling approximation
δUE prop E ( )δR
3 2 (271)R
An expression for the total energy of the system then can be written
U prop minusJa2 + Eε2a3 prop JδR + Eδ 5 2R1 2 (272) The equilibrium state corresponds to the value of δ having the minimum energy obtain from
partU prop minusJR + Eδ 3 2R1 2 (273)
partδ so that
23 1 3 ⎛ JR12 ⎞ ⎛ JR2 ⎞
δ prop ⎜ ⎟ and a prop ⎜ ⎟ (274)⎝ E ⎠ ⎝ E ⎠
The exact solution to this problem yields the result
⎡ ) 1 3 2 1( minusν 2 ⎤ 9πJR
a = ⎢ ⎥ (275)⎢ 2E ⎥⎣ ⎦
43
CHAPTER 21 CELL MEMBRANE MECHANICS AND ADHESION copyRD Kamm 4615
Elastic modulus E adhesion energy per unit area J
2a
Fig 3113 Experiments to determine the contact area of an iminobiotin functionalized agarosebead on a glass coverslip in water Top Schematic of adherent bead Bottom Results for a range of bead radii Solid line is a fit to the date which obeys the power law a prop R23 consistent with the prediction of JKR theory eqn(276) [Reproduced from (Moy Jiao et al 1999)] This can be compared to the result obtained from a more rigorous analysis
⎡9πJR 2(1minus ν 2 ) 13 ⎤
a = ⎢ ⎥ (276)2E⎢ ⎣ ⎥⎦
and to experimental data obtained from spherical beads made from a 4 agarose gel (Fig 3113)
Models for receptor-mediated adhesion
In Chapter x and in the preceding text we discussed the energetics of bond formation and release
as well as the effect of applied force in altering the energy landscape of the bonded pair and
thereby the rate constants for bond kinetics That analysis has obvious implications to the
44
CHAPTER 21 CELL MEMBRANE MECHANICS AND ADHESION copyRD Kamm 4615
adhesion of cells to substrates the surrounding extracellular matrix and other cells Here we
extend that analysis in the specific case of whole cell adhesion In doing so it will be important
to consider such factors as the distribution type and density of receptor-ligand bonds or
potential bonds and the elastic properties of the structures to which they are anchored On the
intracellular side this involves the series of couplings that link the receptor to the cell In the
simplest case this might simply be a link to the lipid bilayer if the receptor has no intracellular
connections More typically especially for couplings with a structural role it involves a series
of proteins ultimately linking the receptor to the cytoskeleton
The typical setting in vivo is one in which cells adhere to other cells or to the extracellular
matrix Adhesions are more easily probed however through in vitro experiments (described
below) where cell adhesion more often occurs to an artificial substrate mediated through one of
several extracellular proteins that are used to coat the surface Generally either collagen or
fibronectin is used Cells are often adhered to these substrates but to produce a more controlled
environment rigid beads are sometimes coated with the appropriate receptors so that one specific
receptor-ligand interaction can be probed While these systems are useful as models of certain
adhesion phenomena it is important to recognize in the interpretation of these experiments that
when bound to a rigid substrate or bead the binding proteins cannot freely diffuse as they would
in a more natural environment In particular the formation of focal adhesions would not occur in
bead-substrate experiments because the receptors would be constrained from aggregating
It is instructive to begin this discussion with a consideration of a single adhesion bond
for example one linking the actin matrix of the cytoskeleton to a β1 integrin and the integrin
receptor binding to the extracellular matrix beyond the cell membrane (Fig 3114) If the bond
is stressed as for example if the cell experiences a force relative to the ECM it will at first
stretch an amount dictated by the level of force in the bond and the stiffness of the complex
Each bond as well as each protein in the bond complex can be thought of as having a certain
stiffness giving rise to a picture in which several springs are considered connected in series
Forces acting on the adhesion complex are transmitted via this series of bonded proteins between
the CSK and the ECM producing local deformations and stresses in the corresponding matrices
that decay with distance from the adhesion site On the intracellular side these forces are
transmitted via a complex involving vinculin α-actinin paxillin and talin Attachment to the
extracellular matrix is mediated by an RGD sequence (in fibronectin for example) which in turn
has binding sites for collagen and fibrin If the force is sufficiently strong above a certain
threshold value F0 say and applied for a sufficiently long time the bond might be severed (deshy
couple) Typical values of this threshold force lie in the range of 10-100 pN (Evans and Ritchie
1997) but depend as well on the rate at which the force is increased Under more rapid
forcings the threshold is high compared to when the force is increased slowly This simply
45
CHAPTER 21 CELL MEMBRANE MECHANICS AND ADHESION copyRD Kamm 4615
reflects the fact that detachment is a stochastic process and that at any given level of force there
exists a finite probability of detachment and this probability increases with time
Fig 3114 One type of attachment linking the intracellular actin matrix to the extracellular matrix via an integrin complex that involves in addition vinculin α-actinin paxillin and talin (Reproduced from Lodish et al Molecular Cell Biolology 2000)
We need also to consider that in equilibrium a fraction Φ = K(1+K)-1 (where K is the
equilibrium constant) of the receptors will be bound at any given time and that the receptorshy
ligand complexes are continually cycling between the bound and unbound states characterized
by their respective rate constants
On a larger scale numerous adhesion sites typically act in parallel each contributing
some amount to the total adhesion force If the force transmitted by each single adhesion
complex is F and the density of adhesion sites (per unit membrane area) is NC then the stress
acting on the cell is the product F NC This gives a somewhat false impression however as it is
unlikely that each adhesion complex carries an equal force Put another way there exists a local
stress τ that can be thought of as the product of the average force per bond times the bond
density This stress is typically non-uniform In the adhesion of a cell to a flat substrate the
bonds near the periphery of the contact zone determine the strength of the cell against
detachment and when the cell is subjected to a detaching force the stresses are concentrated in
46
CHAPTER 21 CELL MEMBRANE MECHANICS AND ADHESION copyRD Kamm 4615
this peripheral region as depicted in Fig 3115 In the vicinity of the edge of adhesion several
factors will influence the stress distribution including the mechanical properties of the membrane
(in particular the bending stiffness KB) the receptor density the spring constants of the bond
and the bond strength
N
Region of adhesion
x1
Fig 3115 Schematic model of a cell membrane being detached from a substrate by application of a tension force N The membrane is free to the left of the dash-dot line and adherent to the right Forces and moments are transmitted through the membrane which adheres to the membrane through receptor-ligand bonds represented by a continuous distrubution p(x1)
To illustrate consider the following simple model for an adherent cell being peeled away
from its substrate by a force that generates a tension N in the membrane (Fig 3115)
Deformations in the membrane are described by eqn (223) where it can be shown that the
bending term dominates provided KbL2 gtN where L is the characteristic length in the x1 direction
(due to the small length scales involved) and the external membrane force (p in the membrane
equation) is now the non-uniform stress due to adhesion bonds As a simple first approximation
we take p = k(δminusδ0) with δ-δ0 being the amount of stretch in the receptor-ligand bond springs
and k an effective bond spring constant Recognizing that p approaches zero far from the edge
(see Fig 319) the membrane displacement and the spring displacement are related u3 = δ-δ0
Thus eqn (228) is written
⎛ part 4 u
KB⎜ 3
⎞ 4 ⎟ = NC F = NC ku
⎝ partx ⎠ 3 (277)1
This can be solved directly showing that the distance of separation between the cell membrane
and substrate grows in an exponential fashion with distance Even more simply a scaling
47
CHAPTER 21 CELL MEMBRANE MECHANICS AND ADHESION copyRD Kamm 4615
analysis of eqn (277) in which the term on the left is approximated by Kbu3w4 where w is the
characteristic distance over which u3 varies tells us that the stresses are concentrated in a region
of width
K
w prop B4 (278)
NC k
near the cell periphery Similarly we can estimate that the cell membrane will detach from the
substrate if N gt FoNCw where F0 is a measure of the force in a single bond at the time of bond
rupture and that the rate of peeling can be roughly approximated as the product of the
disassociation rate k -- (bondss) from eqn (265) and the distance between bonds (N -12C )
Although this provides some insight into how the peeling rate depends on the various factors it fails to capture the fact that the cell remains in an equilibrium attached state even for non-zero levels of tension reflecting that even under force a balance can exist between the rates of formation and rupture of receptor-ligand complexes (Ra Picart et al 1999)
It is also of interest to note that in the region near the edge of the attachment zone(x1=0
in Fig 3115) the membrane acts as a beam subjected to a moment due to the applied tension
This moment is balanced by a force couple due to tension in the adhesion complexes right
adjacent to the edge in combination with a compressive stress between the cell and substrate a
little further in In typical situations this compressive stress can approach levels as high as one
atmosphere and can act to effectively smooth the membrane and recruit new attachment sights While using these continuum descriptions it is important to keep in mind the true
discrete nature of the individual bonds represented in the model as a continuous adhesive
surface This is brought to light by a simple calculation in which the characteristic length over
which the applied tension is supported w is compared to the inter-receptor spacing N -12C
Using typical values for the parameters NC = 103 complexesμm-2 k = 10-5 to 10-6 Nm Kb = 1 to 2x10-18 Nm we find that w cong 01 to 03 μm and the inter-complex spacing N minus1 2
C cong 003 μm While it is reassuring to see that w is typically less than the inter-complex spacing the difference is small It is therefore not surprising that the actual process of cell peeling is stochastic in nature occurring in a sequence of more-or-less discrete steps with a velocity of peeling that varies widely from the mean
The interplay between receptor-ligand bonding and membrane stiffness also determines whether a cell will spread over a surface or peel away from it under a given tension Membrane bending stiffness acts to maintain the membrane and substrate within close proximity near the edge of contact (Fig 3115) Spreading can occur only if their separation distance is within the extended length of the receptor ligand bond over a distance comparable to the linear spacing
48
CHAPTER 21 CELL MEMBRANE MECHANICS AND ADHESION copyRD Kamm 4615
between neighboring bonds ( N minus1 2 C ) Under high tension the surfaces rapidly diverge and
spreading is prevented if the tension is sufficiently low receptor-ligand bonding can occur and spreading can occur
Measurements of adhesion
A variety of methods have been used to experimentally determine the strength of adhesion either
of individual receptor-ligand bonds or populations of bonds as in the case of entire cells
Whole cell experiments are more common and typically require less experimental
sophistication The drawback of course is that they provide only for estimates of average
properties and require certain assumptions regarding the distribution of cell-substrate adhesive
stress for interpretation to the level of a single bond Several of these methods are described
next
Centrifugal cell adhesion assays In this experiment cells are allowed to attached to a substrate
then are placed in a centrifuge rotating at speed ω positioned a distance r from the center of
rotation and oriented so that the net centrifugal force is acting to separate the cell from the
substrate Using the arrangement shown in Fig 3116 (right) the acceleration of the cells is 2ω r and the net force acting on a cell of volume Vc is F = (ρc minus ρf )ω 2rVc where the fluid and cell densities are ρf and ρc respectively
Interpreting these results we can make several different assumptions each leading to a different estimate for the maximum force experienced by the binding complex If we simply assume that all receptor-ligand complexes support an equal fraction of the total force F then the force per bond is f = F (πa 2NC ) where NC is the concentration of bond complexes However as the cell tears away from the substrate the edge bonds will break first since these experience the greatest level of force An alternative approach then is to assume that the adhesion complexes around the cell circumference support the entire load leading to the estimate f = F 2( πaN 1 2 ) recognizing that N1 2
C C is the average distance between bonds A somewhatmore accurate value for f might be obtained if we assume that all complexes within the distance w given by eqn (278) support the load In any of these cases once the centrifugal force exceeds some critical limit since the number of receptors supporting the load falls as the region of contact becomes smaller the force per bond increases and the cell will rapidly detach
Stochastic variability also needs to be taken into account however since even under a constant load any single bond has a finite probability of failure under a given level of force The equilibrium state of the cell then should be viewed as one in which the rate of bond formation equals the rate of bond breakage with increasing force having the effect of reducing the
49
CHAPTER 21 CELL MEMBRANE MECHANICS AND ADHESION copyRD Kamm 4615
probability that the bond will remain intact These effects can be addressed using the methods described in more detail in Chapter xx Parallel flow assay Another common method for assessing cell adhesion is to plate the cells onto one wall of a parallel flow chamber subject them to a fluid dynamic shear stress and observe at what flow rate the cells begin to release If we ignore flow details in the immediate vicinity of the cell the shear stress can be estimated from the solution for a fully developed (Poiseuille) velocity profile
3V ⎡ y2
⎛ ⎞ ⎤v(y) = ⎢1minus ⎥ (279)
2 ⎝ ⎠ ⎣ ⎢ h ⎥⎦
so that the shear stress acting on the cell is
⎛ dv ⎞ 6μV τw = μ⎜ ⎟ = (280)
⎝ dy ⎠ h y = minush
and the total force can be estimated as F asymp τw Ac where Ac is the surface area of the cell membrane exposed to the flow Consider as an example a flow of culture medium at a rate of 1 mls through a channel of height 01 cm and width 1 cm If the culture medium has a viscosity close to that of water (μ=001 dyns) the shear stress is obtained from eqn (280)
6 sdot (001dyn sdot s) sdot (1ml s) ( 01 sdot10cm2 )τ dyn cm 2w = = 6 = 06Pa
01cm This corresponds roughly with the level of shear stress experience by endothelial cells in the arterial system If we consider that the cell has a surface area with dimensions roughly 100 μm x 10 μm or about 103 μm2 then the total force acting on the cell is obtained by integrating the shear stress over the area of the apical membrane Assuming that the shear stress is uniform the force is simply the product of shear stress and surface area or about 1 nN in the present example Again interpretation of results from such experiments requires careful consideration of the distribution of forces among the individual adhesion complexes In this situation the cell is likely to peel from the upstream edge in much the same manner as occurs in the cell peeling experiment discussed earlier
50
CHAPTER 21 CELL MEMBRANE MECHANICS AND ADHESION copyRD Kamm 4615
Radial flow and spinning disk assays One disadvantage of the parallel flow assay is that all cells are subjected to essentially the same level of shear stress so the flow rate needs to be incrementally varied in order to determine the level of force required for detachment These two systems using an axisymmetric geometry circumvent this problem by producing an easily characterized radial variation in shear stress In the case of the radial flow assay fluid enters through a central channel and flows radially outward through the narrow gap between two circular plates From conservation of mass the mean flow velocity is given by
QV = (281)
2πrh and sufficiently far from the center (rgtgth) the velocity profile is parabolic as in the parallel flow assay and the shear stress is again governed by eqn (280) using (281) for V Q
ω
(Not to scale)
v
h h
Cell layer rc Ce l l layer rc
r r
Fig 3116 Schematic diagram showing the radial flow assay (left) and the spinning disk assay (right) In the radial flow assay shear stress attains a maximum value near the center and falls with increasing radius r whereas in the spinning disk system maximum shear stress is experienced at large r In the spinning disk assay cells are grown on one disk and the opposite disk is rotated at constant speed Provided the rate of rotation is sufficiently small that inertial effects can be neglected the velocity is purely in the circumferential direction and the profile is linear between the two plates so that the shear stress experienced by the cells can easily be computed as
ωr τw = μ (282)
h
51
CHAPTER 21 CELL MEMBRANE MECHANICS AND ADHESION copyRD Kamm 4615
In both of these cases as in the parallel flow assay the total force is obtained by integrating the shear stress over the cell surface and the distribution of force among the adhesion complexes is weighted toward those located near the upstream end of the cell This can also be seen by consideration of the torque exerted by shear stress on the cell that must be balanced by a nonshyuniform contact stress with the substrate that is greatest near the upstream end Single bond adhesion assays Two other assays provide a means of obtaining estimates for the strength of a single adhesion bond without the need for excessive interpretation These rely on an ability to isolate a small number of bonds or even a single bond and infer bond strength from the step-wise nature of the de-adhesion process associated with breakage of discrete bonds One of these methods employs the atomic force microscope coated with the ligand of an adhesion receptor as shown in Fig 3117 The probe tip is gradually brought up to the cell surface until one or more receptor-ligand bonds are formed When the probe tip is withdrawn it moves along a different trajectory on a force-displacement plot reflecting the forces of adhesion These forces are seen to jump between more or less discrete levels as the probe continues to be moved away from the cell with each jump corresponding to the breakage of a single bond (Fig 3117) Using this method the bond strength between integrin receptor and a variety of RGD-containing ligands was found to lie in the range of 30 to 100 pN (Lehenkari and Horton 1999)
Fig 3117 The strength of a single adhesion bond can be measured by bringing a functionalized tip of an AFM probe up to the cell allowing bonds to form then slowly withdrawing the probe Monitoring the differences between the force displacement curve between the forward and reverse motions the forces necessary to break a single receptor-ligand bond can be determined [Reproduced from (Lehenkari and Horton 1999)]
52
CHAPTER 21 CELL MEMBRANE MECHANICS AND ADHESION copyRD Kamm 4615
A second method is similar in that the discrete increments in force are monitored as individual receptor-ligand bonds are broken but the forces are measured by means of changes in the shape of a giant vesicle the membrane of which contains the ligands have been inserted In this case one vesicle is made effectively rigid due for example to a high surface tension A second vesicle containing the adhesion molecules is also drawn partially into a micropipet but is much more complaint than the first The two vesicles are then brought into point contact so that one or a small number of adhesions are formed As the pipets are moved apart the compliant vesicle distorts due to the force of adhesion which it can be shown is related to the change in dimension of the vesicle in the direction of the force thereby serving as a sensitive force transducer measuring forces in the range of single adhesion receptors or between 1 and 100 pN [Evans 1991 37]
(For specific examples of leukocyte rolling and attachment see Orsello or Chang amp Hammer)
[This process is initiated for example by local infection that causes the release of
chemotactic agents in addition to cytokines hellip
Models of this process draw upon many of the concepts discussed in this chapter ]
Transient cell adhesion
Concepts of transient adhesion and release are of particular importance in the case of leukocyte
rolling adhesion and transmigration across the endothelial layer of a blood vessel In addition
cell migration through extracellular matrix or along a substrate requires the ability of the cell to
both form and release adhesions
One problem that has received considerable attention is the interaction between an
adherent or rolling leukocyte and the adhesion receptors on the endothelium These studies are
complicated by the three-dimensional nature of the flow the compliance of the interacting
surfaces and receptor-ligand dynamics In a series of recent studies Hammer and co-workers
(Chang Tees et al 2000) have addressed several of these issues computing the viscous force
and torque acting upon a sphere near to planar wall from the mobility matrix (Hammer and Apte
1992) and using the ldquoBell modelrdquo of receptor binding (Bell 1978) but neglecting the effects of
cell deformation The Bell model relates the dissociation rate constant kr to the force in the
bond f the thermal energy kBT and a parameter with units of length that depends on the
reactivity of the molecule
kr = ko r exp(γf kBT ) (283)
53
CHAPTER 21 CELL MEMBRANE MECHANICS AND ADHESION copyRD Kamm 4615
A Monte Carlo method is employed at each time step in the calculation to determine bond
formation or breakage In these studies the nature of the leukocyte-endothelial interaction is
characterized as firm adhesion rolling adhesion bimodal adhesion or no adhesion and mapped
as a function of the two parameters of the Bell model in Fig 3 The boundaries of the rolling
adhesion regime are identified for a wall shear rate of 100 s-1 (dotted lines) or 30 and 400 s-1
(solid lines) Most literature values for the Bell model parameters for a variety of selectin
receptors (known to be instrumental in leukocyte rolling) correspond to the rolling adhesion
regime for typical shear rate of 100 s-1 An interesting but counterintuitive result from this study
was the observation that as the bond stiffness was increased from the value used in most
calculations (100 dyne cm-1) adhesiveness decreased which the authors attribute to reduced
deflection for a given level of force leading subsequently to more rapid dissociation
Fig 3118 The state diagram for a leukocyte interacting with an endothelial surface for shear rates ranging from 30 to 400 s-1 For low dissociation rates the leukocyte remains adherent to the surface (lower left) As either (γ) or ( ko
r ) [see Eqn (283) for definitions] is increased the cell first adheres firmly then rolls along the wall then completely detaches (upper right) Rolling adhesion is defined as the regime where rolling occurs over some part of the shear rate range between 30 and 400 s-1 Firm adhesion indicates that cells remain attached even at the highest shear rate no adhesion indicates that cells roll at a velocity gt 50 of the velocity of a non-adherent sphere In the bimodal regime cells are either adherent or non-adherent and do not exhibit rolling Dotted curves correspond to these same boundaries for a shear rate of 100 s-1 Reproduced from Chang et al (2000)
54
CHAPTER 21 CELL MEMBRANE MECHANICS AND ADHESION copyRD Kamm 4615
In another recent study using high-resolution video-microscopy (Schmidtke and Diamond
2000) it was demonstrated that a flowing neutrophil can attach to an adherent platelet via
adhesion molecules located in the tips of the microvilli and form long tethers averaging nearly 10
μm in length but ranging up to 40 μm at extensional rates of 6-40 μm s-1 for shear rates ranging
from 100-250 s-1 The mechanics of tether formation is itself a fascinating topic that is still under
intense investigation Readers interested in pursuing this work in more detail are referred to the
several papers (Hochmuth Shao et al 1996 Dai and Sheetz 1998 Dai and Sheetz 1999) that
identify a number of intriguing phenomena
55
CHAPTER 21 CELL MEMBRANE MECHANICS AND ADHESION copyRD Kamm 4615
317 Nomenclature Parameter Definition Units
R - receptor
L - ligand
C - receptor-ligand complex
G - Gibbs free energy Nm
N - membrane tension Nm
NR - total receptor density -3μm-2 in 2D or μm in 3D NL - total ligand density μm-2 in 2D or μm-3 in 3D N in 2D or μm-3μm-2
C - complex density in 3D NRf - free receptor density m-2 in 2D or m-3μ μ in 3D NLf - free ligand density -2 -3μm in 2D or μm in 3D d+ - forward diffusional rate constant 2 -1μm s-1 in 2D or 3 μm s in 3D d -1
- - reverse diffusional rate constant s r+ - forward reaction rate constant s-1
r- - reverse reaction rate constant s-1 D 2 -1
m - membrane diffusion coefficient μm s D - solution diffusion coefficient m2 s -1s μ Kb - bending stiffness Nm K 0 - equilibrium constant or affinity (zero force) M-1 in 3D and 2μm in 2D = k0
+ k0 minus
K - equilibrium constant M-1 in 3D and m2μ in 2D = k+kshy
k0 - association rate constant (zero force) M-1 s-1 in 3D or m-2 -1+ μ s in 2D
k0 - dissociation rate constant (zero force) s-1 minus
k - association rate constant M-1 s-1 in 3D or m-2 -1+ μ s in 2D
kminus - dissociation rate constant s-1 f - force per bond N F - total adhesion force N γ - empirical parameter μm r0 - distance over which energy minimum acts μm E0 - bond energy J k JK-1
B - Boltzmanns constant T - temperature K τ - bond lifetime s
56
CHAPTER 21 CELL MEMBRANE MECHANICS AND ADHESION copyRD Kamm 4615
τ0 - bond lifetime with zero force s σ - adhesion stress N μm-2 κ - spring constant for receptor-ligand bond N μm-1
57
CHAPTER 21 CELL MEMBRANE MECHANICS AND ADHESION copyRD Kamm 4615
References Bell G I (1978) Models for the specific adhesion of cells to cells Science 200 618-627 Caille N O Thoumine et al (2002) Contribution of the nucleus to the mechanical properties
of endothelial cells J Biomech 35(2) 177-87 Chang K C D F Tees et al (2000) The state diagram for cell adhesion under flow
leukocyte rolling and firm adhesion Proc Natl Acad Sci U S A 97(21) 11262-7 Dai J and M P Sheetz (1998) Cell membrane mechanics Methods Cell Biol 55 157-71 Dai J and M P Sheetz (1999) Membrane tether formation from blebbing cells Biophys J
77(6) 3363-70 Daily Elson et al (1984) Determination of the elastic area compressibility modulus of the
erythrocyte membrane Biophys J 45(4) 671-682 Evans E and K Ritchie (1997) Dynamic strength of molecular adhesion bonds Biophys J
72(4) 1541-55 Evans E A (1983) Bending elastic modulus of red blood cell membrane derived from
buckling instability in micropipet aspiration tests Biophys J 43(1) 27-30 Hammer D A and S M Apte (1992) Simulation of cell rolling and adhesion on surfaces in
shear flow general results and analysis of selectin-mediated neutrophil adhesion Biophys J 63(1) 35-57
Hardt S L (1979) Rates of diffusion controlled reactions in one two and three dimensions Biophysical Chemistry 10 239-243
Hochmuth F M J Y Shao et al (1996) Deformation and flow of membrane into tethers extracted from neuronal growth cones Biophys J 70(1) 358-69
Kucik D F E L Elson et al (1999) Weak dependence of mobility of membrane protein aggregates on aggregate size supports a viscous model of retardation of diffusion Biophys J 76(1 Pt 1) 314-22
Kusumi A Y Sako et al (1993) Confined lateral diffusion of membrane receptors as studied by single particle tracking (nanovid microscopy) Effects of calcium-induced differentiation in cultured epithelial cells Biophys J 65(5) 2021-40
Lehenkari P P and M A Horton (1999) Single integrin molecule adhesion forces in intact cells measured by atomic force microscopy Biochem Biophys Res Commun 259(3) 645-50
McCloskey M and M M Poo (1984) Protein diffusion in cell membranes some biological implications Int Rev Cytol 87 19-81
Meleard P Gerbeaud C Bardusco N Mitov MD and Ferdandex-Puente L (1998) Mechanical properties of model membranes studied from shape transformations of giant vesicles Biochimie 80 401-413
Moy V T Y Jiao et al (1999) Adhesion energy of receptor-mediated interaction measured by elastic deformation Biophys J 76(3) 1632-8
Ra H J C Picart et al (1999) Muscle cell peeling from micropatterned collagen direct probing of focal and molecular properties of matrix adhesion J Cell Sci 112 ( Pt 10) 1425-36
Saffman P G (1976) Bownian motion in thin sheets of viscous fluid Journal of Fluid Mechanics 73 593-602
Schmidtke D W and S L Diamond (2000) Direct observation of membrane tethers formed during neutrophil attachment to platelets or P-selectin under physiological flow J Cell Biol 149(3) 719-30
Sheets E D R Simson et al (1995) New insights into membrane dynamics from the analysis of cell surface interactions by physical methods Curr Opin Cell Biol 7(5) 707-14
58
CHAPTER 21 CELL MEMBRANE MECHANICS AND ADHESION copyRD Kamm 4615
Vink H and B R Duling (1996) Identification of distinct luminal domains for macromolecules erythrocytes and leukocytes within mammalian capillaries Circ Res 79(3) 581-9
Waugh R and E A Evans (1979) Thermoelasticity of red blood cell membrane Biophys J 26(1) 115-31
Zeman K H Engelhard et al (1990) Bending undulations and elasticity of the erythrocyte membrane effects of cell shape and membrane organization Eur Biophys J 18(4) 203shy19
Zhelev D V D Needham et al (1994) Role of the membrane cortex in neutrophil deformation in small pipets Biophys J 67(2) 696-705
59
MIT OpenCourseWarehttpocwmitedu
20310J 3053J 6024J 2797J Molecular Cellular and Tissue BiomechanicsSpring 2015
For information about citing these materials or our Terms of Use visit httpocwmiteduterms
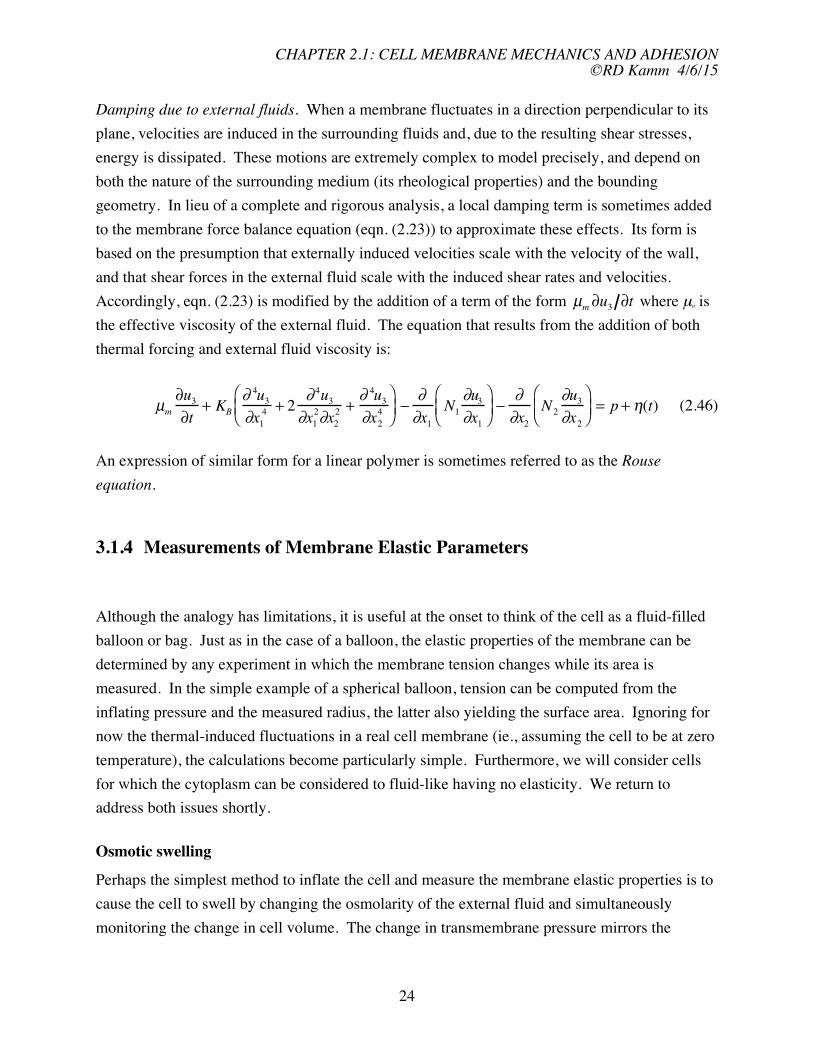
CHAPTER 21 CELL MEMBRANE MECHANICS AND ADHESION copyRD Kamm 4615
Fig yy Plots of tension vs normalized surface area for lipid vesicles of different composition Evans amp Rawicz 1990
ΔA N = (260)
A Ke
Thus we have two limiting predictions one for low tensions eqn (259) and another for high
tensions eqn (260) and the transition from one behavior to the other should occur when the
two expressions for ΔAA are of the same magnitude This is supported by experiment (Fig yy) and the results in the two regimes provide a means for estimating the two moduli Ke and KB
30
CHAPTER 21 CELL MEMBRANE MECHANICS AND ADHESION copyRD Kamm 4615
Before leaving this analysis there is one further result that is useful to state although the
derivation is again somewhat involved Once we have the solution for the undulations at a
given level of tension and for given membrane properties the ensemble average displacement
normal to the plane of the membrane can also be computed with the result
⎞
u2 k ⎛= BT NA
3 ln ⎜ 1+ ⎟ (261)4πN ⎝ π 2KB ⎠
Again this supports our intuition that the undulations will be suppressed at low temperature or
high tension And in the limit as N rarr 0 a binomial expansion of the natural log term shows that
the effect of tension drops out and the magnitude of the undulations varies inversely with the
bending stiffness
315 Membrane Fluid Mechanics
Early studies of protein diffusion notably the work of Saffman (Saffman 1976)
examined protein diffusion using an approach akin to that of Einstein in three dimensional space
thereby reducing the problem to one of solving for the mobility b in the equation for diffusivity
D = kBTb (262)
Calculation of the mobility is influenced by the viscous drag on the portion of the protein within
the membrane but also on to the intra- and extracellular domains as well The solution of
interest here is the one applicable in the limit of small μeμm where μe and μm are the external and
membrane viscosities respectively leading to
kBT ⎛ hμm⎞
D = ⎜minusγ + ln ⎟ (263)4πμmh ⎝ aμ e ⎠
where h is the membrane thickness a the radius of the protein (assumed cylindrical) and γ is
Eulers constant (=05772) Membrane viscosity has been estimated from lipid diffusion to be
~2 poise (McCloskey and Poo 1984) When finite mobility is achieved as a result of a finite
domain as for example a circle of radius R the corresponding result is
31
CHAPTER 21 CELL MEMBRANE MECHANICS AND ADHESION copyRD Kamm 4615
k ⎛ 1 D = BT R ⎞ log minus (264)
4πμh ⎝ a 2 ⎠
While this represents a useful point of departure measurements of lateral diffusion in a
membrane have demonstrated a more complex behavior Fluorescence recovery after
photobleaching (FRAP) has enabled the direct tracking of membrane proteins labeled with
fluorescent antibodies More recently single particle tracking methods have been developed
using colloidal gold or a fluorescent particle in conjunction with digital microscopy as well as
controlled movements using microbeads manipulated by an optical trap
From experiments such as these a new picture has emerged While the lateral diffusion
of lipids and a small fraction of trans-membrane proteins satisfy the general form of Saffmans
predictions the predicted diffusivity is greater than that observed experimentally and agrees with
experiments only when a membrane viscosity of 100 poise is used This might be due to the
presence of other proteins in the membrane (Kucik Elson et al 1999) Experiments also show
that many proteins appear to diffuse freely only in small domains typically measuring from 200shy
600 nm remaining confined to these domains for periods on the order of tens of seconds To
explain this behavior the membrane skeleton fence model was proposed (Kusumi Sako et al
1993) in which a membrane-associated matrix constrains the movement of proteins outside of
the domains defined by the matrix filaments Diffusion beyond these barrier filaments can occur
either as a result of random thermal motions of the transmembrane protein matrix filaments or
both or by transient breaks in the filaments Confinement of proteins may play an important role
in rapid and selective signaling Rapid directed motion of membrane-associated proteins has
also been observed and is likely due to active transport by an intracellular actin- or microtubule-
based motor
316 Cell Adhesion
This section deals with how cells adhere to their surroundings and through these sites of
adhesion how they interact with the external world We begin by summarizing the different
types of adhesion their functions and the molecules involved Next we provide a brief
description of the adhesion complexes found in cells and the role of each type Then the
theories that provide a quantitative description of adhesion between single receptor-ligand pairs
are reviewed in the context of the material presented in Chapter xx including the role of thermal
fluctuations Through these theoretical models both the static and dynamic states of adhesion
can be explored for single molecule pairs then for adherent cells Next we develop the different
32
CHAPTER 21 CELL MEMBRANE MECHANICS AND ADHESION copyRD Kamm 4615
approaches that are used to study the adhesion of cells based either on thermodynamics or
mechanics Methods for the measurement of adhesion strength are described providing
estimates for the force that a cell can exert on its surroundings Various examples will be
presented but the adherence of leukocytes to the endothelium and the role of adhesion in cell
migration will receive special attention
Functions of adhesion
Adhesion has been found to be an essential process necessary for a variety of fundamental
cellular functions
bull Structural integrity Adhesion helps to maintain the overall structural integrity of the
tissue in muscle for example it provides the means of force transmission from the cells
to the surrounding matrix to allow contraction In non-contractile cells it still provides
the needed mechanical coupling to the surrounding tissue necessary for a variety of
cellular functions
bull External sensing Adhesion provides a means by which the cell can sense and
subsequently respond to its surroundings Forces transmitted directly to the cell
membrane or to the cytoskeleton via transmembrane proteins may trigger a variety of
biochemical reactions within the cell as we shall see later in Chapter 33
bull Migration Cell-matrix adhesion is an essential element in cell migration a cell propels
its way through tissue or along a surface through a process involving adhesion
contraction and release also described in Chapter 33
bull Regulation of transport Sites of cell-cell adhesion are often important in the regulation
of transport across a cell layer such as in the case of an epithelium or endothelium
bull Communication Sites of mechanical coupling often provide a means of cell-cell
communication as in the case of gap junctions which offer a pathway for the diffusion
of ions and small molecules between adjacent cells
Adhesion molecules
Cells adhere to their surroundings or to an artificial substrate via a wide variety of different
proteins that can be classified into five major families integrins selectins cadherins
immunoglobulins and transmembrane proteoglycans (Table 1) In terms of their mechanism of
attachment to other cells or the external matrix these can be classified as either homophillic ndash
binding to like molecules heterophillic ndash binding to unlike molecules or those that bind to other
cells through an extracellular linker molecule
Integrins one of the largest class of adhesion molecules are primarily used to attach cells
to the extracellular matrix or the basal lamina but are also present in some cell-cell adhesion
33
CHAPTER 21 CELL MEMBRANE MECHANICS AND ADHESION copyRD Kamm 4615
complexes They typically bind to the matrix via the RGD amino acid sequence (arginine
glycine aspartic acid) but can also contain other binding motifs Integrins are heterodimers in
that they always contain an α and a β subunit with the different isoforms determining the specific ligand to which the integrin binds Two specific types of adhesion focal adhesions and hemidesmosomes often contain integrins and the attachments they make can at times be stable but at other times transient so as for example to mediate cell migration The force of adhesion of a single integrin-ligand bond has been measured using atomic force microscopy and found to be in the range of 30-100 pN (Lehenkari and Horton 1999) with a relatively low binding affinity in the range of K ~ 10-6
D to 10-8 molliter By comparison typical cell-surface receptors bind with an affinity in the range of 10-9 to 10-11 molliter Integrins also play an important role in signaling since extracellular integrin binding is known to influence cytoskeletal morphology as well as the state of cell differentiation Adhesion molecules in the selectin family also tend to form transient bonds and are important in leukocyte adhesion and extravasation the migration of the leukocyte through the endothelium and into the tissue Consequently they tend to be found in cells of the circulation and are present both in leukocytes and endothelial cells and are instrumental in adhesion between these two cell-types during leukocyte rolling
Family Location andor Ligands Comments
function recognized
integrins focal adhesions (E) fibronectin relatively low
hemi-desmosomes collagen laminin affinities
leukocyte immunoglobulins (KD~ 10-6-10-8
(spreading) (I) actin filaments molliter)
adhesion primarily
cell-matrix adhesion
but also in some
cell-cell adhesions
selectins circulating cells and carbohydrates require Ca2+
endothelial cells
rolling adhesion
Ig superfamily important in integrins
(immunoglobulin) immune response homophillic
cadherens adherens junctions (E) homophillic require Ca2+
desmosomes (I) actin
34
CHAPTER 21 CELL MEMBRANE MECHANICS AND ADHESION copyRD Kamm 4615
filaments
intermediate
filaments
transmembrane fibroblasts (E) collagen bind various
proteoglycans epithelial cells fibronectin growth factors
(I) actin such as FGF
filaments
heterophillic
Table 1 Cell adhesion molecules and their characteristics
While both integrin and selectin binding is mediated by Ca2+ adhesion via the
immunoglobulin (Ig) superfamily of proteins is Ca2+ independent Some of the most prominent members of this family are the N-CAMs (Neural cell adhesion molecules) and ICAMs (Intracellular cell adhesion molecules) These tend to undergo homophillic bonding but some also bind to members of the integrin family
Cadherens are often expressed in the same cells as the selectins but form much stronger bonds and therefore play an important role in maintaining cell integrity Because of these attributes cadherens are the primary adhesion proteins in desmosomes and adherens junctions the major structural contacts cells form with other cells or the basil lamina These also form homophillic bonds by a Ca2+ dependent mechanism and mediate selective bonding between adjacent cells Cadherens are relatively short as compared to other adhesion molecules being
about 700-750 amino acid residues in length
Types of adhesion complexes
Cells have developed a variety of specialized adhesion complexes each utilizing one or more of
the adhesion molecules of Table 1 and each serving a specific purpose Typically the cell-cell or
cell-surface spacing is in the range of 10-20 nm but this is highly variable ranging from less than
1 nm when controlling transport to over 100 nm in regions where tight control is unnecessary
Below we describe the different types of junctions and where important for function their
mechanical characteristics
Gap junctions Cells need to communicate with their neighbors for a variety of reasons For
example cardiac myocytes transmit signals from cell to cell in order to maintain a synchronous
35
CHAPTER 21 CELL MEMBRANE MECHANICS AND ADHESION copyRD Kamm 4615
wave of contraction This is typically accomplished by providing a pathway for ions and small
signaling molecules between cells called gap junctions (Fig 3110) These minute channels are
typically comprised of a collection of six connexin proteins that cluster together in cylindrical
fashion forming a minute channel that passes molecules and ions less than about 1200 to 2000
MW (15-2 nm) Transport through these channels is regulated and their permeability drops in
the presence of high Ca2+ concentration as when a cell membrane is ruptured or with low pH
Cyclic AMP acting as a second messenger can be exchanged between cells therefore gap
junctions provide a metabolic linkage between neighboring cells and provide a means by which
hormonal stimulation of just one cell can be transmitted to others
Adherens junctions Adherens junctions are belt-like structures that can be though of as the
structural weld that holds two cells together (Fig 3110) Because of their structural role
these junctions formed by homophilic bonding between proteins in the cadheren family are
anchored securely again via the adaptor proteins α β γ-catenin to the cytoskeleton
Desmosomes and Hemidesmosomes If the adherens junctions are the continuous welds between
cells desmosomes are the spot welds Again these serve primarily a structural purpose
joining two neighboring cells via a complex consisting of a dense plaque on the intracellular
sides of both cells extending 15-20 nm into the cell and consisting of a variety of proteins that
attach to keratin filaments part of the intermediate filament network Hemidesmosomes have
similar intracellular structure but attach instead to the basal laminae Based on their different
extracellular attachment sites desmosomes typically link to other cells via cadherens whereas
hemidesmosomes adhere via a type of integrin Both are commonly found in epithelial cells
36
CHAPTER 21 CELL MEMBRANE MECHANICS AND ADHESION copyRD Kamm 4615
Fig 3110 Schematic showing the different types of cell junctions present in an epithelial cell as found in the small intestine Tight junctions near the apical surface essentially prevent the passage of all molecules The spot desmosomes and adherens junctions provide for cell-cell anchoring and the hemidesmosomes for anchoring to the basal lamina Gap junctions provide a means for communication between neighboring cells [Reproduced from Lodish et al Molecular Cell Biology 2000]
Junction type Function Extracellular or Intracellular
adjacent cell attachment
attachment
Adherens structural cell-cell or cell- ECM proteins or actin filaments
matrix cadherins in
adjacent cell
Desmosome structural cell-cell cadherin intermediate
filaments
Hemidesmosome structural cell-matrix basal lamina via intermediate
integrins filaments
Focal adhesions structural cell-matrix ECM proteins actin filaments
via integrins
Tight junction regulate transport between homophillic binding between the
cells and along cell transmembrane proteins occludin or
37
CHAPTER 21 CELL MEMBRANE MECHANICS AND ADHESION copyRD Kamm 4615
membrane claudins
Gap junctions cell-cell communication channels formed by connexin
via ion and small molecule subunits
exchange
Table 2 Adhesion complexes
Focal adhesions A second means by which cells attach to the extracellular matrix is through
focal adhesions These serve a similar function to the hemidesmosomes and share a common
linkage via integrins to the ECM but are attached on the intracellular side instead to the actin
filaments of the cytoskeleton Actin filaments converge at the site of focal adhesions forming
stress fibers strong actin bundles that attach to the β-subunit of the integrins via adapter
proteins such as actinin vinculin and talin Focal adhesions are instrumental in cell migration
and for this purpose need to be easily formed and disrupted as the cell moves forward Release
or de-adhesion of cells is often mediated by a class of peptides called dis-integrins that
competitively bind to the RGD site used by integrins to attach to a variety of matrix molecules
Tight junctions Control of transport is generally mediated by tight junctions that form an
intricate network of seams between two cells (Fig 3111) As their name implies these are the
tightest of the cell-cell junctions and the gaps they leave are often small enough to exclude even
the smallest ions and molecules Formed by homophillic binding between the transmembrane
proteins occluding and claudins tight junctions allow epithelial cells to perform their critical role
in transepithelial transport and provide for maintenance of differences in concentration between
the apical and basal surfaces of these cells Since occludins are not capable of forming rigid
structural bonds with the cytoskeleton they are most often associated in a junctional complex
with adherens junctions or desmosomes that fulfill the structural needs of attachment
38
CHAPTER 21 CELL MEMBRANE MECHANICS AND ADHESION copyRD Kamm 4615
Fig 3111 Tight junctions in an epithelial cell shown schematically (a) in a freeze fracture replica (b) and in a transmission electron micrograph (c) [Reproduced from Alberts et al 1994]
Fig 3112 Two types of bond that attach a cell to the extracellular matrix by means of clusters of integrins On the extracellular side integrins bind to the matrix proteins fibronectin and laminin Inside the cell they attach to the cytoskeleton via adaptor proteins to either actin filaments (focal adhesions) or intermediate filaments (hemidesmosomes) [Reproduced from Lodish et al Molecular Cell Biolology 2000]
Non-specific binding
Cells can adhere to their surroundings by either non-specific or receptor-ligand (specific)
bonding Though both mechanisms are likely active in most situations as we will see receptorshy
39
CHAPTER 21 CELL MEMBRANE MECHANICS AND ADHESION copyRD Kamm 4615
ligand bonding is the stronger of the two by a considerable margin and is therefore the most
relevant biologically In situations for which either the receptors or their ligands are not present
however such as might be the case in certain in vitro experiments non-specific binding can be
important as well
There are essentially three major forms of non-specific attractions to consider
bull Van der Waals ndash These attractive forces arise due to charge interactions in polar
molecules They tend to dominate among the non-specific mechanisms at
intermediate distances around 20-25 nm [see Boal]
bull Electrostatic ndash These interactions can be either attractive or repulsive depending
on the sign of the surface charges and are particularly important during the
approach of two cells since the glycocalyx has a high negative charge density
bull Steric ndash These forces arise due to the steric exclusion of two molecules as they are
brought into close contact In the case of cell-cell interactions steric repulsion is
due to the compression of the two glycocalyx layers and the tendency to resist
compression resulting from osmotic effects and the elasticity of the layer Steric
forces tend to dominate for small separation distances lt 10 nm
In combination these effects combine to produce a net attractive force per unit area of
about 100 Pa at a separation distance of about 25 nm
Adhesion by means of receptor-ligand binding
We can use the analysis of Chapter xx to estimate the strength of a receptor-ligand bond and
based on typical values for bond density calculate the corresponding strength of adhesion
between two cells or between a cell and a surface Recall that the application of force to a
receptor-ligand bond modifies the dissociation rate constant for the binding reaction This effect
can be modeled in several ways but the result obtained by Bell ((Bell 1978)) suggests the
following exponential form for the dissociation rate
0 ⎛ γf ⎞ 0 ⎛ γσ ⎞ kminus = kminus exp⎜ ⎟ = kminus exp⎜ ⎟ (265)
⎝ kBT ⎠ ⎝ NC kBT ⎠
where k0minus is the unforced dissociation rate constant γ is a factor with the units of length that
corresponds roughly with the distance separating the bonded pair at equilibrium NC is the concentration of bonded complex and σ is the average bond force per unit area To determine
40
CHAPTER 21 CELL MEMBRANE MECHANICS AND ADHESION copyRD Kamm 4615
the rate of change of the concentration of bonded pairs one must solve the following rate equation describing the competition between bond formation (first term) and destruction (second term)
dNC ⎛ γσ ⎞
cong k+ (NR minus NC )(NL ) minus kminus NC = k+ (N minus )( 0R NC NL ) minus kminus NC exp⎜ ⎟ (266)
dt ⎝ NC kBT ⎠
where NR and NL are the concentrations of receptors and ligands respectively and we have
assumed that NCltltNL and that all bonds are stressed equally At equilibrium dNCdt=0 and if
the force applied to detach the cell (equal to the average bond stress σ) is increased
incrementally from zero NC will progressively fall to a new equilibrium value At sufficiently
high levels of force however increasing σ further eventually gives rise to a situation in which equilibrium can no longer be achieved through a reduction in NC At that point NC tends toward zero and the cell separates from the surface to which it was attached It can be shown that this
occurs when (Bell 1978)
k 0
α c exp(α + c + 1) = N
k 0 L (267)minus
σ
where α minγ c equiv and σmin is the minimum stress needed to cause detachment For a wide
NRkBT
range of conditions eqn (267) has the approximate solution
⎛ k0 + ⎞
α c cong 07 ln L (268)⎜ 0 N ⎟⎝ kminus ⎠
so that the critical stress for detachment can be expressed as
N 0
σ cong 07 C kBT ⎛ k ⎞ ln⎜
+ min N ⎟ (269)
γ ⎝ k0 L minus ⎠
where NC is determined from setting eqn (266) to zero under these critical conditions
Thermodynamic approach to cell adhesion
Although we focus here on the mechanical aspects of cell adhesion this process can also be
viewed from a thermodynamic perspective In this approach adhesion is considered in terms of
the change in energy specifically the Gibbs free energy G associated with all the individual
receptor-ligand interactions as well as the various non-specific forces of attraction or repulsion
The adhesion of a cell to a given surface then can be viewed as an equilibrium state determined
41
CHAPTER 21 CELL MEMBRANE MECHANICS AND ADHESION copyRD Kamm 4615
by minimization of the free energy If in undergoing a transition from a free state to an adherent
state the system represented by the cell and surface experiences a reduction in free energy ie
ΔGlt0 then adhesion will occur and the equilibrium state of adhesion will be determined by that with the minimum in free energy or the largest value of -ΔG While this approach ignores
many of the subtleties of the interactions and like the analysis above assumes that all receptorshy
ligand interactions are identical from an energetic point of view it is useful in providing some
simple insights as seen in the next two examples
Example Comparison of specific and non-specific adhesive forces Non-specific bonding due
to the combined effects of van der Waals electrostatic and steric forces result in an attractive
stress of approximately 100 Pa Receptor-ligand bonding give rise to forces that can be
estimated from the change in free energy f ~ to 4x10⁻⁴ dynbond = 9x10-11 to 4x10⁻⁹ ΔGr~9x10⁻⁶ Nbond where f is the force required to break the bond and r is a measure of the distance the bond stretches before it breaks Using a typical density of the receptor-ligand complex NC of ~1012-1015 bondsm2 gives a total bond stress of N 1
C x f ~ 9 x 10 to 4x10⁶ Pa The above kinetic approach to estimating bond strength [eqn (269)] gives a value approximately half of that from this equilibrium approach In either case however the conclusion remains the same non-specific binding can under certain circumstances be important since it is comparable to the lowest estimates of receptor-ligand-mediated bond strength but not surprisingly the latter is quite likely to dominate in nearly all practical situations
Example JKR theory for the equilibrium area of adhesion between a cell and substrate
It is well known that cells tend to take on a more flattened shape as the substrate to which they
are attached becomes more strongly adhesive either by coating with a more attractive ligand or
by increasing the concentration of ligand bound to the substrate Conversely less adhesive cells
round up and become more spherical These observations can be explained with the help of a
simple scaling analysis on the assumptions of small deformation of a linear elastic cell
Let the cell be modeled as a homogeneous elastic sphere with elastic modulus E and
initial radius R (Fig 3113) It is then brought into contact with a surface to which it adheres
As the cell adheres it attains a lower energy state characterized by an adhesion energy per unit
area J Formation of a flat adhesion surface however requires deformation within the elastic
cell and an associated increase in the stored elastic energy In Chapter 31 we showed that the
stored elastic energy per unit volume can be written
UE asymp int τεdV asymp int 1 2 Eε 2dV (270)
Vc Vc
42
CHAPTER 21 CELL MEMBRANE MECHANICS AND ADHESION copyRD Kamm 4615
Strain inside the cell can be approximated as the displacement of the cell surface δ divided by the characteristic distance within the cell to which the deformations penetrate a distance that scales with the lateral extent of the contact region 2a so that ε prop δ a where it can easily be shown from the geometry that a 2 asymp 2δR so that ε prop δ R Combining and dropping all numerical constants we obtain the following scaling approximation
δUE prop E ( )δR
3 2 (271)R
An expression for the total energy of the system then can be written
U prop minusJa2 + Eε2a3 prop JδR + Eδ 5 2R1 2 (272) The equilibrium state corresponds to the value of δ having the minimum energy obtain from
partU prop minusJR + Eδ 3 2R1 2 (273)
partδ so that
23 1 3 ⎛ JR12 ⎞ ⎛ JR2 ⎞
δ prop ⎜ ⎟ and a prop ⎜ ⎟ (274)⎝ E ⎠ ⎝ E ⎠
The exact solution to this problem yields the result
⎡ ) 1 3 2 1( minusν 2 ⎤ 9πJR
a = ⎢ ⎥ (275)⎢ 2E ⎥⎣ ⎦
43
CHAPTER 21 CELL MEMBRANE MECHANICS AND ADHESION copyRD Kamm 4615
Elastic modulus E adhesion energy per unit area J
2a
Fig 3113 Experiments to determine the contact area of an iminobiotin functionalized agarosebead on a glass coverslip in water Top Schematic of adherent bead Bottom Results for a range of bead radii Solid line is a fit to the date which obeys the power law a prop R23 consistent with the prediction of JKR theory eqn(276) [Reproduced from (Moy Jiao et al 1999)] This can be compared to the result obtained from a more rigorous analysis
⎡9πJR 2(1minus ν 2 ) 13 ⎤
a = ⎢ ⎥ (276)2E⎢ ⎣ ⎥⎦
and to experimental data obtained from spherical beads made from a 4 agarose gel (Fig 3113)
Models for receptor-mediated adhesion
In Chapter x and in the preceding text we discussed the energetics of bond formation and release
as well as the effect of applied force in altering the energy landscape of the bonded pair and
thereby the rate constants for bond kinetics That analysis has obvious implications to the
44
CHAPTER 21 CELL MEMBRANE MECHANICS AND ADHESION copyRD Kamm 4615
adhesion of cells to substrates the surrounding extracellular matrix and other cells Here we
extend that analysis in the specific case of whole cell adhesion In doing so it will be important
to consider such factors as the distribution type and density of receptor-ligand bonds or
potential bonds and the elastic properties of the structures to which they are anchored On the
intracellular side this involves the series of couplings that link the receptor to the cell In the
simplest case this might simply be a link to the lipid bilayer if the receptor has no intracellular
connections More typically especially for couplings with a structural role it involves a series
of proteins ultimately linking the receptor to the cytoskeleton
The typical setting in vivo is one in which cells adhere to other cells or to the extracellular
matrix Adhesions are more easily probed however through in vitro experiments (described
below) where cell adhesion more often occurs to an artificial substrate mediated through one of
several extracellular proteins that are used to coat the surface Generally either collagen or
fibronectin is used Cells are often adhered to these substrates but to produce a more controlled
environment rigid beads are sometimes coated with the appropriate receptors so that one specific
receptor-ligand interaction can be probed While these systems are useful as models of certain
adhesion phenomena it is important to recognize in the interpretation of these experiments that
when bound to a rigid substrate or bead the binding proteins cannot freely diffuse as they would
in a more natural environment In particular the formation of focal adhesions would not occur in
bead-substrate experiments because the receptors would be constrained from aggregating
It is instructive to begin this discussion with a consideration of a single adhesion bond
for example one linking the actin matrix of the cytoskeleton to a β1 integrin and the integrin
receptor binding to the extracellular matrix beyond the cell membrane (Fig 3114) If the bond
is stressed as for example if the cell experiences a force relative to the ECM it will at first
stretch an amount dictated by the level of force in the bond and the stiffness of the complex
Each bond as well as each protein in the bond complex can be thought of as having a certain
stiffness giving rise to a picture in which several springs are considered connected in series
Forces acting on the adhesion complex are transmitted via this series of bonded proteins between
the CSK and the ECM producing local deformations and stresses in the corresponding matrices
that decay with distance from the adhesion site On the intracellular side these forces are
transmitted via a complex involving vinculin α-actinin paxillin and talin Attachment to the
extracellular matrix is mediated by an RGD sequence (in fibronectin for example) which in turn
has binding sites for collagen and fibrin If the force is sufficiently strong above a certain
threshold value F0 say and applied for a sufficiently long time the bond might be severed (deshy
couple) Typical values of this threshold force lie in the range of 10-100 pN (Evans and Ritchie
1997) but depend as well on the rate at which the force is increased Under more rapid
forcings the threshold is high compared to when the force is increased slowly This simply
45
CHAPTER 21 CELL MEMBRANE MECHANICS AND ADHESION copyRD Kamm 4615
reflects the fact that detachment is a stochastic process and that at any given level of force there
exists a finite probability of detachment and this probability increases with time
Fig 3114 One type of attachment linking the intracellular actin matrix to the extracellular matrix via an integrin complex that involves in addition vinculin α-actinin paxillin and talin (Reproduced from Lodish et al Molecular Cell Biolology 2000)
We need also to consider that in equilibrium a fraction Φ = K(1+K)-1 (where K is the
equilibrium constant) of the receptors will be bound at any given time and that the receptorshy
ligand complexes are continually cycling between the bound and unbound states characterized
by their respective rate constants
On a larger scale numerous adhesion sites typically act in parallel each contributing
some amount to the total adhesion force If the force transmitted by each single adhesion
complex is F and the density of adhesion sites (per unit membrane area) is NC then the stress
acting on the cell is the product F NC This gives a somewhat false impression however as it is
unlikely that each adhesion complex carries an equal force Put another way there exists a local
stress τ that can be thought of as the product of the average force per bond times the bond
density This stress is typically non-uniform In the adhesion of a cell to a flat substrate the
bonds near the periphery of the contact zone determine the strength of the cell against
detachment and when the cell is subjected to a detaching force the stresses are concentrated in
46
CHAPTER 21 CELL MEMBRANE MECHANICS AND ADHESION copyRD Kamm 4615
this peripheral region as depicted in Fig 3115 In the vicinity of the edge of adhesion several
factors will influence the stress distribution including the mechanical properties of the membrane
(in particular the bending stiffness KB) the receptor density the spring constants of the bond
and the bond strength
N
Region of adhesion
x1
Fig 3115 Schematic model of a cell membrane being detached from a substrate by application of a tension force N The membrane is free to the left of the dash-dot line and adherent to the right Forces and moments are transmitted through the membrane which adheres to the membrane through receptor-ligand bonds represented by a continuous distrubution p(x1)
To illustrate consider the following simple model for an adherent cell being peeled away
from its substrate by a force that generates a tension N in the membrane (Fig 3115)
Deformations in the membrane are described by eqn (223) where it can be shown that the
bending term dominates provided KbL2 gtN where L is the characteristic length in the x1 direction
(due to the small length scales involved) and the external membrane force (p in the membrane
equation) is now the non-uniform stress due to adhesion bonds As a simple first approximation
we take p = k(δminusδ0) with δ-δ0 being the amount of stretch in the receptor-ligand bond springs
and k an effective bond spring constant Recognizing that p approaches zero far from the edge
(see Fig 319) the membrane displacement and the spring displacement are related u3 = δ-δ0
Thus eqn (228) is written
⎛ part 4 u
KB⎜ 3
⎞ 4 ⎟ = NC F = NC ku
⎝ partx ⎠ 3 (277)1
This can be solved directly showing that the distance of separation between the cell membrane
and substrate grows in an exponential fashion with distance Even more simply a scaling
47
CHAPTER 21 CELL MEMBRANE MECHANICS AND ADHESION copyRD Kamm 4615
analysis of eqn (277) in which the term on the left is approximated by Kbu3w4 where w is the
characteristic distance over which u3 varies tells us that the stresses are concentrated in a region
of width
K
w prop B4 (278)
NC k
near the cell periphery Similarly we can estimate that the cell membrane will detach from the
substrate if N gt FoNCw where F0 is a measure of the force in a single bond at the time of bond
rupture and that the rate of peeling can be roughly approximated as the product of the
disassociation rate k -- (bondss) from eqn (265) and the distance between bonds (N -12C )
Although this provides some insight into how the peeling rate depends on the various factors it fails to capture the fact that the cell remains in an equilibrium attached state even for non-zero levels of tension reflecting that even under force a balance can exist between the rates of formation and rupture of receptor-ligand complexes (Ra Picart et al 1999)
It is also of interest to note that in the region near the edge of the attachment zone(x1=0
in Fig 3115) the membrane acts as a beam subjected to a moment due to the applied tension
This moment is balanced by a force couple due to tension in the adhesion complexes right
adjacent to the edge in combination with a compressive stress between the cell and substrate a
little further in In typical situations this compressive stress can approach levels as high as one
atmosphere and can act to effectively smooth the membrane and recruit new attachment sights While using these continuum descriptions it is important to keep in mind the true
discrete nature of the individual bonds represented in the model as a continuous adhesive
surface This is brought to light by a simple calculation in which the characteristic length over
which the applied tension is supported w is compared to the inter-receptor spacing N -12C
Using typical values for the parameters NC = 103 complexesμm-2 k = 10-5 to 10-6 Nm Kb = 1 to 2x10-18 Nm we find that w cong 01 to 03 μm and the inter-complex spacing N minus1 2
C cong 003 μm While it is reassuring to see that w is typically less than the inter-complex spacing the difference is small It is therefore not surprising that the actual process of cell peeling is stochastic in nature occurring in a sequence of more-or-less discrete steps with a velocity of peeling that varies widely from the mean
The interplay between receptor-ligand bonding and membrane stiffness also determines whether a cell will spread over a surface or peel away from it under a given tension Membrane bending stiffness acts to maintain the membrane and substrate within close proximity near the edge of contact (Fig 3115) Spreading can occur only if their separation distance is within the extended length of the receptor ligand bond over a distance comparable to the linear spacing
48
CHAPTER 21 CELL MEMBRANE MECHANICS AND ADHESION copyRD Kamm 4615
between neighboring bonds ( N minus1 2 C ) Under high tension the surfaces rapidly diverge and
spreading is prevented if the tension is sufficiently low receptor-ligand bonding can occur and spreading can occur
Measurements of adhesion
A variety of methods have been used to experimentally determine the strength of adhesion either
of individual receptor-ligand bonds or populations of bonds as in the case of entire cells
Whole cell experiments are more common and typically require less experimental
sophistication The drawback of course is that they provide only for estimates of average
properties and require certain assumptions regarding the distribution of cell-substrate adhesive
stress for interpretation to the level of a single bond Several of these methods are described
next
Centrifugal cell adhesion assays In this experiment cells are allowed to attached to a substrate
then are placed in a centrifuge rotating at speed ω positioned a distance r from the center of
rotation and oriented so that the net centrifugal force is acting to separate the cell from the
substrate Using the arrangement shown in Fig 3116 (right) the acceleration of the cells is 2ω r and the net force acting on a cell of volume Vc is F = (ρc minus ρf )ω 2rVc where the fluid and cell densities are ρf and ρc respectively
Interpreting these results we can make several different assumptions each leading to a different estimate for the maximum force experienced by the binding complex If we simply assume that all receptor-ligand complexes support an equal fraction of the total force F then the force per bond is f = F (πa 2NC ) where NC is the concentration of bond complexes However as the cell tears away from the substrate the edge bonds will break first since these experience the greatest level of force An alternative approach then is to assume that the adhesion complexes around the cell circumference support the entire load leading to the estimate f = F 2( πaN 1 2 ) recognizing that N1 2
C C is the average distance between bonds A somewhatmore accurate value for f might be obtained if we assume that all complexes within the distance w given by eqn (278) support the load In any of these cases once the centrifugal force exceeds some critical limit since the number of receptors supporting the load falls as the region of contact becomes smaller the force per bond increases and the cell will rapidly detach
Stochastic variability also needs to be taken into account however since even under a constant load any single bond has a finite probability of failure under a given level of force The equilibrium state of the cell then should be viewed as one in which the rate of bond formation equals the rate of bond breakage with increasing force having the effect of reducing the
49
CHAPTER 21 CELL MEMBRANE MECHANICS AND ADHESION copyRD Kamm 4615
probability that the bond will remain intact These effects can be addressed using the methods described in more detail in Chapter xx Parallel flow assay Another common method for assessing cell adhesion is to plate the cells onto one wall of a parallel flow chamber subject them to a fluid dynamic shear stress and observe at what flow rate the cells begin to release If we ignore flow details in the immediate vicinity of the cell the shear stress can be estimated from the solution for a fully developed (Poiseuille) velocity profile
3V ⎡ y2
⎛ ⎞ ⎤v(y) = ⎢1minus ⎥ (279)
2 ⎝ ⎠ ⎣ ⎢ h ⎥⎦
so that the shear stress acting on the cell is
⎛ dv ⎞ 6μV τw = μ⎜ ⎟ = (280)
⎝ dy ⎠ h y = minush
and the total force can be estimated as F asymp τw Ac where Ac is the surface area of the cell membrane exposed to the flow Consider as an example a flow of culture medium at a rate of 1 mls through a channel of height 01 cm and width 1 cm If the culture medium has a viscosity close to that of water (μ=001 dyns) the shear stress is obtained from eqn (280)
6 sdot (001dyn sdot s) sdot (1ml s) ( 01 sdot10cm2 )τ dyn cm 2w = = 6 = 06Pa
01cm This corresponds roughly with the level of shear stress experience by endothelial cells in the arterial system If we consider that the cell has a surface area with dimensions roughly 100 μm x 10 μm or about 103 μm2 then the total force acting on the cell is obtained by integrating the shear stress over the area of the apical membrane Assuming that the shear stress is uniform the force is simply the product of shear stress and surface area or about 1 nN in the present example Again interpretation of results from such experiments requires careful consideration of the distribution of forces among the individual adhesion complexes In this situation the cell is likely to peel from the upstream edge in much the same manner as occurs in the cell peeling experiment discussed earlier
50
CHAPTER 21 CELL MEMBRANE MECHANICS AND ADHESION copyRD Kamm 4615
Radial flow and spinning disk assays One disadvantage of the parallel flow assay is that all cells are subjected to essentially the same level of shear stress so the flow rate needs to be incrementally varied in order to determine the level of force required for detachment These two systems using an axisymmetric geometry circumvent this problem by producing an easily characterized radial variation in shear stress In the case of the radial flow assay fluid enters through a central channel and flows radially outward through the narrow gap between two circular plates From conservation of mass the mean flow velocity is given by
QV = (281)
2πrh and sufficiently far from the center (rgtgth) the velocity profile is parabolic as in the parallel flow assay and the shear stress is again governed by eqn (280) using (281) for V Q
ω
(Not to scale)
v
h h
Cell layer rc Ce l l layer rc
r r
Fig 3116 Schematic diagram showing the radial flow assay (left) and the spinning disk assay (right) In the radial flow assay shear stress attains a maximum value near the center and falls with increasing radius r whereas in the spinning disk system maximum shear stress is experienced at large r In the spinning disk assay cells are grown on one disk and the opposite disk is rotated at constant speed Provided the rate of rotation is sufficiently small that inertial effects can be neglected the velocity is purely in the circumferential direction and the profile is linear between the two plates so that the shear stress experienced by the cells can easily be computed as
ωr τw = μ (282)
h
51
CHAPTER 21 CELL MEMBRANE MECHANICS AND ADHESION copyRD Kamm 4615
In both of these cases as in the parallel flow assay the total force is obtained by integrating the shear stress over the cell surface and the distribution of force among the adhesion complexes is weighted toward those located near the upstream end of the cell This can also be seen by consideration of the torque exerted by shear stress on the cell that must be balanced by a nonshyuniform contact stress with the substrate that is greatest near the upstream end Single bond adhesion assays Two other assays provide a means of obtaining estimates for the strength of a single adhesion bond without the need for excessive interpretation These rely on an ability to isolate a small number of bonds or even a single bond and infer bond strength from the step-wise nature of the de-adhesion process associated with breakage of discrete bonds One of these methods employs the atomic force microscope coated with the ligand of an adhesion receptor as shown in Fig 3117 The probe tip is gradually brought up to the cell surface until one or more receptor-ligand bonds are formed When the probe tip is withdrawn it moves along a different trajectory on a force-displacement plot reflecting the forces of adhesion These forces are seen to jump between more or less discrete levels as the probe continues to be moved away from the cell with each jump corresponding to the breakage of a single bond (Fig 3117) Using this method the bond strength between integrin receptor and a variety of RGD-containing ligands was found to lie in the range of 30 to 100 pN (Lehenkari and Horton 1999)
Fig 3117 The strength of a single adhesion bond can be measured by bringing a functionalized tip of an AFM probe up to the cell allowing bonds to form then slowly withdrawing the probe Monitoring the differences between the force displacement curve between the forward and reverse motions the forces necessary to break a single receptor-ligand bond can be determined [Reproduced from (Lehenkari and Horton 1999)]
52
CHAPTER 21 CELL MEMBRANE MECHANICS AND ADHESION copyRD Kamm 4615
A second method is similar in that the discrete increments in force are monitored as individual receptor-ligand bonds are broken but the forces are measured by means of changes in the shape of a giant vesicle the membrane of which contains the ligands have been inserted In this case one vesicle is made effectively rigid due for example to a high surface tension A second vesicle containing the adhesion molecules is also drawn partially into a micropipet but is much more complaint than the first The two vesicles are then brought into point contact so that one or a small number of adhesions are formed As the pipets are moved apart the compliant vesicle distorts due to the force of adhesion which it can be shown is related to the change in dimension of the vesicle in the direction of the force thereby serving as a sensitive force transducer measuring forces in the range of single adhesion receptors or between 1 and 100 pN [Evans 1991 37]
(For specific examples of leukocyte rolling and attachment see Orsello or Chang amp Hammer)
[This process is initiated for example by local infection that causes the release of
chemotactic agents in addition to cytokines hellip
Models of this process draw upon many of the concepts discussed in this chapter ]
Transient cell adhesion
Concepts of transient adhesion and release are of particular importance in the case of leukocyte
rolling adhesion and transmigration across the endothelial layer of a blood vessel In addition
cell migration through extracellular matrix or along a substrate requires the ability of the cell to
both form and release adhesions
One problem that has received considerable attention is the interaction between an
adherent or rolling leukocyte and the adhesion receptors on the endothelium These studies are
complicated by the three-dimensional nature of the flow the compliance of the interacting
surfaces and receptor-ligand dynamics In a series of recent studies Hammer and co-workers
(Chang Tees et al 2000) have addressed several of these issues computing the viscous force
and torque acting upon a sphere near to planar wall from the mobility matrix (Hammer and Apte
1992) and using the ldquoBell modelrdquo of receptor binding (Bell 1978) but neglecting the effects of
cell deformation The Bell model relates the dissociation rate constant kr to the force in the
bond f the thermal energy kBT and a parameter with units of length that depends on the
reactivity of the molecule
kr = ko r exp(γf kBT ) (283)
53
CHAPTER 21 CELL MEMBRANE MECHANICS AND ADHESION copyRD Kamm 4615
A Monte Carlo method is employed at each time step in the calculation to determine bond
formation or breakage In these studies the nature of the leukocyte-endothelial interaction is
characterized as firm adhesion rolling adhesion bimodal adhesion or no adhesion and mapped
as a function of the two parameters of the Bell model in Fig 3 The boundaries of the rolling
adhesion regime are identified for a wall shear rate of 100 s-1 (dotted lines) or 30 and 400 s-1
(solid lines) Most literature values for the Bell model parameters for a variety of selectin
receptors (known to be instrumental in leukocyte rolling) correspond to the rolling adhesion
regime for typical shear rate of 100 s-1 An interesting but counterintuitive result from this study
was the observation that as the bond stiffness was increased from the value used in most
calculations (100 dyne cm-1) adhesiveness decreased which the authors attribute to reduced
deflection for a given level of force leading subsequently to more rapid dissociation
Fig 3118 The state diagram for a leukocyte interacting with an endothelial surface for shear rates ranging from 30 to 400 s-1 For low dissociation rates the leukocyte remains adherent to the surface (lower left) As either (γ) or ( ko
r ) [see Eqn (283) for definitions] is increased the cell first adheres firmly then rolls along the wall then completely detaches (upper right) Rolling adhesion is defined as the regime where rolling occurs over some part of the shear rate range between 30 and 400 s-1 Firm adhesion indicates that cells remain attached even at the highest shear rate no adhesion indicates that cells roll at a velocity gt 50 of the velocity of a non-adherent sphere In the bimodal regime cells are either adherent or non-adherent and do not exhibit rolling Dotted curves correspond to these same boundaries for a shear rate of 100 s-1 Reproduced from Chang et al (2000)
54
CHAPTER 21 CELL MEMBRANE MECHANICS AND ADHESION copyRD Kamm 4615
In another recent study using high-resolution video-microscopy (Schmidtke and Diamond
2000) it was demonstrated that a flowing neutrophil can attach to an adherent platelet via
adhesion molecules located in the tips of the microvilli and form long tethers averaging nearly 10
μm in length but ranging up to 40 μm at extensional rates of 6-40 μm s-1 for shear rates ranging
from 100-250 s-1 The mechanics of tether formation is itself a fascinating topic that is still under
intense investigation Readers interested in pursuing this work in more detail are referred to the
several papers (Hochmuth Shao et al 1996 Dai and Sheetz 1998 Dai and Sheetz 1999) that
identify a number of intriguing phenomena
55
CHAPTER 21 CELL MEMBRANE MECHANICS AND ADHESION copyRD Kamm 4615
317 Nomenclature Parameter Definition Units
R - receptor
L - ligand
C - receptor-ligand complex
G - Gibbs free energy Nm
N - membrane tension Nm
NR - total receptor density -3μm-2 in 2D or μm in 3D NL - total ligand density μm-2 in 2D or μm-3 in 3D N in 2D or μm-3μm-2
C - complex density in 3D NRf - free receptor density m-2 in 2D or m-3μ μ in 3D NLf - free ligand density -2 -3μm in 2D or μm in 3D d+ - forward diffusional rate constant 2 -1μm s-1 in 2D or 3 μm s in 3D d -1
- - reverse diffusional rate constant s r+ - forward reaction rate constant s-1
r- - reverse reaction rate constant s-1 D 2 -1
m - membrane diffusion coefficient μm s D - solution diffusion coefficient m2 s -1s μ Kb - bending stiffness Nm K 0 - equilibrium constant or affinity (zero force) M-1 in 3D and 2μm in 2D = k0
+ k0 minus
K - equilibrium constant M-1 in 3D and m2μ in 2D = k+kshy
k0 - association rate constant (zero force) M-1 s-1 in 3D or m-2 -1+ μ s in 2D
k0 - dissociation rate constant (zero force) s-1 minus
k - association rate constant M-1 s-1 in 3D or m-2 -1+ μ s in 2D
kminus - dissociation rate constant s-1 f - force per bond N F - total adhesion force N γ - empirical parameter μm r0 - distance over which energy minimum acts μm E0 - bond energy J k JK-1
B - Boltzmanns constant T - temperature K τ - bond lifetime s
56
CHAPTER 21 CELL MEMBRANE MECHANICS AND ADHESION copyRD Kamm 4615
τ0 - bond lifetime with zero force s σ - adhesion stress N μm-2 κ - spring constant for receptor-ligand bond N μm-1
57
CHAPTER 21 CELL MEMBRANE MECHANICS AND ADHESION copyRD Kamm 4615
References Bell G I (1978) Models for the specific adhesion of cells to cells Science 200 618-627 Caille N O Thoumine et al (2002) Contribution of the nucleus to the mechanical properties
of endothelial cells J Biomech 35(2) 177-87 Chang K C D F Tees et al (2000) The state diagram for cell adhesion under flow
leukocyte rolling and firm adhesion Proc Natl Acad Sci U S A 97(21) 11262-7 Dai J and M P Sheetz (1998) Cell membrane mechanics Methods Cell Biol 55 157-71 Dai J and M P Sheetz (1999) Membrane tether formation from blebbing cells Biophys J
77(6) 3363-70 Daily Elson et al (1984) Determination of the elastic area compressibility modulus of the
erythrocyte membrane Biophys J 45(4) 671-682 Evans E and K Ritchie (1997) Dynamic strength of molecular adhesion bonds Biophys J
72(4) 1541-55 Evans E A (1983) Bending elastic modulus of red blood cell membrane derived from
buckling instability in micropipet aspiration tests Biophys J 43(1) 27-30 Hammer D A and S M Apte (1992) Simulation of cell rolling and adhesion on surfaces in
shear flow general results and analysis of selectin-mediated neutrophil adhesion Biophys J 63(1) 35-57
Hardt S L (1979) Rates of diffusion controlled reactions in one two and three dimensions Biophysical Chemistry 10 239-243
Hochmuth F M J Y Shao et al (1996) Deformation and flow of membrane into tethers extracted from neuronal growth cones Biophys J 70(1) 358-69
Kucik D F E L Elson et al (1999) Weak dependence of mobility of membrane protein aggregates on aggregate size supports a viscous model of retardation of diffusion Biophys J 76(1 Pt 1) 314-22
Kusumi A Y Sako et al (1993) Confined lateral diffusion of membrane receptors as studied by single particle tracking (nanovid microscopy) Effects of calcium-induced differentiation in cultured epithelial cells Biophys J 65(5) 2021-40
Lehenkari P P and M A Horton (1999) Single integrin molecule adhesion forces in intact cells measured by atomic force microscopy Biochem Biophys Res Commun 259(3) 645-50
McCloskey M and M M Poo (1984) Protein diffusion in cell membranes some biological implications Int Rev Cytol 87 19-81
Meleard P Gerbeaud C Bardusco N Mitov MD and Ferdandex-Puente L (1998) Mechanical properties of model membranes studied from shape transformations of giant vesicles Biochimie 80 401-413
Moy V T Y Jiao et al (1999) Adhesion energy of receptor-mediated interaction measured by elastic deformation Biophys J 76(3) 1632-8
Ra H J C Picart et al (1999) Muscle cell peeling from micropatterned collagen direct probing of focal and molecular properties of matrix adhesion J Cell Sci 112 ( Pt 10) 1425-36
Saffman P G (1976) Bownian motion in thin sheets of viscous fluid Journal of Fluid Mechanics 73 593-602
Schmidtke D W and S L Diamond (2000) Direct observation of membrane tethers formed during neutrophil attachment to platelets or P-selectin under physiological flow J Cell Biol 149(3) 719-30
Sheets E D R Simson et al (1995) New insights into membrane dynamics from the analysis of cell surface interactions by physical methods Curr Opin Cell Biol 7(5) 707-14
58
CHAPTER 21 CELL MEMBRANE MECHANICS AND ADHESION copyRD Kamm 4615
Vink H and B R Duling (1996) Identification of distinct luminal domains for macromolecules erythrocytes and leukocytes within mammalian capillaries Circ Res 79(3) 581-9
Waugh R and E A Evans (1979) Thermoelasticity of red blood cell membrane Biophys J 26(1) 115-31
Zeman K H Engelhard et al (1990) Bending undulations and elasticity of the erythrocyte membrane effects of cell shape and membrane organization Eur Biophys J 18(4) 203shy19
Zhelev D V D Needham et al (1994) Role of the membrane cortex in neutrophil deformation in small pipets Biophys J 67(2) 696-705
59
MIT OpenCourseWarehttpocwmitedu
20310J 3053J 6024J 2797J Molecular Cellular and Tissue BiomechanicsSpring 2015
For information about citing these materials or our Terms of Use visit httpocwmiteduterms
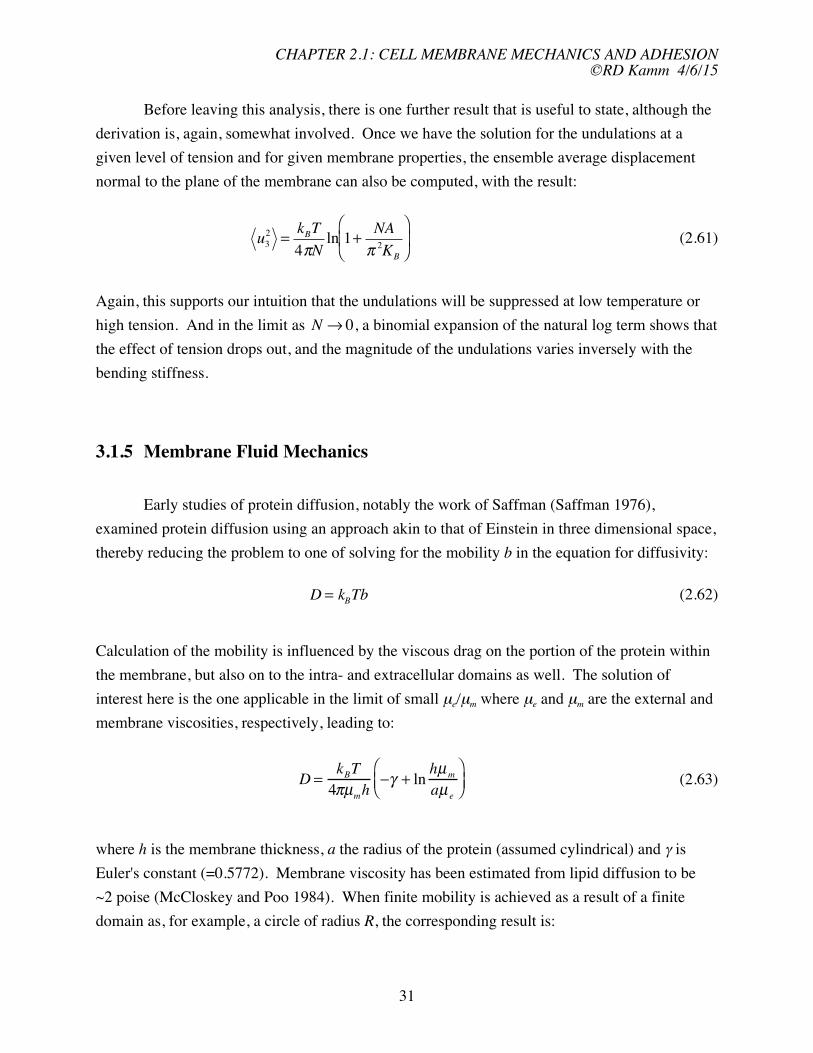
CHAPTER 21 CELL MEMBRANE MECHANICS AND ADHESION copyRD Kamm 4615
k ⎛ 1 D = BT R ⎞ log minus (264)
4πμh ⎝ a 2 ⎠
While this represents a useful point of departure measurements of lateral diffusion in a
membrane have demonstrated a more complex behavior Fluorescence recovery after
photobleaching (FRAP) has enabled the direct tracking of membrane proteins labeled with
fluorescent antibodies More recently single particle tracking methods have been developed
using colloidal gold or a fluorescent particle in conjunction with digital microscopy as well as
controlled movements using microbeads manipulated by an optical trap
From experiments such as these a new picture has emerged While the lateral diffusion
of lipids and a small fraction of trans-membrane proteins satisfy the general form of Saffmans
predictions the predicted diffusivity is greater than that observed experimentally and agrees with
experiments only when a membrane viscosity of 100 poise is used This might be due to the
presence of other proteins in the membrane (Kucik Elson et al 1999) Experiments also show
that many proteins appear to diffuse freely only in small domains typically measuring from 200shy
600 nm remaining confined to these domains for periods on the order of tens of seconds To
explain this behavior the membrane skeleton fence model was proposed (Kusumi Sako et al
1993) in which a membrane-associated matrix constrains the movement of proteins outside of
the domains defined by the matrix filaments Diffusion beyond these barrier filaments can occur
either as a result of random thermal motions of the transmembrane protein matrix filaments or
both or by transient breaks in the filaments Confinement of proteins may play an important role
in rapid and selective signaling Rapid directed motion of membrane-associated proteins has
also been observed and is likely due to active transport by an intracellular actin- or microtubule-
based motor
316 Cell Adhesion
This section deals with how cells adhere to their surroundings and through these sites of
adhesion how they interact with the external world We begin by summarizing the different
types of adhesion their functions and the molecules involved Next we provide a brief
description of the adhesion complexes found in cells and the role of each type Then the
theories that provide a quantitative description of adhesion between single receptor-ligand pairs
are reviewed in the context of the material presented in Chapter xx including the role of thermal
fluctuations Through these theoretical models both the static and dynamic states of adhesion
can be explored for single molecule pairs then for adherent cells Next we develop the different
32
CHAPTER 21 CELL MEMBRANE MECHANICS AND ADHESION copyRD Kamm 4615
approaches that are used to study the adhesion of cells based either on thermodynamics or
mechanics Methods for the measurement of adhesion strength are described providing
estimates for the force that a cell can exert on its surroundings Various examples will be
presented but the adherence of leukocytes to the endothelium and the role of adhesion in cell
migration will receive special attention
Functions of adhesion
Adhesion has been found to be an essential process necessary for a variety of fundamental
cellular functions
bull Structural integrity Adhesion helps to maintain the overall structural integrity of the
tissue in muscle for example it provides the means of force transmission from the cells
to the surrounding matrix to allow contraction In non-contractile cells it still provides
the needed mechanical coupling to the surrounding tissue necessary for a variety of
cellular functions
bull External sensing Adhesion provides a means by which the cell can sense and
subsequently respond to its surroundings Forces transmitted directly to the cell
membrane or to the cytoskeleton via transmembrane proteins may trigger a variety of
biochemical reactions within the cell as we shall see later in Chapter 33
bull Migration Cell-matrix adhesion is an essential element in cell migration a cell propels
its way through tissue or along a surface through a process involving adhesion
contraction and release also described in Chapter 33
bull Regulation of transport Sites of cell-cell adhesion are often important in the regulation
of transport across a cell layer such as in the case of an epithelium or endothelium
bull Communication Sites of mechanical coupling often provide a means of cell-cell
communication as in the case of gap junctions which offer a pathway for the diffusion
of ions and small molecules between adjacent cells
Adhesion molecules
Cells adhere to their surroundings or to an artificial substrate via a wide variety of different
proteins that can be classified into five major families integrins selectins cadherins
immunoglobulins and transmembrane proteoglycans (Table 1) In terms of their mechanism of
attachment to other cells or the external matrix these can be classified as either homophillic ndash
binding to like molecules heterophillic ndash binding to unlike molecules or those that bind to other
cells through an extracellular linker molecule
Integrins one of the largest class of adhesion molecules are primarily used to attach cells
to the extracellular matrix or the basal lamina but are also present in some cell-cell adhesion
33
CHAPTER 21 CELL MEMBRANE MECHANICS AND ADHESION copyRD Kamm 4615
complexes They typically bind to the matrix via the RGD amino acid sequence (arginine
glycine aspartic acid) but can also contain other binding motifs Integrins are heterodimers in
that they always contain an α and a β subunit with the different isoforms determining the specific ligand to which the integrin binds Two specific types of adhesion focal adhesions and hemidesmosomes often contain integrins and the attachments they make can at times be stable but at other times transient so as for example to mediate cell migration The force of adhesion of a single integrin-ligand bond has been measured using atomic force microscopy and found to be in the range of 30-100 pN (Lehenkari and Horton 1999) with a relatively low binding affinity in the range of K ~ 10-6
D to 10-8 molliter By comparison typical cell-surface receptors bind with an affinity in the range of 10-9 to 10-11 molliter Integrins also play an important role in signaling since extracellular integrin binding is known to influence cytoskeletal morphology as well as the state of cell differentiation Adhesion molecules in the selectin family also tend to form transient bonds and are important in leukocyte adhesion and extravasation the migration of the leukocyte through the endothelium and into the tissue Consequently they tend to be found in cells of the circulation and are present both in leukocytes and endothelial cells and are instrumental in adhesion between these two cell-types during leukocyte rolling
Family Location andor Ligands Comments
function recognized
integrins focal adhesions (E) fibronectin relatively low
hemi-desmosomes collagen laminin affinities
leukocyte immunoglobulins (KD~ 10-6-10-8
(spreading) (I) actin filaments molliter)
adhesion primarily
cell-matrix adhesion
but also in some
cell-cell adhesions
selectins circulating cells and carbohydrates require Ca2+
endothelial cells
rolling adhesion
Ig superfamily important in integrins
(immunoglobulin) immune response homophillic
cadherens adherens junctions (E) homophillic require Ca2+
desmosomes (I) actin
34
CHAPTER 21 CELL MEMBRANE MECHANICS AND ADHESION copyRD Kamm 4615
filaments
intermediate
filaments
transmembrane fibroblasts (E) collagen bind various
proteoglycans epithelial cells fibronectin growth factors
(I) actin such as FGF
filaments
heterophillic
Table 1 Cell adhesion molecules and their characteristics
While both integrin and selectin binding is mediated by Ca2+ adhesion via the
immunoglobulin (Ig) superfamily of proteins is Ca2+ independent Some of the most prominent members of this family are the N-CAMs (Neural cell adhesion molecules) and ICAMs (Intracellular cell adhesion molecules) These tend to undergo homophillic bonding but some also bind to members of the integrin family
Cadherens are often expressed in the same cells as the selectins but form much stronger bonds and therefore play an important role in maintaining cell integrity Because of these attributes cadherens are the primary adhesion proteins in desmosomes and adherens junctions the major structural contacts cells form with other cells or the basil lamina These also form homophillic bonds by a Ca2+ dependent mechanism and mediate selective bonding between adjacent cells Cadherens are relatively short as compared to other adhesion molecules being
about 700-750 amino acid residues in length
Types of adhesion complexes
Cells have developed a variety of specialized adhesion complexes each utilizing one or more of
the adhesion molecules of Table 1 and each serving a specific purpose Typically the cell-cell or
cell-surface spacing is in the range of 10-20 nm but this is highly variable ranging from less than
1 nm when controlling transport to over 100 nm in regions where tight control is unnecessary
Below we describe the different types of junctions and where important for function their
mechanical characteristics
Gap junctions Cells need to communicate with their neighbors for a variety of reasons For
example cardiac myocytes transmit signals from cell to cell in order to maintain a synchronous
35
CHAPTER 21 CELL MEMBRANE MECHANICS AND ADHESION copyRD Kamm 4615
wave of contraction This is typically accomplished by providing a pathway for ions and small
signaling molecules between cells called gap junctions (Fig 3110) These minute channels are
typically comprised of a collection of six connexin proteins that cluster together in cylindrical
fashion forming a minute channel that passes molecules and ions less than about 1200 to 2000
MW (15-2 nm) Transport through these channels is regulated and their permeability drops in
the presence of high Ca2+ concentration as when a cell membrane is ruptured or with low pH
Cyclic AMP acting as a second messenger can be exchanged between cells therefore gap
junctions provide a metabolic linkage between neighboring cells and provide a means by which
hormonal stimulation of just one cell can be transmitted to others
Adherens junctions Adherens junctions are belt-like structures that can be though of as the
structural weld that holds two cells together (Fig 3110) Because of their structural role
these junctions formed by homophilic bonding between proteins in the cadheren family are
anchored securely again via the adaptor proteins α β γ-catenin to the cytoskeleton
Desmosomes and Hemidesmosomes If the adherens junctions are the continuous welds between
cells desmosomes are the spot welds Again these serve primarily a structural purpose
joining two neighboring cells via a complex consisting of a dense plaque on the intracellular
sides of both cells extending 15-20 nm into the cell and consisting of a variety of proteins that
attach to keratin filaments part of the intermediate filament network Hemidesmosomes have
similar intracellular structure but attach instead to the basal laminae Based on their different
extracellular attachment sites desmosomes typically link to other cells via cadherens whereas
hemidesmosomes adhere via a type of integrin Both are commonly found in epithelial cells
36
CHAPTER 21 CELL MEMBRANE MECHANICS AND ADHESION copyRD Kamm 4615
Fig 3110 Schematic showing the different types of cell junctions present in an epithelial cell as found in the small intestine Tight junctions near the apical surface essentially prevent the passage of all molecules The spot desmosomes and adherens junctions provide for cell-cell anchoring and the hemidesmosomes for anchoring to the basal lamina Gap junctions provide a means for communication between neighboring cells [Reproduced from Lodish et al Molecular Cell Biology 2000]
Junction type Function Extracellular or Intracellular
adjacent cell attachment
attachment
Adherens structural cell-cell or cell- ECM proteins or actin filaments
matrix cadherins in
adjacent cell
Desmosome structural cell-cell cadherin intermediate
filaments
Hemidesmosome structural cell-matrix basal lamina via intermediate
integrins filaments
Focal adhesions structural cell-matrix ECM proteins actin filaments
via integrins
Tight junction regulate transport between homophillic binding between the
cells and along cell transmembrane proteins occludin or
37
CHAPTER 21 CELL MEMBRANE MECHANICS AND ADHESION copyRD Kamm 4615
membrane claudins
Gap junctions cell-cell communication channels formed by connexin
via ion and small molecule subunits
exchange
Table 2 Adhesion complexes
Focal adhesions A second means by which cells attach to the extracellular matrix is through
focal adhesions These serve a similar function to the hemidesmosomes and share a common
linkage via integrins to the ECM but are attached on the intracellular side instead to the actin
filaments of the cytoskeleton Actin filaments converge at the site of focal adhesions forming
stress fibers strong actin bundles that attach to the β-subunit of the integrins via adapter
proteins such as actinin vinculin and talin Focal adhesions are instrumental in cell migration
and for this purpose need to be easily formed and disrupted as the cell moves forward Release
or de-adhesion of cells is often mediated by a class of peptides called dis-integrins that
competitively bind to the RGD site used by integrins to attach to a variety of matrix molecules
Tight junctions Control of transport is generally mediated by tight junctions that form an
intricate network of seams between two cells (Fig 3111) As their name implies these are the
tightest of the cell-cell junctions and the gaps they leave are often small enough to exclude even
the smallest ions and molecules Formed by homophillic binding between the transmembrane
proteins occluding and claudins tight junctions allow epithelial cells to perform their critical role
in transepithelial transport and provide for maintenance of differences in concentration between
the apical and basal surfaces of these cells Since occludins are not capable of forming rigid
structural bonds with the cytoskeleton they are most often associated in a junctional complex
with adherens junctions or desmosomes that fulfill the structural needs of attachment
38
CHAPTER 21 CELL MEMBRANE MECHANICS AND ADHESION copyRD Kamm 4615
Fig 3111 Tight junctions in an epithelial cell shown schematically (a) in a freeze fracture replica (b) and in a transmission electron micrograph (c) [Reproduced from Alberts et al 1994]
Fig 3112 Two types of bond that attach a cell to the extracellular matrix by means of clusters of integrins On the extracellular side integrins bind to the matrix proteins fibronectin and laminin Inside the cell they attach to the cytoskeleton via adaptor proteins to either actin filaments (focal adhesions) or intermediate filaments (hemidesmosomes) [Reproduced from Lodish et al Molecular Cell Biolology 2000]
Non-specific binding
Cells can adhere to their surroundings by either non-specific or receptor-ligand (specific)
bonding Though both mechanisms are likely active in most situations as we will see receptorshy
39
CHAPTER 21 CELL MEMBRANE MECHANICS AND ADHESION copyRD Kamm 4615
ligand bonding is the stronger of the two by a considerable margin and is therefore the most
relevant biologically In situations for which either the receptors or their ligands are not present
however such as might be the case in certain in vitro experiments non-specific binding can be
important as well
There are essentially three major forms of non-specific attractions to consider
bull Van der Waals ndash These attractive forces arise due to charge interactions in polar
molecules They tend to dominate among the non-specific mechanisms at
intermediate distances around 20-25 nm [see Boal]
bull Electrostatic ndash These interactions can be either attractive or repulsive depending
on the sign of the surface charges and are particularly important during the
approach of two cells since the glycocalyx has a high negative charge density
bull Steric ndash These forces arise due to the steric exclusion of two molecules as they are
brought into close contact In the case of cell-cell interactions steric repulsion is
due to the compression of the two glycocalyx layers and the tendency to resist
compression resulting from osmotic effects and the elasticity of the layer Steric
forces tend to dominate for small separation distances lt 10 nm
In combination these effects combine to produce a net attractive force per unit area of
about 100 Pa at a separation distance of about 25 nm
Adhesion by means of receptor-ligand binding
We can use the analysis of Chapter xx to estimate the strength of a receptor-ligand bond and
based on typical values for bond density calculate the corresponding strength of adhesion
between two cells or between a cell and a surface Recall that the application of force to a
receptor-ligand bond modifies the dissociation rate constant for the binding reaction This effect
can be modeled in several ways but the result obtained by Bell ((Bell 1978)) suggests the
following exponential form for the dissociation rate
0 ⎛ γf ⎞ 0 ⎛ γσ ⎞ kminus = kminus exp⎜ ⎟ = kminus exp⎜ ⎟ (265)
⎝ kBT ⎠ ⎝ NC kBT ⎠
where k0minus is the unforced dissociation rate constant γ is a factor with the units of length that
corresponds roughly with the distance separating the bonded pair at equilibrium NC is the concentration of bonded complex and σ is the average bond force per unit area To determine
40
CHAPTER 21 CELL MEMBRANE MECHANICS AND ADHESION copyRD Kamm 4615
the rate of change of the concentration of bonded pairs one must solve the following rate equation describing the competition between bond formation (first term) and destruction (second term)
dNC ⎛ γσ ⎞
cong k+ (NR minus NC )(NL ) minus kminus NC = k+ (N minus )( 0R NC NL ) minus kminus NC exp⎜ ⎟ (266)
dt ⎝ NC kBT ⎠
where NR and NL are the concentrations of receptors and ligands respectively and we have
assumed that NCltltNL and that all bonds are stressed equally At equilibrium dNCdt=0 and if
the force applied to detach the cell (equal to the average bond stress σ) is increased
incrementally from zero NC will progressively fall to a new equilibrium value At sufficiently
high levels of force however increasing σ further eventually gives rise to a situation in which equilibrium can no longer be achieved through a reduction in NC At that point NC tends toward zero and the cell separates from the surface to which it was attached It can be shown that this
occurs when (Bell 1978)
k 0
α c exp(α + c + 1) = N
k 0 L (267)minus
σ
where α minγ c equiv and σmin is the minimum stress needed to cause detachment For a wide
NRkBT
range of conditions eqn (267) has the approximate solution
⎛ k0 + ⎞
α c cong 07 ln L (268)⎜ 0 N ⎟⎝ kminus ⎠
so that the critical stress for detachment can be expressed as
N 0
σ cong 07 C kBT ⎛ k ⎞ ln⎜
+ min N ⎟ (269)
γ ⎝ k0 L minus ⎠
where NC is determined from setting eqn (266) to zero under these critical conditions
Thermodynamic approach to cell adhesion
Although we focus here on the mechanical aspects of cell adhesion this process can also be
viewed from a thermodynamic perspective In this approach adhesion is considered in terms of
the change in energy specifically the Gibbs free energy G associated with all the individual
receptor-ligand interactions as well as the various non-specific forces of attraction or repulsion
The adhesion of a cell to a given surface then can be viewed as an equilibrium state determined
41
CHAPTER 21 CELL MEMBRANE MECHANICS AND ADHESION copyRD Kamm 4615
by minimization of the free energy If in undergoing a transition from a free state to an adherent
state the system represented by the cell and surface experiences a reduction in free energy ie
ΔGlt0 then adhesion will occur and the equilibrium state of adhesion will be determined by that with the minimum in free energy or the largest value of -ΔG While this approach ignores
many of the subtleties of the interactions and like the analysis above assumes that all receptorshy
ligand interactions are identical from an energetic point of view it is useful in providing some
simple insights as seen in the next two examples
Example Comparison of specific and non-specific adhesive forces Non-specific bonding due
to the combined effects of van der Waals electrostatic and steric forces result in an attractive
stress of approximately 100 Pa Receptor-ligand bonding give rise to forces that can be
estimated from the change in free energy f ~ to 4x10⁻⁴ dynbond = 9x10-11 to 4x10⁻⁹ ΔGr~9x10⁻⁶ Nbond where f is the force required to break the bond and r is a measure of the distance the bond stretches before it breaks Using a typical density of the receptor-ligand complex NC of ~1012-1015 bondsm2 gives a total bond stress of N 1
C x f ~ 9 x 10 to 4x10⁶ Pa The above kinetic approach to estimating bond strength [eqn (269)] gives a value approximately half of that from this equilibrium approach In either case however the conclusion remains the same non-specific binding can under certain circumstances be important since it is comparable to the lowest estimates of receptor-ligand-mediated bond strength but not surprisingly the latter is quite likely to dominate in nearly all practical situations
Example JKR theory for the equilibrium area of adhesion between a cell and substrate
It is well known that cells tend to take on a more flattened shape as the substrate to which they
are attached becomes more strongly adhesive either by coating with a more attractive ligand or
by increasing the concentration of ligand bound to the substrate Conversely less adhesive cells
round up and become more spherical These observations can be explained with the help of a
simple scaling analysis on the assumptions of small deformation of a linear elastic cell
Let the cell be modeled as a homogeneous elastic sphere with elastic modulus E and
initial radius R (Fig 3113) It is then brought into contact with a surface to which it adheres
As the cell adheres it attains a lower energy state characterized by an adhesion energy per unit
area J Formation of a flat adhesion surface however requires deformation within the elastic
cell and an associated increase in the stored elastic energy In Chapter 31 we showed that the
stored elastic energy per unit volume can be written
UE asymp int τεdV asymp int 1 2 Eε 2dV (270)
Vc Vc
42
CHAPTER 21 CELL MEMBRANE MECHANICS AND ADHESION copyRD Kamm 4615
Strain inside the cell can be approximated as the displacement of the cell surface δ divided by the characteristic distance within the cell to which the deformations penetrate a distance that scales with the lateral extent of the contact region 2a so that ε prop δ a where it can easily be shown from the geometry that a 2 asymp 2δR so that ε prop δ R Combining and dropping all numerical constants we obtain the following scaling approximation
δUE prop E ( )δR
3 2 (271)R
An expression for the total energy of the system then can be written
U prop minusJa2 + Eε2a3 prop JδR + Eδ 5 2R1 2 (272) The equilibrium state corresponds to the value of δ having the minimum energy obtain from
partU prop minusJR + Eδ 3 2R1 2 (273)
partδ so that
23 1 3 ⎛ JR12 ⎞ ⎛ JR2 ⎞
δ prop ⎜ ⎟ and a prop ⎜ ⎟ (274)⎝ E ⎠ ⎝ E ⎠
The exact solution to this problem yields the result
⎡ ) 1 3 2 1( minusν 2 ⎤ 9πJR
a = ⎢ ⎥ (275)⎢ 2E ⎥⎣ ⎦
43
CHAPTER 21 CELL MEMBRANE MECHANICS AND ADHESION copyRD Kamm 4615
Elastic modulus E adhesion energy per unit area J
2a
Fig 3113 Experiments to determine the contact area of an iminobiotin functionalized agarosebead on a glass coverslip in water Top Schematic of adherent bead Bottom Results for a range of bead radii Solid line is a fit to the date which obeys the power law a prop R23 consistent with the prediction of JKR theory eqn(276) [Reproduced from (Moy Jiao et al 1999)] This can be compared to the result obtained from a more rigorous analysis
⎡9πJR 2(1minus ν 2 ) 13 ⎤
a = ⎢ ⎥ (276)2E⎢ ⎣ ⎥⎦
and to experimental data obtained from spherical beads made from a 4 agarose gel (Fig 3113)
Models for receptor-mediated adhesion
In Chapter x and in the preceding text we discussed the energetics of bond formation and release
as well as the effect of applied force in altering the energy landscape of the bonded pair and
thereby the rate constants for bond kinetics That analysis has obvious implications to the
44
CHAPTER 21 CELL MEMBRANE MECHANICS AND ADHESION copyRD Kamm 4615
adhesion of cells to substrates the surrounding extracellular matrix and other cells Here we
extend that analysis in the specific case of whole cell adhesion In doing so it will be important
to consider such factors as the distribution type and density of receptor-ligand bonds or
potential bonds and the elastic properties of the structures to which they are anchored On the
intracellular side this involves the series of couplings that link the receptor to the cell In the
simplest case this might simply be a link to the lipid bilayer if the receptor has no intracellular
connections More typically especially for couplings with a structural role it involves a series
of proteins ultimately linking the receptor to the cytoskeleton
The typical setting in vivo is one in which cells adhere to other cells or to the extracellular
matrix Adhesions are more easily probed however through in vitro experiments (described
below) where cell adhesion more often occurs to an artificial substrate mediated through one of
several extracellular proteins that are used to coat the surface Generally either collagen or
fibronectin is used Cells are often adhered to these substrates but to produce a more controlled
environment rigid beads are sometimes coated with the appropriate receptors so that one specific
receptor-ligand interaction can be probed While these systems are useful as models of certain
adhesion phenomena it is important to recognize in the interpretation of these experiments that
when bound to a rigid substrate or bead the binding proteins cannot freely diffuse as they would
in a more natural environment In particular the formation of focal adhesions would not occur in
bead-substrate experiments because the receptors would be constrained from aggregating
It is instructive to begin this discussion with a consideration of a single adhesion bond
for example one linking the actin matrix of the cytoskeleton to a β1 integrin and the integrin
receptor binding to the extracellular matrix beyond the cell membrane (Fig 3114) If the bond
is stressed as for example if the cell experiences a force relative to the ECM it will at first
stretch an amount dictated by the level of force in the bond and the stiffness of the complex
Each bond as well as each protein in the bond complex can be thought of as having a certain
stiffness giving rise to a picture in which several springs are considered connected in series
Forces acting on the adhesion complex are transmitted via this series of bonded proteins between
the CSK and the ECM producing local deformations and stresses in the corresponding matrices
that decay with distance from the adhesion site On the intracellular side these forces are
transmitted via a complex involving vinculin α-actinin paxillin and talin Attachment to the
extracellular matrix is mediated by an RGD sequence (in fibronectin for example) which in turn
has binding sites for collagen and fibrin If the force is sufficiently strong above a certain
threshold value F0 say and applied for a sufficiently long time the bond might be severed (deshy
couple) Typical values of this threshold force lie in the range of 10-100 pN (Evans and Ritchie
1997) but depend as well on the rate at which the force is increased Under more rapid
forcings the threshold is high compared to when the force is increased slowly This simply
45
CHAPTER 21 CELL MEMBRANE MECHANICS AND ADHESION copyRD Kamm 4615
reflects the fact that detachment is a stochastic process and that at any given level of force there
exists a finite probability of detachment and this probability increases with time
Fig 3114 One type of attachment linking the intracellular actin matrix to the extracellular matrix via an integrin complex that involves in addition vinculin α-actinin paxillin and talin (Reproduced from Lodish et al Molecular Cell Biolology 2000)
We need also to consider that in equilibrium a fraction Φ = K(1+K)-1 (where K is the
equilibrium constant) of the receptors will be bound at any given time and that the receptorshy
ligand complexes are continually cycling between the bound and unbound states characterized
by their respective rate constants
On a larger scale numerous adhesion sites typically act in parallel each contributing
some amount to the total adhesion force If the force transmitted by each single adhesion
complex is F and the density of adhesion sites (per unit membrane area) is NC then the stress
acting on the cell is the product F NC This gives a somewhat false impression however as it is
unlikely that each adhesion complex carries an equal force Put another way there exists a local
stress τ that can be thought of as the product of the average force per bond times the bond
density This stress is typically non-uniform In the adhesion of a cell to a flat substrate the
bonds near the periphery of the contact zone determine the strength of the cell against
detachment and when the cell is subjected to a detaching force the stresses are concentrated in
46
CHAPTER 21 CELL MEMBRANE MECHANICS AND ADHESION copyRD Kamm 4615
this peripheral region as depicted in Fig 3115 In the vicinity of the edge of adhesion several
factors will influence the stress distribution including the mechanical properties of the membrane
(in particular the bending stiffness KB) the receptor density the spring constants of the bond
and the bond strength
N
Region of adhesion
x1
Fig 3115 Schematic model of a cell membrane being detached from a substrate by application of a tension force N The membrane is free to the left of the dash-dot line and adherent to the right Forces and moments are transmitted through the membrane which adheres to the membrane through receptor-ligand bonds represented by a continuous distrubution p(x1)
To illustrate consider the following simple model for an adherent cell being peeled away
from its substrate by a force that generates a tension N in the membrane (Fig 3115)
Deformations in the membrane are described by eqn (223) where it can be shown that the
bending term dominates provided KbL2 gtN where L is the characteristic length in the x1 direction
(due to the small length scales involved) and the external membrane force (p in the membrane
equation) is now the non-uniform stress due to adhesion bonds As a simple first approximation
we take p = k(δminusδ0) with δ-δ0 being the amount of stretch in the receptor-ligand bond springs
and k an effective bond spring constant Recognizing that p approaches zero far from the edge
(see Fig 319) the membrane displacement and the spring displacement are related u3 = δ-δ0
Thus eqn (228) is written
⎛ part 4 u
KB⎜ 3
⎞ 4 ⎟ = NC F = NC ku
⎝ partx ⎠ 3 (277)1
This can be solved directly showing that the distance of separation between the cell membrane
and substrate grows in an exponential fashion with distance Even more simply a scaling
47
CHAPTER 21 CELL MEMBRANE MECHANICS AND ADHESION copyRD Kamm 4615
analysis of eqn (277) in which the term on the left is approximated by Kbu3w4 where w is the
characteristic distance over which u3 varies tells us that the stresses are concentrated in a region
of width
K
w prop B4 (278)
NC k
near the cell periphery Similarly we can estimate that the cell membrane will detach from the
substrate if N gt FoNCw where F0 is a measure of the force in a single bond at the time of bond
rupture and that the rate of peeling can be roughly approximated as the product of the
disassociation rate k -- (bondss) from eqn (265) and the distance between bonds (N -12C )
Although this provides some insight into how the peeling rate depends on the various factors it fails to capture the fact that the cell remains in an equilibrium attached state even for non-zero levels of tension reflecting that even under force a balance can exist between the rates of formation and rupture of receptor-ligand complexes (Ra Picart et al 1999)
It is also of interest to note that in the region near the edge of the attachment zone(x1=0
in Fig 3115) the membrane acts as a beam subjected to a moment due to the applied tension
This moment is balanced by a force couple due to tension in the adhesion complexes right
adjacent to the edge in combination with a compressive stress between the cell and substrate a
little further in In typical situations this compressive stress can approach levels as high as one
atmosphere and can act to effectively smooth the membrane and recruit new attachment sights While using these continuum descriptions it is important to keep in mind the true
discrete nature of the individual bonds represented in the model as a continuous adhesive
surface This is brought to light by a simple calculation in which the characteristic length over
which the applied tension is supported w is compared to the inter-receptor spacing N -12C
Using typical values for the parameters NC = 103 complexesμm-2 k = 10-5 to 10-6 Nm Kb = 1 to 2x10-18 Nm we find that w cong 01 to 03 μm and the inter-complex spacing N minus1 2
C cong 003 μm While it is reassuring to see that w is typically less than the inter-complex spacing the difference is small It is therefore not surprising that the actual process of cell peeling is stochastic in nature occurring in a sequence of more-or-less discrete steps with a velocity of peeling that varies widely from the mean
The interplay between receptor-ligand bonding and membrane stiffness also determines whether a cell will spread over a surface or peel away from it under a given tension Membrane bending stiffness acts to maintain the membrane and substrate within close proximity near the edge of contact (Fig 3115) Spreading can occur only if their separation distance is within the extended length of the receptor ligand bond over a distance comparable to the linear spacing
48
CHAPTER 21 CELL MEMBRANE MECHANICS AND ADHESION copyRD Kamm 4615
between neighboring bonds ( N minus1 2 C ) Under high tension the surfaces rapidly diverge and
spreading is prevented if the tension is sufficiently low receptor-ligand bonding can occur and spreading can occur
Measurements of adhesion
A variety of methods have been used to experimentally determine the strength of adhesion either
of individual receptor-ligand bonds or populations of bonds as in the case of entire cells
Whole cell experiments are more common and typically require less experimental
sophistication The drawback of course is that they provide only for estimates of average
properties and require certain assumptions regarding the distribution of cell-substrate adhesive
stress for interpretation to the level of a single bond Several of these methods are described
next
Centrifugal cell adhesion assays In this experiment cells are allowed to attached to a substrate
then are placed in a centrifuge rotating at speed ω positioned a distance r from the center of
rotation and oriented so that the net centrifugal force is acting to separate the cell from the
substrate Using the arrangement shown in Fig 3116 (right) the acceleration of the cells is 2ω r and the net force acting on a cell of volume Vc is F = (ρc minus ρf )ω 2rVc where the fluid and cell densities are ρf and ρc respectively
Interpreting these results we can make several different assumptions each leading to a different estimate for the maximum force experienced by the binding complex If we simply assume that all receptor-ligand complexes support an equal fraction of the total force F then the force per bond is f = F (πa 2NC ) where NC is the concentration of bond complexes However as the cell tears away from the substrate the edge bonds will break first since these experience the greatest level of force An alternative approach then is to assume that the adhesion complexes around the cell circumference support the entire load leading to the estimate f = F 2( πaN 1 2 ) recognizing that N1 2
C C is the average distance between bonds A somewhatmore accurate value for f might be obtained if we assume that all complexes within the distance w given by eqn (278) support the load In any of these cases once the centrifugal force exceeds some critical limit since the number of receptors supporting the load falls as the region of contact becomes smaller the force per bond increases and the cell will rapidly detach
Stochastic variability also needs to be taken into account however since even under a constant load any single bond has a finite probability of failure under a given level of force The equilibrium state of the cell then should be viewed as one in which the rate of bond formation equals the rate of bond breakage with increasing force having the effect of reducing the
49
CHAPTER 21 CELL MEMBRANE MECHANICS AND ADHESION copyRD Kamm 4615
probability that the bond will remain intact These effects can be addressed using the methods described in more detail in Chapter xx Parallel flow assay Another common method for assessing cell adhesion is to plate the cells onto one wall of a parallel flow chamber subject them to a fluid dynamic shear stress and observe at what flow rate the cells begin to release If we ignore flow details in the immediate vicinity of the cell the shear stress can be estimated from the solution for a fully developed (Poiseuille) velocity profile
3V ⎡ y2
⎛ ⎞ ⎤v(y) = ⎢1minus ⎥ (279)
2 ⎝ ⎠ ⎣ ⎢ h ⎥⎦
so that the shear stress acting on the cell is
⎛ dv ⎞ 6μV τw = μ⎜ ⎟ = (280)
⎝ dy ⎠ h y = minush
and the total force can be estimated as F asymp τw Ac where Ac is the surface area of the cell membrane exposed to the flow Consider as an example a flow of culture medium at a rate of 1 mls through a channel of height 01 cm and width 1 cm If the culture medium has a viscosity close to that of water (μ=001 dyns) the shear stress is obtained from eqn (280)
6 sdot (001dyn sdot s) sdot (1ml s) ( 01 sdot10cm2 )τ dyn cm 2w = = 6 = 06Pa
01cm This corresponds roughly with the level of shear stress experience by endothelial cells in the arterial system If we consider that the cell has a surface area with dimensions roughly 100 μm x 10 μm or about 103 μm2 then the total force acting on the cell is obtained by integrating the shear stress over the area of the apical membrane Assuming that the shear stress is uniform the force is simply the product of shear stress and surface area or about 1 nN in the present example Again interpretation of results from such experiments requires careful consideration of the distribution of forces among the individual adhesion complexes In this situation the cell is likely to peel from the upstream edge in much the same manner as occurs in the cell peeling experiment discussed earlier
50
CHAPTER 21 CELL MEMBRANE MECHANICS AND ADHESION copyRD Kamm 4615
Radial flow and spinning disk assays One disadvantage of the parallel flow assay is that all cells are subjected to essentially the same level of shear stress so the flow rate needs to be incrementally varied in order to determine the level of force required for detachment These two systems using an axisymmetric geometry circumvent this problem by producing an easily characterized radial variation in shear stress In the case of the radial flow assay fluid enters through a central channel and flows radially outward through the narrow gap between two circular plates From conservation of mass the mean flow velocity is given by
QV = (281)
2πrh and sufficiently far from the center (rgtgth) the velocity profile is parabolic as in the parallel flow assay and the shear stress is again governed by eqn (280) using (281) for V Q
ω
(Not to scale)
v
h h
Cell layer rc Ce l l layer rc
r r
Fig 3116 Schematic diagram showing the radial flow assay (left) and the spinning disk assay (right) In the radial flow assay shear stress attains a maximum value near the center and falls with increasing radius r whereas in the spinning disk system maximum shear stress is experienced at large r In the spinning disk assay cells are grown on one disk and the opposite disk is rotated at constant speed Provided the rate of rotation is sufficiently small that inertial effects can be neglected the velocity is purely in the circumferential direction and the profile is linear between the two plates so that the shear stress experienced by the cells can easily be computed as
ωr τw = μ (282)
h
51
CHAPTER 21 CELL MEMBRANE MECHANICS AND ADHESION copyRD Kamm 4615
In both of these cases as in the parallel flow assay the total force is obtained by integrating the shear stress over the cell surface and the distribution of force among the adhesion complexes is weighted toward those located near the upstream end of the cell This can also be seen by consideration of the torque exerted by shear stress on the cell that must be balanced by a nonshyuniform contact stress with the substrate that is greatest near the upstream end Single bond adhesion assays Two other assays provide a means of obtaining estimates for the strength of a single adhesion bond without the need for excessive interpretation These rely on an ability to isolate a small number of bonds or even a single bond and infer bond strength from the step-wise nature of the de-adhesion process associated with breakage of discrete bonds One of these methods employs the atomic force microscope coated with the ligand of an adhesion receptor as shown in Fig 3117 The probe tip is gradually brought up to the cell surface until one or more receptor-ligand bonds are formed When the probe tip is withdrawn it moves along a different trajectory on a force-displacement plot reflecting the forces of adhesion These forces are seen to jump between more or less discrete levels as the probe continues to be moved away from the cell with each jump corresponding to the breakage of a single bond (Fig 3117) Using this method the bond strength between integrin receptor and a variety of RGD-containing ligands was found to lie in the range of 30 to 100 pN (Lehenkari and Horton 1999)
Fig 3117 The strength of a single adhesion bond can be measured by bringing a functionalized tip of an AFM probe up to the cell allowing bonds to form then slowly withdrawing the probe Monitoring the differences between the force displacement curve between the forward and reverse motions the forces necessary to break a single receptor-ligand bond can be determined [Reproduced from (Lehenkari and Horton 1999)]
52
CHAPTER 21 CELL MEMBRANE MECHANICS AND ADHESION copyRD Kamm 4615
A second method is similar in that the discrete increments in force are monitored as individual receptor-ligand bonds are broken but the forces are measured by means of changes in the shape of a giant vesicle the membrane of which contains the ligands have been inserted In this case one vesicle is made effectively rigid due for example to a high surface tension A second vesicle containing the adhesion molecules is also drawn partially into a micropipet but is much more complaint than the first The two vesicles are then brought into point contact so that one or a small number of adhesions are formed As the pipets are moved apart the compliant vesicle distorts due to the force of adhesion which it can be shown is related to the change in dimension of the vesicle in the direction of the force thereby serving as a sensitive force transducer measuring forces in the range of single adhesion receptors or between 1 and 100 pN [Evans 1991 37]
(For specific examples of leukocyte rolling and attachment see Orsello or Chang amp Hammer)
[This process is initiated for example by local infection that causes the release of
chemotactic agents in addition to cytokines hellip
Models of this process draw upon many of the concepts discussed in this chapter ]
Transient cell adhesion
Concepts of transient adhesion and release are of particular importance in the case of leukocyte
rolling adhesion and transmigration across the endothelial layer of a blood vessel In addition
cell migration through extracellular matrix or along a substrate requires the ability of the cell to
both form and release adhesions
One problem that has received considerable attention is the interaction between an
adherent or rolling leukocyte and the adhesion receptors on the endothelium These studies are
complicated by the three-dimensional nature of the flow the compliance of the interacting
surfaces and receptor-ligand dynamics In a series of recent studies Hammer and co-workers
(Chang Tees et al 2000) have addressed several of these issues computing the viscous force
and torque acting upon a sphere near to planar wall from the mobility matrix (Hammer and Apte
1992) and using the ldquoBell modelrdquo of receptor binding (Bell 1978) but neglecting the effects of
cell deformation The Bell model relates the dissociation rate constant kr to the force in the
bond f the thermal energy kBT and a parameter with units of length that depends on the
reactivity of the molecule
kr = ko r exp(γf kBT ) (283)
53
CHAPTER 21 CELL MEMBRANE MECHANICS AND ADHESION copyRD Kamm 4615
A Monte Carlo method is employed at each time step in the calculation to determine bond
formation or breakage In these studies the nature of the leukocyte-endothelial interaction is
characterized as firm adhesion rolling adhesion bimodal adhesion or no adhesion and mapped
as a function of the two parameters of the Bell model in Fig 3 The boundaries of the rolling
adhesion regime are identified for a wall shear rate of 100 s-1 (dotted lines) or 30 and 400 s-1
(solid lines) Most literature values for the Bell model parameters for a variety of selectin
receptors (known to be instrumental in leukocyte rolling) correspond to the rolling adhesion
regime for typical shear rate of 100 s-1 An interesting but counterintuitive result from this study
was the observation that as the bond stiffness was increased from the value used in most
calculations (100 dyne cm-1) adhesiveness decreased which the authors attribute to reduced
deflection for a given level of force leading subsequently to more rapid dissociation
Fig 3118 The state diagram for a leukocyte interacting with an endothelial surface for shear rates ranging from 30 to 400 s-1 For low dissociation rates the leukocyte remains adherent to the surface (lower left) As either (γ) or ( ko
r ) [see Eqn (283) for definitions] is increased the cell first adheres firmly then rolls along the wall then completely detaches (upper right) Rolling adhesion is defined as the regime where rolling occurs over some part of the shear rate range between 30 and 400 s-1 Firm adhesion indicates that cells remain attached even at the highest shear rate no adhesion indicates that cells roll at a velocity gt 50 of the velocity of a non-adherent sphere In the bimodal regime cells are either adherent or non-adherent and do not exhibit rolling Dotted curves correspond to these same boundaries for a shear rate of 100 s-1 Reproduced from Chang et al (2000)
54
CHAPTER 21 CELL MEMBRANE MECHANICS AND ADHESION copyRD Kamm 4615
In another recent study using high-resolution video-microscopy (Schmidtke and Diamond
2000) it was demonstrated that a flowing neutrophil can attach to an adherent platelet via
adhesion molecules located in the tips of the microvilli and form long tethers averaging nearly 10
μm in length but ranging up to 40 μm at extensional rates of 6-40 μm s-1 for shear rates ranging
from 100-250 s-1 The mechanics of tether formation is itself a fascinating topic that is still under
intense investigation Readers interested in pursuing this work in more detail are referred to the
several papers (Hochmuth Shao et al 1996 Dai and Sheetz 1998 Dai and Sheetz 1999) that
identify a number of intriguing phenomena
55
CHAPTER 21 CELL MEMBRANE MECHANICS AND ADHESION copyRD Kamm 4615
317 Nomenclature Parameter Definition Units
R - receptor
L - ligand
C - receptor-ligand complex
G - Gibbs free energy Nm
N - membrane tension Nm
NR - total receptor density -3μm-2 in 2D or μm in 3D NL - total ligand density μm-2 in 2D or μm-3 in 3D N in 2D or μm-3μm-2
C - complex density in 3D NRf - free receptor density m-2 in 2D or m-3μ μ in 3D NLf - free ligand density -2 -3μm in 2D or μm in 3D d+ - forward diffusional rate constant 2 -1μm s-1 in 2D or 3 μm s in 3D d -1
- - reverse diffusional rate constant s r+ - forward reaction rate constant s-1
r- - reverse reaction rate constant s-1 D 2 -1
m - membrane diffusion coefficient μm s D - solution diffusion coefficient m2 s -1s μ Kb - bending stiffness Nm K 0 - equilibrium constant or affinity (zero force) M-1 in 3D and 2μm in 2D = k0
+ k0 minus
K - equilibrium constant M-1 in 3D and m2μ in 2D = k+kshy
k0 - association rate constant (zero force) M-1 s-1 in 3D or m-2 -1+ μ s in 2D
k0 - dissociation rate constant (zero force) s-1 minus
k - association rate constant M-1 s-1 in 3D or m-2 -1+ μ s in 2D
kminus - dissociation rate constant s-1 f - force per bond N F - total adhesion force N γ - empirical parameter μm r0 - distance over which energy minimum acts μm E0 - bond energy J k JK-1
B - Boltzmanns constant T - temperature K τ - bond lifetime s
56
CHAPTER 21 CELL MEMBRANE MECHANICS AND ADHESION copyRD Kamm 4615
τ0 - bond lifetime with zero force s σ - adhesion stress N μm-2 κ - spring constant for receptor-ligand bond N μm-1
57
CHAPTER 21 CELL MEMBRANE MECHANICS AND ADHESION copyRD Kamm 4615
References Bell G I (1978) Models for the specific adhesion of cells to cells Science 200 618-627 Caille N O Thoumine et al (2002) Contribution of the nucleus to the mechanical properties
of endothelial cells J Biomech 35(2) 177-87 Chang K C D F Tees et al (2000) The state diagram for cell adhesion under flow
leukocyte rolling and firm adhesion Proc Natl Acad Sci U S A 97(21) 11262-7 Dai J and M P Sheetz (1998) Cell membrane mechanics Methods Cell Biol 55 157-71 Dai J and M P Sheetz (1999) Membrane tether formation from blebbing cells Biophys J
77(6) 3363-70 Daily Elson et al (1984) Determination of the elastic area compressibility modulus of the
erythrocyte membrane Biophys J 45(4) 671-682 Evans E and K Ritchie (1997) Dynamic strength of molecular adhesion bonds Biophys J
72(4) 1541-55 Evans E A (1983) Bending elastic modulus of red blood cell membrane derived from
buckling instability in micropipet aspiration tests Biophys J 43(1) 27-30 Hammer D A and S M Apte (1992) Simulation of cell rolling and adhesion on surfaces in
shear flow general results and analysis of selectin-mediated neutrophil adhesion Biophys J 63(1) 35-57
Hardt S L (1979) Rates of diffusion controlled reactions in one two and three dimensions Biophysical Chemistry 10 239-243
Hochmuth F M J Y Shao et al (1996) Deformation and flow of membrane into tethers extracted from neuronal growth cones Biophys J 70(1) 358-69
Kucik D F E L Elson et al (1999) Weak dependence of mobility of membrane protein aggregates on aggregate size supports a viscous model of retardation of diffusion Biophys J 76(1 Pt 1) 314-22
Kusumi A Y Sako et al (1993) Confined lateral diffusion of membrane receptors as studied by single particle tracking (nanovid microscopy) Effects of calcium-induced differentiation in cultured epithelial cells Biophys J 65(5) 2021-40
Lehenkari P P and M A Horton (1999) Single integrin molecule adhesion forces in intact cells measured by atomic force microscopy Biochem Biophys Res Commun 259(3) 645-50
McCloskey M and M M Poo (1984) Protein diffusion in cell membranes some biological implications Int Rev Cytol 87 19-81
Meleard P Gerbeaud C Bardusco N Mitov MD and Ferdandex-Puente L (1998) Mechanical properties of model membranes studied from shape transformations of giant vesicles Biochimie 80 401-413
Moy V T Y Jiao et al (1999) Adhesion energy of receptor-mediated interaction measured by elastic deformation Biophys J 76(3) 1632-8
Ra H J C Picart et al (1999) Muscle cell peeling from micropatterned collagen direct probing of focal and molecular properties of matrix adhesion J Cell Sci 112 ( Pt 10) 1425-36
Saffman P G (1976) Bownian motion in thin sheets of viscous fluid Journal of Fluid Mechanics 73 593-602
Schmidtke D W and S L Diamond (2000) Direct observation of membrane tethers formed during neutrophil attachment to platelets or P-selectin under physiological flow J Cell Biol 149(3) 719-30
Sheets E D R Simson et al (1995) New insights into membrane dynamics from the analysis of cell surface interactions by physical methods Curr Opin Cell Biol 7(5) 707-14
58
CHAPTER 21 CELL MEMBRANE MECHANICS AND ADHESION copyRD Kamm 4615
Vink H and B R Duling (1996) Identification of distinct luminal domains for macromolecules erythrocytes and leukocytes within mammalian capillaries Circ Res 79(3) 581-9
Waugh R and E A Evans (1979) Thermoelasticity of red blood cell membrane Biophys J 26(1) 115-31
Zeman K H Engelhard et al (1990) Bending undulations and elasticity of the erythrocyte membrane effects of cell shape and membrane organization Eur Biophys J 18(4) 203shy19
Zhelev D V D Needham et al (1994) Role of the membrane cortex in neutrophil deformation in small pipets Biophys J 67(2) 696-705
59
MIT OpenCourseWarehttpocwmitedu
20310J 3053J 6024J 2797J Molecular Cellular and Tissue BiomechanicsSpring 2015
For information about citing these materials or our Terms of Use visit httpocwmiteduterms
CHAPTER 21 CELL MEMBRANE MECHANICS AND ADHESION copyRD Kamm 4615
approaches that are used to study the adhesion of cells based either on thermodynamics or
mechanics Methods for the measurement of adhesion strength are described providing
estimates for the force that a cell can exert on its surroundings Various examples will be
presented but the adherence of leukocytes to the endothelium and the role of adhesion in cell
migration will receive special attention
Functions of adhesion
Adhesion has been found to be an essential process necessary for a variety of fundamental
cellular functions
bull Structural integrity Adhesion helps to maintain the overall structural integrity of the
tissue in muscle for example it provides the means of force transmission from the cells
to the surrounding matrix to allow contraction In non-contractile cells it still provides
the needed mechanical coupling to the surrounding tissue necessary for a variety of
cellular functions
bull External sensing Adhesion provides a means by which the cell can sense and
subsequently respond to its surroundings Forces transmitted directly to the cell
membrane or to the cytoskeleton via transmembrane proteins may trigger a variety of
biochemical reactions within the cell as we shall see later in Chapter 33
bull Migration Cell-matrix adhesion is an essential element in cell migration a cell propels
its way through tissue or along a surface through a process involving adhesion
contraction and release also described in Chapter 33
bull Regulation of transport Sites of cell-cell adhesion are often important in the regulation
of transport across a cell layer such as in the case of an epithelium or endothelium
bull Communication Sites of mechanical coupling often provide a means of cell-cell
communication as in the case of gap junctions which offer a pathway for the diffusion
of ions and small molecules between adjacent cells
Adhesion molecules
Cells adhere to their surroundings or to an artificial substrate via a wide variety of different
proteins that can be classified into five major families integrins selectins cadherins
immunoglobulins and transmembrane proteoglycans (Table 1) In terms of their mechanism of
attachment to other cells or the external matrix these can be classified as either homophillic ndash
binding to like molecules heterophillic ndash binding to unlike molecules or those that bind to other
cells through an extracellular linker molecule
Integrins one of the largest class of adhesion molecules are primarily used to attach cells
to the extracellular matrix or the basal lamina but are also present in some cell-cell adhesion
33
CHAPTER 21 CELL MEMBRANE MECHANICS AND ADHESION copyRD Kamm 4615
complexes They typically bind to the matrix via the RGD amino acid sequence (arginine
glycine aspartic acid) but can also contain other binding motifs Integrins are heterodimers in
that they always contain an α and a β subunit with the different isoforms determining the specific ligand to which the integrin binds Two specific types of adhesion focal adhesions and hemidesmosomes often contain integrins and the attachments they make can at times be stable but at other times transient so as for example to mediate cell migration The force of adhesion of a single integrin-ligand bond has been measured using atomic force microscopy and found to be in the range of 30-100 pN (Lehenkari and Horton 1999) with a relatively low binding affinity in the range of K ~ 10-6
D to 10-8 molliter By comparison typical cell-surface receptors bind with an affinity in the range of 10-9 to 10-11 molliter Integrins also play an important role in signaling since extracellular integrin binding is known to influence cytoskeletal morphology as well as the state of cell differentiation Adhesion molecules in the selectin family also tend to form transient bonds and are important in leukocyte adhesion and extravasation the migration of the leukocyte through the endothelium and into the tissue Consequently they tend to be found in cells of the circulation and are present both in leukocytes and endothelial cells and are instrumental in adhesion between these two cell-types during leukocyte rolling
Family Location andor Ligands Comments
function recognized
integrins focal adhesions (E) fibronectin relatively low
hemi-desmosomes collagen laminin affinities
leukocyte immunoglobulins (KD~ 10-6-10-8
(spreading) (I) actin filaments molliter)
adhesion primarily
cell-matrix adhesion
but also in some
cell-cell adhesions
selectins circulating cells and carbohydrates require Ca2+
endothelial cells
rolling adhesion
Ig superfamily important in integrins
(immunoglobulin) immune response homophillic
cadherens adherens junctions (E) homophillic require Ca2+
desmosomes (I) actin
34
CHAPTER 21 CELL MEMBRANE MECHANICS AND ADHESION copyRD Kamm 4615
filaments
intermediate
filaments
transmembrane fibroblasts (E) collagen bind various
proteoglycans epithelial cells fibronectin growth factors
(I) actin such as FGF
filaments
heterophillic
Table 1 Cell adhesion molecules and their characteristics
While both integrin and selectin binding is mediated by Ca2+ adhesion via the
immunoglobulin (Ig) superfamily of proteins is Ca2+ independent Some of the most prominent members of this family are the N-CAMs (Neural cell adhesion molecules) and ICAMs (Intracellular cell adhesion molecules) These tend to undergo homophillic bonding but some also bind to members of the integrin family
Cadherens are often expressed in the same cells as the selectins but form much stronger bonds and therefore play an important role in maintaining cell integrity Because of these attributes cadherens are the primary adhesion proteins in desmosomes and adherens junctions the major structural contacts cells form with other cells or the basil lamina These also form homophillic bonds by a Ca2+ dependent mechanism and mediate selective bonding between adjacent cells Cadherens are relatively short as compared to other adhesion molecules being
about 700-750 amino acid residues in length
Types of adhesion complexes
Cells have developed a variety of specialized adhesion complexes each utilizing one or more of
the adhesion molecules of Table 1 and each serving a specific purpose Typically the cell-cell or
cell-surface spacing is in the range of 10-20 nm but this is highly variable ranging from less than
1 nm when controlling transport to over 100 nm in regions where tight control is unnecessary
Below we describe the different types of junctions and where important for function their
mechanical characteristics
Gap junctions Cells need to communicate with their neighbors for a variety of reasons For
example cardiac myocytes transmit signals from cell to cell in order to maintain a synchronous
35
CHAPTER 21 CELL MEMBRANE MECHANICS AND ADHESION copyRD Kamm 4615
wave of contraction This is typically accomplished by providing a pathway for ions and small
signaling molecules between cells called gap junctions (Fig 3110) These minute channels are
typically comprised of a collection of six connexin proteins that cluster together in cylindrical
fashion forming a minute channel that passes molecules and ions less than about 1200 to 2000
MW (15-2 nm) Transport through these channels is regulated and their permeability drops in
the presence of high Ca2+ concentration as when a cell membrane is ruptured or with low pH
Cyclic AMP acting as a second messenger can be exchanged between cells therefore gap
junctions provide a metabolic linkage between neighboring cells and provide a means by which
hormonal stimulation of just one cell can be transmitted to others
Adherens junctions Adherens junctions are belt-like structures that can be though of as the
structural weld that holds two cells together (Fig 3110) Because of their structural role
these junctions formed by homophilic bonding between proteins in the cadheren family are
anchored securely again via the adaptor proteins α β γ-catenin to the cytoskeleton
Desmosomes and Hemidesmosomes If the adherens junctions are the continuous welds between
cells desmosomes are the spot welds Again these serve primarily a structural purpose
joining two neighboring cells via a complex consisting of a dense plaque on the intracellular
sides of both cells extending 15-20 nm into the cell and consisting of a variety of proteins that
attach to keratin filaments part of the intermediate filament network Hemidesmosomes have
similar intracellular structure but attach instead to the basal laminae Based on their different
extracellular attachment sites desmosomes typically link to other cells via cadherens whereas
hemidesmosomes adhere via a type of integrin Both are commonly found in epithelial cells
36
CHAPTER 21 CELL MEMBRANE MECHANICS AND ADHESION copyRD Kamm 4615
Fig 3110 Schematic showing the different types of cell junctions present in an epithelial cell as found in the small intestine Tight junctions near the apical surface essentially prevent the passage of all molecules The spot desmosomes and adherens junctions provide for cell-cell anchoring and the hemidesmosomes for anchoring to the basal lamina Gap junctions provide a means for communication between neighboring cells [Reproduced from Lodish et al Molecular Cell Biology 2000]
Junction type Function Extracellular or Intracellular
adjacent cell attachment
attachment
Adherens structural cell-cell or cell- ECM proteins or actin filaments
matrix cadherins in
adjacent cell
Desmosome structural cell-cell cadherin intermediate
filaments
Hemidesmosome structural cell-matrix basal lamina via intermediate
integrins filaments
Focal adhesions structural cell-matrix ECM proteins actin filaments
via integrins
Tight junction regulate transport between homophillic binding between the
cells and along cell transmembrane proteins occludin or
37
CHAPTER 21 CELL MEMBRANE MECHANICS AND ADHESION copyRD Kamm 4615
membrane claudins
Gap junctions cell-cell communication channels formed by connexin
via ion and small molecule subunits
exchange
Table 2 Adhesion complexes
Focal adhesions A second means by which cells attach to the extracellular matrix is through
focal adhesions These serve a similar function to the hemidesmosomes and share a common
linkage via integrins to the ECM but are attached on the intracellular side instead to the actin
filaments of the cytoskeleton Actin filaments converge at the site of focal adhesions forming
stress fibers strong actin bundles that attach to the β-subunit of the integrins via adapter
proteins such as actinin vinculin and talin Focal adhesions are instrumental in cell migration
and for this purpose need to be easily formed and disrupted as the cell moves forward Release
or de-adhesion of cells is often mediated by a class of peptides called dis-integrins that
competitively bind to the RGD site used by integrins to attach to a variety of matrix molecules
Tight junctions Control of transport is generally mediated by tight junctions that form an
intricate network of seams between two cells (Fig 3111) As their name implies these are the
tightest of the cell-cell junctions and the gaps they leave are often small enough to exclude even
the smallest ions and molecules Formed by homophillic binding between the transmembrane
proteins occluding and claudins tight junctions allow epithelial cells to perform their critical role
in transepithelial transport and provide for maintenance of differences in concentration between
the apical and basal surfaces of these cells Since occludins are not capable of forming rigid
structural bonds with the cytoskeleton they are most often associated in a junctional complex
with adherens junctions or desmosomes that fulfill the structural needs of attachment
38
CHAPTER 21 CELL MEMBRANE MECHANICS AND ADHESION copyRD Kamm 4615
Fig 3111 Tight junctions in an epithelial cell shown schematically (a) in a freeze fracture replica (b) and in a transmission electron micrograph (c) [Reproduced from Alberts et al 1994]
Fig 3112 Two types of bond that attach a cell to the extracellular matrix by means of clusters of integrins On the extracellular side integrins bind to the matrix proteins fibronectin and laminin Inside the cell they attach to the cytoskeleton via adaptor proteins to either actin filaments (focal adhesions) or intermediate filaments (hemidesmosomes) [Reproduced from Lodish et al Molecular Cell Biolology 2000]
Non-specific binding
Cells can adhere to their surroundings by either non-specific or receptor-ligand (specific)
bonding Though both mechanisms are likely active in most situations as we will see receptorshy
39
CHAPTER 21 CELL MEMBRANE MECHANICS AND ADHESION copyRD Kamm 4615
ligand bonding is the stronger of the two by a considerable margin and is therefore the most
relevant biologically In situations for which either the receptors or their ligands are not present
however such as might be the case in certain in vitro experiments non-specific binding can be
important as well
There are essentially three major forms of non-specific attractions to consider
bull Van der Waals ndash These attractive forces arise due to charge interactions in polar
molecules They tend to dominate among the non-specific mechanisms at
intermediate distances around 20-25 nm [see Boal]
bull Electrostatic ndash These interactions can be either attractive or repulsive depending
on the sign of the surface charges and are particularly important during the
approach of two cells since the glycocalyx has a high negative charge density
bull Steric ndash These forces arise due to the steric exclusion of two molecules as they are
brought into close contact In the case of cell-cell interactions steric repulsion is
due to the compression of the two glycocalyx layers and the tendency to resist
compression resulting from osmotic effects and the elasticity of the layer Steric
forces tend to dominate for small separation distances lt 10 nm
In combination these effects combine to produce a net attractive force per unit area of
about 100 Pa at a separation distance of about 25 nm
Adhesion by means of receptor-ligand binding
We can use the analysis of Chapter xx to estimate the strength of a receptor-ligand bond and
based on typical values for bond density calculate the corresponding strength of adhesion
between two cells or between a cell and a surface Recall that the application of force to a
receptor-ligand bond modifies the dissociation rate constant for the binding reaction This effect
can be modeled in several ways but the result obtained by Bell ((Bell 1978)) suggests the
following exponential form for the dissociation rate
0 ⎛ γf ⎞ 0 ⎛ γσ ⎞ kminus = kminus exp⎜ ⎟ = kminus exp⎜ ⎟ (265)
⎝ kBT ⎠ ⎝ NC kBT ⎠
where k0minus is the unforced dissociation rate constant γ is a factor with the units of length that
corresponds roughly with the distance separating the bonded pair at equilibrium NC is the concentration of bonded complex and σ is the average bond force per unit area To determine
40
CHAPTER 21 CELL MEMBRANE MECHANICS AND ADHESION copyRD Kamm 4615
the rate of change of the concentration of bonded pairs one must solve the following rate equation describing the competition between bond formation (first term) and destruction (second term)
dNC ⎛ γσ ⎞
cong k+ (NR minus NC )(NL ) minus kminus NC = k+ (N minus )( 0R NC NL ) minus kminus NC exp⎜ ⎟ (266)
dt ⎝ NC kBT ⎠
where NR and NL are the concentrations of receptors and ligands respectively and we have
assumed that NCltltNL and that all bonds are stressed equally At equilibrium dNCdt=0 and if
the force applied to detach the cell (equal to the average bond stress σ) is increased
incrementally from zero NC will progressively fall to a new equilibrium value At sufficiently
high levels of force however increasing σ further eventually gives rise to a situation in which equilibrium can no longer be achieved through a reduction in NC At that point NC tends toward zero and the cell separates from the surface to which it was attached It can be shown that this
occurs when (Bell 1978)
k 0
α c exp(α + c + 1) = N
k 0 L (267)minus
σ
where α minγ c equiv and σmin is the minimum stress needed to cause detachment For a wide
NRkBT
range of conditions eqn (267) has the approximate solution
⎛ k0 + ⎞
α c cong 07 ln L (268)⎜ 0 N ⎟⎝ kminus ⎠
so that the critical stress for detachment can be expressed as
N 0
σ cong 07 C kBT ⎛ k ⎞ ln⎜
+ min N ⎟ (269)
γ ⎝ k0 L minus ⎠
where NC is determined from setting eqn (266) to zero under these critical conditions
Thermodynamic approach to cell adhesion
Although we focus here on the mechanical aspects of cell adhesion this process can also be
viewed from a thermodynamic perspective In this approach adhesion is considered in terms of
the change in energy specifically the Gibbs free energy G associated with all the individual
receptor-ligand interactions as well as the various non-specific forces of attraction or repulsion
The adhesion of a cell to a given surface then can be viewed as an equilibrium state determined
41
CHAPTER 21 CELL MEMBRANE MECHANICS AND ADHESION copyRD Kamm 4615
by minimization of the free energy If in undergoing a transition from a free state to an adherent
state the system represented by the cell and surface experiences a reduction in free energy ie
ΔGlt0 then adhesion will occur and the equilibrium state of adhesion will be determined by that with the minimum in free energy or the largest value of -ΔG While this approach ignores
many of the subtleties of the interactions and like the analysis above assumes that all receptorshy
ligand interactions are identical from an energetic point of view it is useful in providing some
simple insights as seen in the next two examples
Example Comparison of specific and non-specific adhesive forces Non-specific bonding due
to the combined effects of van der Waals electrostatic and steric forces result in an attractive
stress of approximately 100 Pa Receptor-ligand bonding give rise to forces that can be
estimated from the change in free energy f ~ to 4x10⁻⁴ dynbond = 9x10-11 to 4x10⁻⁹ ΔGr~9x10⁻⁶ Nbond where f is the force required to break the bond and r is a measure of the distance the bond stretches before it breaks Using a typical density of the receptor-ligand complex NC of ~1012-1015 bondsm2 gives a total bond stress of N 1
C x f ~ 9 x 10 to 4x10⁶ Pa The above kinetic approach to estimating bond strength [eqn (269)] gives a value approximately half of that from this equilibrium approach In either case however the conclusion remains the same non-specific binding can under certain circumstances be important since it is comparable to the lowest estimates of receptor-ligand-mediated bond strength but not surprisingly the latter is quite likely to dominate in nearly all practical situations
Example JKR theory for the equilibrium area of adhesion between a cell and substrate
It is well known that cells tend to take on a more flattened shape as the substrate to which they
are attached becomes more strongly adhesive either by coating with a more attractive ligand or
by increasing the concentration of ligand bound to the substrate Conversely less adhesive cells
round up and become more spherical These observations can be explained with the help of a
simple scaling analysis on the assumptions of small deformation of a linear elastic cell
Let the cell be modeled as a homogeneous elastic sphere with elastic modulus E and
initial radius R (Fig 3113) It is then brought into contact with a surface to which it adheres
As the cell adheres it attains a lower energy state characterized by an adhesion energy per unit
area J Formation of a flat adhesion surface however requires deformation within the elastic
cell and an associated increase in the stored elastic energy In Chapter 31 we showed that the
stored elastic energy per unit volume can be written
UE asymp int τεdV asymp int 1 2 Eε 2dV (270)
Vc Vc
42
CHAPTER 21 CELL MEMBRANE MECHANICS AND ADHESION copyRD Kamm 4615
Strain inside the cell can be approximated as the displacement of the cell surface δ divided by the characteristic distance within the cell to which the deformations penetrate a distance that scales with the lateral extent of the contact region 2a so that ε prop δ a where it can easily be shown from the geometry that a 2 asymp 2δR so that ε prop δ R Combining and dropping all numerical constants we obtain the following scaling approximation
δUE prop E ( )δR
3 2 (271)R
An expression for the total energy of the system then can be written
U prop minusJa2 + Eε2a3 prop JδR + Eδ 5 2R1 2 (272) The equilibrium state corresponds to the value of δ having the minimum energy obtain from
partU prop minusJR + Eδ 3 2R1 2 (273)
partδ so that
23 1 3 ⎛ JR12 ⎞ ⎛ JR2 ⎞
δ prop ⎜ ⎟ and a prop ⎜ ⎟ (274)⎝ E ⎠ ⎝ E ⎠
The exact solution to this problem yields the result
⎡ ) 1 3 2 1( minusν 2 ⎤ 9πJR
a = ⎢ ⎥ (275)⎢ 2E ⎥⎣ ⎦
43
CHAPTER 21 CELL MEMBRANE MECHANICS AND ADHESION copyRD Kamm 4615
Elastic modulus E adhesion energy per unit area J
2a
Fig 3113 Experiments to determine the contact area of an iminobiotin functionalized agarosebead on a glass coverslip in water Top Schematic of adherent bead Bottom Results for a range of bead radii Solid line is a fit to the date which obeys the power law a prop R23 consistent with the prediction of JKR theory eqn(276) [Reproduced from (Moy Jiao et al 1999)] This can be compared to the result obtained from a more rigorous analysis
⎡9πJR 2(1minus ν 2 ) 13 ⎤
a = ⎢ ⎥ (276)2E⎢ ⎣ ⎥⎦
and to experimental data obtained from spherical beads made from a 4 agarose gel (Fig 3113)
Models for receptor-mediated adhesion
In Chapter x and in the preceding text we discussed the energetics of bond formation and release
as well as the effect of applied force in altering the energy landscape of the bonded pair and
thereby the rate constants for bond kinetics That analysis has obvious implications to the
44
CHAPTER 21 CELL MEMBRANE MECHANICS AND ADHESION copyRD Kamm 4615
adhesion of cells to substrates the surrounding extracellular matrix and other cells Here we
extend that analysis in the specific case of whole cell adhesion In doing so it will be important
to consider such factors as the distribution type and density of receptor-ligand bonds or
potential bonds and the elastic properties of the structures to which they are anchored On the
intracellular side this involves the series of couplings that link the receptor to the cell In the
simplest case this might simply be a link to the lipid bilayer if the receptor has no intracellular
connections More typically especially for couplings with a structural role it involves a series
of proteins ultimately linking the receptor to the cytoskeleton
The typical setting in vivo is one in which cells adhere to other cells or to the extracellular
matrix Adhesions are more easily probed however through in vitro experiments (described
below) where cell adhesion more often occurs to an artificial substrate mediated through one of
several extracellular proteins that are used to coat the surface Generally either collagen or
fibronectin is used Cells are often adhered to these substrates but to produce a more controlled
environment rigid beads are sometimes coated with the appropriate receptors so that one specific
receptor-ligand interaction can be probed While these systems are useful as models of certain
adhesion phenomena it is important to recognize in the interpretation of these experiments that
when bound to a rigid substrate or bead the binding proteins cannot freely diffuse as they would
in a more natural environment In particular the formation of focal adhesions would not occur in
bead-substrate experiments because the receptors would be constrained from aggregating
It is instructive to begin this discussion with a consideration of a single adhesion bond
for example one linking the actin matrix of the cytoskeleton to a β1 integrin and the integrin
receptor binding to the extracellular matrix beyond the cell membrane (Fig 3114) If the bond
is stressed as for example if the cell experiences a force relative to the ECM it will at first
stretch an amount dictated by the level of force in the bond and the stiffness of the complex
Each bond as well as each protein in the bond complex can be thought of as having a certain
stiffness giving rise to a picture in which several springs are considered connected in series
Forces acting on the adhesion complex are transmitted via this series of bonded proteins between
the CSK and the ECM producing local deformations and stresses in the corresponding matrices
that decay with distance from the adhesion site On the intracellular side these forces are
transmitted via a complex involving vinculin α-actinin paxillin and talin Attachment to the
extracellular matrix is mediated by an RGD sequence (in fibronectin for example) which in turn
has binding sites for collagen and fibrin If the force is sufficiently strong above a certain
threshold value F0 say and applied for a sufficiently long time the bond might be severed (deshy
couple) Typical values of this threshold force lie in the range of 10-100 pN (Evans and Ritchie
1997) but depend as well on the rate at which the force is increased Under more rapid
forcings the threshold is high compared to when the force is increased slowly This simply
45
CHAPTER 21 CELL MEMBRANE MECHANICS AND ADHESION copyRD Kamm 4615
reflects the fact that detachment is a stochastic process and that at any given level of force there
exists a finite probability of detachment and this probability increases with time
Fig 3114 One type of attachment linking the intracellular actin matrix to the extracellular matrix via an integrin complex that involves in addition vinculin α-actinin paxillin and talin (Reproduced from Lodish et al Molecular Cell Biolology 2000)
We need also to consider that in equilibrium a fraction Φ = K(1+K)-1 (where K is the
equilibrium constant) of the receptors will be bound at any given time and that the receptorshy
ligand complexes are continually cycling between the bound and unbound states characterized
by their respective rate constants
On a larger scale numerous adhesion sites typically act in parallel each contributing
some amount to the total adhesion force If the force transmitted by each single adhesion
complex is F and the density of adhesion sites (per unit membrane area) is NC then the stress
acting on the cell is the product F NC This gives a somewhat false impression however as it is
unlikely that each adhesion complex carries an equal force Put another way there exists a local
stress τ that can be thought of as the product of the average force per bond times the bond
density This stress is typically non-uniform In the adhesion of a cell to a flat substrate the
bonds near the periphery of the contact zone determine the strength of the cell against
detachment and when the cell is subjected to a detaching force the stresses are concentrated in
46
CHAPTER 21 CELL MEMBRANE MECHANICS AND ADHESION copyRD Kamm 4615
this peripheral region as depicted in Fig 3115 In the vicinity of the edge of adhesion several
factors will influence the stress distribution including the mechanical properties of the membrane
(in particular the bending stiffness KB) the receptor density the spring constants of the bond
and the bond strength
N
Region of adhesion
x1
Fig 3115 Schematic model of a cell membrane being detached from a substrate by application of a tension force N The membrane is free to the left of the dash-dot line and adherent to the right Forces and moments are transmitted through the membrane which adheres to the membrane through receptor-ligand bonds represented by a continuous distrubution p(x1)
To illustrate consider the following simple model for an adherent cell being peeled away
from its substrate by a force that generates a tension N in the membrane (Fig 3115)
Deformations in the membrane are described by eqn (223) where it can be shown that the
bending term dominates provided KbL2 gtN where L is the characteristic length in the x1 direction
(due to the small length scales involved) and the external membrane force (p in the membrane
equation) is now the non-uniform stress due to adhesion bonds As a simple first approximation
we take p = k(δminusδ0) with δ-δ0 being the amount of stretch in the receptor-ligand bond springs
and k an effective bond spring constant Recognizing that p approaches zero far from the edge
(see Fig 319) the membrane displacement and the spring displacement are related u3 = δ-δ0
Thus eqn (228) is written
⎛ part 4 u
KB⎜ 3
⎞ 4 ⎟ = NC F = NC ku
⎝ partx ⎠ 3 (277)1
This can be solved directly showing that the distance of separation between the cell membrane
and substrate grows in an exponential fashion with distance Even more simply a scaling
47
CHAPTER 21 CELL MEMBRANE MECHANICS AND ADHESION copyRD Kamm 4615
analysis of eqn (277) in which the term on the left is approximated by Kbu3w4 where w is the
characteristic distance over which u3 varies tells us that the stresses are concentrated in a region
of width
K
w prop B4 (278)
NC k
near the cell periphery Similarly we can estimate that the cell membrane will detach from the
substrate if N gt FoNCw where F0 is a measure of the force in a single bond at the time of bond
rupture and that the rate of peeling can be roughly approximated as the product of the
disassociation rate k -- (bondss) from eqn (265) and the distance between bonds (N -12C )
Although this provides some insight into how the peeling rate depends on the various factors it fails to capture the fact that the cell remains in an equilibrium attached state even for non-zero levels of tension reflecting that even under force a balance can exist between the rates of formation and rupture of receptor-ligand complexes (Ra Picart et al 1999)
It is also of interest to note that in the region near the edge of the attachment zone(x1=0
in Fig 3115) the membrane acts as a beam subjected to a moment due to the applied tension
This moment is balanced by a force couple due to tension in the adhesion complexes right
adjacent to the edge in combination with a compressive stress between the cell and substrate a
little further in In typical situations this compressive stress can approach levels as high as one
atmosphere and can act to effectively smooth the membrane and recruit new attachment sights While using these continuum descriptions it is important to keep in mind the true
discrete nature of the individual bonds represented in the model as a continuous adhesive
surface This is brought to light by a simple calculation in which the characteristic length over
which the applied tension is supported w is compared to the inter-receptor spacing N -12C
Using typical values for the parameters NC = 103 complexesμm-2 k = 10-5 to 10-6 Nm Kb = 1 to 2x10-18 Nm we find that w cong 01 to 03 μm and the inter-complex spacing N minus1 2
C cong 003 μm While it is reassuring to see that w is typically less than the inter-complex spacing the difference is small It is therefore not surprising that the actual process of cell peeling is stochastic in nature occurring in a sequence of more-or-less discrete steps with a velocity of peeling that varies widely from the mean
The interplay between receptor-ligand bonding and membrane stiffness also determines whether a cell will spread over a surface or peel away from it under a given tension Membrane bending stiffness acts to maintain the membrane and substrate within close proximity near the edge of contact (Fig 3115) Spreading can occur only if their separation distance is within the extended length of the receptor ligand bond over a distance comparable to the linear spacing
48
CHAPTER 21 CELL MEMBRANE MECHANICS AND ADHESION copyRD Kamm 4615
between neighboring bonds ( N minus1 2 C ) Under high tension the surfaces rapidly diverge and
spreading is prevented if the tension is sufficiently low receptor-ligand bonding can occur and spreading can occur
Measurements of adhesion
A variety of methods have been used to experimentally determine the strength of adhesion either
of individual receptor-ligand bonds or populations of bonds as in the case of entire cells
Whole cell experiments are more common and typically require less experimental
sophistication The drawback of course is that they provide only for estimates of average
properties and require certain assumptions regarding the distribution of cell-substrate adhesive
stress for interpretation to the level of a single bond Several of these methods are described
next
Centrifugal cell adhesion assays In this experiment cells are allowed to attached to a substrate
then are placed in a centrifuge rotating at speed ω positioned a distance r from the center of
rotation and oriented so that the net centrifugal force is acting to separate the cell from the
substrate Using the arrangement shown in Fig 3116 (right) the acceleration of the cells is 2ω r and the net force acting on a cell of volume Vc is F = (ρc minus ρf )ω 2rVc where the fluid and cell densities are ρf and ρc respectively
Interpreting these results we can make several different assumptions each leading to a different estimate for the maximum force experienced by the binding complex If we simply assume that all receptor-ligand complexes support an equal fraction of the total force F then the force per bond is f = F (πa 2NC ) where NC is the concentration of bond complexes However as the cell tears away from the substrate the edge bonds will break first since these experience the greatest level of force An alternative approach then is to assume that the adhesion complexes around the cell circumference support the entire load leading to the estimate f = F 2( πaN 1 2 ) recognizing that N1 2
C C is the average distance between bonds A somewhatmore accurate value for f might be obtained if we assume that all complexes within the distance w given by eqn (278) support the load In any of these cases once the centrifugal force exceeds some critical limit since the number of receptors supporting the load falls as the region of contact becomes smaller the force per bond increases and the cell will rapidly detach
Stochastic variability also needs to be taken into account however since even under a constant load any single bond has a finite probability of failure under a given level of force The equilibrium state of the cell then should be viewed as one in which the rate of bond formation equals the rate of bond breakage with increasing force having the effect of reducing the
49
CHAPTER 21 CELL MEMBRANE MECHANICS AND ADHESION copyRD Kamm 4615
probability that the bond will remain intact These effects can be addressed using the methods described in more detail in Chapter xx Parallel flow assay Another common method for assessing cell adhesion is to plate the cells onto one wall of a parallel flow chamber subject them to a fluid dynamic shear stress and observe at what flow rate the cells begin to release If we ignore flow details in the immediate vicinity of the cell the shear stress can be estimated from the solution for a fully developed (Poiseuille) velocity profile
3V ⎡ y2
⎛ ⎞ ⎤v(y) = ⎢1minus ⎥ (279)
2 ⎝ ⎠ ⎣ ⎢ h ⎥⎦
so that the shear stress acting on the cell is
⎛ dv ⎞ 6μV τw = μ⎜ ⎟ = (280)
⎝ dy ⎠ h y = minush
and the total force can be estimated as F asymp τw Ac where Ac is the surface area of the cell membrane exposed to the flow Consider as an example a flow of culture medium at a rate of 1 mls through a channel of height 01 cm and width 1 cm If the culture medium has a viscosity close to that of water (μ=001 dyns) the shear stress is obtained from eqn (280)
6 sdot (001dyn sdot s) sdot (1ml s) ( 01 sdot10cm2 )τ dyn cm 2w = = 6 = 06Pa
01cm This corresponds roughly with the level of shear stress experience by endothelial cells in the arterial system If we consider that the cell has a surface area with dimensions roughly 100 μm x 10 μm or about 103 μm2 then the total force acting on the cell is obtained by integrating the shear stress over the area of the apical membrane Assuming that the shear stress is uniform the force is simply the product of shear stress and surface area or about 1 nN in the present example Again interpretation of results from such experiments requires careful consideration of the distribution of forces among the individual adhesion complexes In this situation the cell is likely to peel from the upstream edge in much the same manner as occurs in the cell peeling experiment discussed earlier
50
CHAPTER 21 CELL MEMBRANE MECHANICS AND ADHESION copyRD Kamm 4615
Radial flow and spinning disk assays One disadvantage of the parallel flow assay is that all cells are subjected to essentially the same level of shear stress so the flow rate needs to be incrementally varied in order to determine the level of force required for detachment These two systems using an axisymmetric geometry circumvent this problem by producing an easily characterized radial variation in shear stress In the case of the radial flow assay fluid enters through a central channel and flows radially outward through the narrow gap between two circular plates From conservation of mass the mean flow velocity is given by
QV = (281)
2πrh and sufficiently far from the center (rgtgth) the velocity profile is parabolic as in the parallel flow assay and the shear stress is again governed by eqn (280) using (281) for V Q
ω
(Not to scale)
v
h h
Cell layer rc Ce l l layer rc
r r
Fig 3116 Schematic diagram showing the radial flow assay (left) and the spinning disk assay (right) In the radial flow assay shear stress attains a maximum value near the center and falls with increasing radius r whereas in the spinning disk system maximum shear stress is experienced at large r In the spinning disk assay cells are grown on one disk and the opposite disk is rotated at constant speed Provided the rate of rotation is sufficiently small that inertial effects can be neglected the velocity is purely in the circumferential direction and the profile is linear between the two plates so that the shear stress experienced by the cells can easily be computed as
ωr τw = μ (282)
h
51
CHAPTER 21 CELL MEMBRANE MECHANICS AND ADHESION copyRD Kamm 4615
In both of these cases as in the parallel flow assay the total force is obtained by integrating the shear stress over the cell surface and the distribution of force among the adhesion complexes is weighted toward those located near the upstream end of the cell This can also be seen by consideration of the torque exerted by shear stress on the cell that must be balanced by a nonshyuniform contact stress with the substrate that is greatest near the upstream end Single bond adhesion assays Two other assays provide a means of obtaining estimates for the strength of a single adhesion bond without the need for excessive interpretation These rely on an ability to isolate a small number of bonds or even a single bond and infer bond strength from the step-wise nature of the de-adhesion process associated with breakage of discrete bonds One of these methods employs the atomic force microscope coated with the ligand of an adhesion receptor as shown in Fig 3117 The probe tip is gradually brought up to the cell surface until one or more receptor-ligand bonds are formed When the probe tip is withdrawn it moves along a different trajectory on a force-displacement plot reflecting the forces of adhesion These forces are seen to jump between more or less discrete levels as the probe continues to be moved away from the cell with each jump corresponding to the breakage of a single bond (Fig 3117) Using this method the bond strength between integrin receptor and a variety of RGD-containing ligands was found to lie in the range of 30 to 100 pN (Lehenkari and Horton 1999)
Fig 3117 The strength of a single adhesion bond can be measured by bringing a functionalized tip of an AFM probe up to the cell allowing bonds to form then slowly withdrawing the probe Monitoring the differences between the force displacement curve between the forward and reverse motions the forces necessary to break a single receptor-ligand bond can be determined [Reproduced from (Lehenkari and Horton 1999)]
52
CHAPTER 21 CELL MEMBRANE MECHANICS AND ADHESION copyRD Kamm 4615
A second method is similar in that the discrete increments in force are monitored as individual receptor-ligand bonds are broken but the forces are measured by means of changes in the shape of a giant vesicle the membrane of which contains the ligands have been inserted In this case one vesicle is made effectively rigid due for example to a high surface tension A second vesicle containing the adhesion molecules is also drawn partially into a micropipet but is much more complaint than the first The two vesicles are then brought into point contact so that one or a small number of adhesions are formed As the pipets are moved apart the compliant vesicle distorts due to the force of adhesion which it can be shown is related to the change in dimension of the vesicle in the direction of the force thereby serving as a sensitive force transducer measuring forces in the range of single adhesion receptors or between 1 and 100 pN [Evans 1991 37]
(For specific examples of leukocyte rolling and attachment see Orsello or Chang amp Hammer)
[This process is initiated for example by local infection that causes the release of
chemotactic agents in addition to cytokines hellip
Models of this process draw upon many of the concepts discussed in this chapter ]
Transient cell adhesion
Concepts of transient adhesion and release are of particular importance in the case of leukocyte
rolling adhesion and transmigration across the endothelial layer of a blood vessel In addition
cell migration through extracellular matrix or along a substrate requires the ability of the cell to
both form and release adhesions
One problem that has received considerable attention is the interaction between an
adherent or rolling leukocyte and the adhesion receptors on the endothelium These studies are
complicated by the three-dimensional nature of the flow the compliance of the interacting
surfaces and receptor-ligand dynamics In a series of recent studies Hammer and co-workers
(Chang Tees et al 2000) have addressed several of these issues computing the viscous force
and torque acting upon a sphere near to planar wall from the mobility matrix (Hammer and Apte
1992) and using the ldquoBell modelrdquo of receptor binding (Bell 1978) but neglecting the effects of
cell deformation The Bell model relates the dissociation rate constant kr to the force in the
bond f the thermal energy kBT and a parameter with units of length that depends on the
reactivity of the molecule
kr = ko r exp(γf kBT ) (283)
53
CHAPTER 21 CELL MEMBRANE MECHANICS AND ADHESION copyRD Kamm 4615
A Monte Carlo method is employed at each time step in the calculation to determine bond
formation or breakage In these studies the nature of the leukocyte-endothelial interaction is
characterized as firm adhesion rolling adhesion bimodal adhesion or no adhesion and mapped
as a function of the two parameters of the Bell model in Fig 3 The boundaries of the rolling
adhesion regime are identified for a wall shear rate of 100 s-1 (dotted lines) or 30 and 400 s-1
(solid lines) Most literature values for the Bell model parameters for a variety of selectin
receptors (known to be instrumental in leukocyte rolling) correspond to the rolling adhesion
regime for typical shear rate of 100 s-1 An interesting but counterintuitive result from this study
was the observation that as the bond stiffness was increased from the value used in most
calculations (100 dyne cm-1) adhesiveness decreased which the authors attribute to reduced
deflection for a given level of force leading subsequently to more rapid dissociation
Fig 3118 The state diagram for a leukocyte interacting with an endothelial surface for shear rates ranging from 30 to 400 s-1 For low dissociation rates the leukocyte remains adherent to the surface (lower left) As either (γ) or ( ko
r ) [see Eqn (283) for definitions] is increased the cell first adheres firmly then rolls along the wall then completely detaches (upper right) Rolling adhesion is defined as the regime where rolling occurs over some part of the shear rate range between 30 and 400 s-1 Firm adhesion indicates that cells remain attached even at the highest shear rate no adhesion indicates that cells roll at a velocity gt 50 of the velocity of a non-adherent sphere In the bimodal regime cells are either adherent or non-adherent and do not exhibit rolling Dotted curves correspond to these same boundaries for a shear rate of 100 s-1 Reproduced from Chang et al (2000)
54
CHAPTER 21 CELL MEMBRANE MECHANICS AND ADHESION copyRD Kamm 4615
In another recent study using high-resolution video-microscopy (Schmidtke and Diamond
2000) it was demonstrated that a flowing neutrophil can attach to an adherent platelet via
adhesion molecules located in the tips of the microvilli and form long tethers averaging nearly 10
μm in length but ranging up to 40 μm at extensional rates of 6-40 μm s-1 for shear rates ranging
from 100-250 s-1 The mechanics of tether formation is itself a fascinating topic that is still under
intense investigation Readers interested in pursuing this work in more detail are referred to the
several papers (Hochmuth Shao et al 1996 Dai and Sheetz 1998 Dai and Sheetz 1999) that
identify a number of intriguing phenomena
55
CHAPTER 21 CELL MEMBRANE MECHANICS AND ADHESION copyRD Kamm 4615
317 Nomenclature Parameter Definition Units
R - receptor
L - ligand
C - receptor-ligand complex
G - Gibbs free energy Nm
N - membrane tension Nm
NR - total receptor density -3μm-2 in 2D or μm in 3D NL - total ligand density μm-2 in 2D or μm-3 in 3D N in 2D or μm-3μm-2
C - complex density in 3D NRf - free receptor density m-2 in 2D or m-3μ μ in 3D NLf - free ligand density -2 -3μm in 2D or μm in 3D d+ - forward diffusional rate constant 2 -1μm s-1 in 2D or 3 μm s in 3D d -1
- - reverse diffusional rate constant s r+ - forward reaction rate constant s-1
r- - reverse reaction rate constant s-1 D 2 -1
m - membrane diffusion coefficient μm s D - solution diffusion coefficient m2 s -1s μ Kb - bending stiffness Nm K 0 - equilibrium constant or affinity (zero force) M-1 in 3D and 2μm in 2D = k0
+ k0 minus
K - equilibrium constant M-1 in 3D and m2μ in 2D = k+kshy
k0 - association rate constant (zero force) M-1 s-1 in 3D or m-2 -1+ μ s in 2D
k0 - dissociation rate constant (zero force) s-1 minus
k - association rate constant M-1 s-1 in 3D or m-2 -1+ μ s in 2D
kminus - dissociation rate constant s-1 f - force per bond N F - total adhesion force N γ - empirical parameter μm r0 - distance over which energy minimum acts μm E0 - bond energy J k JK-1
B - Boltzmanns constant T - temperature K τ - bond lifetime s
56
CHAPTER 21 CELL MEMBRANE MECHANICS AND ADHESION copyRD Kamm 4615
τ0 - bond lifetime with zero force s σ - adhesion stress N μm-2 κ - spring constant for receptor-ligand bond N μm-1
57
CHAPTER 21 CELL MEMBRANE MECHANICS AND ADHESION copyRD Kamm 4615
References Bell G I (1978) Models for the specific adhesion of cells to cells Science 200 618-627 Caille N O Thoumine et al (2002) Contribution of the nucleus to the mechanical properties
of endothelial cells J Biomech 35(2) 177-87 Chang K C D F Tees et al (2000) The state diagram for cell adhesion under flow
leukocyte rolling and firm adhesion Proc Natl Acad Sci U S A 97(21) 11262-7 Dai J and M P Sheetz (1998) Cell membrane mechanics Methods Cell Biol 55 157-71 Dai J and M P Sheetz (1999) Membrane tether formation from blebbing cells Biophys J
77(6) 3363-70 Daily Elson et al (1984) Determination of the elastic area compressibility modulus of the
erythrocyte membrane Biophys J 45(4) 671-682 Evans E and K Ritchie (1997) Dynamic strength of molecular adhesion bonds Biophys J
72(4) 1541-55 Evans E A (1983) Bending elastic modulus of red blood cell membrane derived from
buckling instability in micropipet aspiration tests Biophys J 43(1) 27-30 Hammer D A and S M Apte (1992) Simulation of cell rolling and adhesion on surfaces in
shear flow general results and analysis of selectin-mediated neutrophil adhesion Biophys J 63(1) 35-57
Hardt S L (1979) Rates of diffusion controlled reactions in one two and three dimensions Biophysical Chemistry 10 239-243
Hochmuth F M J Y Shao et al (1996) Deformation and flow of membrane into tethers extracted from neuronal growth cones Biophys J 70(1) 358-69
Kucik D F E L Elson et al (1999) Weak dependence of mobility of membrane protein aggregates on aggregate size supports a viscous model of retardation of diffusion Biophys J 76(1 Pt 1) 314-22
Kusumi A Y Sako et al (1993) Confined lateral diffusion of membrane receptors as studied by single particle tracking (nanovid microscopy) Effects of calcium-induced differentiation in cultured epithelial cells Biophys J 65(5) 2021-40
Lehenkari P P and M A Horton (1999) Single integrin molecule adhesion forces in intact cells measured by atomic force microscopy Biochem Biophys Res Commun 259(3) 645-50
McCloskey M and M M Poo (1984) Protein diffusion in cell membranes some biological implications Int Rev Cytol 87 19-81
Meleard P Gerbeaud C Bardusco N Mitov MD and Ferdandex-Puente L (1998) Mechanical properties of model membranes studied from shape transformations of giant vesicles Biochimie 80 401-413
Moy V T Y Jiao et al (1999) Adhesion energy of receptor-mediated interaction measured by elastic deformation Biophys J 76(3) 1632-8
Ra H J C Picart et al (1999) Muscle cell peeling from micropatterned collagen direct probing of focal and molecular properties of matrix adhesion J Cell Sci 112 ( Pt 10) 1425-36
Saffman P G (1976) Bownian motion in thin sheets of viscous fluid Journal of Fluid Mechanics 73 593-602
Schmidtke D W and S L Diamond (2000) Direct observation of membrane tethers formed during neutrophil attachment to platelets or P-selectin under physiological flow J Cell Biol 149(3) 719-30
Sheets E D R Simson et al (1995) New insights into membrane dynamics from the analysis of cell surface interactions by physical methods Curr Opin Cell Biol 7(5) 707-14
58
CHAPTER 21 CELL MEMBRANE MECHANICS AND ADHESION copyRD Kamm 4615
Vink H and B R Duling (1996) Identification of distinct luminal domains for macromolecules erythrocytes and leukocytes within mammalian capillaries Circ Res 79(3) 581-9
Waugh R and E A Evans (1979) Thermoelasticity of red blood cell membrane Biophys J 26(1) 115-31
Zeman K H Engelhard et al (1990) Bending undulations and elasticity of the erythrocyte membrane effects of cell shape and membrane organization Eur Biophys J 18(4) 203shy19
Zhelev D V D Needham et al (1994) Role of the membrane cortex in neutrophil deformation in small pipets Biophys J 67(2) 696-705
59
MIT OpenCourseWarehttpocwmitedu
20310J 3053J 6024J 2797J Molecular Cellular and Tissue BiomechanicsSpring 2015
For information about citing these materials or our Terms of Use visit httpocwmiteduterms

CHAPTER 21 CELL MEMBRANE MECHANICS AND ADHESION copyRD Kamm 4615
filaments
intermediate
filaments
transmembrane fibroblasts (E) collagen bind various
proteoglycans epithelial cells fibronectin growth factors
(I) actin such as FGF
filaments
heterophillic
Table 1 Cell adhesion molecules and their characteristics
While both integrin and selectin binding is mediated by Ca2+ adhesion via the
immunoglobulin (Ig) superfamily of proteins is Ca2+ independent Some of the most prominent members of this family are the N-CAMs (Neural cell adhesion molecules) and ICAMs (Intracellular cell adhesion molecules) These tend to undergo homophillic bonding but some also bind to members of the integrin family
Cadherens are often expressed in the same cells as the selectins but form much stronger bonds and therefore play an important role in maintaining cell integrity Because of these attributes cadherens are the primary adhesion proteins in desmosomes and adherens junctions the major structural contacts cells form with other cells or the basil lamina These also form homophillic bonds by a Ca2+ dependent mechanism and mediate selective bonding between adjacent cells Cadherens are relatively short as compared to other adhesion molecules being
about 700-750 amino acid residues in length
Types of adhesion complexes
Cells have developed a variety of specialized adhesion complexes each utilizing one or more of
the adhesion molecules of Table 1 and each serving a specific purpose Typically the cell-cell or
cell-surface spacing is in the range of 10-20 nm but this is highly variable ranging from less than
1 nm when controlling transport to over 100 nm in regions where tight control is unnecessary
Below we describe the different types of junctions and where important for function their
mechanical characteristics
Gap junctions Cells need to communicate with their neighbors for a variety of reasons For
example cardiac myocytes transmit signals from cell to cell in order to maintain a synchronous
35
CHAPTER 21 CELL MEMBRANE MECHANICS AND ADHESION copyRD Kamm 4615
wave of contraction This is typically accomplished by providing a pathway for ions and small
signaling molecules between cells called gap junctions (Fig 3110) These minute channels are
typically comprised of a collection of six connexin proteins that cluster together in cylindrical
fashion forming a minute channel that passes molecules and ions less than about 1200 to 2000
MW (15-2 nm) Transport through these channels is regulated and their permeability drops in
the presence of high Ca2+ concentration as when a cell membrane is ruptured or with low pH
Cyclic AMP acting as a second messenger can be exchanged between cells therefore gap
junctions provide a metabolic linkage between neighboring cells and provide a means by which
hormonal stimulation of just one cell can be transmitted to others
Adherens junctions Adherens junctions are belt-like structures that can be though of as the
structural weld that holds two cells together (Fig 3110) Because of their structural role
these junctions formed by homophilic bonding between proteins in the cadheren family are
anchored securely again via the adaptor proteins α β γ-catenin to the cytoskeleton
Desmosomes and Hemidesmosomes If the adherens junctions are the continuous welds between
cells desmosomes are the spot welds Again these serve primarily a structural purpose
joining two neighboring cells via a complex consisting of a dense plaque on the intracellular
sides of both cells extending 15-20 nm into the cell and consisting of a variety of proteins that
attach to keratin filaments part of the intermediate filament network Hemidesmosomes have
similar intracellular structure but attach instead to the basal laminae Based on their different
extracellular attachment sites desmosomes typically link to other cells via cadherens whereas
hemidesmosomes adhere via a type of integrin Both are commonly found in epithelial cells
36
CHAPTER 21 CELL MEMBRANE MECHANICS AND ADHESION copyRD Kamm 4615
Fig 3110 Schematic showing the different types of cell junctions present in an epithelial cell as found in the small intestine Tight junctions near the apical surface essentially prevent the passage of all molecules The spot desmosomes and adherens junctions provide for cell-cell anchoring and the hemidesmosomes for anchoring to the basal lamina Gap junctions provide a means for communication between neighboring cells [Reproduced from Lodish et al Molecular Cell Biology 2000]
Junction type Function Extracellular or Intracellular
adjacent cell attachment
attachment
Adherens structural cell-cell or cell- ECM proteins or actin filaments
matrix cadherins in
adjacent cell
Desmosome structural cell-cell cadherin intermediate
filaments
Hemidesmosome structural cell-matrix basal lamina via intermediate
integrins filaments
Focal adhesions structural cell-matrix ECM proteins actin filaments
via integrins
Tight junction regulate transport between homophillic binding between the
cells and along cell transmembrane proteins occludin or
37
CHAPTER 21 CELL MEMBRANE MECHANICS AND ADHESION copyRD Kamm 4615
membrane claudins
Gap junctions cell-cell communication channels formed by connexin
via ion and small molecule subunits
exchange
Table 2 Adhesion complexes
Focal adhesions A second means by which cells attach to the extracellular matrix is through
focal adhesions These serve a similar function to the hemidesmosomes and share a common
linkage via integrins to the ECM but are attached on the intracellular side instead to the actin
filaments of the cytoskeleton Actin filaments converge at the site of focal adhesions forming
stress fibers strong actin bundles that attach to the β-subunit of the integrins via adapter
proteins such as actinin vinculin and talin Focal adhesions are instrumental in cell migration
and for this purpose need to be easily formed and disrupted as the cell moves forward Release
or de-adhesion of cells is often mediated by a class of peptides called dis-integrins that
competitively bind to the RGD site used by integrins to attach to a variety of matrix molecules
Tight junctions Control of transport is generally mediated by tight junctions that form an
intricate network of seams between two cells (Fig 3111) As their name implies these are the
tightest of the cell-cell junctions and the gaps they leave are often small enough to exclude even
the smallest ions and molecules Formed by homophillic binding between the transmembrane
proteins occluding and claudins tight junctions allow epithelial cells to perform their critical role
in transepithelial transport and provide for maintenance of differences in concentration between
the apical and basal surfaces of these cells Since occludins are not capable of forming rigid
structural bonds with the cytoskeleton they are most often associated in a junctional complex
with adherens junctions or desmosomes that fulfill the structural needs of attachment
38
CHAPTER 21 CELL MEMBRANE MECHANICS AND ADHESION copyRD Kamm 4615
Fig 3111 Tight junctions in an epithelial cell shown schematically (a) in a freeze fracture replica (b) and in a transmission electron micrograph (c) [Reproduced from Alberts et al 1994]
Fig 3112 Two types of bond that attach a cell to the extracellular matrix by means of clusters of integrins On the extracellular side integrins bind to the matrix proteins fibronectin and laminin Inside the cell they attach to the cytoskeleton via adaptor proteins to either actin filaments (focal adhesions) or intermediate filaments (hemidesmosomes) [Reproduced from Lodish et al Molecular Cell Biolology 2000]
Non-specific binding
Cells can adhere to their surroundings by either non-specific or receptor-ligand (specific)
bonding Though both mechanisms are likely active in most situations as we will see receptorshy
39
CHAPTER 21 CELL MEMBRANE MECHANICS AND ADHESION copyRD Kamm 4615
ligand bonding is the stronger of the two by a considerable margin and is therefore the most
relevant biologically In situations for which either the receptors or their ligands are not present
however such as might be the case in certain in vitro experiments non-specific binding can be
important as well
There are essentially three major forms of non-specific attractions to consider
bull Van der Waals ndash These attractive forces arise due to charge interactions in polar
molecules They tend to dominate among the non-specific mechanisms at
intermediate distances around 20-25 nm [see Boal]
bull Electrostatic ndash These interactions can be either attractive or repulsive depending
on the sign of the surface charges and are particularly important during the
approach of two cells since the glycocalyx has a high negative charge density
bull Steric ndash These forces arise due to the steric exclusion of two molecules as they are
brought into close contact In the case of cell-cell interactions steric repulsion is
due to the compression of the two glycocalyx layers and the tendency to resist
compression resulting from osmotic effects and the elasticity of the layer Steric
forces tend to dominate for small separation distances lt 10 nm
In combination these effects combine to produce a net attractive force per unit area of
about 100 Pa at a separation distance of about 25 nm
Adhesion by means of receptor-ligand binding
We can use the analysis of Chapter xx to estimate the strength of a receptor-ligand bond and
based on typical values for bond density calculate the corresponding strength of adhesion
between two cells or between a cell and a surface Recall that the application of force to a
receptor-ligand bond modifies the dissociation rate constant for the binding reaction This effect
can be modeled in several ways but the result obtained by Bell ((Bell 1978)) suggests the
following exponential form for the dissociation rate
0 ⎛ γf ⎞ 0 ⎛ γσ ⎞ kminus = kminus exp⎜ ⎟ = kminus exp⎜ ⎟ (265)
⎝ kBT ⎠ ⎝ NC kBT ⎠
where k0minus is the unforced dissociation rate constant γ is a factor with the units of length that
corresponds roughly with the distance separating the bonded pair at equilibrium NC is the concentration of bonded complex and σ is the average bond force per unit area To determine
40
CHAPTER 21 CELL MEMBRANE MECHANICS AND ADHESION copyRD Kamm 4615
the rate of change of the concentration of bonded pairs one must solve the following rate equation describing the competition between bond formation (first term) and destruction (second term)
dNC ⎛ γσ ⎞
cong k+ (NR minus NC )(NL ) minus kminus NC = k+ (N minus )( 0R NC NL ) minus kminus NC exp⎜ ⎟ (266)
dt ⎝ NC kBT ⎠
where NR and NL are the concentrations of receptors and ligands respectively and we have
assumed that NCltltNL and that all bonds are stressed equally At equilibrium dNCdt=0 and if
the force applied to detach the cell (equal to the average bond stress σ) is increased
incrementally from zero NC will progressively fall to a new equilibrium value At sufficiently
high levels of force however increasing σ further eventually gives rise to a situation in which equilibrium can no longer be achieved through a reduction in NC At that point NC tends toward zero and the cell separates from the surface to which it was attached It can be shown that this
occurs when (Bell 1978)
k 0
α c exp(α + c + 1) = N
k 0 L (267)minus
σ
where α minγ c equiv and σmin is the minimum stress needed to cause detachment For a wide
NRkBT
range of conditions eqn (267) has the approximate solution
⎛ k0 + ⎞
α c cong 07 ln L (268)⎜ 0 N ⎟⎝ kminus ⎠
so that the critical stress for detachment can be expressed as
N 0
σ cong 07 C kBT ⎛ k ⎞ ln⎜
+ min N ⎟ (269)
γ ⎝ k0 L minus ⎠
where NC is determined from setting eqn (266) to zero under these critical conditions
Thermodynamic approach to cell adhesion
Although we focus here on the mechanical aspects of cell adhesion this process can also be
viewed from a thermodynamic perspective In this approach adhesion is considered in terms of
the change in energy specifically the Gibbs free energy G associated with all the individual
receptor-ligand interactions as well as the various non-specific forces of attraction or repulsion
The adhesion of a cell to a given surface then can be viewed as an equilibrium state determined
41
CHAPTER 21 CELL MEMBRANE MECHANICS AND ADHESION copyRD Kamm 4615
by minimization of the free energy If in undergoing a transition from a free state to an adherent
state the system represented by the cell and surface experiences a reduction in free energy ie
ΔGlt0 then adhesion will occur and the equilibrium state of adhesion will be determined by that with the minimum in free energy or the largest value of -ΔG While this approach ignores
many of the subtleties of the interactions and like the analysis above assumes that all receptorshy
ligand interactions are identical from an energetic point of view it is useful in providing some
simple insights as seen in the next two examples
Example Comparison of specific and non-specific adhesive forces Non-specific bonding due
to the combined effects of van der Waals electrostatic and steric forces result in an attractive
stress of approximately 100 Pa Receptor-ligand bonding give rise to forces that can be
estimated from the change in free energy f ~ to 4x10⁻⁴ dynbond = 9x10-11 to 4x10⁻⁹ ΔGr~9x10⁻⁶ Nbond where f is the force required to break the bond and r is a measure of the distance the bond stretches before it breaks Using a typical density of the receptor-ligand complex NC of ~1012-1015 bondsm2 gives a total bond stress of N 1
C x f ~ 9 x 10 to 4x10⁶ Pa The above kinetic approach to estimating bond strength [eqn (269)] gives a value approximately half of that from this equilibrium approach In either case however the conclusion remains the same non-specific binding can under certain circumstances be important since it is comparable to the lowest estimates of receptor-ligand-mediated bond strength but not surprisingly the latter is quite likely to dominate in nearly all practical situations
Example JKR theory for the equilibrium area of adhesion between a cell and substrate
It is well known that cells tend to take on a more flattened shape as the substrate to which they
are attached becomes more strongly adhesive either by coating with a more attractive ligand or
by increasing the concentration of ligand bound to the substrate Conversely less adhesive cells
round up and become more spherical These observations can be explained with the help of a
simple scaling analysis on the assumptions of small deformation of a linear elastic cell
Let the cell be modeled as a homogeneous elastic sphere with elastic modulus E and
initial radius R (Fig 3113) It is then brought into contact with a surface to which it adheres
As the cell adheres it attains a lower energy state characterized by an adhesion energy per unit
area J Formation of a flat adhesion surface however requires deformation within the elastic
cell and an associated increase in the stored elastic energy In Chapter 31 we showed that the
stored elastic energy per unit volume can be written
UE asymp int τεdV asymp int 1 2 Eε 2dV (270)
Vc Vc
42
CHAPTER 21 CELL MEMBRANE MECHANICS AND ADHESION copyRD Kamm 4615
Strain inside the cell can be approximated as the displacement of the cell surface δ divided by the characteristic distance within the cell to which the deformations penetrate a distance that scales with the lateral extent of the contact region 2a so that ε prop δ a where it can easily be shown from the geometry that a 2 asymp 2δR so that ε prop δ R Combining and dropping all numerical constants we obtain the following scaling approximation
δUE prop E ( )δR
3 2 (271)R
An expression for the total energy of the system then can be written
U prop minusJa2 + Eε2a3 prop JδR + Eδ 5 2R1 2 (272) The equilibrium state corresponds to the value of δ having the minimum energy obtain from
partU prop minusJR + Eδ 3 2R1 2 (273)
partδ so that
23 1 3 ⎛ JR12 ⎞ ⎛ JR2 ⎞
δ prop ⎜ ⎟ and a prop ⎜ ⎟ (274)⎝ E ⎠ ⎝ E ⎠
The exact solution to this problem yields the result
⎡ ) 1 3 2 1( minusν 2 ⎤ 9πJR
a = ⎢ ⎥ (275)⎢ 2E ⎥⎣ ⎦
43
CHAPTER 21 CELL MEMBRANE MECHANICS AND ADHESION copyRD Kamm 4615
Elastic modulus E adhesion energy per unit area J
2a
Fig 3113 Experiments to determine the contact area of an iminobiotin functionalized agarosebead on a glass coverslip in water Top Schematic of adherent bead Bottom Results for a range of bead radii Solid line is a fit to the date which obeys the power law a prop R23 consistent with the prediction of JKR theory eqn(276) [Reproduced from (Moy Jiao et al 1999)] This can be compared to the result obtained from a more rigorous analysis
⎡9πJR 2(1minus ν 2 ) 13 ⎤
a = ⎢ ⎥ (276)2E⎢ ⎣ ⎥⎦
and to experimental data obtained from spherical beads made from a 4 agarose gel (Fig 3113)
Models for receptor-mediated adhesion
In Chapter x and in the preceding text we discussed the energetics of bond formation and release
as well as the effect of applied force in altering the energy landscape of the bonded pair and
thereby the rate constants for bond kinetics That analysis has obvious implications to the
44
CHAPTER 21 CELL MEMBRANE MECHANICS AND ADHESION copyRD Kamm 4615
adhesion of cells to substrates the surrounding extracellular matrix and other cells Here we
extend that analysis in the specific case of whole cell adhesion In doing so it will be important
to consider such factors as the distribution type and density of receptor-ligand bonds or
potential bonds and the elastic properties of the structures to which they are anchored On the
intracellular side this involves the series of couplings that link the receptor to the cell In the
simplest case this might simply be a link to the lipid bilayer if the receptor has no intracellular
connections More typically especially for couplings with a structural role it involves a series
of proteins ultimately linking the receptor to the cytoskeleton
The typical setting in vivo is one in which cells adhere to other cells or to the extracellular
matrix Adhesions are more easily probed however through in vitro experiments (described
below) where cell adhesion more often occurs to an artificial substrate mediated through one of
several extracellular proteins that are used to coat the surface Generally either collagen or
fibronectin is used Cells are often adhered to these substrates but to produce a more controlled
environment rigid beads are sometimes coated with the appropriate receptors so that one specific
receptor-ligand interaction can be probed While these systems are useful as models of certain
adhesion phenomena it is important to recognize in the interpretation of these experiments that
when bound to a rigid substrate or bead the binding proteins cannot freely diffuse as they would
in a more natural environment In particular the formation of focal adhesions would not occur in
bead-substrate experiments because the receptors would be constrained from aggregating
It is instructive to begin this discussion with a consideration of a single adhesion bond
for example one linking the actin matrix of the cytoskeleton to a β1 integrin and the integrin
receptor binding to the extracellular matrix beyond the cell membrane (Fig 3114) If the bond
is stressed as for example if the cell experiences a force relative to the ECM it will at first
stretch an amount dictated by the level of force in the bond and the stiffness of the complex
Each bond as well as each protein in the bond complex can be thought of as having a certain
stiffness giving rise to a picture in which several springs are considered connected in series
Forces acting on the adhesion complex are transmitted via this series of bonded proteins between
the CSK and the ECM producing local deformations and stresses in the corresponding matrices
that decay with distance from the adhesion site On the intracellular side these forces are
transmitted via a complex involving vinculin α-actinin paxillin and talin Attachment to the
extracellular matrix is mediated by an RGD sequence (in fibronectin for example) which in turn
has binding sites for collagen and fibrin If the force is sufficiently strong above a certain
threshold value F0 say and applied for a sufficiently long time the bond might be severed (deshy
couple) Typical values of this threshold force lie in the range of 10-100 pN (Evans and Ritchie
1997) but depend as well on the rate at which the force is increased Under more rapid
forcings the threshold is high compared to when the force is increased slowly This simply
45
CHAPTER 21 CELL MEMBRANE MECHANICS AND ADHESION copyRD Kamm 4615
reflects the fact that detachment is a stochastic process and that at any given level of force there
exists a finite probability of detachment and this probability increases with time
Fig 3114 One type of attachment linking the intracellular actin matrix to the extracellular matrix via an integrin complex that involves in addition vinculin α-actinin paxillin and talin (Reproduced from Lodish et al Molecular Cell Biolology 2000)
We need also to consider that in equilibrium a fraction Φ = K(1+K)-1 (where K is the
equilibrium constant) of the receptors will be bound at any given time and that the receptorshy
ligand complexes are continually cycling between the bound and unbound states characterized
by their respective rate constants
On a larger scale numerous adhesion sites typically act in parallel each contributing
some amount to the total adhesion force If the force transmitted by each single adhesion
complex is F and the density of adhesion sites (per unit membrane area) is NC then the stress
acting on the cell is the product F NC This gives a somewhat false impression however as it is
unlikely that each adhesion complex carries an equal force Put another way there exists a local
stress τ that can be thought of as the product of the average force per bond times the bond
density This stress is typically non-uniform In the adhesion of a cell to a flat substrate the
bonds near the periphery of the contact zone determine the strength of the cell against
detachment and when the cell is subjected to a detaching force the stresses are concentrated in
46
CHAPTER 21 CELL MEMBRANE MECHANICS AND ADHESION copyRD Kamm 4615
this peripheral region as depicted in Fig 3115 In the vicinity of the edge of adhesion several
factors will influence the stress distribution including the mechanical properties of the membrane
(in particular the bending stiffness KB) the receptor density the spring constants of the bond
and the bond strength
N
Region of adhesion
x1
Fig 3115 Schematic model of a cell membrane being detached from a substrate by application of a tension force N The membrane is free to the left of the dash-dot line and adherent to the right Forces and moments are transmitted through the membrane which adheres to the membrane through receptor-ligand bonds represented by a continuous distrubution p(x1)
To illustrate consider the following simple model for an adherent cell being peeled away
from its substrate by a force that generates a tension N in the membrane (Fig 3115)
Deformations in the membrane are described by eqn (223) where it can be shown that the
bending term dominates provided KbL2 gtN where L is the characteristic length in the x1 direction
(due to the small length scales involved) and the external membrane force (p in the membrane
equation) is now the non-uniform stress due to adhesion bonds As a simple first approximation
we take p = k(δminusδ0) with δ-δ0 being the amount of stretch in the receptor-ligand bond springs
and k an effective bond spring constant Recognizing that p approaches zero far from the edge
(see Fig 319) the membrane displacement and the spring displacement are related u3 = δ-δ0
Thus eqn (228) is written
⎛ part 4 u
KB⎜ 3
⎞ 4 ⎟ = NC F = NC ku
⎝ partx ⎠ 3 (277)1
This can be solved directly showing that the distance of separation between the cell membrane
and substrate grows in an exponential fashion with distance Even more simply a scaling
47
CHAPTER 21 CELL MEMBRANE MECHANICS AND ADHESION copyRD Kamm 4615
analysis of eqn (277) in which the term on the left is approximated by Kbu3w4 where w is the
characteristic distance over which u3 varies tells us that the stresses are concentrated in a region
of width
K
w prop B4 (278)
NC k
near the cell periphery Similarly we can estimate that the cell membrane will detach from the
substrate if N gt FoNCw where F0 is a measure of the force in a single bond at the time of bond
rupture and that the rate of peeling can be roughly approximated as the product of the
disassociation rate k -- (bondss) from eqn (265) and the distance between bonds (N -12C )
Although this provides some insight into how the peeling rate depends on the various factors it fails to capture the fact that the cell remains in an equilibrium attached state even for non-zero levels of tension reflecting that even under force a balance can exist between the rates of formation and rupture of receptor-ligand complexes (Ra Picart et al 1999)
It is also of interest to note that in the region near the edge of the attachment zone(x1=0
in Fig 3115) the membrane acts as a beam subjected to a moment due to the applied tension
This moment is balanced by a force couple due to tension in the adhesion complexes right
adjacent to the edge in combination with a compressive stress between the cell and substrate a
little further in In typical situations this compressive stress can approach levels as high as one
atmosphere and can act to effectively smooth the membrane and recruit new attachment sights While using these continuum descriptions it is important to keep in mind the true
discrete nature of the individual bonds represented in the model as a continuous adhesive
surface This is brought to light by a simple calculation in which the characteristic length over
which the applied tension is supported w is compared to the inter-receptor spacing N -12C
Using typical values for the parameters NC = 103 complexesμm-2 k = 10-5 to 10-6 Nm Kb = 1 to 2x10-18 Nm we find that w cong 01 to 03 μm and the inter-complex spacing N minus1 2
C cong 003 μm While it is reassuring to see that w is typically less than the inter-complex spacing the difference is small It is therefore not surprising that the actual process of cell peeling is stochastic in nature occurring in a sequence of more-or-less discrete steps with a velocity of peeling that varies widely from the mean
The interplay between receptor-ligand bonding and membrane stiffness also determines whether a cell will spread over a surface or peel away from it under a given tension Membrane bending stiffness acts to maintain the membrane and substrate within close proximity near the edge of contact (Fig 3115) Spreading can occur only if their separation distance is within the extended length of the receptor ligand bond over a distance comparable to the linear spacing
48
CHAPTER 21 CELL MEMBRANE MECHANICS AND ADHESION copyRD Kamm 4615
between neighboring bonds ( N minus1 2 C ) Under high tension the surfaces rapidly diverge and
spreading is prevented if the tension is sufficiently low receptor-ligand bonding can occur and spreading can occur
Measurements of adhesion
A variety of methods have been used to experimentally determine the strength of adhesion either
of individual receptor-ligand bonds or populations of bonds as in the case of entire cells
Whole cell experiments are more common and typically require less experimental
sophistication The drawback of course is that they provide only for estimates of average
properties and require certain assumptions regarding the distribution of cell-substrate adhesive
stress for interpretation to the level of a single bond Several of these methods are described
next
Centrifugal cell adhesion assays In this experiment cells are allowed to attached to a substrate
then are placed in a centrifuge rotating at speed ω positioned a distance r from the center of
rotation and oriented so that the net centrifugal force is acting to separate the cell from the
substrate Using the arrangement shown in Fig 3116 (right) the acceleration of the cells is 2ω r and the net force acting on a cell of volume Vc is F = (ρc minus ρf )ω 2rVc where the fluid and cell densities are ρf and ρc respectively
Interpreting these results we can make several different assumptions each leading to a different estimate for the maximum force experienced by the binding complex If we simply assume that all receptor-ligand complexes support an equal fraction of the total force F then the force per bond is f = F (πa 2NC ) where NC is the concentration of bond complexes However as the cell tears away from the substrate the edge bonds will break first since these experience the greatest level of force An alternative approach then is to assume that the adhesion complexes around the cell circumference support the entire load leading to the estimate f = F 2( πaN 1 2 ) recognizing that N1 2
C C is the average distance between bonds A somewhatmore accurate value for f might be obtained if we assume that all complexes within the distance w given by eqn (278) support the load In any of these cases once the centrifugal force exceeds some critical limit since the number of receptors supporting the load falls as the region of contact becomes smaller the force per bond increases and the cell will rapidly detach
Stochastic variability also needs to be taken into account however since even under a constant load any single bond has a finite probability of failure under a given level of force The equilibrium state of the cell then should be viewed as one in which the rate of bond formation equals the rate of bond breakage with increasing force having the effect of reducing the
49
CHAPTER 21 CELL MEMBRANE MECHANICS AND ADHESION copyRD Kamm 4615
probability that the bond will remain intact These effects can be addressed using the methods described in more detail in Chapter xx Parallel flow assay Another common method for assessing cell adhesion is to plate the cells onto one wall of a parallel flow chamber subject them to a fluid dynamic shear stress and observe at what flow rate the cells begin to release If we ignore flow details in the immediate vicinity of the cell the shear stress can be estimated from the solution for a fully developed (Poiseuille) velocity profile
3V ⎡ y2
⎛ ⎞ ⎤v(y) = ⎢1minus ⎥ (279)
2 ⎝ ⎠ ⎣ ⎢ h ⎥⎦
so that the shear stress acting on the cell is
⎛ dv ⎞ 6μV τw = μ⎜ ⎟ = (280)
⎝ dy ⎠ h y = minush
and the total force can be estimated as F asymp τw Ac where Ac is the surface area of the cell membrane exposed to the flow Consider as an example a flow of culture medium at a rate of 1 mls through a channel of height 01 cm and width 1 cm If the culture medium has a viscosity close to that of water (μ=001 dyns) the shear stress is obtained from eqn (280)
6 sdot (001dyn sdot s) sdot (1ml s) ( 01 sdot10cm2 )τ dyn cm 2w = = 6 = 06Pa
01cm This corresponds roughly with the level of shear stress experience by endothelial cells in the arterial system If we consider that the cell has a surface area with dimensions roughly 100 μm x 10 μm or about 103 μm2 then the total force acting on the cell is obtained by integrating the shear stress over the area of the apical membrane Assuming that the shear stress is uniform the force is simply the product of shear stress and surface area or about 1 nN in the present example Again interpretation of results from such experiments requires careful consideration of the distribution of forces among the individual adhesion complexes In this situation the cell is likely to peel from the upstream edge in much the same manner as occurs in the cell peeling experiment discussed earlier
50
CHAPTER 21 CELL MEMBRANE MECHANICS AND ADHESION copyRD Kamm 4615
Radial flow and spinning disk assays One disadvantage of the parallel flow assay is that all cells are subjected to essentially the same level of shear stress so the flow rate needs to be incrementally varied in order to determine the level of force required for detachment These two systems using an axisymmetric geometry circumvent this problem by producing an easily characterized radial variation in shear stress In the case of the radial flow assay fluid enters through a central channel and flows radially outward through the narrow gap between two circular plates From conservation of mass the mean flow velocity is given by
QV = (281)
2πrh and sufficiently far from the center (rgtgth) the velocity profile is parabolic as in the parallel flow assay and the shear stress is again governed by eqn (280) using (281) for V Q
ω
(Not to scale)
v
h h
Cell layer rc Ce l l layer rc
r r
Fig 3116 Schematic diagram showing the radial flow assay (left) and the spinning disk assay (right) In the radial flow assay shear stress attains a maximum value near the center and falls with increasing radius r whereas in the spinning disk system maximum shear stress is experienced at large r In the spinning disk assay cells are grown on one disk and the opposite disk is rotated at constant speed Provided the rate of rotation is sufficiently small that inertial effects can be neglected the velocity is purely in the circumferential direction and the profile is linear between the two plates so that the shear stress experienced by the cells can easily be computed as
ωr τw = μ (282)
h
51
CHAPTER 21 CELL MEMBRANE MECHANICS AND ADHESION copyRD Kamm 4615
In both of these cases as in the parallel flow assay the total force is obtained by integrating the shear stress over the cell surface and the distribution of force among the adhesion complexes is weighted toward those located near the upstream end of the cell This can also be seen by consideration of the torque exerted by shear stress on the cell that must be balanced by a nonshyuniform contact stress with the substrate that is greatest near the upstream end Single bond adhesion assays Two other assays provide a means of obtaining estimates for the strength of a single adhesion bond without the need for excessive interpretation These rely on an ability to isolate a small number of bonds or even a single bond and infer bond strength from the step-wise nature of the de-adhesion process associated with breakage of discrete bonds One of these methods employs the atomic force microscope coated with the ligand of an adhesion receptor as shown in Fig 3117 The probe tip is gradually brought up to the cell surface until one or more receptor-ligand bonds are formed When the probe tip is withdrawn it moves along a different trajectory on a force-displacement plot reflecting the forces of adhesion These forces are seen to jump between more or less discrete levels as the probe continues to be moved away from the cell with each jump corresponding to the breakage of a single bond (Fig 3117) Using this method the bond strength between integrin receptor and a variety of RGD-containing ligands was found to lie in the range of 30 to 100 pN (Lehenkari and Horton 1999)
Fig 3117 The strength of a single adhesion bond can be measured by bringing a functionalized tip of an AFM probe up to the cell allowing bonds to form then slowly withdrawing the probe Monitoring the differences between the force displacement curve between the forward and reverse motions the forces necessary to break a single receptor-ligand bond can be determined [Reproduced from (Lehenkari and Horton 1999)]
52
CHAPTER 21 CELL MEMBRANE MECHANICS AND ADHESION copyRD Kamm 4615
A second method is similar in that the discrete increments in force are monitored as individual receptor-ligand bonds are broken but the forces are measured by means of changes in the shape of a giant vesicle the membrane of which contains the ligands have been inserted In this case one vesicle is made effectively rigid due for example to a high surface tension A second vesicle containing the adhesion molecules is also drawn partially into a micropipet but is much more complaint than the first The two vesicles are then brought into point contact so that one or a small number of adhesions are formed As the pipets are moved apart the compliant vesicle distorts due to the force of adhesion which it can be shown is related to the change in dimension of the vesicle in the direction of the force thereby serving as a sensitive force transducer measuring forces in the range of single adhesion receptors or between 1 and 100 pN [Evans 1991 37]
(For specific examples of leukocyte rolling and attachment see Orsello or Chang amp Hammer)
[This process is initiated for example by local infection that causes the release of
chemotactic agents in addition to cytokines hellip
Models of this process draw upon many of the concepts discussed in this chapter ]
Transient cell adhesion
Concepts of transient adhesion and release are of particular importance in the case of leukocyte
rolling adhesion and transmigration across the endothelial layer of a blood vessel In addition
cell migration through extracellular matrix or along a substrate requires the ability of the cell to
both form and release adhesions
One problem that has received considerable attention is the interaction between an
adherent or rolling leukocyte and the adhesion receptors on the endothelium These studies are
complicated by the three-dimensional nature of the flow the compliance of the interacting
surfaces and receptor-ligand dynamics In a series of recent studies Hammer and co-workers
(Chang Tees et al 2000) have addressed several of these issues computing the viscous force
and torque acting upon a sphere near to planar wall from the mobility matrix (Hammer and Apte
1992) and using the ldquoBell modelrdquo of receptor binding (Bell 1978) but neglecting the effects of
cell deformation The Bell model relates the dissociation rate constant kr to the force in the
bond f the thermal energy kBT and a parameter with units of length that depends on the
reactivity of the molecule
kr = ko r exp(γf kBT ) (283)
53
CHAPTER 21 CELL MEMBRANE MECHANICS AND ADHESION copyRD Kamm 4615
A Monte Carlo method is employed at each time step in the calculation to determine bond
formation or breakage In these studies the nature of the leukocyte-endothelial interaction is
characterized as firm adhesion rolling adhesion bimodal adhesion or no adhesion and mapped
as a function of the two parameters of the Bell model in Fig 3 The boundaries of the rolling
adhesion regime are identified for a wall shear rate of 100 s-1 (dotted lines) or 30 and 400 s-1
(solid lines) Most literature values for the Bell model parameters for a variety of selectin
receptors (known to be instrumental in leukocyte rolling) correspond to the rolling adhesion
regime for typical shear rate of 100 s-1 An interesting but counterintuitive result from this study
was the observation that as the bond stiffness was increased from the value used in most
calculations (100 dyne cm-1) adhesiveness decreased which the authors attribute to reduced
deflection for a given level of force leading subsequently to more rapid dissociation
Fig 3118 The state diagram for a leukocyte interacting with an endothelial surface for shear rates ranging from 30 to 400 s-1 For low dissociation rates the leukocyte remains adherent to the surface (lower left) As either (γ) or ( ko
r ) [see Eqn (283) for definitions] is increased the cell first adheres firmly then rolls along the wall then completely detaches (upper right) Rolling adhesion is defined as the regime where rolling occurs over some part of the shear rate range between 30 and 400 s-1 Firm adhesion indicates that cells remain attached even at the highest shear rate no adhesion indicates that cells roll at a velocity gt 50 of the velocity of a non-adherent sphere In the bimodal regime cells are either adherent or non-adherent and do not exhibit rolling Dotted curves correspond to these same boundaries for a shear rate of 100 s-1 Reproduced from Chang et al (2000)
54
CHAPTER 21 CELL MEMBRANE MECHANICS AND ADHESION copyRD Kamm 4615
In another recent study using high-resolution video-microscopy (Schmidtke and Diamond
2000) it was demonstrated that a flowing neutrophil can attach to an adherent platelet via
adhesion molecules located in the tips of the microvilli and form long tethers averaging nearly 10
μm in length but ranging up to 40 μm at extensional rates of 6-40 μm s-1 for shear rates ranging
from 100-250 s-1 The mechanics of tether formation is itself a fascinating topic that is still under
intense investigation Readers interested in pursuing this work in more detail are referred to the
several papers (Hochmuth Shao et al 1996 Dai and Sheetz 1998 Dai and Sheetz 1999) that
identify a number of intriguing phenomena
55
CHAPTER 21 CELL MEMBRANE MECHANICS AND ADHESION copyRD Kamm 4615
317 Nomenclature Parameter Definition Units
R - receptor
L - ligand
C - receptor-ligand complex
G - Gibbs free energy Nm
N - membrane tension Nm
NR - total receptor density -3μm-2 in 2D or μm in 3D NL - total ligand density μm-2 in 2D or μm-3 in 3D N in 2D or μm-3μm-2
C - complex density in 3D NRf - free receptor density m-2 in 2D or m-3μ μ in 3D NLf - free ligand density -2 -3μm in 2D or μm in 3D d+ - forward diffusional rate constant 2 -1μm s-1 in 2D or 3 μm s in 3D d -1
- - reverse diffusional rate constant s r+ - forward reaction rate constant s-1
r- - reverse reaction rate constant s-1 D 2 -1
m - membrane diffusion coefficient μm s D - solution diffusion coefficient m2 s -1s μ Kb - bending stiffness Nm K 0 - equilibrium constant or affinity (zero force) M-1 in 3D and 2μm in 2D = k0
+ k0 minus
K - equilibrium constant M-1 in 3D and m2μ in 2D = k+kshy
k0 - association rate constant (zero force) M-1 s-1 in 3D or m-2 -1+ μ s in 2D
k0 - dissociation rate constant (zero force) s-1 minus
k - association rate constant M-1 s-1 in 3D or m-2 -1+ μ s in 2D
kminus - dissociation rate constant s-1 f - force per bond N F - total adhesion force N γ - empirical parameter μm r0 - distance over which energy minimum acts μm E0 - bond energy J k JK-1
B - Boltzmanns constant T - temperature K τ - bond lifetime s
56
CHAPTER 21 CELL MEMBRANE MECHANICS AND ADHESION copyRD Kamm 4615
τ0 - bond lifetime with zero force s σ - adhesion stress N μm-2 κ - spring constant for receptor-ligand bond N μm-1
57
CHAPTER 21 CELL MEMBRANE MECHANICS AND ADHESION copyRD Kamm 4615
References Bell G I (1978) Models for the specific adhesion of cells to cells Science 200 618-627 Caille N O Thoumine et al (2002) Contribution of the nucleus to the mechanical properties
of endothelial cells J Biomech 35(2) 177-87 Chang K C D F Tees et al (2000) The state diagram for cell adhesion under flow
leukocyte rolling and firm adhesion Proc Natl Acad Sci U S A 97(21) 11262-7 Dai J and M P Sheetz (1998) Cell membrane mechanics Methods Cell Biol 55 157-71 Dai J and M P Sheetz (1999) Membrane tether formation from blebbing cells Biophys J
77(6) 3363-70 Daily Elson et al (1984) Determination of the elastic area compressibility modulus of the
erythrocyte membrane Biophys J 45(4) 671-682 Evans E and K Ritchie (1997) Dynamic strength of molecular adhesion bonds Biophys J
72(4) 1541-55 Evans E A (1983) Bending elastic modulus of red blood cell membrane derived from
buckling instability in micropipet aspiration tests Biophys J 43(1) 27-30 Hammer D A and S M Apte (1992) Simulation of cell rolling and adhesion on surfaces in
shear flow general results and analysis of selectin-mediated neutrophil adhesion Biophys J 63(1) 35-57
Hardt S L (1979) Rates of diffusion controlled reactions in one two and three dimensions Biophysical Chemistry 10 239-243
Hochmuth F M J Y Shao et al (1996) Deformation and flow of membrane into tethers extracted from neuronal growth cones Biophys J 70(1) 358-69
Kucik D F E L Elson et al (1999) Weak dependence of mobility of membrane protein aggregates on aggregate size supports a viscous model of retardation of diffusion Biophys J 76(1 Pt 1) 314-22
Kusumi A Y Sako et al (1993) Confined lateral diffusion of membrane receptors as studied by single particle tracking (nanovid microscopy) Effects of calcium-induced differentiation in cultured epithelial cells Biophys J 65(5) 2021-40
Lehenkari P P and M A Horton (1999) Single integrin molecule adhesion forces in intact cells measured by atomic force microscopy Biochem Biophys Res Commun 259(3) 645-50
McCloskey M and M M Poo (1984) Protein diffusion in cell membranes some biological implications Int Rev Cytol 87 19-81
Meleard P Gerbeaud C Bardusco N Mitov MD and Ferdandex-Puente L (1998) Mechanical properties of model membranes studied from shape transformations of giant vesicles Biochimie 80 401-413
Moy V T Y Jiao et al (1999) Adhesion energy of receptor-mediated interaction measured by elastic deformation Biophys J 76(3) 1632-8
Ra H J C Picart et al (1999) Muscle cell peeling from micropatterned collagen direct probing of focal and molecular properties of matrix adhesion J Cell Sci 112 ( Pt 10) 1425-36
Saffman P G (1976) Bownian motion in thin sheets of viscous fluid Journal of Fluid Mechanics 73 593-602
Schmidtke D W and S L Diamond (2000) Direct observation of membrane tethers formed during neutrophil attachment to platelets or P-selectin under physiological flow J Cell Biol 149(3) 719-30
Sheets E D R Simson et al (1995) New insights into membrane dynamics from the analysis of cell surface interactions by physical methods Curr Opin Cell Biol 7(5) 707-14
58
CHAPTER 21 CELL MEMBRANE MECHANICS AND ADHESION copyRD Kamm 4615
Vink H and B R Duling (1996) Identification of distinct luminal domains for macromolecules erythrocytes and leukocytes within mammalian capillaries Circ Res 79(3) 581-9
Waugh R and E A Evans (1979) Thermoelasticity of red blood cell membrane Biophys J 26(1) 115-31
Zeman K H Engelhard et al (1990) Bending undulations and elasticity of the erythrocyte membrane effects of cell shape and membrane organization Eur Biophys J 18(4) 203shy19
Zhelev D V D Needham et al (1994) Role of the membrane cortex in neutrophil deformation in small pipets Biophys J 67(2) 696-705
59
MIT OpenCourseWarehttpocwmitedu
20310J 3053J 6024J 2797J Molecular Cellular and Tissue BiomechanicsSpring 2015
For information about citing these materials or our Terms of Use visit httpocwmiteduterms

CHAPTER 21 CELL MEMBRANE MECHANICS AND ADHESION copyRD Kamm 4615
Fig 3110 Schematic showing the different types of cell junctions present in an epithelial cell as found in the small intestine Tight junctions near the apical surface essentially prevent the passage of all molecules The spot desmosomes and adherens junctions provide for cell-cell anchoring and the hemidesmosomes for anchoring to the basal lamina Gap junctions provide a means for communication between neighboring cells [Reproduced from Lodish et al Molecular Cell Biology 2000]
Junction type Function Extracellular or Intracellular
adjacent cell attachment
attachment
Adherens structural cell-cell or cell- ECM proteins or actin filaments
matrix cadherins in
adjacent cell
Desmosome structural cell-cell cadherin intermediate
filaments
Hemidesmosome structural cell-matrix basal lamina via intermediate
integrins filaments
Focal adhesions structural cell-matrix ECM proteins actin filaments
via integrins
Tight junction regulate transport between homophillic binding between the
cells and along cell transmembrane proteins occludin or
37
CHAPTER 21 CELL MEMBRANE MECHANICS AND ADHESION copyRD Kamm 4615
membrane claudins
Gap junctions cell-cell communication channels formed by connexin
via ion and small molecule subunits
exchange
Table 2 Adhesion complexes
Focal adhesions A second means by which cells attach to the extracellular matrix is through
focal adhesions These serve a similar function to the hemidesmosomes and share a common
linkage via integrins to the ECM but are attached on the intracellular side instead to the actin
filaments of the cytoskeleton Actin filaments converge at the site of focal adhesions forming
stress fibers strong actin bundles that attach to the β-subunit of the integrins via adapter
proteins such as actinin vinculin and talin Focal adhesions are instrumental in cell migration
and for this purpose need to be easily formed and disrupted as the cell moves forward Release
or de-adhesion of cells is often mediated by a class of peptides called dis-integrins that
competitively bind to the RGD site used by integrins to attach to a variety of matrix molecules
Tight junctions Control of transport is generally mediated by tight junctions that form an
intricate network of seams between two cells (Fig 3111) As their name implies these are the
tightest of the cell-cell junctions and the gaps they leave are often small enough to exclude even
the smallest ions and molecules Formed by homophillic binding between the transmembrane
proteins occluding and claudins tight junctions allow epithelial cells to perform their critical role
in transepithelial transport and provide for maintenance of differences in concentration between
the apical and basal surfaces of these cells Since occludins are not capable of forming rigid
structural bonds with the cytoskeleton they are most often associated in a junctional complex
with adherens junctions or desmosomes that fulfill the structural needs of attachment
38
CHAPTER 21 CELL MEMBRANE MECHANICS AND ADHESION copyRD Kamm 4615
Fig 3111 Tight junctions in an epithelial cell shown schematically (a) in a freeze fracture replica (b) and in a transmission electron micrograph (c) [Reproduced from Alberts et al 1994]
Fig 3112 Two types of bond that attach a cell to the extracellular matrix by means of clusters of integrins On the extracellular side integrins bind to the matrix proteins fibronectin and laminin Inside the cell they attach to the cytoskeleton via adaptor proteins to either actin filaments (focal adhesions) or intermediate filaments (hemidesmosomes) [Reproduced from Lodish et al Molecular Cell Biolology 2000]
Non-specific binding
Cells can adhere to their surroundings by either non-specific or receptor-ligand (specific)
bonding Though both mechanisms are likely active in most situations as we will see receptorshy
39
CHAPTER 21 CELL MEMBRANE MECHANICS AND ADHESION copyRD Kamm 4615
ligand bonding is the stronger of the two by a considerable margin and is therefore the most
relevant biologically In situations for which either the receptors or their ligands are not present
however such as might be the case in certain in vitro experiments non-specific binding can be
important as well
There are essentially three major forms of non-specific attractions to consider
bull Van der Waals ndash These attractive forces arise due to charge interactions in polar
molecules They tend to dominate among the non-specific mechanisms at
intermediate distances around 20-25 nm [see Boal]
bull Electrostatic ndash These interactions can be either attractive or repulsive depending
on the sign of the surface charges and are particularly important during the
approach of two cells since the glycocalyx has a high negative charge density
bull Steric ndash These forces arise due to the steric exclusion of two molecules as they are
brought into close contact In the case of cell-cell interactions steric repulsion is
due to the compression of the two glycocalyx layers and the tendency to resist
compression resulting from osmotic effects and the elasticity of the layer Steric
forces tend to dominate for small separation distances lt 10 nm
In combination these effects combine to produce a net attractive force per unit area of
about 100 Pa at a separation distance of about 25 nm
Adhesion by means of receptor-ligand binding
We can use the analysis of Chapter xx to estimate the strength of a receptor-ligand bond and
based on typical values for bond density calculate the corresponding strength of adhesion
between two cells or between a cell and a surface Recall that the application of force to a
receptor-ligand bond modifies the dissociation rate constant for the binding reaction This effect
can be modeled in several ways but the result obtained by Bell ((Bell 1978)) suggests the
following exponential form for the dissociation rate
0 ⎛ γf ⎞ 0 ⎛ γσ ⎞ kminus = kminus exp⎜ ⎟ = kminus exp⎜ ⎟ (265)
⎝ kBT ⎠ ⎝ NC kBT ⎠
where k0minus is the unforced dissociation rate constant γ is a factor with the units of length that
corresponds roughly with the distance separating the bonded pair at equilibrium NC is the concentration of bonded complex and σ is the average bond force per unit area To determine
40
CHAPTER 21 CELL MEMBRANE MECHANICS AND ADHESION copyRD Kamm 4615
the rate of change of the concentration of bonded pairs one must solve the following rate equation describing the competition between bond formation (first term) and destruction (second term)
dNC ⎛ γσ ⎞
cong k+ (NR minus NC )(NL ) minus kminus NC = k+ (N minus )( 0R NC NL ) minus kminus NC exp⎜ ⎟ (266)
dt ⎝ NC kBT ⎠
where NR and NL are the concentrations of receptors and ligands respectively and we have
assumed that NCltltNL and that all bonds are stressed equally At equilibrium dNCdt=0 and if
the force applied to detach the cell (equal to the average bond stress σ) is increased
incrementally from zero NC will progressively fall to a new equilibrium value At sufficiently
high levels of force however increasing σ further eventually gives rise to a situation in which equilibrium can no longer be achieved through a reduction in NC At that point NC tends toward zero and the cell separates from the surface to which it was attached It can be shown that this
occurs when (Bell 1978)
k 0
α c exp(α + c + 1) = N
k 0 L (267)minus
σ
where α minγ c equiv and σmin is the minimum stress needed to cause detachment For a wide
NRkBT
range of conditions eqn (267) has the approximate solution
⎛ k0 + ⎞
α c cong 07 ln L (268)⎜ 0 N ⎟⎝ kminus ⎠
so that the critical stress for detachment can be expressed as
N 0
σ cong 07 C kBT ⎛ k ⎞ ln⎜
+ min N ⎟ (269)
γ ⎝ k0 L minus ⎠
where NC is determined from setting eqn (266) to zero under these critical conditions
Thermodynamic approach to cell adhesion
Although we focus here on the mechanical aspects of cell adhesion this process can also be
viewed from a thermodynamic perspective In this approach adhesion is considered in terms of
the change in energy specifically the Gibbs free energy G associated with all the individual
receptor-ligand interactions as well as the various non-specific forces of attraction or repulsion
The adhesion of a cell to a given surface then can be viewed as an equilibrium state determined
41
CHAPTER 21 CELL MEMBRANE MECHANICS AND ADHESION copyRD Kamm 4615
by minimization of the free energy If in undergoing a transition from a free state to an adherent
state the system represented by the cell and surface experiences a reduction in free energy ie
ΔGlt0 then adhesion will occur and the equilibrium state of adhesion will be determined by that with the minimum in free energy or the largest value of -ΔG While this approach ignores
many of the subtleties of the interactions and like the analysis above assumes that all receptorshy
ligand interactions are identical from an energetic point of view it is useful in providing some
simple insights as seen in the next two examples
Example Comparison of specific and non-specific adhesive forces Non-specific bonding due
to the combined effects of van der Waals electrostatic and steric forces result in an attractive
stress of approximately 100 Pa Receptor-ligand bonding give rise to forces that can be
estimated from the change in free energy f ~ to 4x10⁻⁴ dynbond = 9x10-11 to 4x10⁻⁹ ΔGr~9x10⁻⁶ Nbond where f is the force required to break the bond and r is a measure of the distance the bond stretches before it breaks Using a typical density of the receptor-ligand complex NC of ~1012-1015 bondsm2 gives a total bond stress of N 1
C x f ~ 9 x 10 to 4x10⁶ Pa The above kinetic approach to estimating bond strength [eqn (269)] gives a value approximately half of that from this equilibrium approach In either case however the conclusion remains the same non-specific binding can under certain circumstances be important since it is comparable to the lowest estimates of receptor-ligand-mediated bond strength but not surprisingly the latter is quite likely to dominate in nearly all practical situations
Example JKR theory for the equilibrium area of adhesion between a cell and substrate
It is well known that cells tend to take on a more flattened shape as the substrate to which they
are attached becomes more strongly adhesive either by coating with a more attractive ligand or
by increasing the concentration of ligand bound to the substrate Conversely less adhesive cells
round up and become more spherical These observations can be explained with the help of a
simple scaling analysis on the assumptions of small deformation of a linear elastic cell
Let the cell be modeled as a homogeneous elastic sphere with elastic modulus E and
initial radius R (Fig 3113) It is then brought into contact with a surface to which it adheres
As the cell adheres it attains a lower energy state characterized by an adhesion energy per unit
area J Formation of a flat adhesion surface however requires deformation within the elastic
cell and an associated increase in the stored elastic energy In Chapter 31 we showed that the
stored elastic energy per unit volume can be written
UE asymp int τεdV asymp int 1 2 Eε 2dV (270)
Vc Vc
42
CHAPTER 21 CELL MEMBRANE MECHANICS AND ADHESION copyRD Kamm 4615
Strain inside the cell can be approximated as the displacement of the cell surface δ divided by the characteristic distance within the cell to which the deformations penetrate a distance that scales with the lateral extent of the contact region 2a so that ε prop δ a where it can easily be shown from the geometry that a 2 asymp 2δR so that ε prop δ R Combining and dropping all numerical constants we obtain the following scaling approximation
δUE prop E ( )δR
3 2 (271)R
An expression for the total energy of the system then can be written
U prop minusJa2 + Eε2a3 prop JδR + Eδ 5 2R1 2 (272) The equilibrium state corresponds to the value of δ having the minimum energy obtain from
partU prop minusJR + Eδ 3 2R1 2 (273)
partδ so that
23 1 3 ⎛ JR12 ⎞ ⎛ JR2 ⎞
δ prop ⎜ ⎟ and a prop ⎜ ⎟ (274)⎝ E ⎠ ⎝ E ⎠
The exact solution to this problem yields the result
⎡ ) 1 3 2 1( minusν 2 ⎤ 9πJR
a = ⎢ ⎥ (275)⎢ 2E ⎥⎣ ⎦
43
CHAPTER 21 CELL MEMBRANE MECHANICS AND ADHESION copyRD Kamm 4615
Elastic modulus E adhesion energy per unit area J
2a
Fig 3113 Experiments to determine the contact area of an iminobiotin functionalized agarosebead on a glass coverslip in water Top Schematic of adherent bead Bottom Results for a range of bead radii Solid line is a fit to the date which obeys the power law a prop R23 consistent with the prediction of JKR theory eqn(276) [Reproduced from (Moy Jiao et al 1999)] This can be compared to the result obtained from a more rigorous analysis
⎡9πJR 2(1minus ν 2 ) 13 ⎤
a = ⎢ ⎥ (276)2E⎢ ⎣ ⎥⎦
and to experimental data obtained from spherical beads made from a 4 agarose gel (Fig 3113)
Models for receptor-mediated adhesion
In Chapter x and in the preceding text we discussed the energetics of bond formation and release
as well as the effect of applied force in altering the energy landscape of the bonded pair and
thereby the rate constants for bond kinetics That analysis has obvious implications to the
44
CHAPTER 21 CELL MEMBRANE MECHANICS AND ADHESION copyRD Kamm 4615
adhesion of cells to substrates the surrounding extracellular matrix and other cells Here we
extend that analysis in the specific case of whole cell adhesion In doing so it will be important
to consider such factors as the distribution type and density of receptor-ligand bonds or
potential bonds and the elastic properties of the structures to which they are anchored On the
intracellular side this involves the series of couplings that link the receptor to the cell In the
simplest case this might simply be a link to the lipid bilayer if the receptor has no intracellular
connections More typically especially for couplings with a structural role it involves a series
of proteins ultimately linking the receptor to the cytoskeleton
The typical setting in vivo is one in which cells adhere to other cells or to the extracellular
matrix Adhesions are more easily probed however through in vitro experiments (described
below) where cell adhesion more often occurs to an artificial substrate mediated through one of
several extracellular proteins that are used to coat the surface Generally either collagen or
fibronectin is used Cells are often adhered to these substrates but to produce a more controlled
environment rigid beads are sometimes coated with the appropriate receptors so that one specific
receptor-ligand interaction can be probed While these systems are useful as models of certain
adhesion phenomena it is important to recognize in the interpretation of these experiments that
when bound to a rigid substrate or bead the binding proteins cannot freely diffuse as they would
in a more natural environment In particular the formation of focal adhesions would not occur in
bead-substrate experiments because the receptors would be constrained from aggregating
It is instructive to begin this discussion with a consideration of a single adhesion bond
for example one linking the actin matrix of the cytoskeleton to a β1 integrin and the integrin
receptor binding to the extracellular matrix beyond the cell membrane (Fig 3114) If the bond
is stressed as for example if the cell experiences a force relative to the ECM it will at first
stretch an amount dictated by the level of force in the bond and the stiffness of the complex
Each bond as well as each protein in the bond complex can be thought of as having a certain
stiffness giving rise to a picture in which several springs are considered connected in series
Forces acting on the adhesion complex are transmitted via this series of bonded proteins between
the CSK and the ECM producing local deformations and stresses in the corresponding matrices
that decay with distance from the adhesion site On the intracellular side these forces are
transmitted via a complex involving vinculin α-actinin paxillin and talin Attachment to the
extracellular matrix is mediated by an RGD sequence (in fibronectin for example) which in turn
has binding sites for collagen and fibrin If the force is sufficiently strong above a certain
threshold value F0 say and applied for a sufficiently long time the bond might be severed (deshy
couple) Typical values of this threshold force lie in the range of 10-100 pN (Evans and Ritchie
1997) but depend as well on the rate at which the force is increased Under more rapid
forcings the threshold is high compared to when the force is increased slowly This simply
45
CHAPTER 21 CELL MEMBRANE MECHANICS AND ADHESION copyRD Kamm 4615
reflects the fact that detachment is a stochastic process and that at any given level of force there
exists a finite probability of detachment and this probability increases with time
Fig 3114 One type of attachment linking the intracellular actin matrix to the extracellular matrix via an integrin complex that involves in addition vinculin α-actinin paxillin and talin (Reproduced from Lodish et al Molecular Cell Biolology 2000)
We need also to consider that in equilibrium a fraction Φ = K(1+K)-1 (where K is the
equilibrium constant) of the receptors will be bound at any given time and that the receptorshy
ligand complexes are continually cycling between the bound and unbound states characterized
by their respective rate constants
On a larger scale numerous adhesion sites typically act in parallel each contributing
some amount to the total adhesion force If the force transmitted by each single adhesion
complex is F and the density of adhesion sites (per unit membrane area) is NC then the stress
acting on the cell is the product F NC This gives a somewhat false impression however as it is
unlikely that each adhesion complex carries an equal force Put another way there exists a local
stress τ that can be thought of as the product of the average force per bond times the bond
density This stress is typically non-uniform In the adhesion of a cell to a flat substrate the
bonds near the periphery of the contact zone determine the strength of the cell against
detachment and when the cell is subjected to a detaching force the stresses are concentrated in
46
CHAPTER 21 CELL MEMBRANE MECHANICS AND ADHESION copyRD Kamm 4615
this peripheral region as depicted in Fig 3115 In the vicinity of the edge of adhesion several
factors will influence the stress distribution including the mechanical properties of the membrane
(in particular the bending stiffness KB) the receptor density the spring constants of the bond
and the bond strength
N
Region of adhesion
x1
Fig 3115 Schematic model of a cell membrane being detached from a substrate by application of a tension force N The membrane is free to the left of the dash-dot line and adherent to the right Forces and moments are transmitted through the membrane which adheres to the membrane through receptor-ligand bonds represented by a continuous distrubution p(x1)
To illustrate consider the following simple model for an adherent cell being peeled away
from its substrate by a force that generates a tension N in the membrane (Fig 3115)
Deformations in the membrane are described by eqn (223) where it can be shown that the
bending term dominates provided KbL2 gtN where L is the characteristic length in the x1 direction
(due to the small length scales involved) and the external membrane force (p in the membrane
equation) is now the non-uniform stress due to adhesion bonds As a simple first approximation
we take p = k(δminusδ0) with δ-δ0 being the amount of stretch in the receptor-ligand bond springs
and k an effective bond spring constant Recognizing that p approaches zero far from the edge
(see Fig 319) the membrane displacement and the spring displacement are related u3 = δ-δ0
Thus eqn (228) is written
⎛ part 4 u
KB⎜ 3
⎞ 4 ⎟ = NC F = NC ku
⎝ partx ⎠ 3 (277)1
This can be solved directly showing that the distance of separation between the cell membrane
and substrate grows in an exponential fashion with distance Even more simply a scaling
47
CHAPTER 21 CELL MEMBRANE MECHANICS AND ADHESION copyRD Kamm 4615
analysis of eqn (277) in which the term on the left is approximated by Kbu3w4 where w is the
characteristic distance over which u3 varies tells us that the stresses are concentrated in a region
of width
K
w prop B4 (278)
NC k
near the cell periphery Similarly we can estimate that the cell membrane will detach from the
substrate if N gt FoNCw where F0 is a measure of the force in a single bond at the time of bond
rupture and that the rate of peeling can be roughly approximated as the product of the
disassociation rate k -- (bondss) from eqn (265) and the distance between bonds (N -12C )
Although this provides some insight into how the peeling rate depends on the various factors it fails to capture the fact that the cell remains in an equilibrium attached state even for non-zero levels of tension reflecting that even under force a balance can exist between the rates of formation and rupture of receptor-ligand complexes (Ra Picart et al 1999)
It is also of interest to note that in the region near the edge of the attachment zone(x1=0
in Fig 3115) the membrane acts as a beam subjected to a moment due to the applied tension
This moment is balanced by a force couple due to tension in the adhesion complexes right
adjacent to the edge in combination with a compressive stress between the cell and substrate a
little further in In typical situations this compressive stress can approach levels as high as one
atmosphere and can act to effectively smooth the membrane and recruit new attachment sights While using these continuum descriptions it is important to keep in mind the true
discrete nature of the individual bonds represented in the model as a continuous adhesive
surface This is brought to light by a simple calculation in which the characteristic length over
which the applied tension is supported w is compared to the inter-receptor spacing N -12C
Using typical values for the parameters NC = 103 complexesμm-2 k = 10-5 to 10-6 Nm Kb = 1 to 2x10-18 Nm we find that w cong 01 to 03 μm and the inter-complex spacing N minus1 2
C cong 003 μm While it is reassuring to see that w is typically less than the inter-complex spacing the difference is small It is therefore not surprising that the actual process of cell peeling is stochastic in nature occurring in a sequence of more-or-less discrete steps with a velocity of peeling that varies widely from the mean
The interplay between receptor-ligand bonding and membrane stiffness also determines whether a cell will spread over a surface or peel away from it under a given tension Membrane bending stiffness acts to maintain the membrane and substrate within close proximity near the edge of contact (Fig 3115) Spreading can occur only if their separation distance is within the extended length of the receptor ligand bond over a distance comparable to the linear spacing
48
CHAPTER 21 CELL MEMBRANE MECHANICS AND ADHESION copyRD Kamm 4615
between neighboring bonds ( N minus1 2 C ) Under high tension the surfaces rapidly diverge and
spreading is prevented if the tension is sufficiently low receptor-ligand bonding can occur and spreading can occur
Measurements of adhesion
A variety of methods have been used to experimentally determine the strength of adhesion either
of individual receptor-ligand bonds or populations of bonds as in the case of entire cells
Whole cell experiments are more common and typically require less experimental
sophistication The drawback of course is that they provide only for estimates of average
properties and require certain assumptions regarding the distribution of cell-substrate adhesive
stress for interpretation to the level of a single bond Several of these methods are described
next
Centrifugal cell adhesion assays In this experiment cells are allowed to attached to a substrate
then are placed in a centrifuge rotating at speed ω positioned a distance r from the center of
rotation and oriented so that the net centrifugal force is acting to separate the cell from the
substrate Using the arrangement shown in Fig 3116 (right) the acceleration of the cells is 2ω r and the net force acting on a cell of volume Vc is F = (ρc minus ρf )ω 2rVc where the fluid and cell densities are ρf and ρc respectively
Interpreting these results we can make several different assumptions each leading to a different estimate for the maximum force experienced by the binding complex If we simply assume that all receptor-ligand complexes support an equal fraction of the total force F then the force per bond is f = F (πa 2NC ) where NC is the concentration of bond complexes However as the cell tears away from the substrate the edge bonds will break first since these experience the greatest level of force An alternative approach then is to assume that the adhesion complexes around the cell circumference support the entire load leading to the estimate f = F 2( πaN 1 2 ) recognizing that N1 2
C C is the average distance between bonds A somewhatmore accurate value for f might be obtained if we assume that all complexes within the distance w given by eqn (278) support the load In any of these cases once the centrifugal force exceeds some critical limit since the number of receptors supporting the load falls as the region of contact becomes smaller the force per bond increases and the cell will rapidly detach
Stochastic variability also needs to be taken into account however since even under a constant load any single bond has a finite probability of failure under a given level of force The equilibrium state of the cell then should be viewed as one in which the rate of bond formation equals the rate of bond breakage with increasing force having the effect of reducing the
49
CHAPTER 21 CELL MEMBRANE MECHANICS AND ADHESION copyRD Kamm 4615
probability that the bond will remain intact These effects can be addressed using the methods described in more detail in Chapter xx Parallel flow assay Another common method for assessing cell adhesion is to plate the cells onto one wall of a parallel flow chamber subject them to a fluid dynamic shear stress and observe at what flow rate the cells begin to release If we ignore flow details in the immediate vicinity of the cell the shear stress can be estimated from the solution for a fully developed (Poiseuille) velocity profile
3V ⎡ y2
⎛ ⎞ ⎤v(y) = ⎢1minus ⎥ (279)
2 ⎝ ⎠ ⎣ ⎢ h ⎥⎦
so that the shear stress acting on the cell is
⎛ dv ⎞ 6μV τw = μ⎜ ⎟ = (280)
⎝ dy ⎠ h y = minush
and the total force can be estimated as F asymp τw Ac where Ac is the surface area of the cell membrane exposed to the flow Consider as an example a flow of culture medium at a rate of 1 mls through a channel of height 01 cm and width 1 cm If the culture medium has a viscosity close to that of water (μ=001 dyns) the shear stress is obtained from eqn (280)
6 sdot (001dyn sdot s) sdot (1ml s) ( 01 sdot10cm2 )τ dyn cm 2w = = 6 = 06Pa
01cm This corresponds roughly with the level of shear stress experience by endothelial cells in the arterial system If we consider that the cell has a surface area with dimensions roughly 100 μm x 10 μm or about 103 μm2 then the total force acting on the cell is obtained by integrating the shear stress over the area of the apical membrane Assuming that the shear stress is uniform the force is simply the product of shear stress and surface area or about 1 nN in the present example Again interpretation of results from such experiments requires careful consideration of the distribution of forces among the individual adhesion complexes In this situation the cell is likely to peel from the upstream edge in much the same manner as occurs in the cell peeling experiment discussed earlier
50
CHAPTER 21 CELL MEMBRANE MECHANICS AND ADHESION copyRD Kamm 4615
Radial flow and spinning disk assays One disadvantage of the parallel flow assay is that all cells are subjected to essentially the same level of shear stress so the flow rate needs to be incrementally varied in order to determine the level of force required for detachment These two systems using an axisymmetric geometry circumvent this problem by producing an easily characterized radial variation in shear stress In the case of the radial flow assay fluid enters through a central channel and flows radially outward through the narrow gap between two circular plates From conservation of mass the mean flow velocity is given by
QV = (281)
2πrh and sufficiently far from the center (rgtgth) the velocity profile is parabolic as in the parallel flow assay and the shear stress is again governed by eqn (280) using (281) for V Q
ω
(Not to scale)
v
h h
Cell layer rc Ce l l layer rc
r r
Fig 3116 Schematic diagram showing the radial flow assay (left) and the spinning disk assay (right) In the radial flow assay shear stress attains a maximum value near the center and falls with increasing radius r whereas in the spinning disk system maximum shear stress is experienced at large r In the spinning disk assay cells are grown on one disk and the opposite disk is rotated at constant speed Provided the rate of rotation is sufficiently small that inertial effects can be neglected the velocity is purely in the circumferential direction and the profile is linear between the two plates so that the shear stress experienced by the cells can easily be computed as
ωr τw = μ (282)
h
51
CHAPTER 21 CELL MEMBRANE MECHANICS AND ADHESION copyRD Kamm 4615
In both of these cases as in the parallel flow assay the total force is obtained by integrating the shear stress over the cell surface and the distribution of force among the adhesion complexes is weighted toward those located near the upstream end of the cell This can also be seen by consideration of the torque exerted by shear stress on the cell that must be balanced by a nonshyuniform contact stress with the substrate that is greatest near the upstream end Single bond adhesion assays Two other assays provide a means of obtaining estimates for the strength of a single adhesion bond without the need for excessive interpretation These rely on an ability to isolate a small number of bonds or even a single bond and infer bond strength from the step-wise nature of the de-adhesion process associated with breakage of discrete bonds One of these methods employs the atomic force microscope coated with the ligand of an adhesion receptor as shown in Fig 3117 The probe tip is gradually brought up to the cell surface until one or more receptor-ligand bonds are formed When the probe tip is withdrawn it moves along a different trajectory on a force-displacement plot reflecting the forces of adhesion These forces are seen to jump between more or less discrete levels as the probe continues to be moved away from the cell with each jump corresponding to the breakage of a single bond (Fig 3117) Using this method the bond strength between integrin receptor and a variety of RGD-containing ligands was found to lie in the range of 30 to 100 pN (Lehenkari and Horton 1999)
Fig 3117 The strength of a single adhesion bond can be measured by bringing a functionalized tip of an AFM probe up to the cell allowing bonds to form then slowly withdrawing the probe Monitoring the differences between the force displacement curve between the forward and reverse motions the forces necessary to break a single receptor-ligand bond can be determined [Reproduced from (Lehenkari and Horton 1999)]
52
CHAPTER 21 CELL MEMBRANE MECHANICS AND ADHESION copyRD Kamm 4615
A second method is similar in that the discrete increments in force are monitored as individual receptor-ligand bonds are broken but the forces are measured by means of changes in the shape of a giant vesicle the membrane of which contains the ligands have been inserted In this case one vesicle is made effectively rigid due for example to a high surface tension A second vesicle containing the adhesion molecules is also drawn partially into a micropipet but is much more complaint than the first The two vesicles are then brought into point contact so that one or a small number of adhesions are formed As the pipets are moved apart the compliant vesicle distorts due to the force of adhesion which it can be shown is related to the change in dimension of the vesicle in the direction of the force thereby serving as a sensitive force transducer measuring forces in the range of single adhesion receptors or between 1 and 100 pN [Evans 1991 37]
(For specific examples of leukocyte rolling and attachment see Orsello or Chang amp Hammer)
[This process is initiated for example by local infection that causes the release of
chemotactic agents in addition to cytokines hellip
Models of this process draw upon many of the concepts discussed in this chapter ]
Transient cell adhesion
Concepts of transient adhesion and release are of particular importance in the case of leukocyte
rolling adhesion and transmigration across the endothelial layer of a blood vessel In addition
cell migration through extracellular matrix or along a substrate requires the ability of the cell to
both form and release adhesions
One problem that has received considerable attention is the interaction between an
adherent or rolling leukocyte and the adhesion receptors on the endothelium These studies are
complicated by the three-dimensional nature of the flow the compliance of the interacting
surfaces and receptor-ligand dynamics In a series of recent studies Hammer and co-workers
(Chang Tees et al 2000) have addressed several of these issues computing the viscous force
and torque acting upon a sphere near to planar wall from the mobility matrix (Hammer and Apte
1992) and using the ldquoBell modelrdquo of receptor binding (Bell 1978) but neglecting the effects of
cell deformation The Bell model relates the dissociation rate constant kr to the force in the
bond f the thermal energy kBT and a parameter with units of length that depends on the
reactivity of the molecule
kr = ko r exp(γf kBT ) (283)
53
CHAPTER 21 CELL MEMBRANE MECHANICS AND ADHESION copyRD Kamm 4615
A Monte Carlo method is employed at each time step in the calculation to determine bond
formation or breakage In these studies the nature of the leukocyte-endothelial interaction is
characterized as firm adhesion rolling adhesion bimodal adhesion or no adhesion and mapped
as a function of the two parameters of the Bell model in Fig 3 The boundaries of the rolling
adhesion regime are identified for a wall shear rate of 100 s-1 (dotted lines) or 30 and 400 s-1
(solid lines) Most literature values for the Bell model parameters for a variety of selectin
receptors (known to be instrumental in leukocyte rolling) correspond to the rolling adhesion
regime for typical shear rate of 100 s-1 An interesting but counterintuitive result from this study
was the observation that as the bond stiffness was increased from the value used in most
calculations (100 dyne cm-1) adhesiveness decreased which the authors attribute to reduced
deflection for a given level of force leading subsequently to more rapid dissociation
Fig 3118 The state diagram for a leukocyte interacting with an endothelial surface for shear rates ranging from 30 to 400 s-1 For low dissociation rates the leukocyte remains adherent to the surface (lower left) As either (γ) or ( ko
r ) [see Eqn (283) for definitions] is increased the cell first adheres firmly then rolls along the wall then completely detaches (upper right) Rolling adhesion is defined as the regime where rolling occurs over some part of the shear rate range between 30 and 400 s-1 Firm adhesion indicates that cells remain attached even at the highest shear rate no adhesion indicates that cells roll at a velocity gt 50 of the velocity of a non-adherent sphere In the bimodal regime cells are either adherent or non-adherent and do not exhibit rolling Dotted curves correspond to these same boundaries for a shear rate of 100 s-1 Reproduced from Chang et al (2000)
54
CHAPTER 21 CELL MEMBRANE MECHANICS AND ADHESION copyRD Kamm 4615
In another recent study using high-resolution video-microscopy (Schmidtke and Diamond
2000) it was demonstrated that a flowing neutrophil can attach to an adherent platelet via
adhesion molecules located in the tips of the microvilli and form long tethers averaging nearly 10
μm in length but ranging up to 40 μm at extensional rates of 6-40 μm s-1 for shear rates ranging
from 100-250 s-1 The mechanics of tether formation is itself a fascinating topic that is still under
intense investigation Readers interested in pursuing this work in more detail are referred to the
several papers (Hochmuth Shao et al 1996 Dai and Sheetz 1998 Dai and Sheetz 1999) that
identify a number of intriguing phenomena
55
CHAPTER 21 CELL MEMBRANE MECHANICS AND ADHESION copyRD Kamm 4615
317 Nomenclature Parameter Definition Units
R - receptor
L - ligand
C - receptor-ligand complex
G - Gibbs free energy Nm
N - membrane tension Nm
NR - total receptor density -3μm-2 in 2D or μm in 3D NL - total ligand density μm-2 in 2D or μm-3 in 3D N in 2D or μm-3μm-2
C - complex density in 3D NRf - free receptor density m-2 in 2D or m-3μ μ in 3D NLf - free ligand density -2 -3μm in 2D or μm in 3D d+ - forward diffusional rate constant 2 -1μm s-1 in 2D or 3 μm s in 3D d -1
- - reverse diffusional rate constant s r+ - forward reaction rate constant s-1
r- - reverse reaction rate constant s-1 D 2 -1
m - membrane diffusion coefficient μm s D - solution diffusion coefficient m2 s -1s μ Kb - bending stiffness Nm K 0 - equilibrium constant or affinity (zero force) M-1 in 3D and 2μm in 2D = k0
+ k0 minus
K - equilibrium constant M-1 in 3D and m2μ in 2D = k+kshy
k0 - association rate constant (zero force) M-1 s-1 in 3D or m-2 -1+ μ s in 2D
k0 - dissociation rate constant (zero force) s-1 minus
k - association rate constant M-1 s-1 in 3D or m-2 -1+ μ s in 2D
kminus - dissociation rate constant s-1 f - force per bond N F - total adhesion force N γ - empirical parameter μm r0 - distance over which energy minimum acts μm E0 - bond energy J k JK-1
B - Boltzmanns constant T - temperature K τ - bond lifetime s
56
CHAPTER 21 CELL MEMBRANE MECHANICS AND ADHESION copyRD Kamm 4615
τ0 - bond lifetime with zero force s σ - adhesion stress N μm-2 κ - spring constant for receptor-ligand bond N μm-1
57
CHAPTER 21 CELL MEMBRANE MECHANICS AND ADHESION copyRD Kamm 4615
References Bell G I (1978) Models for the specific adhesion of cells to cells Science 200 618-627 Caille N O Thoumine et al (2002) Contribution of the nucleus to the mechanical properties
of endothelial cells J Biomech 35(2) 177-87 Chang K C D F Tees et al (2000) The state diagram for cell adhesion under flow
leukocyte rolling and firm adhesion Proc Natl Acad Sci U S A 97(21) 11262-7 Dai J and M P Sheetz (1998) Cell membrane mechanics Methods Cell Biol 55 157-71 Dai J and M P Sheetz (1999) Membrane tether formation from blebbing cells Biophys J
77(6) 3363-70 Daily Elson et al (1984) Determination of the elastic area compressibility modulus of the
erythrocyte membrane Biophys J 45(4) 671-682 Evans E and K Ritchie (1997) Dynamic strength of molecular adhesion bonds Biophys J
72(4) 1541-55 Evans E A (1983) Bending elastic modulus of red blood cell membrane derived from
buckling instability in micropipet aspiration tests Biophys J 43(1) 27-30 Hammer D A and S M Apte (1992) Simulation of cell rolling and adhesion on surfaces in
shear flow general results and analysis of selectin-mediated neutrophil adhesion Biophys J 63(1) 35-57
Hardt S L (1979) Rates of diffusion controlled reactions in one two and three dimensions Biophysical Chemistry 10 239-243
Hochmuth F M J Y Shao et al (1996) Deformation and flow of membrane into tethers extracted from neuronal growth cones Biophys J 70(1) 358-69
Kucik D F E L Elson et al (1999) Weak dependence of mobility of membrane protein aggregates on aggregate size supports a viscous model of retardation of diffusion Biophys J 76(1 Pt 1) 314-22
Kusumi A Y Sako et al (1993) Confined lateral diffusion of membrane receptors as studied by single particle tracking (nanovid microscopy) Effects of calcium-induced differentiation in cultured epithelial cells Biophys J 65(5) 2021-40
Lehenkari P P and M A Horton (1999) Single integrin molecule adhesion forces in intact cells measured by atomic force microscopy Biochem Biophys Res Commun 259(3) 645-50
McCloskey M and M M Poo (1984) Protein diffusion in cell membranes some biological implications Int Rev Cytol 87 19-81
Meleard P Gerbeaud C Bardusco N Mitov MD and Ferdandex-Puente L (1998) Mechanical properties of model membranes studied from shape transformations of giant vesicles Biochimie 80 401-413
Moy V T Y Jiao et al (1999) Adhesion energy of receptor-mediated interaction measured by elastic deformation Biophys J 76(3) 1632-8
Ra H J C Picart et al (1999) Muscle cell peeling from micropatterned collagen direct probing of focal and molecular properties of matrix adhesion J Cell Sci 112 ( Pt 10) 1425-36
Saffman P G (1976) Bownian motion in thin sheets of viscous fluid Journal of Fluid Mechanics 73 593-602
Schmidtke D W and S L Diamond (2000) Direct observation of membrane tethers formed during neutrophil attachment to platelets or P-selectin under physiological flow J Cell Biol 149(3) 719-30
Sheets E D R Simson et al (1995) New insights into membrane dynamics from the analysis of cell surface interactions by physical methods Curr Opin Cell Biol 7(5) 707-14
58
CHAPTER 21 CELL MEMBRANE MECHANICS AND ADHESION copyRD Kamm 4615
Vink H and B R Duling (1996) Identification of distinct luminal domains for macromolecules erythrocytes and leukocytes within mammalian capillaries Circ Res 79(3) 581-9
Waugh R and E A Evans (1979) Thermoelasticity of red blood cell membrane Biophys J 26(1) 115-31
Zeman K H Engelhard et al (1990) Bending undulations and elasticity of the erythrocyte membrane effects of cell shape and membrane organization Eur Biophys J 18(4) 203shy19
Zhelev D V D Needham et al (1994) Role of the membrane cortex in neutrophil deformation in small pipets Biophys J 67(2) 696-705
59
MIT OpenCourseWarehttpocwmitedu
20310J 3053J 6024J 2797J Molecular Cellular and Tissue BiomechanicsSpring 2015
For information about citing these materials or our Terms of Use visit httpocwmiteduterms
CHAPTER 21 CELL MEMBRANE MECHANICS AND ADHESION copyRD Kamm 4615
membrane claudins
Gap junctions cell-cell communication channels formed by connexin
via ion and small molecule subunits
exchange
Table 2 Adhesion complexes
Focal adhesions A second means by which cells attach to the extracellular matrix is through
focal adhesions These serve a similar function to the hemidesmosomes and share a common
linkage via integrins to the ECM but are attached on the intracellular side instead to the actin
filaments of the cytoskeleton Actin filaments converge at the site of focal adhesions forming
stress fibers strong actin bundles that attach to the β-subunit of the integrins via adapter
proteins such as actinin vinculin and talin Focal adhesions are instrumental in cell migration
and for this purpose need to be easily formed and disrupted as the cell moves forward Release
or de-adhesion of cells is often mediated by a class of peptides called dis-integrins that
competitively bind to the RGD site used by integrins to attach to a variety of matrix molecules
Tight junctions Control of transport is generally mediated by tight junctions that form an
intricate network of seams between two cells (Fig 3111) As their name implies these are the
tightest of the cell-cell junctions and the gaps they leave are often small enough to exclude even
the smallest ions and molecules Formed by homophillic binding between the transmembrane
proteins occluding and claudins tight junctions allow epithelial cells to perform their critical role
in transepithelial transport and provide for maintenance of differences in concentration between
the apical and basal surfaces of these cells Since occludins are not capable of forming rigid
structural bonds with the cytoskeleton they are most often associated in a junctional complex
with adherens junctions or desmosomes that fulfill the structural needs of attachment
38
CHAPTER 21 CELL MEMBRANE MECHANICS AND ADHESION copyRD Kamm 4615
Fig 3111 Tight junctions in an epithelial cell shown schematically (a) in a freeze fracture replica (b) and in a transmission electron micrograph (c) [Reproduced from Alberts et al 1994]
Fig 3112 Two types of bond that attach a cell to the extracellular matrix by means of clusters of integrins On the extracellular side integrins bind to the matrix proteins fibronectin and laminin Inside the cell they attach to the cytoskeleton via adaptor proteins to either actin filaments (focal adhesions) or intermediate filaments (hemidesmosomes) [Reproduced from Lodish et al Molecular Cell Biolology 2000]
Non-specific binding
Cells can adhere to their surroundings by either non-specific or receptor-ligand (specific)
bonding Though both mechanisms are likely active in most situations as we will see receptorshy
39
CHAPTER 21 CELL MEMBRANE MECHANICS AND ADHESION copyRD Kamm 4615
ligand bonding is the stronger of the two by a considerable margin and is therefore the most
relevant biologically In situations for which either the receptors or their ligands are not present
however such as might be the case in certain in vitro experiments non-specific binding can be
important as well
There are essentially three major forms of non-specific attractions to consider
bull Van der Waals ndash These attractive forces arise due to charge interactions in polar
molecules They tend to dominate among the non-specific mechanisms at
intermediate distances around 20-25 nm [see Boal]
bull Electrostatic ndash These interactions can be either attractive or repulsive depending
on the sign of the surface charges and are particularly important during the
approach of two cells since the glycocalyx has a high negative charge density
bull Steric ndash These forces arise due to the steric exclusion of two molecules as they are
brought into close contact In the case of cell-cell interactions steric repulsion is
due to the compression of the two glycocalyx layers and the tendency to resist
compression resulting from osmotic effects and the elasticity of the layer Steric
forces tend to dominate for small separation distances lt 10 nm
In combination these effects combine to produce a net attractive force per unit area of
about 100 Pa at a separation distance of about 25 nm
Adhesion by means of receptor-ligand binding
We can use the analysis of Chapter xx to estimate the strength of a receptor-ligand bond and
based on typical values for bond density calculate the corresponding strength of adhesion
between two cells or between a cell and a surface Recall that the application of force to a
receptor-ligand bond modifies the dissociation rate constant for the binding reaction This effect
can be modeled in several ways but the result obtained by Bell ((Bell 1978)) suggests the
following exponential form for the dissociation rate
0 ⎛ γf ⎞ 0 ⎛ γσ ⎞ kminus = kminus exp⎜ ⎟ = kminus exp⎜ ⎟ (265)
⎝ kBT ⎠ ⎝ NC kBT ⎠
where k0minus is the unforced dissociation rate constant γ is a factor with the units of length that
corresponds roughly with the distance separating the bonded pair at equilibrium NC is the concentration of bonded complex and σ is the average bond force per unit area To determine
40
CHAPTER 21 CELL MEMBRANE MECHANICS AND ADHESION copyRD Kamm 4615
the rate of change of the concentration of bonded pairs one must solve the following rate equation describing the competition between bond formation (first term) and destruction (second term)
dNC ⎛ γσ ⎞
cong k+ (NR minus NC )(NL ) minus kminus NC = k+ (N minus )( 0R NC NL ) minus kminus NC exp⎜ ⎟ (266)
dt ⎝ NC kBT ⎠
where NR and NL are the concentrations of receptors and ligands respectively and we have
assumed that NCltltNL and that all bonds are stressed equally At equilibrium dNCdt=0 and if
the force applied to detach the cell (equal to the average bond stress σ) is increased
incrementally from zero NC will progressively fall to a new equilibrium value At sufficiently
high levels of force however increasing σ further eventually gives rise to a situation in which equilibrium can no longer be achieved through a reduction in NC At that point NC tends toward zero and the cell separates from the surface to which it was attached It can be shown that this
occurs when (Bell 1978)
k 0
α c exp(α + c + 1) = N
k 0 L (267)minus
σ
where α minγ c equiv and σmin is the minimum stress needed to cause detachment For a wide
NRkBT
range of conditions eqn (267) has the approximate solution
⎛ k0 + ⎞
α c cong 07 ln L (268)⎜ 0 N ⎟⎝ kminus ⎠
so that the critical stress for detachment can be expressed as
N 0
σ cong 07 C kBT ⎛ k ⎞ ln⎜
+ min N ⎟ (269)
γ ⎝ k0 L minus ⎠
where NC is determined from setting eqn (266) to zero under these critical conditions
Thermodynamic approach to cell adhesion
Although we focus here on the mechanical aspects of cell adhesion this process can also be
viewed from a thermodynamic perspective In this approach adhesion is considered in terms of
the change in energy specifically the Gibbs free energy G associated with all the individual
receptor-ligand interactions as well as the various non-specific forces of attraction or repulsion
The adhesion of a cell to a given surface then can be viewed as an equilibrium state determined
41
CHAPTER 21 CELL MEMBRANE MECHANICS AND ADHESION copyRD Kamm 4615
by minimization of the free energy If in undergoing a transition from a free state to an adherent
state the system represented by the cell and surface experiences a reduction in free energy ie
ΔGlt0 then adhesion will occur and the equilibrium state of adhesion will be determined by that with the minimum in free energy or the largest value of -ΔG While this approach ignores
many of the subtleties of the interactions and like the analysis above assumes that all receptorshy
ligand interactions are identical from an energetic point of view it is useful in providing some
simple insights as seen in the next two examples
Example Comparison of specific and non-specific adhesive forces Non-specific bonding due
to the combined effects of van der Waals electrostatic and steric forces result in an attractive
stress of approximately 100 Pa Receptor-ligand bonding give rise to forces that can be
estimated from the change in free energy f ~ to 4x10⁻⁴ dynbond = 9x10-11 to 4x10⁻⁹ ΔGr~9x10⁻⁶ Nbond where f is the force required to break the bond and r is a measure of the distance the bond stretches before it breaks Using a typical density of the receptor-ligand complex NC of ~1012-1015 bondsm2 gives a total bond stress of N 1
C x f ~ 9 x 10 to 4x10⁶ Pa The above kinetic approach to estimating bond strength [eqn (269)] gives a value approximately half of that from this equilibrium approach In either case however the conclusion remains the same non-specific binding can under certain circumstances be important since it is comparable to the lowest estimates of receptor-ligand-mediated bond strength but not surprisingly the latter is quite likely to dominate in nearly all practical situations
Example JKR theory for the equilibrium area of adhesion between a cell and substrate
It is well known that cells tend to take on a more flattened shape as the substrate to which they
are attached becomes more strongly adhesive either by coating with a more attractive ligand or
by increasing the concentration of ligand bound to the substrate Conversely less adhesive cells
round up and become more spherical These observations can be explained with the help of a
simple scaling analysis on the assumptions of small deformation of a linear elastic cell
Let the cell be modeled as a homogeneous elastic sphere with elastic modulus E and
initial radius R (Fig 3113) It is then brought into contact with a surface to which it adheres
As the cell adheres it attains a lower energy state characterized by an adhesion energy per unit
area J Formation of a flat adhesion surface however requires deformation within the elastic
cell and an associated increase in the stored elastic energy In Chapter 31 we showed that the
stored elastic energy per unit volume can be written
UE asymp int τεdV asymp int 1 2 Eε 2dV (270)
Vc Vc
42
CHAPTER 21 CELL MEMBRANE MECHANICS AND ADHESION copyRD Kamm 4615
Strain inside the cell can be approximated as the displacement of the cell surface δ divided by the characteristic distance within the cell to which the deformations penetrate a distance that scales with the lateral extent of the contact region 2a so that ε prop δ a where it can easily be shown from the geometry that a 2 asymp 2δR so that ε prop δ R Combining and dropping all numerical constants we obtain the following scaling approximation
δUE prop E ( )δR
3 2 (271)R
An expression for the total energy of the system then can be written
U prop minusJa2 + Eε2a3 prop JδR + Eδ 5 2R1 2 (272) The equilibrium state corresponds to the value of δ having the minimum energy obtain from
partU prop minusJR + Eδ 3 2R1 2 (273)
partδ so that
23 1 3 ⎛ JR12 ⎞ ⎛ JR2 ⎞
δ prop ⎜ ⎟ and a prop ⎜ ⎟ (274)⎝ E ⎠ ⎝ E ⎠
The exact solution to this problem yields the result
⎡ ) 1 3 2 1( minusν 2 ⎤ 9πJR
a = ⎢ ⎥ (275)⎢ 2E ⎥⎣ ⎦
43
CHAPTER 21 CELL MEMBRANE MECHANICS AND ADHESION copyRD Kamm 4615
Elastic modulus E adhesion energy per unit area J
2a
Fig 3113 Experiments to determine the contact area of an iminobiotin functionalized agarosebead on a glass coverslip in water Top Schematic of adherent bead Bottom Results for a range of bead radii Solid line is a fit to the date which obeys the power law a prop R23 consistent with the prediction of JKR theory eqn(276) [Reproduced from (Moy Jiao et al 1999)] This can be compared to the result obtained from a more rigorous analysis
⎡9πJR 2(1minus ν 2 ) 13 ⎤
a = ⎢ ⎥ (276)2E⎢ ⎣ ⎥⎦
and to experimental data obtained from spherical beads made from a 4 agarose gel (Fig 3113)
Models for receptor-mediated adhesion
In Chapter x and in the preceding text we discussed the energetics of bond formation and release
as well as the effect of applied force in altering the energy landscape of the bonded pair and
thereby the rate constants for bond kinetics That analysis has obvious implications to the
44
CHAPTER 21 CELL MEMBRANE MECHANICS AND ADHESION copyRD Kamm 4615
adhesion of cells to substrates the surrounding extracellular matrix and other cells Here we
extend that analysis in the specific case of whole cell adhesion In doing so it will be important
to consider such factors as the distribution type and density of receptor-ligand bonds or
potential bonds and the elastic properties of the structures to which they are anchored On the
intracellular side this involves the series of couplings that link the receptor to the cell In the
simplest case this might simply be a link to the lipid bilayer if the receptor has no intracellular
connections More typically especially for couplings with a structural role it involves a series
of proteins ultimately linking the receptor to the cytoskeleton
The typical setting in vivo is one in which cells adhere to other cells or to the extracellular
matrix Adhesions are more easily probed however through in vitro experiments (described
below) where cell adhesion more often occurs to an artificial substrate mediated through one of
several extracellular proteins that are used to coat the surface Generally either collagen or
fibronectin is used Cells are often adhered to these substrates but to produce a more controlled
environment rigid beads are sometimes coated with the appropriate receptors so that one specific
receptor-ligand interaction can be probed While these systems are useful as models of certain
adhesion phenomena it is important to recognize in the interpretation of these experiments that
when bound to a rigid substrate or bead the binding proteins cannot freely diffuse as they would
in a more natural environment In particular the formation of focal adhesions would not occur in
bead-substrate experiments because the receptors would be constrained from aggregating
It is instructive to begin this discussion with a consideration of a single adhesion bond
for example one linking the actin matrix of the cytoskeleton to a β1 integrin and the integrin
receptor binding to the extracellular matrix beyond the cell membrane (Fig 3114) If the bond
is stressed as for example if the cell experiences a force relative to the ECM it will at first
stretch an amount dictated by the level of force in the bond and the stiffness of the complex
Each bond as well as each protein in the bond complex can be thought of as having a certain
stiffness giving rise to a picture in which several springs are considered connected in series
Forces acting on the adhesion complex are transmitted via this series of bonded proteins between
the CSK and the ECM producing local deformations and stresses in the corresponding matrices
that decay with distance from the adhesion site On the intracellular side these forces are
transmitted via a complex involving vinculin α-actinin paxillin and talin Attachment to the
extracellular matrix is mediated by an RGD sequence (in fibronectin for example) which in turn
has binding sites for collagen and fibrin If the force is sufficiently strong above a certain
threshold value F0 say and applied for a sufficiently long time the bond might be severed (deshy
couple) Typical values of this threshold force lie in the range of 10-100 pN (Evans and Ritchie
1997) but depend as well on the rate at which the force is increased Under more rapid
forcings the threshold is high compared to when the force is increased slowly This simply
45
CHAPTER 21 CELL MEMBRANE MECHANICS AND ADHESION copyRD Kamm 4615
reflects the fact that detachment is a stochastic process and that at any given level of force there
exists a finite probability of detachment and this probability increases with time
Fig 3114 One type of attachment linking the intracellular actin matrix to the extracellular matrix via an integrin complex that involves in addition vinculin α-actinin paxillin and talin (Reproduced from Lodish et al Molecular Cell Biolology 2000)
We need also to consider that in equilibrium a fraction Φ = K(1+K)-1 (where K is the
equilibrium constant) of the receptors will be bound at any given time and that the receptorshy
ligand complexes are continually cycling between the bound and unbound states characterized
by their respective rate constants
On a larger scale numerous adhesion sites typically act in parallel each contributing
some amount to the total adhesion force If the force transmitted by each single adhesion
complex is F and the density of adhesion sites (per unit membrane area) is NC then the stress
acting on the cell is the product F NC This gives a somewhat false impression however as it is
unlikely that each adhesion complex carries an equal force Put another way there exists a local
stress τ that can be thought of as the product of the average force per bond times the bond
density This stress is typically non-uniform In the adhesion of a cell to a flat substrate the
bonds near the periphery of the contact zone determine the strength of the cell against
detachment and when the cell is subjected to a detaching force the stresses are concentrated in
46
CHAPTER 21 CELL MEMBRANE MECHANICS AND ADHESION copyRD Kamm 4615
this peripheral region as depicted in Fig 3115 In the vicinity of the edge of adhesion several
factors will influence the stress distribution including the mechanical properties of the membrane
(in particular the bending stiffness KB) the receptor density the spring constants of the bond
and the bond strength
N
Region of adhesion
x1
Fig 3115 Schematic model of a cell membrane being detached from a substrate by application of a tension force N The membrane is free to the left of the dash-dot line and adherent to the right Forces and moments are transmitted through the membrane which adheres to the membrane through receptor-ligand bonds represented by a continuous distrubution p(x1)
To illustrate consider the following simple model for an adherent cell being peeled away
from its substrate by a force that generates a tension N in the membrane (Fig 3115)
Deformations in the membrane are described by eqn (223) where it can be shown that the
bending term dominates provided KbL2 gtN where L is the characteristic length in the x1 direction
(due to the small length scales involved) and the external membrane force (p in the membrane
equation) is now the non-uniform stress due to adhesion bonds As a simple first approximation
we take p = k(δminusδ0) with δ-δ0 being the amount of stretch in the receptor-ligand bond springs
and k an effective bond spring constant Recognizing that p approaches zero far from the edge
(see Fig 319) the membrane displacement and the spring displacement are related u3 = δ-δ0
Thus eqn (228) is written
⎛ part 4 u
KB⎜ 3
⎞ 4 ⎟ = NC F = NC ku
⎝ partx ⎠ 3 (277)1
This can be solved directly showing that the distance of separation between the cell membrane
and substrate grows in an exponential fashion with distance Even more simply a scaling
47
CHAPTER 21 CELL MEMBRANE MECHANICS AND ADHESION copyRD Kamm 4615
analysis of eqn (277) in which the term on the left is approximated by Kbu3w4 where w is the
characteristic distance over which u3 varies tells us that the stresses are concentrated in a region
of width
K
w prop B4 (278)
NC k
near the cell periphery Similarly we can estimate that the cell membrane will detach from the
substrate if N gt FoNCw where F0 is a measure of the force in a single bond at the time of bond
rupture and that the rate of peeling can be roughly approximated as the product of the
disassociation rate k -- (bondss) from eqn (265) and the distance between bonds (N -12C )
Although this provides some insight into how the peeling rate depends on the various factors it fails to capture the fact that the cell remains in an equilibrium attached state even for non-zero levels of tension reflecting that even under force a balance can exist between the rates of formation and rupture of receptor-ligand complexes (Ra Picart et al 1999)
It is also of interest to note that in the region near the edge of the attachment zone(x1=0
in Fig 3115) the membrane acts as a beam subjected to a moment due to the applied tension
This moment is balanced by a force couple due to tension in the adhesion complexes right
adjacent to the edge in combination with a compressive stress between the cell and substrate a
little further in In typical situations this compressive stress can approach levels as high as one
atmosphere and can act to effectively smooth the membrane and recruit new attachment sights While using these continuum descriptions it is important to keep in mind the true
discrete nature of the individual bonds represented in the model as a continuous adhesive
surface This is brought to light by a simple calculation in which the characteristic length over
which the applied tension is supported w is compared to the inter-receptor spacing N -12C
Using typical values for the parameters NC = 103 complexesμm-2 k = 10-5 to 10-6 Nm Kb = 1 to 2x10-18 Nm we find that w cong 01 to 03 μm and the inter-complex spacing N minus1 2
C cong 003 μm While it is reassuring to see that w is typically less than the inter-complex spacing the difference is small It is therefore not surprising that the actual process of cell peeling is stochastic in nature occurring in a sequence of more-or-less discrete steps with a velocity of peeling that varies widely from the mean
The interplay between receptor-ligand bonding and membrane stiffness also determines whether a cell will spread over a surface or peel away from it under a given tension Membrane bending stiffness acts to maintain the membrane and substrate within close proximity near the edge of contact (Fig 3115) Spreading can occur only if their separation distance is within the extended length of the receptor ligand bond over a distance comparable to the linear spacing
48
CHAPTER 21 CELL MEMBRANE MECHANICS AND ADHESION copyRD Kamm 4615
between neighboring bonds ( N minus1 2 C ) Under high tension the surfaces rapidly diverge and
spreading is prevented if the tension is sufficiently low receptor-ligand bonding can occur and spreading can occur
Measurements of adhesion
A variety of methods have been used to experimentally determine the strength of adhesion either
of individual receptor-ligand bonds or populations of bonds as in the case of entire cells
Whole cell experiments are more common and typically require less experimental
sophistication The drawback of course is that they provide only for estimates of average
properties and require certain assumptions regarding the distribution of cell-substrate adhesive
stress for interpretation to the level of a single bond Several of these methods are described
next
Centrifugal cell adhesion assays In this experiment cells are allowed to attached to a substrate
then are placed in a centrifuge rotating at speed ω positioned a distance r from the center of
rotation and oriented so that the net centrifugal force is acting to separate the cell from the
substrate Using the arrangement shown in Fig 3116 (right) the acceleration of the cells is 2ω r and the net force acting on a cell of volume Vc is F = (ρc minus ρf )ω 2rVc where the fluid and cell densities are ρf and ρc respectively
Interpreting these results we can make several different assumptions each leading to a different estimate for the maximum force experienced by the binding complex If we simply assume that all receptor-ligand complexes support an equal fraction of the total force F then the force per bond is f = F (πa 2NC ) where NC is the concentration of bond complexes However as the cell tears away from the substrate the edge bonds will break first since these experience the greatest level of force An alternative approach then is to assume that the adhesion complexes around the cell circumference support the entire load leading to the estimate f = F 2( πaN 1 2 ) recognizing that N1 2
C C is the average distance between bonds A somewhatmore accurate value for f might be obtained if we assume that all complexes within the distance w given by eqn (278) support the load In any of these cases once the centrifugal force exceeds some critical limit since the number of receptors supporting the load falls as the region of contact becomes smaller the force per bond increases and the cell will rapidly detach
Stochastic variability also needs to be taken into account however since even under a constant load any single bond has a finite probability of failure under a given level of force The equilibrium state of the cell then should be viewed as one in which the rate of bond formation equals the rate of bond breakage with increasing force having the effect of reducing the
49
CHAPTER 21 CELL MEMBRANE MECHANICS AND ADHESION copyRD Kamm 4615
probability that the bond will remain intact These effects can be addressed using the methods described in more detail in Chapter xx Parallel flow assay Another common method for assessing cell adhesion is to plate the cells onto one wall of a parallel flow chamber subject them to a fluid dynamic shear stress and observe at what flow rate the cells begin to release If we ignore flow details in the immediate vicinity of the cell the shear stress can be estimated from the solution for a fully developed (Poiseuille) velocity profile
3V ⎡ y2
⎛ ⎞ ⎤v(y) = ⎢1minus ⎥ (279)
2 ⎝ ⎠ ⎣ ⎢ h ⎥⎦
so that the shear stress acting on the cell is
⎛ dv ⎞ 6μV τw = μ⎜ ⎟ = (280)
⎝ dy ⎠ h y = minush
and the total force can be estimated as F asymp τw Ac where Ac is the surface area of the cell membrane exposed to the flow Consider as an example a flow of culture medium at a rate of 1 mls through a channel of height 01 cm and width 1 cm If the culture medium has a viscosity close to that of water (μ=001 dyns) the shear stress is obtained from eqn (280)
6 sdot (001dyn sdot s) sdot (1ml s) ( 01 sdot10cm2 )τ dyn cm 2w = = 6 = 06Pa
01cm This corresponds roughly with the level of shear stress experience by endothelial cells in the arterial system If we consider that the cell has a surface area with dimensions roughly 100 μm x 10 μm or about 103 μm2 then the total force acting on the cell is obtained by integrating the shear stress over the area of the apical membrane Assuming that the shear stress is uniform the force is simply the product of shear stress and surface area or about 1 nN in the present example Again interpretation of results from such experiments requires careful consideration of the distribution of forces among the individual adhesion complexes In this situation the cell is likely to peel from the upstream edge in much the same manner as occurs in the cell peeling experiment discussed earlier
50
CHAPTER 21 CELL MEMBRANE MECHANICS AND ADHESION copyRD Kamm 4615
Radial flow and spinning disk assays One disadvantage of the parallel flow assay is that all cells are subjected to essentially the same level of shear stress so the flow rate needs to be incrementally varied in order to determine the level of force required for detachment These two systems using an axisymmetric geometry circumvent this problem by producing an easily characterized radial variation in shear stress In the case of the radial flow assay fluid enters through a central channel and flows radially outward through the narrow gap between two circular plates From conservation of mass the mean flow velocity is given by
QV = (281)
2πrh and sufficiently far from the center (rgtgth) the velocity profile is parabolic as in the parallel flow assay and the shear stress is again governed by eqn (280) using (281) for V Q
ω
(Not to scale)
v
h h
Cell layer rc Ce l l layer rc
r r
Fig 3116 Schematic diagram showing the radial flow assay (left) and the spinning disk assay (right) In the radial flow assay shear stress attains a maximum value near the center and falls with increasing radius r whereas in the spinning disk system maximum shear stress is experienced at large r In the spinning disk assay cells are grown on one disk and the opposite disk is rotated at constant speed Provided the rate of rotation is sufficiently small that inertial effects can be neglected the velocity is purely in the circumferential direction and the profile is linear between the two plates so that the shear stress experienced by the cells can easily be computed as
ωr τw = μ (282)
h
51
CHAPTER 21 CELL MEMBRANE MECHANICS AND ADHESION copyRD Kamm 4615
In both of these cases as in the parallel flow assay the total force is obtained by integrating the shear stress over the cell surface and the distribution of force among the adhesion complexes is weighted toward those located near the upstream end of the cell This can also be seen by consideration of the torque exerted by shear stress on the cell that must be balanced by a nonshyuniform contact stress with the substrate that is greatest near the upstream end Single bond adhesion assays Two other assays provide a means of obtaining estimates for the strength of a single adhesion bond without the need for excessive interpretation These rely on an ability to isolate a small number of bonds or even a single bond and infer bond strength from the step-wise nature of the de-adhesion process associated with breakage of discrete bonds One of these methods employs the atomic force microscope coated with the ligand of an adhesion receptor as shown in Fig 3117 The probe tip is gradually brought up to the cell surface until one or more receptor-ligand bonds are formed When the probe tip is withdrawn it moves along a different trajectory on a force-displacement plot reflecting the forces of adhesion These forces are seen to jump between more or less discrete levels as the probe continues to be moved away from the cell with each jump corresponding to the breakage of a single bond (Fig 3117) Using this method the bond strength between integrin receptor and a variety of RGD-containing ligands was found to lie in the range of 30 to 100 pN (Lehenkari and Horton 1999)
Fig 3117 The strength of a single adhesion bond can be measured by bringing a functionalized tip of an AFM probe up to the cell allowing bonds to form then slowly withdrawing the probe Monitoring the differences between the force displacement curve between the forward and reverse motions the forces necessary to break a single receptor-ligand bond can be determined [Reproduced from (Lehenkari and Horton 1999)]
52
CHAPTER 21 CELL MEMBRANE MECHANICS AND ADHESION copyRD Kamm 4615
A second method is similar in that the discrete increments in force are monitored as individual receptor-ligand bonds are broken but the forces are measured by means of changes in the shape of a giant vesicle the membrane of which contains the ligands have been inserted In this case one vesicle is made effectively rigid due for example to a high surface tension A second vesicle containing the adhesion molecules is also drawn partially into a micropipet but is much more complaint than the first The two vesicles are then brought into point contact so that one or a small number of adhesions are formed As the pipets are moved apart the compliant vesicle distorts due to the force of adhesion which it can be shown is related to the change in dimension of the vesicle in the direction of the force thereby serving as a sensitive force transducer measuring forces in the range of single adhesion receptors or between 1 and 100 pN [Evans 1991 37]
(For specific examples of leukocyte rolling and attachment see Orsello or Chang amp Hammer)
[This process is initiated for example by local infection that causes the release of
chemotactic agents in addition to cytokines hellip
Models of this process draw upon many of the concepts discussed in this chapter ]
Transient cell adhesion
Concepts of transient adhesion and release are of particular importance in the case of leukocyte
rolling adhesion and transmigration across the endothelial layer of a blood vessel In addition
cell migration through extracellular matrix or along a substrate requires the ability of the cell to
both form and release adhesions
One problem that has received considerable attention is the interaction between an
adherent or rolling leukocyte and the adhesion receptors on the endothelium These studies are
complicated by the three-dimensional nature of the flow the compliance of the interacting
surfaces and receptor-ligand dynamics In a series of recent studies Hammer and co-workers
(Chang Tees et al 2000) have addressed several of these issues computing the viscous force
and torque acting upon a sphere near to planar wall from the mobility matrix (Hammer and Apte
1992) and using the ldquoBell modelrdquo of receptor binding (Bell 1978) but neglecting the effects of
cell deformation The Bell model relates the dissociation rate constant kr to the force in the
bond f the thermal energy kBT and a parameter with units of length that depends on the
reactivity of the molecule
kr = ko r exp(γf kBT ) (283)
53
CHAPTER 21 CELL MEMBRANE MECHANICS AND ADHESION copyRD Kamm 4615
A Monte Carlo method is employed at each time step in the calculation to determine bond
formation or breakage In these studies the nature of the leukocyte-endothelial interaction is
characterized as firm adhesion rolling adhesion bimodal adhesion or no adhesion and mapped
as a function of the two parameters of the Bell model in Fig 3 The boundaries of the rolling
adhesion regime are identified for a wall shear rate of 100 s-1 (dotted lines) or 30 and 400 s-1
(solid lines) Most literature values for the Bell model parameters for a variety of selectin
receptors (known to be instrumental in leukocyte rolling) correspond to the rolling adhesion
regime for typical shear rate of 100 s-1 An interesting but counterintuitive result from this study
was the observation that as the bond stiffness was increased from the value used in most
calculations (100 dyne cm-1) adhesiveness decreased which the authors attribute to reduced
deflection for a given level of force leading subsequently to more rapid dissociation
Fig 3118 The state diagram for a leukocyte interacting with an endothelial surface for shear rates ranging from 30 to 400 s-1 For low dissociation rates the leukocyte remains adherent to the surface (lower left) As either (γ) or ( ko
r ) [see Eqn (283) for definitions] is increased the cell first adheres firmly then rolls along the wall then completely detaches (upper right) Rolling adhesion is defined as the regime where rolling occurs over some part of the shear rate range between 30 and 400 s-1 Firm adhesion indicates that cells remain attached even at the highest shear rate no adhesion indicates that cells roll at a velocity gt 50 of the velocity of a non-adherent sphere In the bimodal regime cells are either adherent or non-adherent and do not exhibit rolling Dotted curves correspond to these same boundaries for a shear rate of 100 s-1 Reproduced from Chang et al (2000)
54
CHAPTER 21 CELL MEMBRANE MECHANICS AND ADHESION copyRD Kamm 4615
In another recent study using high-resolution video-microscopy (Schmidtke and Diamond
2000) it was demonstrated that a flowing neutrophil can attach to an adherent platelet via
adhesion molecules located in the tips of the microvilli and form long tethers averaging nearly 10
μm in length but ranging up to 40 μm at extensional rates of 6-40 μm s-1 for shear rates ranging
from 100-250 s-1 The mechanics of tether formation is itself a fascinating topic that is still under
intense investigation Readers interested in pursuing this work in more detail are referred to the
several papers (Hochmuth Shao et al 1996 Dai and Sheetz 1998 Dai and Sheetz 1999) that
identify a number of intriguing phenomena
55
CHAPTER 21 CELL MEMBRANE MECHANICS AND ADHESION copyRD Kamm 4615
317 Nomenclature Parameter Definition Units
R - receptor
L - ligand
C - receptor-ligand complex
G - Gibbs free energy Nm
N - membrane tension Nm
NR - total receptor density -3μm-2 in 2D or μm in 3D NL - total ligand density μm-2 in 2D or μm-3 in 3D N in 2D or μm-3μm-2
C - complex density in 3D NRf - free receptor density m-2 in 2D or m-3μ μ in 3D NLf - free ligand density -2 -3μm in 2D or μm in 3D d+ - forward diffusional rate constant 2 -1μm s-1 in 2D or 3 μm s in 3D d -1
- - reverse diffusional rate constant s r+ - forward reaction rate constant s-1
r- - reverse reaction rate constant s-1 D 2 -1
m - membrane diffusion coefficient μm s D - solution diffusion coefficient m2 s -1s μ Kb - bending stiffness Nm K 0 - equilibrium constant or affinity (zero force) M-1 in 3D and 2μm in 2D = k0
+ k0 minus
K - equilibrium constant M-1 in 3D and m2μ in 2D = k+kshy
k0 - association rate constant (zero force) M-1 s-1 in 3D or m-2 -1+ μ s in 2D
k0 - dissociation rate constant (zero force) s-1 minus
k - association rate constant M-1 s-1 in 3D or m-2 -1+ μ s in 2D
kminus - dissociation rate constant s-1 f - force per bond N F - total adhesion force N γ - empirical parameter μm r0 - distance over which energy minimum acts μm E0 - bond energy J k JK-1
B - Boltzmanns constant T - temperature K τ - bond lifetime s
56
CHAPTER 21 CELL MEMBRANE MECHANICS AND ADHESION copyRD Kamm 4615
τ0 - bond lifetime with zero force s σ - adhesion stress N μm-2 κ - spring constant for receptor-ligand bond N μm-1
57
CHAPTER 21 CELL MEMBRANE MECHANICS AND ADHESION copyRD Kamm 4615
References Bell G I (1978) Models for the specific adhesion of cells to cells Science 200 618-627 Caille N O Thoumine et al (2002) Contribution of the nucleus to the mechanical properties
of endothelial cells J Biomech 35(2) 177-87 Chang K C D F Tees et al (2000) The state diagram for cell adhesion under flow
leukocyte rolling and firm adhesion Proc Natl Acad Sci U S A 97(21) 11262-7 Dai J and M P Sheetz (1998) Cell membrane mechanics Methods Cell Biol 55 157-71 Dai J and M P Sheetz (1999) Membrane tether formation from blebbing cells Biophys J
77(6) 3363-70 Daily Elson et al (1984) Determination of the elastic area compressibility modulus of the
erythrocyte membrane Biophys J 45(4) 671-682 Evans E and K Ritchie (1997) Dynamic strength of molecular adhesion bonds Biophys J
72(4) 1541-55 Evans E A (1983) Bending elastic modulus of red blood cell membrane derived from
buckling instability in micropipet aspiration tests Biophys J 43(1) 27-30 Hammer D A and S M Apte (1992) Simulation of cell rolling and adhesion on surfaces in
shear flow general results and analysis of selectin-mediated neutrophil adhesion Biophys J 63(1) 35-57
Hardt S L (1979) Rates of diffusion controlled reactions in one two and three dimensions Biophysical Chemistry 10 239-243
Hochmuth F M J Y Shao et al (1996) Deformation and flow of membrane into tethers extracted from neuronal growth cones Biophys J 70(1) 358-69
Kucik D F E L Elson et al (1999) Weak dependence of mobility of membrane protein aggregates on aggregate size supports a viscous model of retardation of diffusion Biophys J 76(1 Pt 1) 314-22
Kusumi A Y Sako et al (1993) Confined lateral diffusion of membrane receptors as studied by single particle tracking (nanovid microscopy) Effects of calcium-induced differentiation in cultured epithelial cells Biophys J 65(5) 2021-40
Lehenkari P P and M A Horton (1999) Single integrin molecule adhesion forces in intact cells measured by atomic force microscopy Biochem Biophys Res Commun 259(3) 645-50
McCloskey M and M M Poo (1984) Protein diffusion in cell membranes some biological implications Int Rev Cytol 87 19-81
Meleard P Gerbeaud C Bardusco N Mitov MD and Ferdandex-Puente L (1998) Mechanical properties of model membranes studied from shape transformations of giant vesicles Biochimie 80 401-413
Moy V T Y Jiao et al (1999) Adhesion energy of receptor-mediated interaction measured by elastic deformation Biophys J 76(3) 1632-8
Ra H J C Picart et al (1999) Muscle cell peeling from micropatterned collagen direct probing of focal and molecular properties of matrix adhesion J Cell Sci 112 ( Pt 10) 1425-36
Saffman P G (1976) Bownian motion in thin sheets of viscous fluid Journal of Fluid Mechanics 73 593-602
Schmidtke D W and S L Diamond (2000) Direct observation of membrane tethers formed during neutrophil attachment to platelets or P-selectin under physiological flow J Cell Biol 149(3) 719-30
Sheets E D R Simson et al (1995) New insights into membrane dynamics from the analysis of cell surface interactions by physical methods Curr Opin Cell Biol 7(5) 707-14
58
CHAPTER 21 CELL MEMBRANE MECHANICS AND ADHESION copyRD Kamm 4615
Vink H and B R Duling (1996) Identification of distinct luminal domains for macromolecules erythrocytes and leukocytes within mammalian capillaries Circ Res 79(3) 581-9
Waugh R and E A Evans (1979) Thermoelasticity of red blood cell membrane Biophys J 26(1) 115-31
Zeman K H Engelhard et al (1990) Bending undulations and elasticity of the erythrocyte membrane effects of cell shape and membrane organization Eur Biophys J 18(4) 203shy19
Zhelev D V D Needham et al (1994) Role of the membrane cortex in neutrophil deformation in small pipets Biophys J 67(2) 696-705
59
MIT OpenCourseWarehttpocwmitedu
20310J 3053J 6024J 2797J Molecular Cellular and Tissue BiomechanicsSpring 2015
For information about citing these materials or our Terms of Use visit httpocwmiteduterms

CHAPTER 21 CELL MEMBRANE MECHANICS AND ADHESION copyRD Kamm 4615
by minimization of the free energy If in undergoing a transition from a free state to an adherent
state the system represented by the cell and surface experiences a reduction in free energy ie
ΔGlt0 then adhesion will occur and the equilibrium state of adhesion will be determined by that with the minimum in free energy or the largest value of -ΔG While this approach ignores
many of the subtleties of the interactions and like the analysis above assumes that all receptorshy
ligand interactions are identical from an energetic point of view it is useful in providing some
simple insights as seen in the next two examples
Example Comparison of specific and non-specific adhesive forces Non-specific bonding due
to the combined effects of van der Waals electrostatic and steric forces result in an attractive
stress of approximately 100 Pa Receptor-ligand bonding give rise to forces that can be
estimated from the change in free energy f ~ to 4x10⁻⁴ dynbond = 9x10-11 to 4x10⁻⁹ ΔGr~9x10⁻⁶ Nbond where f is the force required to break the bond and r is a measure of the distance the bond stretches before it breaks Using a typical density of the receptor-ligand complex NC of ~1012-1015 bondsm2 gives a total bond stress of N 1
C x f ~ 9 x 10 to 4x10⁶ Pa The above kinetic approach to estimating bond strength [eqn (269)] gives a value approximately half of that from this equilibrium approach In either case however the conclusion remains the same non-specific binding can under certain circumstances be important since it is comparable to the lowest estimates of receptor-ligand-mediated bond strength but not surprisingly the latter is quite likely to dominate in nearly all practical situations
Example JKR theory for the equilibrium area of adhesion between a cell and substrate
It is well known that cells tend to take on a more flattened shape as the substrate to which they
are attached becomes more strongly adhesive either by coating with a more attractive ligand or
by increasing the concentration of ligand bound to the substrate Conversely less adhesive cells
round up and become more spherical These observations can be explained with the help of a
simple scaling analysis on the assumptions of small deformation of a linear elastic cell
Let the cell be modeled as a homogeneous elastic sphere with elastic modulus E and
initial radius R (Fig 3113) It is then brought into contact with a surface to which it adheres
As the cell adheres it attains a lower energy state characterized by an adhesion energy per unit
area J Formation of a flat adhesion surface however requires deformation within the elastic
cell and an associated increase in the stored elastic energy In Chapter 31 we showed that the
stored elastic energy per unit volume can be written
UE asymp int τεdV asymp int 1 2 Eε 2dV (270)
Vc Vc
42
CHAPTER 21 CELL MEMBRANE MECHANICS AND ADHESION copyRD Kamm 4615
Strain inside the cell can be approximated as the displacement of the cell surface δ divided by the characteristic distance within the cell to which the deformations penetrate a distance that scales with the lateral extent of the contact region 2a so that ε prop δ a where it can easily be shown from the geometry that a 2 asymp 2δR so that ε prop δ R Combining and dropping all numerical constants we obtain the following scaling approximation
δUE prop E ( )δR
3 2 (271)R
An expression for the total energy of the system then can be written
U prop minusJa2 + Eε2a3 prop JδR + Eδ 5 2R1 2 (272) The equilibrium state corresponds to the value of δ having the minimum energy obtain from
partU prop minusJR + Eδ 3 2R1 2 (273)
partδ so that
23 1 3 ⎛ JR12 ⎞ ⎛ JR2 ⎞
δ prop ⎜ ⎟ and a prop ⎜ ⎟ (274)⎝ E ⎠ ⎝ E ⎠
The exact solution to this problem yields the result
⎡ ) 1 3 2 1( minusν 2 ⎤ 9πJR
a = ⎢ ⎥ (275)⎢ 2E ⎥⎣ ⎦
43
CHAPTER 21 CELL MEMBRANE MECHANICS AND ADHESION copyRD Kamm 4615
Elastic modulus E adhesion energy per unit area J
2a
Fig 3113 Experiments to determine the contact area of an iminobiotin functionalized agarosebead on a glass coverslip in water Top Schematic of adherent bead Bottom Results for a range of bead radii Solid line is a fit to the date which obeys the power law a prop R23 consistent with the prediction of JKR theory eqn(276) [Reproduced from (Moy Jiao et al 1999)] This can be compared to the result obtained from a more rigorous analysis
⎡9πJR 2(1minus ν 2 ) 13 ⎤
a = ⎢ ⎥ (276)2E⎢ ⎣ ⎥⎦
and to experimental data obtained from spherical beads made from a 4 agarose gel (Fig 3113)
Models for receptor-mediated adhesion
In Chapter x and in the preceding text we discussed the energetics of bond formation and release
as well as the effect of applied force in altering the energy landscape of the bonded pair and
thereby the rate constants for bond kinetics That analysis has obvious implications to the
44
CHAPTER 21 CELL MEMBRANE MECHANICS AND ADHESION copyRD Kamm 4615
adhesion of cells to substrates the surrounding extracellular matrix and other cells Here we
extend that analysis in the specific case of whole cell adhesion In doing so it will be important
to consider such factors as the distribution type and density of receptor-ligand bonds or
potential bonds and the elastic properties of the structures to which they are anchored On the
intracellular side this involves the series of couplings that link the receptor to the cell In the
simplest case this might simply be a link to the lipid bilayer if the receptor has no intracellular
connections More typically especially for couplings with a structural role it involves a series
of proteins ultimately linking the receptor to the cytoskeleton
The typical setting in vivo is one in which cells adhere to other cells or to the extracellular
matrix Adhesions are more easily probed however through in vitro experiments (described
below) where cell adhesion more often occurs to an artificial substrate mediated through one of
several extracellular proteins that are used to coat the surface Generally either collagen or
fibronectin is used Cells are often adhered to these substrates but to produce a more controlled
environment rigid beads are sometimes coated with the appropriate receptors so that one specific
receptor-ligand interaction can be probed While these systems are useful as models of certain
adhesion phenomena it is important to recognize in the interpretation of these experiments that
when bound to a rigid substrate or bead the binding proteins cannot freely diffuse as they would
in a more natural environment In particular the formation of focal adhesions would not occur in
bead-substrate experiments because the receptors would be constrained from aggregating
It is instructive to begin this discussion with a consideration of a single adhesion bond
for example one linking the actin matrix of the cytoskeleton to a β1 integrin and the integrin
receptor binding to the extracellular matrix beyond the cell membrane (Fig 3114) If the bond
is stressed as for example if the cell experiences a force relative to the ECM it will at first
stretch an amount dictated by the level of force in the bond and the stiffness of the complex
Each bond as well as each protein in the bond complex can be thought of as having a certain
stiffness giving rise to a picture in which several springs are considered connected in series
Forces acting on the adhesion complex are transmitted via this series of bonded proteins between
the CSK and the ECM producing local deformations and stresses in the corresponding matrices
that decay with distance from the adhesion site On the intracellular side these forces are
transmitted via a complex involving vinculin α-actinin paxillin and talin Attachment to the
extracellular matrix is mediated by an RGD sequence (in fibronectin for example) which in turn
has binding sites for collagen and fibrin If the force is sufficiently strong above a certain
threshold value F0 say and applied for a sufficiently long time the bond might be severed (deshy
couple) Typical values of this threshold force lie in the range of 10-100 pN (Evans and Ritchie
1997) but depend as well on the rate at which the force is increased Under more rapid
forcings the threshold is high compared to when the force is increased slowly This simply
45
CHAPTER 21 CELL MEMBRANE MECHANICS AND ADHESION copyRD Kamm 4615
reflects the fact that detachment is a stochastic process and that at any given level of force there
exists a finite probability of detachment and this probability increases with time
Fig 3114 One type of attachment linking the intracellular actin matrix to the extracellular matrix via an integrin complex that involves in addition vinculin α-actinin paxillin and talin (Reproduced from Lodish et al Molecular Cell Biolology 2000)
We need also to consider that in equilibrium a fraction Φ = K(1+K)-1 (where K is the
equilibrium constant) of the receptors will be bound at any given time and that the receptorshy
ligand complexes are continually cycling between the bound and unbound states characterized
by their respective rate constants
On a larger scale numerous adhesion sites typically act in parallel each contributing
some amount to the total adhesion force If the force transmitted by each single adhesion
complex is F and the density of adhesion sites (per unit membrane area) is NC then the stress
acting on the cell is the product F NC This gives a somewhat false impression however as it is
unlikely that each adhesion complex carries an equal force Put another way there exists a local
stress τ that can be thought of as the product of the average force per bond times the bond
density This stress is typically non-uniform In the adhesion of a cell to a flat substrate the
bonds near the periphery of the contact zone determine the strength of the cell against
detachment and when the cell is subjected to a detaching force the stresses are concentrated in
46
CHAPTER 21 CELL MEMBRANE MECHANICS AND ADHESION copyRD Kamm 4615
this peripheral region as depicted in Fig 3115 In the vicinity of the edge of adhesion several
factors will influence the stress distribution including the mechanical properties of the membrane
(in particular the bending stiffness KB) the receptor density the spring constants of the bond
and the bond strength
N
Region of adhesion
x1
Fig 3115 Schematic model of a cell membrane being detached from a substrate by application of a tension force N The membrane is free to the left of the dash-dot line and adherent to the right Forces and moments are transmitted through the membrane which adheres to the membrane through receptor-ligand bonds represented by a continuous distrubution p(x1)
To illustrate consider the following simple model for an adherent cell being peeled away
from its substrate by a force that generates a tension N in the membrane (Fig 3115)
Deformations in the membrane are described by eqn (223) where it can be shown that the
bending term dominates provided KbL2 gtN where L is the characteristic length in the x1 direction
(due to the small length scales involved) and the external membrane force (p in the membrane
equation) is now the non-uniform stress due to adhesion bonds As a simple first approximation
we take p = k(δminusδ0) with δ-δ0 being the amount of stretch in the receptor-ligand bond springs
and k an effective bond spring constant Recognizing that p approaches zero far from the edge
(see Fig 319) the membrane displacement and the spring displacement are related u3 = δ-δ0
Thus eqn (228) is written
⎛ part 4 u
KB⎜ 3
⎞ 4 ⎟ = NC F = NC ku
⎝ partx ⎠ 3 (277)1
This can be solved directly showing that the distance of separation between the cell membrane
and substrate grows in an exponential fashion with distance Even more simply a scaling
47
CHAPTER 21 CELL MEMBRANE MECHANICS AND ADHESION copyRD Kamm 4615
analysis of eqn (277) in which the term on the left is approximated by Kbu3w4 where w is the
characteristic distance over which u3 varies tells us that the stresses are concentrated in a region
of width
K
w prop B4 (278)
NC k
near the cell periphery Similarly we can estimate that the cell membrane will detach from the
substrate if N gt FoNCw where F0 is a measure of the force in a single bond at the time of bond
rupture and that the rate of peeling can be roughly approximated as the product of the
disassociation rate k -- (bondss) from eqn (265) and the distance between bonds (N -12C )
Although this provides some insight into how the peeling rate depends on the various factors it fails to capture the fact that the cell remains in an equilibrium attached state even for non-zero levels of tension reflecting that even under force a balance can exist between the rates of formation and rupture of receptor-ligand complexes (Ra Picart et al 1999)
It is also of interest to note that in the region near the edge of the attachment zone(x1=0
in Fig 3115) the membrane acts as a beam subjected to a moment due to the applied tension
This moment is balanced by a force couple due to tension in the adhesion complexes right
adjacent to the edge in combination with a compressive stress between the cell and substrate a
little further in In typical situations this compressive stress can approach levels as high as one
atmosphere and can act to effectively smooth the membrane and recruit new attachment sights While using these continuum descriptions it is important to keep in mind the true
discrete nature of the individual bonds represented in the model as a continuous adhesive
surface This is brought to light by a simple calculation in which the characteristic length over
which the applied tension is supported w is compared to the inter-receptor spacing N -12C
Using typical values for the parameters NC = 103 complexesμm-2 k = 10-5 to 10-6 Nm Kb = 1 to 2x10-18 Nm we find that w cong 01 to 03 μm and the inter-complex spacing N minus1 2
C cong 003 μm While it is reassuring to see that w is typically less than the inter-complex spacing the difference is small It is therefore not surprising that the actual process of cell peeling is stochastic in nature occurring in a sequence of more-or-less discrete steps with a velocity of peeling that varies widely from the mean
The interplay between receptor-ligand bonding and membrane stiffness also determines whether a cell will spread over a surface or peel away from it under a given tension Membrane bending stiffness acts to maintain the membrane and substrate within close proximity near the edge of contact (Fig 3115) Spreading can occur only if their separation distance is within the extended length of the receptor ligand bond over a distance comparable to the linear spacing
48
CHAPTER 21 CELL MEMBRANE MECHANICS AND ADHESION copyRD Kamm 4615
between neighboring bonds ( N minus1 2 C ) Under high tension the surfaces rapidly diverge and
spreading is prevented if the tension is sufficiently low receptor-ligand bonding can occur and spreading can occur
Measurements of adhesion
A variety of methods have been used to experimentally determine the strength of adhesion either
of individual receptor-ligand bonds or populations of bonds as in the case of entire cells
Whole cell experiments are more common and typically require less experimental
sophistication The drawback of course is that they provide only for estimates of average
properties and require certain assumptions regarding the distribution of cell-substrate adhesive
stress for interpretation to the level of a single bond Several of these methods are described
next
Centrifugal cell adhesion assays In this experiment cells are allowed to attached to a substrate
then are placed in a centrifuge rotating at speed ω positioned a distance r from the center of
rotation and oriented so that the net centrifugal force is acting to separate the cell from the
substrate Using the arrangement shown in Fig 3116 (right) the acceleration of the cells is 2ω r and the net force acting on a cell of volume Vc is F = (ρc minus ρf )ω 2rVc where the fluid and cell densities are ρf and ρc respectively
Interpreting these results we can make several different assumptions each leading to a different estimate for the maximum force experienced by the binding complex If we simply assume that all receptor-ligand complexes support an equal fraction of the total force F then the force per bond is f = F (πa 2NC ) where NC is the concentration of bond complexes However as the cell tears away from the substrate the edge bonds will break first since these experience the greatest level of force An alternative approach then is to assume that the adhesion complexes around the cell circumference support the entire load leading to the estimate f = F 2( πaN 1 2 ) recognizing that N1 2
C C is the average distance between bonds A somewhatmore accurate value for f might be obtained if we assume that all complexes within the distance w given by eqn (278) support the load In any of these cases once the centrifugal force exceeds some critical limit since the number of receptors supporting the load falls as the region of contact becomes smaller the force per bond increases and the cell will rapidly detach
Stochastic variability also needs to be taken into account however since even under a constant load any single bond has a finite probability of failure under a given level of force The equilibrium state of the cell then should be viewed as one in which the rate of bond formation equals the rate of bond breakage with increasing force having the effect of reducing the
49
CHAPTER 21 CELL MEMBRANE MECHANICS AND ADHESION copyRD Kamm 4615
probability that the bond will remain intact These effects can be addressed using the methods described in more detail in Chapter xx Parallel flow assay Another common method for assessing cell adhesion is to plate the cells onto one wall of a parallel flow chamber subject them to a fluid dynamic shear stress and observe at what flow rate the cells begin to release If we ignore flow details in the immediate vicinity of the cell the shear stress can be estimated from the solution for a fully developed (Poiseuille) velocity profile
3V ⎡ y2
⎛ ⎞ ⎤v(y) = ⎢1minus ⎥ (279)
2 ⎝ ⎠ ⎣ ⎢ h ⎥⎦
so that the shear stress acting on the cell is
⎛ dv ⎞ 6μV τw = μ⎜ ⎟ = (280)
⎝ dy ⎠ h y = minush
and the total force can be estimated as F asymp τw Ac where Ac is the surface area of the cell membrane exposed to the flow Consider as an example a flow of culture medium at a rate of 1 mls through a channel of height 01 cm and width 1 cm If the culture medium has a viscosity close to that of water (μ=001 dyns) the shear stress is obtained from eqn (280)
6 sdot (001dyn sdot s) sdot (1ml s) ( 01 sdot10cm2 )τ dyn cm 2w = = 6 = 06Pa
01cm This corresponds roughly with the level of shear stress experience by endothelial cells in the arterial system If we consider that the cell has a surface area with dimensions roughly 100 μm x 10 μm or about 103 μm2 then the total force acting on the cell is obtained by integrating the shear stress over the area of the apical membrane Assuming that the shear stress is uniform the force is simply the product of shear stress and surface area or about 1 nN in the present example Again interpretation of results from such experiments requires careful consideration of the distribution of forces among the individual adhesion complexes In this situation the cell is likely to peel from the upstream edge in much the same manner as occurs in the cell peeling experiment discussed earlier
50
CHAPTER 21 CELL MEMBRANE MECHANICS AND ADHESION copyRD Kamm 4615
Radial flow and spinning disk assays One disadvantage of the parallel flow assay is that all cells are subjected to essentially the same level of shear stress so the flow rate needs to be incrementally varied in order to determine the level of force required for detachment These two systems using an axisymmetric geometry circumvent this problem by producing an easily characterized radial variation in shear stress In the case of the radial flow assay fluid enters through a central channel and flows radially outward through the narrow gap between two circular plates From conservation of mass the mean flow velocity is given by
QV = (281)
2πrh and sufficiently far from the center (rgtgth) the velocity profile is parabolic as in the parallel flow assay and the shear stress is again governed by eqn (280) using (281) for V Q
ω
(Not to scale)
v
h h
Cell layer rc Ce l l layer rc
r r
Fig 3116 Schematic diagram showing the radial flow assay (left) and the spinning disk assay (right) In the radial flow assay shear stress attains a maximum value near the center and falls with increasing radius r whereas in the spinning disk system maximum shear stress is experienced at large r In the spinning disk assay cells are grown on one disk and the opposite disk is rotated at constant speed Provided the rate of rotation is sufficiently small that inertial effects can be neglected the velocity is purely in the circumferential direction and the profile is linear between the two plates so that the shear stress experienced by the cells can easily be computed as
ωr τw = μ (282)
h
51
CHAPTER 21 CELL MEMBRANE MECHANICS AND ADHESION copyRD Kamm 4615
In both of these cases as in the parallel flow assay the total force is obtained by integrating the shear stress over the cell surface and the distribution of force among the adhesion complexes is weighted toward those located near the upstream end of the cell This can also be seen by consideration of the torque exerted by shear stress on the cell that must be balanced by a nonshyuniform contact stress with the substrate that is greatest near the upstream end Single bond adhesion assays Two other assays provide a means of obtaining estimates for the strength of a single adhesion bond without the need for excessive interpretation These rely on an ability to isolate a small number of bonds or even a single bond and infer bond strength from the step-wise nature of the de-adhesion process associated with breakage of discrete bonds One of these methods employs the atomic force microscope coated with the ligand of an adhesion receptor as shown in Fig 3117 The probe tip is gradually brought up to the cell surface until one or more receptor-ligand bonds are formed When the probe tip is withdrawn it moves along a different trajectory on a force-displacement plot reflecting the forces of adhesion These forces are seen to jump between more or less discrete levels as the probe continues to be moved away from the cell with each jump corresponding to the breakage of a single bond (Fig 3117) Using this method the bond strength between integrin receptor and a variety of RGD-containing ligands was found to lie in the range of 30 to 100 pN (Lehenkari and Horton 1999)
Fig 3117 The strength of a single adhesion bond can be measured by bringing a functionalized tip of an AFM probe up to the cell allowing bonds to form then slowly withdrawing the probe Monitoring the differences between the force displacement curve between the forward and reverse motions the forces necessary to break a single receptor-ligand bond can be determined [Reproduced from (Lehenkari and Horton 1999)]
52
CHAPTER 21 CELL MEMBRANE MECHANICS AND ADHESION copyRD Kamm 4615
A second method is similar in that the discrete increments in force are monitored as individual receptor-ligand bonds are broken but the forces are measured by means of changes in the shape of a giant vesicle the membrane of which contains the ligands have been inserted In this case one vesicle is made effectively rigid due for example to a high surface tension A second vesicle containing the adhesion molecules is also drawn partially into a micropipet but is much more complaint than the first The two vesicles are then brought into point contact so that one or a small number of adhesions are formed As the pipets are moved apart the compliant vesicle distorts due to the force of adhesion which it can be shown is related to the change in dimension of the vesicle in the direction of the force thereby serving as a sensitive force transducer measuring forces in the range of single adhesion receptors or between 1 and 100 pN [Evans 1991 37]
(For specific examples of leukocyte rolling and attachment see Orsello or Chang amp Hammer)
[This process is initiated for example by local infection that causes the release of
chemotactic agents in addition to cytokines hellip
Models of this process draw upon many of the concepts discussed in this chapter ]
Transient cell adhesion
Concepts of transient adhesion and release are of particular importance in the case of leukocyte
rolling adhesion and transmigration across the endothelial layer of a blood vessel In addition
cell migration through extracellular matrix or along a substrate requires the ability of the cell to
both form and release adhesions
One problem that has received considerable attention is the interaction between an
adherent or rolling leukocyte and the adhesion receptors on the endothelium These studies are
complicated by the three-dimensional nature of the flow the compliance of the interacting
surfaces and receptor-ligand dynamics In a series of recent studies Hammer and co-workers
(Chang Tees et al 2000) have addressed several of these issues computing the viscous force
and torque acting upon a sphere near to planar wall from the mobility matrix (Hammer and Apte
1992) and using the ldquoBell modelrdquo of receptor binding (Bell 1978) but neglecting the effects of
cell deformation The Bell model relates the dissociation rate constant kr to the force in the
bond f the thermal energy kBT and a parameter with units of length that depends on the
reactivity of the molecule
kr = ko r exp(γf kBT ) (283)
53
CHAPTER 21 CELL MEMBRANE MECHANICS AND ADHESION copyRD Kamm 4615
A Monte Carlo method is employed at each time step in the calculation to determine bond
formation or breakage In these studies the nature of the leukocyte-endothelial interaction is
characterized as firm adhesion rolling adhesion bimodal adhesion or no adhesion and mapped
as a function of the two parameters of the Bell model in Fig 3 The boundaries of the rolling
adhesion regime are identified for a wall shear rate of 100 s-1 (dotted lines) or 30 and 400 s-1
(solid lines) Most literature values for the Bell model parameters for a variety of selectin
receptors (known to be instrumental in leukocyte rolling) correspond to the rolling adhesion
regime for typical shear rate of 100 s-1 An interesting but counterintuitive result from this study
was the observation that as the bond stiffness was increased from the value used in most
calculations (100 dyne cm-1) adhesiveness decreased which the authors attribute to reduced
deflection for a given level of force leading subsequently to more rapid dissociation
Fig 3118 The state diagram for a leukocyte interacting with an endothelial surface for shear rates ranging from 30 to 400 s-1 For low dissociation rates the leukocyte remains adherent to the surface (lower left) As either (γ) or ( ko
r ) [see Eqn (283) for definitions] is increased the cell first adheres firmly then rolls along the wall then completely detaches (upper right) Rolling adhesion is defined as the regime where rolling occurs over some part of the shear rate range between 30 and 400 s-1 Firm adhesion indicates that cells remain attached even at the highest shear rate no adhesion indicates that cells roll at a velocity gt 50 of the velocity of a non-adherent sphere In the bimodal regime cells are either adherent or non-adherent and do not exhibit rolling Dotted curves correspond to these same boundaries for a shear rate of 100 s-1 Reproduced from Chang et al (2000)
54
CHAPTER 21 CELL MEMBRANE MECHANICS AND ADHESION copyRD Kamm 4615
In another recent study using high-resolution video-microscopy (Schmidtke and Diamond
2000) it was demonstrated that a flowing neutrophil can attach to an adherent platelet via
adhesion molecules located in the tips of the microvilli and form long tethers averaging nearly 10
μm in length but ranging up to 40 μm at extensional rates of 6-40 μm s-1 for shear rates ranging
from 100-250 s-1 The mechanics of tether formation is itself a fascinating topic that is still under
intense investigation Readers interested in pursuing this work in more detail are referred to the
several papers (Hochmuth Shao et al 1996 Dai and Sheetz 1998 Dai and Sheetz 1999) that
identify a number of intriguing phenomena
55
CHAPTER 21 CELL MEMBRANE MECHANICS AND ADHESION copyRD Kamm 4615
317 Nomenclature Parameter Definition Units
R - receptor
L - ligand
C - receptor-ligand complex
G - Gibbs free energy Nm
N - membrane tension Nm
NR - total receptor density -3μm-2 in 2D or μm in 3D NL - total ligand density μm-2 in 2D or μm-3 in 3D N in 2D or μm-3μm-2
C - complex density in 3D NRf - free receptor density m-2 in 2D or m-3μ μ in 3D NLf - free ligand density -2 -3μm in 2D or μm in 3D d+ - forward diffusional rate constant 2 -1μm s-1 in 2D or 3 μm s in 3D d -1
- - reverse diffusional rate constant s r+ - forward reaction rate constant s-1
r- - reverse reaction rate constant s-1 D 2 -1
m - membrane diffusion coefficient μm s D - solution diffusion coefficient m2 s -1s μ Kb - bending stiffness Nm K 0 - equilibrium constant or affinity (zero force) M-1 in 3D and 2μm in 2D = k0
+ k0 minus
K - equilibrium constant M-1 in 3D and m2μ in 2D = k+kshy
k0 - association rate constant (zero force) M-1 s-1 in 3D or m-2 -1+ μ s in 2D
k0 - dissociation rate constant (zero force) s-1 minus
k - association rate constant M-1 s-1 in 3D or m-2 -1+ μ s in 2D
kminus - dissociation rate constant s-1 f - force per bond N F - total adhesion force N γ - empirical parameter μm r0 - distance over which energy minimum acts μm E0 - bond energy J k JK-1
B - Boltzmanns constant T - temperature K τ - bond lifetime s
56
CHAPTER 21 CELL MEMBRANE MECHANICS AND ADHESION copyRD Kamm 4615
τ0 - bond lifetime with zero force s σ - adhesion stress N μm-2 κ - spring constant for receptor-ligand bond N μm-1
57
CHAPTER 21 CELL MEMBRANE MECHANICS AND ADHESION copyRD Kamm 4615
References Bell G I (1978) Models for the specific adhesion of cells to cells Science 200 618-627 Caille N O Thoumine et al (2002) Contribution of the nucleus to the mechanical properties
of endothelial cells J Biomech 35(2) 177-87 Chang K C D F Tees et al (2000) The state diagram for cell adhesion under flow
leukocyte rolling and firm adhesion Proc Natl Acad Sci U S A 97(21) 11262-7 Dai J and M P Sheetz (1998) Cell membrane mechanics Methods Cell Biol 55 157-71 Dai J and M P Sheetz (1999) Membrane tether formation from blebbing cells Biophys J
77(6) 3363-70 Daily Elson et al (1984) Determination of the elastic area compressibility modulus of the
erythrocyte membrane Biophys J 45(4) 671-682 Evans E and K Ritchie (1997) Dynamic strength of molecular adhesion bonds Biophys J
72(4) 1541-55 Evans E A (1983) Bending elastic modulus of red blood cell membrane derived from
buckling instability in micropipet aspiration tests Biophys J 43(1) 27-30 Hammer D A and S M Apte (1992) Simulation of cell rolling and adhesion on surfaces in
shear flow general results and analysis of selectin-mediated neutrophil adhesion Biophys J 63(1) 35-57
Hardt S L (1979) Rates of diffusion controlled reactions in one two and three dimensions Biophysical Chemistry 10 239-243
Hochmuth F M J Y Shao et al (1996) Deformation and flow of membrane into tethers extracted from neuronal growth cones Biophys J 70(1) 358-69
Kucik D F E L Elson et al (1999) Weak dependence of mobility of membrane protein aggregates on aggregate size supports a viscous model of retardation of diffusion Biophys J 76(1 Pt 1) 314-22
Kusumi A Y Sako et al (1993) Confined lateral diffusion of membrane receptors as studied by single particle tracking (nanovid microscopy) Effects of calcium-induced differentiation in cultured epithelial cells Biophys J 65(5) 2021-40
Lehenkari P P and M A Horton (1999) Single integrin molecule adhesion forces in intact cells measured by atomic force microscopy Biochem Biophys Res Commun 259(3) 645-50
McCloskey M and M M Poo (1984) Protein diffusion in cell membranes some biological implications Int Rev Cytol 87 19-81
Meleard P Gerbeaud C Bardusco N Mitov MD and Ferdandex-Puente L (1998) Mechanical properties of model membranes studied from shape transformations of giant vesicles Biochimie 80 401-413
Moy V T Y Jiao et al (1999) Adhesion energy of receptor-mediated interaction measured by elastic deformation Biophys J 76(3) 1632-8
Ra H J C Picart et al (1999) Muscle cell peeling from micropatterned collagen direct probing of focal and molecular properties of matrix adhesion J Cell Sci 112 ( Pt 10) 1425-36
Saffman P G (1976) Bownian motion in thin sheets of viscous fluid Journal of Fluid Mechanics 73 593-602
Schmidtke D W and S L Diamond (2000) Direct observation of membrane tethers formed during neutrophil attachment to platelets or P-selectin under physiological flow J Cell Biol 149(3) 719-30
Sheets E D R Simson et al (1995) New insights into membrane dynamics from the analysis of cell surface interactions by physical methods Curr Opin Cell Biol 7(5) 707-14
58
CHAPTER 21 CELL MEMBRANE MECHANICS AND ADHESION copyRD Kamm 4615
Vink H and B R Duling (1996) Identification of distinct luminal domains for macromolecules erythrocytes and leukocytes within mammalian capillaries Circ Res 79(3) 581-9
Waugh R and E A Evans (1979) Thermoelasticity of red blood cell membrane Biophys J 26(1) 115-31
Zeman K H Engelhard et al (1990) Bending undulations and elasticity of the erythrocyte membrane effects of cell shape and membrane organization Eur Biophys J 18(4) 203shy19
Zhelev D V D Needham et al (1994) Role of the membrane cortex in neutrophil deformation in small pipets Biophys J 67(2) 696-705
59
MIT OpenCourseWarehttpocwmitedu
20310J 3053J 6024J 2797J Molecular Cellular and Tissue BiomechanicsSpring 2015
For information about citing these materials or our Terms of Use visit httpocwmiteduterms
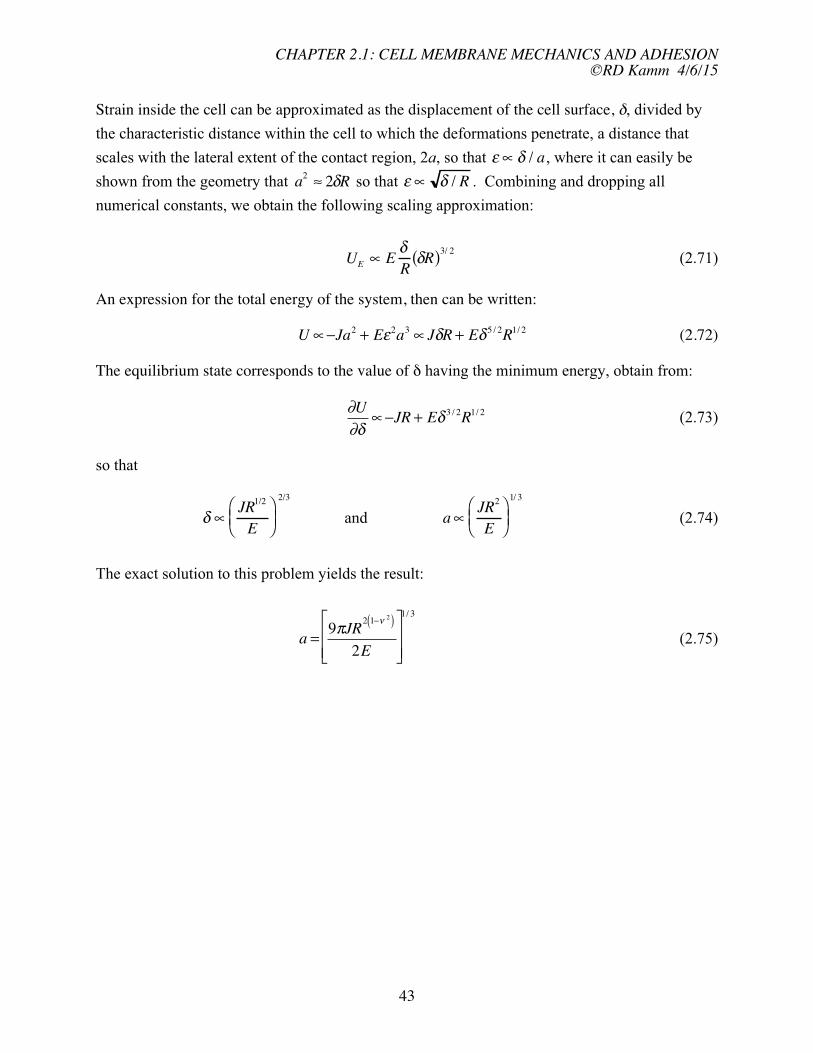
CHAPTER 21 CELL MEMBRANE MECHANICS AND ADHESION copyRD Kamm 4615
Elastic modulus E adhesion energy per unit area J
2a
Fig 3113 Experiments to determine the contact area of an iminobiotin functionalized agarosebead on a glass coverslip in water Top Schematic of adherent bead Bottom Results for a range of bead radii Solid line is a fit to the date which obeys the power law a prop R23 consistent with the prediction of JKR theory eqn(276) [Reproduced from (Moy Jiao et al 1999)] This can be compared to the result obtained from a more rigorous analysis
⎡9πJR 2(1minus ν 2 ) 13 ⎤
a = ⎢ ⎥ (276)2E⎢ ⎣ ⎥⎦
and to experimental data obtained from spherical beads made from a 4 agarose gel (Fig 3113)
Models for receptor-mediated adhesion
In Chapter x and in the preceding text we discussed the energetics of bond formation and release
as well as the effect of applied force in altering the energy landscape of the bonded pair and
thereby the rate constants for bond kinetics That analysis has obvious implications to the
44
CHAPTER 21 CELL MEMBRANE MECHANICS AND ADHESION copyRD Kamm 4615
adhesion of cells to substrates the surrounding extracellular matrix and other cells Here we
extend that analysis in the specific case of whole cell adhesion In doing so it will be important
to consider such factors as the distribution type and density of receptor-ligand bonds or
potential bonds and the elastic properties of the structures to which they are anchored On the
intracellular side this involves the series of couplings that link the receptor to the cell In the
simplest case this might simply be a link to the lipid bilayer if the receptor has no intracellular
connections More typically especially for couplings with a structural role it involves a series
of proteins ultimately linking the receptor to the cytoskeleton
The typical setting in vivo is one in which cells adhere to other cells or to the extracellular
matrix Adhesions are more easily probed however through in vitro experiments (described
below) where cell adhesion more often occurs to an artificial substrate mediated through one of
several extracellular proteins that are used to coat the surface Generally either collagen or
fibronectin is used Cells are often adhered to these substrates but to produce a more controlled
environment rigid beads are sometimes coated with the appropriate receptors so that one specific
receptor-ligand interaction can be probed While these systems are useful as models of certain
adhesion phenomena it is important to recognize in the interpretation of these experiments that
when bound to a rigid substrate or bead the binding proteins cannot freely diffuse as they would
in a more natural environment In particular the formation of focal adhesions would not occur in
bead-substrate experiments because the receptors would be constrained from aggregating
It is instructive to begin this discussion with a consideration of a single adhesion bond
for example one linking the actin matrix of the cytoskeleton to a β1 integrin and the integrin
receptor binding to the extracellular matrix beyond the cell membrane (Fig 3114) If the bond
is stressed as for example if the cell experiences a force relative to the ECM it will at first
stretch an amount dictated by the level of force in the bond and the stiffness of the complex
Each bond as well as each protein in the bond complex can be thought of as having a certain
stiffness giving rise to a picture in which several springs are considered connected in series
Forces acting on the adhesion complex are transmitted via this series of bonded proteins between
the CSK and the ECM producing local deformations and stresses in the corresponding matrices
that decay with distance from the adhesion site On the intracellular side these forces are
transmitted via a complex involving vinculin α-actinin paxillin and talin Attachment to the
extracellular matrix is mediated by an RGD sequence (in fibronectin for example) which in turn
has binding sites for collagen and fibrin If the force is sufficiently strong above a certain
threshold value F0 say and applied for a sufficiently long time the bond might be severed (deshy
couple) Typical values of this threshold force lie in the range of 10-100 pN (Evans and Ritchie
1997) but depend as well on the rate at which the force is increased Under more rapid
forcings the threshold is high compared to when the force is increased slowly This simply
45
CHAPTER 21 CELL MEMBRANE MECHANICS AND ADHESION copyRD Kamm 4615
reflects the fact that detachment is a stochastic process and that at any given level of force there
exists a finite probability of detachment and this probability increases with time
Fig 3114 One type of attachment linking the intracellular actin matrix to the extracellular matrix via an integrin complex that involves in addition vinculin α-actinin paxillin and talin (Reproduced from Lodish et al Molecular Cell Biolology 2000)
We need also to consider that in equilibrium a fraction Φ = K(1+K)-1 (where K is the
equilibrium constant) of the receptors will be bound at any given time and that the receptorshy
ligand complexes are continually cycling between the bound and unbound states characterized
by their respective rate constants
On a larger scale numerous adhesion sites typically act in parallel each contributing
some amount to the total adhesion force If the force transmitted by each single adhesion
complex is F and the density of adhesion sites (per unit membrane area) is NC then the stress
acting on the cell is the product F NC This gives a somewhat false impression however as it is
unlikely that each adhesion complex carries an equal force Put another way there exists a local
stress τ that can be thought of as the product of the average force per bond times the bond
density This stress is typically non-uniform In the adhesion of a cell to a flat substrate the
bonds near the periphery of the contact zone determine the strength of the cell against
detachment and when the cell is subjected to a detaching force the stresses are concentrated in
46
CHAPTER 21 CELL MEMBRANE MECHANICS AND ADHESION copyRD Kamm 4615
this peripheral region as depicted in Fig 3115 In the vicinity of the edge of adhesion several
factors will influence the stress distribution including the mechanical properties of the membrane
(in particular the bending stiffness KB) the receptor density the spring constants of the bond
and the bond strength
N
Region of adhesion
x1
Fig 3115 Schematic model of a cell membrane being detached from a substrate by application of a tension force N The membrane is free to the left of the dash-dot line and adherent to the right Forces and moments are transmitted through the membrane which adheres to the membrane through receptor-ligand bonds represented by a continuous distrubution p(x1)
To illustrate consider the following simple model for an adherent cell being peeled away
from its substrate by a force that generates a tension N in the membrane (Fig 3115)
Deformations in the membrane are described by eqn (223) where it can be shown that the
bending term dominates provided KbL2 gtN where L is the characteristic length in the x1 direction
(due to the small length scales involved) and the external membrane force (p in the membrane
equation) is now the non-uniform stress due to adhesion bonds As a simple first approximation
we take p = k(δminusδ0) with δ-δ0 being the amount of stretch in the receptor-ligand bond springs
and k an effective bond spring constant Recognizing that p approaches zero far from the edge
(see Fig 319) the membrane displacement and the spring displacement are related u3 = δ-δ0
Thus eqn (228) is written
⎛ part 4 u
KB⎜ 3
⎞ 4 ⎟ = NC F = NC ku
⎝ partx ⎠ 3 (277)1
This can be solved directly showing that the distance of separation between the cell membrane
and substrate grows in an exponential fashion with distance Even more simply a scaling
47
CHAPTER 21 CELL MEMBRANE MECHANICS AND ADHESION copyRD Kamm 4615
analysis of eqn (277) in which the term on the left is approximated by Kbu3w4 where w is the
characteristic distance over which u3 varies tells us that the stresses are concentrated in a region
of width
K
w prop B4 (278)
NC k
near the cell periphery Similarly we can estimate that the cell membrane will detach from the
substrate if N gt FoNCw where F0 is a measure of the force in a single bond at the time of bond
rupture and that the rate of peeling can be roughly approximated as the product of the
disassociation rate k -- (bondss) from eqn (265) and the distance between bonds (N -12C )
Although this provides some insight into how the peeling rate depends on the various factors it fails to capture the fact that the cell remains in an equilibrium attached state even for non-zero levels of tension reflecting that even under force a balance can exist between the rates of formation and rupture of receptor-ligand complexes (Ra Picart et al 1999)
It is also of interest to note that in the region near the edge of the attachment zone(x1=0
in Fig 3115) the membrane acts as a beam subjected to a moment due to the applied tension
This moment is balanced by a force couple due to tension in the adhesion complexes right
adjacent to the edge in combination with a compressive stress between the cell and substrate a
little further in In typical situations this compressive stress can approach levels as high as one
atmosphere and can act to effectively smooth the membrane and recruit new attachment sights While using these continuum descriptions it is important to keep in mind the true
discrete nature of the individual bonds represented in the model as a continuous adhesive
surface This is brought to light by a simple calculation in which the characteristic length over
which the applied tension is supported w is compared to the inter-receptor spacing N -12C
Using typical values for the parameters NC = 103 complexesμm-2 k = 10-5 to 10-6 Nm Kb = 1 to 2x10-18 Nm we find that w cong 01 to 03 μm and the inter-complex spacing N minus1 2
C cong 003 μm While it is reassuring to see that w is typically less than the inter-complex spacing the difference is small It is therefore not surprising that the actual process of cell peeling is stochastic in nature occurring in a sequence of more-or-less discrete steps with a velocity of peeling that varies widely from the mean
The interplay between receptor-ligand bonding and membrane stiffness also determines whether a cell will spread over a surface or peel away from it under a given tension Membrane bending stiffness acts to maintain the membrane and substrate within close proximity near the edge of contact (Fig 3115) Spreading can occur only if their separation distance is within the extended length of the receptor ligand bond over a distance comparable to the linear spacing
48
CHAPTER 21 CELL MEMBRANE MECHANICS AND ADHESION copyRD Kamm 4615
between neighboring bonds ( N minus1 2 C ) Under high tension the surfaces rapidly diverge and
spreading is prevented if the tension is sufficiently low receptor-ligand bonding can occur and spreading can occur
Measurements of adhesion
A variety of methods have been used to experimentally determine the strength of adhesion either
of individual receptor-ligand bonds or populations of bonds as in the case of entire cells
Whole cell experiments are more common and typically require less experimental
sophistication The drawback of course is that they provide only for estimates of average
properties and require certain assumptions regarding the distribution of cell-substrate adhesive
stress for interpretation to the level of a single bond Several of these methods are described
next
Centrifugal cell adhesion assays In this experiment cells are allowed to attached to a substrate
then are placed in a centrifuge rotating at speed ω positioned a distance r from the center of
rotation and oriented so that the net centrifugal force is acting to separate the cell from the
substrate Using the arrangement shown in Fig 3116 (right) the acceleration of the cells is 2ω r and the net force acting on a cell of volume Vc is F = (ρc minus ρf )ω 2rVc where the fluid and cell densities are ρf and ρc respectively
Interpreting these results we can make several different assumptions each leading to a different estimate for the maximum force experienced by the binding complex If we simply assume that all receptor-ligand complexes support an equal fraction of the total force F then the force per bond is f = F (πa 2NC ) where NC is the concentration of bond complexes However as the cell tears away from the substrate the edge bonds will break first since these experience the greatest level of force An alternative approach then is to assume that the adhesion complexes around the cell circumference support the entire load leading to the estimate f = F 2( πaN 1 2 ) recognizing that N1 2
C C is the average distance between bonds A somewhatmore accurate value for f might be obtained if we assume that all complexes within the distance w given by eqn (278) support the load In any of these cases once the centrifugal force exceeds some critical limit since the number of receptors supporting the load falls as the region of contact becomes smaller the force per bond increases and the cell will rapidly detach
Stochastic variability also needs to be taken into account however since even under a constant load any single bond has a finite probability of failure under a given level of force The equilibrium state of the cell then should be viewed as one in which the rate of bond formation equals the rate of bond breakage with increasing force having the effect of reducing the
49
CHAPTER 21 CELL MEMBRANE MECHANICS AND ADHESION copyRD Kamm 4615
probability that the bond will remain intact These effects can be addressed using the methods described in more detail in Chapter xx Parallel flow assay Another common method for assessing cell adhesion is to plate the cells onto one wall of a parallel flow chamber subject them to a fluid dynamic shear stress and observe at what flow rate the cells begin to release If we ignore flow details in the immediate vicinity of the cell the shear stress can be estimated from the solution for a fully developed (Poiseuille) velocity profile
3V ⎡ y2
⎛ ⎞ ⎤v(y) = ⎢1minus ⎥ (279)
2 ⎝ ⎠ ⎣ ⎢ h ⎥⎦
so that the shear stress acting on the cell is
⎛ dv ⎞ 6μV τw = μ⎜ ⎟ = (280)
⎝ dy ⎠ h y = minush
and the total force can be estimated as F asymp τw Ac where Ac is the surface area of the cell membrane exposed to the flow Consider as an example a flow of culture medium at a rate of 1 mls through a channel of height 01 cm and width 1 cm If the culture medium has a viscosity close to that of water (μ=001 dyns) the shear stress is obtained from eqn (280)
6 sdot (001dyn sdot s) sdot (1ml s) ( 01 sdot10cm2 )τ dyn cm 2w = = 6 = 06Pa
01cm This corresponds roughly with the level of shear stress experience by endothelial cells in the arterial system If we consider that the cell has a surface area with dimensions roughly 100 μm x 10 μm or about 103 μm2 then the total force acting on the cell is obtained by integrating the shear stress over the area of the apical membrane Assuming that the shear stress is uniform the force is simply the product of shear stress and surface area or about 1 nN in the present example Again interpretation of results from such experiments requires careful consideration of the distribution of forces among the individual adhesion complexes In this situation the cell is likely to peel from the upstream edge in much the same manner as occurs in the cell peeling experiment discussed earlier
50
CHAPTER 21 CELL MEMBRANE MECHANICS AND ADHESION copyRD Kamm 4615
Radial flow and spinning disk assays One disadvantage of the parallel flow assay is that all cells are subjected to essentially the same level of shear stress so the flow rate needs to be incrementally varied in order to determine the level of force required for detachment These two systems using an axisymmetric geometry circumvent this problem by producing an easily characterized radial variation in shear stress In the case of the radial flow assay fluid enters through a central channel and flows radially outward through the narrow gap between two circular plates From conservation of mass the mean flow velocity is given by
QV = (281)
2πrh and sufficiently far from the center (rgtgth) the velocity profile is parabolic as in the parallel flow assay and the shear stress is again governed by eqn (280) using (281) for V Q
ω
(Not to scale)
v
h h
Cell layer rc Ce l l layer rc
r r
Fig 3116 Schematic diagram showing the radial flow assay (left) and the spinning disk assay (right) In the radial flow assay shear stress attains a maximum value near the center and falls with increasing radius r whereas in the spinning disk system maximum shear stress is experienced at large r In the spinning disk assay cells are grown on one disk and the opposite disk is rotated at constant speed Provided the rate of rotation is sufficiently small that inertial effects can be neglected the velocity is purely in the circumferential direction and the profile is linear between the two plates so that the shear stress experienced by the cells can easily be computed as
ωr τw = μ (282)
h
51
CHAPTER 21 CELL MEMBRANE MECHANICS AND ADHESION copyRD Kamm 4615
In both of these cases as in the parallel flow assay the total force is obtained by integrating the shear stress over the cell surface and the distribution of force among the adhesion complexes is weighted toward those located near the upstream end of the cell This can also be seen by consideration of the torque exerted by shear stress on the cell that must be balanced by a nonshyuniform contact stress with the substrate that is greatest near the upstream end Single bond adhesion assays Two other assays provide a means of obtaining estimates for the strength of a single adhesion bond without the need for excessive interpretation These rely on an ability to isolate a small number of bonds or even a single bond and infer bond strength from the step-wise nature of the de-adhesion process associated with breakage of discrete bonds One of these methods employs the atomic force microscope coated with the ligand of an adhesion receptor as shown in Fig 3117 The probe tip is gradually brought up to the cell surface until one or more receptor-ligand bonds are formed When the probe tip is withdrawn it moves along a different trajectory on a force-displacement plot reflecting the forces of adhesion These forces are seen to jump between more or less discrete levels as the probe continues to be moved away from the cell with each jump corresponding to the breakage of a single bond (Fig 3117) Using this method the bond strength between integrin receptor and a variety of RGD-containing ligands was found to lie in the range of 30 to 100 pN (Lehenkari and Horton 1999)
Fig 3117 The strength of a single adhesion bond can be measured by bringing a functionalized tip of an AFM probe up to the cell allowing bonds to form then slowly withdrawing the probe Monitoring the differences between the force displacement curve between the forward and reverse motions the forces necessary to break a single receptor-ligand bond can be determined [Reproduced from (Lehenkari and Horton 1999)]
52
CHAPTER 21 CELL MEMBRANE MECHANICS AND ADHESION copyRD Kamm 4615
A second method is similar in that the discrete increments in force are monitored as individual receptor-ligand bonds are broken but the forces are measured by means of changes in the shape of a giant vesicle the membrane of which contains the ligands have been inserted In this case one vesicle is made effectively rigid due for example to a high surface tension A second vesicle containing the adhesion molecules is also drawn partially into a micropipet but is much more complaint than the first The two vesicles are then brought into point contact so that one or a small number of adhesions are formed As the pipets are moved apart the compliant vesicle distorts due to the force of adhesion which it can be shown is related to the change in dimension of the vesicle in the direction of the force thereby serving as a sensitive force transducer measuring forces in the range of single adhesion receptors or between 1 and 100 pN [Evans 1991 37]
(For specific examples of leukocyte rolling and attachment see Orsello or Chang amp Hammer)
[This process is initiated for example by local infection that causes the release of
chemotactic agents in addition to cytokines hellip
Models of this process draw upon many of the concepts discussed in this chapter ]
Transient cell adhesion
Concepts of transient adhesion and release are of particular importance in the case of leukocyte
rolling adhesion and transmigration across the endothelial layer of a blood vessel In addition
cell migration through extracellular matrix or along a substrate requires the ability of the cell to
both form and release adhesions
One problem that has received considerable attention is the interaction between an
adherent or rolling leukocyte and the adhesion receptors on the endothelium These studies are
complicated by the three-dimensional nature of the flow the compliance of the interacting
surfaces and receptor-ligand dynamics In a series of recent studies Hammer and co-workers
(Chang Tees et al 2000) have addressed several of these issues computing the viscous force
and torque acting upon a sphere near to planar wall from the mobility matrix (Hammer and Apte
1992) and using the ldquoBell modelrdquo of receptor binding (Bell 1978) but neglecting the effects of
cell deformation The Bell model relates the dissociation rate constant kr to the force in the
bond f the thermal energy kBT and a parameter with units of length that depends on the
reactivity of the molecule
kr = ko r exp(γf kBT ) (283)
53
CHAPTER 21 CELL MEMBRANE MECHANICS AND ADHESION copyRD Kamm 4615
A Monte Carlo method is employed at each time step in the calculation to determine bond
formation or breakage In these studies the nature of the leukocyte-endothelial interaction is
characterized as firm adhesion rolling adhesion bimodal adhesion or no adhesion and mapped
as a function of the two parameters of the Bell model in Fig 3 The boundaries of the rolling
adhesion regime are identified for a wall shear rate of 100 s-1 (dotted lines) or 30 and 400 s-1
(solid lines) Most literature values for the Bell model parameters for a variety of selectin
receptors (known to be instrumental in leukocyte rolling) correspond to the rolling adhesion
regime for typical shear rate of 100 s-1 An interesting but counterintuitive result from this study
was the observation that as the bond stiffness was increased from the value used in most
calculations (100 dyne cm-1) adhesiveness decreased which the authors attribute to reduced
deflection for a given level of force leading subsequently to more rapid dissociation
Fig 3118 The state diagram for a leukocyte interacting with an endothelial surface for shear rates ranging from 30 to 400 s-1 For low dissociation rates the leukocyte remains adherent to the surface (lower left) As either (γ) or ( ko
r ) [see Eqn (283) for definitions] is increased the cell first adheres firmly then rolls along the wall then completely detaches (upper right) Rolling adhesion is defined as the regime where rolling occurs over some part of the shear rate range between 30 and 400 s-1 Firm adhesion indicates that cells remain attached even at the highest shear rate no adhesion indicates that cells roll at a velocity gt 50 of the velocity of a non-adherent sphere In the bimodal regime cells are either adherent or non-adherent and do not exhibit rolling Dotted curves correspond to these same boundaries for a shear rate of 100 s-1 Reproduced from Chang et al (2000)
54
CHAPTER 21 CELL MEMBRANE MECHANICS AND ADHESION copyRD Kamm 4615
In another recent study using high-resolution video-microscopy (Schmidtke and Diamond
2000) it was demonstrated that a flowing neutrophil can attach to an adherent platelet via
adhesion molecules located in the tips of the microvilli and form long tethers averaging nearly 10
μm in length but ranging up to 40 μm at extensional rates of 6-40 μm s-1 for shear rates ranging
from 100-250 s-1 The mechanics of tether formation is itself a fascinating topic that is still under
intense investigation Readers interested in pursuing this work in more detail are referred to the
several papers (Hochmuth Shao et al 1996 Dai and Sheetz 1998 Dai and Sheetz 1999) that
identify a number of intriguing phenomena
55
CHAPTER 21 CELL MEMBRANE MECHANICS AND ADHESION copyRD Kamm 4615
317 Nomenclature Parameter Definition Units
R - receptor
L - ligand
C - receptor-ligand complex
G - Gibbs free energy Nm
N - membrane tension Nm
NR - total receptor density -3μm-2 in 2D or μm in 3D NL - total ligand density μm-2 in 2D or μm-3 in 3D N in 2D or μm-3μm-2
C - complex density in 3D NRf - free receptor density m-2 in 2D or m-3μ μ in 3D NLf - free ligand density -2 -3μm in 2D or μm in 3D d+ - forward diffusional rate constant 2 -1μm s-1 in 2D or 3 μm s in 3D d -1
- - reverse diffusional rate constant s r+ - forward reaction rate constant s-1
r- - reverse reaction rate constant s-1 D 2 -1
m - membrane diffusion coefficient μm s D - solution diffusion coefficient m2 s -1s μ Kb - bending stiffness Nm K 0 - equilibrium constant or affinity (zero force) M-1 in 3D and 2μm in 2D = k0
+ k0 minus
K - equilibrium constant M-1 in 3D and m2μ in 2D = k+kshy
k0 - association rate constant (zero force) M-1 s-1 in 3D or m-2 -1+ μ s in 2D
k0 - dissociation rate constant (zero force) s-1 minus
k - association rate constant M-1 s-1 in 3D or m-2 -1+ μ s in 2D
kminus - dissociation rate constant s-1 f - force per bond N F - total adhesion force N γ - empirical parameter μm r0 - distance over which energy minimum acts μm E0 - bond energy J k JK-1
B - Boltzmanns constant T - temperature K τ - bond lifetime s
56
CHAPTER 21 CELL MEMBRANE MECHANICS AND ADHESION copyRD Kamm 4615
τ0 - bond lifetime with zero force s σ - adhesion stress N μm-2 κ - spring constant for receptor-ligand bond N μm-1
57
CHAPTER 21 CELL MEMBRANE MECHANICS AND ADHESION copyRD Kamm 4615
References Bell G I (1978) Models for the specific adhesion of cells to cells Science 200 618-627 Caille N O Thoumine et al (2002) Contribution of the nucleus to the mechanical properties
of endothelial cells J Biomech 35(2) 177-87 Chang K C D F Tees et al (2000) The state diagram for cell adhesion under flow
leukocyte rolling and firm adhesion Proc Natl Acad Sci U S A 97(21) 11262-7 Dai J and M P Sheetz (1998) Cell membrane mechanics Methods Cell Biol 55 157-71 Dai J and M P Sheetz (1999) Membrane tether formation from blebbing cells Biophys J
77(6) 3363-70 Daily Elson et al (1984) Determination of the elastic area compressibility modulus of the
erythrocyte membrane Biophys J 45(4) 671-682 Evans E and K Ritchie (1997) Dynamic strength of molecular adhesion bonds Biophys J
72(4) 1541-55 Evans E A (1983) Bending elastic modulus of red blood cell membrane derived from
buckling instability in micropipet aspiration tests Biophys J 43(1) 27-30 Hammer D A and S M Apte (1992) Simulation of cell rolling and adhesion on surfaces in
shear flow general results and analysis of selectin-mediated neutrophil adhesion Biophys J 63(1) 35-57
Hardt S L (1979) Rates of diffusion controlled reactions in one two and three dimensions Biophysical Chemistry 10 239-243
Hochmuth F M J Y Shao et al (1996) Deformation and flow of membrane into tethers extracted from neuronal growth cones Biophys J 70(1) 358-69
Kucik D F E L Elson et al (1999) Weak dependence of mobility of membrane protein aggregates on aggregate size supports a viscous model of retardation of diffusion Biophys J 76(1 Pt 1) 314-22
Kusumi A Y Sako et al (1993) Confined lateral diffusion of membrane receptors as studied by single particle tracking (nanovid microscopy) Effects of calcium-induced differentiation in cultured epithelial cells Biophys J 65(5) 2021-40
Lehenkari P P and M A Horton (1999) Single integrin molecule adhesion forces in intact cells measured by atomic force microscopy Biochem Biophys Res Commun 259(3) 645-50
McCloskey M and M M Poo (1984) Protein diffusion in cell membranes some biological implications Int Rev Cytol 87 19-81
Meleard P Gerbeaud C Bardusco N Mitov MD and Ferdandex-Puente L (1998) Mechanical properties of model membranes studied from shape transformations of giant vesicles Biochimie 80 401-413
Moy V T Y Jiao et al (1999) Adhesion energy of receptor-mediated interaction measured by elastic deformation Biophys J 76(3) 1632-8
Ra H J C Picart et al (1999) Muscle cell peeling from micropatterned collagen direct probing of focal and molecular properties of matrix adhesion J Cell Sci 112 ( Pt 10) 1425-36
Saffman P G (1976) Bownian motion in thin sheets of viscous fluid Journal of Fluid Mechanics 73 593-602
Schmidtke D W and S L Diamond (2000) Direct observation of membrane tethers formed during neutrophil attachment to platelets or P-selectin under physiological flow J Cell Biol 149(3) 719-30
Sheets E D R Simson et al (1995) New insights into membrane dynamics from the analysis of cell surface interactions by physical methods Curr Opin Cell Biol 7(5) 707-14
58
CHAPTER 21 CELL MEMBRANE MECHANICS AND ADHESION copyRD Kamm 4615
Vink H and B R Duling (1996) Identification of distinct luminal domains for macromolecules erythrocytes and leukocytes within mammalian capillaries Circ Res 79(3) 581-9
Waugh R and E A Evans (1979) Thermoelasticity of red blood cell membrane Biophys J 26(1) 115-31
Zeman K H Engelhard et al (1990) Bending undulations and elasticity of the erythrocyte membrane effects of cell shape and membrane organization Eur Biophys J 18(4) 203shy19
Zhelev D V D Needham et al (1994) Role of the membrane cortex in neutrophil deformation in small pipets Biophys J 67(2) 696-705
59
MIT OpenCourseWarehttpocwmitedu
20310J 3053J 6024J 2797J Molecular Cellular and Tissue BiomechanicsSpring 2015
For information about citing these materials or our Terms of Use visit httpocwmiteduterms
CHAPTER 21 CELL MEMBRANE MECHANICS AND ADHESION copyRD Kamm 4615
adhesion of cells to substrates the surrounding extracellular matrix and other cells Here we
extend that analysis in the specific case of whole cell adhesion In doing so it will be important
to consider such factors as the distribution type and density of receptor-ligand bonds or
potential bonds and the elastic properties of the structures to which they are anchored On the
intracellular side this involves the series of couplings that link the receptor to the cell In the
simplest case this might simply be a link to the lipid bilayer if the receptor has no intracellular
connections More typically especially for couplings with a structural role it involves a series
of proteins ultimately linking the receptor to the cytoskeleton
The typical setting in vivo is one in which cells adhere to other cells or to the extracellular
matrix Adhesions are more easily probed however through in vitro experiments (described
below) where cell adhesion more often occurs to an artificial substrate mediated through one of
several extracellular proteins that are used to coat the surface Generally either collagen or
fibronectin is used Cells are often adhered to these substrates but to produce a more controlled
environment rigid beads are sometimes coated with the appropriate receptors so that one specific
receptor-ligand interaction can be probed While these systems are useful as models of certain
adhesion phenomena it is important to recognize in the interpretation of these experiments that
when bound to a rigid substrate or bead the binding proteins cannot freely diffuse as they would
in a more natural environment In particular the formation of focal adhesions would not occur in
bead-substrate experiments because the receptors would be constrained from aggregating
It is instructive to begin this discussion with a consideration of a single adhesion bond
for example one linking the actin matrix of the cytoskeleton to a β1 integrin and the integrin
receptor binding to the extracellular matrix beyond the cell membrane (Fig 3114) If the bond
is stressed as for example if the cell experiences a force relative to the ECM it will at first
stretch an amount dictated by the level of force in the bond and the stiffness of the complex
Each bond as well as each protein in the bond complex can be thought of as having a certain
stiffness giving rise to a picture in which several springs are considered connected in series
Forces acting on the adhesion complex are transmitted via this series of bonded proteins between
the CSK and the ECM producing local deformations and stresses in the corresponding matrices
that decay with distance from the adhesion site On the intracellular side these forces are
transmitted via a complex involving vinculin α-actinin paxillin and talin Attachment to the
extracellular matrix is mediated by an RGD sequence (in fibronectin for example) which in turn
has binding sites for collagen and fibrin If the force is sufficiently strong above a certain
threshold value F0 say and applied for a sufficiently long time the bond might be severed (deshy
couple) Typical values of this threshold force lie in the range of 10-100 pN (Evans and Ritchie
1997) but depend as well on the rate at which the force is increased Under more rapid
forcings the threshold is high compared to when the force is increased slowly This simply
45
CHAPTER 21 CELL MEMBRANE MECHANICS AND ADHESION copyRD Kamm 4615
reflects the fact that detachment is a stochastic process and that at any given level of force there
exists a finite probability of detachment and this probability increases with time
Fig 3114 One type of attachment linking the intracellular actin matrix to the extracellular matrix via an integrin complex that involves in addition vinculin α-actinin paxillin and talin (Reproduced from Lodish et al Molecular Cell Biolology 2000)
We need also to consider that in equilibrium a fraction Φ = K(1+K)-1 (where K is the
equilibrium constant) of the receptors will be bound at any given time and that the receptorshy
ligand complexes are continually cycling between the bound and unbound states characterized
by their respective rate constants
On a larger scale numerous adhesion sites typically act in parallel each contributing
some amount to the total adhesion force If the force transmitted by each single adhesion
complex is F and the density of adhesion sites (per unit membrane area) is NC then the stress
acting on the cell is the product F NC This gives a somewhat false impression however as it is
unlikely that each adhesion complex carries an equal force Put another way there exists a local
stress τ that can be thought of as the product of the average force per bond times the bond
density This stress is typically non-uniform In the adhesion of a cell to a flat substrate the
bonds near the periphery of the contact zone determine the strength of the cell against
detachment and when the cell is subjected to a detaching force the stresses are concentrated in
46
CHAPTER 21 CELL MEMBRANE MECHANICS AND ADHESION copyRD Kamm 4615
this peripheral region as depicted in Fig 3115 In the vicinity of the edge of adhesion several
factors will influence the stress distribution including the mechanical properties of the membrane
(in particular the bending stiffness KB) the receptor density the spring constants of the bond
and the bond strength
N
Region of adhesion
x1
Fig 3115 Schematic model of a cell membrane being detached from a substrate by application of a tension force N The membrane is free to the left of the dash-dot line and adherent to the right Forces and moments are transmitted through the membrane which adheres to the membrane through receptor-ligand bonds represented by a continuous distrubution p(x1)
To illustrate consider the following simple model for an adherent cell being peeled away
from its substrate by a force that generates a tension N in the membrane (Fig 3115)
Deformations in the membrane are described by eqn (223) where it can be shown that the
bending term dominates provided KbL2 gtN where L is the characteristic length in the x1 direction
(due to the small length scales involved) and the external membrane force (p in the membrane
equation) is now the non-uniform stress due to adhesion bonds As a simple first approximation
we take p = k(δminusδ0) with δ-δ0 being the amount of stretch in the receptor-ligand bond springs
and k an effective bond spring constant Recognizing that p approaches zero far from the edge
(see Fig 319) the membrane displacement and the spring displacement are related u3 = δ-δ0
Thus eqn (228) is written
⎛ part 4 u
KB⎜ 3
⎞ 4 ⎟ = NC F = NC ku
⎝ partx ⎠ 3 (277)1
This can be solved directly showing that the distance of separation between the cell membrane
and substrate grows in an exponential fashion with distance Even more simply a scaling
47
CHAPTER 21 CELL MEMBRANE MECHANICS AND ADHESION copyRD Kamm 4615
analysis of eqn (277) in which the term on the left is approximated by Kbu3w4 where w is the
characteristic distance over which u3 varies tells us that the stresses are concentrated in a region
of width
K
w prop B4 (278)
NC k
near the cell periphery Similarly we can estimate that the cell membrane will detach from the
substrate if N gt FoNCw where F0 is a measure of the force in a single bond at the time of bond
rupture and that the rate of peeling can be roughly approximated as the product of the
disassociation rate k -- (bondss) from eqn (265) and the distance between bonds (N -12C )
Although this provides some insight into how the peeling rate depends on the various factors it fails to capture the fact that the cell remains in an equilibrium attached state even for non-zero levels of tension reflecting that even under force a balance can exist between the rates of formation and rupture of receptor-ligand complexes (Ra Picart et al 1999)
It is also of interest to note that in the region near the edge of the attachment zone(x1=0
in Fig 3115) the membrane acts as a beam subjected to a moment due to the applied tension
This moment is balanced by a force couple due to tension in the adhesion complexes right
adjacent to the edge in combination with a compressive stress between the cell and substrate a
little further in In typical situations this compressive stress can approach levels as high as one
atmosphere and can act to effectively smooth the membrane and recruit new attachment sights While using these continuum descriptions it is important to keep in mind the true
discrete nature of the individual bonds represented in the model as a continuous adhesive
surface This is brought to light by a simple calculation in which the characteristic length over
which the applied tension is supported w is compared to the inter-receptor spacing N -12C
Using typical values for the parameters NC = 103 complexesμm-2 k = 10-5 to 10-6 Nm Kb = 1 to 2x10-18 Nm we find that w cong 01 to 03 μm and the inter-complex spacing N minus1 2
C cong 003 μm While it is reassuring to see that w is typically less than the inter-complex spacing the difference is small It is therefore not surprising that the actual process of cell peeling is stochastic in nature occurring in a sequence of more-or-less discrete steps with a velocity of peeling that varies widely from the mean
The interplay between receptor-ligand bonding and membrane stiffness also determines whether a cell will spread over a surface or peel away from it under a given tension Membrane bending stiffness acts to maintain the membrane and substrate within close proximity near the edge of contact (Fig 3115) Spreading can occur only if their separation distance is within the extended length of the receptor ligand bond over a distance comparable to the linear spacing
48
CHAPTER 21 CELL MEMBRANE MECHANICS AND ADHESION copyRD Kamm 4615
between neighboring bonds ( N minus1 2 C ) Under high tension the surfaces rapidly diverge and
spreading is prevented if the tension is sufficiently low receptor-ligand bonding can occur and spreading can occur
Measurements of adhesion
A variety of methods have been used to experimentally determine the strength of adhesion either
of individual receptor-ligand bonds or populations of bonds as in the case of entire cells
Whole cell experiments are more common and typically require less experimental
sophistication The drawback of course is that they provide only for estimates of average
properties and require certain assumptions regarding the distribution of cell-substrate adhesive
stress for interpretation to the level of a single bond Several of these methods are described
next
Centrifugal cell adhesion assays In this experiment cells are allowed to attached to a substrate
then are placed in a centrifuge rotating at speed ω positioned a distance r from the center of
rotation and oriented so that the net centrifugal force is acting to separate the cell from the
substrate Using the arrangement shown in Fig 3116 (right) the acceleration of the cells is 2ω r and the net force acting on a cell of volume Vc is F = (ρc minus ρf )ω 2rVc where the fluid and cell densities are ρf and ρc respectively
Interpreting these results we can make several different assumptions each leading to a different estimate for the maximum force experienced by the binding complex If we simply assume that all receptor-ligand complexes support an equal fraction of the total force F then the force per bond is f = F (πa 2NC ) where NC is the concentration of bond complexes However as the cell tears away from the substrate the edge bonds will break first since these experience the greatest level of force An alternative approach then is to assume that the adhesion complexes around the cell circumference support the entire load leading to the estimate f = F 2( πaN 1 2 ) recognizing that N1 2
C C is the average distance between bonds A somewhatmore accurate value for f might be obtained if we assume that all complexes within the distance w given by eqn (278) support the load In any of these cases once the centrifugal force exceeds some critical limit since the number of receptors supporting the load falls as the region of contact becomes smaller the force per bond increases and the cell will rapidly detach
Stochastic variability also needs to be taken into account however since even under a constant load any single bond has a finite probability of failure under a given level of force The equilibrium state of the cell then should be viewed as one in which the rate of bond formation equals the rate of bond breakage with increasing force having the effect of reducing the
49
CHAPTER 21 CELL MEMBRANE MECHANICS AND ADHESION copyRD Kamm 4615
probability that the bond will remain intact These effects can be addressed using the methods described in more detail in Chapter xx Parallel flow assay Another common method for assessing cell adhesion is to plate the cells onto one wall of a parallel flow chamber subject them to a fluid dynamic shear stress and observe at what flow rate the cells begin to release If we ignore flow details in the immediate vicinity of the cell the shear stress can be estimated from the solution for a fully developed (Poiseuille) velocity profile
3V ⎡ y2
⎛ ⎞ ⎤v(y) = ⎢1minus ⎥ (279)
2 ⎝ ⎠ ⎣ ⎢ h ⎥⎦
so that the shear stress acting on the cell is
⎛ dv ⎞ 6μV τw = μ⎜ ⎟ = (280)
⎝ dy ⎠ h y = minush
and the total force can be estimated as F asymp τw Ac where Ac is the surface area of the cell membrane exposed to the flow Consider as an example a flow of culture medium at a rate of 1 mls through a channel of height 01 cm and width 1 cm If the culture medium has a viscosity close to that of water (μ=001 dyns) the shear stress is obtained from eqn (280)
6 sdot (001dyn sdot s) sdot (1ml s) ( 01 sdot10cm2 )τ dyn cm 2w = = 6 = 06Pa
01cm This corresponds roughly with the level of shear stress experience by endothelial cells in the arterial system If we consider that the cell has a surface area with dimensions roughly 100 μm x 10 μm or about 103 μm2 then the total force acting on the cell is obtained by integrating the shear stress over the area of the apical membrane Assuming that the shear stress is uniform the force is simply the product of shear stress and surface area or about 1 nN in the present example Again interpretation of results from such experiments requires careful consideration of the distribution of forces among the individual adhesion complexes In this situation the cell is likely to peel from the upstream edge in much the same manner as occurs in the cell peeling experiment discussed earlier
50
CHAPTER 21 CELL MEMBRANE MECHANICS AND ADHESION copyRD Kamm 4615
Radial flow and spinning disk assays One disadvantage of the parallel flow assay is that all cells are subjected to essentially the same level of shear stress so the flow rate needs to be incrementally varied in order to determine the level of force required for detachment These two systems using an axisymmetric geometry circumvent this problem by producing an easily characterized radial variation in shear stress In the case of the radial flow assay fluid enters through a central channel and flows radially outward through the narrow gap between two circular plates From conservation of mass the mean flow velocity is given by
QV = (281)
2πrh and sufficiently far from the center (rgtgth) the velocity profile is parabolic as in the parallel flow assay and the shear stress is again governed by eqn (280) using (281) for V Q
ω
(Not to scale)
v
h h
Cell layer rc Ce l l layer rc
r r
Fig 3116 Schematic diagram showing the radial flow assay (left) and the spinning disk assay (right) In the radial flow assay shear stress attains a maximum value near the center and falls with increasing radius r whereas in the spinning disk system maximum shear stress is experienced at large r In the spinning disk assay cells are grown on one disk and the opposite disk is rotated at constant speed Provided the rate of rotation is sufficiently small that inertial effects can be neglected the velocity is purely in the circumferential direction and the profile is linear between the two plates so that the shear stress experienced by the cells can easily be computed as
ωr τw = μ (282)
h
51
CHAPTER 21 CELL MEMBRANE MECHANICS AND ADHESION copyRD Kamm 4615
In both of these cases as in the parallel flow assay the total force is obtained by integrating the shear stress over the cell surface and the distribution of force among the adhesion complexes is weighted toward those located near the upstream end of the cell This can also be seen by consideration of the torque exerted by shear stress on the cell that must be balanced by a nonshyuniform contact stress with the substrate that is greatest near the upstream end Single bond adhesion assays Two other assays provide a means of obtaining estimates for the strength of a single adhesion bond without the need for excessive interpretation These rely on an ability to isolate a small number of bonds or even a single bond and infer bond strength from the step-wise nature of the de-adhesion process associated with breakage of discrete bonds One of these methods employs the atomic force microscope coated with the ligand of an adhesion receptor as shown in Fig 3117 The probe tip is gradually brought up to the cell surface until one or more receptor-ligand bonds are formed When the probe tip is withdrawn it moves along a different trajectory on a force-displacement plot reflecting the forces of adhesion These forces are seen to jump between more or less discrete levels as the probe continues to be moved away from the cell with each jump corresponding to the breakage of a single bond (Fig 3117) Using this method the bond strength between integrin receptor and a variety of RGD-containing ligands was found to lie in the range of 30 to 100 pN (Lehenkari and Horton 1999)
Fig 3117 The strength of a single adhesion bond can be measured by bringing a functionalized tip of an AFM probe up to the cell allowing bonds to form then slowly withdrawing the probe Monitoring the differences between the force displacement curve between the forward and reverse motions the forces necessary to break a single receptor-ligand bond can be determined [Reproduced from (Lehenkari and Horton 1999)]
52
CHAPTER 21 CELL MEMBRANE MECHANICS AND ADHESION copyRD Kamm 4615
A second method is similar in that the discrete increments in force are monitored as individual receptor-ligand bonds are broken but the forces are measured by means of changes in the shape of a giant vesicle the membrane of which contains the ligands have been inserted In this case one vesicle is made effectively rigid due for example to a high surface tension A second vesicle containing the adhesion molecules is also drawn partially into a micropipet but is much more complaint than the first The two vesicles are then brought into point contact so that one or a small number of adhesions are formed As the pipets are moved apart the compliant vesicle distorts due to the force of adhesion which it can be shown is related to the change in dimension of the vesicle in the direction of the force thereby serving as a sensitive force transducer measuring forces in the range of single adhesion receptors or between 1 and 100 pN [Evans 1991 37]
(For specific examples of leukocyte rolling and attachment see Orsello or Chang amp Hammer)
[This process is initiated for example by local infection that causes the release of
chemotactic agents in addition to cytokines hellip
Models of this process draw upon many of the concepts discussed in this chapter ]
Transient cell adhesion
Concepts of transient adhesion and release are of particular importance in the case of leukocyte
rolling adhesion and transmigration across the endothelial layer of a blood vessel In addition
cell migration through extracellular matrix or along a substrate requires the ability of the cell to
both form and release adhesions
One problem that has received considerable attention is the interaction between an
adherent or rolling leukocyte and the adhesion receptors on the endothelium These studies are
complicated by the three-dimensional nature of the flow the compliance of the interacting
surfaces and receptor-ligand dynamics In a series of recent studies Hammer and co-workers
(Chang Tees et al 2000) have addressed several of these issues computing the viscous force
and torque acting upon a sphere near to planar wall from the mobility matrix (Hammer and Apte
1992) and using the ldquoBell modelrdquo of receptor binding (Bell 1978) but neglecting the effects of
cell deformation The Bell model relates the dissociation rate constant kr to the force in the
bond f the thermal energy kBT and a parameter with units of length that depends on the
reactivity of the molecule
kr = ko r exp(γf kBT ) (283)
53
CHAPTER 21 CELL MEMBRANE MECHANICS AND ADHESION copyRD Kamm 4615
A Monte Carlo method is employed at each time step in the calculation to determine bond
formation or breakage In these studies the nature of the leukocyte-endothelial interaction is
characterized as firm adhesion rolling adhesion bimodal adhesion or no adhesion and mapped
as a function of the two parameters of the Bell model in Fig 3 The boundaries of the rolling
adhesion regime are identified for a wall shear rate of 100 s-1 (dotted lines) or 30 and 400 s-1
(solid lines) Most literature values for the Bell model parameters for a variety of selectin
receptors (known to be instrumental in leukocyte rolling) correspond to the rolling adhesion
regime for typical shear rate of 100 s-1 An interesting but counterintuitive result from this study
was the observation that as the bond stiffness was increased from the value used in most
calculations (100 dyne cm-1) adhesiveness decreased which the authors attribute to reduced
deflection for a given level of force leading subsequently to more rapid dissociation
Fig 3118 The state diagram for a leukocyte interacting with an endothelial surface for shear rates ranging from 30 to 400 s-1 For low dissociation rates the leukocyte remains adherent to the surface (lower left) As either (γ) or ( ko
r ) [see Eqn (283) for definitions] is increased the cell first adheres firmly then rolls along the wall then completely detaches (upper right) Rolling adhesion is defined as the regime where rolling occurs over some part of the shear rate range between 30 and 400 s-1 Firm adhesion indicates that cells remain attached even at the highest shear rate no adhesion indicates that cells roll at a velocity gt 50 of the velocity of a non-adherent sphere In the bimodal regime cells are either adherent or non-adherent and do not exhibit rolling Dotted curves correspond to these same boundaries for a shear rate of 100 s-1 Reproduced from Chang et al (2000)
54
CHAPTER 21 CELL MEMBRANE MECHANICS AND ADHESION copyRD Kamm 4615
In another recent study using high-resolution video-microscopy (Schmidtke and Diamond
2000) it was demonstrated that a flowing neutrophil can attach to an adherent platelet via
adhesion molecules located in the tips of the microvilli and form long tethers averaging nearly 10
μm in length but ranging up to 40 μm at extensional rates of 6-40 μm s-1 for shear rates ranging
from 100-250 s-1 The mechanics of tether formation is itself a fascinating topic that is still under
intense investigation Readers interested in pursuing this work in more detail are referred to the
several papers (Hochmuth Shao et al 1996 Dai and Sheetz 1998 Dai and Sheetz 1999) that
identify a number of intriguing phenomena
55
CHAPTER 21 CELL MEMBRANE MECHANICS AND ADHESION copyRD Kamm 4615
317 Nomenclature Parameter Definition Units
R - receptor
L - ligand
C - receptor-ligand complex
G - Gibbs free energy Nm
N - membrane tension Nm
NR - total receptor density -3μm-2 in 2D or μm in 3D NL - total ligand density μm-2 in 2D or μm-3 in 3D N in 2D or μm-3μm-2
C - complex density in 3D NRf - free receptor density m-2 in 2D or m-3μ μ in 3D NLf - free ligand density -2 -3μm in 2D or μm in 3D d+ - forward diffusional rate constant 2 -1μm s-1 in 2D or 3 μm s in 3D d -1
- - reverse diffusional rate constant s r+ - forward reaction rate constant s-1
r- - reverse reaction rate constant s-1 D 2 -1
m - membrane diffusion coefficient μm s D - solution diffusion coefficient m2 s -1s μ Kb - bending stiffness Nm K 0 - equilibrium constant or affinity (zero force) M-1 in 3D and 2μm in 2D = k0
+ k0 minus
K - equilibrium constant M-1 in 3D and m2μ in 2D = k+kshy
k0 - association rate constant (zero force) M-1 s-1 in 3D or m-2 -1+ μ s in 2D
k0 - dissociation rate constant (zero force) s-1 minus
k - association rate constant M-1 s-1 in 3D or m-2 -1+ μ s in 2D
kminus - dissociation rate constant s-1 f - force per bond N F - total adhesion force N γ - empirical parameter μm r0 - distance over which energy minimum acts μm E0 - bond energy J k JK-1
B - Boltzmanns constant T - temperature K τ - bond lifetime s
56
CHAPTER 21 CELL MEMBRANE MECHANICS AND ADHESION copyRD Kamm 4615
τ0 - bond lifetime with zero force s σ - adhesion stress N μm-2 κ - spring constant for receptor-ligand bond N μm-1
57
CHAPTER 21 CELL MEMBRANE MECHANICS AND ADHESION copyRD Kamm 4615
References Bell G I (1978) Models for the specific adhesion of cells to cells Science 200 618-627 Caille N O Thoumine et al (2002) Contribution of the nucleus to the mechanical properties
of endothelial cells J Biomech 35(2) 177-87 Chang K C D F Tees et al (2000) The state diagram for cell adhesion under flow
leukocyte rolling and firm adhesion Proc Natl Acad Sci U S A 97(21) 11262-7 Dai J and M P Sheetz (1998) Cell membrane mechanics Methods Cell Biol 55 157-71 Dai J and M P Sheetz (1999) Membrane tether formation from blebbing cells Biophys J
77(6) 3363-70 Daily Elson et al (1984) Determination of the elastic area compressibility modulus of the
erythrocyte membrane Biophys J 45(4) 671-682 Evans E and K Ritchie (1997) Dynamic strength of molecular adhesion bonds Biophys J
72(4) 1541-55 Evans E A (1983) Bending elastic modulus of red blood cell membrane derived from
buckling instability in micropipet aspiration tests Biophys J 43(1) 27-30 Hammer D A and S M Apte (1992) Simulation of cell rolling and adhesion on surfaces in
shear flow general results and analysis of selectin-mediated neutrophil adhesion Biophys J 63(1) 35-57
Hardt S L (1979) Rates of diffusion controlled reactions in one two and three dimensions Biophysical Chemistry 10 239-243
Hochmuth F M J Y Shao et al (1996) Deformation and flow of membrane into tethers extracted from neuronal growth cones Biophys J 70(1) 358-69
Kucik D F E L Elson et al (1999) Weak dependence of mobility of membrane protein aggregates on aggregate size supports a viscous model of retardation of diffusion Biophys J 76(1 Pt 1) 314-22
Kusumi A Y Sako et al (1993) Confined lateral diffusion of membrane receptors as studied by single particle tracking (nanovid microscopy) Effects of calcium-induced differentiation in cultured epithelial cells Biophys J 65(5) 2021-40
Lehenkari P P and M A Horton (1999) Single integrin molecule adhesion forces in intact cells measured by atomic force microscopy Biochem Biophys Res Commun 259(3) 645-50
McCloskey M and M M Poo (1984) Protein diffusion in cell membranes some biological implications Int Rev Cytol 87 19-81
Meleard P Gerbeaud C Bardusco N Mitov MD and Ferdandex-Puente L (1998) Mechanical properties of model membranes studied from shape transformations of giant vesicles Biochimie 80 401-413
Moy V T Y Jiao et al (1999) Adhesion energy of receptor-mediated interaction measured by elastic deformation Biophys J 76(3) 1632-8
Ra H J C Picart et al (1999) Muscle cell peeling from micropatterned collagen direct probing of focal and molecular properties of matrix adhesion J Cell Sci 112 ( Pt 10) 1425-36
Saffman P G (1976) Bownian motion in thin sheets of viscous fluid Journal of Fluid Mechanics 73 593-602
Schmidtke D W and S L Diamond (2000) Direct observation of membrane tethers formed during neutrophil attachment to platelets or P-selectin under physiological flow J Cell Biol 149(3) 719-30
Sheets E D R Simson et al (1995) New insights into membrane dynamics from the analysis of cell surface interactions by physical methods Curr Opin Cell Biol 7(5) 707-14
58
CHAPTER 21 CELL MEMBRANE MECHANICS AND ADHESION copyRD Kamm 4615
Vink H and B R Duling (1996) Identification of distinct luminal domains for macromolecules erythrocytes and leukocytes within mammalian capillaries Circ Res 79(3) 581-9
Waugh R and E A Evans (1979) Thermoelasticity of red blood cell membrane Biophys J 26(1) 115-31
Zeman K H Engelhard et al (1990) Bending undulations and elasticity of the erythrocyte membrane effects of cell shape and membrane organization Eur Biophys J 18(4) 203shy19
Zhelev D V D Needham et al (1994) Role of the membrane cortex in neutrophil deformation in small pipets Biophys J 67(2) 696-705
59
MIT OpenCourseWarehttpocwmitedu
20310J 3053J 6024J 2797J Molecular Cellular and Tissue BiomechanicsSpring 2015
For information about citing these materials or our Terms of Use visit httpocwmiteduterms

CHAPTER 21 CELL MEMBRANE MECHANICS AND ADHESION copyRD Kamm 4615
between neighboring bonds ( N minus1 2 C ) Under high tension the surfaces rapidly diverge and
spreading is prevented if the tension is sufficiently low receptor-ligand bonding can occur and spreading can occur
Measurements of adhesion
A variety of methods have been used to experimentally determine the strength of adhesion either
of individual receptor-ligand bonds or populations of bonds as in the case of entire cells
Whole cell experiments are more common and typically require less experimental
sophistication The drawback of course is that they provide only for estimates of average
properties and require certain assumptions regarding the distribution of cell-substrate adhesive
stress for interpretation to the level of a single bond Several of these methods are described
next
Centrifugal cell adhesion assays In this experiment cells are allowed to attached to a substrate
then are placed in a centrifuge rotating at speed ω positioned a distance r from the center of
rotation and oriented so that the net centrifugal force is acting to separate the cell from the
substrate Using the arrangement shown in Fig 3116 (right) the acceleration of the cells is 2ω r and the net force acting on a cell of volume Vc is F = (ρc minus ρf )ω 2rVc where the fluid and cell densities are ρf and ρc respectively
Interpreting these results we can make several different assumptions each leading to a different estimate for the maximum force experienced by the binding complex If we simply assume that all receptor-ligand complexes support an equal fraction of the total force F then the force per bond is f = F (πa 2NC ) where NC is the concentration of bond complexes However as the cell tears away from the substrate the edge bonds will break first since these experience the greatest level of force An alternative approach then is to assume that the adhesion complexes around the cell circumference support the entire load leading to the estimate f = F 2( πaN 1 2 ) recognizing that N1 2
C C is the average distance between bonds A somewhatmore accurate value for f might be obtained if we assume that all complexes within the distance w given by eqn (278) support the load In any of these cases once the centrifugal force exceeds some critical limit since the number of receptors supporting the load falls as the region of contact becomes smaller the force per bond increases and the cell will rapidly detach
Stochastic variability also needs to be taken into account however since even under a constant load any single bond has a finite probability of failure under a given level of force The equilibrium state of the cell then should be viewed as one in which the rate of bond formation equals the rate of bond breakage with increasing force having the effect of reducing the
49
CHAPTER 21 CELL MEMBRANE MECHANICS AND ADHESION copyRD Kamm 4615
probability that the bond will remain intact These effects can be addressed using the methods described in more detail in Chapter xx Parallel flow assay Another common method for assessing cell adhesion is to plate the cells onto one wall of a parallel flow chamber subject them to a fluid dynamic shear stress and observe at what flow rate the cells begin to release If we ignore flow details in the immediate vicinity of the cell the shear stress can be estimated from the solution for a fully developed (Poiseuille) velocity profile
3V ⎡ y2
⎛ ⎞ ⎤v(y) = ⎢1minus ⎥ (279)
2 ⎝ ⎠ ⎣ ⎢ h ⎥⎦
so that the shear stress acting on the cell is
⎛ dv ⎞ 6μV τw = μ⎜ ⎟ = (280)
⎝ dy ⎠ h y = minush
and the total force can be estimated as F asymp τw Ac where Ac is the surface area of the cell membrane exposed to the flow Consider as an example a flow of culture medium at a rate of 1 mls through a channel of height 01 cm and width 1 cm If the culture medium has a viscosity close to that of water (μ=001 dyns) the shear stress is obtained from eqn (280)
6 sdot (001dyn sdot s) sdot (1ml s) ( 01 sdot10cm2 )τ dyn cm 2w = = 6 = 06Pa
01cm This corresponds roughly with the level of shear stress experience by endothelial cells in the arterial system If we consider that the cell has a surface area with dimensions roughly 100 μm x 10 μm or about 103 μm2 then the total force acting on the cell is obtained by integrating the shear stress over the area of the apical membrane Assuming that the shear stress is uniform the force is simply the product of shear stress and surface area or about 1 nN in the present example Again interpretation of results from such experiments requires careful consideration of the distribution of forces among the individual adhesion complexes In this situation the cell is likely to peel from the upstream edge in much the same manner as occurs in the cell peeling experiment discussed earlier
50
CHAPTER 21 CELL MEMBRANE MECHANICS AND ADHESION copyRD Kamm 4615
Radial flow and spinning disk assays One disadvantage of the parallel flow assay is that all cells are subjected to essentially the same level of shear stress so the flow rate needs to be incrementally varied in order to determine the level of force required for detachment These two systems using an axisymmetric geometry circumvent this problem by producing an easily characterized radial variation in shear stress In the case of the radial flow assay fluid enters through a central channel and flows radially outward through the narrow gap between two circular plates From conservation of mass the mean flow velocity is given by
QV = (281)
2πrh and sufficiently far from the center (rgtgth) the velocity profile is parabolic as in the parallel flow assay and the shear stress is again governed by eqn (280) using (281) for V Q
ω
(Not to scale)
v
h h
Cell layer rc Ce l l layer rc
r r
Fig 3116 Schematic diagram showing the radial flow assay (left) and the spinning disk assay (right) In the radial flow assay shear stress attains a maximum value near the center and falls with increasing radius r whereas in the spinning disk system maximum shear stress is experienced at large r In the spinning disk assay cells are grown on one disk and the opposite disk is rotated at constant speed Provided the rate of rotation is sufficiently small that inertial effects can be neglected the velocity is purely in the circumferential direction and the profile is linear between the two plates so that the shear stress experienced by the cells can easily be computed as
ωr τw = μ (282)
h
51
CHAPTER 21 CELL MEMBRANE MECHANICS AND ADHESION copyRD Kamm 4615
In both of these cases as in the parallel flow assay the total force is obtained by integrating the shear stress over the cell surface and the distribution of force among the adhesion complexes is weighted toward those located near the upstream end of the cell This can also be seen by consideration of the torque exerted by shear stress on the cell that must be balanced by a nonshyuniform contact stress with the substrate that is greatest near the upstream end Single bond adhesion assays Two other assays provide a means of obtaining estimates for the strength of a single adhesion bond without the need for excessive interpretation These rely on an ability to isolate a small number of bonds or even a single bond and infer bond strength from the step-wise nature of the de-adhesion process associated with breakage of discrete bonds One of these methods employs the atomic force microscope coated with the ligand of an adhesion receptor as shown in Fig 3117 The probe tip is gradually brought up to the cell surface until one or more receptor-ligand bonds are formed When the probe tip is withdrawn it moves along a different trajectory on a force-displacement plot reflecting the forces of adhesion These forces are seen to jump between more or less discrete levels as the probe continues to be moved away from the cell with each jump corresponding to the breakage of a single bond (Fig 3117) Using this method the bond strength between integrin receptor and a variety of RGD-containing ligands was found to lie in the range of 30 to 100 pN (Lehenkari and Horton 1999)
Fig 3117 The strength of a single adhesion bond can be measured by bringing a functionalized tip of an AFM probe up to the cell allowing bonds to form then slowly withdrawing the probe Monitoring the differences between the force displacement curve between the forward and reverse motions the forces necessary to break a single receptor-ligand bond can be determined [Reproduced from (Lehenkari and Horton 1999)]
52
CHAPTER 21 CELL MEMBRANE MECHANICS AND ADHESION copyRD Kamm 4615
A second method is similar in that the discrete increments in force are monitored as individual receptor-ligand bonds are broken but the forces are measured by means of changes in the shape of a giant vesicle the membrane of which contains the ligands have been inserted In this case one vesicle is made effectively rigid due for example to a high surface tension A second vesicle containing the adhesion molecules is also drawn partially into a micropipet but is much more complaint than the first The two vesicles are then brought into point contact so that one or a small number of adhesions are formed As the pipets are moved apart the compliant vesicle distorts due to the force of adhesion which it can be shown is related to the change in dimension of the vesicle in the direction of the force thereby serving as a sensitive force transducer measuring forces in the range of single adhesion receptors or between 1 and 100 pN [Evans 1991 37]
(For specific examples of leukocyte rolling and attachment see Orsello or Chang amp Hammer)
[This process is initiated for example by local infection that causes the release of
chemotactic agents in addition to cytokines hellip
Models of this process draw upon many of the concepts discussed in this chapter ]
Transient cell adhesion
Concepts of transient adhesion and release are of particular importance in the case of leukocyte
rolling adhesion and transmigration across the endothelial layer of a blood vessel In addition
cell migration through extracellular matrix or along a substrate requires the ability of the cell to
both form and release adhesions
One problem that has received considerable attention is the interaction between an
adherent or rolling leukocyte and the adhesion receptors on the endothelium These studies are
complicated by the three-dimensional nature of the flow the compliance of the interacting
surfaces and receptor-ligand dynamics In a series of recent studies Hammer and co-workers
(Chang Tees et al 2000) have addressed several of these issues computing the viscous force
and torque acting upon a sphere near to planar wall from the mobility matrix (Hammer and Apte
1992) and using the ldquoBell modelrdquo of receptor binding (Bell 1978) but neglecting the effects of
cell deformation The Bell model relates the dissociation rate constant kr to the force in the
bond f the thermal energy kBT and a parameter with units of length that depends on the
reactivity of the molecule
kr = ko r exp(γf kBT ) (283)
53
CHAPTER 21 CELL MEMBRANE MECHANICS AND ADHESION copyRD Kamm 4615
A Monte Carlo method is employed at each time step in the calculation to determine bond
formation or breakage In these studies the nature of the leukocyte-endothelial interaction is
characterized as firm adhesion rolling adhesion bimodal adhesion or no adhesion and mapped
as a function of the two parameters of the Bell model in Fig 3 The boundaries of the rolling
adhesion regime are identified for a wall shear rate of 100 s-1 (dotted lines) or 30 and 400 s-1
(solid lines) Most literature values for the Bell model parameters for a variety of selectin
receptors (known to be instrumental in leukocyte rolling) correspond to the rolling adhesion
regime for typical shear rate of 100 s-1 An interesting but counterintuitive result from this study
was the observation that as the bond stiffness was increased from the value used in most
calculations (100 dyne cm-1) adhesiveness decreased which the authors attribute to reduced
deflection for a given level of force leading subsequently to more rapid dissociation
Fig 3118 The state diagram for a leukocyte interacting with an endothelial surface for shear rates ranging from 30 to 400 s-1 For low dissociation rates the leukocyte remains adherent to the surface (lower left) As either (γ) or ( ko
r ) [see Eqn (283) for definitions] is increased the cell first adheres firmly then rolls along the wall then completely detaches (upper right) Rolling adhesion is defined as the regime where rolling occurs over some part of the shear rate range between 30 and 400 s-1 Firm adhesion indicates that cells remain attached even at the highest shear rate no adhesion indicates that cells roll at a velocity gt 50 of the velocity of a non-adherent sphere In the bimodal regime cells are either adherent or non-adherent and do not exhibit rolling Dotted curves correspond to these same boundaries for a shear rate of 100 s-1 Reproduced from Chang et al (2000)
54
CHAPTER 21 CELL MEMBRANE MECHANICS AND ADHESION copyRD Kamm 4615
In another recent study using high-resolution video-microscopy (Schmidtke and Diamond
2000) it was demonstrated that a flowing neutrophil can attach to an adherent platelet via
adhesion molecules located in the tips of the microvilli and form long tethers averaging nearly 10
μm in length but ranging up to 40 μm at extensional rates of 6-40 μm s-1 for shear rates ranging
from 100-250 s-1 The mechanics of tether formation is itself a fascinating topic that is still under
intense investigation Readers interested in pursuing this work in more detail are referred to the
several papers (Hochmuth Shao et al 1996 Dai and Sheetz 1998 Dai and Sheetz 1999) that
identify a number of intriguing phenomena
55
CHAPTER 21 CELL MEMBRANE MECHANICS AND ADHESION copyRD Kamm 4615
317 Nomenclature Parameter Definition Units
R - receptor
L - ligand
C - receptor-ligand complex
G - Gibbs free energy Nm
N - membrane tension Nm
NR - total receptor density -3μm-2 in 2D or μm in 3D NL - total ligand density μm-2 in 2D or μm-3 in 3D N in 2D or μm-3μm-2
C - complex density in 3D NRf - free receptor density m-2 in 2D or m-3μ μ in 3D NLf - free ligand density -2 -3μm in 2D or μm in 3D d+ - forward diffusional rate constant 2 -1μm s-1 in 2D or 3 μm s in 3D d -1
- - reverse diffusional rate constant s r+ - forward reaction rate constant s-1
r- - reverse reaction rate constant s-1 D 2 -1
m - membrane diffusion coefficient μm s D - solution diffusion coefficient m2 s -1s μ Kb - bending stiffness Nm K 0 - equilibrium constant or affinity (zero force) M-1 in 3D and 2μm in 2D = k0
+ k0 minus
K - equilibrium constant M-1 in 3D and m2μ in 2D = k+kshy
k0 - association rate constant (zero force) M-1 s-1 in 3D or m-2 -1+ μ s in 2D
k0 - dissociation rate constant (zero force) s-1 minus
k - association rate constant M-1 s-1 in 3D or m-2 -1+ μ s in 2D
kminus - dissociation rate constant s-1 f - force per bond N F - total adhesion force N γ - empirical parameter μm r0 - distance over which energy minimum acts μm E0 - bond energy J k JK-1
B - Boltzmanns constant T - temperature K τ - bond lifetime s
56
CHAPTER 21 CELL MEMBRANE MECHANICS AND ADHESION copyRD Kamm 4615
τ0 - bond lifetime with zero force s σ - adhesion stress N μm-2 κ - spring constant for receptor-ligand bond N μm-1
57
CHAPTER 21 CELL MEMBRANE MECHANICS AND ADHESION copyRD Kamm 4615
References Bell G I (1978) Models for the specific adhesion of cells to cells Science 200 618-627 Caille N O Thoumine et al (2002) Contribution of the nucleus to the mechanical properties
of endothelial cells J Biomech 35(2) 177-87 Chang K C D F Tees et al (2000) The state diagram for cell adhesion under flow
leukocyte rolling and firm adhesion Proc Natl Acad Sci U S A 97(21) 11262-7 Dai J and M P Sheetz (1998) Cell membrane mechanics Methods Cell Biol 55 157-71 Dai J and M P Sheetz (1999) Membrane tether formation from blebbing cells Biophys J
77(6) 3363-70 Daily Elson et al (1984) Determination of the elastic area compressibility modulus of the
erythrocyte membrane Biophys J 45(4) 671-682 Evans E and K Ritchie (1997) Dynamic strength of molecular adhesion bonds Biophys J
72(4) 1541-55 Evans E A (1983) Bending elastic modulus of red blood cell membrane derived from
buckling instability in micropipet aspiration tests Biophys J 43(1) 27-30 Hammer D A and S M Apte (1992) Simulation of cell rolling and adhesion on surfaces in
shear flow general results and analysis of selectin-mediated neutrophil adhesion Biophys J 63(1) 35-57
Hardt S L (1979) Rates of diffusion controlled reactions in one two and three dimensions Biophysical Chemistry 10 239-243
Hochmuth F M J Y Shao et al (1996) Deformation and flow of membrane into tethers extracted from neuronal growth cones Biophys J 70(1) 358-69
Kucik D F E L Elson et al (1999) Weak dependence of mobility of membrane protein aggregates on aggregate size supports a viscous model of retardation of diffusion Biophys J 76(1 Pt 1) 314-22
Kusumi A Y Sako et al (1993) Confined lateral diffusion of membrane receptors as studied by single particle tracking (nanovid microscopy) Effects of calcium-induced differentiation in cultured epithelial cells Biophys J 65(5) 2021-40
Lehenkari P P and M A Horton (1999) Single integrin molecule adhesion forces in intact cells measured by atomic force microscopy Biochem Biophys Res Commun 259(3) 645-50
McCloskey M and M M Poo (1984) Protein diffusion in cell membranes some biological implications Int Rev Cytol 87 19-81
Meleard P Gerbeaud C Bardusco N Mitov MD and Ferdandex-Puente L (1998) Mechanical properties of model membranes studied from shape transformations of giant vesicles Biochimie 80 401-413
Moy V T Y Jiao et al (1999) Adhesion energy of receptor-mediated interaction measured by elastic deformation Biophys J 76(3) 1632-8
Ra H J C Picart et al (1999) Muscle cell peeling from micropatterned collagen direct probing of focal and molecular properties of matrix adhesion J Cell Sci 112 ( Pt 10) 1425-36
Saffman P G (1976) Bownian motion in thin sheets of viscous fluid Journal of Fluid Mechanics 73 593-602
Schmidtke D W and S L Diamond (2000) Direct observation of membrane tethers formed during neutrophil attachment to platelets or P-selectin under physiological flow J Cell Biol 149(3) 719-30
Sheets E D R Simson et al (1995) New insights into membrane dynamics from the analysis of cell surface interactions by physical methods Curr Opin Cell Biol 7(5) 707-14
58
CHAPTER 21 CELL MEMBRANE MECHANICS AND ADHESION copyRD Kamm 4615
Vink H and B R Duling (1996) Identification of distinct luminal domains for macromolecules erythrocytes and leukocytes within mammalian capillaries Circ Res 79(3) 581-9
Waugh R and E A Evans (1979) Thermoelasticity of red blood cell membrane Biophys J 26(1) 115-31
Zeman K H Engelhard et al (1990) Bending undulations and elasticity of the erythrocyte membrane effects of cell shape and membrane organization Eur Biophys J 18(4) 203shy19
Zhelev D V D Needham et al (1994) Role of the membrane cortex in neutrophil deformation in small pipets Biophys J 67(2) 696-705
59
MIT OpenCourseWarehttpocwmitedu
20310J 3053J 6024J 2797J Molecular Cellular and Tissue BiomechanicsSpring 2015
For information about citing these materials or our Terms of Use visit httpocwmiteduterms
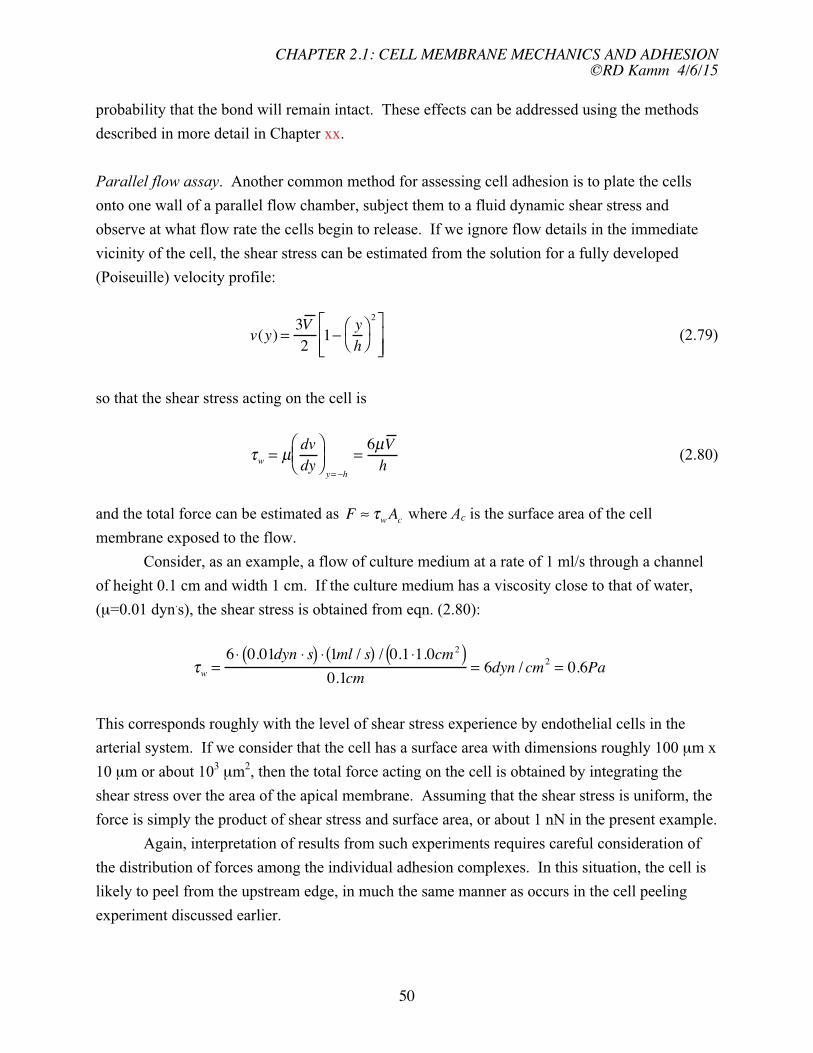
CHAPTER 21 CELL MEMBRANE MECHANICS AND ADHESION copyRD Kamm 4615
probability that the bond will remain intact These effects can be addressed using the methods described in more detail in Chapter xx Parallel flow assay Another common method for assessing cell adhesion is to plate the cells onto one wall of a parallel flow chamber subject them to a fluid dynamic shear stress and observe at what flow rate the cells begin to release If we ignore flow details in the immediate vicinity of the cell the shear stress can be estimated from the solution for a fully developed (Poiseuille) velocity profile
3V ⎡ y2
⎛ ⎞ ⎤v(y) = ⎢1minus ⎥ (279)
2 ⎝ ⎠ ⎣ ⎢ h ⎥⎦
so that the shear stress acting on the cell is
⎛ dv ⎞ 6μV τw = μ⎜ ⎟ = (280)
⎝ dy ⎠ h y = minush
and the total force can be estimated as F asymp τw Ac where Ac is the surface area of the cell membrane exposed to the flow Consider as an example a flow of culture medium at a rate of 1 mls through a channel of height 01 cm and width 1 cm If the culture medium has a viscosity close to that of water (μ=001 dyns) the shear stress is obtained from eqn (280)
6 sdot (001dyn sdot s) sdot (1ml s) ( 01 sdot10cm2 )τ dyn cm 2w = = 6 = 06Pa
01cm This corresponds roughly with the level of shear stress experience by endothelial cells in the arterial system If we consider that the cell has a surface area with dimensions roughly 100 μm x 10 μm or about 103 μm2 then the total force acting on the cell is obtained by integrating the shear stress over the area of the apical membrane Assuming that the shear stress is uniform the force is simply the product of shear stress and surface area or about 1 nN in the present example Again interpretation of results from such experiments requires careful consideration of the distribution of forces among the individual adhesion complexes In this situation the cell is likely to peel from the upstream edge in much the same manner as occurs in the cell peeling experiment discussed earlier
50
CHAPTER 21 CELL MEMBRANE MECHANICS AND ADHESION copyRD Kamm 4615
Radial flow and spinning disk assays One disadvantage of the parallel flow assay is that all cells are subjected to essentially the same level of shear stress so the flow rate needs to be incrementally varied in order to determine the level of force required for detachment These two systems using an axisymmetric geometry circumvent this problem by producing an easily characterized radial variation in shear stress In the case of the radial flow assay fluid enters through a central channel and flows radially outward through the narrow gap between two circular plates From conservation of mass the mean flow velocity is given by
QV = (281)
2πrh and sufficiently far from the center (rgtgth) the velocity profile is parabolic as in the parallel flow assay and the shear stress is again governed by eqn (280) using (281) for V Q
ω
(Not to scale)
v
h h
Cell layer rc Ce l l layer rc
r r
Fig 3116 Schematic diagram showing the radial flow assay (left) and the spinning disk assay (right) In the radial flow assay shear stress attains a maximum value near the center and falls with increasing radius r whereas in the spinning disk system maximum shear stress is experienced at large r In the spinning disk assay cells are grown on one disk and the opposite disk is rotated at constant speed Provided the rate of rotation is sufficiently small that inertial effects can be neglected the velocity is purely in the circumferential direction and the profile is linear between the two plates so that the shear stress experienced by the cells can easily be computed as
ωr τw = μ (282)
h
51
CHAPTER 21 CELL MEMBRANE MECHANICS AND ADHESION copyRD Kamm 4615
In both of these cases as in the parallel flow assay the total force is obtained by integrating the shear stress over the cell surface and the distribution of force among the adhesion complexes is weighted toward those located near the upstream end of the cell This can also be seen by consideration of the torque exerted by shear stress on the cell that must be balanced by a nonshyuniform contact stress with the substrate that is greatest near the upstream end Single bond adhesion assays Two other assays provide a means of obtaining estimates for the strength of a single adhesion bond without the need for excessive interpretation These rely on an ability to isolate a small number of bonds or even a single bond and infer bond strength from the step-wise nature of the de-adhesion process associated with breakage of discrete bonds One of these methods employs the atomic force microscope coated with the ligand of an adhesion receptor as shown in Fig 3117 The probe tip is gradually brought up to the cell surface until one or more receptor-ligand bonds are formed When the probe tip is withdrawn it moves along a different trajectory on a force-displacement plot reflecting the forces of adhesion These forces are seen to jump between more or less discrete levels as the probe continues to be moved away from the cell with each jump corresponding to the breakage of a single bond (Fig 3117) Using this method the bond strength between integrin receptor and a variety of RGD-containing ligands was found to lie in the range of 30 to 100 pN (Lehenkari and Horton 1999)
Fig 3117 The strength of a single adhesion bond can be measured by bringing a functionalized tip of an AFM probe up to the cell allowing bonds to form then slowly withdrawing the probe Monitoring the differences between the force displacement curve between the forward and reverse motions the forces necessary to break a single receptor-ligand bond can be determined [Reproduced from (Lehenkari and Horton 1999)]
52
CHAPTER 21 CELL MEMBRANE MECHANICS AND ADHESION copyRD Kamm 4615
A second method is similar in that the discrete increments in force are monitored as individual receptor-ligand bonds are broken but the forces are measured by means of changes in the shape of a giant vesicle the membrane of which contains the ligands have been inserted In this case one vesicle is made effectively rigid due for example to a high surface tension A second vesicle containing the adhesion molecules is also drawn partially into a micropipet but is much more complaint than the first The two vesicles are then brought into point contact so that one or a small number of adhesions are formed As the pipets are moved apart the compliant vesicle distorts due to the force of adhesion which it can be shown is related to the change in dimension of the vesicle in the direction of the force thereby serving as a sensitive force transducer measuring forces in the range of single adhesion receptors or between 1 and 100 pN [Evans 1991 37]
(For specific examples of leukocyte rolling and attachment see Orsello or Chang amp Hammer)
[This process is initiated for example by local infection that causes the release of
chemotactic agents in addition to cytokines hellip
Models of this process draw upon many of the concepts discussed in this chapter ]
Transient cell adhesion
Concepts of transient adhesion and release are of particular importance in the case of leukocyte
rolling adhesion and transmigration across the endothelial layer of a blood vessel In addition
cell migration through extracellular matrix or along a substrate requires the ability of the cell to
both form and release adhesions
One problem that has received considerable attention is the interaction between an
adherent or rolling leukocyte and the adhesion receptors on the endothelium These studies are
complicated by the three-dimensional nature of the flow the compliance of the interacting
surfaces and receptor-ligand dynamics In a series of recent studies Hammer and co-workers
(Chang Tees et al 2000) have addressed several of these issues computing the viscous force
and torque acting upon a sphere near to planar wall from the mobility matrix (Hammer and Apte
1992) and using the ldquoBell modelrdquo of receptor binding (Bell 1978) but neglecting the effects of
cell deformation The Bell model relates the dissociation rate constant kr to the force in the
bond f the thermal energy kBT and a parameter with units of length that depends on the
reactivity of the molecule
kr = ko r exp(γf kBT ) (283)
53
CHAPTER 21 CELL MEMBRANE MECHANICS AND ADHESION copyRD Kamm 4615
A Monte Carlo method is employed at each time step in the calculation to determine bond
formation or breakage In these studies the nature of the leukocyte-endothelial interaction is
characterized as firm adhesion rolling adhesion bimodal adhesion or no adhesion and mapped
as a function of the two parameters of the Bell model in Fig 3 The boundaries of the rolling
adhesion regime are identified for a wall shear rate of 100 s-1 (dotted lines) or 30 and 400 s-1
(solid lines) Most literature values for the Bell model parameters for a variety of selectin
receptors (known to be instrumental in leukocyte rolling) correspond to the rolling adhesion
regime for typical shear rate of 100 s-1 An interesting but counterintuitive result from this study
was the observation that as the bond stiffness was increased from the value used in most
calculations (100 dyne cm-1) adhesiveness decreased which the authors attribute to reduced
deflection for a given level of force leading subsequently to more rapid dissociation
Fig 3118 The state diagram for a leukocyte interacting with an endothelial surface for shear rates ranging from 30 to 400 s-1 For low dissociation rates the leukocyte remains adherent to the surface (lower left) As either (γ) or ( ko
r ) [see Eqn (283) for definitions] is increased the cell first adheres firmly then rolls along the wall then completely detaches (upper right) Rolling adhesion is defined as the regime where rolling occurs over some part of the shear rate range between 30 and 400 s-1 Firm adhesion indicates that cells remain attached even at the highest shear rate no adhesion indicates that cells roll at a velocity gt 50 of the velocity of a non-adherent sphere In the bimodal regime cells are either adherent or non-adherent and do not exhibit rolling Dotted curves correspond to these same boundaries for a shear rate of 100 s-1 Reproduced from Chang et al (2000)
54
CHAPTER 21 CELL MEMBRANE MECHANICS AND ADHESION copyRD Kamm 4615
In another recent study using high-resolution video-microscopy (Schmidtke and Diamond
2000) it was demonstrated that a flowing neutrophil can attach to an adherent platelet via
adhesion molecules located in the tips of the microvilli and form long tethers averaging nearly 10
μm in length but ranging up to 40 μm at extensional rates of 6-40 μm s-1 for shear rates ranging
from 100-250 s-1 The mechanics of tether formation is itself a fascinating topic that is still under
intense investigation Readers interested in pursuing this work in more detail are referred to the
several papers (Hochmuth Shao et al 1996 Dai and Sheetz 1998 Dai and Sheetz 1999) that
identify a number of intriguing phenomena
55
CHAPTER 21 CELL MEMBRANE MECHANICS AND ADHESION copyRD Kamm 4615
317 Nomenclature Parameter Definition Units
R - receptor
L - ligand
C - receptor-ligand complex
G - Gibbs free energy Nm
N - membrane tension Nm
NR - total receptor density -3μm-2 in 2D or μm in 3D NL - total ligand density μm-2 in 2D or μm-3 in 3D N in 2D or μm-3μm-2
C - complex density in 3D NRf - free receptor density m-2 in 2D or m-3μ μ in 3D NLf - free ligand density -2 -3μm in 2D or μm in 3D d+ - forward diffusional rate constant 2 -1μm s-1 in 2D or 3 μm s in 3D d -1
- - reverse diffusional rate constant s r+ - forward reaction rate constant s-1
r- - reverse reaction rate constant s-1 D 2 -1
m - membrane diffusion coefficient μm s D - solution diffusion coefficient m2 s -1s μ Kb - bending stiffness Nm K 0 - equilibrium constant or affinity (zero force) M-1 in 3D and 2μm in 2D = k0
+ k0 minus
K - equilibrium constant M-1 in 3D and m2μ in 2D = k+kshy
k0 - association rate constant (zero force) M-1 s-1 in 3D or m-2 -1+ μ s in 2D
k0 - dissociation rate constant (zero force) s-1 minus
k - association rate constant M-1 s-1 in 3D or m-2 -1+ μ s in 2D
kminus - dissociation rate constant s-1 f - force per bond N F - total adhesion force N γ - empirical parameter μm r0 - distance over which energy minimum acts μm E0 - bond energy J k JK-1
B - Boltzmanns constant T - temperature K τ - bond lifetime s
56
CHAPTER 21 CELL MEMBRANE MECHANICS AND ADHESION copyRD Kamm 4615
τ0 - bond lifetime with zero force s σ - adhesion stress N μm-2 κ - spring constant for receptor-ligand bond N μm-1
57
CHAPTER 21 CELL MEMBRANE MECHANICS AND ADHESION copyRD Kamm 4615
References Bell G I (1978) Models for the specific adhesion of cells to cells Science 200 618-627 Caille N O Thoumine et al (2002) Contribution of the nucleus to the mechanical properties
of endothelial cells J Biomech 35(2) 177-87 Chang K C D F Tees et al (2000) The state diagram for cell adhesion under flow
leukocyte rolling and firm adhesion Proc Natl Acad Sci U S A 97(21) 11262-7 Dai J and M P Sheetz (1998) Cell membrane mechanics Methods Cell Biol 55 157-71 Dai J and M P Sheetz (1999) Membrane tether formation from blebbing cells Biophys J
77(6) 3363-70 Daily Elson et al (1984) Determination of the elastic area compressibility modulus of the
erythrocyte membrane Biophys J 45(4) 671-682 Evans E and K Ritchie (1997) Dynamic strength of molecular adhesion bonds Biophys J
72(4) 1541-55 Evans E A (1983) Bending elastic modulus of red blood cell membrane derived from
buckling instability in micropipet aspiration tests Biophys J 43(1) 27-30 Hammer D A and S M Apte (1992) Simulation of cell rolling and adhesion on surfaces in
shear flow general results and analysis of selectin-mediated neutrophil adhesion Biophys J 63(1) 35-57
Hardt S L (1979) Rates of diffusion controlled reactions in one two and three dimensions Biophysical Chemistry 10 239-243
Hochmuth F M J Y Shao et al (1996) Deformation and flow of membrane into tethers extracted from neuronal growth cones Biophys J 70(1) 358-69
Kucik D F E L Elson et al (1999) Weak dependence of mobility of membrane protein aggregates on aggregate size supports a viscous model of retardation of diffusion Biophys J 76(1 Pt 1) 314-22
Kusumi A Y Sako et al (1993) Confined lateral diffusion of membrane receptors as studied by single particle tracking (nanovid microscopy) Effects of calcium-induced differentiation in cultured epithelial cells Biophys J 65(5) 2021-40
Lehenkari P P and M A Horton (1999) Single integrin molecule adhesion forces in intact cells measured by atomic force microscopy Biochem Biophys Res Commun 259(3) 645-50
McCloskey M and M M Poo (1984) Protein diffusion in cell membranes some biological implications Int Rev Cytol 87 19-81
Meleard P Gerbeaud C Bardusco N Mitov MD and Ferdandex-Puente L (1998) Mechanical properties of model membranes studied from shape transformations of giant vesicles Biochimie 80 401-413
Moy V T Y Jiao et al (1999) Adhesion energy of receptor-mediated interaction measured by elastic deformation Biophys J 76(3) 1632-8
Ra H J C Picart et al (1999) Muscle cell peeling from micropatterned collagen direct probing of focal and molecular properties of matrix adhesion J Cell Sci 112 ( Pt 10) 1425-36
Saffman P G (1976) Bownian motion in thin sheets of viscous fluid Journal of Fluid Mechanics 73 593-602
Schmidtke D W and S L Diamond (2000) Direct observation of membrane tethers formed during neutrophil attachment to platelets or P-selectin under physiological flow J Cell Biol 149(3) 719-30
Sheets E D R Simson et al (1995) New insights into membrane dynamics from the analysis of cell surface interactions by physical methods Curr Opin Cell Biol 7(5) 707-14
58
CHAPTER 21 CELL MEMBRANE MECHANICS AND ADHESION copyRD Kamm 4615
Vink H and B R Duling (1996) Identification of distinct luminal domains for macromolecules erythrocytes and leukocytes within mammalian capillaries Circ Res 79(3) 581-9
Waugh R and E A Evans (1979) Thermoelasticity of red blood cell membrane Biophys J 26(1) 115-31
Zeman K H Engelhard et al (1990) Bending undulations and elasticity of the erythrocyte membrane effects of cell shape and membrane organization Eur Biophys J 18(4) 203shy19
Zhelev D V D Needham et al (1994) Role of the membrane cortex in neutrophil deformation in small pipets Biophys J 67(2) 696-705
59
MIT OpenCourseWarehttpocwmitedu
20310J 3053J 6024J 2797J Molecular Cellular and Tissue BiomechanicsSpring 2015
For information about citing these materials or our Terms of Use visit httpocwmiteduterms
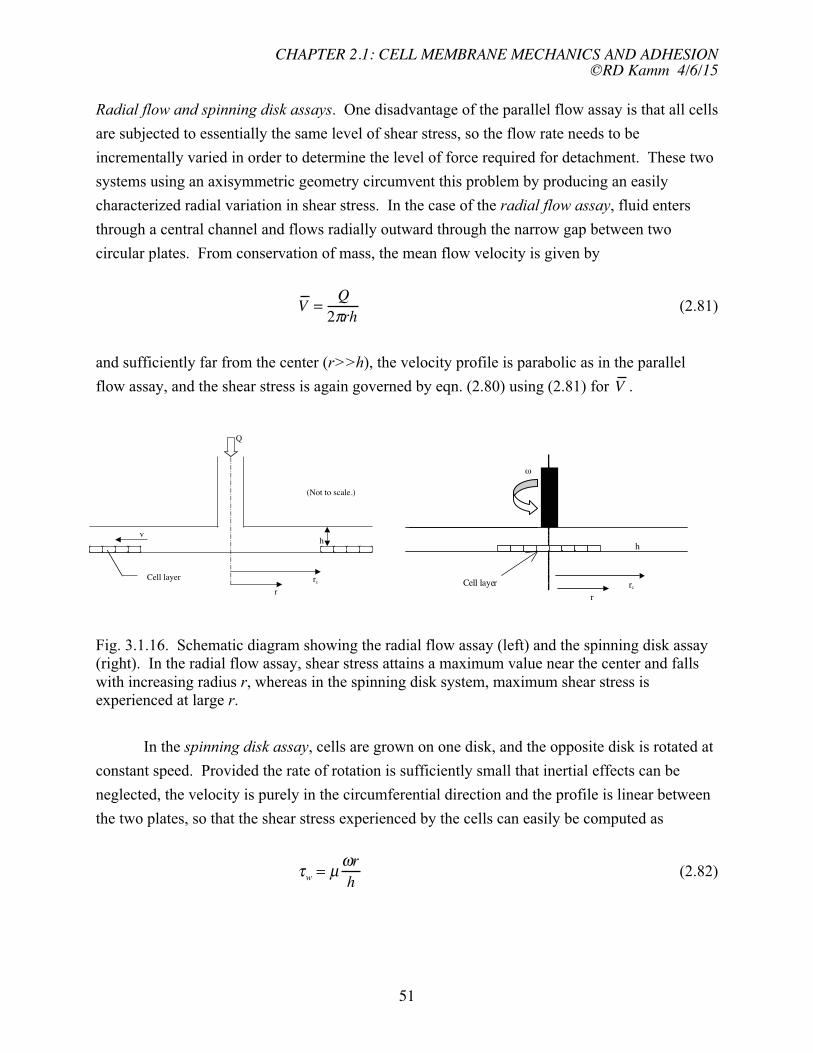
CHAPTER 21 CELL MEMBRANE MECHANICS AND ADHESION copyRD Kamm 4615
317 Nomenclature Parameter Definition Units
R - receptor
L - ligand
C - receptor-ligand complex
G - Gibbs free energy Nm
N - membrane tension Nm
NR - total receptor density -3μm-2 in 2D or μm in 3D NL - total ligand density μm-2 in 2D or μm-3 in 3D N in 2D or μm-3μm-2
C - complex density in 3D NRf - free receptor density m-2 in 2D or m-3μ μ in 3D NLf - free ligand density -2 -3μm in 2D or μm in 3D d+ - forward diffusional rate constant 2 -1μm s-1 in 2D or 3 μm s in 3D d -1
- - reverse diffusional rate constant s r+ - forward reaction rate constant s-1
r- - reverse reaction rate constant s-1 D 2 -1
m - membrane diffusion coefficient μm s D - solution diffusion coefficient m2 s -1s μ Kb - bending stiffness Nm K 0 - equilibrium constant or affinity (zero force) M-1 in 3D and 2μm in 2D = k0
+ k0 minus
K - equilibrium constant M-1 in 3D and m2μ in 2D = k+kshy
k0 - association rate constant (zero force) M-1 s-1 in 3D or m-2 -1+ μ s in 2D
k0 - dissociation rate constant (zero force) s-1 minus
k - association rate constant M-1 s-1 in 3D or m-2 -1+ μ s in 2D
kminus - dissociation rate constant s-1 f - force per bond N F - total adhesion force N γ - empirical parameter μm r0 - distance over which energy minimum acts μm E0 - bond energy J k JK-1
B - Boltzmanns constant T - temperature K τ - bond lifetime s
56
CHAPTER 21 CELL MEMBRANE MECHANICS AND ADHESION copyRD Kamm 4615
τ0 - bond lifetime with zero force s σ - adhesion stress N μm-2 κ - spring constant for receptor-ligand bond N μm-1
57
CHAPTER 21 CELL MEMBRANE MECHANICS AND ADHESION copyRD Kamm 4615
References Bell G I (1978) Models for the specific adhesion of cells to cells Science 200 618-627 Caille N O Thoumine et al (2002) Contribution of the nucleus to the mechanical properties
of endothelial cells J Biomech 35(2) 177-87 Chang K C D F Tees et al (2000) The state diagram for cell adhesion under flow
leukocyte rolling and firm adhesion Proc Natl Acad Sci U S A 97(21) 11262-7 Dai J and M P Sheetz (1998) Cell membrane mechanics Methods Cell Biol 55 157-71 Dai J and M P Sheetz (1999) Membrane tether formation from blebbing cells Biophys J
77(6) 3363-70 Daily Elson et al (1984) Determination of the elastic area compressibility modulus of the
erythrocyte membrane Biophys J 45(4) 671-682 Evans E and K Ritchie (1997) Dynamic strength of molecular adhesion bonds Biophys J
72(4) 1541-55 Evans E A (1983) Bending elastic modulus of red blood cell membrane derived from
buckling instability in micropipet aspiration tests Biophys J 43(1) 27-30 Hammer D A and S M Apte (1992) Simulation of cell rolling and adhesion on surfaces in
shear flow general results and analysis of selectin-mediated neutrophil adhesion Biophys J 63(1) 35-57
Hardt S L (1979) Rates of diffusion controlled reactions in one two and three dimensions Biophysical Chemistry 10 239-243
Hochmuth F M J Y Shao et al (1996) Deformation and flow of membrane into tethers extracted from neuronal growth cones Biophys J 70(1) 358-69
Kucik D F E L Elson et al (1999) Weak dependence of mobility of membrane protein aggregates on aggregate size supports a viscous model of retardation of diffusion Biophys J 76(1 Pt 1) 314-22
Kusumi A Y Sako et al (1993) Confined lateral diffusion of membrane receptors as studied by single particle tracking (nanovid microscopy) Effects of calcium-induced differentiation in cultured epithelial cells Biophys J 65(5) 2021-40
Lehenkari P P and M A Horton (1999) Single integrin molecule adhesion forces in intact cells measured by atomic force microscopy Biochem Biophys Res Commun 259(3) 645-50
McCloskey M and M M Poo (1984) Protein diffusion in cell membranes some biological implications Int Rev Cytol 87 19-81
Meleard P Gerbeaud C Bardusco N Mitov MD and Ferdandex-Puente L (1998) Mechanical properties of model membranes studied from shape transformations of giant vesicles Biochimie 80 401-413
Moy V T Y Jiao et al (1999) Adhesion energy of receptor-mediated interaction measured by elastic deformation Biophys J 76(3) 1632-8
Ra H J C Picart et al (1999) Muscle cell peeling from micropatterned collagen direct probing of focal and molecular properties of matrix adhesion J Cell Sci 112 ( Pt 10) 1425-36
Saffman P G (1976) Bownian motion in thin sheets of viscous fluid Journal of Fluid Mechanics 73 593-602
Schmidtke D W and S L Diamond (2000) Direct observation of membrane tethers formed during neutrophil attachment to platelets or P-selectin under physiological flow J Cell Biol 149(3) 719-30
Sheets E D R Simson et al (1995) New insights into membrane dynamics from the analysis of cell surface interactions by physical methods Curr Opin Cell Biol 7(5) 707-14
58
CHAPTER 21 CELL MEMBRANE MECHANICS AND ADHESION copyRD Kamm 4615
Vink H and B R Duling (1996) Identification of distinct luminal domains for macromolecules erythrocytes and leukocytes within mammalian capillaries Circ Res 79(3) 581-9
Waugh R and E A Evans (1979) Thermoelasticity of red blood cell membrane Biophys J 26(1) 115-31
Zeman K H Engelhard et al (1990) Bending undulations and elasticity of the erythrocyte membrane effects of cell shape and membrane organization Eur Biophys J 18(4) 203shy19
Zhelev D V D Needham et al (1994) Role of the membrane cortex in neutrophil deformation in small pipets Biophys J 67(2) 696-705
59
MIT OpenCourseWarehttpocwmitedu
20310J 3053J 6024J 2797J Molecular Cellular and Tissue BiomechanicsSpring 2015
For information about citing these materials or our Terms of Use visit httpocwmiteduterms
CHAPTER 21 CELL MEMBRANE MECHANICS AND ADHESION copyRD Kamm 4615
References Bell G I (1978) Models for the specific adhesion of cells to cells Science 200 618-627 Caille N O Thoumine et al (2002) Contribution of the nucleus to the mechanical properties
of endothelial cells J Biomech 35(2) 177-87 Chang K C D F Tees et al (2000) The state diagram for cell adhesion under flow
leukocyte rolling and firm adhesion Proc Natl Acad Sci U S A 97(21) 11262-7 Dai J and M P Sheetz (1998) Cell membrane mechanics Methods Cell Biol 55 157-71 Dai J and M P Sheetz (1999) Membrane tether formation from blebbing cells Biophys J
77(6) 3363-70 Daily Elson et al (1984) Determination of the elastic area compressibility modulus of the
erythrocyte membrane Biophys J 45(4) 671-682 Evans E and K Ritchie (1997) Dynamic strength of molecular adhesion bonds Biophys J
72(4) 1541-55 Evans E A (1983) Bending elastic modulus of red blood cell membrane derived from
buckling instability in micropipet aspiration tests Biophys J 43(1) 27-30 Hammer D A and S M Apte (1992) Simulation of cell rolling and adhesion on surfaces in
shear flow general results and analysis of selectin-mediated neutrophil adhesion Biophys J 63(1) 35-57
Hardt S L (1979) Rates of diffusion controlled reactions in one two and three dimensions Biophysical Chemistry 10 239-243
Hochmuth F M J Y Shao et al (1996) Deformation and flow of membrane into tethers extracted from neuronal growth cones Biophys J 70(1) 358-69
Kucik D F E L Elson et al (1999) Weak dependence of mobility of membrane protein aggregates on aggregate size supports a viscous model of retardation of diffusion Biophys J 76(1 Pt 1) 314-22
Kusumi A Y Sako et al (1993) Confined lateral diffusion of membrane receptors as studied by single particle tracking (nanovid microscopy) Effects of calcium-induced differentiation in cultured epithelial cells Biophys J 65(5) 2021-40
Lehenkari P P and M A Horton (1999) Single integrin molecule adhesion forces in intact cells measured by atomic force microscopy Biochem Biophys Res Commun 259(3) 645-50
McCloskey M and M M Poo (1984) Protein diffusion in cell membranes some biological implications Int Rev Cytol 87 19-81
Meleard P Gerbeaud C Bardusco N Mitov MD and Ferdandex-Puente L (1998) Mechanical properties of model membranes studied from shape transformations of giant vesicles Biochimie 80 401-413
Moy V T Y Jiao et al (1999) Adhesion energy of receptor-mediated interaction measured by elastic deformation Biophys J 76(3) 1632-8
Ra H J C Picart et al (1999) Muscle cell peeling from micropatterned collagen direct probing of focal and molecular properties of matrix adhesion J Cell Sci 112 ( Pt 10) 1425-36
Saffman P G (1976) Bownian motion in thin sheets of viscous fluid Journal of Fluid Mechanics 73 593-602
Schmidtke D W and S L Diamond (2000) Direct observation of membrane tethers formed during neutrophil attachment to platelets or P-selectin under physiological flow J Cell Biol 149(3) 719-30
Sheets E D R Simson et al (1995) New insights into membrane dynamics from the analysis of cell surface interactions by physical methods Curr Opin Cell Biol 7(5) 707-14
58
CHAPTER 21 CELL MEMBRANE MECHANICS AND ADHESION copyRD Kamm 4615
Vink H and B R Duling (1996) Identification of distinct luminal domains for macromolecules erythrocytes and leukocytes within mammalian capillaries Circ Res 79(3) 581-9
Waugh R and E A Evans (1979) Thermoelasticity of red blood cell membrane Biophys J 26(1) 115-31
Zeman K H Engelhard et al (1990) Bending undulations and elasticity of the erythrocyte membrane effects of cell shape and membrane organization Eur Biophys J 18(4) 203shy19
Zhelev D V D Needham et al (1994) Role of the membrane cortex in neutrophil deformation in small pipets Biophys J 67(2) 696-705
59
MIT OpenCourseWarehttpocwmitedu
20310J 3053J 6024J 2797J Molecular Cellular and Tissue BiomechanicsSpring 2015
For information about citing these materials or our Terms of Use visit httpocwmiteduterms

MIT OpenCourseWarehttpocwmitedu
20310J 3053J 6024J 2797J Molecular Cellular and Tissue BiomechanicsSpring 2015
For information about citing these materials or our Terms of Use visit httpocwmiteduterms
Related Documents