CHAPTER 20 pH Indicators Molecular Probes ™ Handbook A Guide to Fluorescent Probes and Labeling Technologies 11th Edition (2010) Molecular Probes Resources Molecular Probes Handbook (online version) Comprehensive guide to fluorescent probes and labeling technologies thermofisher.com/handbook Molecular Probes Fluorescence SpectraViewer Identify compatible sets of fluorescent dyes and cell structure probes thermofisher.com/spectraviewer BioProbes Journal of Cell Biology Applications Award-winning magazine highlighting cell biology products and applications thermofisher.com/bioprobes Access all Molecular Probes educational resources at thermofisher.com/probes

Welcome message from author
This document is posted to help you gain knowledge. Please leave a comment to let me know what you think about it! Share it to your friends and learn new things together.
Transcript

CHAPTER 20
pH Indicators
Molecular Probes™ HandbookA Guide to Fluorescent Probes and Labeling Technologies
11th Edition (2010)
CHAPTER 1
Fluorophores and Their Amine-Reactive Derivatives
The Molecular Probes® HandbookA GUIDE TO FLUORESCENT PROBES AND LABELING TECHNOLOGIES11th Edition (2010)
Molecular Probes® Resources
Molecular Probes® Handbook (online version)Comprehensive guide to �uorescent probes and labeling technologies
lifetechnologies.com/handbook
Fluorescence SpectraViewerIdentify compatible sets of �uorescent dyes and cell structure probes
lifetechnologies.com/spectraviewer
BioProbes® Journal of Cell Biology ApplicationsAward-winning magazine highlighting cell biology products and applications
lifetechnologies.com/bioprobes
Access all Molecular Probes® educational resources at lifetechnologies.com/mpeducate
Molecular Probes ResourcesMolecular Probes Handbook (online version)Comprehensive guide to fl uorescent probes and labeling technologiesthermofi sher.com/handbook
Molecular Probes Fluorescence SpectraViewerIdentify compatible sets of fl uorescent dyes and cell structure probesthermofi sher.com/spectraviewer
BioProbes Journal of Cell Biology ApplicationsAward-winning magazine highlighting cell biology products and applicationsthermofi sher.com/bioprobes
Access all Molecular Probes educational resources at thermofi sher.com/probes
883www.invitrogen.com/probes
The Molecular Probes® Handbook: A Guide to Fluorescent Probes and Labeling TechnologiesIMPORTANT NOTICE: The products described in this manual are covered by one or more Limited Use Label License(s). Please refer to the Appendix on page 971 and Master Product List on page 975. Products are For Research Use Only. Not intended for any animal or human therapeutic or diagnostic use.
TW
ENTY
CHAPTER 20
pH Indicators
20.1 Overview of pH Indicators . . . . . . . . . . . . . . . . . . . . . . . . . . . . . . . . . . . . . . . . . . . . . . . . . . 885
20.2 Probes Useful at Near-Neutral pH . . . . . . . . . . . . . . . . . . . . . . . . . . . . . . . . . . . . . . . . . . . . . 886
Fluorescein and Fluorescein Derivatives. . . . . . . . . . . . . . . . . . . . . . . . . . . . . . . . . . . . . . . . . . . . . . . . . . . . . . . . . . . . . . . . . . . . . . . . . . . . . . . . 886
Fluorescein and Its Diacetate . . . . . . . . . . . . . . . . . . . . . . . . . . . . . . . . . . . . . . . . . . . . . . . . . . . . . . . . . . . . . . . . . . . . . . . . . . . . . . . . . . . . . . 886
Carboxy�uorescein and Its Cell-Permeant Esters. . . . . . . . . . . . . . . . . . . . . . . . . . . . . . . . . . . . . . . . . . . . . . . . . . . . . . . . . . . . . . . . . . . . . . . 887
BCECF and Its AM Ester . . . . . . . . . . . . . . . . . . . . . . . . . . . . . . . . . . . . . . . . . . . . . . . . . . . . . . . . . . . . . . . . . . . . . . . . . . . . . . . . . . . . . . . . . . 887
Fluorescein Sulfonic Acid and Its Diacetate . . . . . . . . . . . . . . . . . . . . . . . . . . . . . . . . . . . . . . . . . . . . . . . . . . . . . . . . . . . . . . . . . . . . . . . . . . . 888
Chemically Reactive Fluorescein Diacetates . . . . . . . . . . . . . . . . . . . . . . . . . . . . . . . . . . . . . . . . . . . . . . . . . . . . . . . . . . . . . . . . . . . . . . . . . . 889
Carboxynaphtho�uorescein . . . . . . . . . . . . . . . . . . . . . . . . . . . . . . . . . . . . . . . . . . . . . . . . . . . . . . . . . . . . . . . . . . . . . . . . . . . . . . . . . . . . . . 889
SNARF® pH Indicator. . . . . . . . . . . . . . . . . . . . . . . . . . . . . . . . . . . . . . . . . . . . . . . . . . . . . . . . . . . . . . . . . . . . . . . . . . . . . . . . . . . . . . . . . . . . . . . . 889
Carboxy SNARF®-1 Dye and Its Cell-Permeant Ester . . . . . . . . . . . . . . . . . . . . . . . . . . . . . . . . . . . . . . . . . . . . . . . . . . . . . . . . . . . . . . . . . . . . 889
SNARF®-4F and SNARF®-5F Dyes and Their Cell-Permeant Esters . . . . . . . . . . . . . . . . . . . . . . . . . . . . . . . . . . . . . . . . . . . . . . . . . . . . . . . . . . 890
Amine- and Thiol-Reactive SNARF® Dyes . . . . . . . . . . . . . . . . . . . . . . . . . . . . . . . . . . . . . . . . . . . . . . . . . . . . . . . . . . . . . . . . . . . . . . . . . . . . . 892
8-Hydroxypyrene-1,3,6-Trisulfonic Acid (HPTS) . . . . . . . . . . . . . . . . . . . . . . . . . . . . . . . . . . . . . . . . . . . . . . . . . . . . . . . . . . . . . . . . . . . . . . . . . . 892
Nigericin . . . . . . . . . . . . . . . . . . . . . . . . . . . . . . . . . . . . . . . . . . . . . . . . . . . . . . . . . . . . . . . . . . . . . . . . . . . . . . . . . . . . . . . . . . . . . . . . . . . . . . . . . 892
Data Table 20.2 Probes Useful at Near-Neutral pH . . . . . . . . . . . . . . . . . . . . . . . . . . . . . . . . . . . . . . . . . . . . . . . . . . . . . . . . . . . . . . . . . . . . . . . 893
Product List 20.2 Probes Useful at Near-Neutral pH . . . . . . . . . . . . . . . . . . . . . . . . . . . . . . . . . . . . . . . . . . . . . . . . . . . . . . . . . . . . . . . . . . . . . . 894
20.3 Probes Useful at Acidic pH . . . . . . . . . . . . . . . . . . . . . . . . . . . . . . . . . . . . . . . . . . . . . . . . . . 894
LysoSensor™ Probes . . . . . . . . . . . . . . . . . . . . . . . . . . . . . . . . . . . . . . . . . . . . . . . . . . . . . . . . . . . . . . . . . . . . . . . . . . . . . . . . . . . . . . . . . . . . . . . . 895
LysoSensor™ Yellow/Blue Dye . . . . . . . . . . . . . . . . . . . . . . . . . . . . . . . . . . . . . . . . . . . . . . . . . . . . . . . . . . . . . . . . . . . . . . . . . . . . . . . . . . . . . 895
LysoSensor™ Green and LysoSensor™ Blue Dyes . . . . . . . . . . . . . . . . . . . . . . . . . . . . . . . . . . . . . . . . . . . . . . . . . . . . . . . . . . . . . . . . . . . . . . . 895
pHrodo™ pH Indicator . . . . . . . . . . . . . . . . . . . . . . . . . . . . . . . . . . . . . . . . . . . . . . . . . . . . . . . . . . . . . . . . . . . . . . . . . . . . . . . . . . . . . . . . . . . . . . 896
Oregon Green® and Dichloro�uorescein Derivatives. . . . . . . . . . . . . . . . . . . . . . . . . . . . . . . . . . . . . . . . . . . . . . . . . . . . . . . . . . . . . . . . . . . . . . 896
Other pH Indicators for Acidic Environments. . . . . . . . . . . . . . . . . . . . . . . . . . . . . . . . . . . . . . . . . . . . . . . . . . . . . . . . . . . . . . . . . . . . . . . . . . . . 896
9-Amino-6-Chloro-2-Methoxyacridine (ACMA) . . . . . . . . . . . . . . . . . . . . . . . . . . . . . . . . . . . . . . . . . . . . . . . . . . . . . . . . . . . . . . . . . . . . . . . . 896
8-Hydroxypyrene-1,3,6-Trisulfonic Acid (HPTS) . . . . . . . . . . . . . . . . . . . . . . . . . . . . . . . . . . . . . . . . . . . . . . . . . . . . . . . . . . . . . . . . . . . . . . . . 897
Data Table 20.3 Probes Useful at Acidic pH . . . . . . . . . . . . . . . . . . . . . . . . . . . . . . . . . . . . . . . . . . . . . . . . . . . . . . . . . . . . . . . . . . . . . . . . . . . . . 897
Product List 20.3 Probes Useful at Acidic pH . . . . . . . . . . . . . . . . . . . . . . . . . . . . . . . . . . . . . . . . . . . . . . . . . . . . . . . . . . . . . . . . . . . . . . . . . . . . 898
20.4 pH Indicator Conjugates . . . . . . . . . . . . . . . . . . . . . . . . . . . . . . . . . . . . . . . . . . . . . . . . . . . . 898
pH Indicator Dextrans . . . . . . . . . . . . . . . . . . . . . . . . . . . . . . . . . . . . . . . . . . . . . . . . . . . . . . . . . . . . . . . . . . . . . . . . . . . . . . . . . . . . . . . . . . . . . . 898
pHrodo™ Dextran. . . . . . . . . . . . . . . . . . . . . . . . . . . . . . . . . . . . . . . . . . . . . . . . . . . . . . . . . . . . . . . . . . . . . . . . . . . . . . . . . . . . . . . . . . . . . . . 898
BCECF and SNARF® Indicator Dextrans for Measuring Near-Neutral pH . . . . . . . . . . . . . . . . . . . . . . . . . . . . . . . . . . . . . . . . . . . . . . . . . . . . . 899
Oregon Green® and LysoSensor™ Yellow/Blue Dextrans . . . . . . . . . . . . . . . . . . . . . . . . . . . . . . . . . . . . . . . . . . . . . . . . . . . . . . . . . . . . . . . . . 899
Lipophilic pH Indicators . . . . . . . . . . . . . . . . . . . . . . . . . . . . . . . . . . . . . . . . . . . . . . . . . . . . . . . . . . . . . . . . . . . . . . . . . . . . . . . . . . . . . . . . . . . . . 900
Reactive Dyes for Preparing pH-Sensitive Conjugates. . . . . . . . . . . . . . . . . . . . . . . . . . . . . . . . . . . . . . . . . . . . . . . . . . . . . . . . . . . . . . . . . . . . . 900
Amine-Reactive pHrodo™ pH Indicator . . . . . . . . . . . . . . . . . . . . . . . . . . . . . . . . . . . . . . . . . . . . . . . . . . . . . . . . . . . . . . . . . . . . . . . . . . . . . . 900
Other Amine-Reactive Dyes. . . . . . . . . . . . . . . . . . . . . . . . . . . . . . . . . . . . . . . . . . . . . . . . . . . . . . . . . . . . . . . . . . . . . . . . . . . . . . . . . . . . . . . 900
Data Table 20.4 pH Indicator Conjugates. . . . . . . . . . . . . . . . . . . . . . . . . . . . . . . . . . . . . . . . . . . . . . . . . . . . . . . . . . . . . . . . . . . . . . . . . . . . . . . 901
Product List 20.4 pH Indicator Conjugates . . . . . . . . . . . . . . . . . . . . . . . . . . . . . . . . . . . . . . . . . . . . . . . . . . . . . . . . . . . . . . . . . . . . . . . . . . . . . 902
The Molecular Probes™ Handbook: A Guide to Fluorescent Probes and Labeling Technologies
IMPORTANT NOTICE : The products described in this manual are covered by one or more Limited Use Label License(s). Please refer to the Appendix on page 971 and Master Product List on page 975. Products are For Research Use Only. Not intended for any animal or human therapeutic or diagnostic use.
thermofi sher.com/probes

884www.invitrogen.com/probes
The Molecular Probes® Handbook: A Guide to Fluorescent Probes and Labeling TechnologiesIMPORTANT NOTICE: The products described in this manual are covered by one or more Limited Use Label License(s). Please refer to the Appendix on page 971 and Master Product List on page 975. Products are For Research Use Only. Not intended for any animal or human therapeutic or diagnostic use.
Chapter 20 — pH Indicators
Alexa Fluor® 568 goat anti–mouse IgG, Alexa Fluor® 488 goat anti-rabbit IgG and Alexa Fluor® 350 phalloidin.
The Molecular Probes™ Handbook: A Guide to Fluorescent Probes and Labeling Technologies
IMPORTANT NOTICE : The products described in this manual are covered by one or more Limited Use Label License(s). Please refer to the Appendix on page 971 and Master Product List on page 975. Products are For Research Use Only. Not intended for any animal or human therapeutic or diagnostic use.thermofisher.com/probes
Chapter 20 — pH Indicators
885www.invitrogen.com/probes
The Molecular Probes® Handbook: A Guide to Fluorescent Probes and Labeling TechnologiesIMPORTANT NOTICE: The products described in this manual are covered by one or more Limited Use Label License(s). Please refer to the Appendix on page 971 and Master Product List on page 975. Products are For Research Use Only. Not intended for any animal or human therapeutic or diagnostic use.
Section 20.1 Overview of pH Indicators
�e ability of dyes—notably litmus, phenolphthalein and phenol red—to change their color in response to a pH change has found widespread application in research and industry. Fluorescent dyes, however, provide the increased sensitivity required for optical pH measurements inside live cells. �ey also o�er much greater spatial sampling capability when compared with microelectrode techniques.1 �ese advantages have spurred the development of improved �uorescent dyes that can sense pH changes within physiological ranges. Of course, many of the same �uorescent pH indica-tors can also be used as pH sensors in cell-free media.
To quantitatively measure pH, it is essential to match the indicator’s pKa to the pH of the experimental system. Consequently, the following two sections of this chapter are divided into pH indicators for use in environments with near-neutral pH (Section 20.2) and pH indicators for use in relatively acidic environments (Section 20.3). Intracellular pH is generally between ~6.8 and 7.4 in the cytosol and ~4.5 and 6.0 in the cell’s acidic organelles. Unlike intracellular free Ca2+ concentrations, which can rapidly change by perhaps 100-fold, the pH inside a cell varies by only fractions of a pH unit, and such changes may be quite slow.
We o�er a variety of �uorescent pH indicators, pH indicator conjugates and other reagents for pH measurements in biological systems. Among these are several probes with unique optical responses and specialized localization characteristics:
• Visible light–excitable SNARF® pH indicators enable researchers to determine intracellular pH in the physiological range using dual-emission or dual-excitation ratiometric techniques (Section 20.2), thus providing important tools for confocal laser-scanning microscopy and �ow cytometry.
• pHrodo™ dye and LysoSensor™ probes, for use in acidic environments such as lysosomes (Section 20.3).
• Fluorescent pH indicators coupled to dextrans are extremely well retained in cells, do not bind to cellular proteins and have a reduced tendency to compartmentalize 2 (Section 20.4).
Families of Molecular Probes® pH indicators are listed in Table 20.1 in approximate order of decreasing pKa value.
20.1 Overview of pH Indicators
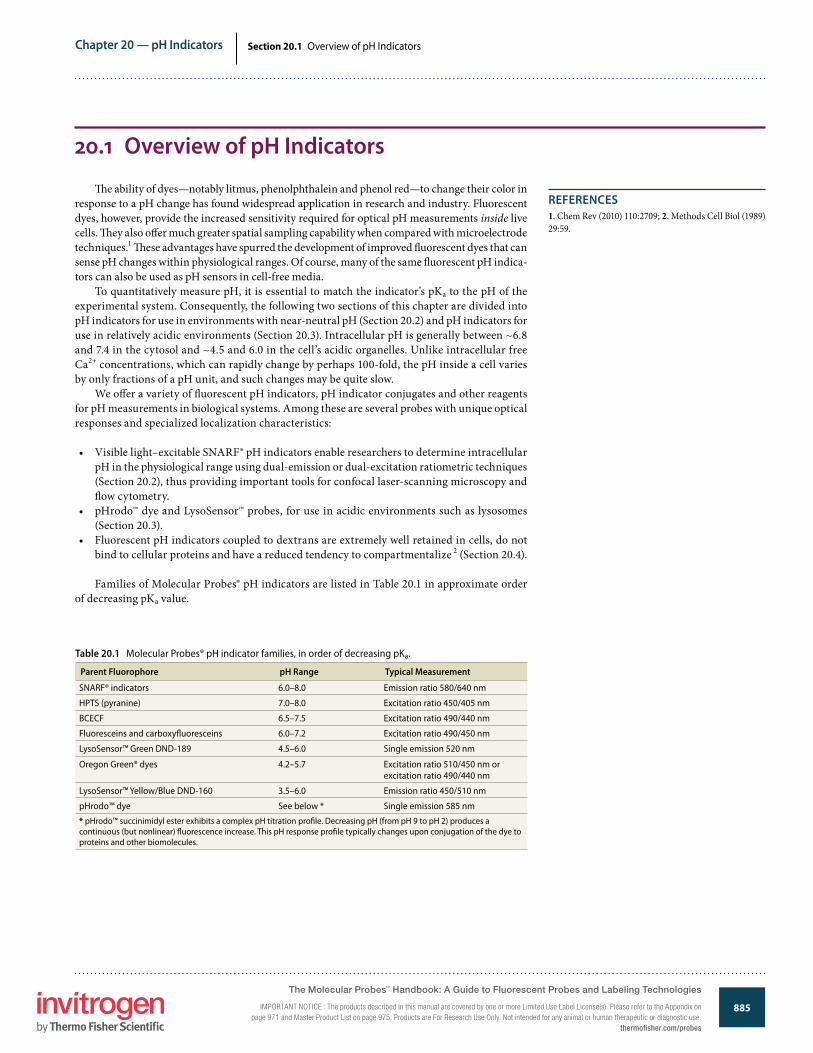
Table 20.1 Molecular Probes® pH indicator families, in order of decreasing pKa.
Parent Fluorophore pH Range Typical Measurement
SNARF® indicators 6.0–8.0 Emission ratio 580/640 nm
HPTS (pyranine) 7.0–8.0 Excitation ratio 450/405 nm
BCECF 6.5–7.5 Excitation ratio 490/440 nm
Fluoresceins and carboxy�uoresceins 6.0–7.2 Excitation ratio 490/450 nm
LysoSensor™ Green DND-189 4.5–6.0 Single emission 520 nm
Oregon Green® dyes 4.2–5.7 Excitation ratio 510/450 nm or excitation ratio 490/440 nm
LysoSensor™ Yellow/Blue DND-160 3.5–6.0 Emission ratio 450/510 nm
pHrodo™ dye See below * Single emission 585 nm
* pHrodo™ succinimidyl ester exhibits a complex pH titration pro�le. Decreasing pH (from pH 9 to pH 2) produces a continuous (but nonlinear) �uorescence increase. This pH response pro�le typically changes upon conjugation of the dye to proteins and other biomolecules.
REFERENCES1. Chem Rev (2010) 110:2709; 2. Methods Cell Biol (1989) 29:59.
The Molecular Probes™ Handbook: A Guide to Fluorescent Probes and Labeling Technologies
IMPORTANT NOTICE : The products described in this manual are covered by one or more Limited Use Label License(s). Please refer to the Appendix on page 971 and Master Product List on page 975. Products are For Research Use Only. Not intended for any animal or human therapeutic or diagnostic use.
thermofisher.com/probes
Chapter 20 — pH Indicators
886www.invitrogen.com/probes
The Molecular Probes® Handbook: A Guide to Fluorescent Probes and Labeling TechnologiesIMPORTANT NOTICE: The products described in this manual are covered by one or more Limited Use Label License(s). Please refer to the Appendix on page 971 and Master Product List on page 975. Products are For Research Use Only. Not intended for any animal or human therapeutic or diagnostic use.
Section 20.2 Probes Useful at Near-Neutral pH
20.2 Probes Useful at Near-Neutral pH
Fluorescein and Fluorescein DerivativesFluorescein and many of its derivatives exhibit multiple, pH-dependent ionic equilibria.1–5
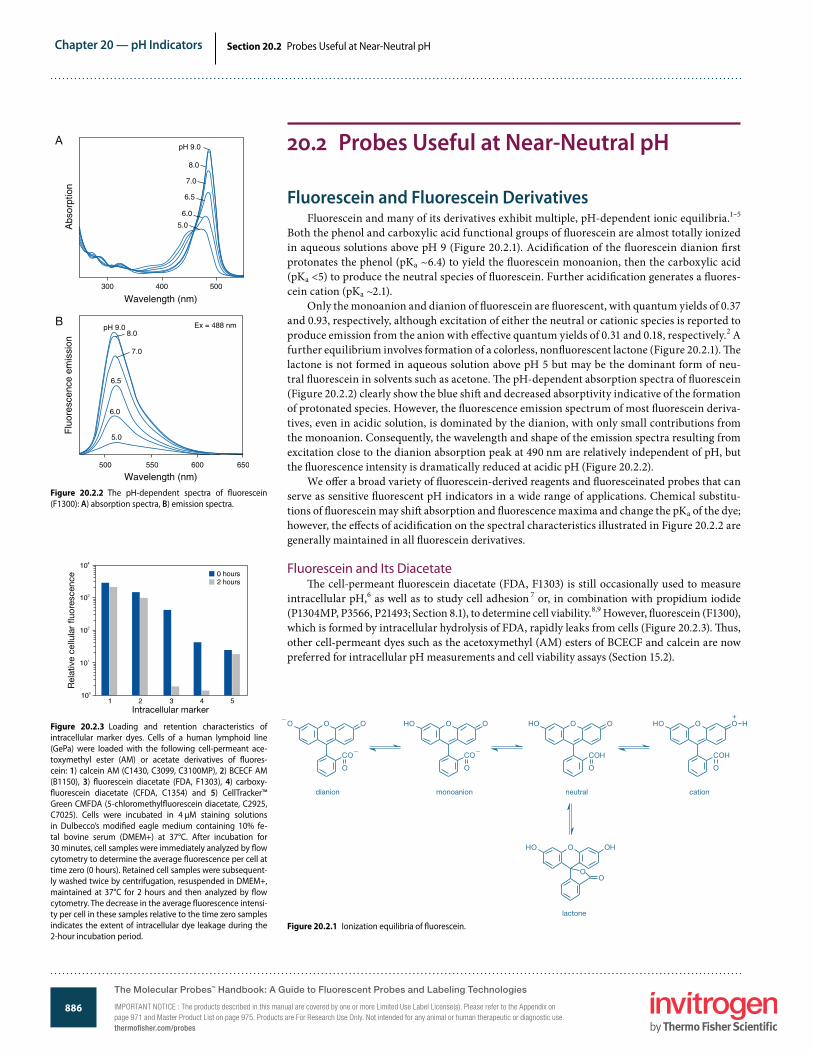
Both the phenol and carboxylic acid functional groups of �uorescein are almost totally ionized in aqueous solutions above pH 9 (Figure 20.2.1). Acidi�cation of the �uorescein dianion �rst protonates the phenol (pKa ~6.4) to yield the �uorescein monoanion, then the carboxylic acid (pKa <5) to produce the neutral species of �uorescein. Further acidi�cation generates a �uores-cein cation (pKa ~2.1).
Only the monoanion and dianion of �uorescein are �uorescent, with quantum yields of 0.37 and 0.93, respectively, although excitation of either the neutral or cationic species is reported to produce emission from the anion with e�ective quantum yields of 0.31 and 0.18, respectively.2 A further equilibrium involves formation of a colorless, non�uorescent lactone (Figure 20.2.1). �e lactone is not formed in aqueous solution above pH 5 but may be the dominant form of neu-tral �uorescein in solvents such as acetone. �e pH-dependent absorption spectra of �uorescein (Figure 20.2.2) clearly show the blue shi� and decreased absorptivity indicative of the formation of protonated species. However, the �uorescence emission spectrum of most �uorescein deriva-tives, even in acidic solution, is dominated by the dianion, with only small contributions from the monoanion. Consequently, the wavelength and shape of the emission spectra resulting from excitation close to the dianion absorption peak at 490 nm are relatively independent of pH, but the �uorescence intensity is dramatically reduced at acidic pH (Figure 20.2.2).
We o�er a broad variety of �uorescein-derived reagents and �uoresceinated probes that can serve as sensitive �uorescent pH indicators in a wide range of applications. Chemical substitu-tions of �uorescein may shi� absorption and �uorescence maxima and change the pKa of the dye; however, the e�ects of acidi�cation on the spectral characteristics illustrated in Figure 20.2.2 are generally maintained in all �uorescein derivatives.
Fluorescein and Its Diacetate�e cell-permeant �uorescein diacetate (FDA, F1303) is still occasionally used to measure
intracellular pH,6 as well as to study cell adhesion 7 or, in combination with propidium iodide (P1304MP, P3566, P21493; Section 8.1), to determine cell viability.8,9 However, �uorescein (F1300), which is formed by intracellular hydrolysis of FDA, rapidly leaks from cells (Figure 20.2.3). �us, other cell-permeant dyes such as the acetoxymethyl (AM) esters of BCECF and calcein are now preferred for intracellular pH measurements and cell viability assays (Section 15.2).
Figure 20.2.2 The pH-dependent spectra of �uorescein (F1300): A) absorption spectra, B) emission spectra.
Figure 20.2.3 Loading and retention characteristics of intracellular marker dyes. Cells of a human lymphoid line (GePa) were loaded with the following cell-permeant ace-toxymethyl ester (AM) or acetate derivatives of �uores-cein: 1) calcein AM (C1430, C3099, C3100MP), 2) BCECF AM (B1150), 3) �uorescein diacetate (FDA, F1303), 4) carboxy-�uorescein diacetate (CFDA, C1354) and 5) CellTracker™ Green CMFDA (5-chloromethyl�uorescein diacetate, C2925, C7025). Cells were incubated in 4 µM staining solutions in Dulbecco’s modi�ed eagle medium containing 10% fe-tal bovine serum (DMEM+) at 37°C. After incubation for 30 minutes, cell samples were immediately analyzed by �ow cytometry to determine the average �uorescence per cell at time zero (0 hours). Retained cell samples were subsequent-ly washed twice by centrifugation, resuspended in DMEM+, maintained at 37°C for 2 hours and then analyzed by �ow cytometry. The decrease in the average �uorescence intensi-ty per cell in these samples relative to the time zero samples indicates the extent of intracellular dye leakage during the 2-hour incubation period.
Intracellular marker
Rel
ativ
e ce
llula
r �u
ores
cenc
e
Figure 20.2.1 Ionization equilibria of �uorescein.
O OHO
CO
O
_
monoanion
O OHO
COH
H
O
+
cation
O OO
CO
O
_
dianion
_
O OHO
COH
O
neutral
lactone
O OHHO
OO
A
B
The Molecular Probes™ Handbook: A Guide to Fluorescent Probes and Labeling Technologies
IMPORTANT NOTICE : The products described in this manual are covered by one or more Limited Use Label License(s). Please refer to the Appendix on page 971 and Master Product List on page 975. Products are For Research Use Only. Not intended for any animal or human therapeutic or diagnostic use.thermofisher.com/probes
Chapter 20 — pH Indicators
887www.invitrogen.com/probes
The Molecular Probes® Handbook: A Guide to Fluorescent Probes and Labeling TechnologiesIMPORTANT NOTICE: The products described in this manual are covered by one or more Limited Use Label License(s). Please refer to the Appendix on page 971 and Master Product List on page 975. Products are For Research Use Only. Not intended for any animal or human therapeutic or diagnostic use.
Section 20.2 Probes Useful at Near-Neutral pH
Carboxy�uorescein and Its Cell-Permeant EstersFluorescein’s high leakage rate out of cells makes it very di�cult to quantitate intracellular
pH, because the decrease in the cell’s �uorescence due to dye leakage cannot be easily distin-guished from that due to acidi�cation. �e use of carboxy�uorescein diacetate (CFDA, C195) for intracellular pH measurements partially addresses this problem.10,11 CFDA is moderately permeant to most cell membranes and, upon hydrolysis by intracellular nonspeci�c esterases, forms carboxy�uorescein (5(6)-FAM, C194, C1904), which has a pH-dependent spectral response very similar to that of �uorescein. As compared with �uorescein, carboxy�uorescein contains an extra negative charge and is therefore better retained in cells 12 (Figure 20.2.3). �e mixed-isomer preparation of CFDA (C195) is usually adequate for intracellular pH measurements because the single isomers of carboxy�uorescein exhibit essentially identical pH-dependent spectra with a pKa ~6.5. For experiments requiring a pure isomer, the single-isomer preparations of carboxy-�uorescein (C1359, C1360; Section 1.5) and CFDA (C1361, C1362; Section 15.2) are available. In addition, we o�er the AM ester of CFDA (5-CFDA, AM, C1354), which is electrically neutral and facilitates cell loading. Upon hydrolysis by intracellular esterases, this AM ester also yields carboxy�uorescein.13–15
BCECF and Its AM EsterAlthough carboxy�uorescein is better retained in cells than is �uorescein, its pKa of ~6.5 is
lower than the cytosolic pH of most cells (pH ~6.8–7.4). Consequently, its �uorescence change is less than optimal for detecting small pH changes above pH 7. Since its introduction by Roger Tsien in 1982,16,17 the polar �uorescein derivative BCECF (B1151) and its membrane-permeant AM ester (B1150, B1170, B3051) have become the most widely used �uorescent indicators for estimating intracellular pH. Also, a �ow cytometric assay has been developed that uses BCECF to estimate the concentration of intracellular K+.18 BCECF’s four to �ve negative charges at pH 7–8 improve its retention in cells (Figure 20.2.3), and its pKa of 6.98 is ideal for typical intracel-lular pH measurements.
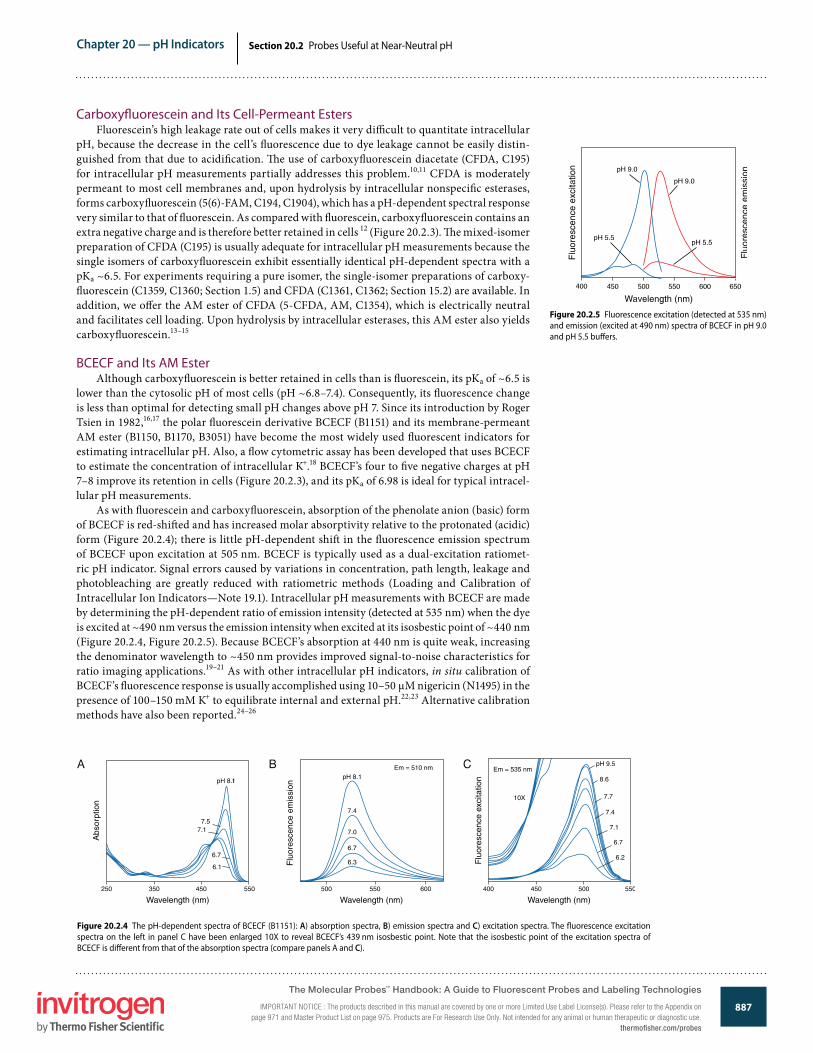
As with �uorescein and carboxy�uorescein, absorption of the phenolate anion (basic) form of BCECF is red-shi�ed and has increased molar absorptivity relative to the protonated (acidic) form (Figure 20.2.4); there is little pH-dependent shi� in the �uorescence emission spectrum of BCECF upon excitation at 505 nm. BCECF is typically used as a dual-excitation ratiomet-ric pH indicator. Signal errors caused by variations in concentration, path length, leakage and photobleaching are greatly reduced with ratiometric methods (Loading and Calibration of Intracellular Ion Indicators—Note 19.1). Intracellular pH measurements with BCECF are made by determining the pH-dependent ratio of emission intensity (detected at 535 nm) when the dye is excited at ~490 nm versus the emission intensity when excited at its isosbestic point of ~440 nm (Figure 20.2.4, Figure 20.2.5). Because BCECF’s absorption at 440 nm is quite weak, increasing the denominator wavelength to ~450 nm provides improved signal-to-noise characteristics for ratio imaging applications.19–21 As with other intracellular pH indicators, in situ calibration of BCECF’s �uorescence response is usually accomplished using 10–50 µM nigericin (N1495) in the presence of 100–150 mM K+ to equilibrate internal and external pH.22,23 Alternative calibration methods have also been reported.24–26
Figure 20.2.4 The pH-dependent spectra of BCECF (B1151): A) absorption spectra, B) emission spectra and C) excitation spectra. The �uorescence excitation spectra on the left in panel C have been enlarged 10X to reveal BCECF’s 439 nm isosbestic point. Note that the isosbestic point of the excitation spectra of BCECF is di�erent from that of the absorption spectra (compare panels A and C).
Figure 20.2.5 Fluorescence excitation (detected at 535 nm) and emission (excited at 490 nm) spectra of BCECF in pH 9.0 and pH 5.5 bu�ers.
A B C
The Molecular Probes™ Handbook: A Guide to Fluorescent Probes and Labeling Technologies
IMPORTANT NOTICE : The products described in this manual are covered by one or more Limited Use Label License(s). Please refer to the Appendix on page 971 and Master Product List on page 975. Products are For Research Use Only. Not intended for any animal or human therapeutic or diagnostic use.
thermofisher.com/probes
Chapter 20 — pH Indicators
888www.invitrogen.com/probes
The Molecular Probes® Handbook: A Guide to Fluorescent Probes and Labeling TechnologiesIMPORTANT NOTICE: The products described in this manual are covered by one or more Limited Use Label License(s). Please refer to the Appendix on page 971 and Master Product List on page 975. Products are For Research Use Only. Not intended for any animal or human therapeutic or diagnostic use.
Section 20.2 Probes Useful at Near-Neutral pH
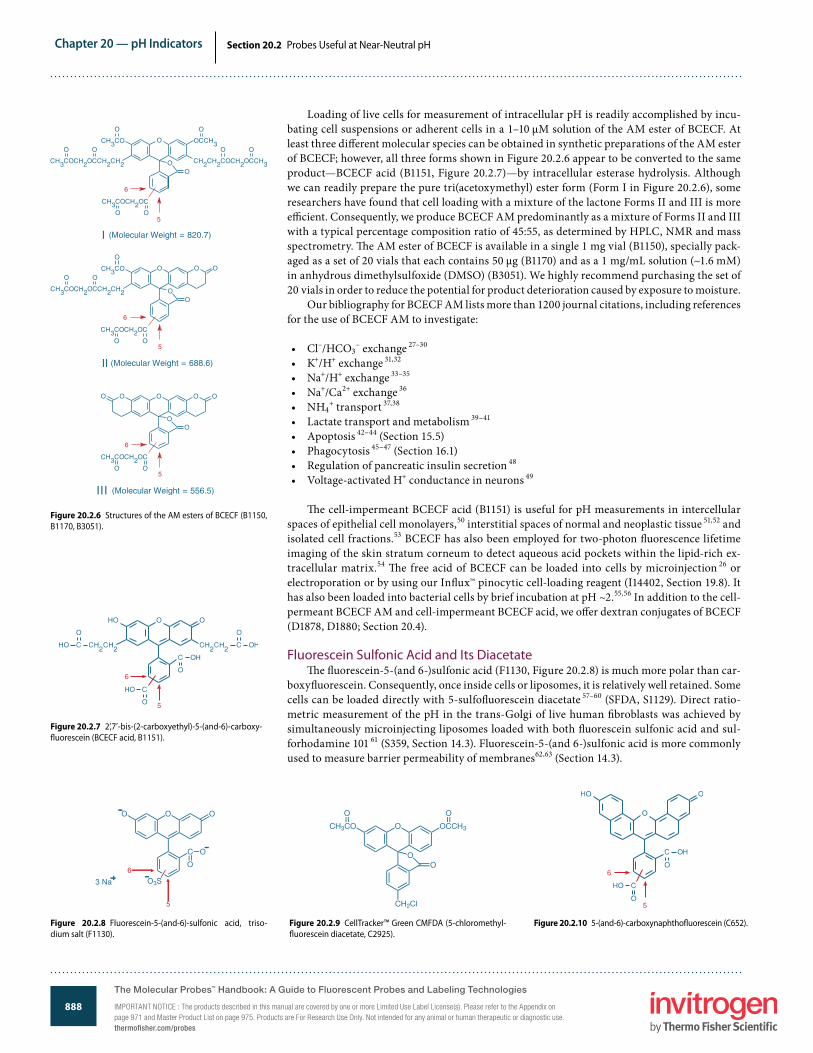
Loading of live cells for measurement of intracellular pH is readily accomplished by incu-bating cell suspensions or adherent cells in a 1–10 µM solution of the AM ester of BCECF. At least three di�erent molecular species can be obtained in synthetic preparations of the AM ester of BCECF; however, all three forms shown in Figure 20.2.6 appear to be converted to the same product—BCECF acid (B1151, Figure 20.2.7)—by intracellular esterase hydrolysis. Although we can readily prepare the pure tri(acetoxymethyl) ester form (Form I in Figure 20.2.6), some researchers have found that cell loading with a mixture of the lactone Forms II and III is more e�cient. Consequently, we produce BCECF AM predominantly as a mixture of Forms II and III with a typical percentage composition ratio of 45:55, as determined by HPLC, NMR and mass spectrometry. �e AM ester of BCECF is available in a single 1 mg vial (B1150), specially pack-aged as a set of 20 vials that each contains 50 µg (B1170) and as a 1 mg/mL solution (~1.6 mM) in anhydrous dimethylsulfoxide (DMSO) (B3051). We highly recommend purchasing the set of 20 vials in order to reduce the potential for product deterioration caused by exposure to moisture.
Our bibliography for BCECF AM lists more than 1200 journal citations, including references for the use of BCECF AM to investigate:
• Cl–/HCO3– exchange 27–30
• K+/H+ exchange 31,32
• Na+/H+ exchange 33–35
• Na+/Ca2+ exchange 36
• NH4+ transport 37,38
• Lactate transport and metabolism 39–41
• Apoptosis 42–44 (Section 15.5)• Phagocytosis 45–47 (Section 16.1)• Regulation of pancreatic insulin secretion 48
• Voltage-activated H+ conductance in neurons 49
�e cell-impermeant BCECF acid (B1151) is useful for pH measurements in intercellular spaces of epithelial cell monolayers,50 interstitial spaces of normal and neoplastic tissue 51,52 and isolated cell fractions.53 BCECF has also been employed for two-photon �uorescence lifetime imaging of the skin stratum corneum to detect aqueous acid pockets within the lipid-rich ex-tracellular matrix.54 �e free acid of BCECF can be loaded into cells by microinjection 26 or electroporation or by using our In�ux™ pinocytic cell-loading reagent (I14402, Section 19.8). It has also been loaded into bacterial cells by brief incubation at pH ~2.55,56 In addition to the cell-permeant BCECF AM and cell-impermeant BCECF acid, we o�er dextran conjugates of BCECF (D1878, D1880; Section 20.4).
Fluorescein Sulfonic Acid and Its Diacetate�e �uorescein-5-(and 6-)sulfonic acid (F1130, Figure 20.2.8) is much more polar than car-
boxy�uorescein. Consequently, once inside cells or liposomes, it is relatively well retained. Some cells can be loaded directly with 5-sulfo�uorescein diacetate 57–60 (SFDA, S1129). Direct ratio-metric measurement of the pH in the trans-Golgi of live human �broblasts was achieved by simultaneously microinjecting liposomes loaded with both �uorescein sulfonic acid and sul-forhodamine 101 61 (S359, Section 14.3). Fluorescein-5-(and 6-)sulfonic acid is more commonly used to measure barrier permeability of membranes62,63 (Section 14.3).
Figure 20.2.10 5-(and-6)-carboxynaphtho�uorescein (C652).Figure 20.2.8 Fluorescein-5-(and-6)-sulfonic acid, triso-dium salt (F1130).
O O
C O
O
O3S
5
6O
3 Na
Figure 20.2.9 CellTracker™ Green CMFDA (5-chloromethyl-�uorescein diacetate, C2925).
CH3CO O OCCH3
OO
OO
CH2Cl
Figure 20.2.6 Structures of the AM esters of BCECF (B1150, B1170, B3051).
Figure 20.2.7 2’,7’-bis-(2-carboxyethyl)-5-(and-6)-carboxy-�uorescein (BCECF acid, B1151).
The Molecular Probes™ Handbook: A Guide to Fluorescent Probes and Labeling Technologies
IMPORTANT NOTICE : The products described in this manual are covered by one or more Limited Use Label License(s). Please refer to the Appendix on page 971 and Master Product List on page 975. Products are For Research Use Only. Not intended for any animal or human therapeutic or diagnostic use.thermofisher.com/probes
Chapter 20 — pH Indicators
889www.invitrogen.com/probes
The Molecular Probes® Handbook: A Guide to Fluorescent Probes and Labeling TechnologiesIMPORTANT NOTICE: The products described in this manual are covered by one or more Limited Use Label License(s). Please refer to the Appendix on page 971 and Master Product List on page 975. Products are For Research Use Only. Not intended for any animal or human therapeutic or diagnostic use.
Section 20.2 Probes Useful at Near-Neutral pH
Chemically Reactive Fluorescein DiacetatesOne means for overcoming the cell leakage problem common to the above pH indicators,
including BCECF, is to trap the indicator inside the cell via conjugation to intracellular constitu-ents. CellTracker™ Green CMFDA (C2925, C7025; Figure 20.2.9) and chloromethyl SNARF®-1 (C6826) incorporate a thiol-reactive chloromethyl moiety that reacts with intracellular thiols, including glutathione and proteins, to yield well-retained products (Figure 20.2.3). Cleavage of the acetate groups of the CMFDA conjugate by intracellular esterases yields a conjugate that retains the pH-dependent spectral properties of �uorescein. Because of its superior retention as compared with SNARF® AM and BCECF AM, CellTracker™ Green CMFDA was employed to monitor the intracellular pH response to osmotic stress in CHO, HEK 293 and Caco-2 cells.64 Similarly, the amine-reactive succinimidyl ester of CFDA (CFSE, C1157) can be used for long-term pH studies of live cells, producing a conjugate with the pH-sensitive properties of carboxy�uorescein.65
Carboxynaphtho�uoresceinCarboxynaphtho�uorescein (C652, Figure 20.2.10) has pH-dependent red �uorescence
(excitation/emission maxima ~598/668 nm at pH >9) with a relatively high pKa of ~7.6. �e long-wavelength pH-dependent spectra of carboxynaphtho�uorescein have been exploited in the construction of �ber-optic pH sensors.66,67 �is long-wavelength pH indicator is also available in membrane-permeant diacetate form (C13196) for passive intracellular loading and as an amine-reactive succinimidyl ester (C653, Section 20.4) for preparing pH-sensi-tive conjugates.
SNARF® pH Indicator�e seminaphthorhoda�uors (SNARF® dyes) are visible light–excitable �uorescent pH indi-
cators.68 �e SNARF® indicators have both dual-emission and dual-excitation properties, mak-ing them particularly useful for confocal laser-scanning microscopy 69–72 (Figure 20.2.11), �ow cytometry 21,73–75 and microplate reader–based measurements.76 �e dual-emission properties of the SNARF® indicators make them preferred probes for use in �ber-optic pH sensors.77–79 �ese pH indicators can be excited by the 488 or 514 nm spectral lines of the argon-ion laser and are sensitive to pH values within the physiological range. Dextran conjugates of the SNARF® dyes are described in Section 20.4.
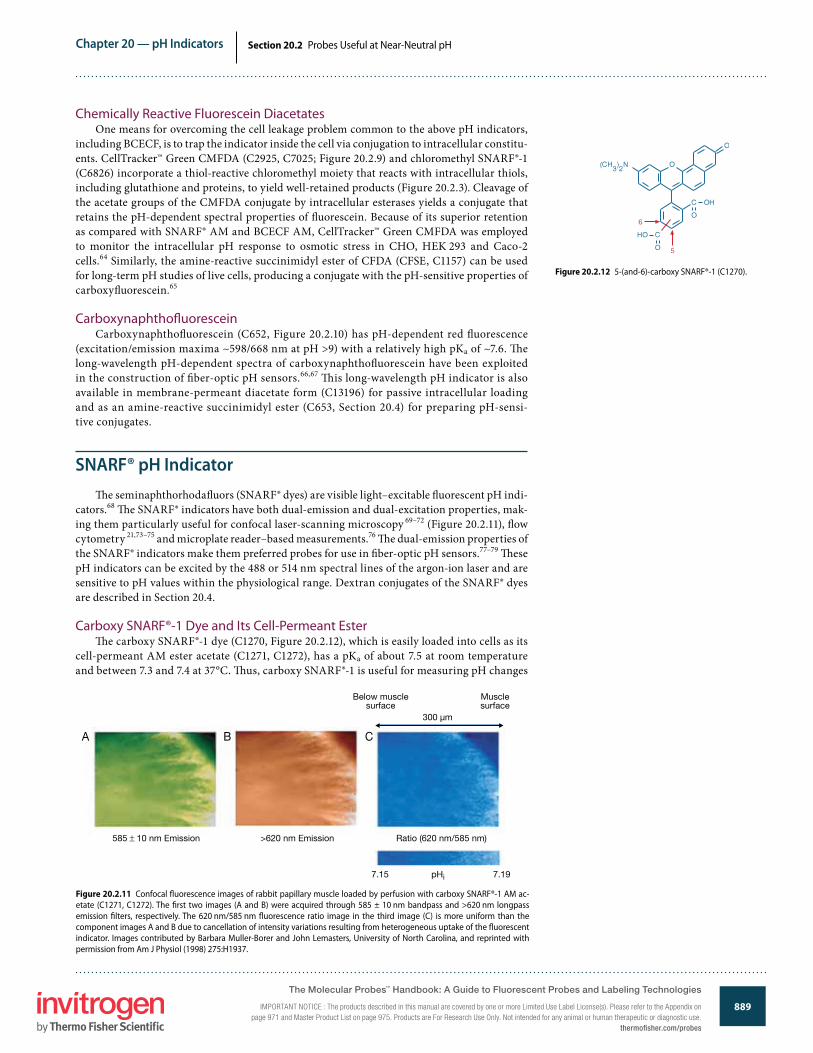
Carboxy SNARF®-1 Dye and Its Cell-Permeant Ester�e carboxy SNARF®-1 dye (C1270, Figure 20.2.12), which is easily loaded into cells as its
cell-permeant AM ester acetate (C1271, C1272), has a pKa of about 7.5 at room temperature and between 7.3 and 7.4 at 37°C. �us, carboxy SNARF®-1 is useful for measuring pH changes
Figure 20.2.12 5-(and-6)-carboxy SNARF®-1 (C1270).
Figure 20.2.11 Confocal �uorescence images of rabbit papillary muscle loaded by perfusion with carboxy SNARF®-1 AM ac-etate (C1271, C1272). The �rst two images (A and B) were acquired through 585 ± 10 nm bandpass and >620 nm longpass emission �lters, respectively. The 620 nm/585 nm �uorescence ratio image in the third image (C) is more uniform than the component images A and B due to cancellation of intensity variations resulting from heterogeneous uptake of the �uorescent indicator. Images contributed by Barbara Muller-Borer and John Lemasters, University of North Carolina, and reprinted with permission from Am J Physiol (1998) 275:H1937.
Below musclesurface
Musclesurface
300 µm
585 ± 10 nm Emission >620 nm Emission Ratio (620 nm/585 nm)
7.15 7.19pHi
A B C
The Molecular Probes™ Handbook: A Guide to Fluorescent Probes and Labeling Technologies
IMPORTANT NOTICE : The products described in this manual are covered by one or more Limited Use Label License(s). Please refer to the Appendix on page 971 and Master Product List on page 975. Products are For Research Use Only. Not intended for any animal or human therapeutic or diagnostic use.
thermofisher.com/probes

Chapter 20 — pH Indicators
890www.invitrogen.com/probes
The Molecular Probes® Handbook: A Guide to Fluorescent Probes and Labeling TechnologiesIMPORTANT NOTICE: The products described in this manual are covered by one or more Limited Use Label License(s). Please refer to the Appendix on page 971 and Master Product List on page 975. Products are For Research Use Only. Not intended for any animal or human therapeutic or diagnostic use.
Section 20.2 Probes Useful at Near-Neutral pH
between pH 7 and pH 8. Like �uorescein and BCECF, the absorption spectrum of the carboxy SNARF®-1 pH indicator undergoes a shi� to longer wavelengths upon deprotonation of its phenolic substituent (Figure 20.2.13). In contrast to the �uorescein-based indicators, however, carboxy SNARF®-1 also exhibits a signi�cant pH-dependent emission shi� from yellow-orange to deep-red �uorescence as conditions become more basic (Figure 20.2.14, Figure 20.2.15). �is pH dependence allows the ratio of the �uorescence intensities from the dye at two emission wavelengths—typically 580 nm and 640 nm—to be used for quantitative determinations of pH (Loading and Calibration of Intracellular Ion Indicators—Note 19.1) (Figure 20.2.11). For practical purposes, it is o�en desirable to bias the detection of carboxy SNARF®-1 �uorescence towards the less �uorescent acidic form by using an excitation wavelength between 488 nm and the excitation isosbestic point at ~530 nm, yielding balanced signals for the two emission ratio components (Figure 20.2.14, Figure 20.2.16). When excited at 488 nm, carboxy SNARF®-1 exhibits an emission isosbestic point of ~610 nm and a lower �uorescent signal than obtained with 514 nm excitation.72 Alternatively, when excited by the 568 nm spectral line of the Ar-Kr laser found in some confocal laser-scanning microscopes, carboxy SNARF®-1 exhibits a �uo-rescence increase at 640 nm as the pH increases and an emission isosbestic point at 585 nm.72 As with other ion indicators, intracellular environments may cause signi�cant changes to both the spectral properties and pKa of carboxy SNARF®-1,80–83 and the indicator should always be calibrated in the system under study.
�e spectra of carboxy SNARF®-1 are well resolved from those of fura-2 84,85 and indo-1 86 (Section 19.2), as well as those of the �uo-3,85,87,88 �uo-4, Calcium Green™ and Oregon Green® 488 BAPTA Ca2+ indicators (Section 19.3), permitting simultaneous measurements of intracellular pH and Ca2+ (Figure 20.2.17). Carboxy SNARF®-1 has also been used in combination with the Na+ indicator SBFI (S1262, S1263, S1264; Section 21.1) to simultaneously detect pH and Na+ changes.89 �e relatively long-wavelength excitation and emission characteristics of carboxy SNARF®-1 fa-cilitate studies in auto�uorescent cells 90 and permit experiments that employ ultraviolet light–photoactivated caged probes 91 (Section 5.3). Incubation of cells for several hours a�er loading with carboxy SNARF®-1 AM ester acetate results in compartmentally selective retention of the dye, allowing in situ measurements of mitochondrial pH 92 (Figure 20.2.18).
SNARF®-4F and SNARF®-5F Dyes and Their Cell-Permeant EstersAlthough the carboxy SNARF®-1 indicator possesses excellent spectral properties, its pKa
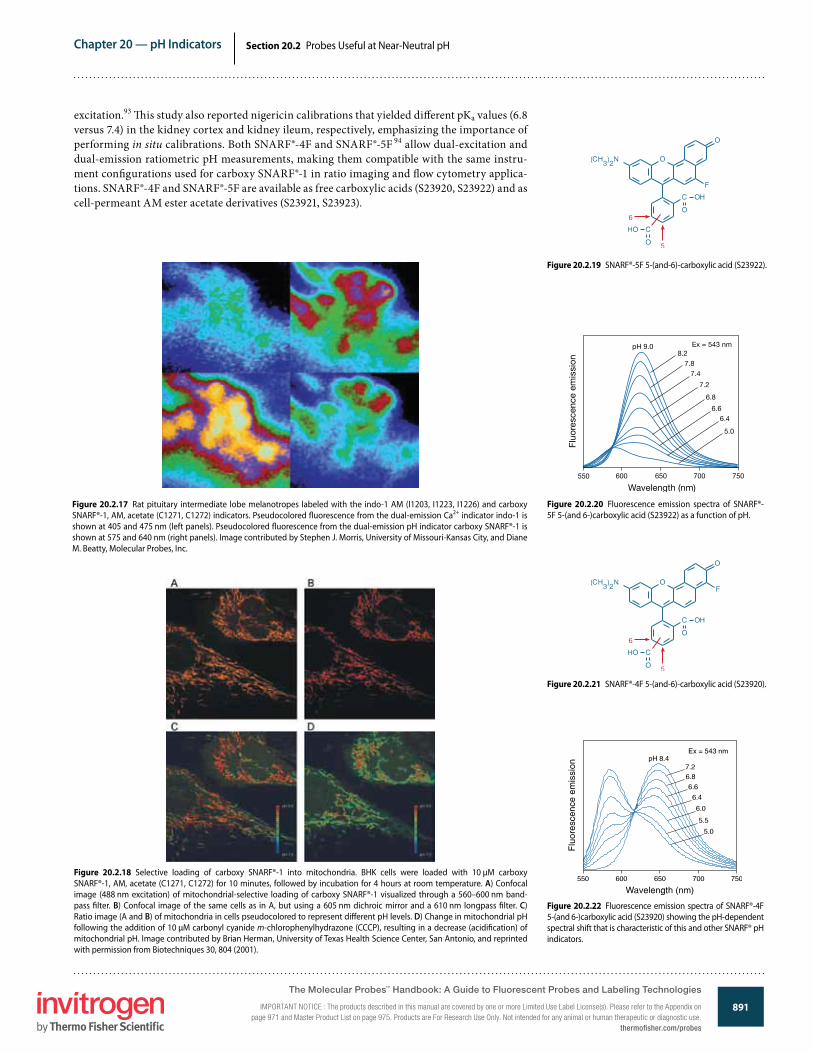
of ~7.5 may be too high for measurements of intracellular pH in some cells. For quantitative measurements of pH changes in the typical cytosolic range (pH ~6.8–7.4), we now recommend SNARF®-5F carboxylic acid (Figure 20.2.19), which has a pKa value of ~7.2, as the indicator with the optimal spectral properties for estimating cytosolic pH (Figure 20.2.20). SNARF®-4F carboxylic acid (Figure 20.2.21) has a somewhat more acidic pH sensitivity maximum (pKa ~6.4) but retains its dual-emission spectral properties (Figure 20.2.22). SNARF®-4F has been used for pH imaging in kidney tissues using two-photon excitation (780 nm) microscopy; the pH-depen-dent emission shi� response was observed to be essentially the same as seen with one-photon
Figure 20.2.15 Absorption and �uorescence emission (ex-cited at 514 nm) spectra of carboxy SNARF®-1 in pH 9.0 and pH 6.0 bu�ers.
Figure 20.2.16 Absorption and �uorescence emission (ex-cited at 488 nm) spectra of carboxy SNARF®-1 in pH 9.0 and pH 6.0 bu�ers.
Figure 20.2.14 The pH-dependent emission spectra of carboxy SNARF®-1 (C1270) when excited at A) 488 nm, B) 514 nm and C) 534 nm.
Figure 20.2.13 The pH-dependent absorption spectra of carboxy SNARF®-1 (C1270).
Wavelength (nm)
Ab
sorp
tion
A
B
C
The Molecular Probes™ Handbook: A Guide to Fluorescent Probes and Labeling Technologies
IMPORTANT NOTICE : The products described in this manual are covered by one or more Limited Use Label License(s). Please refer to the Appendix on page 971 and Master Product List on page 975. Products are For Research Use Only. Not intended for any animal or human therapeutic or diagnostic use.thermofisher.com/probes
Chapter 20 — pH Indicators
891www.invitrogen.com/probes
The Molecular Probes® Handbook: A Guide to Fluorescent Probes and Labeling TechnologiesIMPORTANT NOTICE: The products described in this manual are covered by one or more Limited Use Label License(s). Please refer to the Appendix on page 971 and Master Product List on page 975. Products are For Research Use Only. Not intended for any animal or human therapeutic or diagnostic use.
Section 20.2 Probes Useful at Near-Neutral pH
Figure 20.2.18 Selective loading of carboxy SNARF®-1 into mitochondria. BHK cells were loaded with 10 µM carboxy SNARF®-1, AM, acetate (C1271, C1272) for 10 minutes, followed by incubation for 4 hours at room temperature. A) Confocal image (488 nm excitation) of mitochondrial-selective loading of carboxy SNARF®-1 visualized through a 560–600 nm band-pass �lter. B) Confocal image of the same cells as in A, but using a 605 nm dichroic mirror and a 610 nm longpass �lter. C) Ratio image (A and B) of mitochondria in cells pseudocolored to represent di�erent pH levels. D) Change in mitochondrial pH following the addition of 10 µM carbonyl cyanide m-chlorophenylhydrazone (CCCP), resulting in a decrease (acidi�cation) of mitochondrial pH. Image contributed by Brian Herman, University of Texas Health Science Center, San Antonio, and reprinted with permission from Biotechniques 30, 804 (2001).
Figure 20.2.19 SNARF®-5F 5-(and-6)-carboxylic acid (S23922).
Figure 20.2.21 SNARF®-4F 5-(and-6)-carboxylic acid (S23920).
Figure 20.2.20 Fluorescence emission spectra of SNARF®-5F 5-(and 6-)carboxylic acid (S23922) as a function of pH.
Fluo
resc
ence
em
issi
on
Wavelength (nm)550 650 750
pH 9.0 Ex = 543 nm
7.2
7.47.8
8.2
600 700
6.8
6.66.4
5.0
Figure 20.2.17 Rat pituitary intermediate lobe melanotropes labeled with the indo-1 AM (I1203, I1223, I1226) and carboxy SNARF®-1, AM, acetate (C1271, C1272) indicators. Pseudocolored �uorescence from the dual-emission Ca2+ indicator indo-1 is shown at 405 and 475 nm (left panels). Pseudocolored �uorescence from the dual-emission pH indicator carboxy SNARF®-1 is shown at 575 and 640 nm (right panels). Image contributed by Stephen J. Morris, University of Missouri-Kansas City, and Diane M. Beatty, Molecular Probes, Inc.
excitation.93 �is study also reported nigericin calibrations that yielded di�erent pKa values (6.8 versus 7.4) in the kidney cortex and kidney ileum, respectively, emphasizing the importance of performing in situ calibrations. Both SNARF®-4F and SNARF®-5F 94 allow dual-excitation and dual-emission ratiometric pH measurements, making them compatible with the same instru-ment con�gurations used for carboxy SNARF®-1 in ratio imaging and �ow cytometry applica-tions. SNARF®-4F and SNARF®-5F are available as free carboxylic acids (S23920, S23922) and as cell-permeant AM ester acetate derivatives (S23921, S23923).
Figure 20.2.22 Fluorescence emission spectra of SNARF®-4F 5-(and 6-)carboxylic acid (S23920) showing the pH-dependent spectral shift that is characteristic of this and other SNARF® pH indicators.
The Molecular Probes™ Handbook: A Guide to Fluorescent Probes and Labeling Technologies
IMPORTANT NOTICE : The products described in this manual are covered by one or more Limited Use Label License(s). Please refer to the Appendix on page 971 and Master Product List on page 975. Products are For Research Use Only. Not intended for any animal or human therapeutic or diagnostic use.
thermofisher.com/probes
Chapter 20 — pH Indicators
892www.invitrogen.com/probes
The Molecular Probes® Handbook: A Guide to Fluorescent Probes and Labeling TechnologiesIMPORTANT NOTICE: The products described in this manual are covered by one or more Limited Use Label License(s). Please refer to the Appendix on page 971 and Master Product List on page 975. Products are For Research Use Only. Not intended for any animal or human therapeutic or diagnostic use.
Section 20.2 Probes Useful at Near-Neutral pH
REFERENCES1. J Fluorescence (1996) 6:147; 2. Spectrochim Acta A (1995) 51:7; 3. Photochem Photobiol (1994) 60:435; 4. J Luminescence (1975) 10:381; 5. J Phys Chem (1971) 75:245; 6. FEBS Lett (1994) 341:125; 7. J Immunol Methods (1993) 157:117; 8. Methods Mol Biol (1995) 43:211; 9. J Histochem Cytochem (1985) 33:77; 10. Cytometry (1995) 19:235; 11. Photochem Photobiol (1994) 60:274; 12. J Immunol Methods (1994) 172:115; 13. Biochemistry (1995) 34:1606; 14. Cytometry (1992) 13:739; 15. J Immunol Methods (1990) 130:251; 16. Proc Natl Acad Sci U S A (1984) 81:7436; 17. J Cell Biol (1982) 95:189; 18. Cytometry (1997) 28:42; 19. Methtods Cell Biol (2007) 81:415; 20. Biophys J (2006) 90:608; 21. Methods Cell Biol (1994) 41:135; 22. Biochemistry (1979) 18:2210; 23. Methods Enzymol (1990) 192:38; 24. J Cell Physiol (1992) 151:596; 25. J Fluorescence (1992) 2:191; 26. Biophys J (1996) 71:394; 27. J Gen Physiol (2009) 133:315; 28. Kidney Int (1998) 53:432; 29. Am J Physiol (1998) 274:F358; 30. J Membr Biol (1997) 159:253; 31. Biochemistry (1995) 34:15157; 32. J Biol Chem (1997) 272:25668; 33. J Biol Chem (2009) 284:19437; 34. P�ugers Arch (2008) 455:799; 35. Proc Natl Acad Sci U S A (2007) 104:9325; 36. J Biol Chem (2007) 282:3720; 37. Am J Physiol (1997) 273:F817; 38. Plant Physiol (1997) 113:451; 39. J Biol Chem (1998) 273:15920; 40. J Biol Chem (1998) 273:27162; 41. J Biol Chem (1996) 271:861; 42. J Biol Chem (2007) 282:2880; 43. J Biol Chem (2001) 276:514; 44. J Biol Chem (1996) 271:16260; 45. J Biol Chem (1997) 272:29810; 46. J Leukoc Biol (1997) 62:329; 47. J Biol Chem (1996) 271:2005; 48. J Biol Chem (2006) 281:22142; 49. Neuroscience (2008) 151:1084; 50. J Membr Biol (1994) 140:89; 51. Proc Natl Acad Sci U S A (2002) 99:9439; 52. Cancer Res (1994) 54:5670; 53. Biochemistry (1996) 35:13419; 54. Biophys J (2002) 83:1682; 55. Mol Membr Biol (1996) 13:173; 56. Biochim Biophys Acta (1991) 1115:75; 57. J Cell Biol (1990) 111:3129; 58. J Immunol Methods (1990) 133:87; 59. FEBS Lett (1986) 200:203; 60. Biotechniques (1985) 3:270; 61. J Biol Chem (1995) 270:4967; 62. Am J Physiol Gastrointest Liver Physiol (1995) 268:361; 63. Am J Physiol Gastrointest Liver Physiol (2001) 281:G833; 64. AAPS PharmSci (2002) 4:E21; 65. J Appl Microbiol (2000) 88:809; 66. Mikrochim Acta (1992) 108:133; 67. Anal Chem (1997) 69:863; 68. Anal Biochem (1991) 194:330; 69. Methods Enzymol (1999) 302:341; 70. Micron (1993) 24:573; 71. Am J Physiol (1998) 275:H1937; 72. Biophys J (1994) 66:942; 73. Cytometry (1993) 14:916; 74. J Immunol Methods (1998) 221:43; 75. J Cell Physiol (1998) 177:109; 76. Am J Physiol (1997) 273:C1783;
Figure 20.2.25 8-hydroxypyrene-1,3,6-trisulfonic acid, tri sodium salt (HPTS; pyranine, H348).
Figure 20.2.26 The pH-dependent absorption spectra of 8-hydroxypyrene-1,3,6-trisulfonic acid (HPTS, H348).
Figure 20.2.23 5-(and-6)-chloromethyl SNARF®-1, acetate (C6826).
(CH3)2N O
OO
OCCH3
O
ClH2C
5
6
Figure 20.2.24 Human neutrophils loaded with 5-(and-6)-chloromethyl SNARF®-1 acetate (C6826).
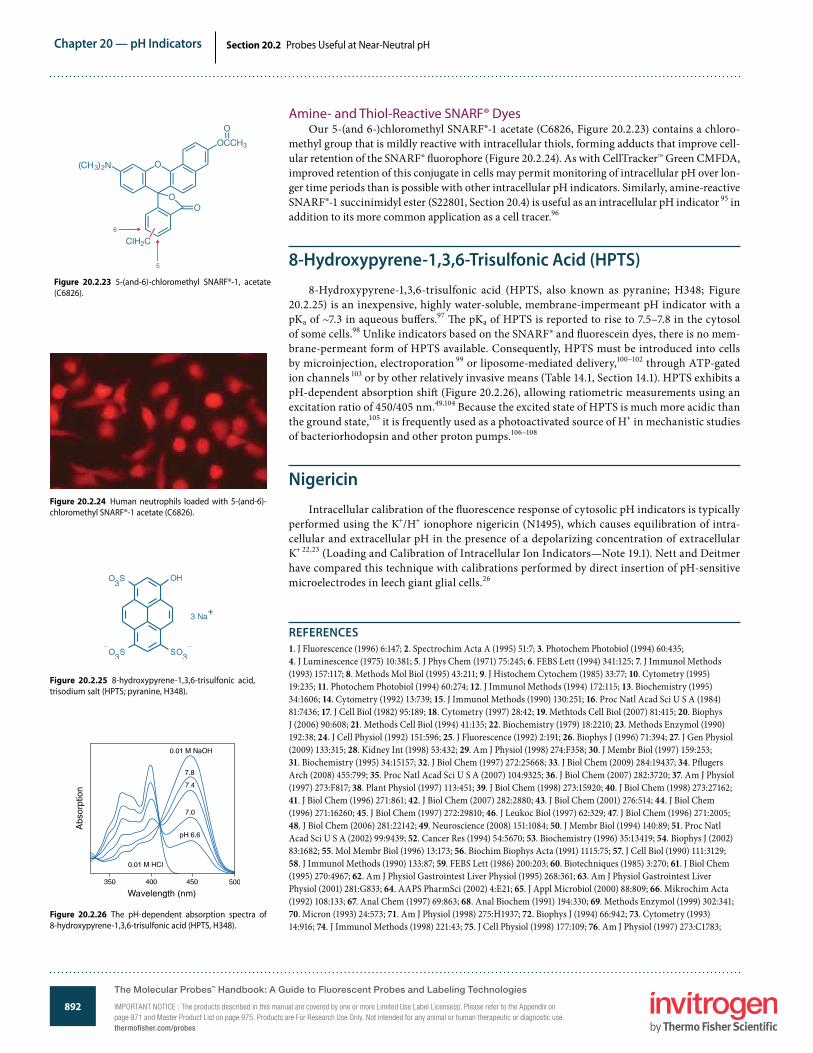
Amine- and Thiol-Reactive SNARF® DyesOur 5-(and 6-)chloromethyl SNARF®-1 acetate (C6826, Figure 20.2.23) contains a chloro-
methyl group that is mildly reactive with intracellular thiols, forming adducts that improve cell-ular retention of the SNARF® �uorophore (Figure 20.2.24). As with CellTracker™ Green CMFDA, improved retention of this conjugate in cells may permit monitoring of intracellular pH over lon-ger time periods than is possible with other intracellular pH indicators. Similarly, amine-reactive SNARF®-1 succinimidyl ester (S22801, Section 20.4) is useful as an intracellular pH indicator 95 in addition to its more common application as a cell tracer.96
8-Hydroxypyrene-1,3,6-Trisulfonic Acid (HPTS)8-Hydroxypyrene-1,3,6-trisulfonic acid (HPTS, also known as pyranine; H348; Figure
20.2.25) is an inexpensive, highly water-soluble, membrane-impermeant pH indicator with a pKa of ~7.3 in aqueous bu�ers.97 �e pKa of HPTS is reported to rise to 7.5–7.8 in the cytosol of some cells.98 Unlike indicators based on the SNARF® and �uorescein dyes, there is no mem-brane-permeant form of HPTS available. Consequently, HPTS must be introduced into cells by microinjection, electroporation 99 or liposome-mediated delivery,100–102 through ATP-gated ion channels 103 or by other relatively invasive means (Table 14.1, Section 14.1). HPTS exhibits a pH-dependent absorption shi� (Figure 20.2.26), allowing ratiometric measurements using an excitation ratio of 450/405 nm.49,104 Because the excited state of HPTS is much more acidic than the ground state,105 it is frequently used as a photoactivated source of H+ in mechanistic studies of bacteriorhodopsin and other proton pumps.106–108
NigericinIntracellular calibration of the �uorescence response of cytosolic pH indicators is typically
performed using the K+/H+ ionophore nigericin (N1495), which causes equilibration of intra-cellular and extracellular pH in the presence of a depolarizing concentration of extracellular K+ 22,23 (Loading and Calibration of Intracellular Ion Indicators—Note 19.1). Nett and Deitmer have compared this technique with calibrations performed by direct insertion of pH-sensitive microelectrodes in leech giant glial cells.26
The Molecular Probes™ Handbook: A Guide to Fluorescent Probes and Labeling Technologies
IMPORTANT NOTICE : The products described in this manual are covered by one or more Limited Use Label License(s). Please refer to the Appendix on page 971 and Master Product List on page 975. Products are For Research Use Only. Not intended for any animal or human therapeutic or diagnostic use.thermofisher.com/probes
Chapter 20 — pH Indicators
893www.invitrogen.com/probes
The Molecular Probes® Handbook: A Guide to Fluorescent Probes and Labeling TechnologiesIMPORTANT NOTICE: The products described in this manual are covered by one or more Limited Use Label License(s). Please refer to the Appendix on page 971 and Master Product List on page 975. Products are For Research Use Only. Not intended for any animal or human therapeutic or diagnostic use.
Section 20.2 Probes Useful at Near-Neutral pH
77. J Biomed Mater Res (1998) 39:9; 78. J Immunol Methods (1993) 159:145; 79. Anal Chem (1993) 65:2329; 80. J Photochem Photobiol B (1997) 37:18; 81. P�ugers Arch (1994) 427:332; 82. Anal Biochem (1992) 204:65; 83. J Fluorescence (1992) 2:75; 84. J Cell Physiol (1994) 161:129; 85. Cell Calcium (1996) 19:337; 86. Endocrinology (1993) 133:972; 87. J Physiol (2000) 528:25; 88. Cytometry (1996) 24:99; 89. P�ugers Arch (2004) 449:307; 90. Proc Natl Acad Sci U S A (2009) 106:16574; 91. Biophys J (2007) 92:641; 92. Biotechniques (2001) 30:804; 93. J Biol Chem (2007) 282:25141; 94. Bioorg
Med Chem Lett (2001) 11:2903; 95. Exp Cell Res (2004) 298:521; 96. Cytometry B Clin Cytom (2007) 72:458; 97. Fresenius Z Anal Chem (1983) 314:119; 98. Anal Biochem (2005) 347:34; 99. J Bacteriol (1995) 177:1017; 100. Pharm Res (1997) 14:1203; 101. Proc Natl Acad Sci U S A (1997) 94:8795; 102. Curr Eye Res (1997) 16:1073; 103. Am J Physiol (1998) 275:C1158; 104. Proc Natl Acad Sci U S A (1995) 92:3156; 105. J Phys Chem A (2007) 111:230; 106. Angew Chem Int Ed Engl (2009) 48:8523; 107. Biophys J (2003) 84:671; 108. Biochemistry (1996) 35:6604.
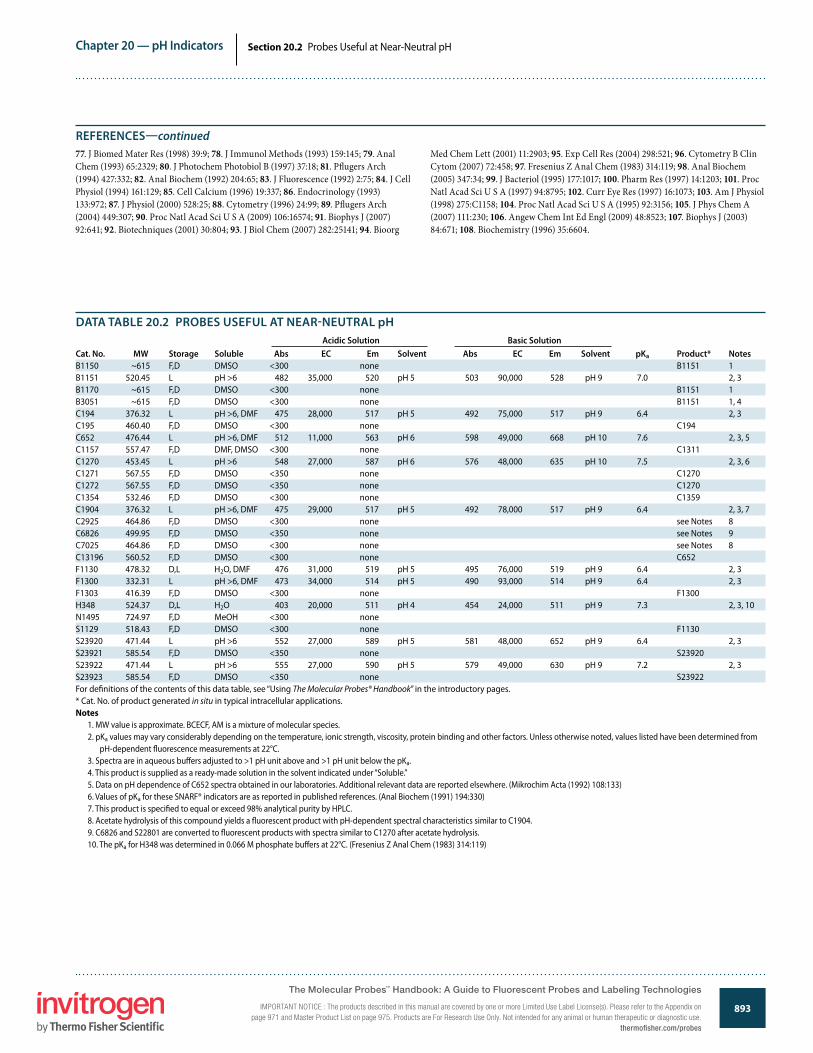
DATA TABLE 20.2 PROBES USEFUL AT NEAR-NEUTRAL pH Acidic Solution Basic Solution
Cat. No. MW Storage Soluble Abs EC Em Solvent Abs EC Em Solvent pKa Product* NotesB1150 ~615 F,D DMSO <300 none B1151 1B1151 520.45 L pH >6 482 35,000 520 pH 5 503 90,000 528 pH 9 7.0 2, 3B1170 ~615 F,D DMSO <300 none B1151 1B3051 ~615 F,D DMSO <300 none B1151 1, 4C194 376.32 L pH >6, DMF 475 28,000 517 pH 5 492 75,000 517 pH 9 6.4 2, 3C195 460.40 F,D DMSO <300 none C194C652 476.44 L pH >6, DMF 512 11,000 563 pH 6 598 49,000 668 pH 10 7.6 2, 3, 5C1157 557.47 F,D DMF, DMSO <300 none C1311C1270 453.45 L pH >6 548 27,000 587 pH 6 576 48,000 635 pH 10 7.5 2, 3, 6C1271 567.55 F,D DMSO <350 none C1270C1272 567.55 F,D DMSO <350 none C1270C1354 532.46 F,D DMSO <300 none C1359C1904 376.32 L pH >6, DMF 475 29,000 517 pH 5 492 78,000 517 pH 9 6.4 2, 3, 7C2925 464.86 F,D DMSO <300 none see Notes 8C6826 499.95 F,D DMSO <350 none see Notes 9C7025 464.86 F,D DMSO <300 none see Notes 8C13196 560.52 F,D DMSO <300 none C652F1130 478.32 D,L H2O, DMF 476 31,000 519 pH 5 495 76,000 519 pH 9 6.4 2, 3F1300 332.31 L pH >6, DMF 473 34,000 514 pH 5 490 93,000 514 pH 9 6.4 2, 3F1303 416.39 F,D DMSO <300 none F1300H348 524.37 D,L H2O 403 20,000 511 pH 4 454 24,000 511 pH 9 7.3 2, 3, 10N1495 724.97 F,D MeOH <300 noneS1129 518.43 F,D DMSO <300 none F1130S23920 471.44 L pH >6 552 27,000 589 pH 5 581 48,000 652 pH 9 6.4 2, 3S23921 585.54 F,D DMSO <350 none S23920S23922 471.44 L pH >6 555 27,000 590 pH 5 579 49,000 630 pH 9 7.2 2, 3S23923 585.54 F,D DMSO <350 none S23922For de�nitions of the contents of this data table, see “Using The Molecular Probes® Handbook” in the introductory pages.* Cat. No. of product generated in situ in typical intracellular applications.Notes
1. MW value is approximate. BCECF, AM is a mixture of molecular species.2. pKa values may vary considerably depending on the temperature, ionic strength, viscosity, protein binding and other factors. Unless otherwise noted, values listed have been determined from
pH-dependent �uorescence measurements at 22°C.3. Spectra are in aqueous bu�ers adjusted to >1 pH unit above and >1 pH unit below the pKa.4. This product is supplied as a ready-made solution in the solvent indicated under “Soluble.”5. Data on pH dependence of C652 spectra obtained in our laboratories. Additional relevant data are reported elsewhere. (Mikrochim Acta (1992) 108:133)6. Values of pKa for these SNARF® indicators are as reported in published references. (Anal Biochem (1991) 194:330)7. This product is speci�ed to equal or exceed 98% analytical purity by HPLC.8. Acetate hydrolysis of this compound yields a �uorescent product with pH-dependent spectral characteristics similar to C1904.9. C6826 and S22801 are converted to �uorescent products with spectra similar to C1270 after acetate hydrolysis.10. The pKa for H348 was determined in 0.066 M phosphate bu�ers at 22°C. (Fresenius Z Anal Chem (1983) 314:119)
REFERENCES—continued
The Molecular Probes™ Handbook: A Guide to Fluorescent Probes and Labeling Technologies
IMPORTANT NOTICE : The products described in this manual are covered by one or more Limited Use Label License(s). Please refer to the Appendix on page 971 and Master Product List on page 975. Products are For Research Use Only. Not intended for any animal or human therapeutic or diagnostic use.
thermofisher.com/probes
Chapter 20 — pH Indicators
894www.invitrogen.com/probes
The Molecular Probes® Handbook: A Guide to Fluorescent Probes and Labeling TechnologiesIMPORTANT NOTICE: The products described in this manual are covered by one or more Limited Use Label License(s). Please refer to the Appendix on page 971 and Master Product List on page 975. Products are For Research Use Only. Not intended for any animal or human therapeutic or diagnostic use.
Section 20.2 Probes Useful at Near-Neutral pH
20.3 Probes Useful at Acidic pH
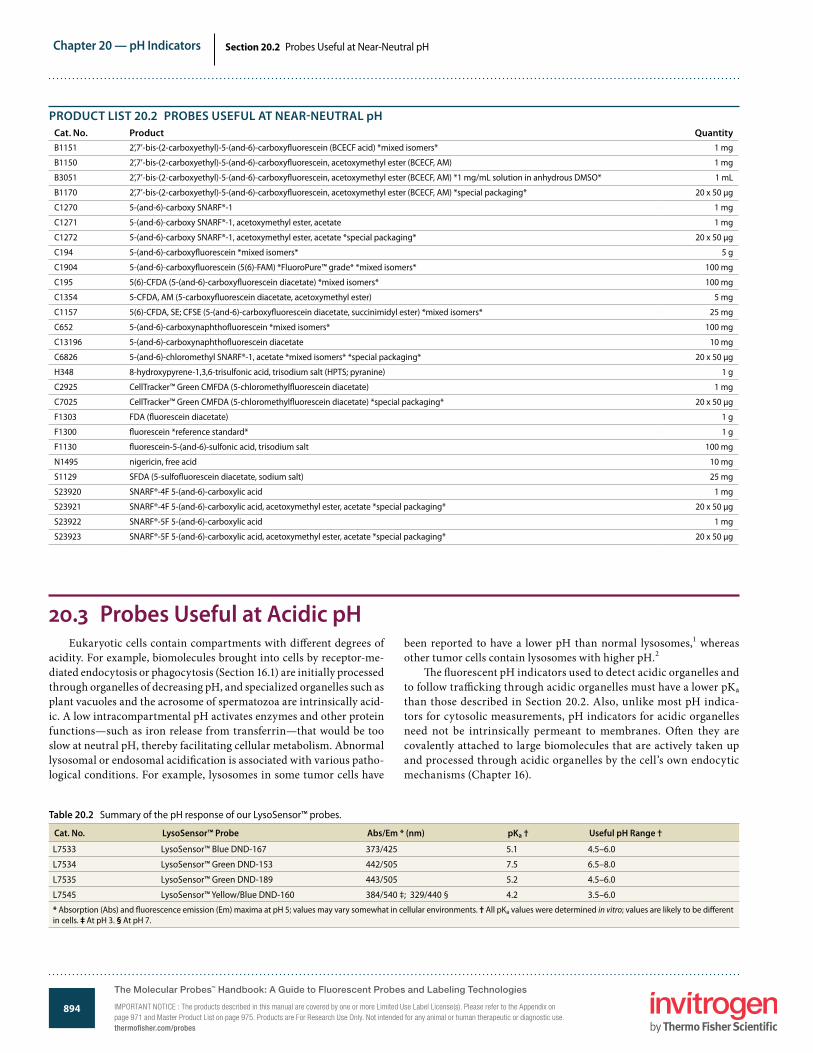
Table 20.2 Summary of the pH response of our LysoSensor™ probes.
Cat. No. LysoSensor™ Probe Abs/Em * (nm) pKa † Useful pH Range †
L7533 LysoSensor™ Blue DND-167 373/425 5.1 4.5–6.0
L7534 LysoSensor™ Green DND-153 442/505 7.5 6.5–8.0
L7535 LysoSensor™ Green DND-189 443/505 5.2 4.5–6.0
L7545 LysoSensor™ Yellow/Blue DND-160 384/540 ‡; 329/440 § 4.2 3.5–6.0
* Absorption (Abs) and �uorescence emission (Em) maxima at pH 5; values may vary somewhat in cellular environments. † All pKa values were determined in vitro; values are likely to be di�erent in cells. ‡ At pH 3. § At pH 7.
PRODUCT LIST 20.2 PROBES USEFUL AT NEAR-NEUTRAL pHCat. No. Product QuantityB1151 2’,7’-bis-(2-carboxyethyl)-5-(and-6)-carboxy�uorescein (BCECF acid) *mixed isomers* 1 mg
B1150 2’,7’-bis-(2-carboxyethyl)-5-(and-6)-carboxy�uorescein, acetoxymethyl ester (BCECF, AM) 1 mg
B3051 2’,7’-bis-(2-carboxyethyl)-5-(and-6)-carboxy�uorescein, acetoxymethyl ester (BCECF, AM) *1 mg/mL solution in anhydrous DMSO* 1 mL
B1170 2’,7’-bis-(2-carboxyethyl)-5-(and-6)-carboxy�uorescein, acetoxymethyl ester (BCECF, AM) *special packaging* 20 x 50 µg
C1270 5-(and-6)-carboxy SNARF®-1 1 mg
C1271 5-(and-6)-carboxy SNARF®-1, acetoxymethyl ester, acetate 1 mg
C1272 5-(and-6)-carboxy SNARF®-1, acetoxymethyl ester, acetate *special packaging* 20 x 50 µg
C194 5-(and-6)-carboxy�uorescein *mixed isomers* 5 g
C1904 5-(and-6)-carboxy�uorescein (5(6)-FAM) *FluoroPure™ grade* *mixed isomers* 100 mg
C195 5(6)-CFDA (5-(and-6)-carboxy�uorescein diacetate) *mixed isomers* 100 mg
C1354 5-CFDA, AM (5-carboxy�uorescein diacetate, acetoxymethyl ester) 5 mg
C1157 5(6)-CFDA, SE; CFSE (5-(and-6)-carboxy�uorescein diacetate, succinimidyl ester) *mixed isomers* 25 mg
C652 5-(and-6)-carboxynaphtho�uorescein *mixed isomers* 100 mg
C13196 5-(and-6)-carboxynaphtho�uorescein diacetate 10 mg
C6826 5-(and-6)-chloromethyl SNARF®-1, acetate *mixed isomers* *special packaging* 20 x 50 µg
H348 8-hydroxypyrene-1,3,6-trisulfonic acid, trisodium salt (HPTS; pyranine) 1 g
C2925 CellTracker™ Green CMFDA (5-chloromethyl�uorescein diacetate) 1 mg
C7025 CellTracker™ Green CMFDA (5-chloromethyl�uorescein diacetate) *special packaging* 20 x 50 µg
F1303 FDA (�uorescein diacetate) 1 g
F1300 �uorescein *reference standard* 1 g
F1130 �uorescein-5-(and-6)-sulfonic acid, trisodium salt 100 mg
N1495 nigericin, free acid 10 mg
S1129 SFDA (5-sulfo�uorescein diacetate, sodium salt) 25 mg
S23920 SNARF®-4F 5-(and-6)-carboxylic acid 1 mg
S23921 SNARF®-4F 5-(and-6)-carboxylic acid, acetoxymethyl ester, acetate *special packaging* 20 x 50 µg
S23922 SNARF®-5F 5-(and-6)-carboxylic acid 1 mg
S23923 SNARF®-5F 5-(and-6)-carboxylic acid, acetoxymethyl ester, acetate *special packaging* 20 x 50 µg
Eukaryotic cells contain compartments with di�erent degrees of acidity. For example, biomolecules brought into cells by receptor-me-diated endocytosis or phagocytosis (Section 16.1) are initially processed through organelles of decreasing pH, and specialized organelles such as plant vacuoles and the acrosome of spermatozoa are intrinsically acid-ic. A low intracompartmental pH activates enzymes and other protein functions—such as iron release from transferrin—that would be too slow at neutral pH, thereby facilitating cellular metabolism. Abnormal lysosomal or endosomal acidi�cation is associated with various patho-logical conditions. For example, lysosomes in some tumor cells have
been reported to have a lower pH than normal lysosomes,1 whereas other tumor cells contain lysosomes with higher pH.2
�e �uorescent pH indicators used to detect acidic organelles and to follow tra�cking through acidic organelles must have a lower pKa than those described in Section 20.2. Also, unlike most pH indica-tors for cytosolic measurements, pH indicators for acidic organelles need not be intrinsically permeant to membranes. O�en they are covalently attached to large biomolecules that are actively taken up and processed through acidic organelles by the cell’s own endocytic mechanisms (Chapter 16).
The Molecular Probes™ Handbook: A Guide to Fluorescent Probes and Labeling Technologies
IMPORTANT NOTICE : The products described in this manual are covered by one or more Limited Use Label License(s). Please refer to the Appendix on page 971 and Master Product List on page 975. Products are For Research Use Only. Not intended for any animal or human therapeutic or diagnostic use.thermofisher.com/probes
Chapter 20 — pH Indicators
895www.invitrogen.com/probes
The Molecular Probes® Handbook: A Guide to Fluorescent Probes and Labeling TechnologiesIMPORTANT NOTICE: The products described in this manual are covered by one or more Limited Use Label License(s). Please refer to the Appendix on page 971 and Master Product List on page 975. Products are For Research Use Only. Not intended for any animal or human therapeutic or diagnostic use.
Section 20.3 Probes Useful at Acidic pH
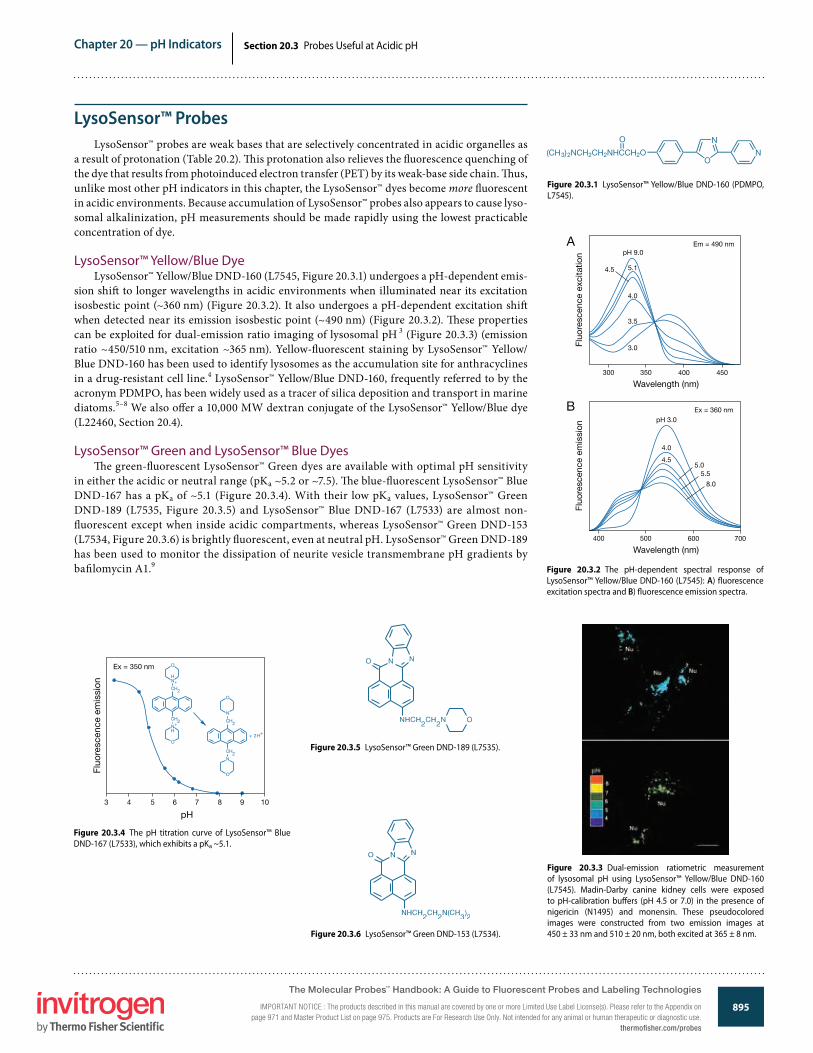
LysoSensor™ ProbesLysoSensor™ probes are weak bases that are selectively concentrated in acidic organelles as
a result of protonation (Table 20.2). �is protonation also relieves the �uorescence quenching of the dye that results from photoinduced electron transfer (PET) by its weak-base side chain. �us, unlike most other pH indicators in this chapter, the LysoSensor™ dyes become more �uorescent in acidic environments. Because accumulation of LysoSensor™ probes also appears to cause lyso-somal alkalinization, pH measurements should be made rapidly using the lowest practicable concentration of dye.
LysoSensor™ Yellow/Blue DyeLysoSensor™ Yellow/Blue DND-160 (L7545, Figure 20.3.1) undergoes a pH-dependent emis-
sion shi� to longer wavelengths in acidic environments when illuminated near its excitation isosbestic point (~360 nm) (Figure 20.3.2). It also undergoes a pH-dependent excitation shi� when detected near its emission isosbestic point (~490 nm) (Figure 20.3.2). �ese properties can be exploited for dual-emission ratio imaging of lysosomal pH 3 (Figure 20.3.3) (emission ratio ~450/510 nm, excitation ~365 nm). Yellow-�uorescent staining by LysoSensor™ Yellow/Blue DND-160 has been used to identify lysosomes as the accumulation site for anthracyclines in a drug-resistant cell line.4 LysoSensor™ Yellow/Blue DND-160, frequently referred to by the acronym PDMPO, has been widely used as a tracer of silica deposition and transport in marine diatoms.5–8 We also o�er a 10,000 MW dextran conjugate of the LysoSensor™ Yellow/Blue dye (L22460, Section 20.4).
LysoSensor™ Green and LysoSensor™ Blue Dyes�e green-�uorescent LysoSensor™ Green dyes are available with optimal pH sensitivity
in either the acidic or neutral range (pKa ~5.2 or ~7.5). �e blue-�uorescent LysoSensor™ Blue DND-167 has a pKa of ~5.1 (Figure 20.3.4). With their low pKa values, LysoSensor™ Green DND-189 (L7535, Figure 20.3.5) and LysoSensor™ Blue DND-167 (L7533) are almost non-�uorescent except when inside acidic compartments, whereas LysoSensor™ Green DND-153 (L7534, Figure 20.3.6) is brightly �uorescent, even at neutral pH. LysoSensor™ Green DND-189 has been used to monitor the dissipation of neurite vesicle transmembrane pH gradients by ba�lomycin A1.9 Figure 20.3.2 The pH-dependent spectral response of
LysoSensor™ Yellow/Blue DND-160 (L7545): A) �uorescence excitation spectra and B) �uorescence emission spectra.
Ex = 360 nm
Fluo
resc
ence
em
issi
on
Wavelength (nm)400 500 600 700
pH 3.0
4.0
4.55.0
5.5
8.0
Em = 490 nm
Fluo
resc
ence
exc
itatio
n
Wavelength (nm)300 350 400 450
pH 9.0
5.14.5
4.0
3.5
3.0
A
B
Figure 20.3.3 Dual-emission ratiometric measurement of lysosomal pH using LysoSensor™ Yellow/Blue DND-160 (L7545). Madin-Darby canine kidney cells were exposed to pH-calibration bu�ers (pH 4.5 or 7.0) in the presence of nigericin (N1495) and monensin. These pseudocolored images were constructed from two emission images at 450 ± 33 nm and 510 ± 20 nm, both excited at 365 ± 8 nm.
N
ON(CH3)2NCH2CH2NHCCH2O
O
Figure 20.3.1 LysoSensor™ Yellow/Blue DND-160 (PDMPO, L7545).
Figure 20.3.5 LysoSensor™ Green DND-189 (L7535).
Figure 20.3.4 The pH titration curve of LysoSensor™ Blue DND-167 (L7533), which exhibits a pKa ~5.1.
CH2
CH2N
O
N
O
+ 2 H+
CH2
CH2N
O
N
O
H
H
+
+
pH
Fluo
resc
ence
em
issi
on
Ex = 350 nm
3 4 5 6 7 8 9 10
Figure 20.3.6 LysoSensor™ Green DND-153 (L7534).
The Molecular Probes™ Handbook: A Guide to Fluorescent Probes and Labeling Technologies
IMPORTANT NOTICE : The products described in this manual are covered by one or more Limited Use Label License(s). Please refer to the Appendix on page 971 and Master Product List on page 975. Products are For Research Use Only. Not intended for any animal or human therapeutic or diagnostic use.
thermofisher.com/probes
Chapter 20 — pH Indicators
896www.invitrogen.com/probes
The Molecular Probes® Handbook: A Guide to Fluorescent Probes and Labeling TechnologiesIMPORTANT NOTICE: The products described in this manual are covered by one or more Limited Use Label License(s). Please refer to the Appendix on page 971 and Master Product List on page 975. Products are For Research Use Only. Not intended for any animal or human therapeutic or diagnostic use.
Section 20.3 Probes Useful at Acidic pH
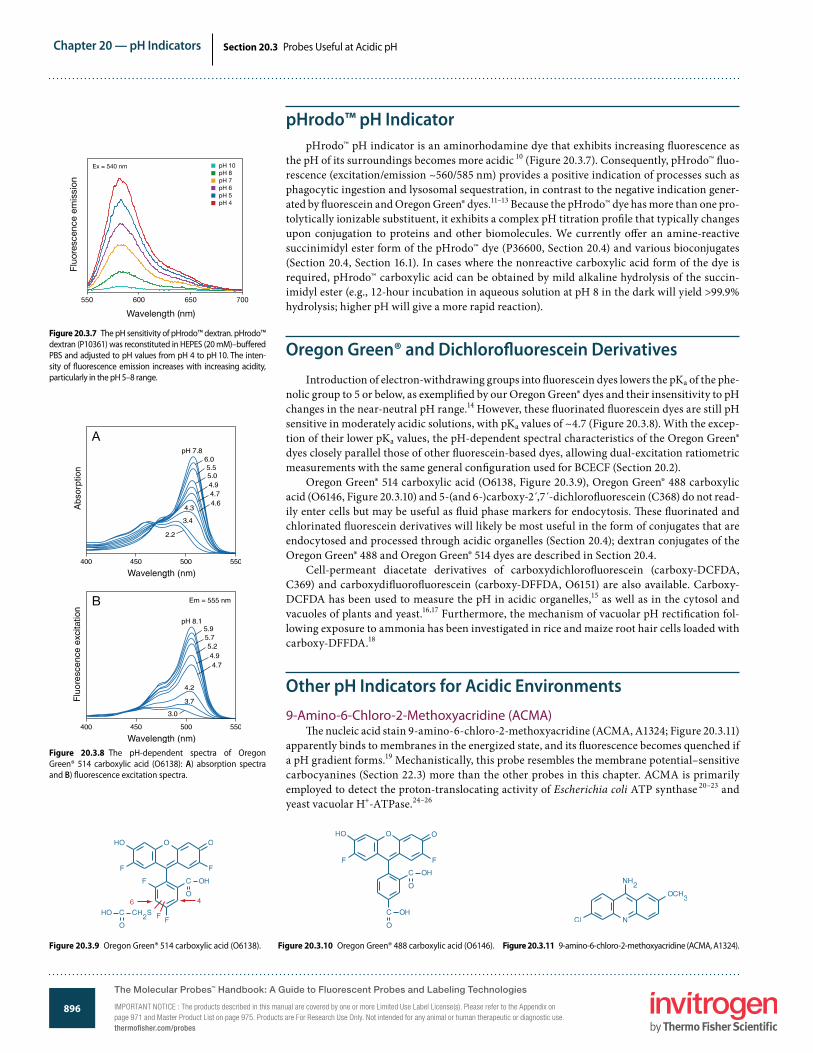
pHrodo™ pH IndicatorpHrodo™ pH indicator is an aminorhodamine dye that exhibits increasing �uorescence as
the pH of its surroundings becomes more acidic 10 (Figure 20.3.7). Consequently, pHrodo™ �uo-rescence (excitation/emission ~560/585 nm) provides a positive indication of processes such as phagocytic ingestion and lysosomal sequestration, in contrast to the negative indication gener-ated by �uorescein and Oregon Green® dyes.11–13 Because the pHrodo™ dye has more than one pro-tolytically ionizable substituent, it exhibits a complex pH titration pro�le that typically changes upon conjugation to proteins and other biomolecules. We currently o�er an amine-reactive succinimidyl ester form of the pHrodo™ dye (P36600, Section 20.4) and various bioconjugates (Section 20.4, Section 16.1). In cases where the nonreactive carboxylic acid form of the dye is required, pHrodo™ carboxylic acid can be obtained by mild alkaline hydrolysis of the succin-imidyl ester (e.g., 12-hour incubation in aqueous solution at pH 8 in the dark will yield >99.9% hydrolysis; higher pH will give a more rapid reaction).
Oregon Green® and Dichloro�uorescein DerivativesIntroduction of electron-withdrawing groups into �uorescein dyes lowers the pKa of the phe-
nolic group to 5 or below, as exempli�ed by our Oregon Green® dyes and their insensitivity to pH changes in the near-neutral pH range.14 However, these �uorinated �uorescein dyes are still pH sensitive in moderately acidic solutions, with pKa values of ~4.7 (Figure 20.3.8). With the excep-tion of their lower pKa values, the pH-dependent spectral characteristics of the Oregon Green® dyes closely parallel those of other �uorescein-based dyes, allowing dual-excitation ratiometric measurements with the same general con�guration used for BCECF (Section 20.2).
Oregon Green® 514 carboxylic acid (O6138, Figure 20.3.9), Oregon Green® 488 carboxylic acid (O6146, Figure 20.3.10) and 5-(and 6-)carboxy-2 ,́7 -́dichloro�uorescein (C368) do not read-ily enter cells but may be useful as �uid phase markers for endocytosis. �ese �uorinated and chlorinated �uorescein derivatives will likely be most useful in the form of conjugates that are endocytosed and processed through acidic organelles (Section 20.4); dextran conjugates of the Oregon Green® 488 and Oregon Green® 514 dyes are described in Section 20.4.
Cell-permeant diacetate derivatives of carboxydichloro�uorescein (carboxy-DCFDA, C369) and carboxydi�uoro�uorescein (carboxy-DFFDA, O6151) are also available. Carboxy-DCFDA has been used to measure the pH in acidic organelles,15 as well as in the cytosol and vacuoles of plants and yeast.16,17 Furthermore, the mechanism of vacuolar pH recti�cation fol-lowing exposure to ammonia has been investigated in rice and maize root hair cells loaded with carboxy-DFFDA.18
Other pH Indicators for Acidic Environments9-Amino-6-Chloro-2-Methoxyacridine (ACMA)
�e nucleic acid stain 9-amino-6-chloro-2-methoxyacridine (ACMA, A1324; Figure 20.3.11) apparently binds to membranes in the energized state, and its �uorescence becomes quenched if a pH gradient forms.19 Mechanistically, this probe resembles the membrane potential–sensitive carbocyanines (Section 22.3) more than the other probes in this chapter. ACMA is primarily employed to detect the proton-translocating activity of Escherichia coli ATP synthase 20–23 and yeast vacuolar H+-ATPase.24–26
Figure 20.3.7 The pH sensitivity of pHrodo™ dextran. pHrodo™ dextran (P10361) was reconstituted in HEPES (20 mM)–bu�ered PBS and adjusted to pH values from pH 4 to pH 10. The inten-sity of �uorescence emission increases with increasing acidity, particularly in the pH 5–8 range.
550 650600 700
pH 10pH 8pH 7pH 6
pH 4pH 5
Wavelength (nm)
Fluo
resc
ence
em
issi
on
Ex = 540 nm
Figure 20.3.8 The pH-dependent spectra of Oregon Green® 514 carboxylic acid (O6138): A) absorption spectra and B) �uorescence excitation spectra.
A
B
Figure 20.3.10 Oregon Green® 488 carboxylic acid (O6146).Figure 20.3.9 Oregon Green® 514 carboxylic acid (O6138). Figure 20.3.11 9-amino-6-chloro-2-methoxyacridine (ACMA, A1324).
The Molecular Probes™ Handbook: A Guide to Fluorescent Probes and Labeling Technologies
IMPORTANT NOTICE : The products described in this manual are covered by one or more Limited Use Label License(s). Please refer to the Appendix on page 971 and Master Product List on page 975. Products are For Research Use Only. Not intended for any animal or human therapeutic or diagnostic use.thermofisher.com/probes

Chapter 20 — pH Indicators
897www.invitrogen.com/probes
The Molecular Probes® Handbook: A Guide to Fluorescent Probes and Labeling TechnologiesIMPORTANT NOTICE: The products described in this manual are covered by one or more Limited Use Label License(s). Please refer to the Appendix on page 971 and Master Product List on page 975. Products are For Research Use Only. Not intended for any animal or human therapeutic or diagnostic use.
Section 20.3 Probes Useful at Acidic pH
8-Hydroxypyrene-1,3,6-Trisulfonic Acid (HPTS)Although 8-hydroxypyrene-1,3,6-trisulfonic acid (HPTS, H348;
Section 20.2) has a pKa ~7.3 and is primarily used as a pH indicator in the near-neutral range, it o�ers several advantages for monitoring intraorganelle pH in endosomal/lysosomal pathways: 27
• �e highly polar character that results from its three sulfonic acid groups prevents leakage across intracellular membranes.
• Uptake by �uid-phase endocytosis is e�cient and easily accomplished.• Determination of excitation ratios allows pH measurements that
are independent of vesicular size and indicator concentration.• Precise calibration permits pH values as low as 4.4 to be accurately
measured.• HPTS is nontoxic and does not perturb normal physiological
function.
HPTS can be introduced into cells by microinjection, electropora-tion or liposome-mediated delivery or through ATP-gated ion chan-nels.28 HPTS has also been loaded into cells using a patch pipette.29 HPTS has been reported to be less phototoxic than BCECF.28
REFERENCES1. J Cell Sci (1994) 107:2381; 2. Biochemistry (1996) 35:2811; 3. Chem Biol (1999) 6:411; 4. Blood (1997) 89:3745; 5. Proc Natl Acad Sci U S A (2008) 105:1579; 6. Eukaryot Cell (2007) 6:271; 7. Limnol Oceanogr Meth (2005) 3:462; 8. Chem Biol (2001) 8:1051; 9. J Neurochem (1997) 69:1927; 10. Mol Biosyst (2010) 6:888; 11. J Biol Chem (2009) 284:35926; 12. J Immunol Methods (2009) 342:71; 13. J Immunol (2008) 181:4043; 14. J Org Chem (1997) 62:6469; 15. Anal Biochem (1990) 187:109; 16. Plant Physiol (1992) 98:680; 17. Methods Enzymol (1991) 194:644; 18. Planta (1998) 206:154; 19. Biochim Biophys Acta (1983) 722:107; 20. J Biol Chem (1998) 273:16229; 21. Biochemistry (1998) 37:10846; 22. J Biol Chem (1998) 273:16241; 23. Biochim Biophys Acta (1993) 1183:161; 24. J Biol Chem (1996) 271:22487; 25. J Biol Chem (1996) 271:2018; 26. J Biol Chem (1994) 269:13224; 27. Proc Natl Acad Sci U S A (1995) 92:3156; 28. Am J Physiol (1998) 275:C1158; 29. J Physiol (2001) 530:405.
DATA TABLE 20.3 PROBES USEFUL AT ACIDIC pH Acidic Solution Neutral/Basic Solution
Cat. No. MW Storage Soluble Abs EC Em Solvent Abs EC Em Solvent pKa NotesA1324 258.71 L DMF, DMSO 412 8200 471 MeOH see Notes see Notes 8.6 1, 2C368 445.21 L pH >6, DMF 495 38,000 529 pH 4 504 107,000 529 pH 8 4.8 3, 4C369 529.29 F,D DMSO <300 none 5L7533 376.50 F,D,L DMSO 373 11,000 425 pH 3 373 11,000 425 pH 7 5.1 3, 4, 6, 7L7534 356.43 F,D,L DMSO 442 17,000 505 pH 5 442 17,000 505 pH 9 7.5 3, 4, 6, 7L7535 398.46 F,D,L DMSO 443 16,000 505 pH 3 443 16,000 505 pH 7 5.2 3, 4, 6, 7L7545 366.42 F,D,L DMSO 384 21,000 540 pH 3 329 23,000 440 pH 7 4.2 3, 4, 6, 8O6138 512.36 L pH >6, DMF 489 26,000 526 pH 3 506 86,000 526 pH 9 4.7 3, 4, 9O6146 412.30 L pH >6, DMF 478 27,000 518 pH 3 492 85,000 518 pH 9 4.7 3, 4, 10O6151 496.38 F,D DMSO <300 none 11For de�nitions of the contents of this data table, see “Using The Molecular Probes® Handbook” in the introductory pages.Notes
1. Absorption and �uorescence spectra of the protonated and deprotonated forms of A1324 are quite similar. This observation, and the listed pKa value, are reported in published references. (Eur Biophys J (1986) 13:251) Accumulation of the probe in the presence of transmembrane pH gradients results in �uorescence quenching. (Biochim Biophys Acta (1983) 722:107)
2. Spectra of this compound are in methanol acidi�ed with a trace of HCl.3. pKa values may vary considerably depending on the temperature, ionic strength, viscosity, protein binding and other factors. Unless otherwise noted, values listed have been determined from
pH-dependent �uorescence measurements at 22°C.4. Spectra are in aqueous bu�ers adjusted to >1 pH unit above and >1 pH unit below the pKa.5. C369 is converted to a �uorescent product (C368) after acetate hydrolysis.6. This product is supplied as a ready-made solution in the solvent indicated under “Soluble.”7. This LysoSensor™ dye exhibits increasing �uorescence as pH decreases with no spectral shift. L7533 has additional absorption and �uorescence emission peaks at Abs = 394 nm and
Em = 401 nm.8. The pKa value for this product is determined from the pH-dependent variation of the absorption spectrum.9. The �uorescence lifetime (τ) of the Oregon Green® 514 dye in pH 9.0 bu�er at 20°C is 4.2 nanoseconds. Data provided by the SPEX Fluorescence Group, Horiba Jobin Yvon, Inc.10. The �uorescence lifetime (τ) of the Oregon Green® 488 dye in pH 9.0 bu�er at 20°C is 4.1 nanoseconds. Data provided by the SPEX Fluorescence Group, Horiba Jobin Yvon, Inc.11. Acetate hydrolysis of this compound yields a �uorescent product with spectral characteristics similar to O6146.
The Molecular Probes™ Handbook: A Guide to Fluorescent Probes and Labeling Technologies
IMPORTANT NOTICE : The products described in this manual are covered by one or more Limited Use Label License(s). Please refer to the Appendix on page 971 and Master Product List on page 975. Products are For Research Use Only. Not intended for any animal or human therapeutic or diagnostic use.
thermofisher.com/probes

Chapter 20 — pH Indicators
898www.invitrogen.com/probes
The Molecular Probes® Handbook: A Guide to Fluorescent Probes and Labeling TechnologiesIMPORTANT NOTICE: The products described in this manual are covered by one or more Limited Use Label License(s). Please refer to the Appendix on page 971 and Master Product List on page 975. Products are For Research Use Only. Not intended for any animal or human therapeutic or diagnostic use.
Section 20.4 pH Indicator Conjugates
20.4 pH Indicator Conjugates
Table 20.3 Molecular Probes® pH indicator dextrans, in order of decreasing pKa.
Dye Cat. No. pKa * Measurement Wavelengths Application NotesSNARF® D3303, D3304 ~7.5 Emission ratio 580/640 nm excited at 514 or 488 nm • Best conjugate for ratiometric emission measurements
BCECF D1878, D1880 ~7.0 Excitation ratio 490/440 nm detected at 530 nm • Best conjugate for ratiometric excitation measurements
Fluorescein D1821, D1823, D1844, D3305
~6.4 Excitation ratio 490/450 nm detected at 520 nm • Fluorescence is strongly quenched upon uptake into acidic organelles
Fluorescein and tetramethylrhodamine
D1951 ~6.4 Excitation ratio 495/555 nm detected at 580 nm † • Conjugate incorporating both pH-sensitive and pH-insensitive �uorescent dyes
pHrodo™ P10361 NA ‡ Emission at 585 nm when excited at 540–560 nm • Best conjugate for measurements requiring broad-range pH sensitivity
Oregon Green® 488 D7170, D7172 ~4.7 Excitation ratio 490/440 nm detected at 520 nm • Good photostability• Optimum pH sensitivity for measurements in lysosomes and late
endosomes
Oregon Green® 514 D7176 ~4.7 Excitation ratio 510/450 nm detected at 530 nm • Excellent photostability• Optimum pH sensitivity for measurements in lysosomes and late
endosomes
LysoSensor™ Yellow/Blue
L22460 ~4.2 Excitation ratio 340/400 nm detected at 520 nm; emission ratio 450/510 nm excited at 365 nm
• Options for dual excitation or dual emission ratio measurements• Optimum pH sensitivity for measurements in lysosomes and late
endosomes* pKa values are those determined for the free dyes. Actual values for dextran conjugates may di�er by up to ± 0.3 pH units and may vary with production lots. † Ratiometric emission measurements at 520/580 nm (with excitation at 495 nm) are also possible in principle; however, the response may be complicated by �uorescence resonance energy transfer. NA = Not applicable. ‡ pHrodo™ pH indicator exhibits a complex pH titration pro�le. Decreasing pH (from pH 9 to pH 2) produces a continuous (but nonlinear) �uorescence increase.
PRODUCT LIST 20.3 PROBES USEFUL AT ACIDIC pHCat. No. Product QuantityA1324 9-amino-6-chloro-2-methoxyacridine (ACMA) 100 mg
C368 5-(and-6)-carboxy-2’,7’-dichloro�uorescein *mixed isomers* 100 mg
C369 5-(and-6)-carboxy-2’,7’-dichloro�uorescein diacetate (carboxy-DCFDA) *mixed isomers* 100 mg
L7533 LysoSensor™ Blue DND-167 *1 mM solution in DMSO* *special packaging* 20 x 50 µL
L7534 LysoSensor™ Green DND-153 *1 mM solution in DMSO* *special packaging* 20 x 50 µL
L7535 LysoSensor™ Green DND-189 *1 mM solution in DMSO* *special packaging* 20 x 50 µL
L7545 LysoSensor™ Yellow/Blue DND-160 (PDMPO) *1 mM solution in DMSO* 20 x 50 µL
O6146 Oregon Green® 488 carboxylic acid *5-isomer* 5 mg
O6151 Oregon Green® 488 carboxylic acid diacetate (carboxy-DFFDA) *6-isomer* 5 mg
O6138 Oregon Green® 514 carboxylic acid 5 mg
�is section includes our selection of pH indicators conjugated to dextrans and lipids, as well as our chemically reactive pH indicators for preparing new pH-sensitive conjugates. �e pH indicator conjugates described below include both those useful at near-neutral pH and those useful in acidic environments.
pH Indicator Dextrans�e pH-sensitive properties of the pH indicators described in
Section 20.2 and Section 20.3 are usually not signi�cantly a�ected upon conjugation to dextrans. However, coupling of pH indicators to these inert polysaccharides changes several other properties of the dyes:
• Conjugates have high water solubility and therefore must be loaded into cells by microinjection, whole-cell patch-clamping, endocyto-sis or liposome fusion or by using the In�ux™ pinocytic cell loading reagent (I14402, Section 19.8).
• Once loaded, dextrans are retained in viable cells for long periods and (at least those dextrans with average molecular weights above 3000) will not pass through gap junctions.
• Attachment to a dextran signi�cantly decreases the likelihood that the indicator will become compartmentalized, thereby avoiding a substantial problem associated with cell-permeant acetoxymethyl (AM) ester derivatives.1
�e properties of some of the most useful pH indicator dextrans are listed in Table 20.3 in approximate order of decreasing pKa value. Our numerous labeled dextrans are discussed in Section 14.5 and listed in Table 14.4.
pHrodo™ Dextran�e 10,000 MW pHrodo™ dextran (P10361) is a superior alternative
to other �uorescent dextran conjugates (e.g., BCECF and tetramethyl-rhodamine) for live-cell imaging of endocytosis 2 (Section 16.1). pHrodo™ dextran possesses a pH-sensitive �uorescence emission that increases in intensity with increasing acidity (Figure 20.4.1). pHrodo™ dextran is essentially non�uorescent in the extracellular environment; however, upon internalization, the acidic environment of the endosomes elicits a bright, red-�uorescent signal from this dextran conjugate. �e minimal �uorescent signal from the pHrodo™ dextran conjugate at neutral pH prevents the detection of noninternalized and nonspeci�cally bound
The Molecular Probes™ Handbook: A Guide to Fluorescent Probes and Labeling Technologies
IMPORTANT NOTICE : The products described in this manual are covered by one or more Limited Use Label License(s). Please refer to the Appendix on page 971 and Master Product List on page 975. Products are For Research Use Only. Not intended for any animal or human therapeutic or diagnostic use.thermofisher.com/probes
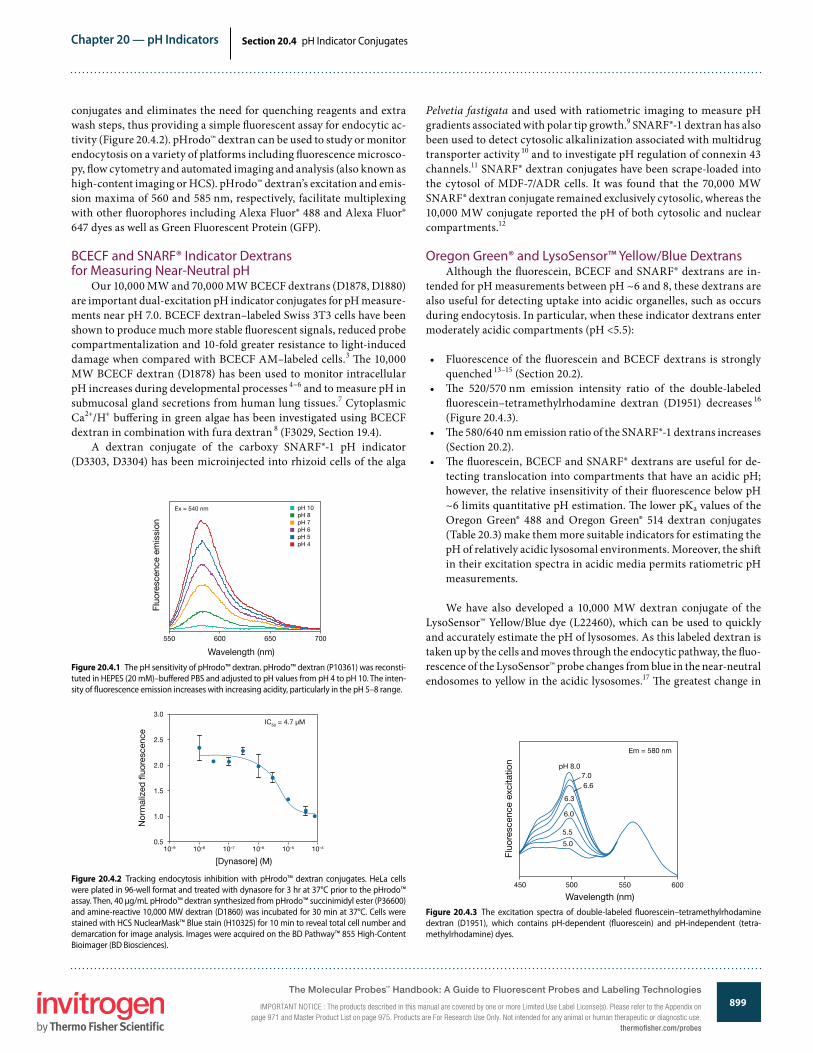
Chapter 20 — pH Indicators
899www.invitrogen.com/probes
The Molecular Probes® Handbook: A Guide to Fluorescent Probes and Labeling TechnologiesIMPORTANT NOTICE: The products described in this manual are covered by one or more Limited Use Label License(s). Please refer to the Appendix on page 971 and Master Product List on page 975. Products are For Research Use Only. Not intended for any animal or human therapeutic or diagnostic use.
Section 20.4 pH Indicator Conjugates
conjugates and eliminates the need for quenching reagents and extra wash steps, thus providing a simple �uorescent assay for endocytic ac-tivity (Figure 20.4.2). pHrodo™ dextran can be used to study or monitor endocytosis on a variety of platforms including �uorescence microsco-py, �ow cytometry and automated imaging and analysis (also known as high-content imaging or HCS). pHrodo™ dextran’s excitation and emis-sion maxima of 560 and 585 nm, respectively, facilitate multiplexing with other �uorophores including Alexa Fluor® 488 and Alexa Fluor® 647 dyes as well as Green Fluorescent Protein (GFP).
BCECF and SNARF® Indicator Dextrans for Measuring Near-Neutral pH
Our 10,000 MW and 70,000 MW BCECF dextrans (D1878, D1880) are important dual-excitation pH indicator conjugates for pH measure-ments near pH 7.0. BCECF dextran–labeled Swiss 3T3 cells have been shown to produce much more stable �uorescent signals, reduced probe compartmentalization and 10-fold greater resistance to light-induced damage when compared with BCECF AM–labeled cells.3 �e 10,000 MW BCECF dextran (D1878) has been used to monitor intracellular pH increases during developmental processes 4–6 and to measure pH in submucosal gland secretions from human lung tissues.7 Cytoplasmic Ca2+/H+ bu�ering in green algae has been investigated using BCECF dextran in combination with fura dextran 8 (F3029, Section 19.4).
A dextran conjugate of the carboxy SNARF®-1 pH indicator (D3303, D3304) has been microinjected into rhizoid cells of the alga
Figure 20.4.1 The pH sensitivity of pHrodo™ dextran. pHrodo™ dextran (P10361) was reconsti-tuted in HEPES (20 mM)–bu�ered PBS and adjusted to pH values from pH 4 to pH 10. The inten-sity of �uorescence emission increases with increasing acidity, particularly in the pH 5–8 range.
550 650600 700
pH 10pH 8pH 7pH 6
pH 4pH 5
Wavelength (nm)
Fluo
resc
ence
em
issi
on
Ex = 540 nm
Figure 20.4.2 Tracking endocytosis inhibition with pHrodo™ dextran conjugates. HeLa cells were plated in 96-well format and treated with dynasore for 3 hr at 37°C prior to the pHrodo™ assay. Then, 40 µg/mL pHrodo™ dextran synthesized from pHrodo™ succinimidyl ester (P36600) and amine-reactive 10,000 MW dextran (D1860) was incubated for 30 min at 37°C. Cells were stained with HCS NuclearMask™ Blue stain (H10325) for 10 min to reveal total cell number and demarcation for image analysis. Images were acquired on the BD Pathway™ 855 High-Content Bioimager (BD Biosciences).
[Dynasore] (M)10–9 10–510–610–710–8 10–4
0.5
Nor
mal
ized
�uo
resc
ence
1.0
1.5
2.0
2.5
3.0IC50 = 4.7 µM
Figure 20.4.3 The excitation spectra of double-labeled �uorescein–tetramethylrhodamine dextran (D1951), which contains pH-dependent (�uorescein) and pH-independent (tetra-methylrhodamine) dyes.
6.3
5.0
6.0
5.5
pH 8.07.06.6
Em = 580 nm
Fluo
resc
ence
exc
itatio
n
Wavelength (nm)450 500 550 600
Pelvetia fastigata and used with ratiometric imaging to measure pH gradients associated with polar tip growth.9 SNARF®-1 dextran has also been used to detect cytosolic alkalinization associated with multidrug transporter activity 10 and to investigate pH regulation of connexin 43 channels.11 SNARF® dextran conjugates have been scrape-loaded into the cytosol of MDF-7/ADR cells. It was found that the 70,000 MW SNARF® dextran conjugate remained exclusively cytosolic, whereas the 10,000 MW conjugate reported the pH of both cytosolic and nuclear compartments.12
Oregon Green® and LysoSensor™ Yellow/Blue DextransAlthough the �uorescein, BCECF and SNARF® dextrans are in-
tended for pH measurements between pH ~6 and 8, these dextrans are also useful for detecting uptake into acidic organelles, such as occurs during endocytosis. In particular, when these indicator dextrans enter moderately acidic compartments (pH <5.5):
• Fluorescence of the �uorescein and BCECF dextrans is strongly quenched 13–15 (Section 20.2).
• �e 520/570 nm emission intensity ratio of the double-labeled �uorescein–tetramethylrhodamine dextran (D1951) decreases 16 (Figure 20.4.3).
• �e 580/640 nm emission ratio of the SNARF®-1 dextrans increases (Section 20.2).
• �e �uorescein, BCECF and SNARF® dextrans are useful for de-tecting translocation into compartments that have an acidic pH; however, the relative insensitivity of their �uorescence below pH ~6 limits quantitative pH estimation. �e lower pKa values of the Oregon Green® 488 and Oregon Green® 514 dextran conjugates (Table 20.3) make them more suitable indicators for estimating the pH of relatively acidic lysosomal environments. Moreover, the shi� in their excitation spectra in acidic media permits ratiometric pH measurements.
We have also developed a 10,000 MW dextran conjugate of the LysoSensor™ Yellow/Blue dye (L22460), which can be used to quickly and accurately estimate the pH of lysosomes. As this labeled dextran is taken up by the cells and moves through the endocytic pathway, the �uo-rescence of the LysoSensor™ probe changes from blue in the near-neutral endosomes to yellow in the acidic lysosomes.17 �e greatest change in
The Molecular Probes™ Handbook: A Guide to Fluorescent Probes and Labeling Technologies
IMPORTANT NOTICE : The products described in this manual are covered by one or more Limited Use Label License(s). Please refer to the Appendix on page 971 and Master Product List on page 975. Products are For Research Use Only. Not intended for any animal or human therapeutic or diagnostic use.
thermofisher.com/probes
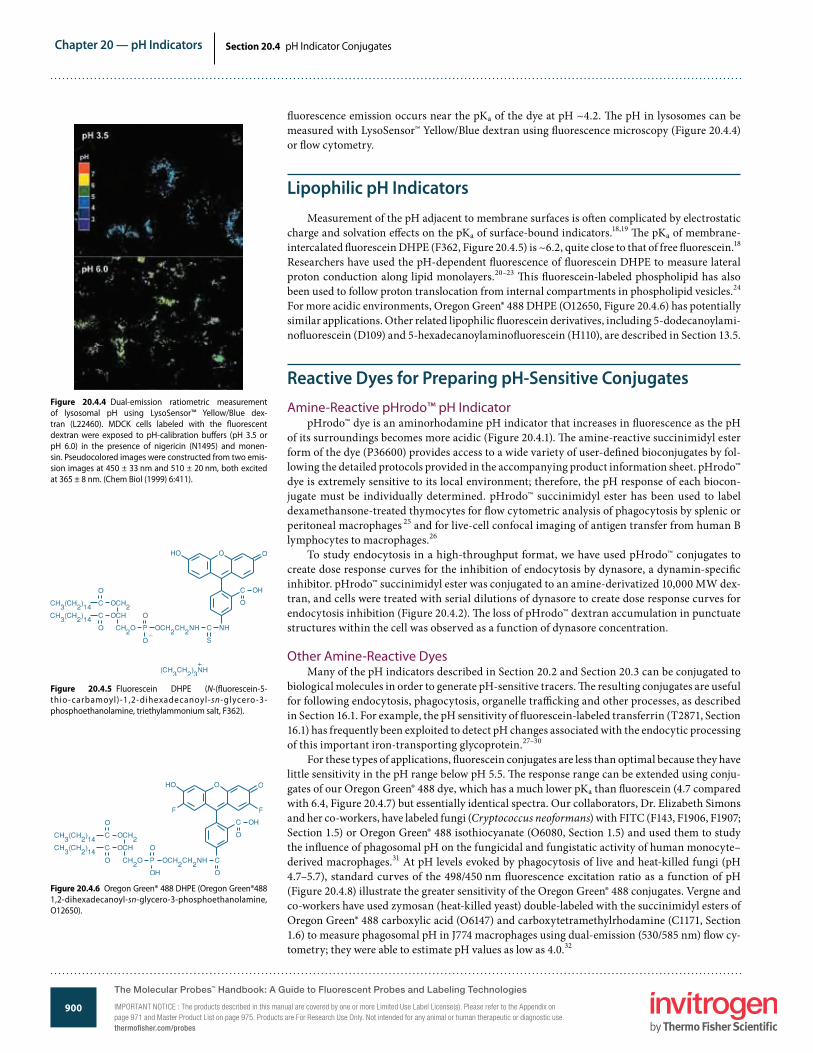
Chapter 20 — pH Indicators
900www.invitrogen.com/probes
The Molecular Probes® Handbook: A Guide to Fluorescent Probes and Labeling TechnologiesIMPORTANT NOTICE: The products described in this manual are covered by one or more Limited Use Label License(s). Please refer to the Appendix on page 971 and Master Product List on page 975. Products are For Research Use Only. Not intended for any animal or human therapeutic or diagnostic use.
Section 20.4 pH Indicator Conjugates
�uorescence emission occurs near the pKa of the dye at pH ~4.2. �e pH in lysosomes can be measured with LysoSensor™ Yellow/Blue dextran using �uorescence microscopy (Figure 20.4.4) or �ow cytometry.
Lipophilic pH IndicatorsMeasurement of the pH adjacent to membrane surfaces is o�en complicated by electrostatic
charge and solvation e�ects on the pKa of surface-bound indicators.18,19 �e pKa of membrane-intercalated �uorescein DHPE (F362, Figure 20.4.5) is ~6.2, quite close to that of free �uorescein.18 Researchers have used the pH-dependent �uorescence of �uorescein DHPE to measure lateral proton conduction along lipid monolayers.20–23 �is �uorescein-labeled phospholipid has also been used to follow proton translocation from internal compartments in phospholipid vesicles.24 For more acidic environments, Oregon Green® 488 DHPE (O12650, Figure 20.4.6) has potentially similar applications. Other related lipophilic �uorescein derivatives, including 5-dodecanoylami-no�uorescein (D109) and 5-hexadecanoylamino�uorescein (H110), are described in Section 13.5.
Reactive Dyes for Preparing pH-Sensitive ConjugatesAmine-Reactive pHrodo™ pH Indicator
pHrodo™ dye is an aminorhodamine pH indicator that increases in �uorescence as the pH of its surroundings becomes more acidic (Figure 20.4.1). �e amine-reactive succinimidyl ester form of the dye (P36600) provides access to a wide variety of user-de�ned bioconjugates by fol-lowing the detailed protocols provided in the accompanying product information sheet. pHrodo™ dye is extremely sensitive to its local environment; therefore, the pH response of each biocon-jugate must be individually determined. pHrodo™ succinimidyl ester has been used to label dexamethansone-treated thymocytes for �ow cytometric analysis of phagocytosis by splenic or peritoneal macrophages 25 and for live-cell confocal imaging of antigen transfer from human B lymphocytes to macrophages.26
To study endocytosis in a high-throughput format, we have used pHrodo™ conjugates to create dose response curves for the inhibition of endocytosis by dynasore, a dynamin-speci�c inhibitor. pHrodo™ succinimidyl ester was conjugated to an amine-derivatized 10,000 MW dex-tran, and cells were treated with serial dilutions of dynasore to create dose response curves for endocytosis inhibition (Figure 20.4.2). �e loss of pHrodo™ dextran accumulation in punctuate structures within the cell was observed as a function of dynasore concentration.
Other Amine-Reactive DyesMany of the pH indicators described in Section 20.2 and Section 20.3 can be conjugated to
biological molecules in order to generate pH-sensitive tracers. �e resulting conjugates are useful for following endocytosis, phagocytosis, organelle tra�cking and other processes, as described in Section 16.1. For example, the pH sensitivity of �uorescein-labeled transferrin (T2871, Section 16.1) has frequently been exploited to detect pH changes associated with the endocytic processing of this important iron-transporting glycoprotein.27–30
For these types of applications, �uorescein conjugates are less than optimal because they have little sensitivity in the pH range below pH 5.5. �e response range can be extended using conju-gates of our Oregon Green® 488 dye, which has a much lower pKa than �uorescein (4.7 compared with 6.4, Figure 20.4.7) but essentially identical spectra. Our collaborators, Dr. Elizabeth Simons and her co-workers, have labeled fungi (Cryptococcus neoformans) with FITC (F143, F1906, F1907; Section 1.5) or Oregon Green® 488 isothiocyanate (O6080, Section 1.5) and used them to study the in�uence of phagosomal pH on the fungicidal and fungistatic activity of human monocyte–derived macrophages.31 At pH levels evoked by phagocytosis of live and heat-killed fungi (pH 4.7–5.7), standard curves of the 498/450 nm �uorescence excitation ratio as a function of pH (Figure 20.4.8) illustrate the greater sensitivity of the Oregon Green® 488 conjugates. Vergne and co-workers have used zymosan (heat-killed yeast) double-labeled with the succinimidyl esters of Oregon Green® 488 carboxylic acid (O6147) and carboxytetramethylrhodamine (C1171, Section 1.6) to measure phagosomal pH in J774 macrophages using dual-emission (530/585 nm) �ow cy-tometry; they were able to estimate pH values as low as 4.0.32
Figure 20.4.5 Fluorescein DHPE (N-(�uorescein-5-thio- carbamoyl)-1,2- dihexadecanoyl-sn-glycero-3-phosphoethanolamine, triethylammonium salt, F362).
Figure 20.4.6 Oregon Green® 488 DHPE (Oregon Green®488 1,2-dihexadecanoyl-sn-glycero-3-phosphoethanolamine, O12650).
Figure 20.4.4 Dual-emission ratiometric measurement of lysosomal pH using LysoSensor™ Yellow/Blue dex-tran (L22460). MDCK cells labeled with the �uorescent dextran were exposed to pH-calibration bu�ers (pH 3.5 or pH 6.0) in the presence of nigericin (N1495) and monen-sin. Pseudocolored images were constructed from two emis-sion images at 450 ± 33 nm and 510 ± 20 nm, both excited at 365 ± 8 nm. (Chem Biol (1999) 6:411).
The Molecular Probes™ Handbook: A Guide to Fluorescent Probes and Labeling Technologies
IMPORTANT NOTICE : The products described in this manual are covered by one or more Limited Use Label License(s). Please refer to the Appendix on page 971 and Master Product List on page 975. Products are For Research Use Only. Not intended for any animal or human therapeutic or diagnostic use.thermofisher.com/probes

Chapter 20 — pH Indicators
901www.invitrogen.com/probes
The Molecular Probes® Handbook: A Guide to Fluorescent Probes and Labeling TechnologiesIMPORTANT NOTICE: The products described in this manual are covered by one or more Limited Use Label License(s). Please refer to the Appendix on page 971 and Master Product List on page 975. Products are For Research Use Only. Not intended for any animal or human therapeutic or diagnostic use.
Section 20.4 pH Indicator Conjugates
Many of the reagents or methods required to prepare conjugates have been described in Chapter 1. �e most common method of producing a useful conjugate is the reaction of amines with succinimidyl ester or isothiocyanate derivatives of the pH indicator. Examples of amine-re-active pH indicators include the succinimidyl esters of the carboxy SNARF®-1 and carboxynaph-tho�uorescein dyes (S22801, C653). �e succinimidyl ester of the chlorinated �uorescein de-rivative 6-JOE (pKa ~11.5, C6171MP; Section 1.5) can be used to prepare conjugates that are responsive to alkaline pH levels. When the amine-reactive pH indicator is not available, sulfos-uccinimidyl esters can generally be prepared in situ simply by dissolving the carboxylic acid dye in a bu�er that contains N-hydroxysulfosuccinimide and 1-ethyl-3-(3-dimethylaminopropyl)carbodiimide (NHSS, H2249; EDAC, E2247; Section 3.4); this method was used to activate SNARF®-4F carboxylic acid (S23920, Section 20.2) for labeling 5 -́amine–modi�ed oligonucle-otides.33 Addition of NHSS to the bu�er has been shown to enhance the yield of carbodiimide-mediated conjugations.34 Suitable amine-reactive pH indicators or dyes that can be made reactive using EDAC/NHSS are listed in Table 20.4. Figure 20.4.7 Comparison of pH-dependent �uorescence
of the Oregon Green® 488 (d), carboxy�uorescein (s) and Alexa Fluor® 488 (h) �uorophores. Fluorescence intensities were measured for equal concentrations of the three dyes using excitation/emission at 490/520 nm.
1 2 3 4 5 6 7 8 9 10
pH
Fluo
resc
ence
em
issi
on
Oregon Green® 488
Carboxy�uorescein
Alexa Fluor ® 488
Figure 20.4.8 Calibration curves for intraphagosomal pH measurements using fungi (Cryptococcus neofor-mans) labeled with Oregon Green® 488 isothiocyanate (O6080) or �uorescein isothiocyanate (FITC; F143, F1906, F1907). Human monocyte–derived macrophages laden with phagocytosed C. neoformans were exposed to pH-con-trolled bu�ers in the presence of the K+/H+ ionophore nige-ricin (N1495). The 498/450 nm �uorescence excitation ratios corresponding to di�erent pH levels were measured in a spectro�uorometer. The data were provided by Elizabeth Simons, Boston University.
FITCOregon Green® 488
498/
450
nm e
xcita
tion
ratio
pH3.5 4.0 5.0 5.5 8.0
6.5
5.5
3.5
2.0
4.0
4.5
5.0
6.0
4.5
3.0
2.5
6.0 6.5 7.0 7.5
Table 20.4 Reactive pH indicator dyes.
pH Indicator Preferred Reactive Form
BCECF BCECF (B1151, Section 20.2) *
Carboxy�uorescein 5-(and 6-)carboxy�uorescein, succinimidyl ester (C1311, Section 1.5)
6-JOE 6-carboxy-4’,5’-dichloro-2’,7’-dimethoxy�uorescein, succinimidyl ester (C6171MP, Section 1.5)
Naphtho�uorescein 5-(and 6-)carboxynaphtho�uorescein, succinimidyl ester (C653)
Oregon Green® 488 Oregon Green® 488 carboxylic acid, succinimidyl ester (O6147, O6149)
Oregon Green® 514 Oregon Green® 514 carboxylic acid, succinimidyl ester (O6139)
pHrodo™ pHrodo™ succinimidyl ester (P36600)
SNARF®-1 SNARF®-1 carboxylic acid, acetate, succinimidyl ester (S22801)5-(and 6-)carboxy SNARF®-1 (C1270, Section 20.2) *
SNARF®-4F SNARF®-4F carboxylic acid (S23920, Section 20.2) *
SNARF®-5F SNARF®-5F carboxylic acid (S23922, Section 20.2) *
* Carboxylic acids require activation with EDAC/NHSS before reaction with amines.
REFERENCES1. J Exp Biol (1994) 196:419; 2. J Biol Chem (2009) 284:35926; 3. J Cell Physiol (1989) 141:410; 4. Dev Biol (1997) 191:53; 5. Development (1994) 120:433; 6. Dev Biol (1993) 156:176; 7. Proc Natl Acad Sci U S A (2001) 98:8119; 8. Protoplasma (1997) 198:107; 9. Science (1994) 263:1419; 10. J Histochem Cytochem (1990) 38:685; 11. Biophys J (1996) 70:1294; 12. Proc Natl Acad Sci U S A (1999) 96:4432; 13. Proc Natl Acad Sci U S A (1994) 91:4811; 14. J Biol Chem (1993) 268:25320; 15. J Cell Sci (1993) 105:861; 16. J Cell Biol (1995) 130:821; 17. Nucleic Acids Res (2002) 30:1338; 18. Biochim Biophys Acta (1988) 939:289; 19. J Phys Chem (1977) 81:1755; 20. Biochemistry (1990) 29:59; 21. J Am Chem Soc (1991) 113:8818; 22. Eur J Biochem (1987) 162:379; 23. Nature (1986) 322:756; 24. Biochim Biophys Acta (1984) 766:161; 25. J Immunol Methods (2009) 342:71; 26. J Immunol (2008) 181:4043; 27. Biochemistry (1992) 31:5820; 28. Cell (1984) 37:789; 29. J Biol Chem (1991) 266:3469; 30. J Biol Chem (1990) 265:6688; 31. Infect Immun (1999) 67:885; 32. Anal Biochem (1998) 255:127; 33. Bioconjug Chem (2005) 16:986; 34. Anal Biochem (1986) 156:220.
DATA TABLE 20.4 pH INDICATOR CONJUGATES Acidic Solution Basic Solution
Cat. No. MW Storage Soluble Abs EC Em Solvent Abs EC Em Solvent pKa NotesC653 573.51 F,D,L DMF, DMSO 515 10,000 565 pH 6 602 42,000 672 pH 10 7.6 1, 2D1821 see Notes F,L H2O 473 ND 514 pH 5 490 ND 513 pH 9 6.4 1, 3, 4, 5D1823 see Notes F,L H2O 473 ND 514 pH 5 490 ND 514 pH 9 6.4 1, 3, 4, 5D1844 see Notes F,L H2O 473 ND 514 pH 5 490 ND 514 pH 9 6.4 1, 3, 4, 5D1878 see Notes F,L H2O 482 ND 520 pH 5 503 ND 528 pH 9 7.0 1, 3, 4, 5D1880 see Notes F,L H2O 482 ND 520 pH 5 503 ND 528 pH 9 7.0 1, 3, 4, 5D1951 see Notes F,L H2O see Notes see Notes ND 1, 3, 4, 6D3303 see Notes F,L H2O 548 ND 587 pH 6 576 ND 635 pH 10 7.5 1, 3, 4, 5D3304 see Notes F,L H2O 548 ND 587 pH 6 576 ND 635 pH 10 7.5 1, 3, 4, 5D3305 see Notes F,L H2O 473 ND 514 pH 5 490 ND 514 pH 9 6.4 1, 3, 4, 5D7170 see Notes F,L H2O 478 ND 518 pH 3 492 ND 518 pH 9 4.7 1, 3, 4, 5
continued on next page
The Molecular Probes™ Handbook: A Guide to Fluorescent Probes and Labeling Technologies
IMPORTANT NOTICE : The products described in this manual are covered by one or more Limited Use Label License(s). Please refer to the Appendix on page 971 and Master Product List on page 975. Products are For Research Use Only. Not intended for any animal or human therapeutic or diagnostic use.
thermofisher.com/probes
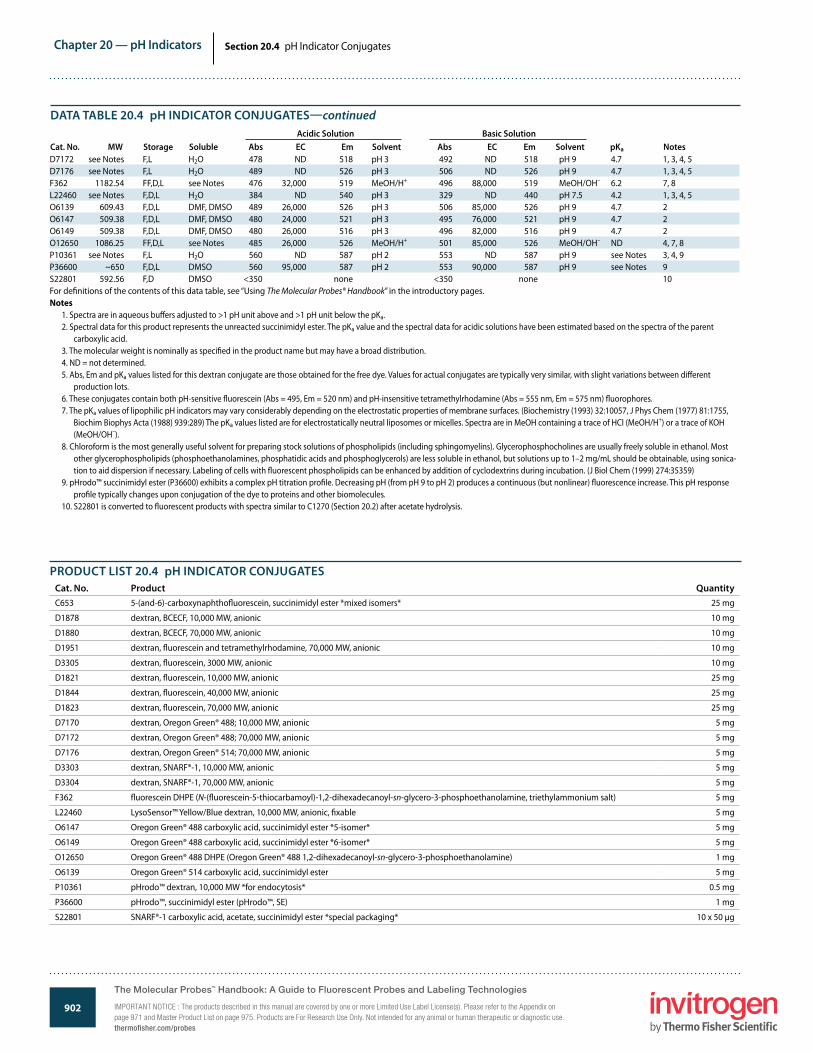
Chapter 20 — pH Indicators
902www.invitrogen.com/probes
The Molecular Probes® Handbook: A Guide to Fluorescent Probes and Labeling TechnologiesIMPORTANT NOTICE: The products described in this manual are covered by one or more Limited Use Label License(s). Please refer to the Appendix on page 971 and Master Product List on page 975. Products are For Research Use Only. Not intended for any animal or human therapeutic or diagnostic use.
Section 20.4 pH Indicator Conjugates
D7172 see Notes F,L H2O 478 ND 518 pH 3 492 ND 518 pH 9 4.7 1, 3, 4, 5D7176 see Notes F,L H2O 489 ND 526 pH 3 506 ND 526 pH 9 4.7 1, 3, 4, 5F362 1182.54 FF,D,L see Notes 476 32,000 519 MeOH/H+ 496 88,000 519 MeOH/OH– 6.2 7, 8L22460 see Notes F,D,L H2O 384 ND 540 pH 3 329 ND 440 pH 7.5 4.2 1, 3, 4, 5O6139 609.43 F,D,L DMF, DMSO 489 26,000 526 pH 3 506 85,000 526 pH 9 4.7 2O6147 509.38 F,D,L DMF, DMSO 480 24,000 521 pH 3 495 76,000 521 pH 9 4.7 2O6149 509.38 F,D,L DMF, DMSO 480 26,000 516 pH 3 496 82,000 516 pH 9 4.7 2O12650 1086.25 FF,D,L see Notes 485 26,000 526 MeOH/H+ 501 85,000 526 MeOH/OH– ND 4, 7, 8P10361 see Notes F,L H2O 560 ND 587 pH 2 553 ND 587 pH 9 see Notes 3, 4, 9P36600 ~650 F,D,L DMSO 560 95,000 587 pH 2 553 90,000 587 pH 9 see Notes 9S22801 592.56 F,D DMSO <350 none <350 none 10For de�nitions of the contents of this data table, see “Using The Molecular Probes® Handbook” in the introductory pages.Notes
1. Spectra are in aqueous bu�ers adjusted to >1 pH unit above and >1 pH unit below the pKa.2. Spectral data for this product represents the unreacted succinimidyl ester. The pKa value and the spectral data for acidic solutions have been estimated based on the spectra of the parent
carboxylic acid.3. The molecular weight is nominally as speci�ed in the product name but may have a broad distribution.4. ND = not determined.5. Abs, Em and pKa values listed for this dextran conjugate are those obtained for the free dye. Values for actual conjugates are typically very similar, with slight variations between di�erent
production lots.6. These conjugates contain both pH-sensitive �uorescein (Abs = 495, Em = 520 nm) and pH-insensitive tetramethylrhodamine (Abs = 555 nm, Em = 575 nm) �uorophores.7. The pKa values of lipophilic pH indicators may vary considerably depending on the electrostatic properties of membrane surfaces. (Biochemistry (1993) 32:10057, J Phys Chem (1977) 81:1755,
Biochim Biophys Acta (1988) 939:289) The pKa values listed are for electrostatically neutral liposomes or micelles. Spectra are in MeOH containing a trace of HCl (MeOH/H+) or a trace of KOH (MeOH/OH–).
8. Chloroform is the most generally useful solvent for preparing stock solutions of phospholipids (including sphingomyelins). Glycerophosphocholines are usually freely soluble in ethanol. Most other glycerophospholipids (phosphoethanolamines, phosphatidic acids and phosphoglycerols) are less soluble in ethanol, but solutions up to 1–2 mg/mL should be obtainable, using sonica-tion to aid dispersion if necessary. Labeling of cells with �uorescent phospholipids can be enhanced by addition of cyclodextrins during incubation. (J Biol Chem (1999) 274:35359)
9. pHrodo™ succinimidyl ester (P36600) exhibits a complex pH titration pro�le. Decreasing pH (from pH 9 to pH 2) produces a continuous (but nonlinear) �uorescence increase. This pH response pro�le typically changes upon conjugation of the dye to proteins and other biomolecules.
10. S22801 is converted to �uorescent products with spectra similar to C1270 (Section 20.2) after acetate hydrolysis.
PRODUCT LIST 20.4 pH INDICATOR CONJUGATESCat. No. Product QuantityC653 5-(and-6)-carboxynaphtho�uorescein, succinimidyl ester *mixed isomers* 25 mg
D1878 dextran, BCECF, 10,000 MW, anionic 10 mg
D1880 dextran, BCECF, 70,000 MW, anionic 10 mg
D1951 dextran, �uorescein and tetramethylrhodamine, 70,000 MW, anionic 10 mg
D3305 dextran, �uorescein, 3000 MW, anionic 10 mg
D1821 dextran, �uorescein, 10,000 MW, anionic 25 mg
D1844 dextran, �uorescein, 40,000 MW, anionic 25 mg
D1823 dextran, �uorescein, 70,000 MW, anionic 25 mg
D7170 dextran, Oregon Green® 488; 10,000 MW, anionic 5 mg
D7172 dextran, Oregon Green® 488; 70,000 MW, anionic 5 mg
D7176 dextran, Oregon Green® 514; 70,000 MW, anionic 5 mg
D3303 dextran, SNARF®-1, 10,000 MW, anionic 5 mg
D3304 dextran, SNARF®-1, 70,000 MW, anionic 5 mg
F362 �uorescein DHPE (N-(�uorescein-5-thiocarbamoyl)-1,2-dihexadecanoyl-sn-glycero-3-phosphoethanolamine, triethylammonium salt) 5 mg
L22460 LysoSensor™ Yellow/Blue dextran, 10,000 MW, anionic, �xable 5 mg
O6147 Oregon Green® 488 carboxylic acid, succinimidyl ester *5-isomer* 5 mg
O6149 Oregon Green® 488 carboxylic acid, succinimidyl ester *6-isomer* 5 mg
O12650 Oregon Green® 488 DHPE (Oregon Green® 488 1,2-dihexadecanoyl-sn-glycero-3-phosphoethanolamine) 1 mg
O6139 Oregon Green® 514 carboxylic acid, succinimidyl ester 5 mg
P10361 pHrodo™ dextran, 10,000 MW *for endocytosis* 0.5 mg
P36600 pHrodo™, succinimidyl ester (pHrodo™, SE) 1 mg
S22801 SNARF®-1 carboxylic acid, acetate, succinimidyl ester *special packaging* 10 x 50 µg
DATA TABLE 20.4 pH INDICATOR CONJUGATES—continued Acidic Solution Basic Solution
Cat. No. MW Storage Soluble Abs EC Em Solvent Abs EC Em Solvent pKa Notes
The Molecular Probes™ Handbook: A Guide to Fluorescent Probes and Labeling Technologies
IMPORTANT NOTICE : The products described in this manual are covered by one or more Limited Use Label License(s). Please refer to the Appendix on page 971 and Master Product List on page 975. Products are For Research Use Only. Not intended for any animal or human therapeutic or diagnostic use.thermofisher.com/probes
Related Documents