Chapter 20 Copyright ©2010 by South-Western, a division of Cengage Learning. All rights reserved 1 ECON Designed by Amy McGuire, B-books, Ltd. McEachern 2010-2011 20 CHAPTER Internationa l Finance Micro

Welcome message from author
This document is posted to help you gain knowledge. Please leave a comment to let me know what you think about it! Share it to your friends and learn new things together.
Transcript
Chapter 20 Copyright ©2010 by South-Western, a division of Cengage Learning. All rights reserved 1
ECON
Designed byAmy McGuire, B-books, Ltd.
McEachern 2010-2011
20
CHAPTERInternational Finance
Micro

Chapter 20 Copyright ©2010 by South-Western, a division of Cengage Learning. All rights reserved 2
LO1
Balance of Payments International economic transactions
Flow of transactions – period of time
May not involve cash payments
Double-entry bookkeeping
Credits
Inflow of receipts from the rest
of the world
Debits
Outflows of payments to the
rest of the world
Individual accounts
Chapter 20 Copyright ©2010 by South-Western, a division of Cengage Learning. All rights reserved 3
LO1
Balance of Payments
Merchandise trade balance: Trade in goods
Value of merchandise exports minus the
value of merchandise imports
Credits: Value of U.S. merchandise exports
Debits: Value of U.S. merchandise imports
Surplus: exports exceed imports
Deficit: imports exceed exports
Chapter 20 Copyright ©2010 by South-Western, a division of Cengage Learning. All rights reserved 4
LO1
Merchandise Trade Balance Reported monthly
Influences
Foreign exchange markets
The stock market
Financial markets
Depends on
Economy’s relative strength
Economy’s competitiveness
Relative value of domestic currency
Chapter 20 Copyright ©2010 by South-Western, a division of Cengage Learning. All rights reserved 5
LO1
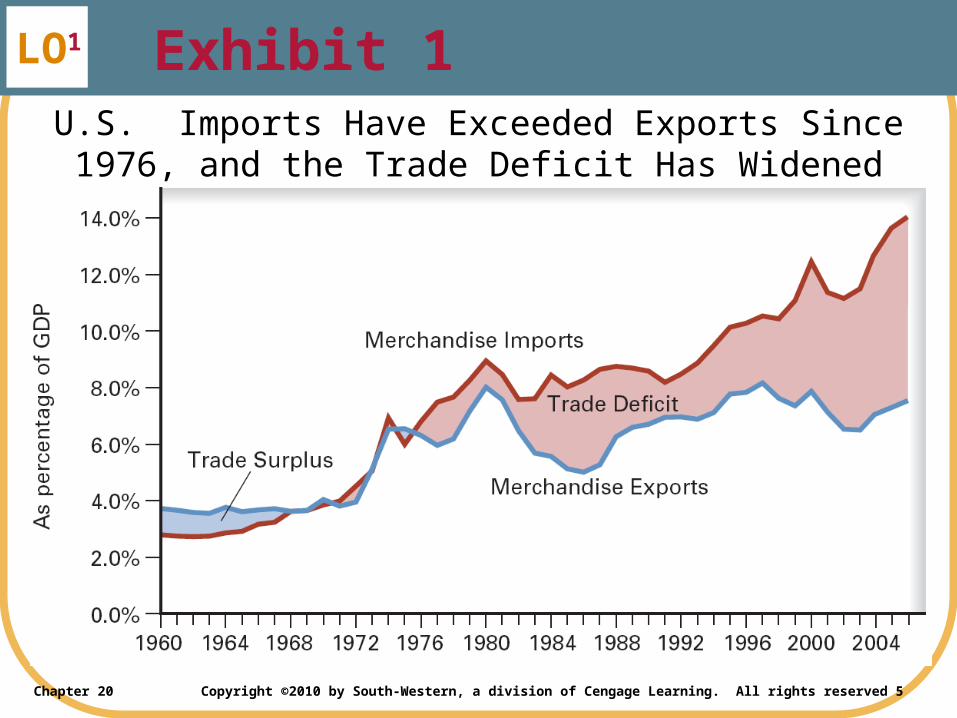
U.S. Imports Have Exceeded Exports Since 1976, and the Trade Deficit Has Widened
Exhibit 1

Chapter 20 Copyright ©2010 by South-Western, a division of Cengage Learning. All rights reserved 6
LO1U.S. Merchandise Trade Deficits in 2008 by Country or Grouping
U.S. imports more goods from each of the world’s major economies than it exports to them. The largest U.S. trade deficit is with China, which exported five times more to the United States in 2008 than it imported from the United States.
Exhibit 2

Chapter 20 Copyright ©2010 by South-Western, a division of Cengage Learning. All rights reserved 7
LO1
Balance of Payments Balance on goods and services
U.S. service exports
Credit in U.S. balance of payments
U.S. service imports
Debit in U.S. balance of payments
Surplus services: exports exceed
imports
Balance on goods and services
Net exports = exports minus imports

Chapter 20 Copyright ©2010 by South-Western, a division of Cengage Learning. All rights reserved 8
LO1
Balance of Payments Net investment income
U.S. residents
Earn investment income
On assets owned abroad
Credit in balance of payments
Foreigners
Earn investment income
On assets owned in U.S.
Debit in balance of payments
Net investment income from abroad
Chapter 20 Copyright ©2010 by South-Western, a division of Cengage Learning. All rights reserved 9
LO1
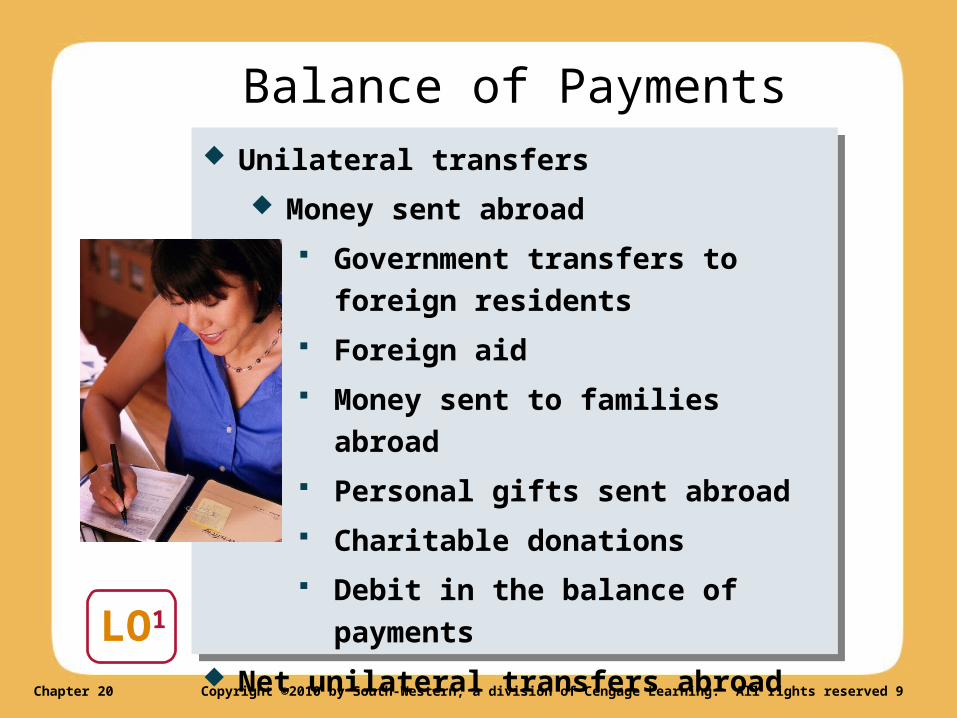
Balance of Payments Unilateral transfers
Money sent abroad
Government transfers to foreign
residents
Foreign aid
Money sent to families abroad
Personal gifts sent abroad
Charitable donations
Debit in the balance of payments
Net unilateral transfers abroad
Chapter 20 Copyright ©2010 by South-Western, a division of Cengage Learning. All rights reserved 10
LO1
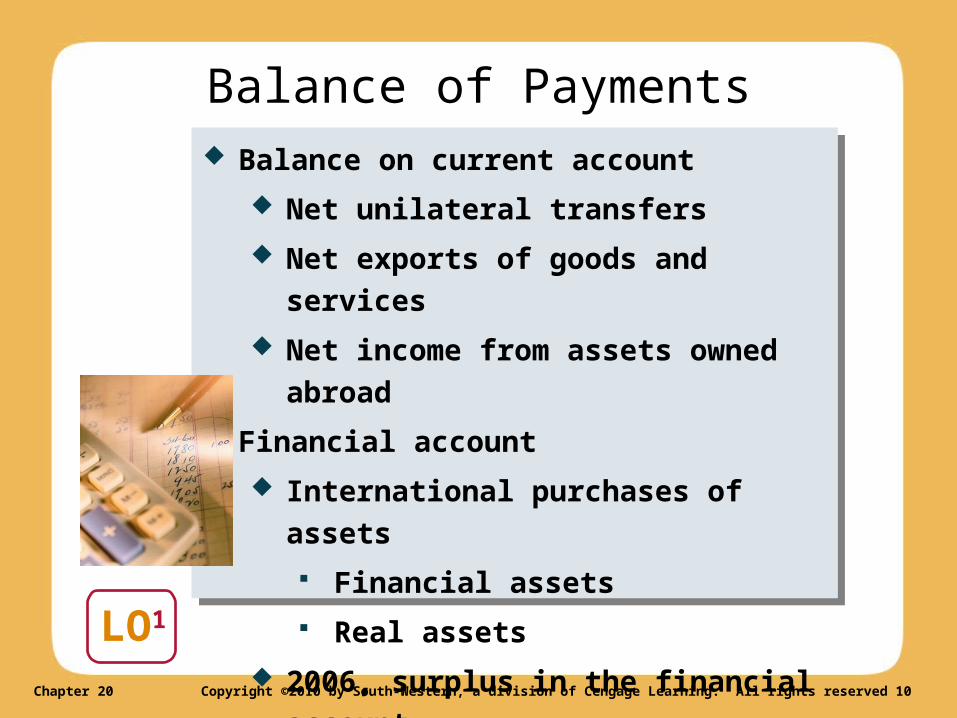
Balance of Payments Balance on current account
Net unilateral transfers
Net exports of goods and services
Net income from assets owned abroad
Financial account
International purchases of assets
Financial assets
Real assets
2006, surplus in the financial account

Chapter 20 Copyright ©2010 by South-Western, a division of Cengage Learning. All rights reserved 11
LO1
Deficits and Surpluses
Credits on balance of payments (+)
Transactions requiring payments from
foreigners to U.S. residents
Debits on balance of payments (-)
Transactions requiring payments to
foreigners from U.S. residents
Statistical discrepancy
“Fudge factor”
Chapter 20 Copyright ©2010 by South-Western, a division of Cengage Learning. All rights reserved 12
LO1
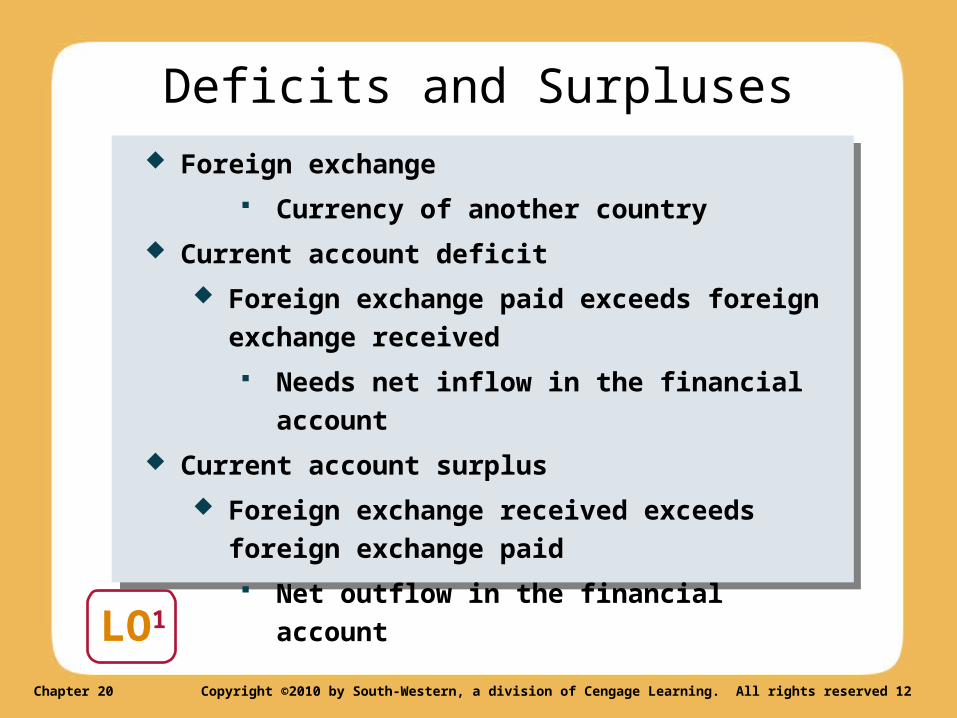
Deficits and Surpluses Foreign exchange
Currency of another country
Current account deficit
Foreign exchange paid exceeds foreign
exchange received
Needs net inflow in the financial account
Current account surplus
Foreign exchange received exceeds foreign
exchange paid
Net outflow in the financial account

Chapter 20 Copyright ©2010 by South-Western, a division of Cengage Learning. All rights reserved 13
LO1
U.S. Balance of Payments for
2007 (billions of
dollars)
Exhibit 3
Chapter 20 Copyright ©2010 by South-Western, a division of Cengage Learning. All rights reserved 14
Foreign Exchange Rates and Markets
LO2
Foreign exchange Foreign money To carry out international
transactions Exchange rate
Price (measured in one country’s currency) of buying one unit of another country’s currency
Determined on foreign exchange market

Chapter 20 Copyright ©2010 by South-Western, a division of Cengage Learning. All rights reserved 15
Foreign Exchange Rates and Markets
LO2
Foreign exchange market Buy and sell foreign exchange
Exchange rate of euro Number of dollars – to purchase one euro Dollar depreciation; weakening
Increase in number of dollars for one euro Dollar appreciation; strengthening
Decrease in number of dollars for one euro Determined by demand and supply
Chapter 20 Copyright ©2010 by South-Western, a division of Cengage Learning. All rights reserved 16
Demand for Foreign Exchange
LO2
Demand curve Inverse relationship
Dollar price of euro Quantity of euros demanded
Assumed constant Income; preferences (U.S. consumers) Expected inflation (U.S. and euro area) Price of goods (euro area) Interest rates (U.S. and euro area)

Chapter 20 Copyright ©2010 by South-Western, a division of Cengage Learning. All rights reserved 17
Supply of Foreign Exchange
LO2
Supply curve Positive relationship
Dollar price of euro Quantity of euros supplied
Assumed constant Income, taxes (euro area) Expected inflation (euro area and U.S.) Interest rates (euro area and U.S.)

Chapter 20 Copyright ©2010 by South-Western, a division of Cengage Learning. All rights reserved 18
LO2
The Foreign Exchange Market
The fewer dollars needed to purchase 1 unit of foreign exchange, the lower the price of foreign goods, the greater the quantity of foreign goods demanded, and the greater the quantity of foreign exchange demanded. The D curve slopes downward.
An increase in in the exchange rate makes US products cheaper for foreigners. The increases demand for US goods implies an increase in the quantity of foreign exchange supplied. The S curve slopes upward.
Exhibit 4
8000Foreign exchange
(millions of euros)
1.20
1.25
$1.30
Exc
hang
e ra
te (
dolla
rs p
er e
uro)
D
S
Chapter 20 Copyright ©2010 by South-Western, a division of Cengage Learning. All rights reserved 19
Determining the Exchange Rate
LO2
Equilibrium exchange rate Demand intersects the supply
Floating exchange rate Adjust freely
Increase in demand for foreign exchange Increase of equilibrium exchange rate Euro increases in value (appreciates) Dollar falls value (depreciates)
Chapter 20 Copyright ©2010 by South-Western, a division of Cengage Learning. All rights reserved 20
LO2
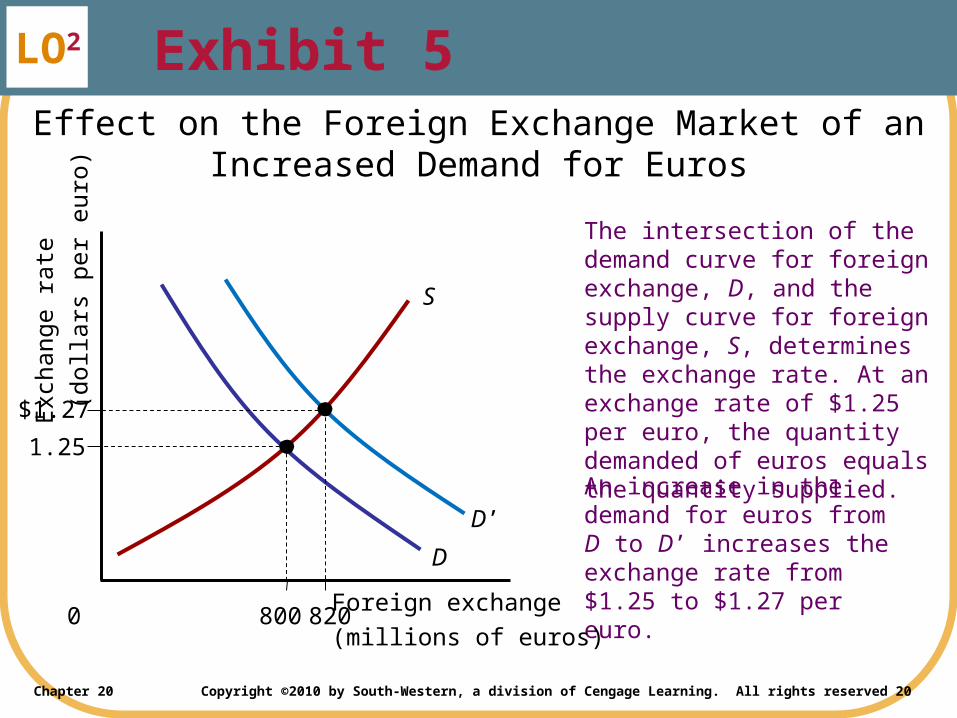
Effect on the Foreign Exchange Market of an Increased Demand for Euros
The intersection of the demand curve for foreign exchange, D, and the supply curve for foreign exchange, S, determines the exchange rate. At an exchange rate of $1.25 per euro, the quantity demanded of euros equals the quantity supplied.
An increase in the demand for euros from D to D’ increases the exchange rate from $1.25 to $1.27 per euro.
Exhibit 5
1.25
$1.27
Exc
hang
e ra
te
(do
llars
per
eur
o)
D’
S
D
8000Foreign exchange
(millions of euros)820
Chapter 20 Copyright ©2010 by South-Western, a division of Cengage Learning. All rights reserved 21
Arbitrageurs and Speculators
LO2
Arbitrageurs Dealers
Simultaneously: buy low and sell high Little risk Ensure equality of exchange rates on
different markets Speculators
Buy low; sell high later Riskier
Chapter 20 Copyright ©2010 by South-Western, a division of Cengage Learning. All rights reserved 22
Purchasing Power Parity
LO2
Purchasing power parity PPP theory For unrestricted trade
Trading goods Exchange rate between two currencies
Adjust in long run to reflect price differences between the two currency regions
Given basket of goods Same price around the world
Chapter 20 Copyright ©2010 by South-Western, a division of Cengage Learning. All rights reserved 23
Purchasing Power Parity
LO2
PPP theory Does not explain exchange rates at a particular
point in time Trade barriers Central bank intervention Products not traded Product differentiation
Chapter 20 Copyright ©2010 by South-Western, a division of Cengage Learning. All rights reserved 24
LO2C
ase
Stu
dy
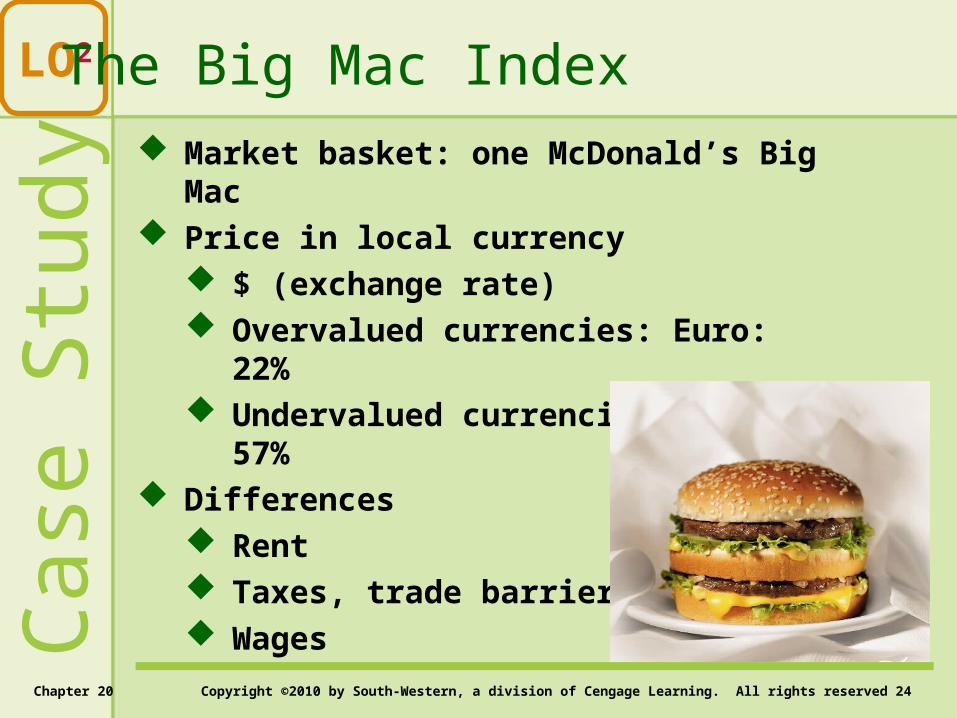
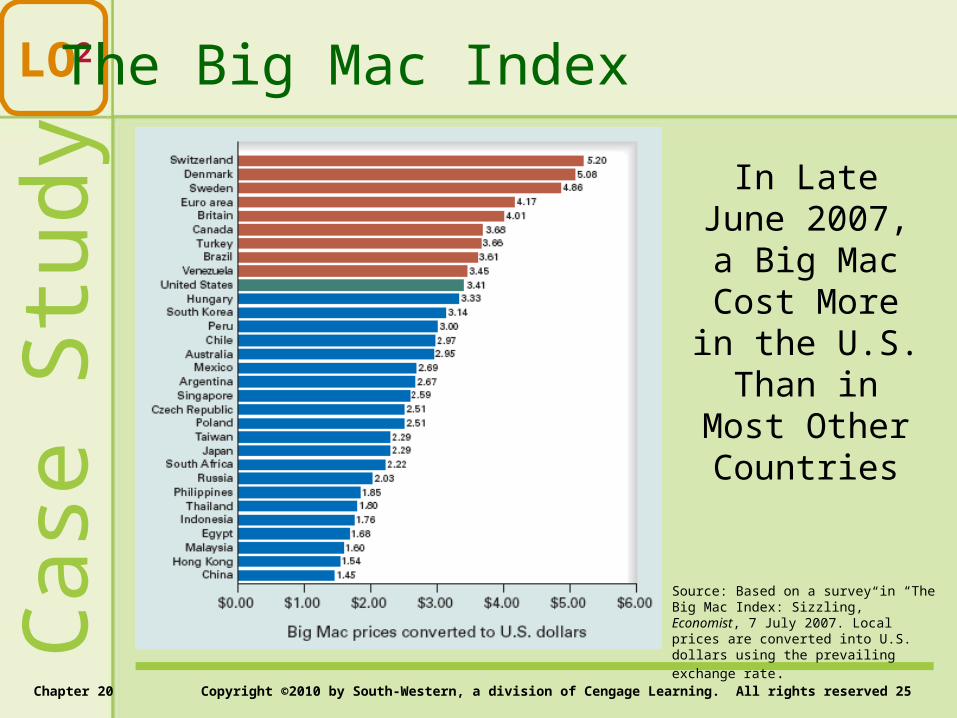
The Big Mac Index Market basket: one McDonald’s Big Mac Price in local currency
$ (exchange rate) Overvalued currencies: Euro: 22% Undervalued currencies: Yuan: 57%
Differences Rent Taxes, trade barriers Wages
Chapter 20 Copyright ©2010 by South-Western, a division of Cengage Learning. All rights reserved 25
LO2C
ase
Stu
dy
The Big Mac Index
In Late June 2007, a Big Mac Cost
More in the U.S. Than in Most Other Countries
Source: Based on a survey in “The Big Mac Index: Sizzling,” Economist, 7 July 2007. Local prices are converted into U.S. dollars
using the prevailing exchange rate.
Chapter 20 Copyright ©2010 by South-Western, a division of Cengage Learning. All rights reserved 26
LO3
Floating exchange rates Determined by demand and supply Balance of payment accounts
Current or financial accounts Debit entries
• Increase D for foreign exchange $ depreciation
Credit entries• Increase S of foreign
exchange $ appreciation
Flexible Exchange Rates

Chapter 20 Copyright ©2010 by South-Western, a division of Cengage Learning. All rights reserved 27
Fixed Exchange Rates
LO3
Pegged exchange rates Government intervention; Central
Bank Sell euros, buy dollars – keep
euro’s value down Sell dollars, buy euros – keep
euro’s value up Increase pegged exchange
rate: devaluation Decrease pegged exchange
rate: revaluation Restriction on imports Policies to slow the economy Foreign exchange control
Chapter 20 Copyright ©2010 by South-Western, a division of Cengage Learning. All rights reserved 28
International Monetary System
LO4
1879-1914: Gold Standard Currencies convert into gold at fixed rate Collapsed during WWI
1944: Bretton Woods Agreement Exchange rates – fixed in terms of dollars Dollar standard Fixed rate
Dollars exchanged for gold International Monetary Fund (IMF)
Chapter 20 Copyright ©2010 by South-Western, a division of Cengage Learning. All rights reserved 29
International Monetary System
LO4
Late 1960s: U.S. Inflation Overvalued dollar
1971 U.S. merchandise imports exceeded
merchandise exports Gold outflow Washington meeting: $ devalued 8%
1972 U.S. trade deficit: tripled

Chapter 20 Copyright ©2010 by South-Western, a division of Cengage Learning. All rights reserved 30
International Monetary System
LO4
1973 $ devalued 10% Dollars exchanged for
German marks Bretton Woods system collapsed
Current system Managed float
Freely floating exchange rate Sporadic intervention by central banks
Chapter 20 Copyright ©2010 by South-Western, a division of Cengage Learning. All rights reserved 31
LO4C
ase
Stu
dy U.S. trade deficit with China:
$233 billion in 2006; 20% annual increase China: devaluated Yuan; boosted U.S. $
Chinese products – Cheaper abroad Stimulate exports Tax rebates, subsidies
Foreign products – More expensive in China Discourages imports Quotas, tariffs
Increased Chinese production; job creation
What about China?
Related Documents