16 CHAPTER 2: REVIEW OF LITERATURE 2.1. Relevant Anatomy & Physiology of the Auditory System The unique ultra-structural organization of the human cochlea has fascinated researchers for many years, with innumerable studies being performed to understand the complex behavior of the end organ of hearing to various insults, which eventually has lead to the monumental innovation of the auditory neural prosthesis. The interesting path-breaking discovery that despite congenital or acquired damage to the Organ of Corti due to various causes, the spiral ganglion population within the modiolus survives and remains functional, was the scientific basis upon which the field of cochlear implantation has evolved rapidly to its present day status. Knowledge of the intricate micro-anatomy and patho-physiology of the auditory system remains vital for comprehensively understanding the various electrophysiological and behavioural responses that are evoked by a cochlear implant. Organization & Function of the Membranous Labyrinth The compartmentalization of the membranous labyrinth into the Scala Vestibuli, Scala Media and Scala Tympani, provides distinct channels for flow of the endo-cochlear fluids in response to the acoustical impulse, which in turn induce mechanical displacement of the Basilar Membrane, thereby

Welcome message from author
This document is posted to help you gain knowledge. Please leave a comment to let me know what you think about it! Share it to your friends and learn new things together.
Transcript

16
CHAPTER 2: REVIEW OF LITERATURE
2.1. Relevant Anatomy & Physiology of the Auditory System
The unique ultra-structural organization of the human cochlea has
fascinated researchers for many years, with innumerable studies being
performed to understand the complex behavior of the end organ of hearing to
various insults, which eventually has lead to the monumental innovation of the
auditory neural prosthesis.
The interesting path-breaking discovery that despite congenital or
acquired damage to the Organ of Corti due to various causes, the spiral
ganglion population within the modiolus survives and remains functional, was
the scientific basis upon which the field of cochlear implantation has evolved
rapidly to its present day status. Knowledge of the intricate micro-anatomy
and patho-physiology of the auditory system remains vital for
comprehensively understanding the various electrophysiological and
behavioural responses that are evoked by a cochlear implant.
Organization & Function of the Membranous Labyrinth
The compartmentalization of the membranous labyrinth into the Scala
Vestibuli, Scala Media and Scala Tympani, provides distinct channels for flow
of the endo-cochlear fluids in response to the acoustical impulse, which in
turn induce mechanical displacement of the Basilar Membrane, thereby

17
triggering the Organ of Corti to create electrical nerve action potentials. The
cochlear tonotopicity facilitates temporal stimulation of the various regions of
the cochlea, according to the intensity and frequency of the acoustical
impulse, which get transduced into electrical signals and relay onto the
afferent neuronal fibrils and first order neurons in the spiral ganglion.
The Basilar Membrane (BM) extends from the lateral edge of Osseous
Spiral Lamina (OSL) to the basilar crest over the Spiral Ligament. It is unique
in its dimensions, with an average length of 31.5mm and its width increases
from the cochlear apex to base from around 150 to 450 µm. It is
microscopically divided into a medial pars arcuata and a lateral pars
pectinata. The pars arcuata primarily consists of radial filaments which secure
it to the spiral ligament through strong type II collagen with support from
specialized cells – the Claudius and Boettcher cells. This arrangement
provides the Basilar Membrane with high resilience and tenacity required for
optimal displacement with the travelling wave and a frequency specific
maximal vibratory property (Clark GM et al, 1988).
The cochlear implant electrode array when placed in situ within the
scala tympani, lies underneath and in proximity to the Basilar Membrane. It
mimics the natural arrangement of the Basilar Membrane, with the electrodes
serially arranged for stimulation according to the ‘place-pitch’ conduction
principle (Frijns JH et al, 2001).

18
The major difference in stimulation via these electrodes is the absence
of transduction via Organ of Corti, since sound stimuli externally pre-
processed into electrical impulses are directly delivered to their respective
regions within the cochlea and trigger the Spiral Ganglia within the
Rosenthal’s Canal (bypassing the damaged Organ of Corti) and further
conduct these signals to the auditory nerve and onto the auditory brain which
perceives it as natural sound signals. Hence, the basic requirement for the
success of cochlear implant aided hearing is the presence of surviving Spiral
Ganglion population within the damaged cochlea (Hall RD, 1990; Leake PA et
al, 1999).

19
Fig-2.1 Fig-2.2 Fig-2.1.1: Internal structure of the cochlea showing alignment of the Organ of
Corti, in relation to the Spiral Ganglion within the Rosenthal’s canal and the
further formation of the Auditory Nerve Fibers in the Modiolus. The survival of
functional Spiral Ganglion population, nearly 35,000 in number (in spite of
congenital or acquired damage to the Organ of Corti) is paramount for the
success of electrical stimulation with Cochlear Implants.
Fig-2.1.2: Ultra-structure of cochlea showing the arrangement of afferent
neuronal fibrils; A: Apical cochlear turn showing myelinated nerve fibers
within osseous spiral lamina (OSL) & B: Basal cochlear turn showing Organ
of Corti (OC), adjacent to osseous spiral lamina (OSL)
(From: Wright CG & Roland PS, 2005).

20
Fig-2.1.3: Cross-section of basal turn of the cochlear duct & its schematic
representation, showing the internal ultra-structure of the Organ of Corti
(From: Wright CG & Roland PS, 2005).

21
Pathological Dead Regions in the Cochlea
Dead regions occur within the cochlea where the hair cells and / or the
auditory neurons function poorly. A sine-wave that produces peak basilar
membrane vibration in a dead region may not evoke sufficient neural activity
within that dead region, for that signal to be detected as an acoustic impulse.
However, if the signal is sufficiently intense, it may be detected via hair cells /
neurons adjacent to the dead region. This phenomenon is termed as ‘off-
frequency listening’ or ‘off-place listening’.
Using a frequency-to-place map, the boundary of a dead region can be
defined in terms of the characteristic frequency of the hair cells and / or
neurons immediately adjacent to a dead region. This is referred to as the
edge frequency (fe) and a dead region may have two edge frequencies, an
upper and a lower one. However, candidates for cochlear implantation,
typically have a dead region that starts at ‘fe’ and extends upwards from
there, extending over the basal, middle & apical regions of the cochlea.
Psycho-acoustic tests for diagnosing dead regions in the hearing impaired
cochlea, typically lead to an estimate of the value of the edge frequencies
(Clark GM et al, 1988).
In a similar way, the behavioural & electrophysiological measurements
performed through a cochlear implant from the various dead regions within
the cochlea, are not alike, since they get influenced by factors like – density of

22
the surviving spiral ganglion / afferent neuronal population, the electrode-
neural interface, gelling effect of sensory elements towards the stimulating
electrodes, presence of any intra-cochlear fibrosis or cicatrization due to
insertional trauma and spiral ganglion migration towards the electrode array
over a longitudinal period of electrical stimulation. Such factors necessitate
individual measurement of responses from the various regions of the cochlea
(Gluckert R, 2005; Roland PS, 2006).
Fig-2.1.4: Cadaveric Cochlear Dissection Model: shown after insertion of
cochlear implant electrode array via the Round Window niche into the Scala
Tympani. The active electrode contacts are placed immediately beneath the
basilar membrane, in order to be close to the modiolus & simulate the
tonotopic phenomenon of the cochlea. Today, various types of electrode
designs are available - like peri-modiolar hugging / pre-curved, contour &
contour advanced, Hifocus Helix, Mid-scalar etc; which favor optimal
positioning of electrodes with respect to the neural elements, and provide full

23
transmisson of electrical energy onto the nerve, without causing undue
charge-based injury at the contact point. Sound impulses externally
transduced into electrical stimuli, arrive at the frequency-band specific
electrode contacts along the array and traverse across the basilar membrane
onto their respective spiral ganglia and further relay in the auditory nerve
fibers at the various sites along the cochlea, thus providing a ‘nature-like’
tonotopic hearing perception (From: Wright CG, Roland PS & Kuzma J,
2005).
The Need for Early Implantation
Research studies using animal models have objectively proved the
phenomenon of Neural Plasticity and Scavenging, which happens as the
central auditory system undergoes sequential degenerative changes over the
duration of hearing loss (Hardie, et al 1998). The presence of hearing in at
least one ear provided adequate stimulation in order to preserve the
synapses in the inferior colliculus and thus prevent neural scavenging, to an
extent (Hardie, Clintock, Aitkin & Shepherd, 1999). But, aberrant connections
begin to form between the midbrain and the peripheral auditory system, if
hearing is deprived during a sensitive period in early development (Russell &
Moore, 1995). Hence, a “Critical Age” for stimulation of the auditory brain
exists, which ranges from 1 to 3.5 years in congenitally hearing impaired
children beyond which optimal speech & language development may become
compromised (Sharma A et al, 2002).

24
Brown, Tyler and Bertschy, in 1997, studied the influence of age at
implantation & duration of hearing impairment, on the outcomes with CI, in a
group of pre-lingual children & they reported statistically significant
improvement in speech / language skills among early implantees (<5 yrs), as
compared to those implanted later (>5 yrs). A further assessment of speech
outcomes in CI users has shown that pre-lingual children implanted at a
younger age, perform much better than those implanted at older ages (Tobey
EA, 2000). The amount of auditory cortical activity thus depends upon the age
at cochlear implantation. Recent research has shown that younger implantees
with a limited duration of hearing deprivation, have larger areas of auditory
representation on their temporal cortex as noted on PET-CT scans & this
correlated well with good outcomes as recorded by their Habilitation scores.
Principles of Auditory Neurophysiology & its Assessment
Auditory neurophysiology is complex due to the numerous structural
and functional inter-connections occurring between the cochlear nuclei,
superior olivary complex, inferior colliculus and the auditory radiations, with
approximately 30,000 cochlear nerve fibres, relaying onto a sequence of
nearly 10 million neurons in the central auditory system. There are multiple
decussations, midline-crossings and an efferent descending auditory network
which furthermore make deciphering the signals an enigma. But, the
distribution of signals along the cochlea and further onto the higher auditory
centers, follows a tonotopic pattern and is based on a temporal integration
25
principle, which sequentially relays over specific time intervals. Such neuro-
physiological responses are influenced by critical factors like age, arborization
of the cortex, duration of hearing loss, presence of organic lesions or
functional imbalances afflicting the auditory pathway (Kral A et al, 2001;
Sharma et al, 2002).
A precise integration of signals along the auditory relay, favours
objective monitoring with evoked auditory potentials for confirming optimal
functioning of the various centers along the auditory system. Objective
measurements in normal or hearing impaired individuals may be performed
using near-field evoked responses like ECochG / OAE or far-field responses
like BERA, ASSR, MLR / LLR, P300 & CAEP.
In cochlear implantees, a similar battery of electrophysiological
measurements, are clinically available to assess the optimal performance of
the auditory system in response to signals delivered via the implant. Since,
the damaged cochlea is bypassed by the implant, all tests like the ECAP,
ESRT, EABR, EMLR, ELLR, P300, MMN and CAEP, are performed as far-
field ‘Evoked Telemetry’ responses to intra-cochlear electrical stimulation via
the cochlear implant.

26
2.2. Cochlear Implantation –
2.2.1. Historical Perspective & Current Status
Fig-2.2.1: Schematic representation of a Cochlear Implant in-situ
The serendipitous discovery of auditory perception following electrical
stimulation of the ear, as described in Volta’s experiment, in 1790, has today
evolved by leaps and bounds, into the unique realm of cochlear implantation.
Following Volta’s cue of the possibility of electrically stimulating hearing, a
string of researchers continued to experiment with electrical hearing over the
next 167 years, but with little clinical success. Djourno and Eyries reported
their first successful stimulation of the acoustic nerve by direct application of
an electrode in a deaf person in 1957. Their achievement brought in an
overwhelming wave of interest from various parts of the world and soon a
string of similar single channel implantations were performed by House,
Doyle, Simmons, and others.

27
The introduction of multi-channel implants by Prof. Graeme Clark in
1967, lead to further advances in micro-electronics and speech processor
designs. Over the next fifty years, technological improvements produced
refinements in surgery, miniaturization of implants with better electrode
designs & precise speech processing strategies suitable for all environments,
leading to the evolution of the present day cochlear implant system (Hall JW,
2007). The chronological landmarks which were achieved, during the rapid
evolution in the field of cochlear implantation, have been enlisted in the
following Table - 2.2.1.
Historical Landmarks in the Evolution of Cochlear Implants
1790 Alessandro
Volta
Used electrical current to stimulate the inner ear &
published his auditory experience
1855 Duchenne of
Boulogne
Used an alternating electrical current produced by a
vibratory circuit to stimulate the inner ear
1868 Brenner Published the effects of altering polarity, rate & intensity
of the electrical stimulation on the placement of
electrodes. He discovered that hearing quality was better
with a negative polarity stimulus
1930 Wever
&
Bray
Demonstrated that the response to the electrodes from the
surrounding area of the auditory nerve of a cat was
similar in frequency and amplitude to which the ear had
been previously exposed to as in nature
1936 Gersuni
&
Volokhov
Found that hearing could still persist after the removal of
the tympanic membrane and ossicles, therefore giving an
opening for the cochlea to be the site for electrical
stimulation

28
1939 Stevens
&
Jones
Showed that electrical stimulus could be transduced
linearly or non-linearly into sound vibrations before it
reached the inner ear
They proved that the middle ear acted as a transducer,
electrical energy could be converted into sound by direct
effect on the basilar membrane of the cochlea and thus a
direct stimulation of the auditory nerve produced a basic
hearing sensation
1950 Lundberg Performed one of the first attempts to stimulate the
auditory nerve using a sinusoidal current during a
neurosurgical operation
1957 Djourno
&
Eyries
Published their first results of direct electrical excitation
on the auditory nerve, using a trans-cutaneous magnetic
inductive link, which laid the foundation for clinical
research in human subjects
1961 William
House
Implanted two patients with the first prototype of short
term single electrode implants
1964 Blair
Simmons
Implanted a six electrode unit in an adult cochlea for the
first time, the success of which proved the place theory of
electrical frequency coding
1964 Doyle Reported inserting a linear chain of electrodes into a
patient with total perspective deafness, which provided
hearing perception
1966 Blair
Simmons
Performed extensive studies where electrodes were
placed through the promontory and vestibule directly
into the modiolar part of the auditory nerve. Thus, each
nerve fiber representing different frequencies could be
stimulated for the first time.

29
1967 Graeme
Clark
Invented the multiple-channel cochlear implant prototype
for the management of profound hearing loss
1972 Speech Processor prototype developed
Speech processor worked with Dr House's 3M single
electrode implant and was made commercially available.
1,000 patients were implanted between 1972 to 1980.
1976 William House
& Michelson
Studied the effects on patients when small electric
currents were used on the promontory during middle ear
procedures in deaf individuals. Dr. House implanted
several devices in totally deaf volunteers, many of which
failed due to the lack of bio-compatibility
1980 House 3M device
Several pre-/peri-lingual children were implanted with
the 3M single channel device in USA
1984 Multi-channel Cochlear Implant
In Australia, the Multi-channel Cochlear Implant which
enhanced spectral perception and speech recognition was
developed
1985 US-FDA approval
for 3M House
CI
All basic safety concerns about the long term success of
CI in adults and children were mostly resolved & efficacy
of CI was established
1990s Blake Wilson
& The Era of
Modern Cochlear Implants
Introduced better speech coding strategies in the
processor which provided higher performance. Further
technological refinements lead to the evolution of a range
of newer FDA approved / CE marked cochlear implant
devices, from the various CI Companies
2000s to
Present Day
Bilateral CI, Bimodal Stimulation
(EAS / Hybrid), Partial
Deafness CI
The basic concepts of multi-channel CI remain the same,
but a wide range expansion has occurred in the
candidacy. Improvements in speech processing
technology, has lead to clear hearing in noisy
environment & enhanced music perception skills

30
2.2.2. CI Technology & Surgery : An Overview
Cochlear implants have been established as time-tested electronic
devices, used to restore hearing in individuals with severe to profound
hearing loss, over the last four decades. The last decade has especially seen
tremendous progress and refinement in implant technology and surgical
techniques for newer devices. The candidacy for CI has expanded by leaps
and bounds to include very young children, those with multiple handicaps, a
spectrum of syndromic associations & also individuals with partial high
frequency hearing loss having residual hearing in lower frequencies.
Fig-2.2.2.1: Schematic representation of electrical hearing as provided via a cochlear implant

31
The Architecture of Cochlear Implants
The cochlear implant system comprises of an external & internal
component, both of which are connected transcutaneously with a magnet
during implant use. The parts of a CI device include a directional microphone,
which receives acoustic impulses from the environment and transmits them
onto a speech processor, which in turn converts these signals into frequency
specific electrical signals & transmits them as coded signals, via
radiofrequency across a transcutaneous transmitter-receiver/stimulator coil,
worn on the mastoid temporal bone. The receiver-stimulator coil in the
internal system, decodes these signals, in order to produce a pattern of
temporally arranged frequency specific electrical stimuli, which get distributed
along the electrode array placed within the cochlea. Since this method follows
a pattern of ‘place-pitch’ stimulation, very similar to the tonotopic arrangement
of the normal cochlea, these electrical signals are perceived by the spiral
ganglion and first order neurons of the Auditory Nerve exactly like in normal
ears, thereby providing nature-like auditory perception to the higher auditory
centers (Laneau J, 2004).
Recent technological improvements like the digitalization of speech
processors with high rate stimulation, current steering, stochastic and fine-
structure processing of sound signals, have provided enhanced clarity of
complex sound signals in all environments and music perception skills for CI

32
users, to match a nature-like hearing experience. Although the speech
processor codes the electrical signals digitally, the transmission of information
onto the electrode array needs to be done serially in an analogue manner, in
order to comprehensively provide a temporally integrated sound across the
entire speech spectrum onto the higher centers. Present day research is
focused on this aspect of implant technology, to invent an option of delivering
digital sound signals directly onto the electrodes, which is an exciting
possibility in the near future, since it may eventually lead to completely
implantable digital CI devices with remote programming options, while
obviating the need for a radiofrequency interface with an external speech
processor (Niparko JK et al, 2009).
Ultra-high resolution CT scans have now documented the enlargement
of Rosenthal’s canal, with growth & migration of spiral ganglion population
towards the electrode array over a period of implant use. This promising
finding provides numerous possibilities for the restoration of neural elements
via a cochlear implant, to alleviate intra-cochlear damage in future. Research
is hence, focused on the aspects of stem cell therapy and neural regeneration
factors, which may be delivered via drug eluting electrode arrays, for
promoting hair cell regeneration (Toh EH & Luxford WM, 2008).

33
Speech Processing Strategies and their influence on Mapping
Sound processing strategies represent a set of rules that define how
the speech processor analyzes acoustic signals and codes them for delivery
to the cochlear implant. These codes are processed in the form of Spectral
Information and Fine-Timing / Temporal Information and delivered to the
electrodes as Analogue and Pulsatile stimulus waveforms. A complete
stimulating strategy should ideally address the number of channels selected
to reproduce the original spectrum, the number of electrodes activated to
generate each channel, the number of consecutive clock cycles required to
deliver selected channels and the scheduling of the activating sequence of
electrodes (Kiefer, 2001; Koch, 2004; Han DM, 2005; Wilson & Dorman,
2008). The older pulsatile strategies like SAS and pre-processed feature
extaction (MPEAK) have given way to newer coding methods of peak picking
or place-coding (n-of-m / ACE / SPEAK) and the robust rate-coding
envelopes (CIS/CIS+/HiRes).
Coding strategies serve to derive stimulation parameters from the input
signal. The simultaneous analog strategy (SAS) closely mimics the natural
hearing. All incoming sounds are compressed and filtered into eight channels.
These channels are then simultaneously and continuously presented to the
appropriate tonotopic electrode. There is no need for selecting speech
frequencies in this strategy since the intensity is coded either by stimulus

34
amplitude, rate or both. Due to this fact the SAS strategy has met with limited
success. The SPEAK (Spectral Peak) focuses on the spectral (frequency)
properties of sound and is based on the place-pitch selectivity of the cochlea.
Since it is a roving, place coding strategy, there can be stimulation of selected
speech relevant sites along the cochlea, with spectral peaks or maxima
providing detailed spectral information. The SPEAK strategy is characterized
by filtering sound into 20 different bands covering the range of 200 Hz to
10,000 Hz. Electrodes are stimulated sequentially and at amplitudes specific
for each frequency peak. The outputs for each filter are analyzed and those
channels of highest amplitude that contain speech frequencies are stimulated.
This method also provides cues for consonant perception and for
environmental sounds.
CIS (Continuous Interleaved Sampling) is a rate coding strategy, which
provides detailed temporal information, but it stimulates fewer, widely spaced
and fixed number of electrodes or sites in the cochlea at a higher rate than
SPEAK. This system works by filtering the speech into eight bands. The
bands with the highest amplitude within the speech frequencies are
subsequently compressed and their corresponding electrodes are stimulated.
The CIS strategy uses high-rate pulsatile stimuli to capture the fine temporal
details of speech. ACE (Advanced Combination Encoders) is a combination
of the place and rate strategies, which helps to optimize the amount of
temporal information conveyed by stimulating the cochlea at faster rates (up

35
to 3500 pps per channel). This strategy gives the Audiologist good flexibility to
optimize sound processing for each individual. Using ACE, the Audiologist
can select the number of stimulation channels, the number of maxima and the
stimulation rate per channel. The ACE strategy filters speech into a set
number of channels and then selects the highest envelope signals for each
cycle of stimulation. The newer coding strategies are focused on Envelope &
FSP (Fine-Structure Processing), which have distinct benefits for
comprehensive speech understanding, tonal language coding, three
dimensional spatial hearing, hearing in noise & quiet and musical notes
appreciation. The future of CI signal coding is focused on the development of
virtual channels for sequential & parallel stimulation, at a higher rate using a
wider input dynamic range, for optimal & rapid processing of complex sounds
in all environments, thereby reproducing the original sound spectrum clearly
to the cochlear implantee (Kiefer, 2001; Han, 2005; Wilson, 2008).
Today, all strategies are either CIS-based or n-of-m / ACE / HiRes
based. It is accepted that no single strategy is effective for all recipients. For
this reason, recent software offer several speech processing strategies for the
same implant. This allows the Audiologist to choose what strategy is best for
that individual. Currently, the Cochlear-Nucleus systems employ SPEAK,
ACE and CIS. The MedEl system relies on the CIS strategy and the
Advanced Bionics system follows the HiRes-P/S strategies. It is important to
adhere to a single strategy for stimulating the implant, while serially

36
programming an individual, since any alteration in strategy between
schedules, will unduly influence the current levels configured into the MAPs
and thereby induce variabilities in subsequent Mapping. For a similar reason,
it is not possible to compare cohorts using different implant devices, or
cohorts using the same device but with different speech processor models,
since a variable bias gets induced due to differences in the electrode
configuration and / or speech processing strategy, which will eventually
provide results favoring the advanced models or strategies, used in the
comparison (Miller CA et al, 2003; Polak M et al, 2005).
Cochlear Implantation: The Surgeon’s Perspective
With the candidacy expanding to include a panorama of difficult
individuals, CI surgeons face a multitude of challenges while performing
surgery in recent times. A meticulous assessment of a candidates’ temporal
bone anatomy with high resolution radio-imaging and assessment of their
associated medical conditions & fitness for surgery under general anesthesia,
are paramount in successfully performing the cochlear implant procedure
without any untoward incidents (Miyamoto R & Kirk K, 2001).
High resolution CT and MRI scans greatly aid in exploring the intricate
anatomy of the temporal bone and help to identify congenital anomalies of the
inner ear like an Incomplete Partition (Type-I), Mondini Deformity (IP-II),
Large Vestibular Aqueduct, Common Cavity, cochlea-vestibular Dysplasia,

37
Cochlear Ossification (congenital or post-meningitic sequelae), Rotated
Cochlea or an aberrant course of the Facial Nerve in the middle ear. These
scans also help in assessment of the vestibulo-cochlear nerve bundle in order
to ascertain the candidacy for cochlear implantation and further decide upon
the appropriate per-operative preparations necessary for implantation (Phelps
PD & Proops DW, 1999). Apart from the routine audiological test battery used
to confirm the candidacy for CI, advanced objective electrophysiological tests
like the Trans-tympanic EABR and Cortical Auditory Evoked Potentials
(CAEP) help to judge whether a candidate with a malformed cochlea & / or
hypoplastic / thin VIII cranial nerve will benefit from the cochlear implant or
not.
A judicious planning session needs to be held prior to CI surgery for
deciding upon the best approach to the cochlea, which type of electrode
needs to be chosen, what technique needs to be used for electrode insertion
and how to overcome intra-operative obstacles like a CSF gusher, facial
nerve exposure or posterior canal wall / annulus dehiscence (Toh EH &
Luxford WM, 2008). Surgery is essentially the same in children and adults
because the anatomic structures are of adult configuration at birth. However,
in very young children, there is an increased risk of facial palsy, hypothermia
and hypovolemic shock due to blood loss (more so, with a bilateral
simultaneous CI). A detailed counseling session is mandatory for the parents
& family, for emphasizing the surgical procedure including details regarding
38
the risks involved, the techniques of ‘Switch-On’ & Programming of the
Device and the need for intensive Auditory Verbal Habilitation / Therapy (AVH
/ AVT) for a minimum period of one year in order to match their realistic
expectations with the eventual outcomes of cochlear implantation.
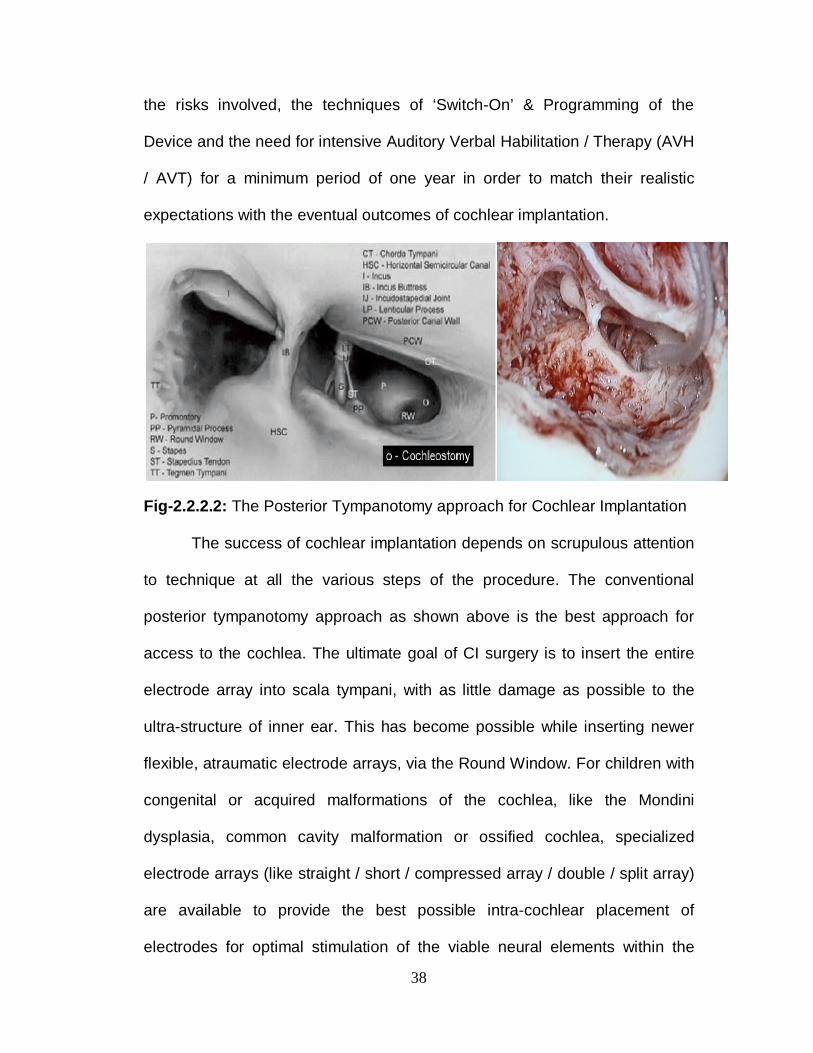
Fig-2.2.2.2: The Posterior Tympanotomy approach for Cochlear Implantation
The success of cochlear implantation depends on scrupulous attention
to technique at all the various steps of the procedure. The conventional
posterior tympanotomy approach as shown above is the best approach for
access to the cochlea. The ultimate goal of CI surgery is to insert the entire
electrode array into scala tympani, with as little damage as possible to the
ultra-structure of inner ear. This has become possible while inserting newer
flexible, atraumatic electrode arrays, via the Round Window. For children with
congenital or acquired malformations of the cochlea, like the Mondini
dysplasia, common cavity malformation or ossified cochlea, specialized
electrode arrays (like straight / short / compressed array / double / split array)
are available to provide the best possible intra-cochlear placement of
electrodes for optimal stimulation of the viable neural elements within the

39
deformed cochlea. Hence, it prevails upon the experienced CI surgeons, who
take up these challenging cases, to judiciously choose the best electrode type
for overcoming the deformity and complete the implantation successfully.
One of the latest applications of implantable hearing technology
combines electric and acoustic stimulation (EAS) into a hybrid device
designed for individuals with binaural non-progressive low-frequency residual
hearing and severe-to-profound high-frequency hearing loss. While
performing such a surgery, great care is taken to preserve the residual
hearing by administration of Intra-venous Steroids after performing the
cochleostomy or exposing the round window niche, prior to insertion of
electrodes. A soft-insertion needs to be performed delicately using a special
electrode array with care not to damage the neuronal structures within the
cochlea (Walkowiak A et al, 2010). Due to the success of this hearing
preservation technique with ‘soft-insertion’ of electrodes in candidates with
residual hearing, partial deafness cochlear implantation has successfully
come into vogue in recent times and bilateral hybrid implantations are also
being performed. Thus, cochlear implantation is heralded as a safe surgery
with a negligible percentage of complications, while providing complete
restoration of the lost sense of hearing & aiding in the development of speech
and language skills, thereby integrating CI users into the normal society and
leading to a productive life.

40
2.2.3. CI Programming & Habilitation Protocols
The cochlear implant is ‘Switched-On’ three weeks after the surgery,
providing sufficient time for the wound healing and facilitating adequate period
of convalescence for the implantee. For pre-lingually hearing impaired
individuals, the ‘Switch-On’ is a dramatic event, since they experience
auditory perception for the first time in their life. Very young children and
those with additional handicaps may develop fear and aversion to this
experience and may refuse to wear the implant further-on. Hence, it requires
the nuances of an experienced Audiologist to convince such children to wear
the implant and set the correct Mapping levels, based on standard
observation techniques, periodically in the initial periods of implant use and
subsequently fine-tune the MAPs according to the needs of the implantee, as
and when required.
The Art of Mapping
For cochlear implant users to perceive the desired range of acoustic
signals from their environment, the features of these sounds must control the
electrical stimulation within the cochlea in an appropriate way. Low amplitude
speech sounds of different spectral structure should elicit soft percepts and
higher amplitude acoustic signals should elicit louder percepts while avoiding
uncomfortably loud stimulation. As the useful dynamic range for electrical
stimulation is relatively narrow and varies across patients and electrodes,

41
there is a need to tailor the amplitudes of electrical stimulation for each
patient. This can be done by assessing the behavioural feedback to psycho-
physical & psycho-acoustical stimulation via the cochlear implant, for a wide
range of input signals varying in intensity and frequency across the speech
spectrum.
Behavioral responses are the ‘Gold-standard’ method for programming
cochlear implants and they are sufficient to obtain accurate electrical
threshold and comfort levels for the majority of adults and older children using
cochlear implants. Although these levels are reasonably accurate at the time
of programming, the threshold and comfort levels tend to change over time
(Skinner et al, 1995). As a norm, the behavioral levels are low-set at initial
Mapping schedules for providing adequate psychophysical perceptive signals
to the new implantee, who would seek to understand & familiarize the sounds
signals and gradually these levels are increased later-on in a step-wise
manner for each electrode along the array, with additional psycho-acoustical
inputs, in order to provide an enhanced dynamic range for electrical hearing
with loudness scaling, pitch ranking and electrode sweeping properties, as
the cochlear implantee becomes more adapted and conducive for higher
intensity stimulation, over a period of implant use.

42
Fig-2.2.3.1: Behavioural MAP - The ‘Gold-standard’ for Implant Programming
Identifying Most Comfortable Levels form the basis of Behavioural
programming in the MedEl & Advanced bionics implants, while their
Threshold levels are auto-set by their Map Law, at 10% of the comfort levels
to provide an adequate dynamic range across electrodes. The Cochlear-
Nucleus implants uniquely follow a different Map Law, wherein emphasis is
on Threshold Level based Mapping with individual Comfort Levels being set
at around 70% of the Loudness Discomfort Level, for all the electrodes across
the array, altering the width of the dynamic range for each electrode, as
necessary. Once a series of Maps are created, as per the implantees’

43
preference, they are incorporated (fitted) into the speech processor as
Programs, which control the presentation of encoded sound information
through the implant, within the dynamic ranges for stimulation, as set for a
particular sound environment.
The Threshold and Comfort Levels obtained for individual electrodes
and stored in the memory of the speech processor control the implant’s
function and have a bearing on the loudness of the speech signals in most
normal environments. But, these levels may not necessarily provide
comfortable speech comprehension in noisy environments and hence
stimulation with a particular program may be tolerable for a limited time, but
could potentially become uncomfortable over a longer period of implant use.
This necessitates regular programming sessions, especially during the first
year after implantation, wherein attempts are made to provide a diverse range
of MAPs, in order to accustom the implantee to various acoustic
environments. Watchful observation of the implantees’ auditory verbal skills
over a time of implant use provides useful feedback for the Audiologist, to
judge whether the program set for the implantee is optimal or not.

44
Fig - 2.2.3.2: Comfort Level based Mapping technique shown for a MedEl Implantee

45
Fig-2.2.3.3: Charge based Fitting of Map into Speech Processor in MedEl Implantee
The Auditory Verbal Habilitation Protocol
Cochlear implantees are exposed to intensive auditory verbal
habilitation soon after receiving their implants, for a minimum period of one
year, in order to make them use the implant optimally and in the right way.
Habilitation aims at development of new communication skills, rather than just
replacing the lost hearing function. Hearing via the implant is used as an
active agent for the sequential development of cognition, intelligence,
receptive and expressive language skills in a pre-determined, systematic
order as per the St.Gabriels’ Curriculum. Periodical assessment of these
learned skills, are performed by professionally trained Habilitationists, using a
multitude of standard scoring systems. The most popular among these are
the Category of Auditory Performance (CAP) and Speech Intelligibility Rating

46
(SIR) scores (O’Donoghue et al, 1999); which have an ordinal, non-linear
scale for assessment of the auditory verbal abilities of the implantee, taking
into account the number of months taken by the implantee to achieve the
skills. Further subjective scores like the Meaningful Auditory Integration Scale
(MAIS) and Meaningful Use of Speech Scale (MUSS) developed by Robbins
et al, in 1991, include the participation of the parents of the implantees, and
thereby provide a feedback to the habilitationist, on the parental perspective
of the implantees’ communication skills.
As the implantees learn to listen via the implant, they climb through an
auditory skills pyramid, from a stage of auditory awareness / sound
association, onto the stage wherein they develop auditory processing and
comprehension through closed-set and open-set interactions. As this
happens, they simultaneously develop their speech skills from a stage of
phonating isolatory words, onto the formation of full-fledged sentences.
Acquisition of enhanced auditory receptive skills and useful levels of spoken
language attained through cochlear implants provides an opportunity to
integrate into the process of normal education and achieve scholastic skills,
which heralds the successful outcome of cochlear implantation.
Habilitation is extremely challenging in children with multiple handicaps
and complex needs. Hence, it is imperative for the Habilitationist, to wear a
thinking cap and cater to the individual needs of the implantee, by monitoring

47
the progress of the implantee, and by determining his / her areas of strength
& weakness and set goals accordingly. It is paramount for them to work in
tandem with the Audiologist who provides the MAP for stimulation via the
implant, since any poor performer needs to be troubleshooted at the earliest,
for verifying the optimal settings in their MAPs. If necessary intervention with
Re-Mapping and enhancement of the habilitation protocols need to be
pursued in order to eventually match the expected outcomes of cochlear
implantation in such individuals.
2.2.4. CI Electrophysiology – Principles & Methods of IT, ECAP, ESRT & EABR
Prior to cochlear implantation, objective measures like the Trans-
tympanic EABR and Promonteric Stimulation (prom-stim) may be used to
select the ear for cochlear implantation, among older individuals with
prolonged period of auditory deprivation (Zwolan & Kileny, 2004). During
cochlear implantation, ECAP, ESRT & EABR, can be used to assess device
integrity and to measure the amplitude growth function of the auditory nerve
response (Mason SM, 2004). This assures the implant team & the family
members, that the implantee is receiving auditory signals optimally via the
implant. Post-operatively, these tests aid in objective programming of the
speech processor and can also be used as a possible predictor of implant
performance. Establishing precise electrical thresholds and comfort levels
through behavioral methods is challenging in very young children and those

48
with developmental delay or multiple disabilities and in such cases
electrophysiological measures have taken precedence (Brown CJ et al, 2000;
Shallop JK et al, 2000).
Electrode stimulation modes and array structures
There are different stimulation modes by which electrodes deliver
signals to the cochlea and these modes vary with the different models of
implants available today. Monopolar stimulation refers to electrode stimulation
with respect to a single extra-cochlear electrode that serves as a reference
ground. Bipolar stimulation refers to electrode stimulation in reference to a
neighboring intra-cochlear electrode. Dual electrode stimulation is the
coupling of two adjacent intra-cochlear electrodes as the active electrode.
The dual mode is preferred for electrophysiological studies, due to better
neural recording capabilities. The electrode arrays may possess single
contact points placed towards the modiolus (as in Cochlear-Nucleus Implants)
or paired contact points on either side of the electrode array (as in MedEl
Implants). Recent developments have given rise to pre-curved electrode
arrays which are intended to closely approximate with the modiolus. These
electrode contacts lie closer to the basilar membrane, need lesser current to
stimulate the nerve & thereby improve spatial specificity of stimulation. Such
variations influence the pattern of electrical flow across electrode-neural
interface and therefore impedance to current flow may vary with respect to
electrode orientation & proximity to neural elements along the cochlea.

49
Fig-2.2.4.1: Normal Impedance Telemetry profile shown for a
Cochlear-Nucleus Implantee
Impedance Telemetry (IT): IT shows the amount of resistance present to
passage of current across the electrodes and thereby displays the
conditioning of electrode-neuronal interface for receiving electrical stimulation
via the implant. IT helps in the measurement of the voltage developed across
the active electrodes during stimulation in order to identify electrode
anomalies. Electrode impedance is calculated by dividing the voltage at the
electrode by the current flow through the electrode. The ground path
impedance assessment is considered to be vital for the integrity of the
implant. IT can be tested in Monopolar, Bipolar, MP1+2 (Dual) and in
Common Ground modes. Hence, it is mandatory to perform IT measurements
on all electrodes across the array, prior to each schedule of
electrophysiological testing & Mapping (Finley CC, 1990; Liang DH, 1999;
Henkin Y, 2003). Impedance Telemetry is routinely performed in all the

50
available modes by the software and the most conducive mode for electrode
stimulation is chosen by default, as per the electrode design & implant model.
Fundamentals of ECAP Testing: ECAP Telemetry is a quick and non-
invasive way of recording the electrically evoked synchronous responses of
the peripheral auditory nerve fibers. The cochlear implant receives the evoked
action potentials, by amplifying signals from the intra-cochlear electrodes and
these signals are encoded and transmitted back to the speech processor by
radio frequency. Thus ECAP measurement is a wireless bi-directional
communication of data between the programming hardware and the implant
in-vivo. The neural response resulting from a stimulus presented at one
electrode within cochlea is measured at a neighboring intra-cochlear
electrode.
The ECAP is a triphasic waveform, with a small positive peak P1,
negative trough N1 & positive peak P2. The P1 latency lies in the range of
100-300 µsec and the amplitude from N1 to P2 is denoted in µvolts. The
negative peak N1 appears at about 220 to 400 µsec following the stimulus
onset and this is followed by much smaller positive peaks or plateau (P2)
occurring at about 600 to 800 µsec (Abbas, Brown & Gantz, 1998; Cullington,
2000). The twin-peak P1 and P2 waveforms are mainly found on apical
electrodes, and may be related to the activity of both the peripheral dendrites
and the more central axons (Stypulkowski and van den Honert, 1984; Lai and

51
Dillier, 2000). Since ECAP is an early latency response, it needs to be
separated from the stimulus artifact, using a forward masking and subtraction
paradigm which exploits the refractory property of the auditory nerve (Abbas
et al, 2000). ECAP is described by the amplitude of the evoked response as a
function of stimulation level. ECAP thresholds and slope can be determined
from the amplitude growth function and this amplitude increases in an ordinal
sequence, with an increase in stimulus level. ECAP testing measures the
excitability of the auditory nerve at different cochlear locations and hence, it
reflects upon the surviving spiral ganglion population across the cochlea
(Brown et al, 1999).
Fig - 2.2.4.2: Basic set-up necessary for performing ECAP (NRI) measurements
in an Advanced Bionics Implantee

52
ECAP measurements are useful in estimating the amount of
psychophysical information needed to fit a CI, but may not predict
performance / outcomes with the device (Kevin & Susan, 2001). The basic
clinical applications of ECAP measurements in the present day include
confirmation of device integrity and physiological responsiveness of recipient,
selecting the optimal stimulation rate and for setting Maps for very young /
‘Difficult to MAP’ children. Intra-operative
ECAPs are used to verify the integrity of the cochlear implant, to
establish proper placement and functioning of the intra-cochlear electrodes
and to objectively document the auditory nerve response to electrical
stimulation via the CI. Post-operative ECAPs can be rapidly generated
electrode-wise across the array and this helps to assist in programming
individuals who cannot provide reliable behavioral responses and also for
verification of the accuracy of inconsistent behavioral responses, across the
array.
ECAP thresholds are believed to fall within the dynamic range of
Behavioural MAPs and therefore Audiologists may feel assured to tune up the
Behavioural levels based on ECAP thresholds, since that will result in audible
percepts for the implantee (Di Nardo et al, 2003; Hughes LM et al., 2000). In
many cases, ECAP thresholds have been observed to follow a contour or
shape similar to that of a Behaviourally created MAP. When the contour of

53
MAP levels across electrodes is different for T-levels versus C-levels within a
subject, the ECAP will often mirror the shape of one of those functions,
usually the T-levels (Hughes & Vander Werff, 2001). Hence, Audiologists may
prefer to set the profile and tilt of an initial MAP, based on ECAP thresholds
across the array, since this is a reasonable starting point for creating a first-
approximated MAP, based on which they can begin to condition a child to
respond behaviorally.
Newer ECAP modules, have added features like automated stimulus
parameters, faster sampling of signals, higher amplifier gains with lower noise
and better masking / artifact reduction methods, all of which precisely reflect
upon the neural activity induced by electrical stimulation at various regions of
the cochlea.

54
Fig - 2.2.4.3: Electrode-wise ECAP (ART) data acquired for a MedEl Sonata Implant

55
Fundamentals of ESRT Testing: It is defined as a neuromuscular electrical
reflex mediated through the brainstem, identified by the bilateral simultaneous
contraction of the stapedius muscles in the middle ears of an implantee, in
response to a direct electrical stimulation delivered to the auditory nerve, by
the cochlear implant. In a cochlear implantee, the electrically evoked
stapedial reflex can be visually identified by tendon contractions intra-
operatively and measured post-operatively using the reflexometer of an
impedance bridge, in a manual reflex decay mode, from the ipsilateral or
contralateral (non-implanted) ear, in response to electrical stimulation through
the implant, provided the normal middle ear integrity is confirmed with
tympanometry.
ESRTs show a threshold and also demonstrate amplitude growth up to
a point of saturation, similar to Acoustic SRTs. A one-second burst of biphasic
stimulus impulses (~250 pps) at a supra-threshold current level, are typically
used to evoke ESRTs, through any of the electrode channels of the CI.
Stimulation is gradually increased until a sufficient deflection is observed in
the reflex decay window and a standard bracketing procedure (with small
increments in current level) is used to determine the actual stapedius reflex
threshold (Battmer et al, 1990; Hall JW, 2007).
ESRT has a few limitations, like the need for presence of normal
middle ear function and integrity of the facial nerve and the acoustic reflex

56
pathway, which is paramount for eliciting reflexes at all schedules of testing.
The presence of ESRT response confirms that the implant is functioning and
that the neural pathways of the peripheral auditory nerve and the lower
regions of brainstem are intact. ESRT thresholds can be a good estimate of
comfort levels for speech processor programming for subjects, who are
unable to perform psychophysical behavioural tasks (Spivak et al, 1994).
ESRT modules are present in the Mapping software platforms of the
various companies and ESRT measurements have identical stimulus
parameters to those of the psychophysical MAPs, including the pulse duration
and stimulus repetition rate. This allows a direct comparison between ESRT
and behavioral measurements, making the ESRT data potentially more
predictive for purposes of fitting the CI. Studies involving experienced implant
users have demonstrated predictable relationships between the reflex
threshold and perceptual behavioural judgments, which fall between the most
comfortable level and level of loudness discomfort (Hodges AV, 2003).
Studies on ESRT reflex measured intra-operatively on anaesthetized patients
show a less robust relationship with behavioral percepts, but have been
demonstrated to provide benefit, as a starting point for setting maximum
loudness during programming (Jerger J et al, 1988).
In very young children where performing a conditioned response task
is often difficult, obtaining a reflex on even a single electrode, provides
57
assurance that the stimulation being used to condition the child is clearly
audible. ESRT thresholds tend to over-predict comfort levels in the initial
periods of implant use especially in children and programming such subjects,
using ESRT alone may lead to over-stimulation of the implantee (Spivak et al,
1994; Brown CJ et al, 1996).
Hence, a consensus of opinion has been derived from results of
various research workers, whereby initial ESRT based maps are to be made
by setting maximum stimulation levels at approximately 20% below ESRT
thresholds. With the current generation of multi-programmable speech
processors, MAPs made at -20%, -10% and at the reflex threshold can be
provided to the implantee at initial programming. Following such a method,
should help to avoid over-stimulation via CI, which is of particular importance
when fitting very young children (Hodges AV, 2003; Gordon KA, 2004; Hall
JW, 2007).

58
Fig-2.2.4.4: ESRT measurements as performed for Subject-A of the MedEl implant
group, with electrode-wise psychophysical stimulus delivered by Maestro 4.0.1
software and responses recorded from Ipsilateral / contra-lateral ear, in a manual
reflex decay mode, using the Reflexometer of an Inter-acoustics AZ 26 impedance
bridge, after confirming normal tympanometry in the test ear.
59
Fundamentals of EABR Testing: It is a far-field recording of changes in the
electrical activity in the brainstem, in response to auditory stimulus in the
electrical form, provided by the cochlear implant. The EABR consists of a
series of vertex positive peaks occurring within the first 6 to 8 ms, following
electrical stimulation of the auditory nerve. The general morphology of the
EABR is typically similar to that of acoustic counterpart, and the most
prominent peak of the EABR is also the wave V. The primary difference
between the EABR and the acoustic ABR is that EABRs recede with
significant shorter peak latencies.
In general, the absolute latencies for all EABR component waves are
observed to be around 1 to 1.5 milliseconds shorter than the typical acoustic
auditory brain stem response (ABR) mean latencies (Fig-2.2.4.6.). Typically,
wave V of the EABR has latency of 4-5ms, while at the high stimulation levels
the latency of the V peak of ABR is 5-6ms. The amplitude of the EABR peaks
are greater than the ABR peaks, presumably reflecting the greater neural
synchrony associated with electrical, as opposed to acoustic stimulation of
the auditory system. Another major difference between both is that the
latency of the individual peaks of the EABR changes very little with
stimulation level. The lack of change in latency is probably due to the
electrical stimulation which bypasses the normal cochlear mechanics and
activates nerve fibers directly.

60
The amplitude of EABR peaks are found to be greater than the
acoustic ABR peaks, because of the greater neural synchrony associated
with the electrical stimulus, as opposed to acoustic stimulation of the auditory
system. But, these relatively larger amplitudes of the electrical signals
produced by the implant, makes the recording of EABR difficult, since there is
considerable disturbances from the EEG waveforms and artifacts which are
also simultaneously triggered by the implant. Thus, it is paramount to prepare
the optimal settings necessary for EABR recording, by synchronizing the
stimulating & recording modules and by fine-tuning the pre-amplifier settings /
frequency band filters as required, in order to negate the super-imposing
artifacts / EEG waves, while meticulously studying the EABR responses.
EABR is a reliable, objective alternative to behavioral techniques for
estimating threshold and comfortable levels for electrical stimulation in
‘Difficult to MAP’ scenarios. But, the results of threshold estimation with EABR
in patients with CI are not as accurate as the estimation of behavioral
thresholds with conventional ABR in children using Hearing Aids. One factor
affecting the accuracy of threshold estimation with EABR is the electrode
location within the cochlea and the neural density at that region. Unlike ABR,
the EABR is unable to quantify the intensity of the stimulus accurately, since
there is considerable difference in the pitch ranking and loudness scaling
properties of the input signals, as delivered by the speech processor in an
implantee (as compared to a natural acoustic signal threshold used for

61
evoking ABR). While ABR identifies the exact threshold of hearing in dB for a
hearing impaired individual, EABR thresholds tend to fall much higher than
the actual electrical threshold levels to be set in the MAP for the implantee,
especially in the basal regions of the cochlea. In most cases, the EABR has
lower threshold with shorter latency and larger amplitude for a stimulus
evoking the apical electrode sites, while the basal regions require a higher
intensity of stimulus, for evoking a similar EABR response (Brown et al, 1994;
Hodges, Ruth, Lambert & Balkany, 1994; Shallop, Van Dyke & Mischke,
1991; Truy et al, 1998).
Lusted, Shelton & Simmons, in 1984 compared the electrode sites and
demonstrated that scala tympani placement resulted in clearer changes in
growth of amplitude for different degrees of neuron loss than electrodes
placed outside the cochlea. Hall JW in 1990 reported on measures of EABR
of rats, in which he demonstrated a correlation between growth response
magnitude and nerve fiber survival. Wave 1 the auditory nerve response
showed the strongest correlation, while later peaks of EABR showed poor
correlations.
Kilney & Zwolan in 2004, characterized the trans-tympanically evoked,
peri-operative EABR and defined its relationship with pre-operative hearing,
age and hearing loss etiology on 59 children (10 to 60 months of age) who
had received cochlear implants. There was no difference found between

62
wave V latency obtained from the younger (10-36 months) & older (37-60
months) children. This study highlights the fact that EABR testing is reliable
across subjects of different etiology and duration of hearing loss.
A number of investigators have used intra-cochlear stimulation to
measure EABR responses. The EABR responses in all these cases are
consistent, both across the studies and implant types (Abbas PJ, 1999;
Brown CJ, 2000; Mason SM, 2000; Gordon KA, 2004; Davids T, 2008). The
difference between pre-implant (TT-EABR / Prom-Stim) and post-implant
intra-cochlear EABR studies are likely related to the proximity of the
electrodes to the nerve and the consistency of the electrode placement as in
the case of intra-cochlear EABR stimulation. The amplitude and latency of
wave V of the EABR waveforms need to be plotted as a function of the
stimulus current level, in order to identify the exact threshold of EABR
responses. The amplitude of the response generally increases with increasing
stimulus levels and the latency of the peak tends to decrease slightly.

63
Fig-2.2.4.5: Basic Set-up & Montage necessary for EABR measurements, shown as performed for Subject-A of the MedEl implant group, psychophysical stimulus delivered to the electrodes by Maestro 4.0.1 software via the Diagnostic Interface Box 2.0 and evoked responses from the Ipsilateral ear, recorded using the Intelligent Hearing Systems (IHS) SmartEP (Evoked Potential) software module (Version 3.91USBez), in a synchronized paired computer.
Fig-2.2.4.6: Representative EABR waveforms as evoked via the cochlear implant, showing typical wave morphology & latency patterns and their comparison to an acoustic ABR waveform. Standard differences in wave latencies between ABR & EABR are highlighted in a table (Ref: Abbas PJ, 1991).

64
Fig-2.2.4.7: A representative EABR threshold measurement shown as performed for
Subject-K of the MedEl Combi40+ implant group, with the psychophysical stimulus
delivered by Zebra DOS software (version 3.0) and evoked responses recorded from
the implanted ear, using the Intelligent Hearing Systems (IHS) SmartEP (Evoked
Potential) software module (Version 3.91USBez).
EABR Stimulation of different electrodes within the implant can result
in different sensitivity, but all show similar changes of amplitude and latency
with the current level. This facilitates the acquisition of similar data from
adjacent electrodes located in the same region of the cochlea which is being
tested, thereby providing an option of selecting any electrode from an offset
along the array for EABR analysis, for predicting MAPs for that region of the
cochlea (Hall JW, 2007).

65
Standard Parameters used for Electrophysiological Measurements (An example of default parameters shown from the Cochlear-Nucleus Implant Group)
Impedance Telemetry
(IT)
Stimulation Modes = CG, MP1, MP2 & MP 1+2;
Stimulus Current Level = 100 micro-volts Pulse Width = 25; Recording: 0-30 k-ohms
Evoked Compound
Action Potential (ECAP)
Neural Response Telemetry
(NRT)
Probe: Stimulating Active Electrode = Screening (Mid Array ~ 14) + Full Sweep of All Electrodes / Alternate Electrodes Indifferent Electrode = 1-22, CG Stimulating Mode = MP1 Stimulating Current Level = 1-255 CL Stimulation Pulse Width = 25-400 microsecs Stimulation Pulse Gap = 25 Stimulation Rate = 5 - 400 Hz
Recording : Recording Active Electrode = Screening (Near Mid Array~ 17,18) Recording Mode = MP2 Gain = 40-60dB Delay = 35-1400 microsecs
Averaging : Sampling Rate ~ 9900 Sampling Mode = Artifact Paradigm - Subtraction by Masker Probe Artifact Cancellation Method = Forward Masking No of Sweeps = 1-100 Artifact Levels = 1-100% Radio-Frequency Blank = 1870
Masking : Masking Current Level = 1-255 CL Masking Pulse Width = 25-400 ms Masking Pulse Gap = 25 Masking Probe Interval = 250-10,000 µs Masking Rate = 100 Masking Mode = 500 Peak Threshold= 0-100 microvolts Negative Peak N1=0.5 ms Positive Peak P1=1 ms Amplitude = -50 to 80 microvolts Time = 0-2.5 ms

66
Electrically Evoked
Stapedial Reflex
Telemetry
(ESRT)
Measurement Options: Method 1 – Intra-operative Visual Recording Method 2 – Impedance Bridge Testing in Ipsilateral / Contralateral Ear
Stimulated Electrodes – 1, 6, 14, 20, 22 Current Levels = 1-255 CL Pulse Width = 25-400 µs No. of Pulses / Burst = 1-10,000 Stimulus Interface Gap = 6-60 µs Stimulation Rate = 100-8000 Hz Stimulation Duration = 0-5000 ms Stimulus Repetition Rate = 0.005-1000 Hz
Electrically Evoked
Auditory Brainstem Response
(EABR)
Stimulation defaults:
Single cycle pulse trigger
Indifferent electrode: MP1
Stimulus current level = 150 - 220 CL
Stimulus pulse width = 25 - 100 µs
Stimulus inter-phase gap = 7
Number of pulses per burst = 1
Burst stimulus duration = 0.057
Burst repetition Rate = 35 Hz
Stimulus Rate = 21.1/milliseconds Stimulated Electrodes = 1, 14, 22
Measurement defaults:
Electrodes placed on Vertex (Cz) / high-forehead (Fz) / CL Mastoid (Ref) and low-forehead (CG)
RF free period: 10 ms
Number of sweeps: 1000
Averaging: Basic / Alternating polarity
Artifact rejection: Disabled
Trigger delay: 0 µs
Sweeps / Artifact = 1024/1 to 1413/60 PP Amplification = 14 - 21 SNR = 0.7 - 3.2 Pre-amplifier Gain = 60 - 100 dB
Recording Mode: Bipolar / Multi-polar Alternating Stimulation via CI Trigger pulse Artifact Subtraction by Polarity Reversal Filters = 100-1500Hz Peak Records = 1.4-7.8 ms High Pass Filter = 1-150Hz Low Pass Filter = 3-5 KHz Amplification Rate = 50,000 to 100,000 EAP Signal Record = 1-10 milliseconds

67
2.3. Literature Survey:
Recent Concepts & Practices in Cochlear Implant Electrophysiology & Mapping
Technological improvements in cochlear implantation, including the
development of newer speech coding strategies and programming modules,
in addition to the advances in surgical techniques and the clinical expertise
available today for comprehensive habilitation, have improved the outcomes
& quality of life in CI users. The present day CI programming, has become
more dependent on higher stimulation rates, provided by the new age speech
processors which favor enhanced auditory perception abilities, hearing in
noise, speech clarity and music perception skills. The speech coding
strategies adopted and implemented in the various types of cochlear
implants, offer different stimulation rates, which needs to be optimized by the
implant audiologist according to the candidates’ preference.
In clinical practice, choosing an optimal rate for stimulation becomes a
trial and error method based on behavioural inputs from the candidate, but
younger children may not be able to identify the best rates for stimulation,
since a rate which offers best quality of sound, may not offer the best speech
perception. In a similar way, it may often be difficult to distinguish between an
optimal MAP versus an effective MAP, based only on behavioural responses
to high rate stimulation via the cochlear implant (Skinner MW, 2000 &
Overstreet EH, 2004). Auditory perception at high stimulation rates may also

68
be influenced by the refractory property and recovery function of the nerve,
which affect the perception of loudness via temporal summation, since a fast
recovering nerve fiber will transmit more impulses than a slow one. To
overcome this mismatch, newer implants have been incorporated with
automated stimulation rates derived from inbuilt formulas, based on the pulse
width and averaged electrode voltage. The default rates for stimulation with
automated pulse widths, thus maintain the same charge throughout the
electrode array. This helps to protect the electrodes against any physical
damage which may occur due to stronger current stimuli, beyond the
electrodes’ compliance limit.
Impedance Telemetry: Studies have shown that impedance levels reflect
upon the integrity of the electrode-neuronal interface, but do not necessarily
have any significant influence on the Electrophysiological thresholds and
Mapping levels. A high impedance value in an electrode does not provoke a
higher EP threshold. The possible reason for this finding is that the nerve
responses to the electrical stimuli are controlled by a spectrum of factors like
the refractory property, recovery function, neuronal density at the site of
stimulus and influences of higher centers on the auditory nerve (Saunders E
et al, 2002; Henkin Y et al, 2003). The Impedance levels across the array,
gradually stabilizes over time with implant use. This is possibly due to the
gelling effect of electrodes with the tissue interface and neural reorganization
around the electrode array, which facilitates better conduction of electrical
impulses with lesser resistance as the auditory nerve becomes more

69
conducive to electrical stimulation over time (Abbas et al, 2001). In practice, it
has been observed that the impedance values across the electrodes keep
varying by a few Kilo-Ohms with time, but they need to be within the
normative levels for optimal conduction of electrical impulses, without undue
resistance to the passage of current. It is a routine practice that Implant
audiologists check the impedance telemetry, both intra-operatively after
placement of the cochlear implant in-situ and also prior to each schedule of
Mapping / before attempting an electrophysiological measurement, in order to
make sure that all electrodes are conditioned for electrical stimulation and
thus confirm the implant integrity at the time of testing.
Need for Post-operative Electrophysiological Testing
In the past, researchers compared both intra-operative and post-
operative electrophysiological tests, especially ECAPs for setting MAPs and
an initial consensus was derived from results published by brown CJ et al,
1994; Parkinson AJ, 2002; Hill K et al, 2004; and Mason S, 2004. These
Authors proposed the use of both intra-operative and post-operative ECAP
tests for setting initial MAPs, since their studies had shown that there was no
statistically significant differences between the two longitudinal measures and
hence both were equally useful during Switch-On & at subsequent initial
Mapping schedules. These authors also suggested that, subjects who do not
produce sufficient ECAPs at the time of ‘Switch-On’, possibly due to low-set

70
comfort levels with reduced tolerance to loudness of the stimuli, may benefit
from goodness-of-fit MAPs created based on intra-operative ECAP profiles
alone. This concept has been commercially utilized in recent implant
software, which has provision for incorporation of intra-operative ECAP
thresholds into the Mapping program when necessary. Hence audiologists do
not feel the need for performing post-operative ECAP tests, unless required
as in ‘Difficult to MAP’ situations.
But, intra-operative tests do not truly reflect upon the behaviour of the
Auditory Nerve at the time of the cochlear implant ‘Switch-On’ and
programming. There are significant variations in the current levels of various
electrophysiological tests post-operatively due to factors like; wound healing,
reduction in neural tissue - electrode interface (the gelling effect), alteration of
electro-chemical gradient within cochlea, neural re-organization, conditioning
and adaptation of auditory nerve and the influences of higher auditory centers
on the nerve’s response to electrical stimulation, all of which are absent while
the subject was tested under General Anesthesia, in the operating room.
A series of researchers at the Cooperative Research Center (CRC) for
Cochlear Implants in Melbourne, Australia analyzed the relationship between
intra-operative and post-operative ECAP thresholds and their application for
programming the Cochlear-Nucleus Devices, during the last decade. Their
studies have proved that post-operative ECAP profiles are more effective in

71
Mapping, than an intra-operative ECAP profile. A similar opinion has also
evolved from other studies on intra-operative versus post-operative ESRT &
EABR profiles & their clinical application for implant programming (Battmer
RD et al, 1990; Kileney PR et al, 1991; Hodges AV et al, 2003).
In a comprehensive research work done by Hughes LM et al, in 2001;
a longitudinal analysis of electrical impedances, ECAPs and behavioural
measures was performed in a group of Cochlear-Nucleus 24 CI users. The
primary goal was to study the changes in these measures over time and
compare the results between 35 adults and 33 children involved in this study.
The various parameters were sequentially recorded in these cohorts up to 2
years of implant use. The results showed that changes in impedance
telemetry, ECAP thresholds and Amplitude growth function of ECAPs were
similar among adults and children, up to the first 2 months of CI use. Beyond
the first 2 months, children exhibited significant increase in electrode
impedance, ECAP thresholds, slope and rising psychophysical T-levels, while
these same measures were relatively stable in adults. The major inference
from this study is that, if ECAP thresholds need to be used for Mapping, it is
best to make these measurements at the same time intervals as the device
programming, rather than using the ECAP measurements made at the initial
programming session (Switch-On) or earlier (intra-operatively), for setting the
Mapping levels at later visits.

72
Hence, there is a paradigm shift in the consensus of opinion in the
present day that, a one-time confirmation of optimal implant function
assessed intra-operatively with electrophysiological measures, does not
impress upon the post-operative behavior of the Auditory Nerve to electrical
stimulation via the cochlear implant, which may vary over a period of time.
Thereby, post-operative electrophysiological tests need to be performed
during the habilitation period or beyond, in order to predict optimal Mapping
levels, whenever a ‘Difficult to MAP’ situation is encountered in the clinical
scenario (Brown CJ et al, 2003; Hill K et al, 2004; Gordon et al, 2004; Polak
M et al, 2005; Caner et al, 2007 and Basta D et al, 2007). Most implant
manufacturers have provided in-built electrophysiological test modules, in
their programming software for this purpose, but they do not emphasize their
use, unless when a trouble-shooting situation is encountered.
Implant companies are yet to provide a clear-cut, comprehensive tool
guide or flow-chart algorithm, for the optimal application of these objective
measures in real-life ‘Difficult to MAP’ situations, which adds to the dilemma
of the Implant audiologist, who may often face such a practical situation in
clinical practice. A possible reason for the above scenario may be the paucity
of uniform & consistent results while using electrophysiological measures.
The realm of post-operative electrophysiology is still evolving, with new data
emerging from reputed CI clinics across the world, providing new insights into
this intriguing entity, with ample scope for further research.

73
The Enigma of Mismatch between
Electrophysiological Thresholds & Behavioural Levels
The three clinically available objective measures, namely - ECAP,
ESRT & EABR have been successful in providing working MAPs for cochlear
implantees, but all of them have also shown certain drawbacks when clinically
applied, as discussed in the literature below.
A) ECAP versus Behavioural Levels: ECAP measurements are the most
popular, user friendly, rapidly performable method for providing reference
values for Mapping, but they do not predict the optimal behavioural levels for
setting in a MAP, due to various reasons as below. ECAP thresholds tend to
be higher than the behavioural threshold levels and may fall in-between
threshold & comfort Levels, within the dynamic range of the MAP, but in 1/3rd
population of implantees ECAPs may also exceed the comfort levels
especially in the basal electrodes (Smith et al, 1994). Strong correlations
have been reported between ECAP thresholds and psychophysical
behavioural thresholds, while weaker but significant correlations have been
found between ECAPs and comfort levels in various studies by Brown CJ,
1996 & 1998; Abbas PJ, 1999; Hughes LM, 2000; Franck & Norton, 2001.
The obvious mismatch noted between the ECAP thresholds and
behavioural current levels, has been implicated to the different rates at which
74
the stimulus is delivered to the Auditory Nerve via the implant. ECAPs are
evoked at much slower stimulation rates, in order to clearly identify the
morphology of the nerve action potentials and to study the properties of
amplitude growth and recovery function of the nerve. Behavioural
programming is done at higher stimulation rates by fast temporal processing
of sound impulses, in order to deliver the complete sound signal without any
loss of information and thus provide the best auditory perception. Hence
ECAP levels cannot be directly incorporated into the speech processor as
programming levels, without any available behavioural inputs from the
cochlear implantee.
A fundamental study done by Abbas PJ et al, in 2001 established the
fact that ECAP measures alone are not very reliable for implant programming.
Abbas & his colleagues revealed chronological changes in ECAP (NRT) over
time from the day of surgery in their study group of 36 children, using the
Cochlear-Nucleus Implants. Statistically significant changes in the NRT
thresholds of these children were observed until 3 to 8 months following initial
stimulation. Measures of NRT slope in the children did not stabilize even until
12-months post-implantation. These Authors opined that longitudinal trends in
NRT measures followed the threshold levels more closely than comfort levels
in the Nucleus implant group which they studied but, NRT did not reflect upon
the vital factors like an expanding dynamic range and rising maximal comfort
levels, which are paramount for optimal implant fitting over a period of implant

75
use. Smoorenburg, et al in 2002, proved that the recovery function of the
auditory nerve when analyzed via the Nucleus NRT software, helped to define
the stimulation levels needed to program initial MAPs in infants and children.
They found it useful to create offsets between T-NRT and T-Levels across the
array and thus help in defining the tilt of the MAP. They concluded that ECAP
thresholds, have a positive correlation with comfort levels, but cannot be used
to predict the overall comfort levels and tilt of the comfort profile, since
prediction of slope of the maximum stimulation curve, which is the most
critical factor in speech perception, from the ECAP thresholds was quite poor.
Many reasons have been documented in literature for the poor match
between the ECAP thresholds and the Behavioural Levels to be programmed
in the MAP. Factors affecting ECAP profile include – electrode impedance on
the probe and recording electrodes, radial distance of the probe and
recording electrodes from the modiolus, actual focus of contact between the
electrode & the neuronal elements, neural density at the point of stimulation,
refractory period of the nerve fibers, masker probe induced artifacts, voltage
measurements across the electrodes, demographic variables such as etiology
of the hearing loss, duration of auditory deprivation, implantation age and
duration of implant use (Pfingst BE, 1999; Rebscher SJ, 2001; Morsnowski A,
2003; Shpak T,2004).

76
Researchers like Almqvist B (1998), Miller CA (2000), and Morsnowski
A (2003), aimed to identify the goodness-of-fit between ECAP thresholds and
Behavioural profiles, in order to establish a common correction factor for
incorporation into the fitting method, in ‘Difficult to MAP’ candidates. But, they
were unable to arrive at a consensus regarding standardization of a
correction factor based on offsets formed between the reference T-Levels and
their corresponding ECAP thresholds, since they found that subjects showed
a range of inter-electrode and inter-patient variabilities which occurred over
time, during their studies.
Effect of Stimulation Rate on the relationship between
ECAP & Behavioural levels
Frank & Norton, in 1999 have reported that there is no one-to-one
relationship between ECAP thresholds and behavioural measures used to
program the speech processor, since they found that these recordings
followed no specific patterns and considerable variability was found across
the electrodes and among the subjects. The following reasons substantiate
their observation. The degree to which electrophysiological thresholds of the
auditory nerve could replace or supplement behavioural testing methods,
depend upon the pulse rate of the stimulus used for electrophysiological and
behavioural measurements.
77
The rate of stimulation at which ECAPs are measured is necessarily
limited by the time needed for each recording to be elicited on the software
and by the refractory properties of the nerve. ECAP measurements arise from
the auditory nerve activity within the millisecond immediately following each
current pulse. Thus, the pulses must be spaced far enough apart in order to
allow this measurement to be free from additional stimulus artifacts. If the rate
of stimulus is very high, the amount of activity evoked by each pulse would be
reduced by refractory effects of the nerve, making the response more difficult
to detect.
On the contrary, behavioural levels used to program the implant, are
generally measured at relatively higher pulse rates, ranging from 250 to 1000
pulses per second, depending upon the speech coding strategy being used.
SPEAK strategy uses 250 pulses/sec, CIS strategy uses 1200 pulses/sec and
ACE uses 900 pulses/second. This high stimulation rate tends to decrease
the behavioural threshold and comfort levels, since the psychophysical
responses to this high stimulation rate depends not only on the evoked
activity for each pulse in a pulse train, but also on the neural activity
integrated over a period of time on summation of a number of stimulus
pulses. The electrophysiological thresholds do not temporally integrate in the
same way as the behavioural thresholds and hence, there lies a disparity
between these two thresholds, even when measured on the same electrode
at the same time (Brown CJ et al, 1999; Skinner MW et al, 2000).

78
Brown CJ et al in 1998, compared ECAP thresholds to psychophysical
threshold levels in Nucleus implantees, for single biphasic pulses and found a
good correlation of r = 0.89 between them. She inferred that ECAP thresholds
measured at 35Hz are more related to behavioural thresholds obtained for
500 millisecond pulse trains of 35Hz, than to behavioural thresholds for 500
millisecond pulse trains of 250Hz. Subsequent studies that compared ECAPs
and behavioural thresholds showed correlation ranging from r = 0.5 to 0.6 in
adults (Smoorenburg et al, 2000) and between 0.2 to 0.7 in children (Hughes
et al, 2000; Gordon et al, 2002).
Zimmerling and Hochmair, in 2002 measured post-operative ECAP
thresholds at 80Hz and behavioural thresholds and maximum comfort levels
at 80Hz and 2020Hz in 12 Ineraid implantees. They concluded that ECAP
thresholds at 80Hz were highly correlated with behavioural threshold
measures at the same rate (r=0.89), but correlated less with behavioural
threshold measured at 2020Hz (r=0.6). Comfort levels moderately correlated
with ECAP thresholds at 80Hz (r=0.5) but correlations were poor at 2020Hz
(r<0.2). Murray & McKay, in 2005 reported that correlations of ECAP
thresholds with behavioural measures decreased with increasing stimulation
rates. Their data showed correlation values ranging from r = 0.94 at 35Hz
rate, 0.7 at 250Hz rate and 0.6 at 1800Hz rate respectively. They also noted
that ECAP thresholds were located higher in the behavioural dynamic range
as the rate increased, possible due to the fact that higher the rate,

79
behavioural threshold and comfort levels become lower. Fewster and
Dawson, in 2005 also reiterated this fact in their work, where ECAP
thresholds fell close to comfort levels when high stimulation rates were used.
Basile et al, in 2004 reported that in general, ECAPs obtained at low
stimulation rates are better in morphology and amplitude than those acquired
at higher rates.
The electrode design and rates used in the speech coding strategy
have a significant effect on the behavioural thresholds and ECAP
measurements (Eisen & Franck, 2004; Han DM et al, 2005; Polak M et al,
2005). Researchers have also proved that speech perception is better for
psycho-acoustically created behavioural Maps, than for NRT based Maps
with behavioural adjustments (Smoorenburg GF et al, 2002; Seyle K & Brown
CJ, 2002). Hence, the clinical application of ECAPs for device programming is
often limited to identifying the minimal thresholds required for nerve
stimulation at initial Mapping, but later psycho-acoustical feedback with
speech stimulus is mandatory in order to redefine the ECAP based Map,
according to the subjects needs.
Brown CJ et al, in 1998 reported that correlations may improve by
using additional limited behavioural data along with electrophysiological
measurements. Initial trials with a raw and random electrode-wise correlation
between these measures provided inconsistent and varied correction factors

80
across the array. Later, Hughes LM et al, 2000 & Smoorenburg GF et al,
2002; showed that behavioural threshold and comfort level data obtained
from a single middle electrode on the array can be used to create offsets with
its corresponding NRT level. Hughes further described that the difference in
current level (NRT vs T-Level and NRT vs C-Level) recorded at the mid-
electrode, may be used as a correction factor and applied to the NRT values
on other electrodes for predicting optimal behavioural threshold and comfort
levels across all the electrodes. This method improved correlations between
the measures in his study from 0.6 upto 0.9. But, since electrophysiological &
behavioural responses are not similar across the array, and may widely vary
between the apical and the basal array, this method was not found to be
clinically very successful.
In order to improve the correlations across the array, Gordon et al in
2004, investigated with a combination of two separate correction factors, one
for the basal and mid-array and another for the apical array since, greater
variabilities had been observed in the apical array leading to lower
correlations in the previous studies. Using this method Gordon could obtain
improved correlations across the array, of r = 0.95 for ECAP vs T-Level and r
= 0.93 for ECAP vs C-Level. The mean average difference between the
actually measured behavioural levels and statistically predicted behavioural
levels across the array, reduced to lesser than 10 programming units by this
method. Gordon’s study proved that it is better to divide the electrode array

81
into offsets preferably as apical array, mid-array and basal array and select
one representative electrode in each array for performing correlations with
their behavioural levels. This method provides three correction factors across
the array, thus increasing the accuracy of predicting optimal behavioural
levels for each region of the cochlea independently. Since ECAP
measurements when used alone without any behavioural inputs were not able
to provide a reliable MAP, researchers looked further into other available
objective measures like the ESRT & EABR for aiding in Implant programming.
In general, it has been observed that basal electrodes require higher current
levels for stimulation, than the apical electrodes. The higher behavioural
comfort levels noted in the basal array imply that louder impulses are required
to address the basal region of the cochlea, which has higher density of spiral
ganglions and codes for higher frequencies of auditory stimulation.
A study by Hughes LM & Abbas PJ, in 2005 analyzed the
electrophysiologic channel interaction, electrode pitch-ranking and
behavioural thresholds among two cohorts of Cochlear-Nucleus implantees,
using ECAP measurements and they concluded that there was no statistically
significant difference with respect to the ECAP measurements, noted
between the straight array and the peri-modiolar, contour advanced array
groups, even though the contour advanced group possessed lesser electrode
channel interaction and improved pitch-ranking ability. Such a panorama of
behavioural levels required to be set across the electrode array, cannot be

82
provided comprehensively by ECAP measurements alone, since they do not
reflect upon the accurate psycho-physical / psycho-acoustical properties of
the electrical impulse, processed via the cochlear implant. This necessitated
the use of ESRT & EABR which reflected better on the comfort levels needed
to be set in the MAP, due to their higher intensities of stimulation. As the
concept of Map Law evolved to include, charge based electrode programming
with comfort level based fitting, ESRT has taken precedence in setting MAPs
in recent times.
B) ESRT versus Behavioural Levels: ESRT measurements have been
commonly used for predicting comfort levels especially for very young, pre-
lingual, hearing impaired cochlear implantees, in whom identifying the optimal
loudness of the electrical signal is paramount for providing the best fitting
program. It is known that in the initial period of implant use, ESRT thresholds
may over-estimate the comfort levels and they may be a good indicator of
maximum comfort levels, rather than most comfortable levels. Hence,
audiologists setting an ESRT based initial MAP for an uncooperative child,
must be cautious in order to avoid any Mapping level above the ESRT
thresholds, which may induce an uncomfortable response to acoustic
stimulation in the child and aversion to further implant use. At later stages of
implant use, ESRT levels may fall in close proximity to the most comfortable
levels (Spivak et al, 1994; Hodges et al, 2003; Stephan et al, 2000).

83
ESRT has been found to be of greater value than ECAPs for the
estimation of behavioural comfort levels (Gordon et al, 2004; Han et al, 2005;
Caner et al, 2007). Investigators have concluded that ESRT show high
correlations with behaviourally obtained comfort levels and help to predict the
maximum comfort level pattern across electrodes (Jerger J et al, 1988;
Stephan K, 2000; Walkowiak A, 2010). Fitting the speech processor based on
ESRT data has been shown to result in speech perception scores equal to or
better than those achieved with conventional fitting techniques (Shallop JK,
1995; Almqvist, 2000, Bresnihan M, 2001). In general it has been observed,
that implantees using ESRT based MAPs have lesser discomfort and better
preference to wear the implant in loud environments. But, especially among
very young children, initial fitting measures with ESRT alone has not been
very successful due the inherent nature of ESRT thresholds to over-estimate
the comfort levels, which may result in the setting of too loud a MAP in such
children, thereby inducing an aversion for implant use among these children
(Walkowiak A et al, 2010 ; Van Den Abbeele T et al, 2012).
Unlike ECAP & EABR, ESRT thresholds are found to significantly rise
over a period of implant use, in accordance with the increased tolerance to
higher levels of stimulation shown by increasing comfort levels and an
expanding dynamic range among cochlear implantees (Gordon KA et al,
2004). Accurate estimation and fine-tuning of most comfortable levels and
loudness balancing are of greater value, while applying an ESRT based

84
method for programming young children, rather than construction of an
overall MAP profile, only using ESRT measurements. Hence, ESRT has been
the popular tool of choice, to aid in MAP stabilization and to avoid over-
stimulation among CI users with fluctuating / inconsistent comfort levels,
which can happen due to a greater stochastic ability (Shallop JK, 1995;
Ferguson et al, 2002; Miller CA et al 2003). By and large, ESRT based
prediction methods are found to be more useful than ECAP based prediction
methods, for setting Psychophysical behavioural levels for pediatric
implantees, though their comparisons with comfort levels are significantly
influenced by individual variabilities among the subjects, with regards to their
age at implantation and duration of implant use.
C) EABR versus Behavioural Levels: Literature suggests strong positive
correlations between acoustic BERA thresholds and subjective behavioural
thresholds for specific acoustic stimuli among normal individuals (Gorga et al,
1985; Coats & Martin, 1997). Similarly, research has also shown that EABR
thresholds have good positive correlations with behavioural responses for the
same electrical stimulus delivered via the cochlear implant (Abbas PJ &
Brown CJ, 1991). Hall JW in 1990, found a strong correlation between the
amplitude growth of wave 1 of EABR and the number of surviving spiral
ganglion cells. This correlation was found to be much weaker for the
subsequent waves in the EABR. Hall also described that wave 1 of Jewett’s
potentials corresponds to the ECAP potential and therefore ECAP thresholds

85
are directly proportional to the number of auditory nerve fibers activated at the
site of stimulation. This was a possible explanation for the ECAP thresholds
falling close to the psychophysical behavioural threshold levels, while the
EABR waveforms usually require a stronger stimulus higher than the
threshold current level, since the responses are evoked from the brainstem.
Brown CJ et al, in 1999 reported reasonable positive correlations for
EABR with maximum comfort levels, and recommended its application in the
setting of MAPs. In her study, she observed that EABR thresholds fell
approximately two-thirds of the way between the subject’s behavioural
threshold and comfort levels. But, she also emphasized the existence of
considerable individual variabilities in her series, between the subjects and in
the same individual over a time of implant use. She attributed this variability to
the temporal integration of the electrically synchronized stimuli, across
subjects. CI users who were able to perform excellent temporal integration of
the high rate sound signals, had larger differences between their Behavioural
levels and their EABR thresholds, than those subjects, who did not process
their high rate signals well enough. Hence, Brown concluded that in order to
improve the correlations between EABR and Behavioural levels for a specific
electrode, it was necessary to estimate the temporal integration ability of the
CI user.

86
In a subsequent study, Abbas PJ et al, in 2000 opined that EABR
threshold patterns mostly tend to remain unchanged during the first year of
implant use and hence EABR may be useful for objective programming of
implants, throughout the period of habilitation. This observation favored the
inclusion of EABR into the electrophysiological test battery provided by the
various Implant manufacturers. Further research focused on the assessment
of EABR properties at various sites along the implant array. Gordon KA et al,
in 2004 observed that EABR thresholds were higher than ECAP thresholds
across the array, due to the need for a higher energy of stimulation via CI that
is required to elicit a recordable action potential from the brainstem. Gordon
inferred that a pattern of gradual ascent in EABR thresholds may be noted
from the apical array towards the basal array, possibly due to higher neuronal
tissue density in the basal regions of the cochlea, which need more current
for a cumulative response from the brainstem.
It is accepted that EABR is more reliable than other objective
measures for predicting Behavioural levels, since it is more consistent across
the array and remains stable on longitudinal assessment over a period of
time. But, EABR has not found much acceptance in the practical scenario,
since it requires technical expertise with an advanced set-up and a
cooperative implantee. It is also found to be cumbersome, time-consuming &
impractical to be done electrode-wise, in order to comprehensively program a
cochlear implantee (Abbas et al, 2000; Brown et al, 2003; Shpak et al, 2004).

87
Need to Combine Objective Measurements
for Predicting Behavioural MAPs
Since each of the objective measures (ECAP, ESRT & EABR) showed
inherent disparities as above while predicting behavioural MAPs, researchers
arrived at a consensus of opinion, to combine these measures into a test
battery, in order to obtain more consistent MAPs. Gordon & colleagues, in
2004 pioneered the concept of combining the three objective measures for
achieving optimal cochlear implant stimulation levels in children. They
observed that a combination of such non-behavioural measures can aid in the
determination of useful cochlear implant stimulation levels, particularly in
young children and infants with limited auditory experience.
Gordon proposed that in order to overcome the disparities among
these measures while predicting MAPs, appropriate correction factors need to
be generated, based on individual correlations with available behavioural
levels and then may be clinically applied to produce an optimal MAP. She
suggested that correction factors to predict threshold levels should be based
on ECAP thresholds and EABR thresholds, and maximum stimulation levels
must be determined by using the ESRT thresholds. She believed that such
correction factors need to be made for at least one apical and one mid-array /
basal electrode, taking into account the age of the child and these factors
may have to be revised during the first year of implant use.

88
Need for Correlating Electrophysiological Measures
with Behavioural Responses
Electrophysiological measurements recorded from the Auditory Nerve
are quite different from the behavioural responses observed in the cochlear
implantee, mainly due to the fact that the electrical nerve responses recorded
from the peripheral auditory system does not primarily match with the
behavioural responses to the same current level of stimulation, since they are
influenced by the auditory processing, which happens at the higher auditory
centers. Electrophysiological measurements are usually performed at default
stimulation parameters that are different from the stimulation rates eventually
used during cochlear implant programming.
Sensitivity and neural reactions recorded to electrophysiological stimuli
are bound to be different from the behavioural reactions recorded at higher
rates of stimulation, used while programming (Shepherd RK & Javel E, 1997).
A higher stimulation rate is used in Mapping for optimal processing of stimuli
necessary for speech comprehension, while a lower stimulation rate is
preferred while performing electrophysiological measurements, since
accurate neural thresholds can thus be identified (Craddock et al, 2004;
Kaplan-Neeman et al, 2004; Gordon KA et al, 2004; Davids T et al, 2008).

89
Behavioural response elicited by electrical stimulation with a cochlear
implant electrode, is understood to be the result of a combination and
superposition of the following phenomena occurring at three different levels:
(Level-1) Electrode - tissue impedance and positioning of the electrode
contact towards the neural tissue. The higher thresholds for
electrophysiological responses at the basal electrodes are possibly due to the
physical current distribution among the more dense network of neurons;
(Level-2) Neural preservation and excitability status and refractory properties
of the auditory nerve fibers and (Level-3) Cortical and behavioural reactions
to the excitation patterns in the higher auditory pathways as influenced by the
age at onset of deafness, cognition, intellect, hearing aid usage and duration
of hearing deprivation prior to implantation.
All electrophysiological measurements clinically used like the ECAP,
EABR & ESRT objectively record events occurring at levels 1 and 2, yet take
no account of the variability present at the higher auditory centers. This
necessitates the need for their correlation with any available behavioural
level, in order to be able to optimally predict further behavioural levels across
the electrode array.
Behavioural responses are immensely influenced by higher auditory
circuits and electrophysiological measurements of the peripheral auditory
system alone cannot substitute or replace a behavioural MAP accurately.

90
Behavioural responses to stimulation via the implant vary widely between
very young children and older children, wherein factors at level-3 play a major
role and there also exist inter-personal variabilities between subjects.
Inappropriate Behavioural Mapping in infants / toddlers may over-estimate
comfort levels, as compared to older children, since these subjects are unable
to provide correct auditory feedbacks to the psychophysical stimuli provided
by the implants. Hence, age may also be a factor influencing the variability of
the behavioural levels across subjects (Sharma A & Dorman M, 2002).
The advent of Cortical Auditory Evoked Potentials (CAEP) and
Positron Emission Tomographic CT-Scan (PET-CT), have today provided
some objective insights into the interesting events occurring at the level 3,
with respect to age at onset of hearing loss, duration of auditory deprivation,
lingual status, cognitive mental functions, age at implantation and duration of
implant use, among pediatric cochlear implant users.
Research with cochlear implant aided Acoustic & Electrically Evoked
CAEPs / PET-CT imaging by studying their correlations with the behavioural
levels / outcomes among a spectrum of pediatric cochlear implantees, may
probably provide the way forward in future to solve the mismatch which
exists, while applying current methods.

91
Electrophysiological Thresholds versus Behavioural Levels:
An Example of Mismatch
The following Figs - 2.3.1 & 2.3.2, represent the mismatch noted
between the electrophysiological thresholds and the behavioural comfort
levels (M-Levels) at different points of time of implant use, found in a cochlear
implantee of the study group (Subject A) using the Advanced Bionics HiRes
90k implant with Harmony speech processor. The NRI, ESRT & EABR
threshold values have been directly plotted onto the graph for a comparison
with their respective M-Levels (y-axis = current units – CU & x-axis =
electrode array El 1- apical & El 16 - basal electrode).
Fig - 2.3.1: Plotted after ‘Switch-On’, at 1 month of implant use in Subject A, shows that; EABR thresholds (measured on 3 electrodes across the array) lie close to the Behavioural M-Levels, ESRT thresholds (measured on 4 electrodes across the array) over-estimate the Behavioural M-Levels, while NRI thresholds (measured for all electrodes across the array) fall on a mean average of around 65% of the Behavioural M-Levels and are variable from electrode to electrode.

92
Fig - 2.3.2: Plotted at 12 months of implant use in Subject A, there is more proximity between the ESRT & EABR thresholds and Behavioural M-Levels, but NRI thresholds still fall on a mean average of around 80% of the M-Levels and are variable from electrode to electrode.
These graphs highlight the practical fact that direct incorporation of
electrophysiological thresholds especially ECAPs onto the MAPs for fitting a
subject with inconsistent behavioural responses (which is the popular method
followed in clinical practice) is fallacious at any time of implant use, and will
produce sub-optimal performance with habilitation, unless such MAPs are
further fine-tuned with behavioural inputs subsequently. The existence of
such disparities, reiterates the need for a correlation between
electrophysiological and behavioural measurements, based on which a
statistical method for predicting optimal behavioural levels can be developed,
prior to clinical application of the electrophysiological parameters for implant
fitting. The present research work was focused on developing such a clinically
useful statistical prediction method, which would provide a way for optimal
Implant fitting.
Related Documents