CHAPTER 2 PREVIOUS STUDY ON SHALE ROCKS ァ2.1. INTRODUCTION In this thesis a series of tests on intact and reconstituted Wianamatta group shales is reported. One of the purposes of this chapter is to present an overview of previous studies on the nature and classification of argillaceous rocks and to examine the general characteristics of shale material that can have consistencies that range from stiff clay to rock. Another purpose of this chapter is to investigate the engineering behaviour of argillaceous rock with particular emphasis on shale properties. There is considerable confusion in the terminology used to describe shale materials. This review is mainly concerned with what will be called “clay shales”. These are defined as stiff shales with more than 50% clay particles by weight that are highly susceptible to significant deterioration as a result of interaction with water. They have been referred to in the literature as “stiff”, “fissile”, “intact”, “compacted”, or “brittle” shale as well as “soil-like shale”. The nature of cementation, the index properties and the mechanical behaviour of clay shales are reviewed. Data from previous studies on shales including various laboratory

Welcome message from author
This document is posted to help you gain knowledge. Please leave a comment to let me know what you think about it! Share it to your friends and learn new things together.
Transcript
CHAPTER 2
PREVIOUS STUDY ON SHALE ROCKS
§2.1. INTRODUCTION
In this thesis a series of tests on intact and reconstituted Wianamatta group shales is
reported. One of the purposes of this chapter is to present an overview of previous studies
on the nature and classification of argillaceous rocks and to examine the general
characteristics of shale material that can have consistencies that range from stiff clay to
rock. Another purpose of this chapter is to investigate the engineering behaviour of
argillaceous rock with particular emphasis on shale properties.
There is considerable confusion in the terminology used to describe shale materials. This
review is mainly concerned with what will be called “clay shales”. These are defined as
stiff shales with more than 50% clay particles by weight that are highly susceptible to
significant deterioration as a result of interaction with water. They have been referred to
in the literature as “stiff”, “fissile”, “intact”, “compacted”, or “brittle” shale as well as
“soil-like shale”.
The nature of cementation, the index properties and the mechanical behaviour of clay
shales are reviewed. Data from previous studies on shales including various laboratory
Chapter 2 – Previous Study on Shale Rocks
8
tests for determining the strength and stiffness of rock a re considered. The main aim is to
determine tests that are appropriate for the investigation of Bringelly shale.
The main features of the critical state concept and its application to soft rocks are
presented and the suitability of the application of this concept to clay shales rocks is
considered.
The post-depositional history of the Wianamatta group is discussed. The role that the
geology has played in establishing characteristic features of the Bringelly shale, and
insights that this can provide about the likely engineering response are also considered.
§2.2. BASIC GEOLOGICAL FEATURES IN THE SYDNEY BASIN
§2.2.1 Basic geology of Wianamatta group
The Wianamatta group ranges in age from early to middle Triassic. No late Triassic
sediments are known to have been deposited in the Sydney Basin (Bembrick et., 1980).
This agrees with Herbert, (1979) who suggested that Wianamatta group was deposited in
the middle Triassic during a single overall regressive episode after subsidence of the
Hawkesbury sandstone. Moreover, since Triassic times the surface of the Sydney basin
has been above sea level and consequently any further deposition of sediments will have
been terrestrial.
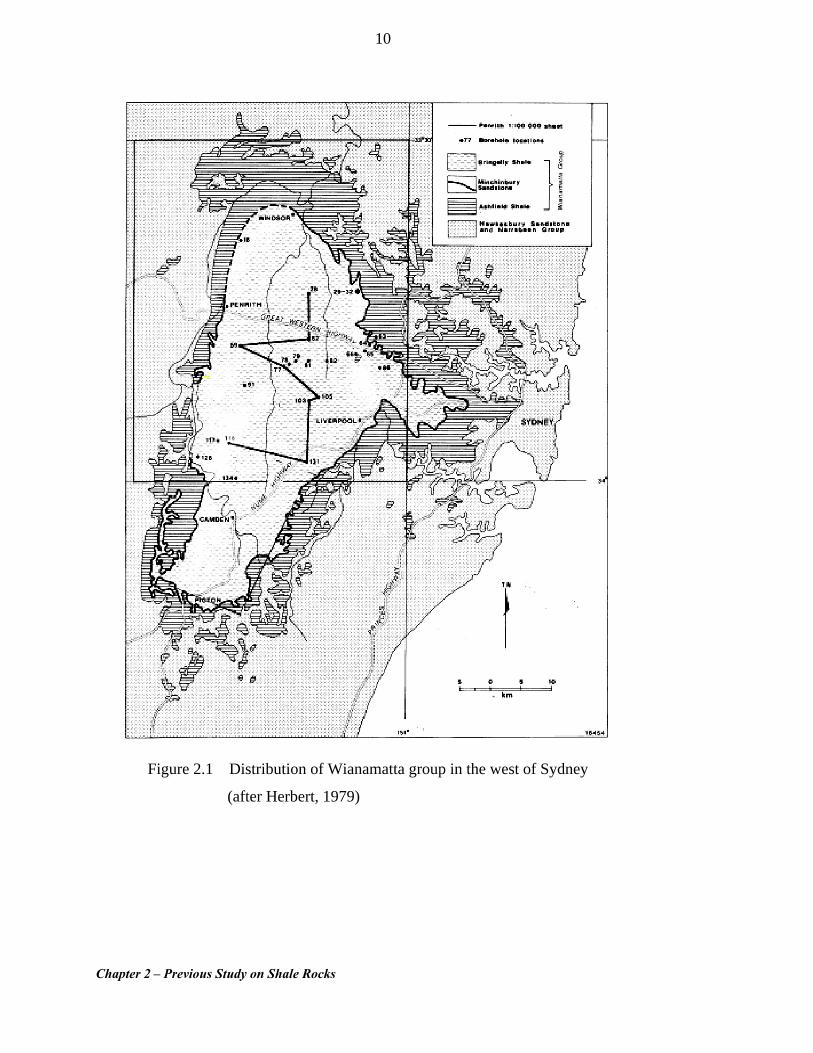
The Sydney metropolitan area is founded on three major rock units, the Wianamatta
group, the Hawkesbury sandstone and the Narrabeen group. These three rock units are
overlain locally by Quaternary / Tertiary alluvium. The Wianamatta group rocks (up to
304m thick), and their weathering products are of engineering importance as they form
the foundations for most of the residential, and industrial districts to the west of the city
of Sydney, as shown by the distribution of Wianamatta group rocks (Fig. 2.1). Both
Bringelly and Ashfield shales represent important resources of brick clay in Sydney.
However, the few remaining Ashfield shale pits have mostly been engulfed by suburban
Chapter 2 – Previous Study on Shale Rocks
9
development and have little remaining accessible reserves. In the western suburbs of
Sydney, Bringelly shale is frequently encountered during construction.
The Wianamatta group is believed to have been deposited during a single overall
regressive episode (Helby, 1973) and is an abundant geologic sequence in the Sydney
basin. It is dominated by argillaceous rocks. Shale comprises the upper rock layer for the
majority of suburban Sydney, covering a total area of approximately 1125 km2. The
residual soil layer is typically only a few metres thick. Two geologically distinct shale
types are found that are known as Ashfield shale and Bringelly shale.
The geological group is composed of prodelta and delta front shale (Ashfield shale),
barrier and barrier bar sandstone (Minchinbury sandstone), and an alluvial coastal plain
sequence (Bringelly shale). According to Herbert (1979, 1980b) the continuous supply of
sediment into the Sydney basin at the time of deposition caused the shoreline to build out
seawards with a vertical sequence of deposits. These deposits upgrade from lacustrine to
brackish or shallow marine deposits at the base (Ashfield shale), through a shoreline san d
(Minchinbury sandstone) and finally into alluvial sediments (Bringelly shale). This
interpretation was consistent with studies carried out by Chesnut (1983). No large-scale
sedimentary breaks have been recorded by previous geological studies on the Wianamatta
group.
The Bringelly shale was first described by Lovering (1954) then redefined by Herbert
(1979). It is interpreted as a coastal alluvial plain sequence which grades up from a
lagoonal-coastal marsh sequence at the base to increasingly more terrestrial, alluvial plain
sediments towards the top of the formation. Lithologically, it comprises sequences that
can be listed in order of decreasing volumetric significance as (1) claystone and siltstone
(2) laminite (3) sandstone (4) coal and highly carbonaceous claystone. Good outcrop is
uncommon in Bringelly shale due to soil cover developed in situ as a result of the
ongoing weathering of the parent rock.
Chapter 2 – Previous Study on Shale Rocks
10
Figure 2.1 Distribution of Wianamatta group in the west of Sydney
(after Herbert, 1979)
Chapter 2 – Previous Study on Shale Rocks
11
§2.2.2 Evolution of Sydney basin
The Sydney basin came into existence as a result of two major evolutional events. The
first major event occurred during late Paleozoic while the second major event occurred
during Late Permian to Middle Triassic period which represents the age of Wianamatta
group. The latter event has resulted in earth movement particularly during the mid
Permian (270 mya) and for the next 70 million years, Permian-Triassic sediments were
subjected to periodic episodes of marine transgressions and regressions that alternately
inundated and exposed the developing basin (Herbert, 1980). During this period, the
basin received large amounts of sediment from both land-based and marine sources.
Sedimentation episodes are believed by some researchers to have largely ceased by the
end of the Triassic (205 mya) still the subject of argument by many researchers (details
will be given in section 2.2.3.2). This was followed by episodes of volcanism,
weathering, soil formation, subsidence and uplift, all of which have resulted in the
formation of the present topography. Moreover, the formation of the basin was previously
thought to be the result of rifting (Branagan et al., 1976).
However, a recent interpretation of the structural history of the basin (Stewart et al.,
1995) suggests that compression has played a more dominant role whereby many major
depositional cycles may have been initiated during foreland loading. These cycles of
deposition caused a compression that led to folding (indicated by the New England fold
belt) and subsequently to the establishment of the northern Sydney Basin. Geologically
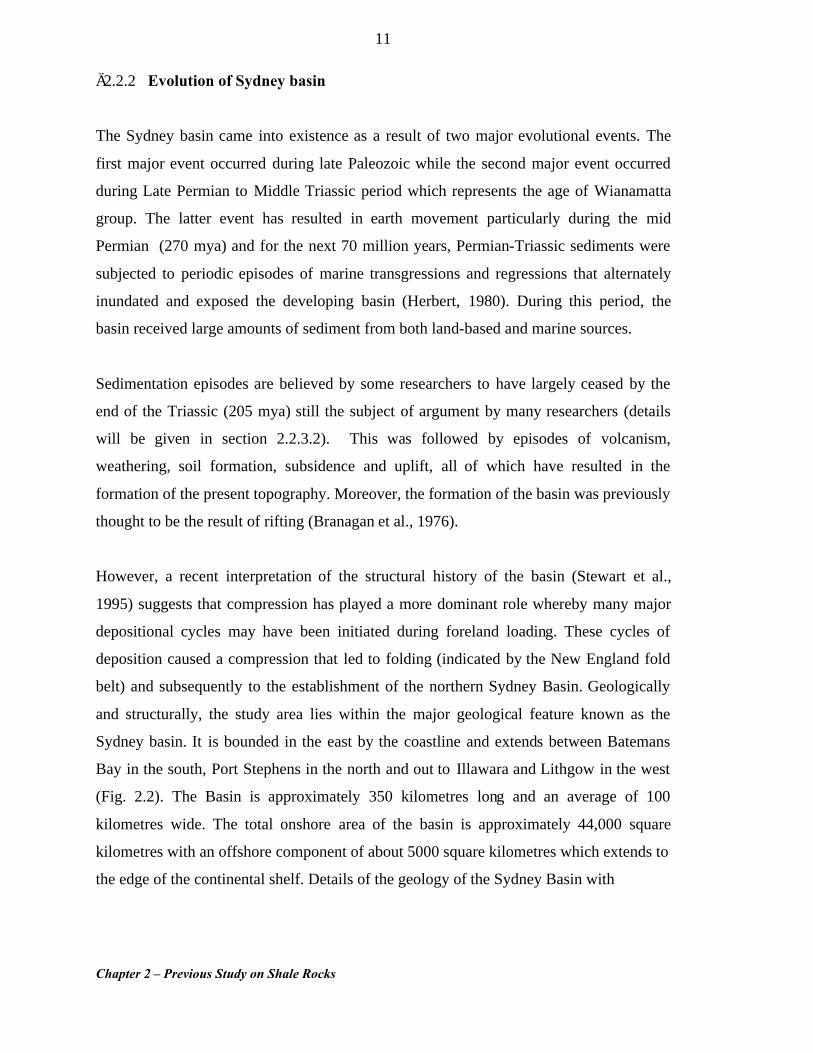
and structurally, the study area lies within the major geological feature known as the
Sydney basin. It is bounded in the east by the coastline and extends between Batemans
Bay in the south, Port Stephens in the north and out to Illawara and Lithgow in the west
(Fig. 2.2). The Basin is approximately 350 kilometres long and an average of 100
kilometres wide. The total onshore area of the basin is approximately 44,000 square
kilometres with an offshore component of about 5000 square kilometres which extends to
the edge of the continental shelf. Details of the geology of the Sydney Basin with
Chapter 2 – Previous Study on Shale Rocks
12
Figure 2.2 Main structural features of Sydney basin
(after Branagan, 1983)
emphasis to Wianamatta group were given by Herbert, 1980; Herbert, 1979, and
Lovering, et.al., 1969).
§2.2.3 Depositional and post-depositional events of Wianamatta group
§2.2.3.1 Depositional events
The depositional environment has a significant influence on the evolution of fabric and
structure of the material. This was evident from the sequential variations of Bringelly
shale which were interpreted as a coastal alluvial plain sequence which grades up from a
lagoonal – coastal marsh sequence at the base to be more alluvial at the top (Lovering,
Shale
Chapter 2 – Previous Study on Shale Rocks
13
1954). These deposits were described as extensive swamplands cut by meandering
estuarine and alluvial channels (Macgregor, 1985). The flow of these channels has
resulted in a deposition of uniform soil with very fine particles. This episode has occurred
in a single major marine regression. Lagoon, levee, peat marsh, and flood plain deposits
were the major features throughout this period.
This agrees with a description by Chesunt (1998) who suggested that the preserved
Bringelly shale of fine silt / clay particles was deposited (200mya) during periods of
rising sea level (Fig. 2.3) which he believed to be the last depositional stage in the history
of the basin (210mya) during the Jurassic period (more details are given in the next
section).
However, Helby (1973) held a different view as he suggested that the last stage of
deposition that occurred during the mid–late Triassic has affected the sedimentary
structure of Wianamatta group whereby major geological events such as diagenesis,
tectonism, weathering, and erosion are believed to be the prime contributors to the
variation in some physical properties such as porosity. During the formation of deposits,
compression due to overburden stress may have reduced the porosity of these deposits.
§2.2.3.2 Post-depositional events
The episodes of deposition that occurred in lake and swamp environments have been
followed by post-depositional events that have led to changes in structure, lithology, and
mineralogy. In the Wianamatta group, most of the chemical and mineralogical changes
are believed to have taken place at the sediment-water interface. The chemical changes
for instance have had an impact on the chemistry of the depositional environment of this
geological group and subsequently on the physio-lithological properties of its shale
formations. This is evident from the presence of fossil rootlets (Retallack,1980) and a
mottled texture of the light-grey claystone of Bringelly shale where the leaching of iron
and calcium is evident. The carbonaceous type of this claystone was probably deposited
in a swamp environment, while the non-carbonaceous type was probably deposited in
Chapter 2 – Previous Study on Shale Rocks
14
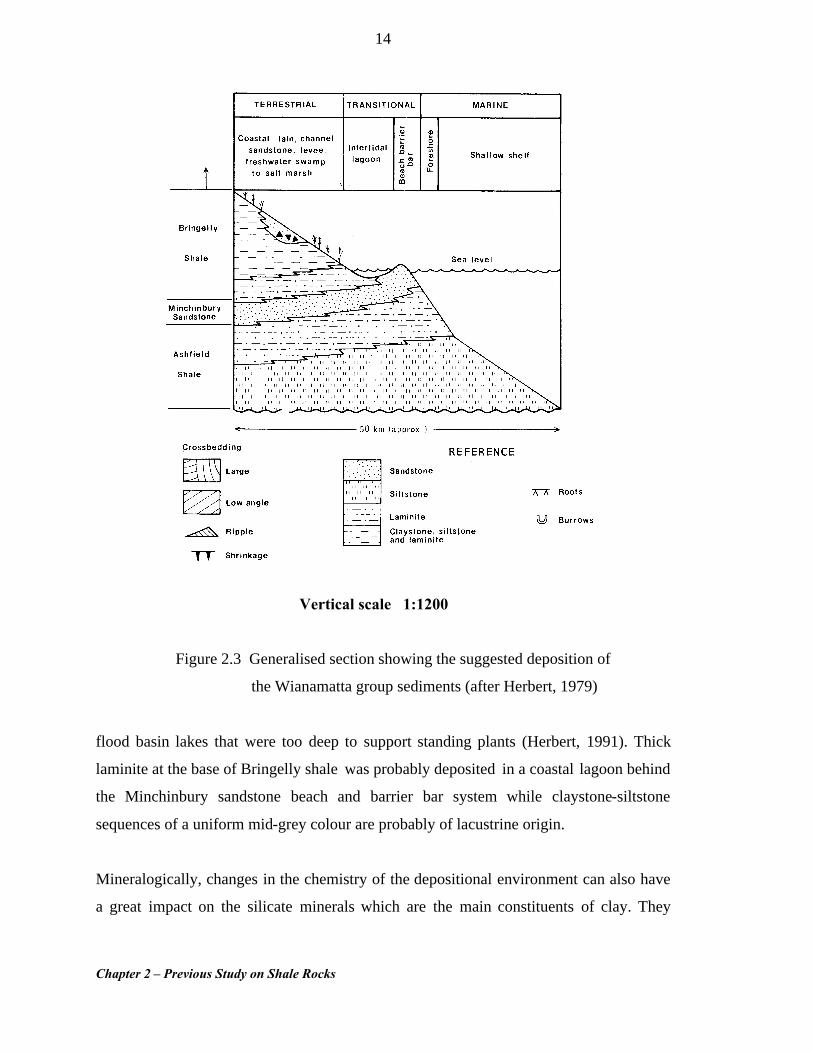
Vertical scale 1:1200
Figure 2.3 Generalised section showing the suggested deposition of
the Wianamatta group sediments (after Herbert, 1979)
flood basin lakes that were too deep to support standing plants (Herbert, 1991). Thick
laminite at the base of Bringelly shale was probably deposited in a coastal lagoon behind
the Minchinbury sandstone beach and barrier bar system while claystone-siltstone
sequences of a uniform mid-grey colour are probably of lacustrine origin.
Mineralogically, changes in the chemistry of the depositional environment can also have
a great impact on the silicate minerals which are the main constituents of clay. They
Chapter 2 – Previous Study on Shale Rocks
15
become unstable under the influence of weathering processes that can cause a
dissociation where a proportion of silicate minerals are dissolved incongruently, leaving
behind sheet silicates and iron oxides. During weathering, rock deteriorates back to clay,
some leaching occurs, roots and worms increase the porosity, moisture is taken back into
the clay structure and the mass per volume of the rock (density) decreases. Structural
features such as bedding, partings, and joints can be sufficient to initiate different
processes of weathering. These processes are carried out by various agents that are
capable of creating a gentle rounded topography (except where thick sandstone units-old
beach or sand dunes – are present).
The originally deposited soil of Bringelly shale that was described as uniform with very
fine particles and low void ratio would have decreased porosity even more due to the
subsequent lithification (by compression). Subsequently, the ongoing process of erosion
of overlying material leads to a state of unloading. This state allowed discontinuities in
the rock masses such as bedding planes, partings and joints to open up and to enhance
weathering processes, particularly chemical ones. Chemical weathering is more effective
in environments where lithification of rocks is not complete. This condition will have
assisted in further reduction to some rock minerals such as Fe, Ca, Na, Mg, and some
silicate groups.
This post-deposition geological history has left remarkable features that distinguish
Bringelly shale, and have made it easy for engineers and scientists to identify them.
These features and their relation to mode of deposition can be summarized in the
following points:
v void ratio and porosity is very low due to the dominancy of fine material
constituting the rock.
v moisture content is very low, due to depth of burial and associated compression
which has caused an expulsion of water and reduction in void ratios
Chapter 2 – Previous Study on Shale Rocks
16
v fossil rootlets, worm casts, siderite nodules and a faintly mottled texture are
present. These features might have led to an increase in the void ratio prior to the
process of soil lithification.
v Beds of carbonaceous claystone-siltstone in the upper part of the Bringelly shale
show evidence of plant debris and / or fossil roots. This is an indication that the
environment of deposition consisted of flood basins and lakes which were
reasonably shallow and able to support standing vegetation.
v bedding planes and partings which distinguish Bringelly shale are probably due to
unloading caused by erosion, which has in turn allowed chemical weathering to
take place. These are evident from the presence of mica sheets that are often
found between two distinctive layers i.e. claystone and siltstone.
Erosion of an upper-most layer of the Wianamatta group is suggested by the significant
difference in the thickness of Bringelly shale at the western side and that at the eastern
side of the formation. On the western side, the preserved sediment is 257m at the
Razorback range (Camden-Picton district) compared to 60m thick at the eastern side of
the formation (Wright, 1970). The erosion processes affecting the Wianamatta group
have been the focus of investigation by many researchers since the early seventies. These
studies were aimed at finding a connection between the missing thickness of sediments
from the post-Triassic period and the formation of the passive eastern margin in the floor
of the Tasman sea.
From the engineering perspective, knowledge of the geological processes would enable
the depth of sediment to be determined and allow the role of sedimentation compaction in
controlling the engineering properties to be assessed. Limited engineering investigations
have aimed to relate the post-depositional events that followed the formation of the
Permo-Triassic deposits to the characterization of Wianamatta shale properties such as
cementation, mineralogy, stiffness, and low porosity. Prior to the current study these
investigations were largely confined to Ashfield shale (e.g. Ghafoori, 1994).
Chapter 2 – Previous Study on Shale Rocks
17
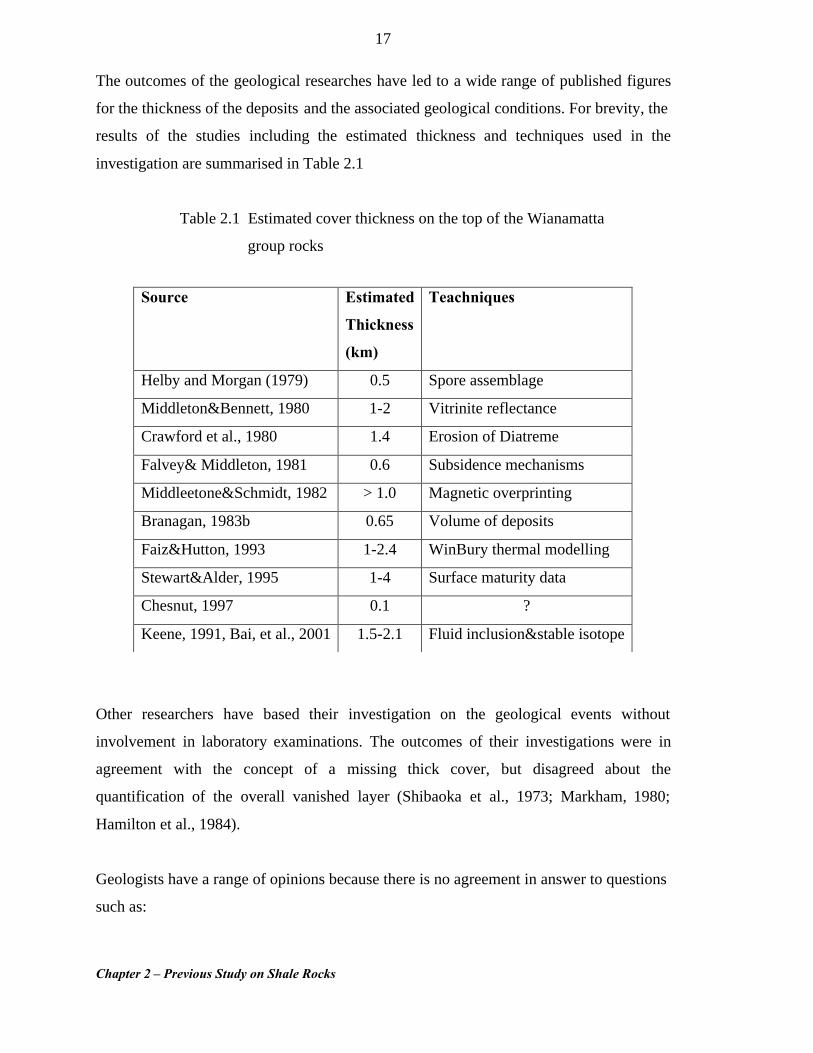
The outcomes of the geological researches have led to a wide range of published figures
for the thickness of the deposits and the associated geological conditions. For brevity, the
results of the studies including the estimated thickness and techniques used in the
investigation are summarised in Table 2.1
Table 2.1 Estimated cover thickness on the top of the Wianamatta
group rocks
Other researchers have based their investigation on the geological events without
involvement in laboratory examinations. The outcomes of their investigations were in
agreement with the concept of a missing thick cover, but disagreed about the
quantification of the overall vanished layer (Shibaoka et al., 1973; Markham, 1980;
Hamilton et al., 1984).
Geologists have a range of opinions because there is no agreement in answer to questions
such as:
Source Estimated
Thickness
(km)
Teachniques
Helby and Morgan (1979) 0.5 Spore assemblage
Middleton&Bennett, 1980 1-2 Vitrinite reflectance
Crawford et al., 1980 1.4 Erosion of Diatreme
Falvey& Middleton, 1981 0.6 Subsidence mechanisms
Middleetone&Schmidt, 1982 > 1.0 Magnetic overprinting
Branagan, 1983b 0.65 Volume of deposits
Faiz&Hutton, 1993 1-2.4 WinBury thermal modelling
Stewart&Alder, 1995 1-4 Surface maturity data
Chesnut, 1997 0.1 ?
Keene, 1991, Bai, et al., 2001 1.5-2.1 Fluid inclusion&stable isotope
Chapter 2 – Previous Study on Shale Rocks
18
i. how did the thick cover get there?
ii. How thick was it ?
iii. how long did it take to form?
iv. when was it removed and how long did its removal take?
v. how accurate and reliable are the techniques used in determining the cover?
Based on regional comparisons and surface maturity data, recent studies by Stewart &
Alder (1995) and Keene (2001) have suggested that the deposition of at least 1-2 km, and
possibly up to 4 km of Jurassic to Cretaceous sedimentation including small bodies of
magma are believed to have occurred before being eroded during tectonism associated
with Tasman sea rifting and / or underplating of the eastern continental margin.
The products of erosion of these thick sediments that can be estimated as ~10500 km3 are
believed to be deposited on the Tasman sea floor. These sediments will have influenced
the lithology and structure of the shale in the Wianamatta group due to the loading and
unloading and stress relief. For instance, it is believed that the low void ratio of both
shales (Ashfield and Bringelly) that were deposited in Late Triassic can be explained by
deep burial. Ashfield shale, for instance has a range of porosity between 5% to 12%
(Ghafoori, 1994). The existing sediment has a maximum depth of 257 m (Herbert, 1979)
which implies a significant missing cover that was surely thicker than the currently
existing layers.
In summary, most researchers agree on the reality of a now non-existent overlying
material, but argue about the thickness of such cover. However, given geological
uncertainty, it is difficult to estimate accurately the depth of burial that occurred during
the Triassic age.
Chapter 2 – Previous Study on Shale Rocks
19
§2.3 CLASSIFICATION AND GENERAL NATURE
§2.3.1. Classification schemes
In general, argillaceous rocks such as shale, mudstone, claystone, siltstone, and clay shale
are characterized by wide variations both in their engineering properties and composition.
The common characteristics of this group of rocks are that all members are fine-grained
and composed predominantly of clay and silt sized materials.
The term shale has been used by some authors for all argillaceous rocks, including
claystone, siltstone and mudstone (Ingram, 1953; Krumbein et al., 1963). Others have
specified the large group as the mudstone group and classified shale as a member of this
group (Twenhofel, 1937; Muller, 1967). Terzaghi (1946) had a different opinion in
defining shale. He claimed that the material should be called shale when it displayed a
clear ring upon striking by a hammer, and showed no change in volume when it was
immersed in water.
Many classifications used for argillaceous rocks are geological and depend on such
properties as quartz content, grain size, colour, and the degree of compaction. Although
these provide important information regarding the geological history of these materials,
such classifications can be misleading when concerned with engineering behaviour. This
is particularly evident when evaluating the behaviour of clay shales.
The general characteristics of clay shales include (1) highly overconsolidated, (2)
commonly small scale fissured, (3) strong diagenetic bonding, (4) tendency to slake when
rewetted after drying, (5) high swelling pressure in the presence of water, and (6)
significant disintegration as a result of interaction with water.
Beyond this general description of clay shales, the classification of these materials has
become complicated and confusing. Numerous classification schemes for argillaceous
materials have been proposed, and have reviewed by Shamburger, Patrick, and Cutten
Chapter 2 – Previous Study on Shale Rocks
20
(1975), Deen (1981), and others. A summary of these reviews concentrating on issues
relevant to the present study is given below.
§2.3.1.1. Geological classification of clay shale
The major objective of geological classifications is the determination of the geological
history of deposits. Initially classification (Wentworth, 1922) was based primarily on
grain size and arbitrarily set the boundary between argillaceous material and the
remaining sedimentary rocks. Ingram (1953) took the classification one step further, he
subdivided all clayey materials based on percentages of silt and clay components, and on
their breaking characteristics. Ingram used the term fissility which is the fine scale
fracturing in the shale surface to distinguish shale from stone, while the prefixes “clay”,
“silt”, or “mud” are derived from the relative percentages of the grain size components.
Thereafter, such terms as claystone, siltstone, and clay shale began to be used in the
literature.
In an attempt to distinguish between compacted and cemented shale, Philbrick (1950)
performed a simple weathering test that was based on five cycles of drying and wetting.
He suggested that the shales that reduced to grain sized particles be termed compacted
shales and those that were unaffected be termed cemented shale. This approach followed
earlier classification by Mead (1936) who classified shales according to their cementation
into two broad groups, the first is compacted shales that have been consolidated under
stress by the overlying sediment without intergranular cement, and the second is
cemented shales that could have a cementing agent (calcareous, siliceous, or ferruginous)
or a bonding material formed by recrystallisation of clay minerals.
A similar division by Underwood (1967) introduced new terms, “soil-like” shale for
compacted shale and “rock-like” shale or bonded shale for cemented shale. Although the
classification was aimed to serve geological purposes (Fig. 2.4), the division between
these two groups is poorly defined. This shortcoming motivated Folk (1968) to clarify
Ingram’s scheme by refining “mudstone” as argillaceous materials with sub-equal
Chapter 2 – Previous Study on Shale Rocks
21
Figure 2.4 Classification scheme of Underwood (1967).
amounts of clay and silt. This was further modified by Gamble (1972) who introduced a
classification scheme that was essentially the same as Ingram’s except that the terms clay
shale and silt shale have been changed into “clayey shale” and “silty shale”. Although
this change may seem insignificant, the term clayey shale does help to distinguish a clay
rich shale from a clay shale which, in engineering usage, implies certain engineering
behaviour and not simply a fissile rock which is rich in clay content.
Based on stress history, Bjerrum (1967b) classified shales as overconsolidated plastic
clays with strongly developed diagenetic bonds and clay-shales as overconsolidated
Chapter 2 – Previous Study on Shale Rocks
22
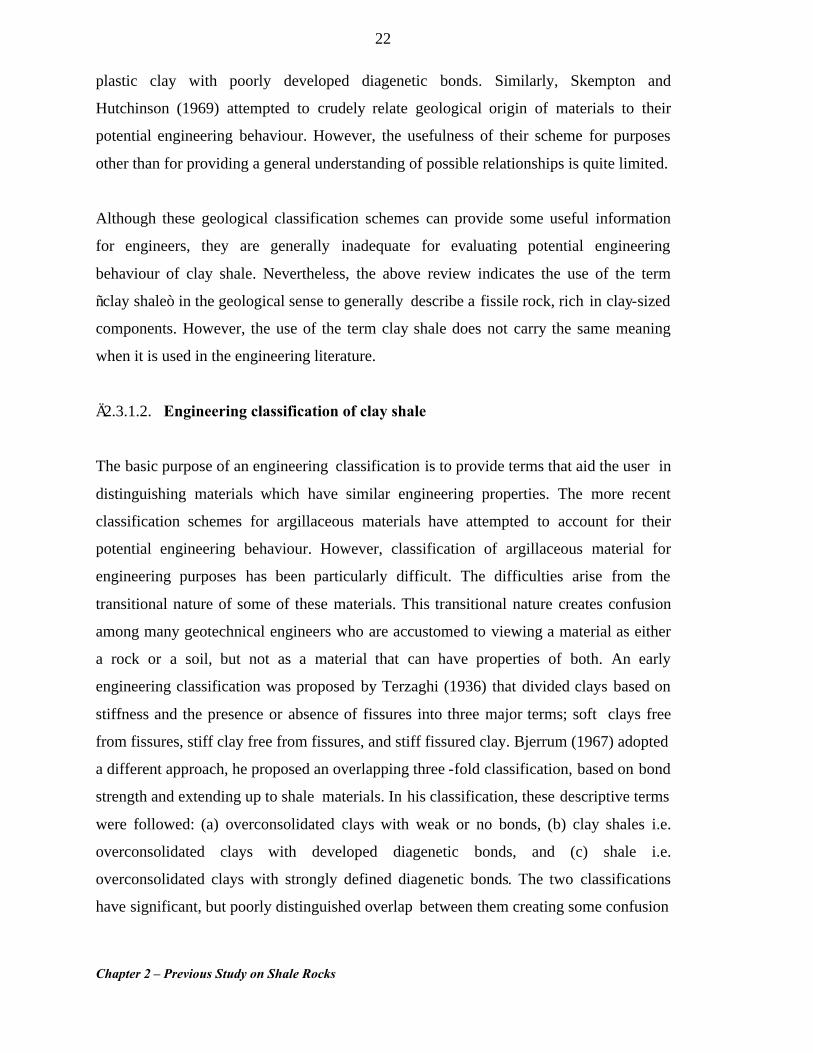
plastic clay with poorly developed diagenetic bonds. Similarly, Skempton and
Hutchinson (1969) attempted to crudely relate geological origin of materials to their
potential engineering behaviour. However, the usefulness of their scheme for purposes
other than for providing a general understanding of possible relationships is quite limited.
Although these geological classification schemes can provide some useful information
for engineers, they are generally inadequate for evaluating potential engineering
behaviour of clay shale. Nevertheless, the above review indicates the use of the term
“clay shale” in the geological sense to generally describe a fissile rock, rich in clay-sized
components. However, the use of the term clay shale does not carry the same meaning
when it is used in the engineering literature.
§2.3.1.2. Engineering classification of clay shale
The basic purpose of an engineering classification is to provide terms that aid the user in
distinguishing materials which have similar engineering properties. The more recent
classification schemes for argillaceous materials have attempted to account for their
potential engineering behaviour. However, classification of argillaceous material for
engineering purposes has been particularly difficult. The difficulties arise from the
transitional nature of some of these materials. This transitional nature creates confusion
among many geotechnical engineers who are accustomed to viewing a material as either
a rock or a soil, but not as a material that can have properties of both. An early
engineering classification was proposed by Terzaghi (1936) that divided clays based on
stiffness and the presence or absence of fissures into three major terms; soft clays free
from fissures, stiff clay free from fissures, and stiff fissured clay. Bjerrum (1967) adopted
a different approach, he proposed an overlapping three -fold classification, based on bond
strength and extending up to shale materials. In his classification, these descriptive terms
were followed: (a) overconsolidated clays with weak or no bonds, (b) clay shales i.e.
overconsolidated clays with developed diagenetic bonds, and (c) shale i.e.
overconsolidated clays with strongly defined diagenetic bonds. The two classifications
have significant, but poorly distinguished overlap between them creating some confusion
Chapter 2 – Previous Study on Shale Rocks
23
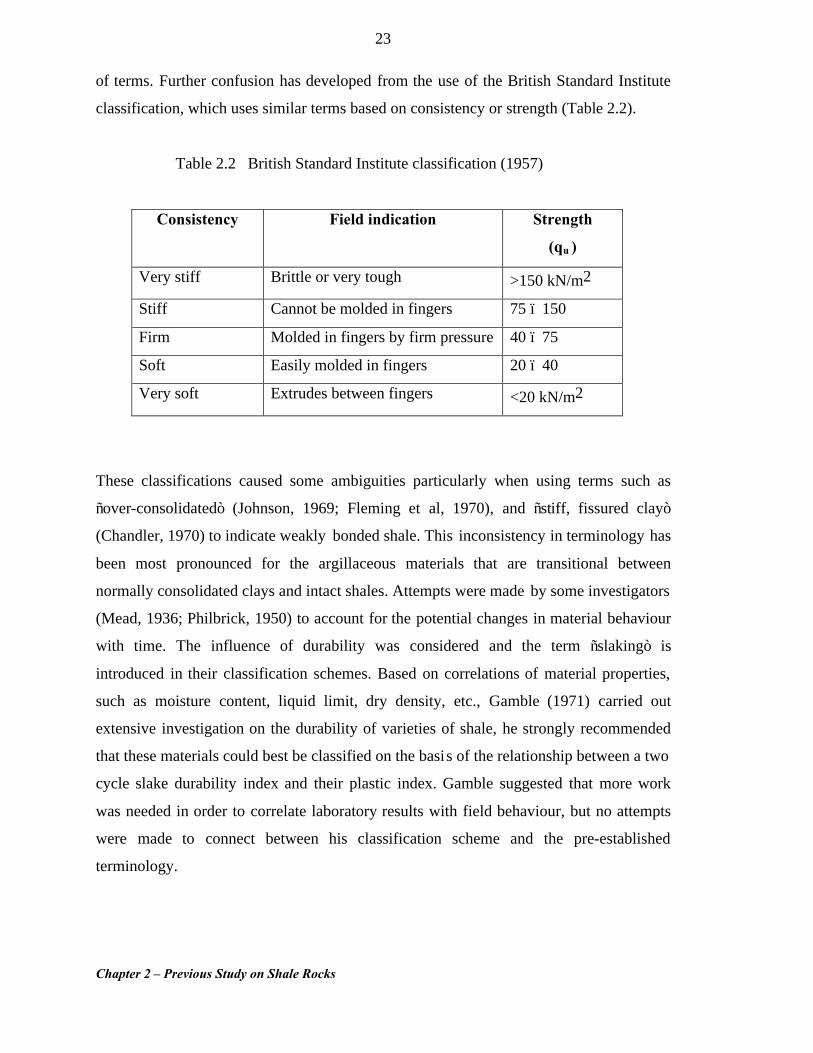
of terms. Further confusion has developed from the use of the British Standard Institute
classification, which uses similar terms based on consistency or strength (Table 2.2).
Table 2.2 British Standard Institute classification (1957)
Consistency Field indication Strength
(qu )
Very stiff Brittle or very tough >150 kN/m2
Stiff Cannot be molded in fingers 75 – 150
Firm Molded in fingers by firm pressure 40 – 75
Soft Easily molded in fingers 20 – 40
Very soft Extrudes between fingers <20 kN/m2
These classifications caused some ambiguities particularly when using terms such as
“over-consolidated” (Johnson, 1969; Fleming et al, 1970), and “stiff, fissured clay”
(Chandler, 1970) to indicate weakly bonded shale. This inconsistency in terminology has
been most pronounced for the argillaceous materials that are transitional between
normally consolidated clays and intact shales. Attempts were made by some investigators
(Mead, 1936; Philbrick, 1950) to account for the potential changes in material behaviour
with time. The influence of durability was considered and the term “slaking” is
introduced in their classification schemes. Based on correlations of material properties,
such as moisture content, liquid limit, dry density, etc., Gamble (1971) carried out
extensive investigation on the durability of varieties of shale, he strongly recommended
that these materials could best be classified on the basis of the relationship between a two
cycle slake durability index and their plastic index. Gamble suggested that more work
was needed in order to correlate laboratory results with field behaviour, but no attempts
were made to connect between his classification scheme and the pre-established
terminology.
Chapter 2 – Previous Study on Shale Rocks
24
Based on the realization of the importance of shale deterioration, another classification
was proposed by Deo (1972) that classified argillaceous materials according to their
susceptibility to deterioration rather than the initial state of the material. Three tests, all of
which measure shale durability (i.e. slaking, slake durability, and sulfate soundness),
were performed on various shales from Paleozoic deposits in Indiana. Using indices
derived from these three tests, Deo categorized shale deposits into soil-like shale, two
types of intermediate shale, and rock-like shale. A combination of earlier classification
schemes based on initial properties and classification schemes based on durability was
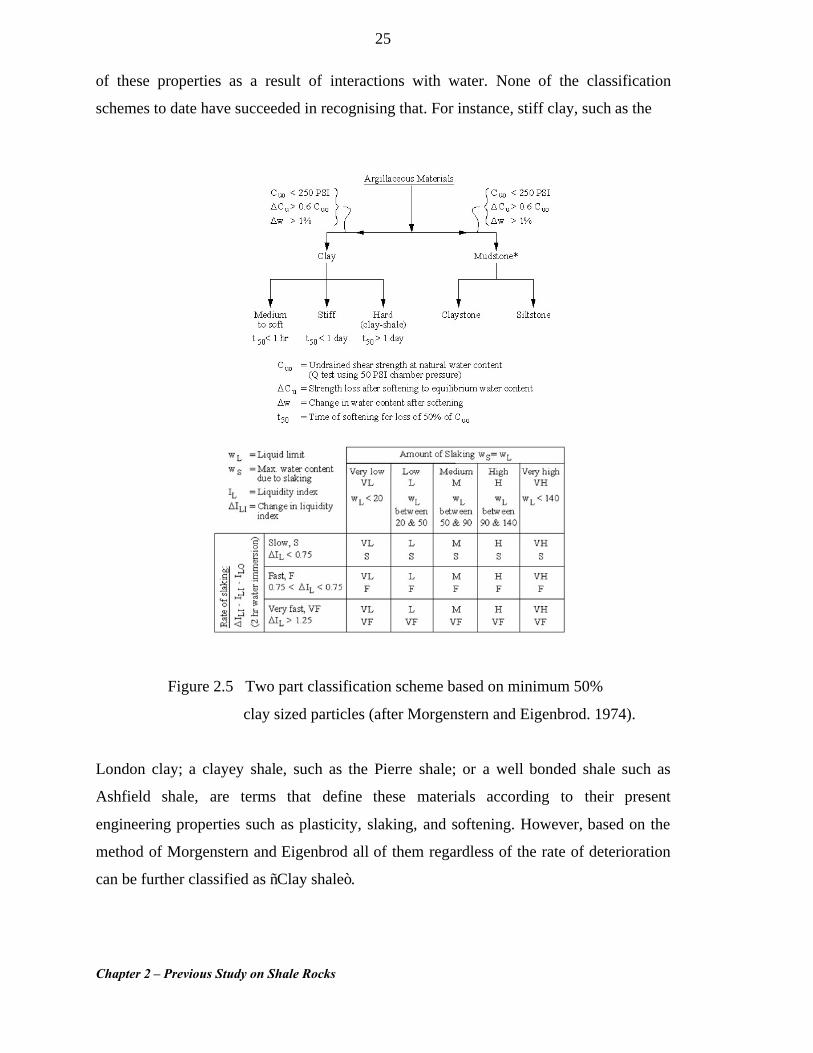
first attempted by Morgenstern and Eigenbrod (1974) who presented two classification
schemes (Fig. 2.5), one based entirely on the slaking characteristics (i.e. the rate of
slaking versus the amount of slaking), and a more significant scheme that included
undrained shear strength, strength loss after softening, changes of water content after
softening, and the time of softening. Although it was required that the scheme emphasise
the influence of softening on strength and water content, the scheme first stipulated three
potentially conflicting properties:
a) undrained shear strength,
b) the degree of strength loss after softening, and
c) the degree of changes in water content after softening.
These properties are given conditional values prior to dividing the argillaceous material
into either soil or rock, and the classification is based only on these conditional values.
Only after this division, are slaking characteristics used to determine if any of the soil like
materials are clay shales. According to this classification, a shale that could be classified
as rock-like according to its initial strength characteristics, could also be classified as
soil- like based on its response to softening. According to this scheme, Italian clay shale,
although rock-like in initial strength, slakes completely to a soft mud with only one cycle
of the slake durability test (Belviso et al, 1977). Other engineering materials are classified
according to their engineering properties that they presently exhibit. Yet, a “clay shale” is
unique not in its present properties, but rather in its potential for significant deterioration
Chapter 2 – Previous Study on Shale Rocks
25
of these properties as a result of interactions with water. None of the classification
schemes to date have succeeded in recognising that. For instance, stiff clay, such as the
Figure 2.5 Two part classification scheme based on minimum 50%
clay sized particles (after Morgenstern and Eigenbrod. 1974).
London clay; a clayey shale, such as the Pierre shale; or a well bonded shale such as
Ashfield shale, are terms that define these materials according to their present
engineering properties such as plasticity, slaking, and softening. However, based on the
method of Morgenstern and Eigenbrod all of them regardless of the rate of deterioration
can be further classified as “Clay shale”.
Chapter 2 – Previous Study on Shale Rocks
26
§2.4 GENERAL CHARACTERISTICS OF CLAY SHALE
§2.4.1 Index properties
Index properties such as water content, density, and porosity (void ratio), and specific
gravity provide information that help our understanding of the behaviour of a material.
These properties when applied to shale are influenced by factors such as degree of
weathering, mineral components, texture and structure, and type of cementation if any.
§2.4.1.1 Density and porosity
Density of shale is affected by the depth of burial and any defects and / or infillings
involved. Density or unit weight of a rock is defined as its weight per volume. It may
increase for the same rock type as the depth to the rock from the ground level increases.
This is expected because of the increasing overburden. The density is also influenced by
the mineral composition, porosity, joints and other open spaces present, even for the same
rock type. In addition, an increase in density could be due to a decrease in open joints or
cracks as a result of the high pressure caused by the overlying rocks. Organic content
may also affect the density of shale if it involves part of its cementing agent. Tests on
different shales have revealed that the bulk density of shales fall within the range 2.0 to
2.73 t/m3 (Deen, 1981).
Knowledge about porosity is essential in the fields of geomechanics, geophysics, and
petroleum engineering. Porosity is a rock property that affects the density, strength, and
elasticity and it varies during the geological history of shale. Quantitative determination
of this parameter is necessary to characterise models for compaction and deformation of
shale (Olgaard et al., 1997).
Chapter 2 – Previous Study on Shale Rocks
27
The porosity-depth relationship is an important factor in studying compaction and burial
depth. A porosity of 9 to 10% for shale under an overburden of 1800 m was reported by
Hedberg (1935). These values were compared to the average porosity of the near surface
silt and clay that ranged between 30 to 80%. This significant reduction in porosity was a
result of the substantial compaction and burial depth. A similar study was undertaken on
Candian shale by Katsube and Williamson (1994b) who reported a reduction in the
porosity of the shale from 30% at a depth of 1000m to 5% as the depth of burial increased
to 2500m. Other factors such as erosion, stress, weathering, and lithification can play an
important role in changing porosity.
Many researchers have reported the effect of porosity on the mechanical properties of
rocks, but few have investigated the effect of stress on porosity. Prasad (2003) studied the
behaviour of clay rich sediments from deposition to burial and lithification. She
suggested that the time at which cementation occurs could significantly influence
porosity. With early cementation, inter-particle voids are locked and further porosity
decreases is retarded. Conversely, high stresses or compaction result in low porosity and
hence no cement or late infilling.
Porosity and permeability of clay shale is very much influenced by lithification which is a
result of reduction of voids, reorientation of particles and cementation. Reduction of
permeability in a ductile shale was also investigated by Evans et al., (1990) who
considered the decrease in permeability as a result of compactive deformation. Shea and
Kronenberg (1993) reported the influence of compaction of clay shale in weakening the
basal planes of the phyllosilicates. This influence may cause preferred orientations of the
phyllosilcates and eventually to the creation of micro-defects that may contribute to an
increase in the porosity of the material. These defects were investigated by Olgaard
(1997) who described them as micro-cracks that have been formed as a result of bending
the weakened phyllosilicates around detrital grains. This structural change is primarily
due to the stress acting on the clay shale.
Chapter 2 – Previous Study on Shale Rocks
28
§2.4.1.2 Water content
It has been well established that the moisture content of a shale can have significant
effects on its physical and mechanical properties. Water contents of shale have been
reported which vary from less than 5% to as high as 35% (Banks, 1971). This variation in
water content has a marked influence on the mechanical behaviour, affecting both
strength and deformation properties (Lashkaripour, 1999). This concept was investigated
by Van Eeckhout (1976) who also studied the effect of water content on the strength of
argillaceous rocks with different degrees of saturation. A significant reduction in the
strength of clay shale due to an increase in water content from dry condition to saturated
condition was found. Van Eeckhout’s findings were further investigated by Hsu and
Nelson (1993) who reported a strong correlation between compressive strength and water
content for clay shales of North America. Based on their analyses of considerable data for
various clay shales, a correlation between the unconfined compressive strength and
moisture content was demonstrated. They also reported a natural water content of 20% as
a critical value above which the influence of moisture content becomes less significant.
The influence of the water content on the strength of shale was studied earlier by
Salustowicz (1965) who found that the presence of moisture may decrease the strength by
as much as 60%. Colback and Wiid (1965) attributed the reduction of strength to the
degree of saturation of the shale. This was observed when they carried out uniaxial
compression tests on shale specimens under various relative humidities and observed a
decrease in compressive strength with an increase in the moisture content. Collback and
Wiid found that the compressive strength of the shale under saturated conditions was
about 50% of that under dry conditions (Figure 2.6). The figure shows a small change in
water content of about 1% from saturated to dry condition. Studies carried out by A.G.I.
(1971) on an Italian clay shale and on clay shale from Iran (Lashkaripour & Ajalloeian,
2000) showed that a reduction of about 90% in the unconfined compressive strength can
result from an increase in the natural moisture content from 0.05% to 4%. However,
smaller values of reduction in strength due to increase in moisture content were reported
by other researchers (Steiger & Leung, 1990; Ghafoori, 1995).
Chapter 2 – Previous Study on Shale Rocks
29
Figure 2.6 Influence of moisture content on the UCS
of shale (after Colback and Wiid, 1965)
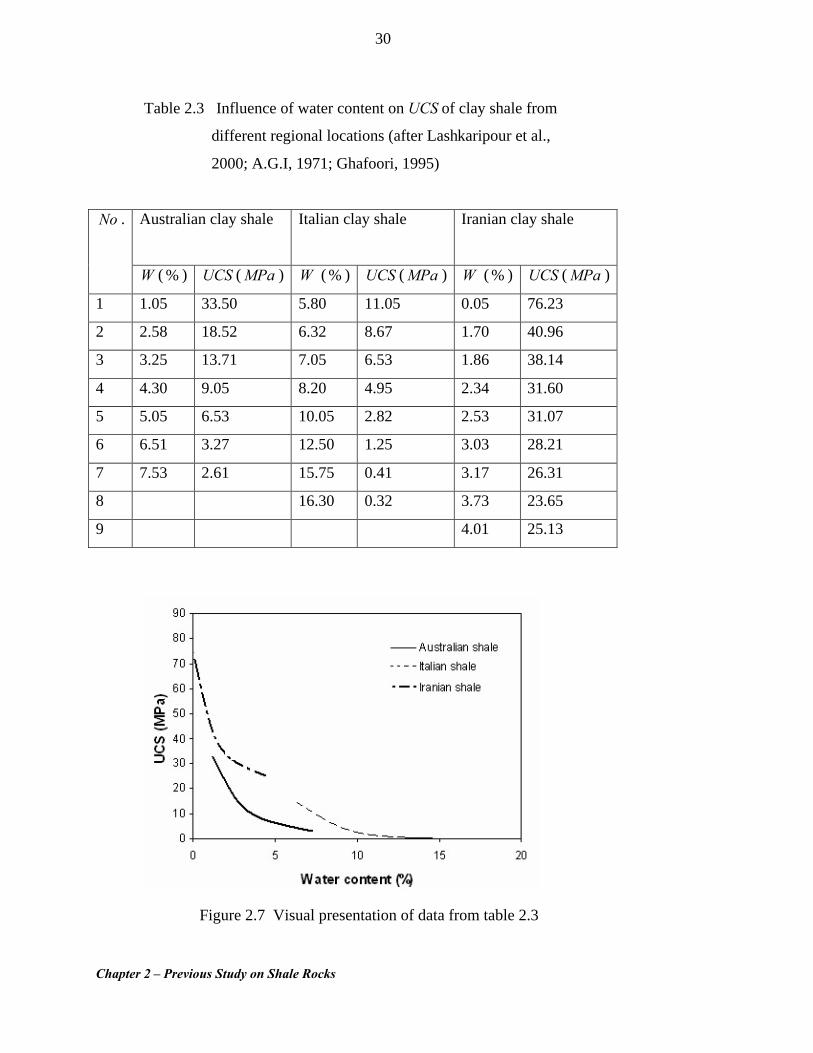
In order to show the influence of moisture content on strength, data from different clay
shales were compiled (Table 2.3) and are shown in Figure 2.7. A correlation between
natural water content and the strength of the shale was investigated further by Ghafoori
(1995) who carried out a series of tests on fully saturated samples of Ashfield shale with
geological descriptions ranging from intact to highly weathered. For these samples the
moisture contents were in the range from 1.12% to 8.7% with a mean value of 3.85 and a
standard deviation of 1.8%. The data indicates an inverse relationship between the UCS
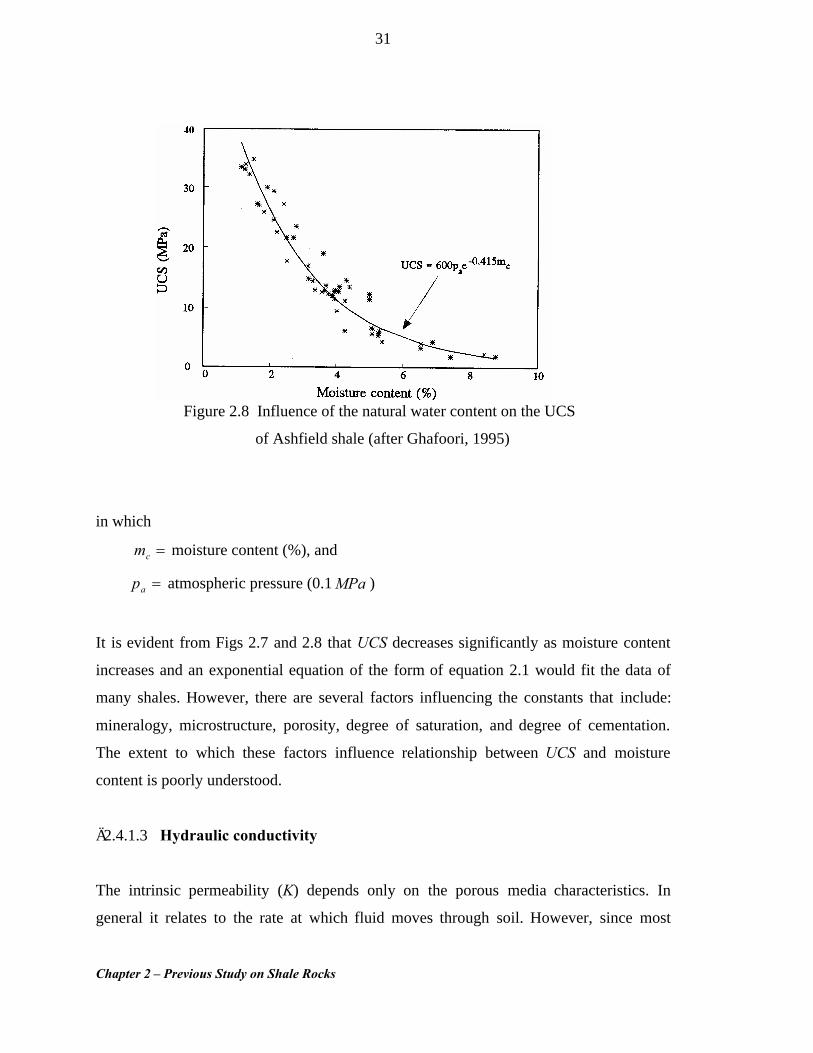
and the moisture content (Fig.2.8). This relationship is best described by the following
equation:
cmapUCS 415.0exp600 -= (2.1)
Chapter 2 – Previous Study on Shale Rocks
30
Table 2.3 Influence of water content on UCS of clay shale from
different regional locations (after Lashkaripour et al.,
2000; A.G.I, 1971; Ghafoori, 1995)
Australian clay shale Italian clay shale Iranian clay shale
No .
W ( % ) UCS ( MPa ) W (% ) UCS ( MPa ) W (% ) UCS ( MPa )
1 1.05 33.50 5.80 11.05 0.05 76.23
2 2.58 18.52 6.32 8.67 1.70 40.96
3 3.25 13.71 7.05 6.53 1.86 38.14
4 4.30 9.05 8.20 4.95 2.34 31.60
5 5.05 6.53 10.05 2.82 2.53 31.07
6 6.51 3.27 12.50 1.25 3.03 28.21
7 7.53 2.61 15.75 0.41 3.17 26.31
8 16.30 0.32 3.73 23.65
9 4.01 25.13
Figure 2.7 Visual presentation of data from table 2.3
Chapter 2 – Previous Study on Shale Rocks
31
Figure 2.8 Influence of the natural water content on the UCS
of Ashfield shale (after Ghafoori, 1995)
in which
=cm moisture content (%), and
=ap atmospheric pressure (0.1 MPa )
It is evident from Figs 2.7 and 2.8 that UCS decreases significantly as moisture content
increases and an exponential equation of the form of equation 2.1 would fit the data of
many shales. However, there are several factors influencing the constants that include:
mineralogy, microstructure, porosity, degree of saturation, and degree of cementation.
The extent to which these factors influence relationship between UCS and moisture
content is poorly understood.
§2.4.1.3 Hydraulic conductivity
The intrinsic permeability (K) depends only on the porous media characteristics. In
general it relates to the rate at which fluid moves through soil. However, since most
Chapter 2 – Previous Study on Shale Rocks
32
theories developed for water seepage through porous media are based on Darcy’s law, it
is more common to use hydraulic conductivity ( k) as the parameter describing the ra te of
water movement. Hydraulic conductivity depends on the properties of the fluid, degree of
saturation, and the porous medium. Knowledge of this property is important in providing
useful solutions to a large number of engineering problems in soils and rocks (Suzuki,
1982). For soils, it depends on soil texture, soil structure, the presence of compacted or
dense soil horizons, and also to the size and distribution of voids in the soil (Charman and
Murphy, 2000).
For rocks, it may also vary over several orders of magnitude based on mineral
composition, grain size distribution, and the pore space distribution (Russel et al., 1996)
For clay shale, various authors have investigated the relations between permeability, void
ratio, effective stress, and the extent and frequency of any laminations. Since shale is
anisotropic, it is not unreasonable to expect the permeability to be anisotropic, with a
larger value parallel to the laminations Katsube et al. (1991) reported that shale seems to
approach a maximum state of compaction at a depth ranging from 2.4 to 3.2 km from the
ground surface and that this is known as a critical depth of burial (CDB). In their report,
they claimed that the CDB is a transitional zone dividing the burial process into
mechanical (above) and diagenesis (below). Katsube and Williamson (1994b) carried out
tests on unconsolidated shale to investigate the influence of stress on permeability. Their
test results revealed that the rate of hydraulic conductivity (k) decreases with depth and
approaches a minimum value of 10 –20 m/s at an effective stress of about 50 MPa, which
is equivalent to an overburden stress of about 3 km.
The low conductivity of shale has been used to explain the time delay before failure that
often is experienced during the drilling of shale (Horsrud et al., 1998). Based on the
initial state as well as the stress path of shale, drilling in low permeability shale may
result in an immediate drop in pore pressure, it may take from hours to weeks before the
pore pressure again reaches its initial value. The drop in pore pressure causes an increase
in the effective stress and hence makes the formation more stable. Over time, the gradual
Chapter 2 – Previous Study on Shale Rocks
33
increase in pore pressure to reach equilibrium may result in reduction in the effective
strength and eventually cause failure of the shale.
Shale conductivity values decrease, as is the case for most argillaceous materials, with
applied pressure in the laboratory. Best (1995) reported that this variation is enhanced by
the opening of microcracks, developed as a result of stress-release during sample
removal, and their closure due to the confining stresses developed from compaction and
depth of burial. In general, there is no agreement on whether the permeability-pressure
relationship can be presented by a single mathematical expression. However, it is
believed that it can be represented approximately by an exponential curve taking the form
of:
)exp(0 ePKk a-= ( 2.2)
where
0K is the permeability at atmospheric pressure,
eP is the effective pressure, and
a is a constant.
The above equation was tested by Kwon et al. (2001a) who investigated the permeability
of illite-rich shale from the Wilcox formation under different stresses. Their test results
have shown that the equation would reasonably fit the data within a range of effective
stresses from 3 MPa to 12 MPa.
In their studies on Wilcox shale, Kwon et.al. (2001a) reported anisotropy in the
conductivity at low effective stress, with values measured parallel to bedding 102 times
greater than those measured normal to bedding. Chesnut (1983) suggested that
permeability of intact shale in the Sydney Basin is very low, and that significant water
flow is most likely only in the plane of laminations. Few laboratory data are available for
Sydney basin shales, however Golder Associates (1979) measured k values of the
Bringelly shale in the field. Following 48 hours for bore saturation, the measured values
Chapter 2 – Previous Study on Shale Rocks
34
ranged from 7101 -¥ to 7106 -¥ m/s. The relatively high conductivity was attributed to the
presence of more permeable rock units within Bringelly shale and / or to the structural
disintegration due to post-saturation swelling. Itakura (1999) managed to reduce the rate
of the structural disintegration during saturation of Bringelly shale. He performed tests on
three types of specimens during his studies on the advective transport of contaminants at
the Castlereagh site in NSW. Itakura has reported a decreased conductivity of Bringelly
shale to be of the order of sm /10 11- to 1210- . His tests for conductivity also included
clay specimens from the same site. Itakura used abbreviations to characterize different
specimen types. His test results on clayey shale specimens (CBS) have shown that a rapid
drop in the conductivity from 7101.4 -¥ to 10105.8 -¥ m/s and was also associated with a
decrease in the void ratio from 0.16 to 0.11 respectively.
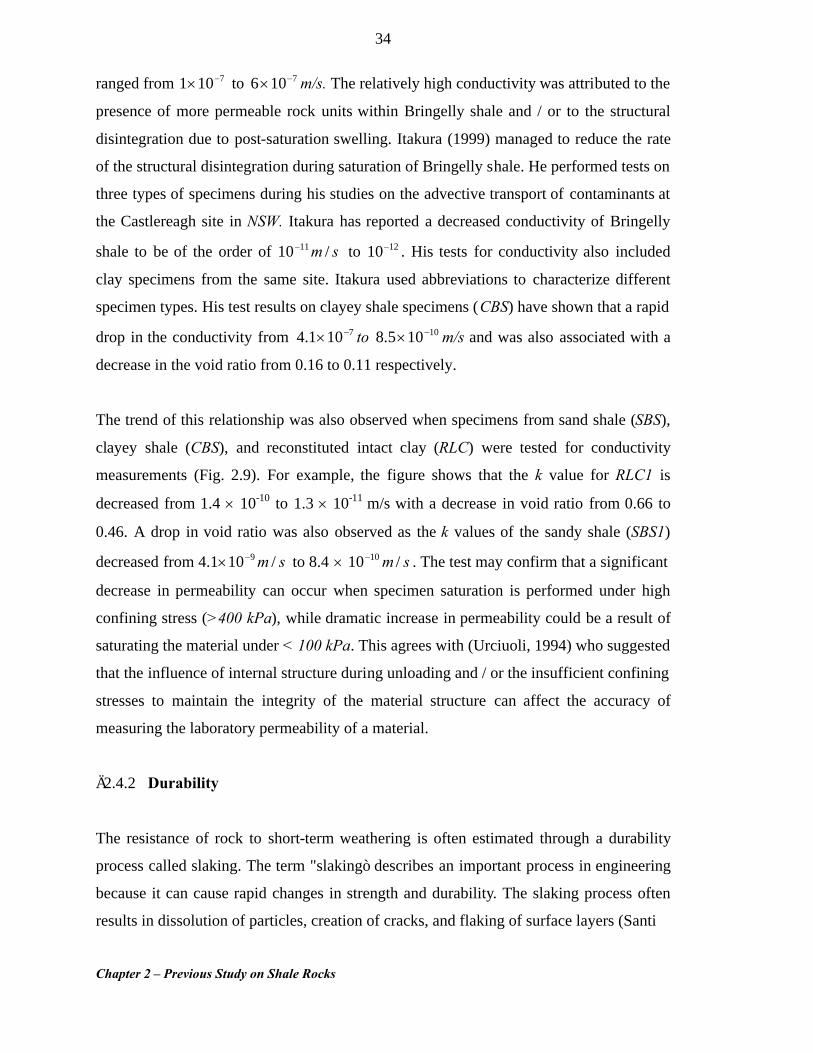
The trend of this relationship was also observed when specimens from sand shale (SBS),
clayey shale (CBS), and reconstituted intact clay (RLC) were tested for conductivity
measurements (Fig. 2.9). For example, the figure shows that the k value for RLC1 is
decreased from 1.4 ¥ 10-10 to 1.3 ¥ 10-11 m/s with a decrease in void ratio from 0.66 to
0.46. A drop in void ratio was also observed as the k values of the sandy shale (SBS1)
decreased from 4.1¥ sm /10 9- to 8.4 ¥ sm /10 10- . The test may confirm that a significant
decrease in permeability can occur when specimen saturation is performed under high
confining stress (>400 kPa), while dramatic increase in permeability could be a result of
saturating the material under < 100 kPa. This agrees with (Urciuoli, 1994) who suggested
that the influence of internal structure during unloading and / or the insufficient confining
stresses to maintain the integrity of the material structure can affect the accuracy of
measuring the laboratory permeability of a material.
§2.4.2 Durability
The resistance of rock to short-term weathering is often estimated through a durability
process called slaking. The term "slaking” describes an important process in engineering
because it can cause rapid changes in strength and durability. The slaking process often
results in dissolution of particles, creation of cracks, and flaking of surface layers (Santi
Chapter 2 – Previous Study on Shale Rocks
35
Figure 2.9 Relation between void ratio and hydraulic conductivity
for the shale samples (after Itakura, 1999)
and Koncagul, 1996). Because of the physical interdependence between durability and
slaking, durability of shale is often measured with slaking tests.
§2.4.2.1 Assessment of durability
For shale, durability is considered as an index of its deterioration over time, particularly if
used in an embankment or as fill (Okland and Lovell, 1982). Shale can also degrade to a
certain extent with time. Problems in using shale as a construction material have occurred
in numerous applications, including slopes, spillways, and unstable subgrades. In order to
assess the durability of shales, Gamble (1971) used the slake durability index to establish
an engineering geological classification scheme. This step was followed by Deo (1973)
who also used slake durability test results in conjunction with other index test results to
identify shale that was suitable for use in embankments. Moriwaki (1974) noted four
modes of slaking:
0.1 0.2 0.3 0.4 0.5 0.6 0.7Void Ratio
10
10
10
10
10
10
10
Hy
dr
au
li
c
Co
nd
uc
ti
vi
ty
(
m/
s)
-12
-11
-10
-9
-8
-7
-6
RLC1SBS1SBS2CBS1CBS2
Chapter 2 – Previous Study on Shale Rocks
36
(a) swelling, described as an increase in bulk volume without visible cracking or
significant loss of material,
(b) body slaking, which appears to originate from internal processes and which rapidly
traverses large portions of mass with no apparent deterioration between cracks,
(c) surface slaking, characterized by loss of mass due to "sloughing" of tiny flakes of
grains from the entire surface with no apparent cracks in the underlying material, and
(d) dispersion, characterized by loss of mass resulting from the separation of clay-sized
grains which go into suspension, rather than settling.
Clay shales are characteristically highly susceptible to slaking. It is possible that the
process of slaking is closely related to swelling and softening of clay shale. However, the
degree of softening and swelling is very much influenced by not only the clay contents,
but more importantly by the type of clay species and their reactivity. In the absence of
mineralogical changes, water content can be increased by (a) dilation during shear, (b)
simple swelling related to elastic rebound following unloading, and (c) swelling and
slaking related to the breaking of inter-particle bonds in response to wetting, or wetting
and drying cycles in the absence of external load changes.
Shale can also degrade to a certain extent with time when it is removed or drying from its
natural condition, this degradation results from water absorption upon unloading. This
type of softening may lead to deterioration of the shale rock (Terzaghi, 1963). Depending
on its physical and mineralogical properties, shale can be reduced from a rock like state
to a soil-like material. Slaking and / or softening, are interrelated and believed to be
important processes in the field of civil engineering due to their influence in causing
rapid changes in strength and durability. These changes can lead to problems with
erosion, slope stability, settlement, bearing capacity and drainage.
Chapter 2 – Previous Study on Shale Rocks
37
However, in order to account for such changes and variations in the engineering behavior
of clay shale, it is important to understand the mechanisms by which the material
properties of clay shale are altered. While many researchers have speculated on the
causes of softening in clay shale, few have carried out extensive investigations on the
fundamental mechanism of slaking.
Many studies have presented evidence (Nakano, 1970) that supports the hypothesis that
some materials will not slake as long as the water content remains above a certain
threshold, but if the water content is lowered below this threshold, slaking will occur
during either drying or rewetting. Moriwaki (1974) disagreed with this hypothesis and
concluded from his investigations on reconstituted shale that the dominant slaking
mechanism is controlled by the clay mineralogy. Moriwaki further concluded that the
susceptibility of any material to slaking would depend not only on the mineralogy, but
also on the "physico -chemical characteristics", such as bonding, and the chemistry of the
slaking fluid. However, it is worth mentioning that properties such as permeability and
the presence of microcracks play an important role in determining the durability of shale.
Harper et al. (1979) and Richardson (1984) have supported Moriwaki’s approach and
performed further tests to evaluate the rate of slaking in shale rocks. Test results showed
that based on mineralogy, structure, water content, and porosity, durability could vary
from very low to extremely high. Variations in durability could also be experienced as a
result of temperature changes, and changes in humidity environment and degree of
saturation (Grice 1968). However, Venter (1980) has claimed that the slake durability
index of non-expandable shale is not effected by differences in temperature.
Some of these observations were further investigated for Wianamatta Group shales by
Ghafoori (1995) who demonstrated the influence of durability on strength and natural
moisture content of Ashfield shale. The test results revealed an inverse relationship
between the durability of the rock and its natural water content, with durability and
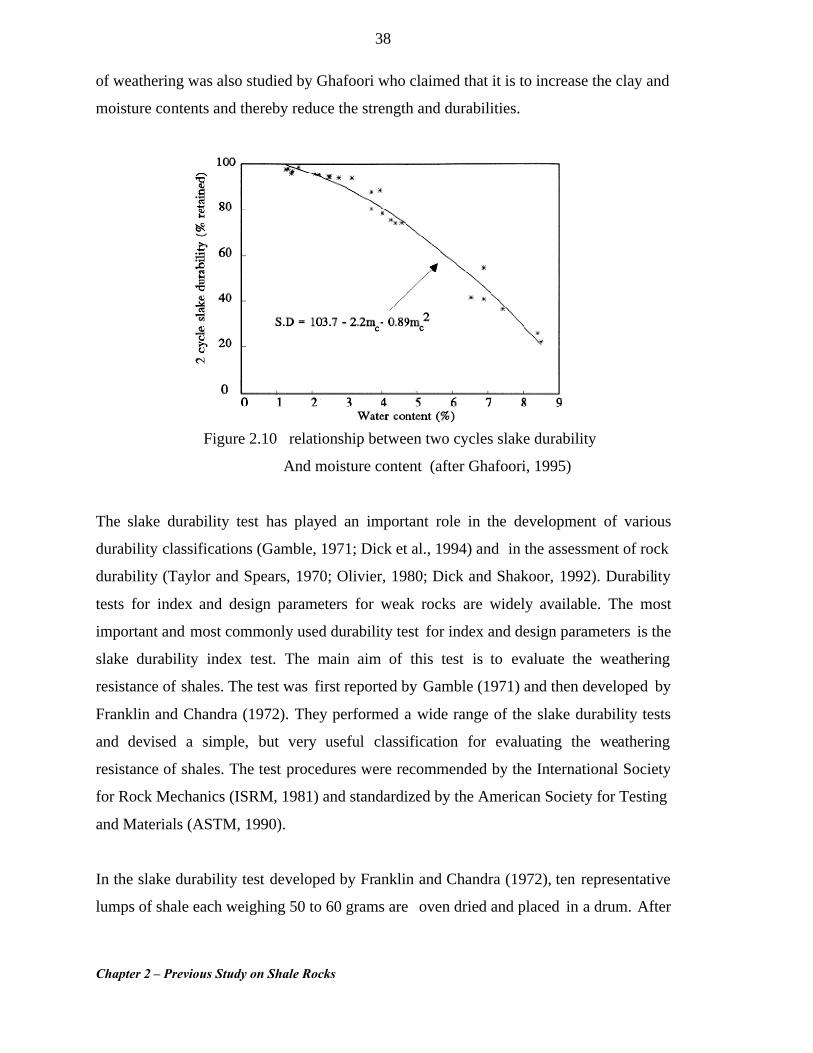
strength increasing with decreasing moisture content (Fig 2.10) and concluded that the
natural moisture content was a good predictor of the durability of Ashfield shale. Effect
Chapter 2 – Previous Study on Shale Rocks
38
of weathering was also studied by Ghafoori who claimed that it is to increase the clay and
moisture contents and thereby reduce the strength and durabilities.
Figure 2.10 relationship between two cycles slake durability
And moisture content (after Ghafoori, 1995)
The slake durability test has played an important role in the development of various
durability classifications (Gamble, 1971; Dick et al., 1994) and in the assessment of rock
durability (Taylor and Spears, 1970; Olivier, 1980; Dick and Shakoor, 1992). Durability
tests for index and design parameters for weak rocks are widely available. The most
important and most commonly used durability test for index and design parameters is the
slake durability index test. The main aim of this test is to evaluate the weathering
resistance of shales. The test was first reported by Gamble (1971) and then developed by
Franklin and Chandra (1972). They performed a wide range of the slake durability tests
and devised a simple, but very useful classification for evaluating the weathering
resistance of shales. The test procedures were recommended by the International Society
for Rock Mechanics (ISRM, 1981) and standardized by the American Society for Testing
and Materials (ASTM, 1990).
In the slake durability test developed by Franklin and Chandra (1972), ten representative
lumps of shale each weighing 50 to 60 grams are oven dried and placed in a drum. After
Chapter 2 – Previous Study on Shale Rocks
39
10 minutes rotating in a partly immersed drum constructed of 2 mm mesh, the retained
material in the drum is oven dried at 105oC for at least 6 hours and weighed. The cycle is
repeated and the slake durability index is the dry weight percentage of material retained
after the second cycle. Taylor (1988) performed slake durability tests on a wide range of
clay–bearing rocks. He suggested that the two-cycle slake durability testing does not
offer an acceptable indication of the durability of these rocks. Several studies have looked
at increasing the number of slaking cycles (e.g. Moon and Beattie, 1995; Gokceoglu,
2000; Dhakal, 2002). Gokceoglu (2000) reported a significant increase in the amount of
clay minerals passing from the drum after the third cycle, noting that repeated wetting
and drying contributed to an increase in the amount of disaggregated clay minerals from
the original shale sample. This was confirmed by Dhakal (2002) who performed a slaking
test on Akita mudstone that was run for six cycles to ensure the passage of clay minerals
from the drum. The slaking factor of Morgenstern and Eigenbrod (1974) is unique in that
it is based on the one-dimensional free swell of a laterally-confined sample. In these tests,
the change of height, and therefore the change of water content were measured as a
function of wetting and drying cycles. Increased swelling is assumed to indicate
progressive slaking within the specimen.
The slaking and compression softening tests were used by Morgenstern and Eigenbrod
(1974) for identifying shale types. They performed the slaking tests on various clay shale
specimens and other stiff clays. They also found a linear relationship between the
maximum water content, obtained during the slaking test, and the liquid limit of the
natural shale.
There is a lack of consistency among researchers on acceptable test procedures, and
attempts to improve the slake test. Thus, although the slake durability test gives an
indication of the susceptibility of a clay shale to slake and disintegrate, it does not
provide a reliable quantitative measure.
Chapter 2 – Previous Study on Shale Rocks
40
§2.4.2.2 A possible mechanism of slaking
Gokceoglu et al. (2000) suggested that hydration and chemical alteration of clay shale are
closely related processes. He also claimed that responses to rock-slaking in shale with
swelling clay minerals will vary based on the amount type of the constituent clay
minerals. Increase of hydration and double layer repulsion force and negative pore
pressure are the main slaking mechanisms in shale with significant amount of smectite.
Internal microcracks in shale allow the entry of water carrying dissolved ions and lead
into great expansion and destruction of the crystal lattice (Botts, 1998). Bjerrum (1967)
suggested that the mechanism of slaking is a result of disruption of diagenetic bonds and
the release of stored strain energy. This was further interpreted by Terzaghi and Peck
(1967) who stated that the slaking mechanism could result from the compression of
trapped air within the clay or shale mass, particularly in soils containing highly expansive
clay minerals.
The degree of deterioration is believed to be based on the amount of clay minerals and
their subsequent swelling effects, it can also vary according to the rock type (Varley,
1990). Considering the significant influence of durability on the unconfined compressive
strength, there are very few publications that relate UCS to durability (e.g. Koncagul and
Santi, 1999; Eigenbrod, 1972; Augenbaugh and Bruzewski, 1976). Huppert, (1988)
reported that microstructure controls both strength and durability of shale and that high
strength and durability are indicative of low porosity and a high degree of particle
interlocking.
The influence of strength, weathering, clay content, and natural moisture content on
durability of the Ashfield shale was examined by Ghafoori (1995) who demonstrated the
effects of the moisture content on the durability and strength of the shale. It was evident
from these examinations that increasing moisture content can reduce the strength and
durability of the rock.
Chapter 2 – Previous Study on Shale Rocks
41
The methods that are commonly employed for investigating the process of slaking do not
provide adequate information regarding the effects of slaking on the strength and stress-
strain behaviour of clay shales in the field. Furthermore, it seems that the slake durabilit y
test does not necessarily measure the relative reduction of strength due to degradation of
the material.
§2.4.3 Strength
Determining the strength of soils for engineering applications is a highly complex issue.
Different measures of soil strength are usually applicable in different applications.
Knowledge of the strength is essential in the design and prediction of performance of a
structure on or in the material encountered. The strength of clay shale can be influenced
by density and bonding. However, determining the effects of these parameters on the
strength of shale rocks appears to be difficult (e.g. Huang, 1994). For clay shale, because
of the difficulty in sampling, storing, and their inherent anisotropy, e.g. laminations or
micro and / or macro-cracks, strength tests are more complicated than for other common
rocks. However, knowledge of the strength is essential for classification purposes and to
assist with judgment about the suitability of these rocks for various construction
purposes.
The aim of this section is to identify index tests that are useful for defining engineering
properties, strength classification, and also for determining a suitable strength index for
clay shale. The point load index test and unconfined compressive strength tests both
provide procedures suitable for routine field use. The tests can be conducted quite rapidly
and inexpensively on-site and / or in the laboratory and thus allow for quick on site
monitoring of material strength.
§2.4.3.1 The point load strength
The point load strength test provides a rapid and accurate strength index value that is
useful for strength classification of shale rock. The test was first defined by Reichmuth
Chapter 2 – Previous Study on Shale Rocks
42
(1968) and a formula for the point load strength index was proposed by Broch and
Franklin (1972). The test was then normalized by ISRM (1985), and later was updated by
Brook (1993). The point load test is performed by loading a sample between two conical
points having 60-degree conical points with a 5 -mm point radius. Thus, a sufficient point
load can be provided to fail hard rock samples using portable test apparatus. Results of
point load tests are usually expressed in terms of the point load strength index Is given by
the equation:
2DPI s = (2.3)
where
Is = the point load strength index
P = the applied load
D = the distance between the loading points
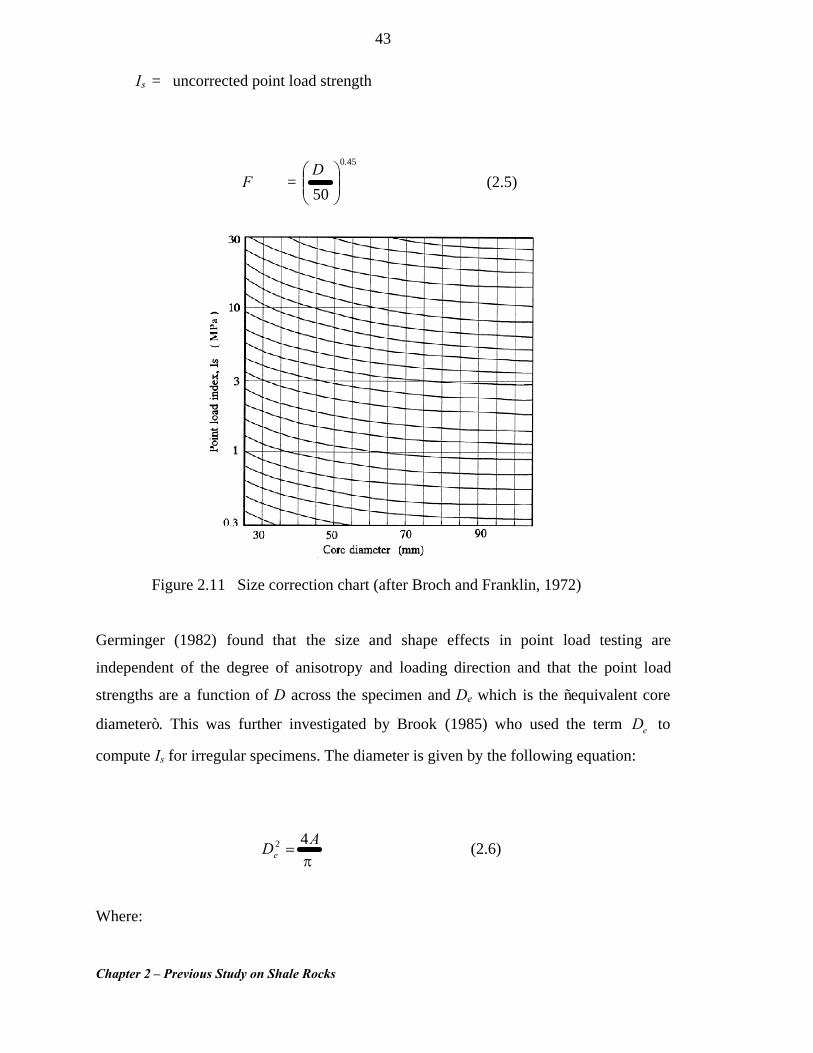
The point load strength test when first introduced, was mainly used to predict UCS
(Broch and Franklin, 1972). Because Is is size dependent (Bieniawski, 1975), it should be
correlated to a standard size i.e. 50-mm diameter core. Broch and Franklin (1972)
introduced a size correction factor, F as a function of core diameter for all rocks. From
the experimental data, they proposed a size correction chart that can be used as a standard
reference. This chart is reproduced in Figure 2.11 and can be used to determine Is50 in
diametral point load index tests using the following expression:
Is50 = F¥ Is (2.4)
Where:
F = a size correction factor
Chapter 2 – Previous Study on Shale Rocks
43
Is = uncorrected point load strength
F = 45.0
50 ˜̃¯
ˆÁÁË
Ê D (2.5)
Figure 2.11 Size correction chart (after Broch and Franklin, 1972)
Germinger (1982) found that the size and shape effects in point load testing are
independent of the degree of anisotropy and loading direction and that the point load
strengths are a function of D across the specimen and De which is the “equivalent core
diameter”. This was further investigated by Brook (1985) who used the term eD to
compute Is for irregular specimens. The diameter is given by the following equation:
pADe
42 = (2.6)
Where:
Chapter 2 – Previous Study on Shale Rocks
44
A= minimum cross-sectional area
He suggested that eD should be as close as possible to the site-size core diameter,
especially where diametrical point load tests are also conducted. He also recommended
that the test should be performed using a width-to-length ratio between 0.3 and 1.0 and
that a minimum of ten specimens should be tested.
Point load tests may be performed on specimens with different sample geometries. Tests
on core may be performed across the diameter of core samples (Bieniawski, 1975), or the
core may be loaded axially. Alternatively tests may be performed on irregular lumps
where no core is available. Smith (1997) has modified the test for rock that is
nonuniform, has inclusions of weaker material, or is excessively brittle. In such cases,
local crushing failure can occur without failing the entire sample. In order to ensure more
reasonable results, Smith replaced the point loads by flat platens configured to pivot on
the point load platens.
On average, unconfined compressive strength (UCS) is 20 to 25 times the point load
strength ( )50(sI ). However, it can vary over a much wider range (ISRM, 1985). Many
correlations have been published in the literature from which strength parameters such as
UCS can be predicted. Published information on the point load test mainly relates to hard
rock (Franklin, 1981; Richardson, 1985; Wiesner & Gillate, 1997), although some
researchers have used the point load test on dredge material. Correlations with UCS for
weaker, saturated shales are not available (Smith, 1990).
Most rocks are to some extent anisotropic in their mechanical properties, even if they
appear to contain no visible planes of weakness. Based on the direction of loading
relative to that of weakness planes, strength of intact rock specimens can vary by a factor
of ten or more (Broch and Franklin, 1972). The point load strength test was found to be a
practical technique that is capable of measuring a strength anisotropy index, which is the
point load strength ratio in two different directions. These directions are normally taken
parallel and normal to any laminations.
Chapter 2 – Previous Study on Shale Rocks
45
Pells (1975) suggested that for certain rock materials the UCS value that is predicted
using diametral point load test and a conversion factors suggested by Broch and Franklin
and / or Bieniawski is accurate enough for many engineering design purposes,
particularly classification. However, Pells recommended that whenever point load test
results are used to predict materiall strength under uniaxial or triaxial stress, at least some
conventional uniaxial compression tests should be performed. Tsidzi (1991) stressed on
the importance of the visual identification of the rock materials prior to the use of the
conversion factor. He believed that the error associated with the prediction of the UCS
from the point load test can be reduced by more than 20%.
DGGT (1979) and Hassani et.al. (1980) affirmed Pell’s approach and suggested that in
practice, the use of an average conversion factor can be sufficient for determining UCS
values from the point load test results with no differentiation of rock type. However, this
approach failed to adopt a common factor for determining the strength value, for
example, DGGT used a conversion factor of 24 while Hassani used a factor of 29
between uniaxial compressive strength and diametral point load index. Based on limited
point load test data gathered from Wianamatta shale and reported by Hadfield (1981),
Won (1985) suggested correlation factors of 14 to 35 between UCS and the axial point
load strength and 22 to 35 between UCS and the diametral point load strength. These
correlations have been based on limited data and subject to the degree of substance
defects and orientation of lamination and / or bedding. More data would be required to
find reliable correlation factors between UCS and axial and diametral point load
strengths.
These are investigated in the present research. Ghafoori (1995) conducted an exclusive
study on Ashfield shale and gave correlation factors of 24.1 and 38.2 for axial and
diametral load strength respectively. The lower correlation values reported by Won may
reflect the inclusion of Bringelly data with its different mineralogy and engineering
properties within the undifferentiated results for Wianamatta shale. For the upper units of
Bringelly shale, new data is required to find reliable correlation factors between UCS and

Chapter 2 – Previous Study on Shale Rocks
46
axial and diametral point load strength. The difference between these correlation factors
may reflect the different degree of anisotropy among clay shales and also reflects the
difficulty of performing UCS tests as there is a wide spread practice of relying on point
load index tests and relating these to UCS value on the basis of an empirical correlation.
In the present research program, the correlation factor will be investigated.
§2.4.3.2 Uniaxial strength
The standard uniaxial compressive strength sc is one of the most important and
commonly used properties of rocks. The uniaxial compressive strength has been widely
used as a basis for classifications of rock substances versus rock mass for engineering
purposes. For example, the primary intact rock property of interest for foundation design
is unconfined compressive strength. The main purposes of the tests are to estimate the
strength characteristics as well as determine the elastic parameters of rocks. Although it is
known that strength of jointed rocks is generally less than unfractured portions of the
rock mass, the unconfined compressive strength provides an upper limit of the rock mass
strength and an index value for rock classification.
In shale, inherent weaknesses in the rock structure make collection and preparation of
samples a difficult task. Among these weaknesses are bedding structures, microcracks,
and swelling clay minerals. As a result of these, uniaxial compressive strength values
determined from intact rock samples, which are usually the stronger and more easily
prepared ones, are unlikely to be representative of a large rock mass.
The uniaxial compressive test is used to determine the compressive strength as well as
deformation characteristics of a rock sample under a one dimensional stress state in the
laboratory. The compressive strength sc is the quotient of the uniaxial test failure load F
and the area of the sample A :
sc = AF (2.7)
Chapter 2 – Previous Study on Shale Rocks
47
Researchers in the field of rock mechanics have found that uniaxial compressive strength
decreases as length to diameter of a cylindrical specimen increases. The ISRM (1972)
recommended a length to diameter ratio of 2.5 to 3 as a standard for UCS laboratory
tests. However, a cylindrical specimen with a length to diameter of 2 to 2.5 is
recommended by ASTM D2938 (1971). These ratios are applicable to a core size of
NX (54 mm). To avoid end effects on the strength and deformation results, a cylindrical
shape was chosen for the experiments reported in the present study. Because of the coring
problems in Bringelly shale, an L/D ratio of 2 was used for uniaxial compression tests
performed in this study.
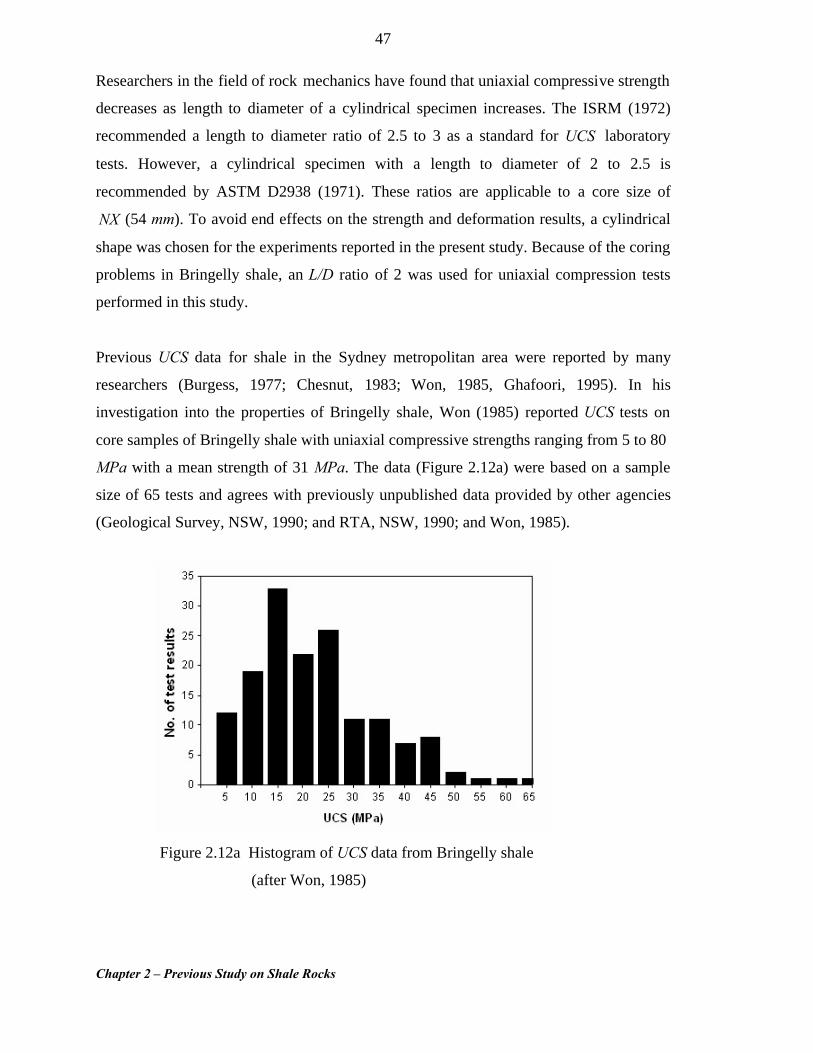
Previous UCS data for shale in the Sydney metropolitan area were reported by many
researchers (Burgess, 1977; Chesnut, 1983; Won, 1985, Ghafoori, 1995). In his
investigation into the properties of Bringelly shale, Won (1985) reported UCS tests on
core samples of Bringelly shale with uniaxial compressive strengths ranging from 5 to 80
MPa with a mean strength of 31 MPa. The data (Figure 2.12a) were based on a sample
size of 65 tests and agrees with previously unpublished data provided by other agencies
(Geological Survey, NSW, 1990; and RTA, NSW, 1990; and Won, 1985).
Figure 2.12a Histogram of UCS data from Bringelly shale
(after Won, 1985)
Chapter 2 – Previous Study on Shale Rocks
48
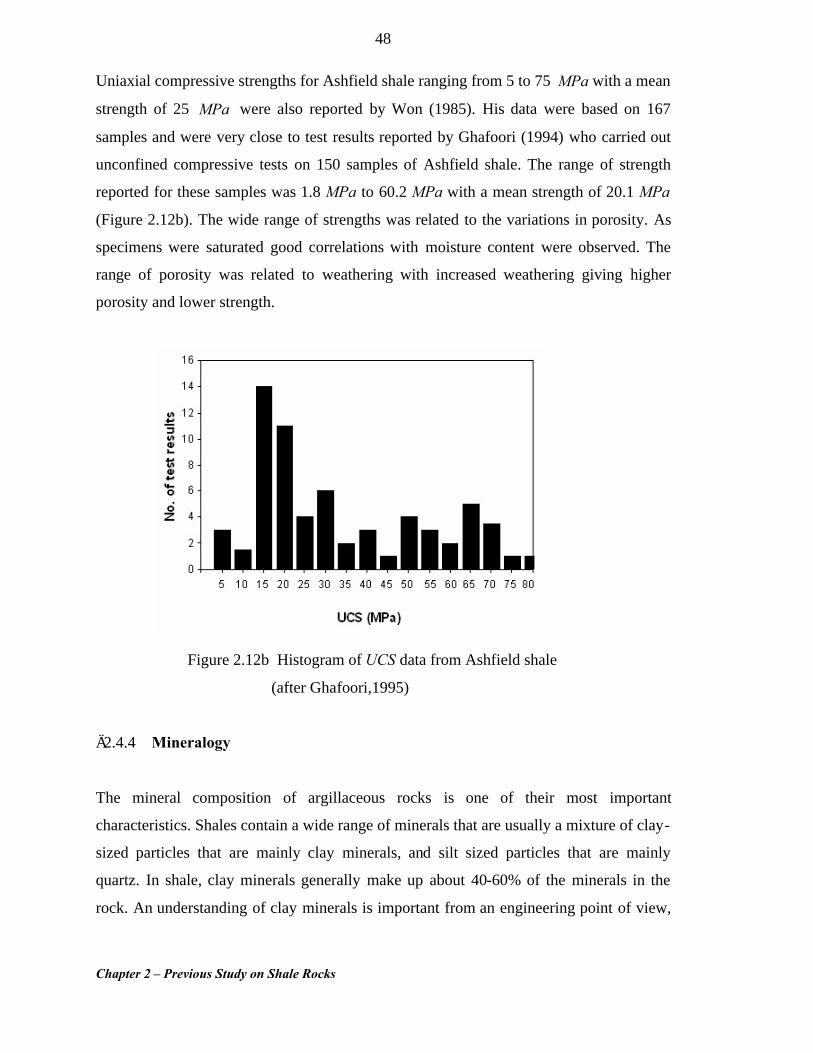
Uniaxial compressive strengths for Ashfield shale ranging from 5 to 75 MPa with a mean
strength of 25 MPa were also reported by Won (1985). His data were based on 167
samples and were very close to test results reported by Ghafoori (1994) who carried out
unconfined compressive tests on 150 samples of Ashfield shale. The range of strength
reported for these samples was 1.8 MPa to 60.2 MPa with a mean strength of 20.1 MPa
(Figure 2.12b). The wide range of strengths was related to the variations in porosity. As
specimens were saturated good correlations with moisture content were observed. The
range of porosity was related to weathering with increased weathering giving higher
porosity and lower strength.
Figure 2.12b Histogram of UCS data from Ashfield shale
(after Ghafoori,1995)
§2.4.4 Mineralogy
The mineral composition of argillaceous rocks is one of their most important
characteristics. Shales contain a wide range of minerals that are usually a mixture of clay-
sized particles that are mainly clay minerals, and silt sized particles that are mainly
quartz. In shale, clay minerals generally make up about 40-60% of the minerals in the
rock. An understanding of clay minerals is important from an engineering point of view,
Chapter 2 – Previous Study on Shale Rocks
49
as some minerals expand significantly when exposed to water and this can have a
significant influence on the mechanical behaviour of the material.
The type of clay mineral is a function of the source rocks, climate and diagenetic history.
The main clay minerals found in shales are illite, kaolinite, smectite, and chlorite.
Smectite and kaolinite for instance are more common in non-marine shales, while illite
and chlorite are more common in marine shales (Brown et al., 1977). Different clay
minerals have different effects on the engineering behaviour of soil and rocks. However,
shales containing the smectite minerals are commonly more troublesome than others.
The clay mineral particles usually are less than 2 microns in diameter. Shales having
higher clay mineral contents have smaller average grain sizes, while those with lower
clay mineral contents generally contain coarser grained, silty particles. Attwell and
Farmer (1976) reported that decreases in the ratio of clay mineral to quartz content result
in reduced liquid and plastic limits, and may also result in increasing uniaxial
compressive strength and uniaxial tensile strength of shale (Dusseault et al., 1986).
§2.4.5 Microstructure
The microstructure and fabric of a material can influence its engineering behaviour.
However, hence testing can quantify effects but can not be used to identify origin, it was
suggested to examine material fabric by microscopy. For clay shale, mechanisms of
deformation have generally been inferred from macroscopic and microscopic modes (e.g.
Jordan et al., 1989). The mineralogical composition and fabric are the basic factors
determining the properties of rock (Yumei et al., 1993). For instance, internal structural
features such as micro-cracks in conjunction with water within the inter-layers of clays
may control deformations and reduce the strength of shale.
The influence of micro-cracking was investigated by Ibanez et al. (1993) who performed
triaxial compression experiment on illite rich shale at varying confining pressures. They
reported that optical microscopy and transmission electron microscopy of deformed illite
Chapter 2 – Previous Study on Shale Rocks
50
rich shales showed that brittle micro-cracking and dilatant mechanisms were responsible
for deformation. The deformation was accompanied by the development of fine scale
bending in individual illite and chlorite platelets, and micro-crack bands were common
within the shear zones regardless of the degree of orientation relative to the laminations.
Previous studies of shale deformation by Bell et al. (1986); Christoffersen et al. (1990);
and Mares et al. (1990) have also documented dilatant mechanisms of micro-cracking
and fracture, while shear on clay platelets has been presumed to occur by frictional
sliding on hydrated clay surfaces.
The effect of these deformation mechanisms is to cause a significant departure from
strictly elastic behaviour. Yielding and an extended non-linear response can be observed
when shale is loaded to failure. Such inelastic effects are known to result either from
localised plastic yielding or from micro-cracking. The latter was examined by Vernik
(1994) who attributed the origin of such micro-cracks in shale to five factors: (1) a
differential elastic rebound of constituent minerals caused by overburden stress relief, (2)
cooling induced thermal cracking, (3) overburden relief induced microhydraulic
fracturing of overpressured fluid inclusion, (4) concentrated bottomhole stressing, and (5)
microcracks in-situ. Even though, the first four factors could result from drilling and core
recovery, Vernick suggested that all the factors could be present in situ. Furthermore, he
described the mechanism of their formation as due to the relative weakness of the rock
matrix. Rearrangement of clay platelets due to compaction (Fig. 2.13) may result in
internal structural deformation causing a development of micro-cracks.
When pore pressure exceeds the normal total stress acting on the rock, microcracks are
likely to develop. This was described by Meissner (1978) as a microhydraulic fracturing
process and was suggested to be common in shale. It is developed during erosion when
the formation pore pressure exceeds the total normal stress by a few megapascals.
These microcracks could determine the mode of failure in some shales. Yoshinaka et al.
(1997) performed a series of compression tests on Kobe shale and reported that the
increase of stress level can result in pore pressure build up due to the closure of pre-
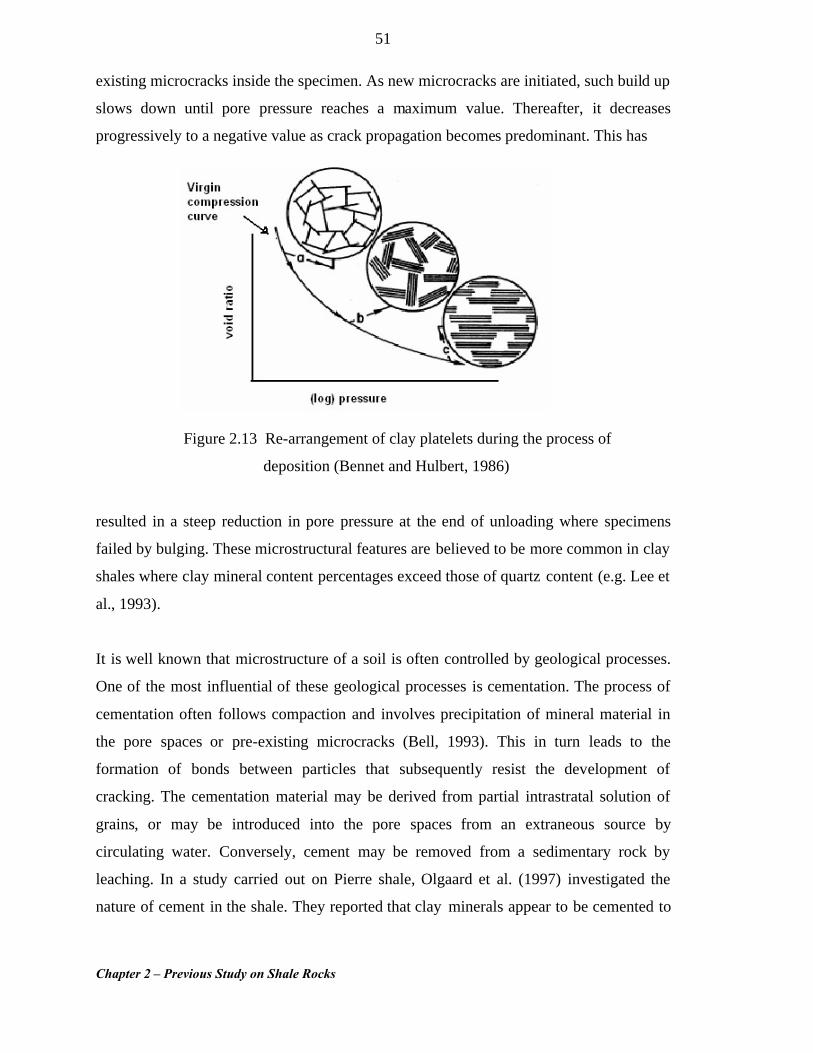
Chapter 2 – Previous Study on Shale Rocks
51
existing microcracks inside the specimen. As new microcracks are initiated, such build up
slows down until pore pressure reaches a maximum value. Thereafter, it decreases
progressively to a negative value as crack propagation becomes predominant. This has
Figure 2.13 Re-arrangement of clay platelets during the process of
deposition (Bennet and Hulbert, 1986)
resulted in a steep reduction in pore pressure at the end of unloading where specimens
failed by bulging. These microstructural features are believed to be more common in clay
shales where clay mineral content percentages exceed those of quartz content (e.g. Lee et
al., 1993).
It is well known that microstructure of a soil is often controlled by geological processes.
One of the most influential of these geological processes is cementation. The process of
cementation often follows compaction and involves precipitation of mineral material in
the pore spaces or pre-existing microcracks (Bell, 1993). This in turn leads to the
formation of bonds between particles that subsequently resist the development of
cracking. The cementation material may be derived from partial intrastratal solution of
grains, or may be introduced into the pore spaces from an extraneous source by
circulating water. Conversely, cement may be removed from a sedimentary rock by
leaching. In a study carried out on Pierre shale, Olgaard et al. (1997) investigated the
nature of cement in the shale. They reported that clay minerals appear to be cemented to
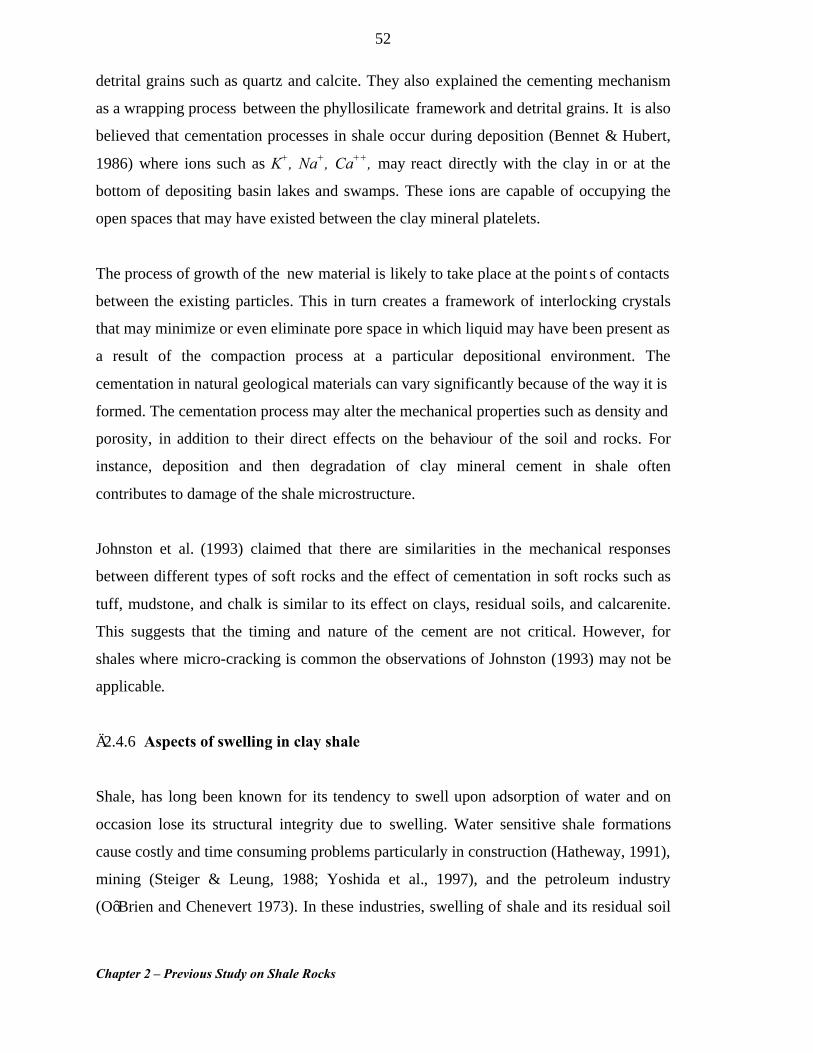
Chapter 2 – Previous Study on Shale Rocks
52
detrital grains such as quartz and calcite. They also explained the cementing mechanism
as a wrapping process between the phyllosilicate framework and detrital grains. It is also
believed that cementation processes in shale occur during deposition (Bennet & Hubert,
1986) where ions such as K+, Na+, Ca++, may react directly with the clay in or at the
bottom of depositing basin lakes and swamps. These ions are capable of occupying the
open spaces that may have existed between the clay mineral platelets.
The process of growth of the new material is likely to take place at the point s of contacts
between the existing particles. This in turn creates a framework of interlocking crystals
that may minimize or even eliminate pore space in which liquid may have been present as
a result of the compaction process at a particular depositional environment. The
cementation in natural geological materials can vary significantly because of the way it is
formed. The cementation process may alter the mechanical properties such as density and
porosity, in addition to their direct effects on the behaviour of the soil and rocks. For
instance, deposition and then degradation of clay mineral cement in shale often
contributes to damage of the shale microstructure.
Johnston et al. (1993) claimed that there are similarities in the mechanical responses
between different types of soft rocks and the effect of cementation in soft rocks such as
tuff, mudstone, and chalk is similar to its effect on clays, residual soils, and calcarenite.
This suggests that the timing and nature of the cement are not critical. However, for
shales where micro-cracking is common the observations of Johnston (1993) may not be
applicable.
§2.4.6 Aspects of swelling in clay shale
Shale, has long been known for its tendency to swell upon adsorption of water and on
occasion lose its structural integrity due to swelling. Water sensitive shale formations
cause costly and time consuming problems particularly in construction (Hatheway, 1991),
mining (Steiger & Leung, 1988; Yoshida et al., 1997), and the petroleum industry
(O’Brien and Chenevert 1973). In these industries, swelling of shale and its residual soil
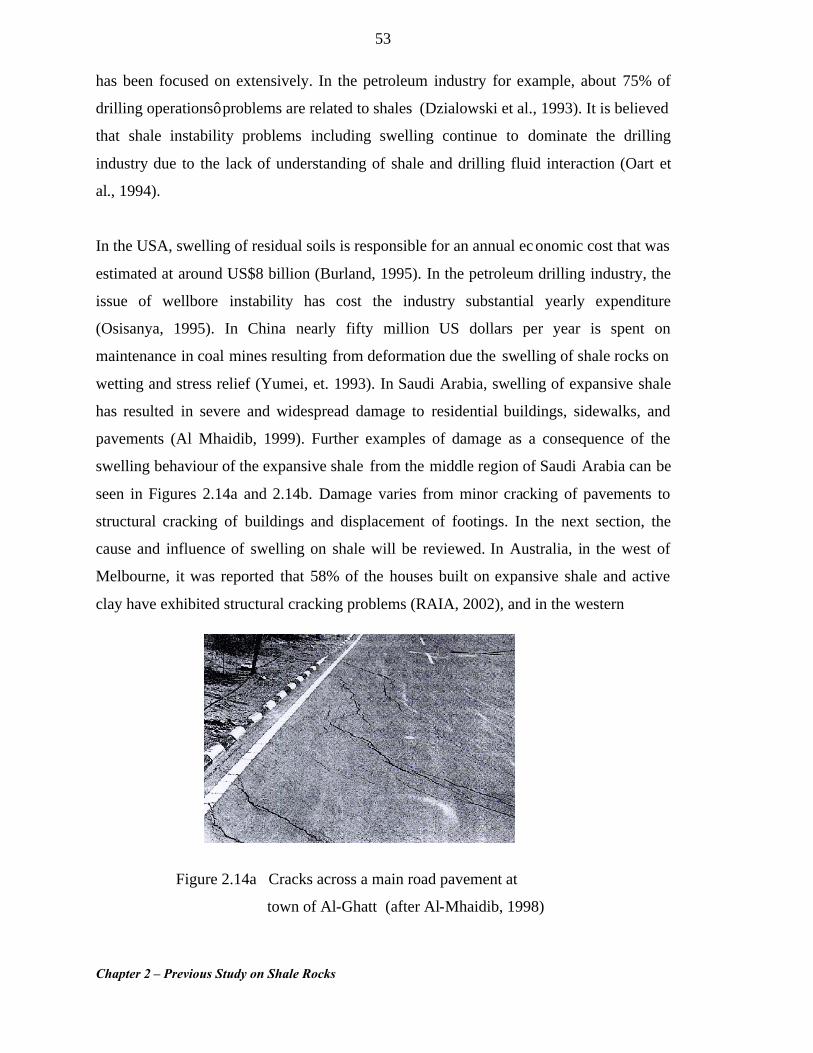
Chapter 2 – Previous Study on Shale Rocks
53
has been focused on extensively. In the petroleum industry for example, about 75% of
drilling operations’ problems are related to shales (Dzialowski et al., 1993). It is believed
that shale instability problems including swelling continue to dominate the drilling
industry due to the lack of understanding of shale and drilling fluid interaction (Oart et
al., 1994).
In the USA, swelling of residual soils is responsible for an annual economic cost that was
estimated at around US$8 billion (Burland, 1995). In the petroleum drilling industry, the
issue of wellbore instability has cost the industry substantial yearly expenditure
(Osisanya, 1995). In China nearly fifty million US dollars per year is spent on
maintenance in coal mines resulting from deformation due the swelling of shale rocks on
wetting and stress relief (Yumei, et. 1993). In Saudi Arabia, swelling of expansive shale
has resulted in severe and widespread damage to residential buildings, sidewalks, and
pavements (Al Mhaidib, 1999). Further examples of damage as a consequence of the
swelling behaviour of the expansive shale from the middle region of Saudi Arabia can be
seen in Figures 2.14a and 2.14b. Damage varies from minor cracking of pavements to
structural cracking of buildings and displacement of footings. In the next section, the
cause and influence of swelling on shale will be reviewed. In Australia, in the west of
Melbourne, it was reported that 58% of the houses built on expansive shale and active
clay have exhibited structural cracking problems (RAIA, 2002), and in the western
Figure 2.14a Cracks across a main road pavement at
town of Al-Ghatt (after Al-Mhaidib, 1998)
Chapter 2 – Previous Study on Shale Rocks
54
Figure 2.14b Cracks in a reinforced concrete gate and
adjacent wall (after Al-Mhaidib, 1998)
suburbs of Sydney, damage inflicted on residential construction by the influence of
expansive clay shale (Bringelly shale), particularly when heavy rains following a drought
season. This issue has not been recognized by the local authorities such as councils and
local governments.
One consequence of swelling in clay shale is that standard water flush drilling techniques
give very poor core recovery. This can be demonstrated by the difference in core
recovery from the two shales of the Wianamatta group in Australia. Ashfield shale (Fig.
2.15a), that does not contain swelling clay minerals shows a good core recovery when
conventional diamond drilling has been used. When using the same drilling technique,
Bringelly shale (Fig. 2.15b) has given a very poor core recovery (Coffey Geosciences,
2004).
§2.4.6.1 Previous investigation and preliminary findings on swelling
Extensive investigations have been made to study the causes and mechanism of swelling
of some argillaceous rocks, particularly clay shale and marl. The results of these
investigations were reviewed and assessed by researchers such as Balasubramanian
(1972); Mitchell (1973, 1976); Lindner (1976); Huang et al. (1986) and others. In the
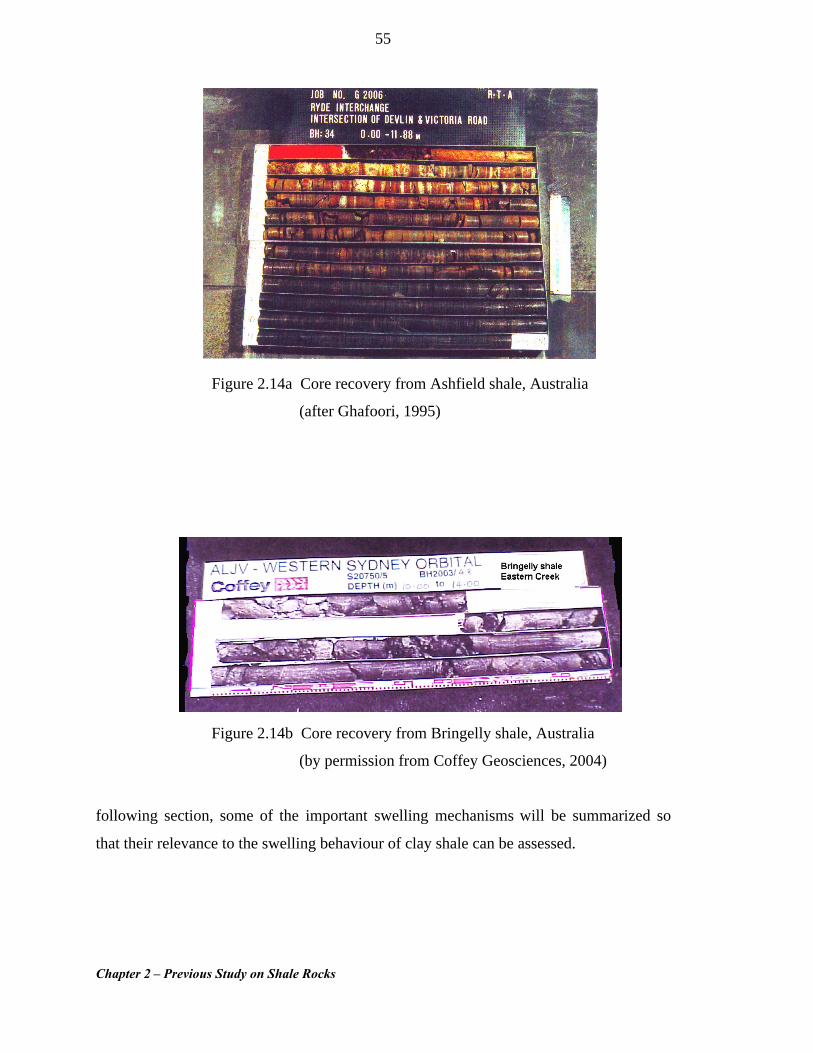
Chapter 2 – Previous Study on Shale Rocks
55
Figure 2.14a Core recovery from Ashfield shale, Australia
(after Ghafoori, 1995)
Figure 2.14b Core recovery from Bringelly shale, Australia
(by permission from Coffey Geosciences, 2004)
following section, some of the important swelling mechanisms will be summarized so
that their relevance to the swelling behaviour of clay shale can be assessed.
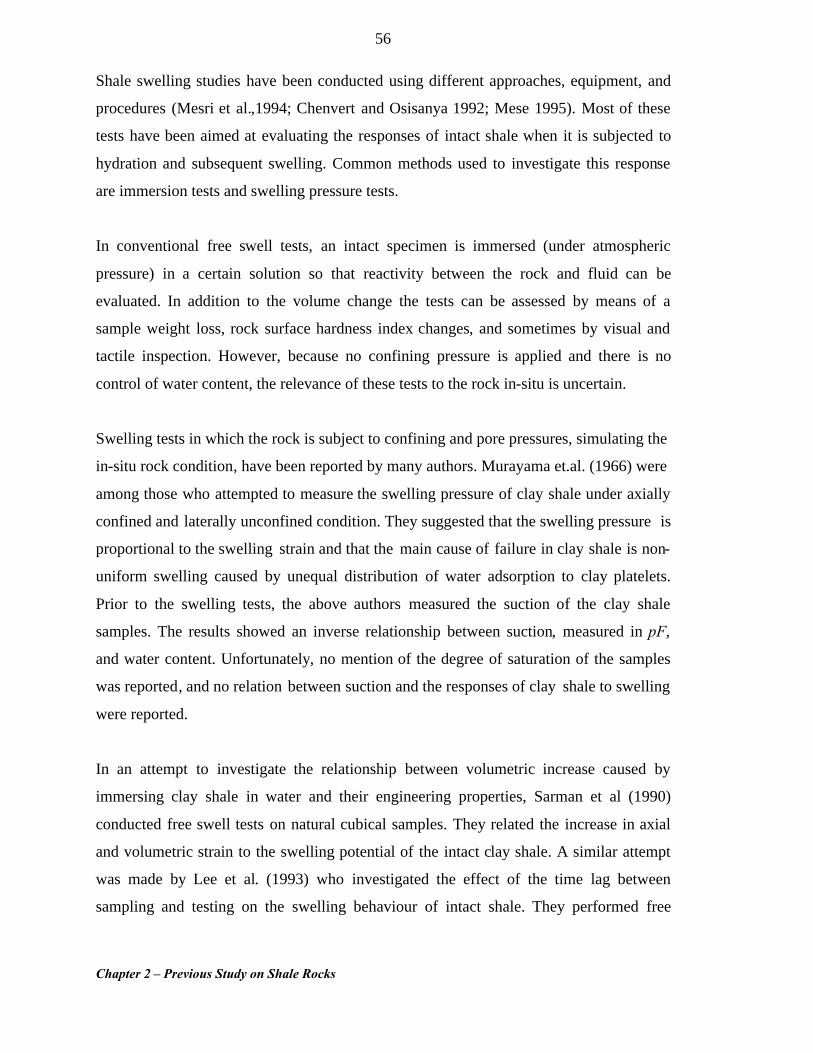
Chapter 2 – Previous Study on Shale Rocks
56
Shale swelling studies have been conducted using different approaches, equipment, and
procedures (Mesri et al.,1994; Chenvert and Osisanya 1992; Mese 1995). Most of these
tests have been aimed at evaluating the responses of intact shale when it is subjected to
hydration and subsequent swelling. Common methods used to investigate this response
are immersion tests and swelling pressure tests.
In conventional free swell tests, an intact specimen is immersed (under atmospheric
pressure) in a certain solution so that reactivity between the rock and fluid can be
evaluated. In addition to the volume change the tests can be assessed by means of a
sample weight loss, rock surface hardness index changes, and sometimes by visual and
tactile inspection. However, because no confining pressure is applied and there is no
control of water content, the relevance of these tests to the rock in-situ is uncertain.
Swelling tests in which the rock is subject to confining and pore pressures, simulating the
in-situ rock condition, have been reported by many authors. Murayama et.al. (1966) were
among those who attempted to measure the swelling pressure of clay shale under axially
confined and laterally unconfined condition. They suggested that the swelling pressure is
proportional to the swelling strain and that the main cause of failure in clay shale is non-
uniform swelling caused by unequal distribution of water adsorption to clay platelets.
Prior to the swelling tests, the above authors measured the suction of the clay shale
samples. The results showed an inverse relationship between suction, measured in pF,
and water content. Unfortunately, no mention of the degree of saturation of the samples
was reported, and no relation between suction and the responses of clay shale to swelling
were reported.
In an attempt to investigate the relationship between volumetric increase caused by
immersing clay shale in water and their engineering properties, Sarman et al (1990)
conducted free swell tests on natural cubical samples. They related the increase in axial
and volumetric strain to the swelling potential of the intact clay shale. A similar attempt
was made by Lee et al. (1993) who investigated the effect of the time lag between
sampling and testing on the swelling behaviour of intact shale. They performed free
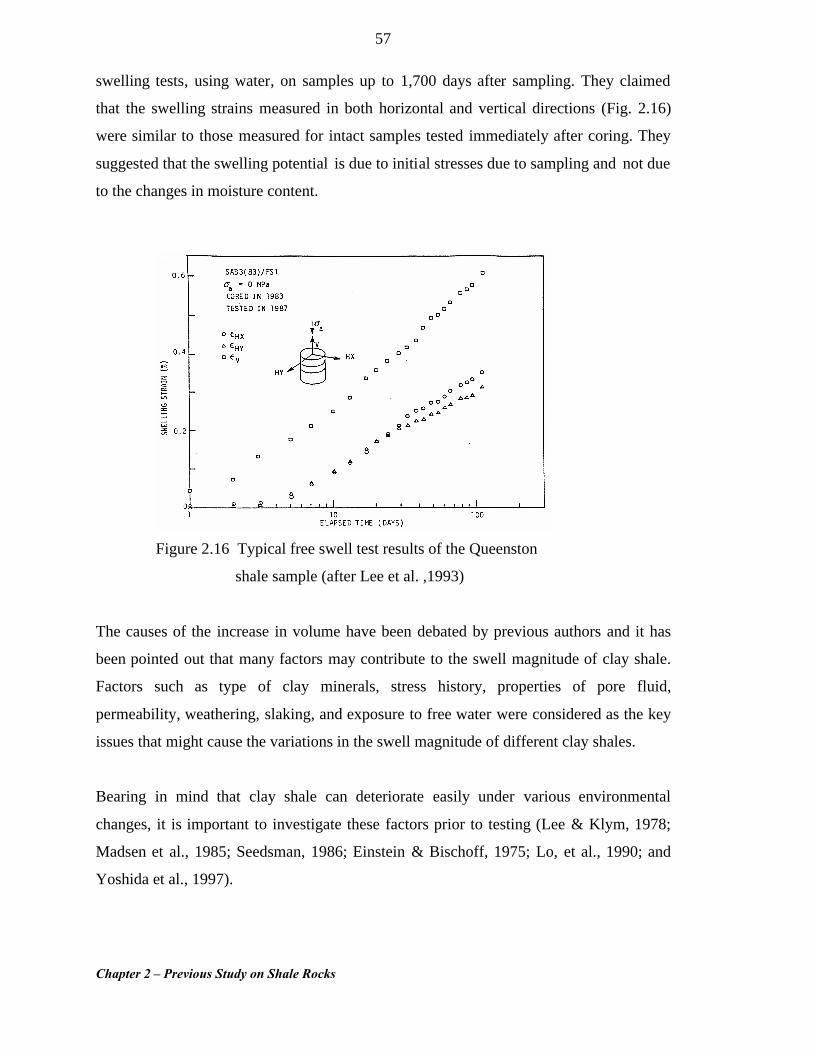
Chapter 2 – Previous Study on Shale Rocks
57
swelling tests, using water, on samples up to 1,700 days after sampling. They claimed
that the swelling strains measured in both horizontal and vertical directions (Fig. 2.16)
were similar to those measured for intact samples tested immediately after coring. They
suggested that the swelling potential is due to initial stresses due to sampling and not due
to the changes in moisture content.
Figure 2.16 Typical free swell test results of the Queenston
shale sample (after Lee et al. ,1993)
The causes of the increase in volume have been debated by previous authors and it has
been pointed out that many factors may contribute to the swell magnitude of clay shale.
Factors such as type of clay minerals, stress history, properties of pore fluid,
permeability, weathering, slaking, and exposure to free water were considered as the key
issues that might cause the variations in the swell magnitude of different clay shales.
Bearing in mind that clay shale can deteriorate easily under various environmental
changes, it is important to investigate these factors prior to testing (Lee & Klym, 1978;
Madsen et al., 1985; Seedsman, 1986; Einstein & Bischoff, 1975; Lo, et al., 1990; and
Yoshida et al., 1997).
Chapter 2 – Previous Study on Shale Rocks
58
Steiger (1993) investigated the hydration behaviour of Pierre shale in the triaxial
apparatus. He measured the swelling pressures and strains using different test fluids.
Sodium, potassium, calcium, and barium chloride solutions were used. Potassium
chloride solution had much greater effects in minimizing the swelling potential of the
rock. Kronenberg et al (1996) used the same approach in an effort to investigate the
influence of fluid chemistry on the swelling potential of Wilcox shale. They suggested
that using fluids such as NaCl, KCL, and CaCl2 at different concentration could control
the swelling potential of the shale. These studies suggest that the swelling and associated
swelling pressure are a result of a redevelopment of double-layer water (Mesri et al.,
1994). Although these studies showed why potassium is a major ingredient of inhibitive
drilling fluid, but they did not pay much attention to the influence of such chemical
solutions on the volumetric strain in the clay shale. In the oil industry, researchers have
been interested in identifying an environmentally acceptable water based mud that could
act as an alternative to oil-based muds (Simpson et al, 1995; Oart et al., 1996). Their
results showed that oil based muds contain an emulsified water phase that can increase
hydration, pore pressure, and hence weaken the rock. They suggested that a water soluble
organic monomer can provide a mud that is capable of minimising the swelling potential
of the shale without weakening the rock.
Studies of the swelling potential in clay shale have found that absorption and adsorption
can be used to explain the swell potential of shale (e.g. Sarman et al., 1990; Harrington et
al., 1997). This conclusion was based on testing the material in water and no attention
was given to the influence of the chemistry of the pore fluid. However, when different
ambient fluids have been used, it has been suggested that that the mechanism of swelling
is osmotic swelling due to ion-concentration differences between the double layer water
and the pore fluid. These studies have shown on one hand the importance of the
engineering properties in predicting the swelling potential, and on the other hand the
necessity of examining the mineral composition and fabric to understand the mechanism
of swelling in clay shale. The complexity of fluid / rock interactions in shale has led to a
degree of confusion about the relationship between the phenomena of chemico-osmotic
flow, swelling and hydration. For instance, from the swelling behaviour observed in
Chapter 2 – Previous Study on Shale Rocks
59
Labiche shale (Wong, 1997), neither the osmotic swelling concept, nor water adsorption
theory could explain why shale specimens swell when exposed to 1% and 3% NaCl
solution when the pore fluid concentration is about 0.15%. However, Carminati et al
(1997) relate the cause of the above effect to suction pressure that could have been
generated by insufficient saturation, unloading, and also due to the development of
micro-cracks in the sample. However, Carminati et al.’s postulation has ignored the fact
that swelling of Labiche shale is dependent on NaCl concentration (Wong, 1997).
§2.4.6.2 Possible mechanisms of swelling
In water saturated systems, local volume changes are a result of the transient movement
of water due to effective stress changes. If the volume increases, the process is known as
swelling. In partially or unsaturated systems, water interacts with cations attracted to
negatively charged clay surfaces. Hydration of the cations on the silicate surfaces reduces
the free energy of water and thus provides a driving force to cause spontaneous water
adsorption and swelling until the activity or chemical potential of the associated water
becomes equal to that of the free water (Low, 1992). This free water was defined by
Hueckel (1992) as the water that fills the intramatrix pores and is able to move due to
hydraulic gradients at room temperature.
In general, water is believed to be driven in or out of shale by different driving forces:
hydraulic pressure, electrical and chemical potential, and temperature. However,
researchers have adopted different concepts in an attempt to explain the mechanism that
lead to swelling of shale. For example, the osmotic pressure concept was adopted by Oart
et al. (1996); Santos et al. (1996); and Steiger (1993) who agreed that swelling occurs
when there is a physico-chemical change in pore fluid chemistry. Osmotic movement of
water from the intramatrix pores to the interlamellar pores occurs according to an ionic
gradient. Because of its simplicity, the osmotic pressure concept is widely used, and can
be used to quantify the swelling and consolidation (Barbour et al., 1989; Madsen et al.,
1985). However, the osmotic pressure method appears to cater only for undisturbed
Chapter 2 – Previous Study on Shale Rocks
60
samples and samples that resist disintegration when in contact with water (Mody et al.,
2002).
The water adsorption concept was first proposed by Chenevert (1970) who postulated
that swelling of clay shale is a result of water adsorption that is capable of generating
internal stresses. These stresses may lead to a reduction in compressive strength and
consequently ultimate shale failure. Water adsorption was interpreted as a result of
hydration and chemical forces. These forces are attributed to the ions and water
movement between mineral layer surfaces (Pashely et al., 1983). The water adsorption
mechanism can account for the molecular interactions between, pore fluid, clay particles,
and the ions in the pore fluid. This approach was further explained by Low (1987) who
suggested that the interaction of water with clay mineral surfaces reduces the chemical
potential of the water, therefore creating a gradient in the chemical potential that enables
additional water to flow into the system. The same concept was adopted by Yew et
al.(1989) and Heidug et al. (1996) who succeeded in developing a swell model that is
based on the continuity- governing equation by introduce a chemical potential parameter
that was related to the driving force causing water migration and swelling.
Horsud et al. (1998) have suggested that suction is the main driving mechanism for shale
swelling development. They stated that osmosis does not play a role, and that suction,
which varies with the water content of the material, is the main cause of the swelling in
clay shale. The limitation of this approach is that it cannot explain the influence of pore
fluid chemistry.
§2.4.7 Deformation characteristics
Shale can degrade to a certain extent with time when it is removed from its natural
condition and is subjected to stress relief or when its environment changes or when it is
subject to weathering processes. Thus the engineering properties can change with time.
This time dependent deformation behaviour can be important in the design and
construction of ground and underground structures built in swelling rocks. In order to
Chapter 2 – Previous Study on Shale Rocks
61
estimate the likely deformation of the ground and the displacements of structures reliably,
accurate information on the deformation properties of shale is needed. For instance,
elastic parameters such as modulus of elasticity and Poisson’s ratio are usually required
as input for characterization of intact rock and / or rock mass deformability assessments.
These are required for a wide range of strain, from less than about 0.001% to that at peak
strength. The distinction between elastic and plastic deformation properties is also
important. It is difficult, however, to evaluate accurately these quantities by conventional
triaxial compression test (Clayton et al., 1994; Tatsuoka & Kohata, 1995). In particular,
data are required at strains of less than about 0.1%, which typically cover the strain levels
experienced in the ground at working load levels (Burland, 1989; Atkinson & Sallfors,
1991; and Kim et al., 1994).
In their investigations on the deformation of the ground and displacement of structures,
Kim et al. (1994) used local deformation transducers to measure small strains of less than
0.001%. They suggested that the initial portion of stress-strain relation at small strains is
virtually linear and recoverable, allowing Young’s modulus to be defined confidently.
They also attributed the S-shaped stress-strain curve to the closing of microcracks during
axial compression. At large strains, the local stress-strain relation is noticeably non-
linear. However, the degree of non-linearity was found to be smaller than is typical for
poorly cemented material (Shibuya et al., 1991). Plastic strain prior to gross yielding is a
common phenomenon in soft rocks. In principle, the yield point at the end of the straight
portion of the stress-strain curve signifies the transition of elastic to plastic deformation.
Although used widely, yield cannot always be exactly located in this way. Yoshinaka et
al. (1996) performed triaxial compression tests on siltstone and mudstone samples from
Japan. The results indicated that by plotting the variation of deformation moduli with
respect to axial plastic strain, the yield point, and maximum elastic deformation modulus
could easily be detected.
The correlation between the modulus of elasticity and confining stress has been
investigated by Kulhawy (1975) who suggested a power law expression in the form:
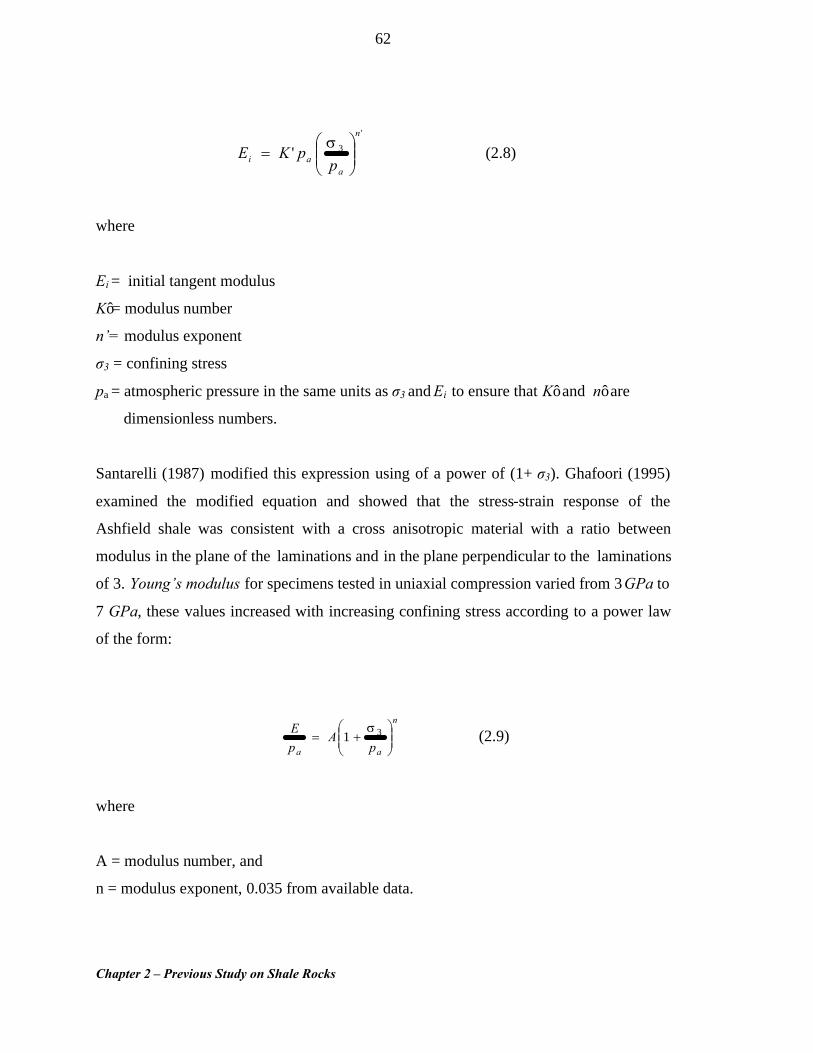
Chapter 2 – Previous Study on Shale Rocks
62
'
3'n
aai p
pKE ˜̃¯
ˆÁÁË
Ê=
s (2.8)
where
Ei = initial tangent modulus
K’= modulus number
n’= modulus exponent
σ3 = confining stress
pa = atmospheric pressure in the same units as σ3 and Ei to ensure that K’ and n’ are
dimensionless numbers.
Santarelli (1987) modified this expression using of a power of (1+ σ3). Ghafoori (1995)
examined the modified equation and showed that the stress-strain response of the
Ashfield shale was consistent with a cross anisotropic material with a ratio between
modulus in the plane of the laminations and in the plane perpendicular to the laminations
of 3. Young’s modulus for specimens tested in uniaxial compression varied from 3GPa to
7 GPa, these values increased with increasing confining stress according to a power law
of the form:
n
aa pA
pE
˜̃¯
ˆÁÁË
Ê+= 31
s (2.9)
where
A = modulus number, and
n = modulus exponent, 0.035 from available data.
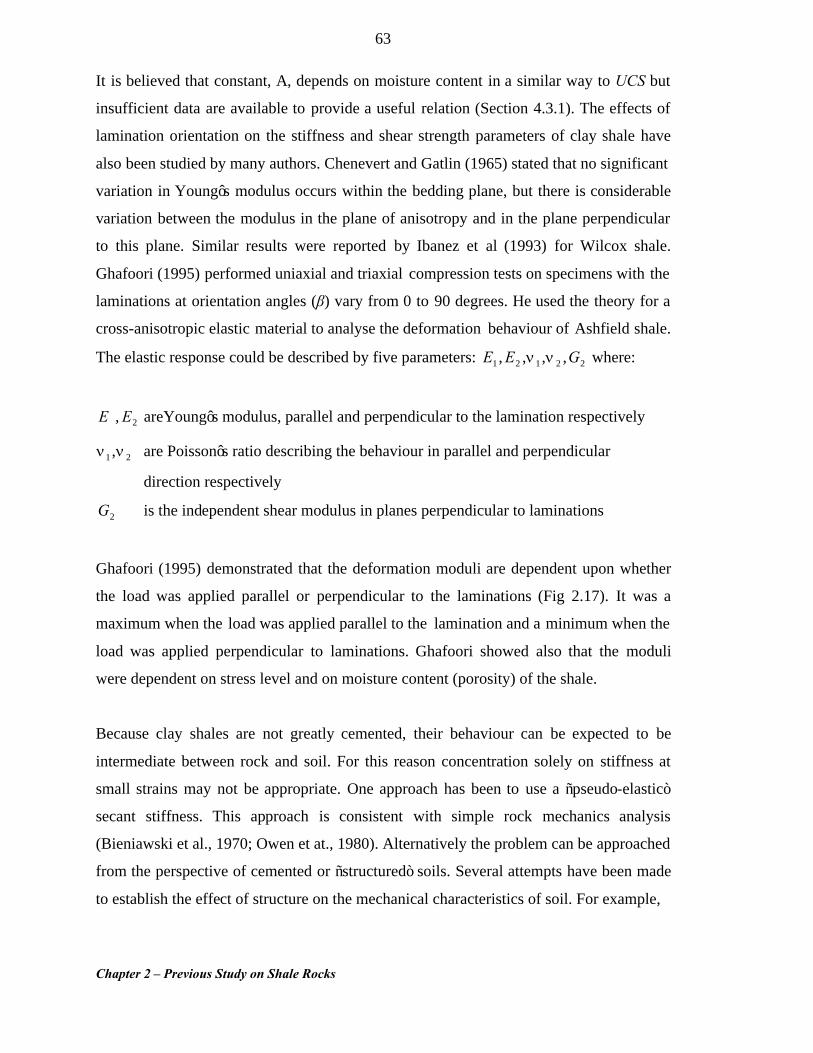
Chapter 2 – Previous Study on Shale Rocks
63
It is believed that constant, A, depends on moisture content in a similar way to UCS but
insufficient data are available to provide a useful relation (Section 4.3.1). The effects of
lamination orientation on the stiffness and shear strength parameters of clay shale have
also been studied by many authors. Chenevert and Gatlin (1965) stated that no significant
variation in Young’s modulus occurs within the bedding plane, but there is considerable
variation between the modulus in the plane of anisotropy and in the plane perpendicular
to this plane. Similar results were reported by Ibanez et al (1993) for Wilcox shale.
Ghafoori (1995) performed uniaxial and triaxial compression tests on specimens with the
laminations at orientation angles (β) vary from 0 to 90 degrees. He used the theory for a
cross-anisotropic elastic material to analyse the deformation behaviour of Ashfield shale.
The elastic response could be described by five parameters: 22121 ,,,, GEE nn where:
2, EE areYoung’s modulus, parallel and perpendicular to the lamination respectively
21 ,nn are Poisson’s ratio describing the behaviour in parallel and perpendicular
direction respectively
2G is the independent shear modulus in planes perpendicular to laminations
Ghafoori (1995) demonstrated that the deformation moduli are dependent upon whether
the load was applied parallel or perpendicular to the laminations (Fig 2.17). It was a
maximum when the load was applied parallel to the lamination and a minimum when the
load was applied perpendicular to laminations. Ghafoori showed also that the moduli
were dependent on stress level and on moisture content (porosity) of the shale.
Because clay shales are not greatly cemented, their behaviour can be expected to be
intermediate between rock and soil. For this reason concentration solely on stiffness at
small strains may not be appropriate. One approach has been to use a “pseudo-elastic”
secant stiffness. This approach is consistent with simple rock mechanics analysis
(Bieniawski et al., 1970; Owen et at., 1980). Alternatively the problem can be approached
from the perspective of cemented or “structured” soils. Several attempts have been made
to establish the effect of structure on the mechanical characteristics of soil. For example,
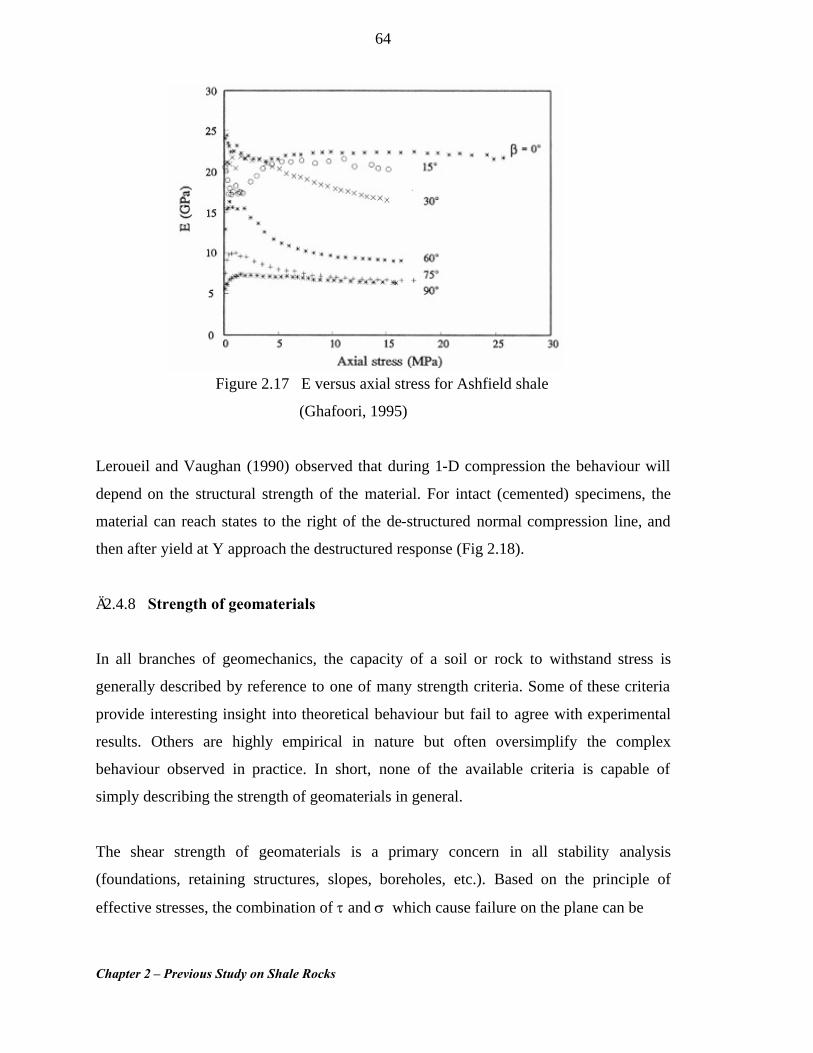
Chapter 2 – Previous Study on Shale Rocks
64
Figure 2.17 E versus axial stress for Ashfield shale
(Ghafoori, 1995)
Leroueil and Vaughan (1990) observed that during 1-D compression the behaviour will
depend on the structural strength of the material. For intact (cemented) specimens, the
material can reach states to the right of the de-structured normal compression line, and
then after yield at Y approach the destructured response (Fig 2.18).
§2.4.8 Strength of geomaterials
In all branches of geomechanics, the capacity of a soil or rock to withstand stress is
generally described by reference to one of many strength criteria. Some of these criteria
provide interesting insight into theoretical behaviour but fail to agree with experimental
results. Others are highly empirical in nature but often oversimplify the complex
behaviour observed in practice. In short, none of the available criteria is capable of
simply describing the strength of geomaterials in general.
The shear strength of geomaterials is a primary concern in all stability analysis
(foundations, retaining structures, slopes, boreholes, etc.). Based on the principle of
effective stresses, the combination of t and s which cause failure on the plane can be
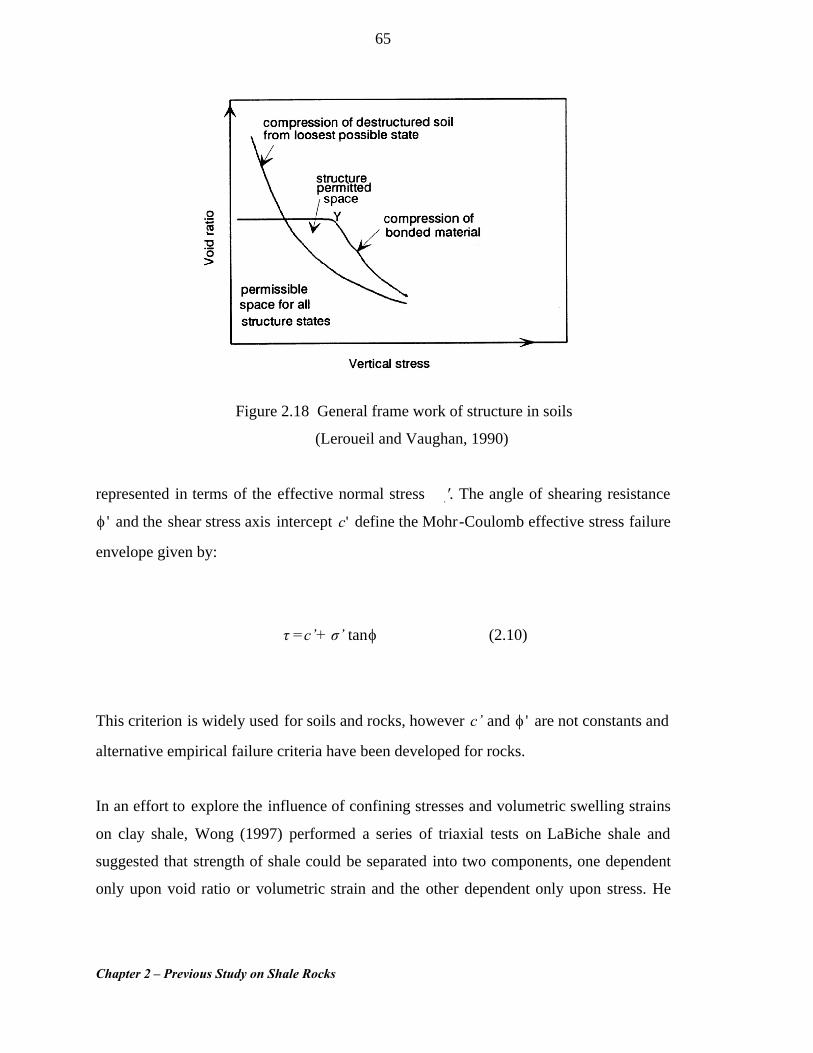
Chapter 2 – Previous Study on Shale Rocks
65
Figure 2.18 General frame work of structure in soils
(Leroueil and Vaughan, 1990)
represented in terms of the effective normal stress
'. The angle of shearing resistance
'f and the shear stress axis intercept 'c define the Mohr-Coulomb effective stress failure
envelope given by:
τ =c’+ σ’ tanf (2.10)
This criterion is widely used for soils and rocks, however c’ and 'f are not constants and
alternative empirical failure criteria have been developed for rocks.
In an effort to explore the influence of confining stresses and volumetric swelling strains
on clay shale, Wong (1997) performed a series of triaxial tests on LaBiche shale and
suggested that strength of shale could be separated into two components, one dependent
only upon void ratio or volumetric strain and the other dependent only upon stress. He
Chapter 2 – Previous Study on Shale Rocks
66
used Coulomb type expression (Eq.2.17) to rewrite the Hvorslev shear strength equation
as follow:
τ =co+ μσ (2.11)
in which
co is the cohesive shear strength and m is the coefficient of internal friction.
)tan()(),( fseett ¢+== vfvff cp (2.12)
in which
evf and pf are the volumetric strain and mean confining stress at failure
respectively.
It is believed that the above equation can be used if the clay shale specimens are expected
to be subject to swelling during drained triaxial testing. As a consequence of this,
normalization of the stress-strain relation with the confining stress variable alone may not
be expected.
The Mohr-Columb failure criterion can also be expressed in terms of the major and minor
principal effective stresses s' and s'3
σ’1 = 'sin1'sin1
ff
-+ σ ‘3+ q’u (2.13)
where q /u is the uniaxial compressive strength of the material.
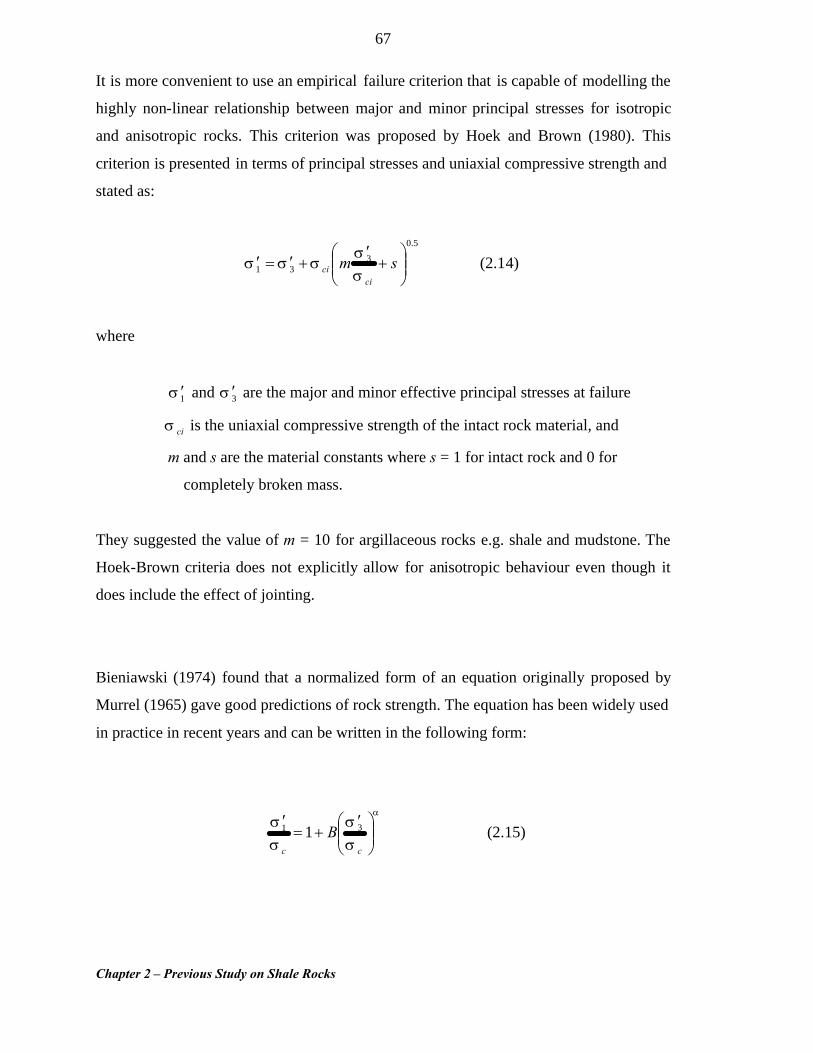
Chapter 2 – Previous Study on Shale Rocks
67
It is more convenient to use an empirical failure criterion that is capable of modelling the
highly non-linear relationship between major and minor principal stresses for isotropic
and anisotropic rocks. This criterion was proposed by Hoek and Brown (1980). This
criterion is presented in terms of principal stresses and uniaxial compressive strength and
stated as:
5.0
331 ˜̃
¯
ˆÁÁË
Ê+
¢+¢=¢ sm
cici s
ssss (2.14)
where
1s ¢ and 3s ¢ are the major and minor effective principal stresses at failure
cis is the uniaxial compressive strength of the intact rock material, and
m and s are the material constants where s = 1 for intact rock and 0 for
completely broken mass.
They suggested the value of m = 10 for argillaceous rocks e.g. shale and mudstone. The
Hoek-Brown criteria does not explicitly allow for anisotropic behaviour even though it
does include the effect of jointing.
Bieniawski (1974) found that a normalized form of an equation originally proposed by
Murrel (1965) gave good predictions of rock strength. The equation has been widely used
in practice in recent years and can be written in the following form:
a
ss
ss
˜̃¯
ˆÁÁË
Ê ¢+=
¢
cc
B 31 1 (2.15)
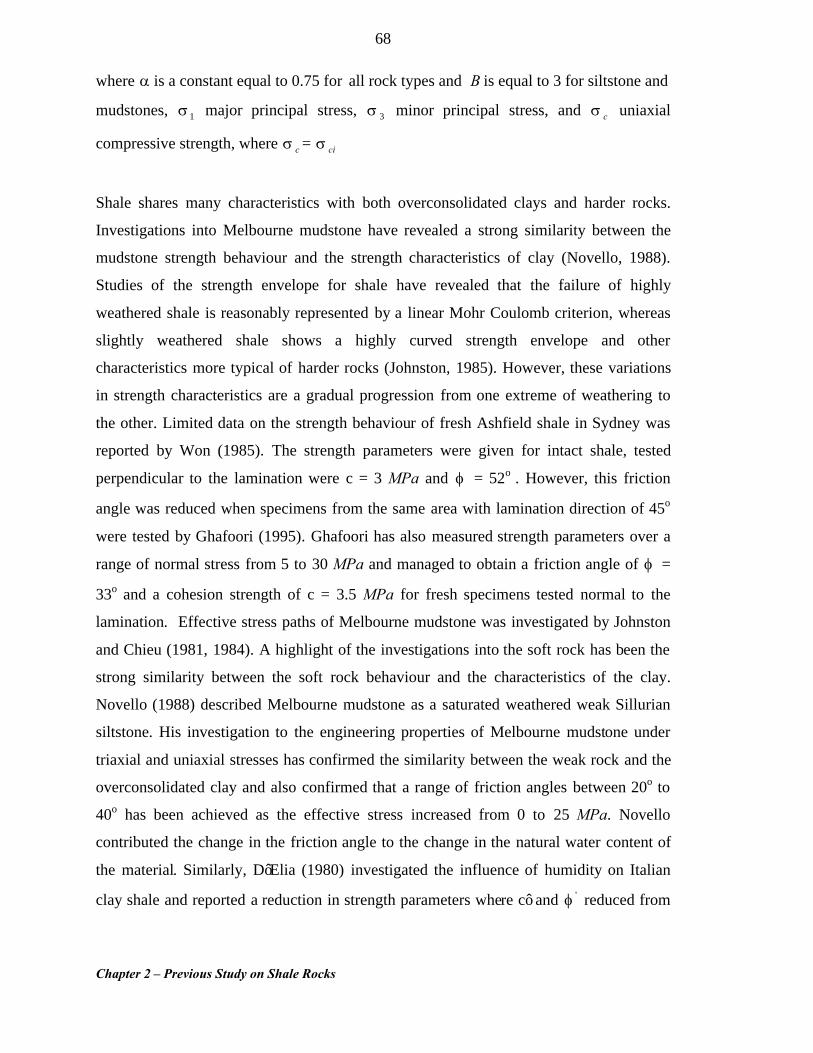
Chapter 2 – Previous Study on Shale Rocks
68
where a is a constant equal to 0.75 for all rock types and B is equal to 3 for siltstone and
mudstones, 1s major principal stress, 3s minor principal stress, and cs uniaxial
compressive strength, where cs = cis
Shale shares many characteristics with both overconsolidated clays and harder rocks.
Investigations into Melbourne mudstone have revealed a strong similarity between the
mudstone strength behaviour and the strength characteristics of clay (Novello, 1988).
Studies of the strength envelope for shale have revealed that the failure of highly
weathered shale is reasonably represented by a linear Mohr Coulomb criterion, whereas
slightly weathered shale shows a highly curved strength envelope and other
characteristics more typical of harder rocks (Johnston, 1985). However, these variations
in strength characteristics are a gradual progression from one extreme of weathering to
the other. Limited data on the strength behaviour of fresh Ashfield shale in Sydney was
reported by Won (1985). The strength parameters were given for intact shale, tested
perpendicular to the lamination were c = 3 MPa and f = 52o . However, this friction
angle was reduced when specimens from the same area with lamination direction of 45o
were tested by Ghafoori (1995). Ghafoori has also measured strength parameters over a
range of normal stress from 5 to 30 MPa and managed to obtain a friction angle of f =
33o and a cohesion strength of c = 3.5 MPa for fresh specimens tested normal to the
lamination. Effective stress paths of Melbourne mudstone was investigated by Johnston
and Chieu (1981, 1984). A highlight of the investigations into the soft rock has been the
strong similarity between the soft rock behaviour and the characteristics of the clay.
Novello (1988) described Melbourne mudstone as a saturated weathered weak Sillurian
siltstone. His investigation to the engineering properties of Melbourne mudstone under
triaxial and uniaxial stresses has confirmed the similarity between the weak rock and the
overconsolidated clay and also confirmed that a range of friction angles between 20o to
40o has been achieved as the effective stress increased from 0 to 25 MPa. Novello
contributed the change in the friction angle to the change in the natural water content of
the material. Similarly, D’Elia (1980) investigated the influence of humidity on Italian
clay shale and reported a reduction in strength parameters where c’ and 'f reduced from
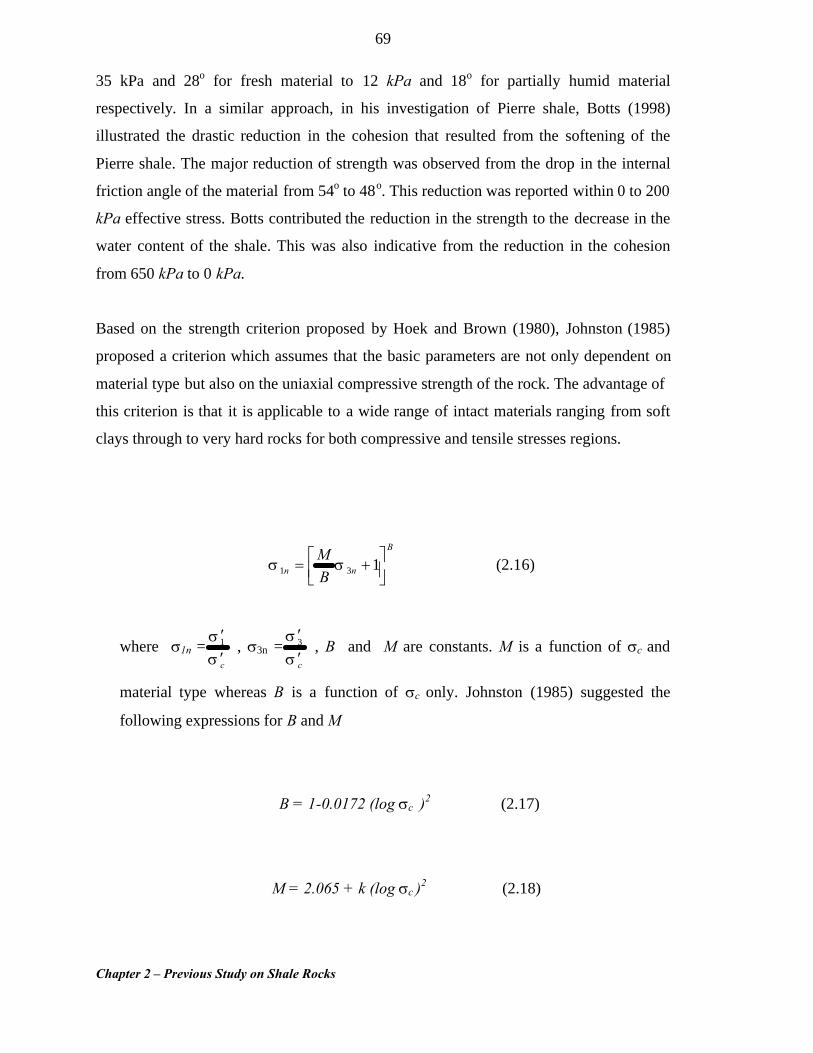
Chapter 2 – Previous Study on Shale Rocks
69
35 kPa and 28o for fresh material to 12 kPa and 18o for partially humid material
respectively. In a similar approach, in his investigation of Pierre shale, Botts (1998)
illustrated the drastic reduction in the cohesion that resulted from the softening of the
Pierre shale. The major reduction of strength was observed from the drop in the internal
friction angle of the material from 54o to 48o. This reduction was reported within 0 to 200
kPa effective stress. Botts contributed the reduction in the strength to the decrease in the
water content of the shale. This was also indicative from the reduction in the cohesion
from 650 kPa to 0 kPa.
Based on the strength criterion proposed by Hoek and Brown (1980), Johnston (1985)
proposed a criterion which assumes that the basic parameters are not only dependent on
material type but also on the uniaxial compressive strength of the rock. The advantage of
this criterion is that it is applicable to a wide range of intact materials ranging from soft
clays through to very hard rocks for both compressive and tensile stresses regions.
B
nn BM
˙̊˘
ÍÎÈ += 131 ss (2.16)
where s1n =cs
s¢¢1 , s3n =
css
¢¢3 , B and M are constants. M is a function of sc and
material type whereas B is a function of sc only. Johnston (1985) suggested the
following expressions for B and M
B = 1-0.0172 (log sc )2 (2.17)
M = 2.065 + k (log sc )2 (2.18)
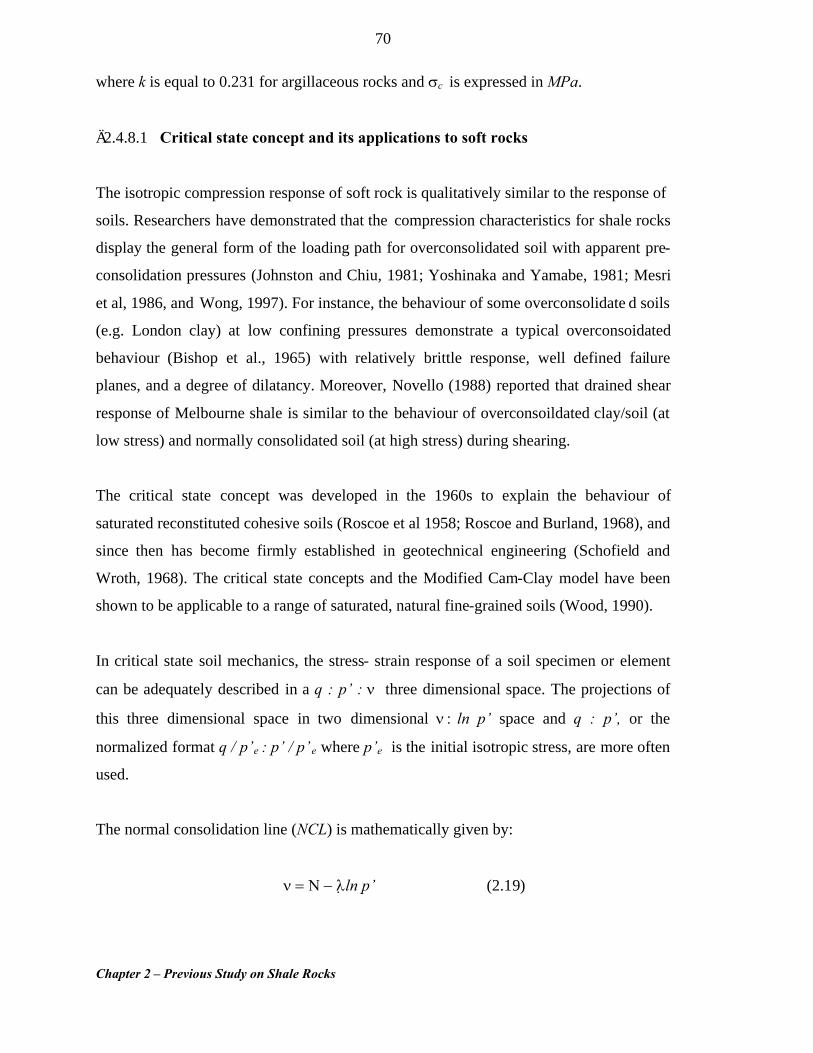
Chapter 2 – Previous Study on Shale Rocks
70
where k is equal to 0.231 for argillaceous rocks and sc is expressed in MPa.
§2.4.8.1 Critical state concept and its applications to soft rocks
The isotropic compression response of soft rock is qualitatively similar to the response of
soils. Researchers have demonstrated that the compression characteristics for shale rocks
display the general form of the loading path for overconsolidated soil with apparent pre-
consolidation pressures (Johnston and Chiu, 1981; Yoshinaka and Yamabe, 1981; Mesri
et al, 1986, and Wong, 1997). For instance, the behaviour of some overconsolidate d soils
(e.g. London clay) at low confining pressures demonstrate a typical overconsoidated
behaviour (Bishop et al., 1965) with relatively brittle response, well defined failure
planes, and a degree of dilatancy. Moreover, Novello (1988) reported that drained shear
response of Melbourne shale is similar to the behaviour of overconsoildated clay/soil (at
low stress) and normally consolidated soil (at high stress) during shearing.
The critical state concept was developed in the 1960s to explain the behaviour of
saturated reconstituted cohesive soils (Roscoe et al 1958; Roscoe and Burland, 1968), and
since then has become firmly established in geotechnical engineering (Schofield and
Wroth, 1968). The critical state concepts and the Modified Cam-Clay model have been
shown to be applicable to a range of saturated, natural fine-grained soils (Wood, 1990).
In critical state soil mechanics, the stress- strain response of a soil specimen or element
can be adequately described in a q : p’ : n three dimensional space. The projections of
this three dimensional space in two dimensional n : ln p’ space and q : p’, or the
normalized format q / p’e : p’ / p’e where p’e is the initial isotropic stress, are more often
used.
The normal consolidation line (NCL) is mathematically given by:
n = N - l ln p’ (2.19)
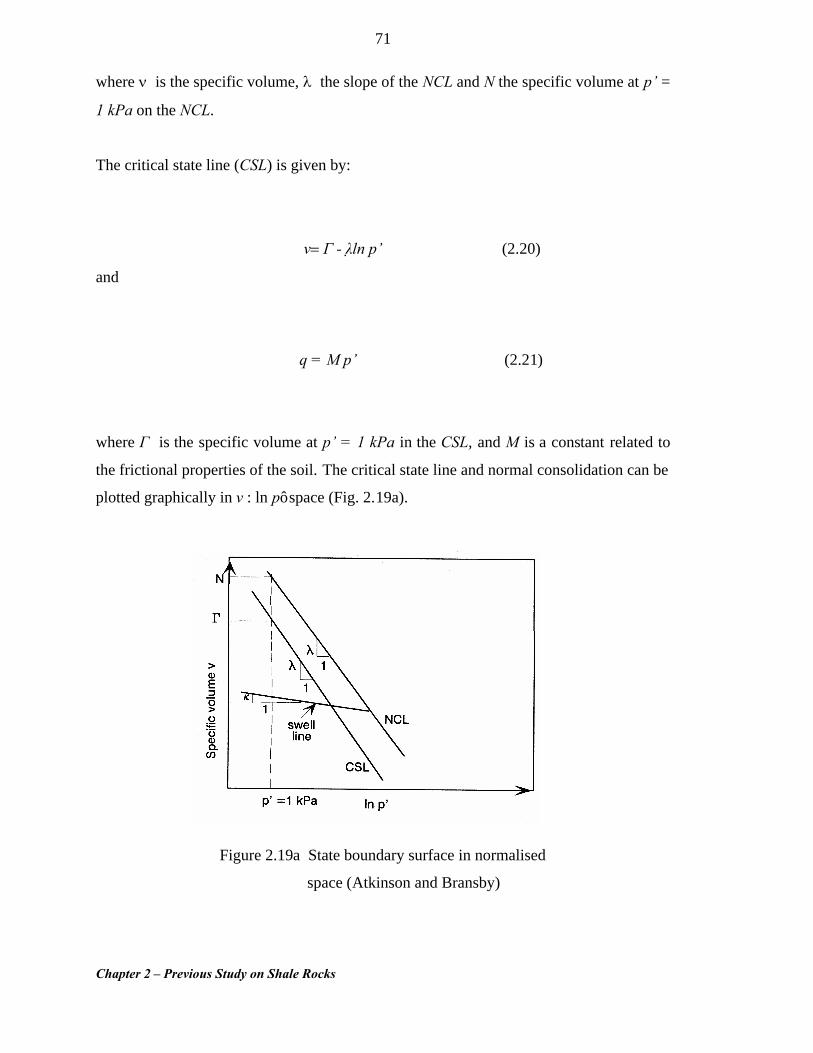
Chapter 2 – Previous Study on Shale Rocks
71
where n is the specific volume, l the slope of the NCL and N the specific volume at p’ =
1 kPa on the NCL.
The critical state line (CSL) is given by:
v= Γ - λln p’ (2.20)
and
q = M p’ (2.21)
where Γ is the specific volume at p’ = 1 kPa in the CSL, and M is a constant related to
the frictional properties of the soil. The critical state line and normal consolidation can be
plotted graphically in v : ln p’ space (Fig. 2.19a).
Figure 2.19a State boundary surface in normalised
space (Atkinson and Bransby)
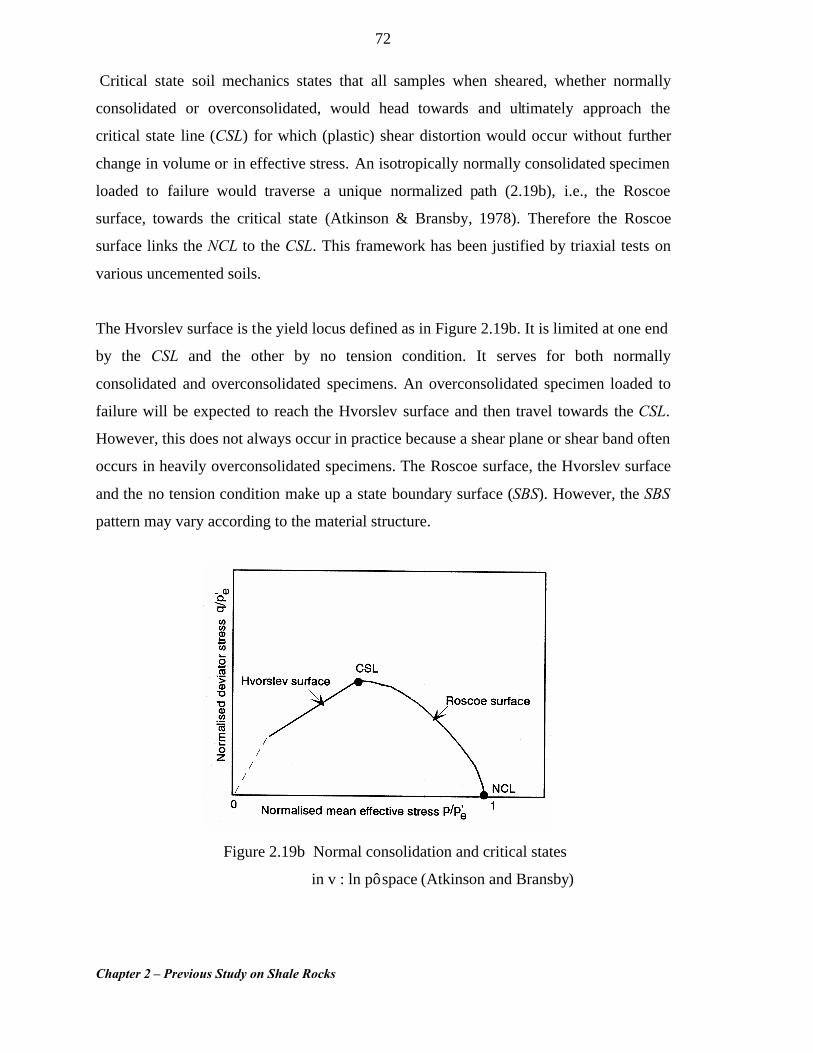
Chapter 2 – Previous Study on Shale Rocks
72
Critical state soil mechanics states that all samples when sheared, whether normally
consolidated or overconsolidated, would head towards and ultimately approach the
critical state line (CSL) for which (plastic) shear distortion would occur without further
change in volume or in effective stress. An isotropically normally consolidated specimen
loaded to failure would traverse a unique normalized path (2.19b), i.e., the Roscoe
surface, towards the critical state (Atkinson & Bransby, 1978). Therefore the Roscoe
surface links the NCL to the CSL. This framework has been justified by triaxial tests on
various uncemented soils.
The Hvorslev surface is the yield locus defined as in Figure 2.19b. It is limited at one end
by the CSL and the other by no tension condition. It serves for both normally
consolidated and overconsolidated specimens. An overconsolidated specimen loaded to
failure will be expected to reach the Hvorslev surface and then travel towards the CSL.
However, this does not always occur in practice because a shear plane or shear band often
occurs in heavily overconsolidated specimens. The Roscoe surface, the Hvorslev surface
and the no tension condition make up a state boundary surface (SBS). However, the SBS
pattern may vary according to the material structure.
Figure 2.19b Normal consolidation and critical states
in v : ln p’ space (Atkinson and Bransby)
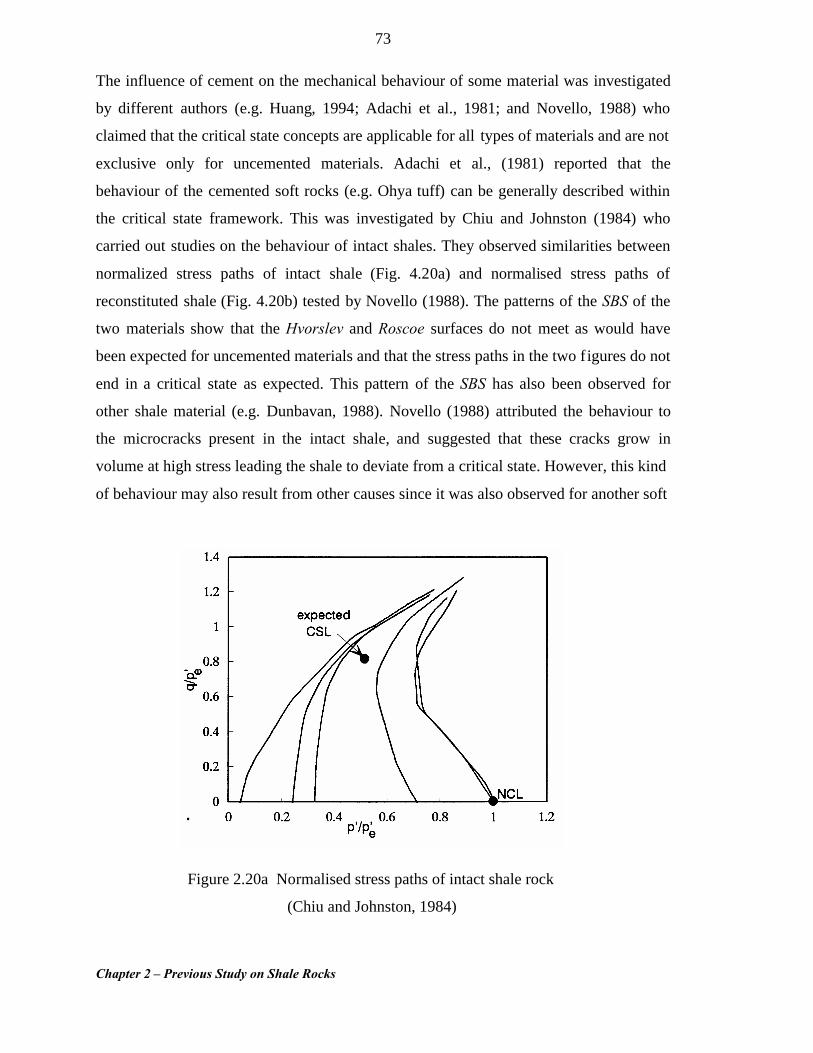
Chapter 2 – Previous Study on Shale Rocks
73
The influence of cement on the mechanical behaviour of some material was investigated
by different authors (e.g. Huang, 1994; Adachi et al., 1981; and Novello, 1988) who
claimed that the critical state concepts are applicable for all types of materials and are not
exclusive only for uncemented materials. Adachi et al., (1981) reported that the
behaviour of the cemented soft rocks (e.g. Ohya tuff) can be generally described within
the critical state framework. This was investigated by Chiu and Johnston (1984) who
carried out studies on the behaviour of intact shales. They observed similarities between
normalized stress paths of intact shale (Fig. 4.20a) and normalised stress paths of
reconstituted shale (Fig. 4.20b) tested by Novello (1988). The patterns of the SBS of the
two materials show that the Hvorslev and Roscoe surfaces do not meet as would have
been expected for uncemented materials and that the stress paths in the two figures do not
end in a critical state as expected. This pattern of the SBS has also been observed for
other shale material (e.g. Dunbavan, 1988). Novello (1988) attributed the behaviour to
the microcracks present in the intact shale, and suggested that these cracks grow in
volume at high stress leading the shale to deviate from a critical state. However, this kind
of behaviour may also result from other causes since it was also observed for another soft
Figure 2.20a Normalised stress paths of intact shale rock
(Chiu and Johnston, 1984)
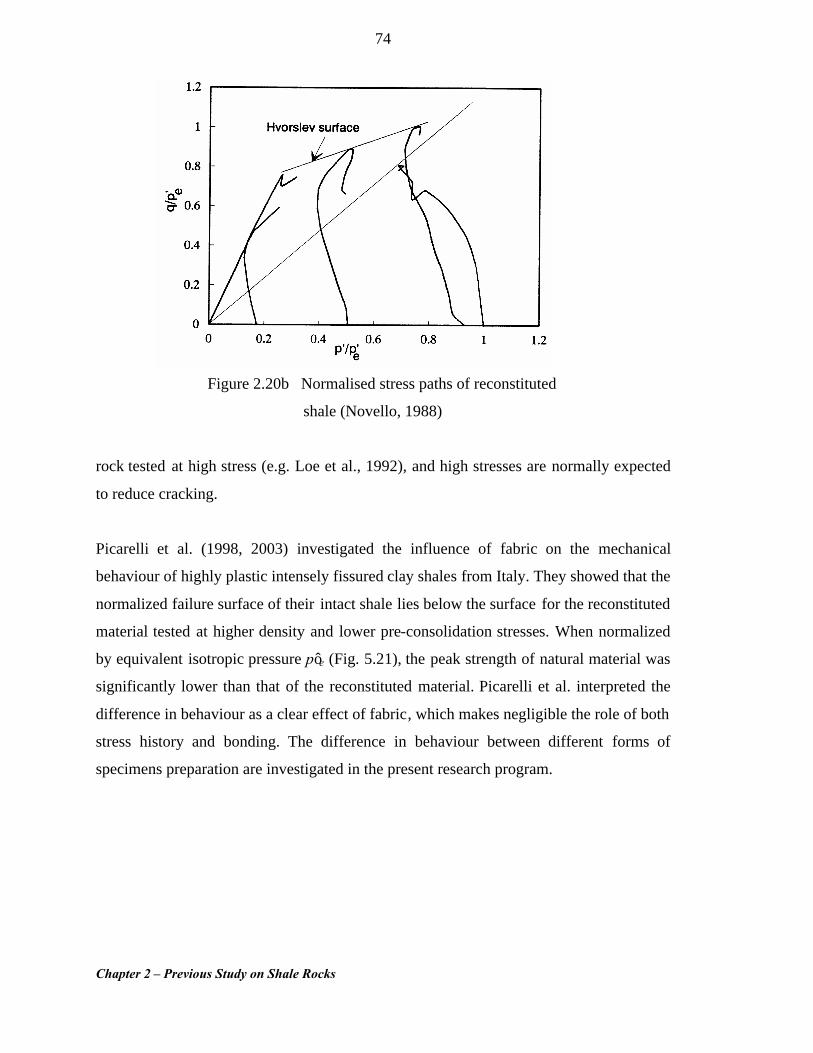
Chapter 2 – Previous Study on Shale Rocks
74
Figure 2.20b Normalised stress paths of reconstituted
shale (Novello, 1988)
rock tested at high stress (e.g. Loe et al., 1992), and high stresses are normally expected
to reduce cracking.
Picarelli et al. (1998, 2003) investigated the influence of fabric on the mechanical
behaviour of highly plastic intensely fissured clay shales from Italy. They showed that the
normalized failure surface of their intact shale lies below the surface for the reconstituted
material tested at higher density and lower pre-consolidation stresses. When normalized
by equivalent isotropic pressure p’e (Fig. 5.21), the peak strength of natural material was
significantly lower than that of the reconstituted material. Picarelli et al. interpreted the
difference in behaviour as a clear effect of fabric, which makes negligible the role of both
stress history and bonding. The difference in behaviour between different forms of
specimens preparation are investigated in the present research program.
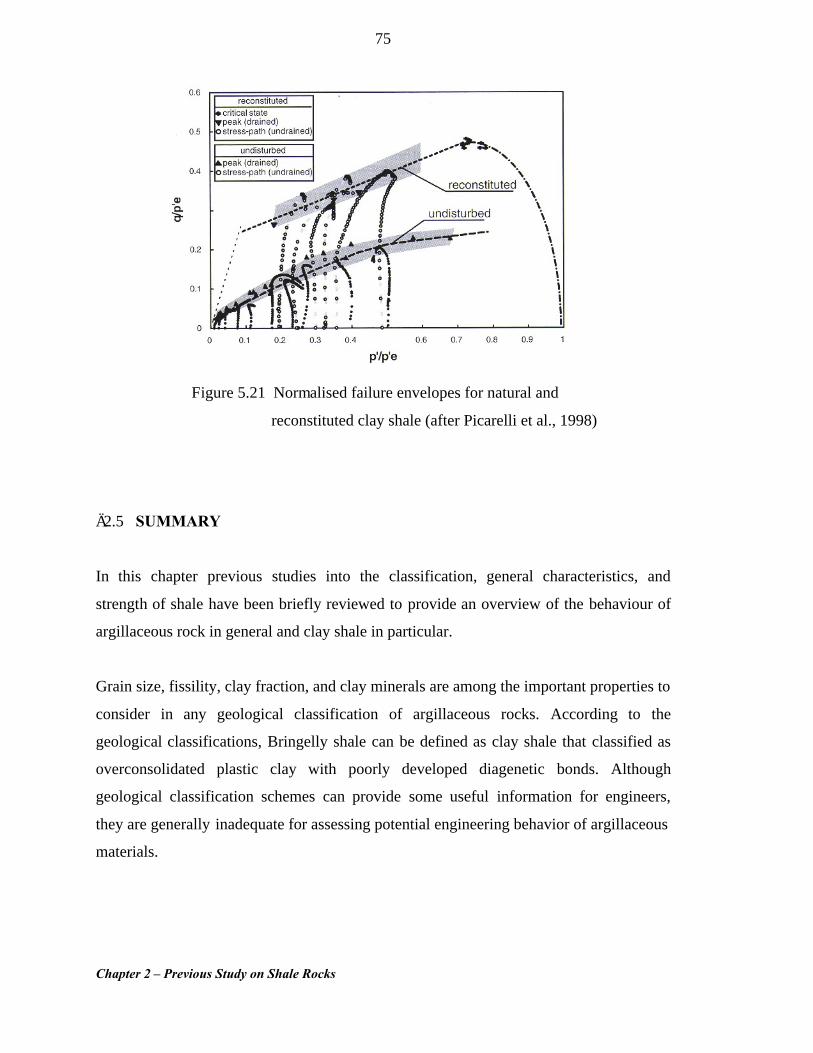
Chapter 2 – Previous Study on Shale Rocks
75
Figure 5.21 Normalised failure envelopes for natural and
reconstituted clay shale (after Picarelli et al., 1998)
§2.5 SUMMARY
In this chapter previous studies into the classification, general characteristics, and
strength of shale have been briefly reviewed to provide an overview of the behaviour of
argillaceous rock in general and clay shale in particular.
Grain size, fissility, clay fraction, and clay minerals are among the important properties to
consider in any geological classification of argillaceous rocks. According to the
geological classifications, Bringelly shale can be defined as clay shale that classified as
overconsolidated plastic clay with poorly developed diagenetic bonds. Although
geological classification schemes can provide some useful information for engineers,
they are generally inadequate for assessing potential engineering behavior of argillaceous
materials.
Chapter 2 – Previous Study on Shale Rocks
76
The objective of an engineering classification scheme is to categorize geological
materials according to their potential engineering behaviour. In this regard, an
engineering classification is often oriented toward specific applications. This tends to
cause some confusion among investigators when schemes employed for one application
are considered valid for all applications. Classification of argillaceous materials for
engineering purposes has been particularly difficult. Many of these difficulties have
resulted because of the transitional nature between soil and rock. In addition, few
engineering classification schemes account for the potential changes in material behavior
which can occur in a relatively short time in many of these deposits
Extensive efforts have been conducted by many researchers in an attempt to characterize
the engineering properties of swelling shale. The rate of swelling has been found to be
controlled by (i) hydraulic diffusion, i.e. flow of water from outside to the intermatrix
pores according to the hydraulic gradient, and (ii) chemical diffusion-swelling. The
chemical diffusion-swelling process includes ion diffusion, osmotic movement of water
into double layers and water adsorption to clay minerals.
It was found that the shale deterioration and loss of its natural induration as a result of
weathering upon exposure to wetting and drying cycles is by itself a major engineering
problem. More important, however, is the fact that none of these durability tests measure
the relative reduction of shear strength that occurs as these materials undergo
deterioration in the field. Although wet and dry tests do measure the important tendency
of a material to degrade, they do not necessarily measure the relative reduction of
strength due to degradation.
A wide range of index properties have been reported for different types of shale. In
general unconfined compressive strength and point load test results are based on test
condition and the size of specimen. The point load test has been shown to be useful for
weak, unsaturated, and brittle rocks that are typical of shale. For correlations of sI to
UCS , a material-specific correlation factor should be used. However, the merit of these
Chapter 2 – Previous Study on Shale Rocks
77
findings is limited by the fact that the effect of mineralogy and cementation have not
been independently investigated.
The major difficulties in assessing and predicting the engineering behaviour of clay
shales can be attributed to several factors among which the transitional behaviour of shale
between rock and soil, changes in the strength over a short period of time, and the role of
their geological history are important. The factors that control the magnitude and time
frame of these changes are not well understood. Evidence suggests that the presence of
expandable clay minerals and microcracks, and the fabric play a very important part in
the rapid loss of strength in clay shales. However, the geotechnical literature is
surprisingly devoid of systematic studies concerned with theoretical or experimental
aspects of swelling and fabric in the deterioration of the structural integrity of clay shales.
It appears that clay shale tends to deviate slightly from the critical state behaviour. This
has been attributed to structural and diagenetic changes. The effects of these factors on
the mechanical behaviour of clay shale are not fully understood. Further experimental
work is required including consideration of other parameters such as the influence of
degree of alignment of clay particles on reducing the strength and stiffness of clay shale
and the role of saturation in influencing the strength and / or stiffness of these materials.
The review of data from Wianamatta shale is based on limited theoretical and
experimental results. It is often assumed that the two shale members of the Wianamatta
group are similar in their physical and mechanical behaviour. However, differences in
mineralogy and core recovery between Bringelly and Ashfield shales have been noted, as
well as a paucity of engineering data for the Bringelly shale. Thus, the current state of
research on the engineering performance of Bringelly shale is still far from complete , and
there are still many uncertainties that need to be addressed by more reliable experimental
data.

Chapter 2 – Previous Study on Shale Rocks
78
END OF CHAPTER 2

Chapter 2 – Previous Study on Shale Rocks
79
Related Documents