Chapter 2 Land Real Property Assessment Guidelines Page 1 Contents Overview of the Land Valuation Process 6 Role of the Assessing Official 6 Representative Parcels 6 Representative Disclosure Statements 7 Land Value Ratio 7 Neighborhoods 7 Maps 8 Base Rates and Base Lots 8 Maximum Allowable Percentage Variance 8 Influence Factors 9 Establishing Land Value Maps 9 Evaluating Sales Information 12 Selecting Unit Values Used for Land Valuation 13 Valuing Improved Vacant Platted Lots 16 Assessment of Rights-of-Way to Adjacent Property Holder 16 Providing General Information on Property Record Card 17 Task 1- Recording Identification and Classification Data 17 Task 2-Recording the Site Characteristics 23 Valuing Platted Lots 24 Establishing Base Rates for Platted Lots 25 Establishing the Effective Frontage and Depth of Platted Lots 27 Determining Depth Factors for Platted Lots 38 Determining Influence Factors for Platted Lots 43 Completing the Land Data and Computations Section of the Property Record Card for Platted Lots 45 Task 1-Recording the Necessary Data 45 Task 2-Calculating the Land Value 50

Welcome message from author
This document is posted to help you gain knowledge. Please leave a comment to let me know what you think about it! Share it to your friends and learn new things together.
Transcript

Chapter 2 Land
Real Property Assessment Guidelines Page 1
Contents
Overview of the Land Valuation Process 6
Role of the Assessing Official 6
Representative Parcels 6
Representative Disclosure Statements 7
Land Value Ratio 7
Neighborhoods 7
Maps 8
Base Rates and Base Lots 8
Maximum Allowable Percentage Variance 8
Influence Factors 9
Establishing Land Value Maps 9
Evaluating Sales Information 12
Selecting Unit Values Used for Land Valuation 13
Valuing Improved Vacant Platted Lots 16
Assessment of Rights-of-Way to Adjacent
Property Holder 16
Providing General Information on Property
Record Card 17
Task 1- Recording Identification and
Classification Data 17
Task 2-Recording the Site
Characteristics 23
Valuing Platted Lots 24
Establishing Base Rates for Platted Lots 25
Establishing the Effective Frontage and Depth
of Platted Lots 27
Determining Depth Factors for Platted Lots 38
Determining Influence Factors for Platted Lots 43
Completing the Land Data and Computations
Section of the Property Record Card for
Platted Lots 45
Task 1-Recording the Necessary Data 45
Task 2-Calculating the Land Value 50

Chapter 2 Land
Real Property Assessment Guidelines Page 2
Valuing Residential Acreage and
Agricultural Homesites 53
Valuing Residential Acreage Parcels Larger
Than One Acre 54
Valuing Residential Acreage Parcels One Acre
or Smaller 55
Valuing Residential Acreage Tracts Using the
Front Foot Method 55
Establishing Base Rates for Residential Acreage
Tracts 55
Determining Size Adjustment Factors for
Acreage 56
Determining Influence Factors for Residential
Acreage 57
Completing the Land Data and Computations
Section of Property Record Card for
Residential Acreage 59
Task 1-Recording the Necessary Data 59
Task 2-Calculating the Land Value 63
Valuing Commercial and Industrial Acreage 65
Understanding Commercial and Industrial Land
Categories 65
Establishing Use Classes for Commercial and
Industrial Properties 67
Determining the Building Density Ratio 67
Establishing Base Rates for Commercial and
Industrial Land 69
Determining Influence Factors for Commercial
and Industrial Land 70
Completing the Land Data and Computations
Portion of Property Record Card for
Commercial and Industrial Acreage 71
Task 1-Recording the Necessary Data 71
Task 2-Calculating the True Tax Value 75
Valuing Agricultural Land 76
Agricultural Land Base Rate 77
Assessing Agricultural Land 78

Chapter 2 Land
Real Property Assessment Guidelines Page 3
Converting Units of Measurement for
Agricultural Land 84
Classifying Agricultural Land into Use Types 85
Using Soil Maps 93
Soil Series 93
Soil Map Units 94
Soil Complexes 94
Understanding the Calculation of the Soil
Productivity Index 95
Valuing Strip Mined Agricultural Land 96
Valuation of Oil and Gas Interests 96
Completing the Land Data and Computations
Section of Property Record Card for
Agricultural Acreage 96
Task 1-Determining the Land Value for
the Land areas 97
Task 2-Calculating the Total Farmland
acreage 101
Task 3-Calculating the Value of
Farmland 102
Task 4-Calculating the Value of
Classified Land 103
Task 5-Calculating the Total
Farmland/Classified Land Value 103
Task 6-Calculating the Land Value of
the Homesite(s) and Agriculture Excess
Acres 104
Completing the Valuation Record Section of
the Property Record Card 104
Tables
Table 2-1. Class Codes 19
Table 2-2. Subclass Codes 19
Table 2-3. Topography Options 23
Table 2-4. Street or Road Options 24
Table 2-5. Neighborhood Options 24
Chapter 2 Land
Real Property Assessment Guidelines Page 4
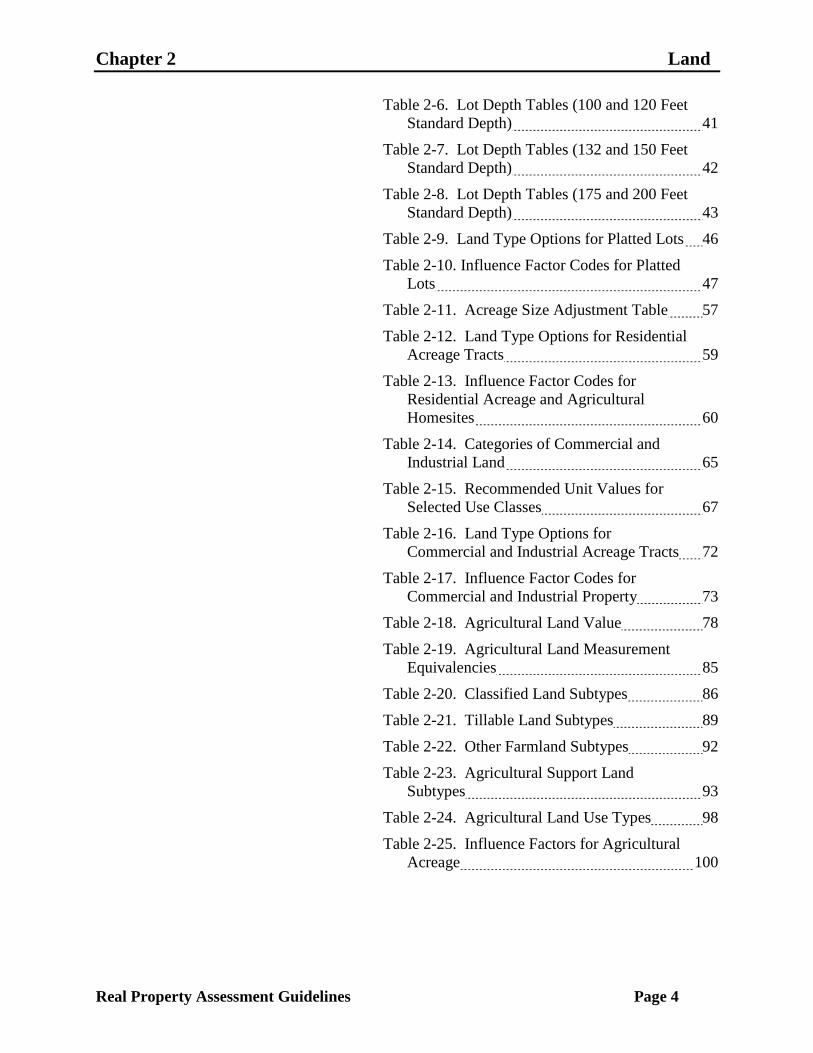
Table 2-6. Lot Depth Tables (100 and 120 Feet
Standard Depth) 41
Table 2-7. Lot Depth Tables (132 and 150 Feet
Standard Depth) 42
Table 2-8. Lot Depth Tables (175 and 200 Feet
Standard Depth) 43
Table 2-9. Land Type Options for Platted Lots 46
Table 2-10. Influence Factor Codes for Platted
Lots 47
Table 2-11. Acreage Size Adjustment Table 57
Table 2-12. Land Type Options for Residential
Acreage Tracts 59
Table 2-13. Influence Factor Codes for
Residential Acreage and Agricultural
Homesites 60
Table 2-14. Categories of Commercial and
Industrial Land 65
Table 2-15. Recommended Unit Values for
Selected Use Classes 67
Table 2-16. Land Type Options for
Commercial and Industrial Acreage Tracts 72
Table 2-17. Influence Factor Codes for
Commercial and Industrial Property 73
Table 2-18. Agricultural Land Value 78
Table 2-19. Agricultural Land Measurement
Equivalencies 85
Table 2-20. Classified Land Subtypes 86
Table 2-21. Tillable Land Subtypes 89
Table 2-22. Other Farmland Subtypes 92
Table 2-23. Agricultural Support Land
Subtypes 93
Table 2-24. Agricultural Land Use Types 98
Table 2-25. Influence Factors for Agricultural
Acreage 100

Chapter 2 Land
Real Property Assessment Guidelines Page 5
Figures
Figure 2-1. Example of a 100% Platted Lot 28
Figure 2-2. Example of a Type 2 Platted Lot 28
Figure 2-3. Example of a Type 3 Platted Lot 29
Figure 2-4. Example of a Type 4 Platted Lot 31
Figure 2-5. Example of a Type 5 Platted Lot 32
Figure 2-6. Example of a Type 6 Platted Lot 32
Figure 2-7. Example of a Type 7 Platted Lot 33
Figure 2-8. Example of a Type 8 Platted Lot 34
Figure 2-9. Example of a Type 9 Platted Lot 36
Figure 2-10. Example of a Type 10 Platted Lot 36
Figure 2-11. Example of a Type 11 Platted Lot 37
Figure 2-12. Example of a Type 12 Platted Lot 38
Figure 2-13. Dimensions of Example Lots 52
Figure 2-14. Example of Agricultural Land
Measurements 84
Figure 2-15 Valuation Record Section of the
Agricultural Property Record Card 105
Figure 2-16. Valuation Record Section of the
Residential Property Record Card 106
Figure 2-17. Valuation Record Section of the
Commercial and Industrial Property Record
Card 107
Figure 2-18. Area for Signing and Dating a
Property Record Card 108

Chapter 2 Land
Real Property Assessment Guidelines Page 6
Overview of the Land Valuation Process
This section describes how each type of land is valued. It discusses how the
assessing official determines base rates for the following types of land:
platted lots
residential acreage and agricultural homesites
commercial and industrial acreage.
In addition, this section describes how the assessing official applies the base rates
to determine the true tax land value for each of the types of land listed above, as
well as for agricultural acreage.
Role of the Assessing Official
The assessing official shall determine the value of all classes of residential land,
commercial land, industrial land, and agricultural homesite within his or her
jurisdiction. The established value of this land represents the March 1, 2011
market value of improved land.
The following list does not apply to this section:
(1) land assessed as land devoted to agricultural use under IC 6-1.1-4-13;
(2) land classified as forest land under IC 6-1.1-6;
(3) land classified as a windbreak under IC 6-1.1-6.2;
(4) land classified as wildlife habitat or riparian under IC 6-1.1-6.5;
(5) land classified as a filter strip under IC 6-1.1-6.7.
The following guidelines shall be followed in determining land valuations.
Representative Parcels
The assessing official must select a representative number of sales disclosure
statements filed under IC 6-1.1-5.5 or written estimations of a property value
provided by a licensed real estate professional that are based on relevant sales
data to justify the land value determination for each neighborhood. All sales
disclosure statements must be verified by:
(1) a visual inspection of the subject property; and
(2) a reasonable attempt to determine that the transaction was negotiated as an
arm‘s- length transaction.
All sales disclosure statements selected must be adjusted to exclude the value of
any personal property of significant value that was included in the disclosed sales
price. All sales disclosure statements selected involving property that is not
typical of the neighborhood must be adjusted to negate the affect the atypical
aspects of the property have on the disclosed sales price.

Chapter 2 Land
Real Property Assessment Guidelines Page 7
For the purposes of this section, a ―representative number‖ shall mean a number
that is no less than three percent (3%) of the total number of parcels within the
neighborhood established under the section headed ―neighborhood.‖
(1) a lesser percentage is truly representative of values in the neighborhood; or
(2) disclosure statements from a substantially similar neighborhood are truly
representative of values in the neighborhood.
Assessing officials should select disclosure statements or estimations of value
that, based on all relevant facts and evaluation of the neighborhood as a whole,
fairly represent the value of property in the neighborhood.
Representative Disclosure Statements
Representative disclosure statements selected for use must refer to a transaction,
or written estimations of value must refer to an estimation of value, that is dated
no more than eighteen (18) months prior or subsequent to March 1, 2011.
Valuation adjustments may be made based on the date of the disclosure statement
or estimations of value. Valuation adjustments should be made as is necessary to
approximate the value of the subject land on March 1, 2011.
Land Value Ratio
The assessing official must determine an appropriate land value ratio to be applied
to sales disclosure statements or estimations of value of improved properties. This
ratio must take into account factors that are critical to determination of the value
of the land. The ratio and factors must be included as part of the land value
determination. The factors should include, but not be limited to, such factors as:
(1) unimproved lot sale prices designated by property developers;
(2) the desirability due to physical features, such as waterfront property or
wooded lots;
(3) the desirability of the location due to external features, such as school district
or proximity to commercial developments; and
(4) consideration of the replacement cost of the improvement.
Neighborhoods
All property within a jurisdiction must be established as part of a neighborhood
defined by the assessing official. The assessing official shall define
neighborhoods according to:
(1) common development characteristics;
(2) the average age of the majority of improvements;
(3) the size of lots or tracts;
(4) subdivision plats and zoning maps;

Chapter 2 Land
Real Property Assessment Guidelines Page 8
(5) school and other taxing district boundaries;
(6) distinctive geographic boundaries;
(7) any manmade improvements that significantly disrupt the cohesion of adjacent
properties;
(8) sales statistics; and
(9) other characteristics deemed appropriate to assure equitable determinations.
Maps
All neighborhoods must be identified on easily read maps. The maps must be
numerically organized, clearly delineate the neighborhood boundary, show the
neighborhood established base rate and the code number. All neighborhoods shall
be assigned a code number for identification. A copy of the maps shall be readily
available for public inspection.
All property record cards must give the:
(1) number of the map on which the neighborhood that includes the subject
property is shown;
(2) neighborhood code number; and
(3) applicable base rate.
Base Rates and Base Lots
The assessing official shall establish a base rate for pricing each neighborhood.
Base rates should include a specifically stated value for water supply, sewage
disposal, and all other on-site development costs. Neighborhoods shall be
classified according to majority use as residential, agricultural homesite,
commercial, or industrial. The assessing official shall also establish a base lot to
represent the typical and average characteristics of lots in the neighborhood for
the purpose of making pricing adjustments.
Maximum Allowable Percentage Variance
The assessing official shall establish a maximum allowable percentage variance
between the base lot value for neighborhoods having the same classification and
substantially similar characteristics. The maximum allowable percentage variance
should not exceed twenty percent (20%). (If ranges are established, the maximum
allowable percentage variance should be applied to compare the two (2) highest
rates to each other and the two (2) lowest rates to each other.) If adjacent
neighborhoods located on opposite sides of a jurisdiction or county boundary:
(1) have the same classification and substantially similar characteristics; and
(2) the variance between the neighborhood base lot values is greater than the
maximum allowable percentage variance established by either jurisdiction;

Chapter 2 Land
Real Property Assessment Guidelines Page 9
For the purposes of this section, ―substantially similar characteristics‖ refers to
characteristics that are predominant in, and common to, each neighborhood, and
in all material respects are substantially similar in terms of:
(1) the size and shape of lots or tracts;
(2) the age and style of improvements;
(3) the condition and quality of improvements;
(4) zoning;
(5) the general use of improvements;
(6) development conditions;
(7) infrastructure components;
(8) geographic features;
(9) proximity to primary traffic routes;
(10) governmental services; and
(11) neighborhood desirability, as reflected by market values.
Influence Factors
In addition to the provisions of this chapter, the assessing official shall establish
detailed criteria relating to influence factors that may be applied to individual
parcels. The criteria relating to influence factors shall include:
(1) criteria for identifying and determining the existence of unique features that
are inconsistent with the norm for the neighborhood;
(2) specific conditions that will be considered as evidence that a parcel deserves
an influence factor;
(3) a method for evaluating whether a particular condition actually influences the
value of the parcel; and
(4) any factors, criteria, or conditions relating to influence factors that are
promulgated in a rule by the Department.
Establishing Land Value Maps
Each assessing official must obtain copies of maps pertaining to the various areas
of the jurisdiction. These maps must be plat maps or recorded plats that have
been reproduced from the county‘s plat mapping system. The maps are necessary
to indicate the developed portions of a jurisdiction. The maps should indicate the
outlines of the blocks, streets, roads, and alleys, and include the lots and their
dimensions. Some organizational ideas for planning the mapping obligation for
this function are:
In a smaller, less populated jurisdiction the number of maps necessary to
complete the task of compiling the land value maps could be relatively small. A
master jurisdiction map might be included with copies of separate plat map pages
for the areas of the jurisdiction which are considered more developed. These

Chapter 2 Land
Real Property Assessment Guidelines Page 10
developed areas could be a small town or a variety of different platted
subdivisions sprinkled throughout the jurisdiction.
In a medium sized jurisdiction the number of maps increases because the
mixture of developed properties increases. A general jurisdiction map would be
beneficial to use as an index location system, but the main working maps should
be reproduced using each section as the base. Each developed area of the section
would have a separate map of the area as recorded in the plat books.
In a large jurisdiction the map requirements would be limited to the parameters
of the existing county system. Normally, these jurisdictions have a sophisticated
system in place that identifies a specific portion of the jurisdictions by plat page.
The maps necessary to complete the land value map obligation would be at the
plat page level.
Many assessing officials begin the land valuation process by first recording the
current values on the working copy of the maps. This process develops a picture
of the values and their current neighborhood boundaries. These neighborhood
boundaries may change as the assessing official analyzes the changing
characteristics of established neighborhoods and identifies the developing areas
within the jurisdiction. Preliminary neighborhood boundaries may be sketched
onto the working boundaries at this time to reflect the assessing official‘s initial
impression of the values within the jurisdiction.
The assessing official can begin the task of analyzing sales information to
determine the market value of the land as of March 1, 2011. Sales information of
individual properties is derived from sales disclosure forms. These forms are
filed with the county at the time a property exchanges hands and a copy for each
form has been retained for each transaction since July 1, 1997. The sales
disclosure forms should be organized and filed by property location and property
class. An analysis of the grouped sales as compared with their map location could
influence the assessing official to redraw the preliminary neighborhood
boundaries. The objective of this comparison is to refine each neighborhood into
a market value range for similar type properties. Each specific neighborhood
shall be identified on reproducible maps and have an assigned code number
unique to the area.
Once the sales have been grouped, an analysis of the neighborhood is made to
determine the land value ratio. This ratio is expressed as a percentage and
represents the amount of a sale attributable to the land. The mechanics for
determining this ratio are further explained under the Allocation Method in the
Section Evaluating Sales Information. It is advisable that the assessing official
start in the areas of the jurisdiction which are clearly of a greater value and
analyze the reasons why these values are higher. Once these reasons become
apparent, the assessing official can use the distinguishing features as a basis for
the further analysis of the entire jurisdiction. This process is necessary because
each designated neighborhood within the jurisdiction shall have a land value ratio.

Chapter 2 Land
Real Property Assessment Guidelines Page 11
A visual inspection and verification process is required on a representative sample
of properties included in each sales grouping. By reviewing the sales disclosures
for each neighborhood, the assessing official can select properties for inspection
that represent the typical property for the neighborhood. The sales transaction of
property should be free of any unique circumstances that would suggest the stated
purchase price is not representative of the neighborhood. The visual inspection is
necessary to make sure that the assessing official understands the physical aspects
of the property at the time of sale. A copy of the property record card, as of the
sale date, would serve as the best comparison method. If there are necessary
questions raised during the inspection, the assessing official should contact the
buyer of the property to ensure that the correct information is captured. The
visual inspection of the property also gives the assessing official the opportunity
to compare the characteristics of the subject neighborhood against the
characteristics of various other neighborhoods.
Each identified neighborhood shall have a representative sample of sales to
establish the land value. The representative sample is defined in this section as
three percent (3%) of the total number of parcels within the neighborhood. If the
number of sales disclosures for the neighborhood is less than the required three
percent (3%), the assessing official must contact a local licensed real estate
professional about providing a letter of opinion on the value of various parcels
located throughout the neighborhood as of March 1, 2011.
The most important issue to consider next is the assessing official‘s task of
establishing the market value for residential, commercial, industrial, and
agricultural homesite land as of March 1, 2011. The pricing method and base rate
are mathematical functions to arrive at this desired value. As a source of value
comparison between neighborhoods, the assessing official shall designate a base
lot for each specific neighborhood throughout the jurisdiction. The base lot
represents the typical and average characteristics of lots located within the
neighborhood. For a homogeneous neighborhood that contains only subdivided
lots of 60 x 132 , the designated base lot is 60 x 132 . The base lot for a
neighborhood comprised of agricultural parcels only is a one (1) acre homesite.
A maximum value variance between substantially similar neighborhoods with the
same classification shall not exceed twenty percent (20%). The assessing official
shall establish a maximum allowable variance of twenty percent (20%) or less.
Sales disclosure documents and real estate broker‘s letters of opinion can next be
analyzed to determine the actual value of the subject neighborhoods. By applying
the established land value ratio to the sales information, the assessing official can
determine the amount of sale attributable to land. The value for each sale is
compared against the remaining neighborhood sales to determine the appropriate
value for the neighborhood. As this comparison is performed for each
neighborhood, a final analysis of the neighborhood boundaries is warranted to
ensure that the boundaries are correct on each map.

Chapter 2 Land
Real Property Assessment Guidelines Page 12
With the neighborhood boundaries finalized and the maps completed with the
recorded values, the assessing official can begin the task of calculating the base
rates applicable to each neighborhood.
Evaluating Sales Information
When establishing land values throughout the jurisdiction, each assessing official
shall evaluate sales information by using the sales comparison method, the
abstraction method, or the allocation method. Each method is described below.
The sales comparison method is one of the most reliable methods of estimating
land value. Under this method, the sale prices of similar properties are compared.
The greater the number of sales, the more reliable the results. Sales prices might
require adjustment to account for differences in the properties compared. Sale
prices may be adjusted by a percentage or a specific dollar amount basis. The
assessing official should research every market area and base adjustments on
measurable market differences in properties. Examples of the adjustment process
using the sales comparison method are provided below.
Example 1: A vacant parcel sold for $10,200 in early 2009. The parcel slopes
sharply from the street. The developer of the subdivision reports that the parcel
sold at a discount of $3,000 to cover the cost of correcting the problem. To make
the sale representative of other vacant land in the area, add the amount of the
discount to the sales price ($10,200 + $3,000 = $13,200). The cost of the discount
added to the land selling price is equal to the true land value.
Example 2: A vacant parcel sold for $10,000 on contract. Information obtained
from the real estate broker indicates that the buyer was related to the developer
and obtained a 15% discount on the sale. The value of the unimproved lot is 85%
of the adjusted sale price. To adjust for the discount, find the sale price without
the discount ($10,000 ÷ .85 = $11,765). The cost to improve the land is added to
the vacant land price to equal an improved land value.
The abstraction method is used to determine the indicated value of residential
land if the sample of vacant land sales is insufficient for a geographic area. This
method of estimating land value is most reliable when a minimum amount of
depreciation has occurred on the improvements. The value of land is determined
by subtracting the depreciated value of the improvements from the sales price.
The result indicates the contribution of the land value to the total sale. An
example of the abstraction method is provided below.
Example 3: A residential property sold for $59,500 in January 2009. If the
depreciated value of the structures equals $50,300, the indicated value of the
improved land is $9,200 ($59,500 - $50,300 = $9,200).
The allocation or percentage of sale method is used to determine the indicated
value of land if the sample of sales for a neighborhood represents improved

Chapter 2 Land
Real Property Assessment Guidelines Page 13
properties. This method of estimating land values depends on an analysis of the
various neighborhoods to determine the percentage contribution of land to the
total sale.
Compare the sale price of vacant land to the sale price of the improved parcels
within a homogeneous neighborhood. The resulting ratio is equal to the allocation
percentage of sale for the neighborhood. However, before the comparison can be
made, adjust the vacant lot sale upward to account for improvements such as
utility hook-ups, landscaping, residential driveways, and private walkways. This
adjustment is necessary because these appurtenances to the land are valued with
the land. Also, the amount of improvement can be expressed as a percentage of
the total land value. In the following example, the amount is expressed as a whole
dollar development cost.
Example 4: Suppose a vacant land sale for neighborhood #501 is $20,000 and
the applicable development costs are $5,000 in January, 2009. Determine an
estimate of the applicable percentage ratio by comparing the $25,000 developed
land value to the recent neighborhood #501 sale prices of improved properties.
For example, if improved properties are selling for $125,000 to $135,000, the
estimated percentage of sale range for neighborhood #501 is 18.5% to 20%. The
value of a standard lot in neighborhood #501 would be estimated at $25,000. If a
neighborhood has no vacant parcels to help determine a developed lot value, the
assessing official must begin the process of comparing the subject neighborhood
to neighborhoods where the percentage of sale is known. Comparable
neighborhoods consist of neighborhoods with similar sale prices and
neighborhood characteristics. Once a comparable neighborhood has been
established, the percentage of sale ratio is multiplied against the selling prices of
the improved parcels to arrive at an estimated land value for the subject
neighborhood.
Selecting Unit Values Used for Land Valuation
Unit values or base rates are units of measurement used in the assessment
calculation process. The assessing official determines which of the following five
types of unit values, described in the sections below, are appropriate for valuing
the different types of land in the jurisdiction:
front foot value
square foot value
acreage value
site value
unit density
The size, dimensional data available on tax maps or plat maps, methods of
comparison used by the typical buyer and seller, and the ease of application
should determine the selection of the most applicable pricing method for the
neighborhood. It should be stressed that the pricing method for valuing the

Chapter 2 Land
Real Property Assessment Guidelines Page 14
neighborhood is of less importance than arriving at the correct value of the land as
of the valuation date.
Front Foot Value
Front foot value is a whole dollar amount applied to the most desirable frontage of
a parcel. For commercial property in a downtown area, front footage along the
main street is of primary importance. For a residential parcel in a platted
subdivision, front footage along the street is of primary importance. In both cases,
the front foot method is appropriate because the front footage of the parcel has the
greatest influence on the land‘s value. Front foot value is the appropriate method
when the selling price of similar properties, divided by the amount of frontage is
similar. The following example illustrates the relationship between front foot
value and selling price.
Example: Parcel A has 100 feet of frontage on Main Street and Parcel B has
50 feet of frontage on Main Street. Both parcels have the same depth. Parcel A
sold for $12,000. Parcel B sold for $6,000. To calculate the base rate, divide the
sale price of the parcel by the frontage feet:
Parcel A $12,000 ÷ 100 = $120
Parcel B $6,000 ÷ 50 = $120
In both cases, the selling price divided by the number of frontage feet equals $120
per front foot. Because the same base rate is obtained on both properties, the
assessing official determines that the front foot method is the appropriate land
valuation method for these properties.
Square Foot Value
Square foot value is a value applied to each individual square foot of a parcel. The
square foot method is used when the selling price divided by the area in square
feet for similar properties is similar. The following example illustrates how to use
the selling price to determine square foot value.
Example: Parcels C and D both have 100 feet of frontage on Oak Street. Parcel
C is 200 feet deep, has an area of 20,000 square feet, and sold for $10,000. Parcel
D is 100 feet deep, has an area of 10,000 square feet and sold for $5,000.
Calculate the square foot value by dividing the sale price of the parcel by the area
of the parcel in square feet:
Parcel C $10,000 ÷ 20,000 = $0.50
Parcel D $5,000 ÷ 10,000 = $0.50
Because the same base rate ($0.50 per square foot) is obtained for both properties,
the assessing official determines that the square foot method is the appropriate
method for these properties. The front foot value method is not appropriate
because the front foot value method produces a front foot value for Parcel C that
is twice the front foot value for Parcel D.

Chapter 2 Land
Real Property Assessment Guidelines Page 15
Acreage Value
The acreage value method is appropriate where a particular use requires a large
amount of land. The most frequent uses of the acreage value method are for:
agricultural homesites
rural residential homesites
rural residential excess acreage
commercial and industrial land
irregularly shaped platted lots that are too cumbersome to size.
Site Value
The site value method is applied when characteristics peculiar to a particular
parcel distort the value determined using other methods. This value distortion is
normally attributed to the parcel‘s shape or size. The following example illustrates
the use of the site value method.
Example: In a neighborhood the standard lot is 50 feet by 120 feet, with a
calculated front foot price of $100. The typical lot sells for $5,000. However,
Lot #20 is an irregularly shaped lot with dimensions that make it extremely
difficult to determine lot size and price. The value estimate for Lot #20 is similar
to all other lots in the area, so the site value estimate is recorded at a flat rate of
$5,000. In this example the $5,000 site value is equivalent to the base lot value,
indicating that in the assessing official‘s judgment the irregularity of the subject‘s
shape neither enhances nor detracts from the value of the subject in respect to the
base lot value.
Suppose that the irregularity of the subject‘s shape enhanced the value of the
subject by 10%. The resulting true tax value for the subject is $5,500 ($5,000 +
10%).
Suppose that the irregularity of the subject‘s shape decreased the value of the
subject by 10%. However, the decrement was off-set by the subject‘s premium
location. In this instance the base lot value of the subject neighborhood decreased.
The resulting true tax value for the subject lot is $5,000 ($5,000 = 10% - 10%).
Note: In all cases the starting point is the base lot value of the subject
neighborhood, and the treatment of that value as an ―estimated value‖.
Unit Density
Unit density is a value applied to the number of units which can be constructed on
a site. It is used when the market indicates that a site is sold on a unit basis, such
as an apartment property where the unit of comparison is sale price per buildable
apartment.

Chapter 2 Land
Real Property Assessment Guidelines Page 16
Valuing Improved Vacant Platted Lots
Platted lots are valued on the basis of improvements made to them. Improvements
to the land include, but are not limited to, the cost of:
a water well
a septic system
connecting a structure into a public water and sewage system
landscaping
private walkways and residential driveways
The assessing official must survey the jurisdiction to determine the costs of these
improvements for each neighborhood as of March 1, 2011. The cost attributable
to a water and sewage system should represent depreciated costs of not less than
50% of the total installation cost of each component.
The improved land value estimate represents the cost of vacant land, plus the
depreciated cost of a water well and septic system or public utility hook-up fees
plus any costs, such as landscaping and private walkways and residential
driveways incurred to make the parcel suitable for building. An example of
estimating the land value for an individual land sale is provided below.
Example: An 80 feet by 150 feet commercial platted vacant lot was purchased
for $30,000. The water well and septic system cost for this particular area is
$5,500. The depreciated cost of the water well and septic system is calculated as:
(.80 x $5,500) $4,400. The assessor knows that the water well and septic system
are relatively new, so the 80% ratio is used. The landscaping cost associated with
the parcel is estimated to be $10,000. The cost of the vacant land plus the
depreciated cost of the water well and septic system and landscaping attributable
to the land equals the value of the improved vacant lot ($30,000 + $4,400 +
$10,000 = $44,400).
Assessment of Rights-of-Way to Adjacent Property Holder
Land may not be assessed to an adjacent property holder if it is:
occupied by, and is within the right-of-way of, a railroad, interurban, or street
railway
within the line of a levee constructed and maintained either by a levee
association or under any law of this state
used and occupied as part of a public drainage ditch, including land that:
is adjacent to the ditch
cannot be used for farmland or any other purpose because of a need for access
to the ditch
within a right-of-way that is used and occupied as a public highway.

Chapter 2 Land
Real Property Assessment Guidelines Page 17
If the land has not been transferred by deed to a person who holds the land for
railroad, interurban, street railway, levee, drainage, or public highway purposes,
the land is assessed to the adjacent property owner. However, the assessed value
of the land so assessed is deducted from the assessed value of the land assessed to
the adjacent property owner. If an assessing official and a landowner fail to agree
on the amount of land assessed, the county surveyor must survey the land in
question.
Providing General Information on the Property
Record Card
Before you provide the information and perform the calculations necessary to
value a property, you need to identify the parcel and provide general information
about it. The front of the residential, agricultural, and commercial and industrial
Property Record Cards provide specific areas for recording information about the
parcel‘s:
identity
location
classification
ownership
site characteristics
The steps for recording this information are grouped into the following tasks,
described in the sections below:
Task 1—Record identification and classification data for the parcel.
Task 2—Record the site characteristics of the parcel.
Task 1—Recording Identification and Classification Data
To record identification and classification data for the parcel, perform these steps:
Step 1 In the ―Parcel number‖ cell, enter the parcel number used for taxation
purposes.
Step 2 In the ―County‖ cell, enter the county number where the parcel is located.
Step 3 In the ―Jurisdiction‖ cell, enter the Department of Local Government
Finance‘s assigned number for the jurisdiction where the parcel is located.
Step 4 If the parcel is located in a corporation, enter the Department of Local
Government Finance‘s assigned number for the corporation in the
―Corporation‖ cell.

Chapter 2 Land
Real Property Assessment Guidelines Page 18
Step 5 In the ―district cell, enter the Department of Local Government Finance‘s
assigned taxing district number for the location of the subject parcel.
Step 6 In the ―Section and Plat‖ cell, enter the county code that represents the
specific mapped area of the district where the parcel is located. Letters or
numbers may be used.
Step 7 In the ―Routing Number‖ cell, enter the assigned number that matches the
parcel‘s location on a specific map. This number facilitates field
inspection.
Note: If there is more than one property card for the parcel, enter the same
routing number on each card.
Step 8 In the ―Neighborhood Code Number‖ cell, enter the code number assigned
by the jurisdiction assessor to the parcel‘s location.
Step 9 ―Property Class‖ is an index to identify the class of property for each
individual parcel. Enter a one-digit code for the general property class,
and a two-digit suffix code for the subclass.
The basis for classification is the predominant current use. All contiguous parcels
associated with the main use designation should be coded with the same property
subclass codes.
Example: A parcel used for a bank parking lot should have the same property
class code of 444 as the parcel containing the bank building. All associated parcel
numbers should be listed in a computer accessible memorandum section of the
Property Record Card for the main or highest valued parcel. The parcel number of
the main or highest valued parcel should likewise be identified on each of the
associated parcels. If a parcel is unused, the basis for classification depends on
the anticipated use or the use for which the parcel is zoned. When entering the
general property class, note that the property class applies to the entire parcel.
Therefore, for multiple card parcels, it is necessary to enter the class only on the
card numbered ―001‖.
Table 2-1 shows the general property class codes. Table 2-2 shows the two-digit
subclass codes that fall within each property class.
Property Class Codes
The following table shows the general property class codes. The second table
shows the two-digit subclass codes that fall within each property class.

Chapter 2 Land
Real Property Assessment Guidelines Page 19
Table 2-1. Class Codes
This option Indicates
1 Agricultural taxable land and improvements used primarily for
agricultural purposes
2 The legal description is being valued for severed mineral rights at
a flat value of sixty dollars ($60) per acre
3 Industrial taxable land and improvements used primarily for
manufacturing, processing, or refining foods and materials
4 Commercial taxable land and improvements used for general
commercial and recreational purposes
5 Residential taxable land and improvements used primarily for
residential purposes
6 Exempt property
8 Taxable land and improvements owned by a public utility
company
Table 2-2. Subclass Codes
Class Code 1 Agricultural taxable land and improvements used primarily for agricultural purposes
00 Vacant land
01 Cash grain/general
farm
02 Livestock other than
dairy and poultry
03 Dairy farm
04 Poultry farm
05 Fruit & nut farm
06 Vegetable farm
07 Tobacco farm
08 Nursery
09 Greenhouses
10 Hog farm
11 Beef farm
20 Timber
98 Structure on leased
land
99 Other agricultural
use
Class Code 2 The legal description is being valued for severed mineral rights at a flat value of sixty dollars ($60) per acre
00 Severed mineral
rights
Class Code 3 Industrial taxable land and improvements used primarily for manufacturing, processing, or refining foods and materials
00 Vacant land
10 Food and drink
processing facility
20 Foundries and heavy
manufacturing
30 Medium
manufacturing and
assembly
40 Light manufacturing
and assembly
45 Industrial office
46 Research and
development facility
50 Industrial warehouse
60 Industrial truck
terminal
70 Small shop
80 Mine or quarry
85 Landfill
90 Grain elevator
98 Structure on leased
land
99 Other industrial
structure

Chapter 2 Land
Real Property Assessment Guidelines Page 20
Class Code 4 Commercial taxable land and improvements used for general commercial and recreational purposes
00 Vacant land
01 4 to 19 family
apartments
02 20 to 39 family
apartments
03 40 or more family
apartments
10 Motel or tourist
cabins
11 Hotel
12 Nursing home and
private hospital
15 Mobile home park
16 Commercial camp
ground
19 Other commercial
housing
20 Small detached
retail of less than 10,000
square feet
21 Supermarket
22 Discount and junior
department store
24 Full line department
store
25 Neighborhood
shopping center (Strip
center)
26 Community
shopping center
27 Regional shopping
center
28 Convenience market
29 Other retail
structures
30 Restaurant,
cafeteria, or bar
31 Franchise-type
restaurant
35 Drive-in restaurant
39 Other food service
40 Dry clean plant or
laundry
41 Funeral home
42 Medical clinic or
offices
43 Drive-up/walk-up
bank only
44 Full service banks
45 Savings and loans
47 Office building (1 or
2 story)
48 Office building
(3 stories or more,
walkup)
49 Office building
(3 stories or more,
elevator)
50 Convenience market
with gasoline sales
51 Convenience market
/ franchise-type
restaurant with gasoline
sales
52 Service station
53 Car wash
54 Auto sales and
service
55 Commercial garage
56 Parking lot or
structure
60 Theater
61 Drive-in theater
62 Golf range or
miniature course
63 Golf course or
country club
64 Bowling alley
65 Lodge hall
66 Amusement park
67 Health club
68 Ice rink
69 Riverboat gaming
resort
80 Commercial
warehouse
81 Commercial
mini-warehouse
82 Commercial truck
terminal
90 Marine service
facility
95 Marina
98 Structure on leased
land
99 Other commercial
structures
Class Code 5 Residential taxable land and improvements used primarily for residential purposes
00 Vacant platted lot
01 Vacant unplatted
land of 0 to 9.99 acres
02 Vacant unplatted
land of 10 to 19.99 acres
03 Vacant unplatted
land of 20 to 29.99 acres
04 Vacant unplatted
land of 30 to 39.99 acres
05 Vacant unplatted
land of 40 or more acres
10 One family dwelling
on a platted lot
15 One family dwelling
on unplatted land of 40
or more acres
20 Two family
dwelling on a platted lot
21 Two family
dwelling on unplatted
land of 0 to 9.99 acres
22 Two family
dwelling on unplatted
land of 10 to 19.99 acres
23 Two family
dwelling on unplatted
land of 20 to 29.99 acres
32 Three family
dwelling on unplatted
land of 10 to 19.99 acres
33 Three family
dwelling on unplatted
land of 20 to 29.99 acres
34 Three family
dwelling on unplatted
land of 30 to 39.99 acres
35 Three family
dwelling on unplatted
land of 40 or more acres
40 Mobile or
manufactured home on a
platted lot
44 Mobile or
manufactured home on
unplatted land of 30 to
39.99 acres
45 Mobile or
manufactured home on
unplatted land of 40 or
more acres
50 Condominium unit
on a platted lot
51 Condominium unit
on unplatted land of 0 to
9.99 acres
52 Condominium unit
on unplatted land of 10
to 19.99 acres
Continued on next page

Chapter 2 Land
Real Property Assessment Guidelines Page 21
Class Code 5 continued
11 One family dwelling
on unplatted land of 0 to
9.99 acres
12 One family dwelling
on unplatted land of 10
to 19.99 acres
13 One family dwelling
on unplatted land of 20
to 29.99 acres
14 One family dwelling
on unplatted land of 30
to 39.99 acres
24 Two family
dwelling on unplatted
land of 30 to 39.99 acres
25 Two family
dwelling on unplatted
land of 40 or more acres
30 Three family
dwelling on a platted lot
31 Three family
dwelling on unplatted
land of 0 to 9.99 acres
41 Mobile or
manufactured home on
unplatted land of 0 to
9.99 acres
42 Mobile or
manufactured home on
unplatted land of 10 to
19.99 acres
43 Mobile or
manufactured home on
unplatted land of 20 to
29.99 acres
53 Condominium unit
on unplatted land of 20
to 29.99 acres
54 Condominium unit
on unplatted land of 30
to 39.99 acres
55 Condominium unit
on unplatted land of 40
or more acres
56 Condominium
dwelling (row type)
57 Common area parcel
90 Annually assessed
mobile or manufactured
home on platted
property
91 Annually assessed
mobile or manufactured
home on unplatted land
98 Structure on leased
land
99 Other residential
structures
Class Code 6 Exempt property
00 Exempt property
owned by the United
States of America
10 Exempt property
owned by the State of
Indiana
20 Exempt property
owned by a county
30 Exempt property
owned by a jurisdiction
40 Exempt property
owned by a municipality
50 Exempt property
owned by a board of
education
60 Exempt property
owned by a park district
70 Exempt property
owned by a private
academy or college
80 Exempt property
owned by a charitable
organization that is
granted an exemption
85 Exempt property
owned by a religious
organization that is
granted an exemption
86 Church, chapel,
mosque, synagogue,
tabernacle, or temple
that is granted an
exemption
90 Exempt property
owned by a cemetery
organization that is
granted an exemption
99 Other exempt
property owned by an
organization that is
granted an exemption
Chapter 2 Land
Real Property Assessment Guidelines Page 22
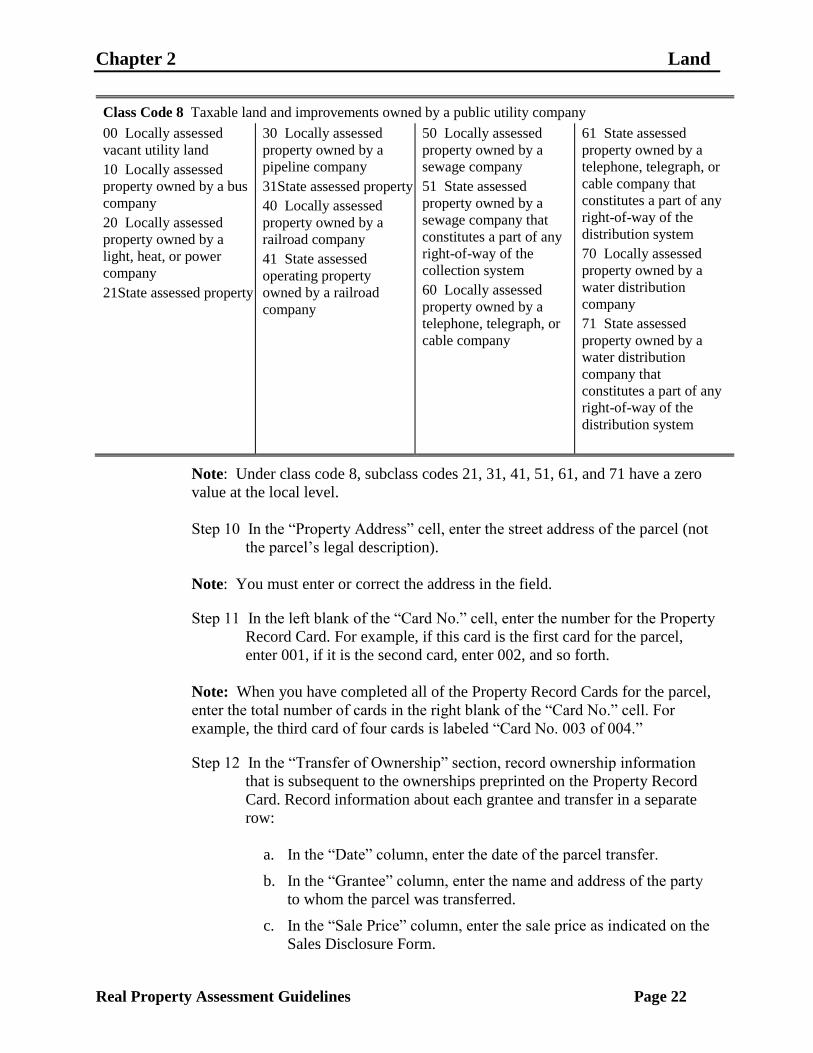
Class Code 8 Taxable land and improvements owned by a public utility company
00 Locally assessed
vacant utility land
10 Locally assessed
property owned by a bus
company
20 Locally assessed
property owned by a
light, heat, or power
company
21State assessed property owned by a light, heat, or power company that constitutes a part of any right-of-way of the light, heat, or power company
30 Locally assessed
property owned by a
pipeline company
31State assessed property owned by a pipeline company that constitutes a part of any right-of-way of the distribution system
40 Locally assessed
property owned by a
railroad company
41 State assessed
operating property
owned by a railroad
company
50 Locally assessed
property owned by a
sewage company
51 State assessed
property owned by a
sewage company that
constitutes a part of any
right-of-way of the
collection system
60 Locally assessed
property owned by a
telephone, telegraph, or
cable company
61 State assessed
property owned by a
telephone, telegraph, or
cable company that
constitutes a part of any
right-of-way of the
distribution system
70 Locally assessed
property owned by a
water distribution
company
71 State assessed
property owned by a
water distribution
company that
constitutes a part of any
right-of-way of the
distribution system
Note: Under class code 8, subclass codes 21, 31, 41, 51, 61, and 71 have a zero
value at the local level.
Step 10 In the ―Property Address‖ cell, enter the street address of the parcel (not
the parcel‘s legal description).
Note: You must enter or correct the address in the field.
Step 11 In the left blank of the ―Card No.‖ cell, enter the number for the Property
Record Card. For example, if this card is the first card for the parcel,
enter 001, if it is the second card, enter 002, and so forth.
Note: When you have completed all of the Property Record Cards for the parcel,
enter the total number of cards in the right blank of the ―Card No.‖ cell. For
example, the third card of four cards is labeled ―Card No. 003 of 004.‖
Step 12 In the ―Transfer of Ownership‖ section, record ownership information
that is subsequent to the ownerships preprinted on the Property Record
Card. Record information about each grantee and transfer in a separate
row:
a. In the ―Date‖ column, enter the date of the parcel transfer.
b. In the ―Grantee‖ column, enter the name and address of the party
to whom the parcel was transferred.
c. In the ―Sale Price‖ column, enter the sale price as indicated on the
Sales Disclosure Form.

Chapter 2 Land
Real Property Assessment Guidelines Page 23
d. In the ―Owner Occupied‖ column, on the agricultural or residential
property record card, place a check in the ―Yes‖ box if owner
occupied, or place a check in the ―No‖ box if not owner occupied.
Task 2—Recording the Site Characteristics
To record the parcel‘s general site characteristics, perform these steps:
Step 1 In the ―Topography‖ section, place a check in the check boxes for the
terms that describe the terrain of the site in terms of its suitability for use.
Table 2-3 describes the topography options.
Table 2-3. Topography Options
This option Indicates a site
Level Approximately at street level and relatively flat.
Level and
High
Higher than street level, but relatively flat and
otherwise appearing suitable for use with minimal
extraordinary site preparation.
High Higher than street level and sloping enough to require
extraordinary site preparation. Undeveloped land
checked ―High‖ may require a value adjustment.
Improved land may require a value adjustment
depending on the extent to which the detriment to
value remains.
Low Lower than street level and sloping enough to require
extraordinary site preparation.
High and
Low
Exhibiting both ―High‖ and ―Low‖ characteristics.
Rolling With undulating terrain that may require extraordinary
site preparation, depending on the use of the site.
Swampy Subject to holding water and not readily drainable. If
this condition applies to a portion of the parcel, insert
―p‖ (for part) instead of a check, and place checks in
the check boxes that describe the rest of the site.
Step 2 In the ―Public Utilities‖ section, place a check in the check boxes for the
site services provided by public utility companies and governmental
jurisdictions, such as water, sewer, gas and electricity. Follow these
guidelines:
Place a check in the check boxes for each of the services provided,
whether or not the service is being used.
If all of the utilities are available, place a check in the ―All‖ check box
instead of checking the individual items.

Chapter 2 Land
Real Property Assessment Guidelines Page 24
Step 3 In the ―Street or Rd.‖ section, place a check in the check boxes for the
characteristics of the primary fronting street or road, or the street or road
that provides the most immediate access. Table 2-4 describes the street or
road options.
Table 2-4. Street or Road Options
This option Indicates
Paved A concrete, blacktop, or comparably improved street
or road
Unpaved A dirt or comparably unimproved street or road
Proposed A street or road does not exist, but is planned and
approved for the future
Sidewalk The parcel is served by a paved sidewalk available
for public use
Alley The parcel is served by an alley
Step 4 In the ―Neighborhood‖ section, place a check in the check box for the
option that best describes the life cycle stage most characteristic of the
neighborhood where the parcel is located. Table 2-5 describes the
neighborhood options.
Table 2-5. Neighborhood Options
This option Indicates
Improving A stage of development evidenced by increasing
desirability
Static A condition of equilibrium evidenced by little change
Declining A stage of disintegration evidenced by decreasing
desirability
Blighted A marked decline characterized by structural
deterioration and environmental deficiencies
Valuing Platted Lots
This section describes how to value platted lots. Before you can value platted lots,
you need to understand the following topics, which are addressed in this section:
how the assessing official establishes base rates for platted lots
how to establish the effective frontage and depth for a platted lot
how to determine the depth factor for a platted lot
how to determine any influence factors for a platted lot.

Chapter 2 Land
Real Property Assessment Guidelines Page 25
Establishing Base Rates for Platted Lots
Using the neighborhood information contained on the land value maps, the
assessing official calculates the indicated front foot values for each platted lot in a
neighborhood by performing the steps below:
Step 1 Determine the value of the lot from the analyzed information on the map.
Step 2 Determine the depth factor for the lot. Instructions are provided in the
section Determining Depth Factors for Platted Lots in this chapter.
Step 3 To determine the adjusted value, divide the value of the lot (determined in
Step 1) by the depth factor for the lot (determined in Step 2):
Adjusted value = Lot value ÷ Depth factor
Step 4 Determine the effective front footage of the lot. Instructions are provided
in the section Establishing the Effective Frontage and Depth of Platted
Lots in this chapter.
Step 5 To obtain the indicated front foot value for the lot, divide the adjusted
value (obtained in Step 3) by the effective front footage of the lot
(determined in Step 4):
Indicated front
foot value
= Adjusted value ÷ Effective front footage
The assessing official then uses the indicated front foot values calculated for the
lots in a neighborhood to determine the base rate per front foot for the area. The
following examples illustrate how to calculate and analyze indicated front foot
values. As you review these examples, keep in mind that the process of
determining front foot values and base rates often is not exact. It is exact only
when the selling price is known. By analyzing sales disclosure forms and
estimations of value from the neighborhood, the assessor can determine a 2011
land value estimate to use.
Example 1: Neighborhood #1 is platted with all lots measuring 60 feet by
120 feet. Since the standard depth for the area is 120 feet, the depth factor is 1.00.
The estimates from the sales data sheet indicate that the value for an improved lot
is approximately $6,000. The calculation for the indicated front foot value is:
$6,000 ÷ 1.00 = $6,000 ÷ 60 = $100.
Because all of the lots in this neighborhood are the same, the base rate in
Neighborhood #1 is $100 per front foot.
Chapter 2 Land
Real Property Assessment Guidelines Page 26
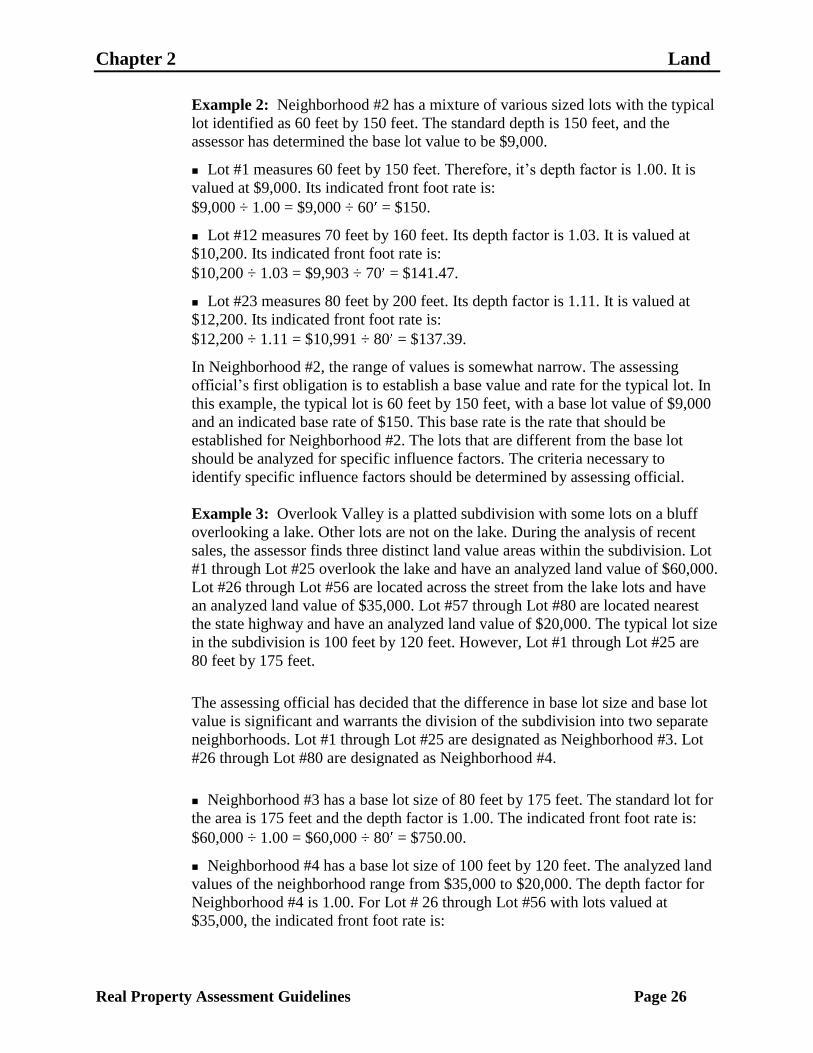
Example 2: Neighborhood #2 has a mixture of various sized lots with the typical
lot identified as 60 feet by 150 feet. The standard depth is 150 feet, and the
assessor has determined the base lot value to be $9,000.
Lot #1 measures 60 feet by 150 feet. Therefore, it‘s depth factor is 1.00. It is
valued at $9,000. Its indicated front foot rate is:
$9,000 ÷ 1.00 = $9,000 ÷ 60 = $150.
Lot #12 measures 70 feet by 160 feet. Its depth factor is 1.03. It is valued at
$10,200. Its indicated front foot rate is:
$10,200 ÷ 1.03 = $9,903 ÷ 70 = $141.47.
Lot #23 measures 80 feet by 200 feet. Its depth factor is 1.11. It is valued at
$12,200. Its indicated front foot rate is:
$12,200 ÷ 1.11 = $10,991 ÷ 80 = $137.39.
In Neighborhood #2, the range of values is somewhat narrow. The assessing
official‘s first obligation is to establish a base value and rate for the typical lot. In
this example, the typical lot is 60 feet by 150 feet, with a base lot value of $9,000
and an indicated base rate of $150. This base rate is the rate that should be
established for Neighborhood #2. The lots that are different from the base lot
should be analyzed for specific influence factors. The criteria necessary to
identify specific influence factors should be determined by assessing official.
Example 3: Overlook Valley is a platted subdivision with some lots on a bluff
overlooking a lake. Other lots are not on the lake. During the analysis of recent
sales, the assessor finds three distinct land value areas within the subdivision. Lot
#1 through Lot #25 overlook the lake and have an analyzed land value of $60,000.
Lot #26 through Lot #56 are located across the street from the lake lots and have
an analyzed land value of $35,000. Lot #57 through Lot #80 are located nearest
the state highway and have an analyzed land value of $20,000. The typical lot size
in the subdivision is 100 feet by 120 feet. However, Lot #1 through Lot #25 are
80 feet by 175 feet.
The assessing official has decided that the difference in base lot size and base lot
value is significant and warrants the division of the subdivision into two separate
neighborhoods. Lot #1 through Lot #25 are designated as Neighborhood #3. Lot
#26 through Lot #80 are designated as Neighborhood #4.
Neighborhood #3 has a base lot size of 80 feet by 175 feet. The standard lot for
the area is 175 feet and the depth factor is 1.00. The indicated front foot rate is:
$60,000 ÷ 1.00 = $60,000 ÷ 80 = $750.00.
Neighborhood #4 has a base lot size of 100 feet by 120 feet. The analyzed land
values of the neighborhood range from $35,000 to $20,000. The depth factor for
Neighborhood #4 is 1.00. For Lot # 26 through Lot #56 with lots valued at
$35,000, the indicated front foot rate is:

Chapter 2 Land
Real Property Assessment Guidelines Page 27
$35,000 ÷ 1.00 = $35,000 ÷ 100 = $350.00.
For Lot #57 through Lot #80 with lots valued at $20,000, the indicated front foot
rate is:
$20,000 ÷ 1.00 = $20,000 ÷ 100 = $200.00.
In this example, the assessor developed a range of base rates for
Neighborhood #4—$200 for the low rate and $350 for the high rate.
Establishing the Effective Frontage and Depth of Platted Lots
The front foot method is the method generally used to value platted lots. When
determining a lot‘s size using the front foot method, the following criteria must be
met:
Prior to establishing the size of the lot, the scale of the plat must be established.
The effective frontage and depth must form right angles.
The depth lines must be parallel to each other.
The frontage line must be perpendicular to the depth lines.
Of course, actual lots do not necessarily meet these criteria. This section discusses
how to calculate the effective frontage and effective depth of actual lots in order
to calculate land value using the front foot method. Sample lot shapes are shown
to help guide you. When you calculate the effective frontage and depth for an
irregularly shaped lot, you should show your calculations on the property record
card or an attachment.
Type 1 Lot
The Type 1 lot is known as a 100% lot. The characteristics of a 100% lot are:
The vertical lines of the lot form right angles with the horizontal lines of the lot.
There are no lines in the lot that do not form a 90 angle.
The narrowest portion of this type of lot is usually the frontage.
Example: The lot shown below has an actual frontage of 50 feet, an effective
frontage of 50 feet, and an effective depth of 100 feet.

Chapter 2 Land
Real Property Assessment Guidelines Page 28
1
Figure 2-1. Example of a 100% Platted Lot
Type 2 Lot
The Type 2 lot is similar to a 100% lot, except that the rear line of the lot is not
perpendicular to the depth lines. The actual and effective frontage are the same.
To determine the effective depth of this type of lot, perform the following steps:
Step 1 Add the length of the two sides.
Step 2 Divide the total by two to determine the average depth.
Example: The lot shown below has an actual frontage of 50 feet, an effective
frontage of 50 feet, and an effective depth of 117 feet
(100 + 134 = 234 ÷ 2 = 117 ).
2
Figure 2-2. Example of a Type 2 Platted Lot
Type 3 Lot
For the Type 3 lot, the frontage is the line that is perpendicular to the depth lines.
For this type of lot, you must draw additional lines (shown as dashed lines in the
example) to establish an accurate effective depth. Use of the 100 foot side line as
the depth fails to account for the rear portion of the lot. Therefore, you must draw
an additional depth line (the dashed line perpendicular to the frontage).
To find the effective depth of the lot, perform the following steps:
Step 1 Calculate the average depth of each section.
Step 2 Calculate the width percentage of each section to the total width of the lot.

Chapter 2 Land
Real Property Assessment Guidelines Page 29
Step 3 Multiply the width percentage for each section calculated in Step 2 by the
average length of each section.
Step 4 Add the results for each section calculated in Step 3 to determine the
weighted average length of the subject lot.
Example: The lot shown in below demonstrates how to draw additional depth
lines. In this case only one additional depth line is necessary. The lot has an actual
frontage of 70 feet (two sections of 35 feet), an effective frontage of 70 feet (two
sections of 35 feet), and an effective depth of 120 feet.
Average depth Section 1 = 100 + 140 = 240 2 = 120
Average depth Section 2 = 100 + 140 = 240 2 = 120
Width % Section 1 = 35 70 = .5 or 50%
Width % Section 2 = 35 70 = .5 or 50%
Width % x Avg Length Section 1 = .50 x 120 = 60
Width % x Avg Length Section 2 = .5 x 120 = 60
Effective depth = 60 + 60 = 120
Follow these guidelines when drawing additional depth lines to establish an
accurate effective depth:
Draw lines for establishing depth perpendicular to the frontage line.
Draw these parallel lines with equal increments between them.
Draw the lines to scale to make computation easier.
100'
Street
70'
140'
55' 55'
3
Figure 2-3. Example of a Type 3 Platted Lot

Chapter 2 Land
Real Property Assessment Guidelines Page 30
Type 4 Lot
The Type 4 lot is a more complicated variation of the lot shown in the prior table.
The shape of this lot requires more depth lines in order to calculate the effective
depth. Notice that the depth lines meet the criteria described in the previous
section--they are perpendicular to the frontage, parallel to each other, drawn to
scale.
The example lot has:
an actual frontage of 80 feet (four sections of 20 feet)
an effective frontage of 80 feet (four sections of 20 feet)
an effective depth of 88 feet.
Average depth
Section 1
= 70 + 80 = 150 2 = 75
Average depth
Section 2
= 80 + 90 = 170 2 = 85
Average depth
Section 3
= 90 + 100 = 190 2 = 95
Average depth
Section 4
= 100 + 90 = 190 2 = 95
Width % Section 1 = 20 80 = .25 or 25%
Width % Section 2 = 20 80 = .25 or 25%
Width % Section 3 = 20 80 = .25 or 25%
Width % Section 4 = 20 80 = .25 or 25%
Width % x Avg.
Length Section 1
= .25 x 75 = 18.75
Width % x Avg.
Length Section 2
= .25 x 85 = 21.25
Width % x Avg.
Length Section 3
= .25 x 95 = 23.75
Width % x Avg.
Length Section 4
= .25 x 95 = 23.75
Effective
depth
= 18.75 + 21.25 + 23.75 + 23.75 = 87.50

Chapter 2 Land
Real Property Assessment Guidelines Page 31
70'
80'
20'
80'
90' 90' 100'
Street 4
Figure 2-4. Example of a Type 4 Platted Lot
Type 5 Lot
The Type 5 lot, shown below, is a right triangle with the base of the triangle
located at the street. There are only two perpendicular lines. When any lot or
portion of a lot forms a right triangle, and the base is on the street, use the
following guidelines:
Apply a percentage factor to establish the effective frontage.
The actual frontage is the line that runs parallel to the street.
Use a factor of 65% to determine the effective frontage.
The depth is the line that is perpendicular to the frontage.
To calculate the effective frontage of such a lot, multiply the actual frontage by
the percentage factor:
Effective frontage = Actual frontage x Percentage factor
The example lot has:
an actual frontage of 100 feet
an effective frontage of 65 feet (100 x .65 = 65 )
an effective depth of 100 feet.

Chapter 2 Land
Real Property Assessment Guidelines Page 32
5
Figure 2-5. Example of a Type 5 Platted Lot
Type 6 Lot
The Type 6 lot is a right triangle with the apex of the triangle located at the street.
There are only two perpendicular lines. When any lot, or a portion of a lot, forms
a right triangle, and the apex is on the street:
Apply a percentage factor to establish the effective frontage.
The actual frontage is zero.
Use a factor of 35% to determine the effective frontage.
The depth is the line that is perpendicular to the frontage.
To calculate the effective frontage, multiply the actual length of the rear line by
the percentage factor:
Effective frontage = Rear line x Percentage factor
The example lot has:
an actual frontage of 0 feet
an effective frontage of 18 feet (50 x .35 = 17.5 )
an effective depth of 110 feet.
6
Figure 2-6. Example of a Type 6 Platted Lot

Chapter 2 Land
Real Property Assessment Guidelines Page 33
Type 7 Lot
In the Type 7 lot, the width lines are parallel. However, the depth lines are not
parallel to each other and are not perpendicular to the frontage line. In such a
case, first draw depth lines that are parallel to the frontage and to scale. Drawing
depth lines results in the creation of three figures within this lot—two right
triangles with the bases of both located on the street and one 100% lot.
To calculate the effective frontage of such a lot, perform these steps:
Step 1 To determine the actual frontage of the two triangles, subtract the width of
the 100% lot from the actual front footage:
Actual frontage of triangles = Actual frontage – Width of 100% lot
Step 2 To determine the effective frontage of the two triangles, multiply the
actual frontage of the triangles by the percentage factor of 65%:
Effective frontage of triangles = Actual frontage of triangles x .65
Step 3 To determine the effective frontage of the lot, add the effective frontage of
the triangle and the effective frontage of the 100% lot:
Effective frontage
of lot
= Effective frontage
of triangles
+ Effective frontage
of 100% lot
The example lot has:
an actual frontage of 140 feet
an effective frontage of 112 feet (140 – 60 = 80 x .65 = 52 + 60 = 112 )
an effective depth of 105 feet.
7
Figure 2-7. Example of a Type 7 Platted Lot
Chapter 2 Land
Real Property Assessment Guidelines Page 34
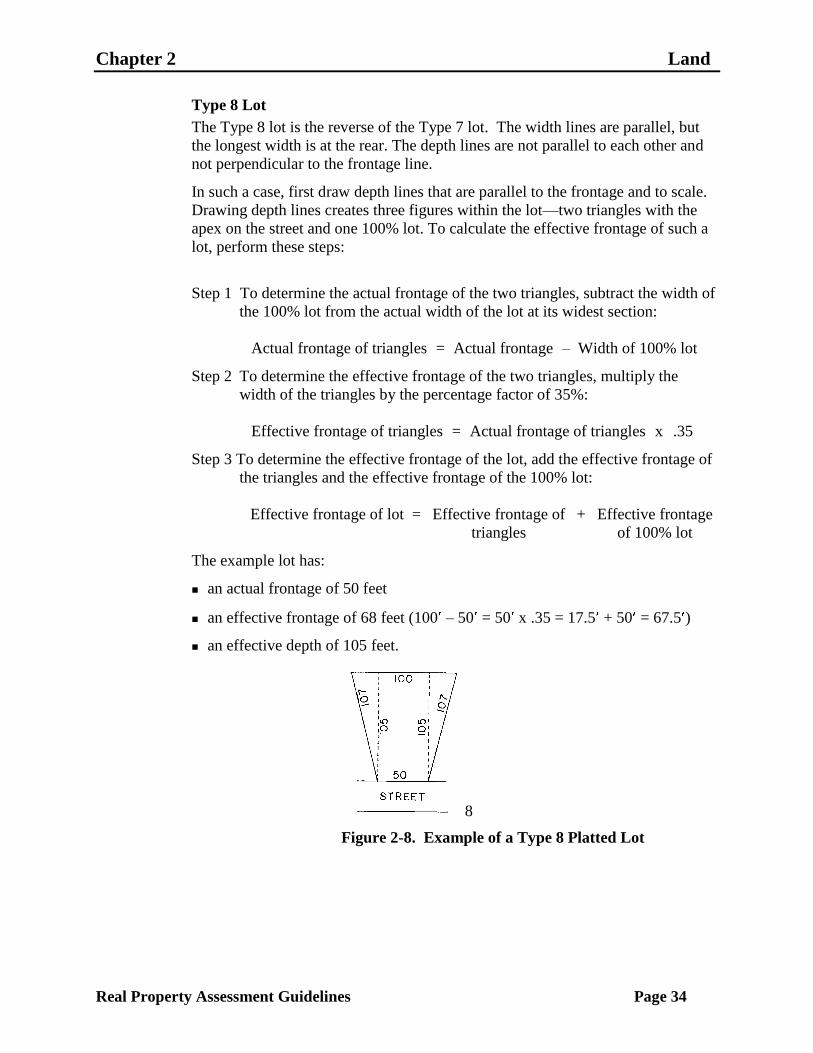
Type 8 Lot
The Type 8 lot is the reverse of the Type 7 lot. The width lines are parallel, but
the longest width is at the rear. The depth lines are not parallel to each other and
not perpendicular to the frontage line.
In such a case, first draw depth lines that are parallel to the frontage and to scale.
Drawing depth lines creates three figures within the lot—two triangles with the
apex on the street and one 100% lot. To calculate the effective frontage of such a
lot, perform these steps:
Step 1 To determine the actual frontage of the two triangles, subtract the width of
the 100% lot from the actual width of the lot at its widest section:
Actual frontage of triangles = Actual frontage – Width of 100% lot
Step 2 To determine the effective frontage of the two triangles, multiply the
width of the triangles by the percentage factor of 35%:
Effective frontage of triangles = Actual frontage of triangles x .35
Step 3 To determine the effective frontage of the lot, add the effective frontage of
the triangles and the effective frontage of the 100% lot:
Effective frontage of lot = Effective frontage of
triangles
+ Effective frontage
of 100% lot
The example lot has:
an actual frontage of 50 feet
an effective frontage of 68 feet (100 – 50 = 50 x .35 = 17.5 + 50 = 67.5 )
an effective depth of 105 feet.
8
Figure 2-8. Example of a Type 8 Platted Lot

Chapter 2 Land
Real Property Assessment Guidelines Page 35
Type 9 Lot
The lot shown below does not have any two lines perpendicular or parallel. The
line that is parallel to the street is the frontage. For such a lot, use the frontage
line to square the lot. Draw depth lines perpendicular to the frontage and to scale.
Also, draw a width line parallel to the frontage and perpendicular to the depth
lines. Drawing the dashed lines creates four figures.
To calculate the effective depth of this type of lot, perform the following steps:
Step 1 Add the length of the two depth lines.
Step 2 Divide the total by two to determine the average depth.
To calculate the effective frontage, perform the following steps:
Step 1 To calculate the effective front footage of the triangle with the apex at the
rear of the lot, multiply the length of the base of the triangle by the
percentage factor of 65%:
Effective frontage
of triangle
= Length of base of
triangle
x .65
Step 2 To calculate the effective front footage of the triangle with the apex at the
front of the lot, multiply the length of the base of the triangle by the
percentage factor of 35%:
Effective frontage
of triangle
= Length of base
of triangle
x .35
Step 3 To calculate the effective front footage of the lot, add the effective front
footage of the 100% lot to the effective front footage of the two triangles:
Effective frontage
of lot
= Effective frontage
of triangles
+ Effective Frontage
of 100% lot
The example lot has:
an actual frontage of 130 feet
an effective frontage of 132 feet
((20 x .65 = 13 ) + (25 x .35 = 8.75 ) = 21.75 + 110 = 131.75 ))
an effective depth of 95 feet (100 + 90 = 190 ÷ 2).

Chapter 2 Land
Real Property Assessment Guidelines Page 36
9
Figure 2-9. Example of a Type 9 Platted Lot
Type 10 Lot
The Type 10 lot is a double entry lot. The lines are perpendicular and parallel. By
drawing a dashed line, two figures are formed within the lot. For this type of lot,
record two frontages and two depths. Determine the effective frontage and
effective depth of each area of the lot as you would for a 100% lot.
The left portion of the example lot has:
an actual frontage of 50 feet
an effective frontage of 50 feet
an effective depth of 100 feet.
The right portion of the lot has:
an actual frontage of 20 feet
an effective frontage of 20 feet
an effective depth of 140 feet.
10
Figure 2-10. Example of a Type 10 Platted Lot

Chapter 2 Land
Real Property Assessment Guidelines Page 37
Type 11 Lot
Lot 2 in the figure below is a double entry lot. It differs from the previous
example because it has a 50 feet by 50 feet portion at the rear of Lot 3 that has no
street frontage. This area is called a rear lot.
The rear portion of Lot 2 (the rear lot), located behind Lot 3, has:
an actual frontage of 0 feet
an effective frontage of 50 feet
an effective depth of 50 feet.
The left portion of Lot 2 (the front lot) has:
an actual frontage of 50 feet
an effective frontage of 50 feet
an effective depth of 200 feet.
11
Figure 2-11. Example of a Type 11 Platted Lot
Type 12 Lot
The Type 12 lot is a cul-de-sac lot. To determine the effective frontage of such a
lot, follow these steps:
Step 1 Establish the gross width of the lot by finding and measuring the widest
part of the lot (185 feet in the example).
Step 2 Draw lines for a 100% lot so that it encompasses the area most likely to
include the dwelling.
Step 3 Draw and measure lines perpendicular to the gross width lines and to
scale. Determine the effective frontage of the 100% lot.

Chapter 2 Land
Real Property Assessment Guidelines Page 38
Step 4 The remainder of the lot forms two triangles with their apex on the street.
To determine the effective frontage of the remainder of the lot, subtract
the width of the 100% lot from the gross width line of the lot and multiply
by a percentage factor of .35:
Effective frontage
of remainder
= (Gross width line of
lot)
– (Width of100% lot) x .35
Step 5 To calculate the effective frontage of the lot, add the width of the 100% lot
to the effective frontage of the remainder of the lot:
Effective frontage
of lot
= Width of 100% lot + Effective frontage
of remainder
To determine the effective depth of the lot, follow these steps:
Step 1 Add the length of the two depth lines.
Step 2 Divide the total by two to determine the average depth.
The example lot has:
an actual frontage of 120 feet
an effective frontage of 143 feet (The gross width is 185 feet and the width of
the 100% lot is 120 feet.)
(185 – 120 = 65 x .35 = 22.75 + 120 = 142.75 ).
an effective depth of 163 feet (150 + 175 = 325 ÷ 2 = 162.5 ).
12
Figure 2-12. Example of a Type 12 Platted Lot
Determining Depth Factors for Platted Lots
Each assessing official must designate the base lot size for each neighborhood
identified on the land value map. If the majority of the lots are platted at 50 feet
by 150 feet, the base lot size for the area is 50 feet by 150 feet. The establishment
of the base lot creates the standard against which all other lots within the
neighborhood are compared.
Chapter 2 Land
Real Property Assessment Guidelines Page 39
The depth factor is a multiplier that you apply to a unit land value to adjust the
value of a particular lot to account for the depth of the lot. The depth table adjusts
the lot value of those lots that have either less depth or more depth than the
standard established for the neighborhood. The depth tables let you select the
appropriate depth factor for a lot. Select the depth table corresponding to the
standard lot depth for the neighborhood to determine the appropriate depth factor
for a lot.
The process for determining the depth factor of a front lot is different from the
process of determining the depth factor for a rear lot.
To determine the depth factor for a front lot, perform the following steps:
Step 1 Determine the effective depth of the entire lot.
Step 2 In Table 2-6 through Table 2-8, locate the lot depth table that corresponds
to the standard lot depth determined for the neighborhood.
Step 3 In the ―Depth‖ column in the selected depth table, locate the row
corresponding to the effective depth of the lot (in feet).
Step 4 Find the intersection of the selected row (effective depth) and the ―Factor‖
column. Note the number—the depth factor for the lot.
The depth factor for the rear lot must be manually entered. To determine the
depth factor of a rear lot, perform the following steps:
Step 1 Determine the overall depth of the lot by measuring from the street to the
rear of the rear lot. If you have not already done so, determine the
effective depth of the front lot.
Step 2 In Table 2-6 through Table 2-8, locate the lot depth table that corresponds
to the standard lot depth determined for the neighborhood.
Step 3 In the ―Depth‖ column in the selected depth table, locate the overall depth
of the lot.
Step 4 Find the intersection of the selected row (overall depth) and the ―Factor‖
column. Note the number that you find—the overall depth factor.
Step 5 In the selected depth table, locate the effective depth of the front lot.
Step 6 .. Find the intersection of the selected row (effective depth of the front lot)
and the ―Factor‖ column. Note the number—the front lot depth factor.

Chapter 2 Land
Real Property Assessment Guidelines Page 40
Step 7 To determine the depth factor of the rear lot, subtract the front lot depth
factor (determined in Step 6) from the overall depth factor (determined in
Step 4):
Rear lot
depth factor
= Overall
depth factor
- Front lot
depth factor
To use the depth factor to calculate the value of a parcel that has a depth different
from the standard depth in the area, multiply the base rate by the depth factor:
Adjusted rate = Base rate x Depth factor
Example 1: The standard lot for Neighborhood #6 is 100 feet by 150 feet deep.
Lot #1 is 100 feet wide by 125 feet deep. The base rate in the area is $100. In the
lot depth table for 150 feet standard depth, locate 125 feet and the corresponding
depth factor (.92). To determine the adjusted value of Lot #1, multiply the base
rate by the depth factor ($100 x .92 = $92). Then, multiply the adjusted rate by the
front footage ($92 x 100 = $9,200).
Example 2: Lot #10 is located in Neighborhood #6 and is 100 feet by 150 feet.
It is considered a rear lot because it sits directly behind Lot #1 and has no street
access. The overall depth of both Lot #1 and Lot #10 is 300 feet. In the lot depth
table for 150 feet standard depth, locate 300 feet and the corresponding depth
factor (1.16). The depth factor for Lot #10 represents the difference between the
overall depth factor (1.16) and the depth factor (.92) of the front lot. The
calculated depth factor (1.16 - .92 = .24) is the depth factor for Lot #10. To
determine the adjusted value of Lot #10, multiply the base rate by the depth factor
($100 x .24 = $24). Then, multiply the adjusted rate by the front footage ($24 x
100‘ = $2,400).
Note: If the depth of the subject lot lies between two of those published on the
chart, choose the lower depth factor of the two.

Chapter 2 Land
Real Property Assessment Guidelines Page 41
Table 2-6. Lot Depth Tables (100 and 120 Feet Standard Depth)
100 Feet Standard Depth 120 Feet Standard Depth
Depth Factor Depth Factor Depth Factor Depth Factor Depth Factor Depth Factor Depth Factor Depth Factor
1 .07 51 .74 101 1.00 151 1.14 1 .03 51 .65 101 .91 151 1.12
2 .09 52 .75 102 1.01 152 1.15 2 .05 52 .65 102 .92 152 1.12
3 .11 53 .75 103 1.01 153 1.15 3 .08 53 .66 103 .92 153 1.12
4 .13 54 .76 104 1.01 154 1.15 4 .10 54 .66 104 .93 154 1.12
5 .15 55 .77 105 1.01 155 1.15 5 .13 55 .67 105 .93 155 1.13
6 .17 56 .78 106 1.02 156 1.15 6 .15 56 .68 106 .94 156 1.13
7 .19 57 .78 107 1.02 157 1.16 7 .17 57 .68 107 .94 157 1.13
8 .21 58 .79 108 1.02 158 1.16 8 .19 58 .69 108 .95 158 1.13
9 .23 59 .79 109 1.03 159 1.16 9 .21 59 .69 109 .95 159 1.14
10 .25 60 .80 110 1.03 160 1.16 10 .24 60 .70 110 .96 160 1.14
11 .27 61 .81 111 1.03 161 1.16 11 .26 61 .71 111 .96 161 1.14
12 .29 62 .81 112 1.03 162 1.17 12 .27 62 .71 112 .97 162 1.14
13 .31 63 .82 113 1.04 163 1.17 13 .29 63 .72 113 .97 163 1.15
14 .33 64 .82 114 1.04 164 1.17 14 .31 64 .73 114 .97 164 1.15
15 .35 65 .83 115 1.04 165 1.17 15 .33 65 .73 115 .98 165 1.15
16 .37 66 .84 116 1.05 166 1.17 16 .35 66 .74 116 .98 166 1.15
17 .38 67 .84 117 1.05 167 1.17 17 .36 67 .75 117 .99 167 1.15
18 .40 68 .85 118 1.05 168 1.18 18 .38 68 .75 118 .99 168 1.16
19 .41 69 .85 119 1.06 169 1.18 19 .40 69 .76 119 1.00 169 1.16
20 .43 70 .86 120 1.06 170 1.18 20 .41 70 .76 120 1.00 170 1.16
21 .44 71 .87 121 1.06 175 1.18 21 .42 71 .77 121 1.00 175 1.17
22 .46 72 .87 122 1.07 180 1.19 22 .43 72 .78 122 1.01 180 1.18
23 .47 73 .88 123 1.07 185 1.20 23 .44 73 .78 123 1.01 185 1.19
24 .49 74 .88 124 1.07 190 1.20 24 .45 74 .79 124 1.02 190 1.20
25 .50 75 .89 125 1.08 195 1.21 25 .46 75 .79 125 1.02 195 1.21
26 .51 76 .89 126 1.08 200 1.21 26 .47 76 .80 126 1.03 200 1.22
27 .52 77 .90 127 1.08 205 1.21 27 .48 77 .80 127 1.03 205 1.22
28 .53 78 .90 128 1.08 210 1.21 28 .48 78 .81 128 1.03 210 1.23
29 .54 79 .91 129 1.09 215 1.21 29 .49 79 .81 129 1.04 215 1.23
30 .55 80 .91 130 1.09 220 1.22 30 .50 80 .82 130 1.04 220 1.23
31 .56 81 .92 131 1.09 225 1.22 31 .51 81 .82 131 1.05 225 1.23
32 .57 82 .92 132 1.10 230 1.22 32 .52 82 .83 132 1.05 230 1.24
33 .58 83 .93 133 1.10 235 1.22 33 .53 83 .83 133 1.05 235 1.24
34 .59 84 .93 134 1.10 240 1.23 34 .53 84 .84 134 1.06 240 1.24
35 .60 85 .94 135 1.10 250 1.23 35 .54 85 .84 134 1.06 250 1.25
36 .61 86 .94 136 1.11 260 1.24 36 .55 86 .85 136 1.07 260 1.25
37 .62 87 .95 137 1.11 270 1.24 37 .56 87 .85 137 1.07 270 1.25
38 .63 88 .95 138 1.11 280 1.25 38 .57 88 .86 138 1.07 280 1.25
39 .64 89 .96 139 1.12 290 1.25 39 .57 89 .86 139 1.08 290 1.26
40 .65 90 .96 140 1.12 300 1.26 40 .58 90 .87 140 1.08 300 1.26
41 .66 91 .96 141 1.12 310 1.26 41 .59 91 .87 141 1.08 310 1.26
42 .67 92 .97 142 1.12 320 1.27 42 .59 92 .87 142 1.09 320 1.26
43 .67 93 .97 143 1.13 330 1.27 43 .60 93 .88 143 1.09 330 1.27
44 .68 94 .98 144 1.13 340 1.28 44 .60 94 .88 144 1.09 340 1.27
45 .69 95 .98 145 1.13 350 1.28 45 .61 95 .89 145 1.10 350 1.27
46 .70 96 .98 146 1.13 360 1.29 46 .62 96 .89 146 1.10 360 1.27
47 .71 97 .99 147 1.14 370 1.29 47 .62 97 .90 147 1.10 370 1.28
48 .71 98 .99 148 1.14 380 1.30 48 .63 98 .90 148 1.11 380 1.28
49 .72 99 1.00 149 1.14 390 1.30 49 .63 99 .91 149 1.11 390 1.28
50 .73 100 1.00 150 1.14 400 1.31 50 .64 100 .91 150 1.11 400 1.28

Chapter 2 Land
Real Property Assessment Guidelines Page 42
Table 2-7. Lot Depth Tables (132 and 150 Feet Standard Depth)
132 Feet Standard Depth 150 Feet Standard Depth
Depth Factor Depth Factor Depth Factor Depth Factor Depth Factor Depth Factor Depth Factor Depth Factor
1 .03 51 .62 101 .89 151 1.06 1 .03 51 .57 101 .82 151 1.00
2 .05 52 .63 102 .90 152 1.06 2 .04 52 .58 102 .83 152 1.01
3 .07 53 .64 103 .90 153 1.06 3 .05 53 .58 103 .83 153 1.01
4 .09 54 .64 104 .90 154 1.07 4 .07 54 .59 104 .84 154 1.01
5 .10 55 .65 105 .91 155 1.07 5 .08 55 .59 105 .84 155 1.02
6 .12 56 .66 106 .91 156 1.07 6 .10 56 .60 106 .85 156 1.02
7 .13 57 .66 107 .91 157 1.07 7 .12 57 .60 107 .85 157 1.02
8 .15 58 .67 108 .92 158 1.08 8 .13 58 .61 108 .86 158 1.03
9 .17 59 .68 109 .92 159 1.08 9 .14 59 .62 109 .86 159 1.03
10 .19 60 .69 110 .93 160 1.08 10 .15 60 .62 110 .86 160 1.03
11 .20 61 .69 111 .93 161 1.08 11 .17 61 .63 111 .87 161 1.04
12 .21 62 .70 112 .94 162 1.09 12 .19 62 .63 112 .87 162 1.04
13 .23 63 .70 113 .94 163 1.09 13 .20 63 .64 113 .88 163 1.04
14 .24 64 .71 114 .94 164 1.09 14 .21 64 .65 114 .88 164 1.05
15 .26 65 .72 115 .95 165 1.09 15 .22 65 .65 115 .88 165 1.05
16 .27 66 .72 116 .95 166 1.10 16 .24 66 .66 116 .89 166 1.05
17 .29 67 .73 117 .95 167 1.10 17 .25 67 .66 117 .89 167 1.06
18 .30 68 .73 118 .95 168 1.10 18 .26 68 .67 118 .89 168 1.06
19 .32 69 .74 119 .96 169 1.10 19 .27 69 .67 119 .90 169 1.06
20 .33 70 .74 120 .96 170 1.11 20 .28 70 .68 120 .90 170 1.06
21 .34 71 .75 121 .96 175 1.12 21 .30 71 .68 121 .90 175 1.07
22 .35 72 .75 122 .97 180 1.12 22 .31 72 .69 122 .91 180 1.08
23 .37 73 .76 123 .97 185 1.13 23 .32 73 .69 123 .91 185 1.09
24 .38 74 .76 124 .97 190 1.14 24 .33 74 .70 124 .92 190 1.10
25 .39 75 .77 125 .98 195 1.14 25 .34 75 .70 125 .92 200 1.11
26 .40 76 .77 126 .98 200 1.15 26 .35 76 .70 126 .92 210 1.11
27 .41 77 .78 127 .98 205 1.15 27 .36 77 .71 127 .93 215 1.11
28 .42 78 .78 128 .99 210 1.16 28 .37 78 .71 128 .93 220 1.12
29 .43 79 .79 129 .99 215 1.16 29 .38 79 .72 129 .94 225 1.12
30 .44 80 .80 130 .99 220 1.16 30 .39 80 .72 130 .94 230 1.12
31 .45 81 .80 131 1.00 225 1.16 31 .40 81 .73 131 .94 235 1.12
32 .46 82 .80 132 1.00 230 1.17 32 .41 82 .73 132 .95 240 1.13
33 .47 83 .81 133 1.00 235 1.17 33 .42 83 .74 133 .95 250 1.13
34 .48 84 .81 134 1.01 240 1.17 34 .43 84 .74 134 .95 260 1.14
35 .49 85 .82 135 1.01 250 1.18 35 .43 85 .75 135 .96 270 1.14
36 .50 86 .82 136 1.01 260 1.18 36 .44 86 .75 136 .96 280 1.15
37 .51 87 .83 137 1.02 270 1.19 37 .45 87 .76 137 .96 290 1.15
38 .52 88 .84 138 1.02 280 1.19 38 .46 88 .77 138 .97 300 1.16
39 .53 89 .84 139 1.02 290 1.20 39 .47 89 .77 139 .97 310 1.16
40 .54 90 .85 140 1.03 300 1.20 40 .48 90 .78 140 .97 320 1.17
41 .54 91 .85 141 1.03 310 1.21 41 .49 91 .78 141 .98 330 1.17
42 .55 92 .86 142 1.03 320 1.21 42 .50 92 .79 142 .98 340 1.18
43 .56 93 .86 143 1.04 330 1.22 43 .51 93 .79 143 .98 350 1.18
44 .56 94 .86 144 1.04 340 1.22 44 .52 94 .80 144 .99 360 1.19
45 .57 95 .87 145 1.04 350 1.23 45 .52 95 .80 145 .99 370 1.19
46 .58 96 .87 146 1.05 360 1.23 46 .53 96 .80 146 .99 380 1.20
47 .59 97 .88 147 1.05 370 1.24 47 .54 97 .81 147 .99 390 1.20
48 .60 98 .88 148 1.05 380 1.24 48 .55 98 .81 148 1.00 400 1.21
49 .61 99 .89 149 1.06 390 1.25 49 .56 99 .82 149 1.00
50 .62 100 .89 150 1.06 400 1.25 50 .56 100 .82 150 1.00

Chapter 2 Land
Real Property Assessment Guidelines Page 43
Table 2-8. Lot Depth Tables (175 and 200 Feet Standard Depth)
175 Feet Standard Depth 200 Feet Standard Depth
Depth Factor Depth Factor Depth Factor Depth Factor Depth Factor Depth Factor Depth Factor Depth Factor
10 .16 90 .77 170 .99 300 1.09 10 .13 110 .77 210 1.01 330 1.10
15 .23 95 .79 175 1.00 320 1.10 15 .18 115 .79 215 1.02 340 1.10
20 .29 100 .81 180 1.00 340 1.11 20 .24 120 .81 220 1.02 350 1.11
25 .34 105 .83 185 1.01 360 1.11 25 .29 125 .82 225 1.03 360 1.11
30 .33 130 .84 230 1.03 370 1.12
30 .38 110 .85 190 1.02 380 1.12 35 ..36 135 .85 235 1.04 380 1.12
35 .43 115 .87 195 1.02 400 1.12 40 .40 140 .87 240 1.04 390 1.13
40 .48 120 .88 200 1.03 420 1.13 45 .44 145 .88 245 1.05 400 1.13
45 .52 125 .89 210 1.03 440 1.13 50 .48 150 .89 250 1.05 420 1.14
55 .51 155 .91 255 1.06 440 1.14
50 .56 130 .91 220 1.04 460 1.13 60 .54 160 .92 260 1.06 460 1.15
55 .59 135 .92 230 1.05 480 1.13 65 .57 165 .93 265 1.06 480 1.15
60 .62 140 .94 240 1.05 500 1.13 70 .59 170 .94 270 1.07 500 1.15
65 .65 145 .95 250 1.06 520 1.14 75 .62 175 .95 275 1.07 520 1.16
80 .64 180 .96 280 1.07 540 1.16
70 .68 150 .96 260 1.07 540 1.14 85 .67 185 .97 285 1.08 560 1.16
75 .70 155 .97 270 1.07 560 1.15 90 .69 190 .98 290 1.08 580 1.17
80 .73 160 .98 280 1.08 580 1.15 95 .71 195 .99 300 1.08 600 1.17
85 .75 165 .98 290 1.08 600 1.16 100 .73 200 1.00 310 1.09
105 .75 205 1.01 320 1.09
Determining Influence Factors for Platted Lots
When the assessing official establishes base rates for a neighborhood, the assessor
establishes rates for a base lot. The calculated value of this base entity becomes
the standard to which all remaining lots within the neighborhood are compared.
Often there are conditions peculiar to specific lots within a neighborhood that
must be analyzed on an individual basis. These conditions require the assessor to
make an adjustment to the value of the lot. This adjustment is an influence factor.
An influence factor represents the composite effect that influences the value of
certain lots within the boundaries of an entire neighborhood. It is expressed as a
percentage. The percentage is obtained by comparing the estimated dollar amount
of the adjustment to the estimated value of the lot. This ratio is converted to a
percentage. If the ratio represents a negative amount, a negative influence factor
percentage is applied to the subject land. If the ratio is a positive amount, a
positive influence factor is applied to the subject land.
The examples in the sections below illustrate how to identify and calculate
influence factors for platted lots.
Adverse Topography Example
In Neighborhood #1, the lots measure 60 feet by 120 feet. The base rate is $200
per front foot. Each lot has an improved value estimate of $12,000 per lot.

Chapter 2 Land
Real Property Assessment Guidelines Page 44
On Lot #62 of the subdivision, there is a one family dwelling with a yard that
occupies approximately the front 90 feet of the lot. The remaining 30 feet of the
lot is a ravine that cannot be utilized. The lot sold for less than the standard lots.
The ravine area was the reason for the lower price. Because the area was
developed in the 1950s, the original sales information is no longer accessible.
In this case, the assessing official may apply an influence factor because of the
adverse topography. The assessor estimates the difference in value between this
lot and the standard lot as $1,000, or 8 1/3% of the selling price of the standard
lots. The assessor applies an 8% influence factor to the subject lot.
Absence of Land Improvements Example
Lot #86 is located in Neighborhood #1. It is the standard lot size and is vacant.
There is no water or sewage disposal system installed on the property. The lot
value of $12,000, established by the assessing official, represents an improved lot
value with either water and sewage utilities, water well and septic system, or a
combination of both. Other improvement costs associated with this land are
driveways, private walkways, and an allowance for typical landscaping. Because
Lot #86 does not have these services, an adjustment or influence factor is
necessary.
The assessor surveys the jurisdiction to determine the amount included in the
value of improved land for the various land improvement costs. Improvement
costs affect individual lots differently based on the estimated improved land
value. For a less valuable area, the influence factor percentage is higher than for a
more valuable area because the land improvement cost represents a higher
percentage of the total land value.
The assessing official contacted the utility companies servicing this neighborhood
and determined that lot owners are charged $900 to tap into the existing systems.
The assessor estimated that it costs an additional $700 to run water and sewer
lines from the existing utilities to the normal placement of a dwelling of this lot.
The total cost to improve this lot with water and sewer for a dwelling is $1,600
($700 + $900 = $1,600).The cost of installing utilities is depreciated by the
assessor in this neighborhood by 50% to obtain a partial adjustment of $800. The
assessor estimates that the improvement costs for a residential driveway, typical
landscaping, and private sidewalks is equal to $1,000. The total cost attributed to
improve a residential lot in this neighborhood is $1,800 ($800 + $1,000 = $1,800).
To determine the influence factor, divide the adjustment by the value for the lot
before the adjustment ($1,800 ÷ $12,000 = .15 or 15%).
The assessor applies a negative 15% influence factor for ―under improved‖ to
each vacant lot, until such time when the lot is improved. For each neighborhood,
the assessor develops the estimated amount included in the value to improve the
land. The deduction for a lack of improvements affects individual lots differently
based on the estimated improved land value. For less valuable neighborhoods, the

Chapter 2 Land
Real Property Assessment Guidelines Page 45
influence factor percentage would tend to be higher than in the more valuable
neighborhoods because the land improvement addition increase represents a
higher percentage of the total land value.
Excessive Frontage Example
In Neighborhood #1, the standard lot width is 60 feet. The assessor has
established a base rate of $200 per front foot. Lot #1 and Lot #2 are not typical
lots of the subdivision because they have street frontage equal to 90 feet instead of
60 feet. These lots contain the original subdivision model homes, which were
built in the middle of the 90 foot lots.
Neither dwelling design requires 90 feet of frontage. Both dwellings would fit on
the 60 foot lots located throughout the subdivision.
The value of a 60 feet lot is $12,000. The 90 feet lots are not worth 50% more
than the standard lots. A value of $18,000 for the lots is too high. However, the
lots are worth more than $12,000.
The dwellings were built in the middle of the lots. There is a 60 feet lot with two
15 feet strips of land on either side. The 60 feet portion of the lots is comparable
to the standard lot established for the area. The two 15 feet strips are classified as
excessive frontage. The assessor estimates that these lots are worth approximately
$15,000 each. To reinforce this opinion, the assessor calculates the 30 feet of
excess frontage at 50% loss of value (30 x $200 x .50 = $3,000). To determine
the influence factor, divide the adjustment by the unadjusted value ($3,000 ÷
$18,000 = .16666 or 16 2/3%). The assessor grants an excessive frontage
influence factor of 17% to Lot #1 and Lot #2. This adjustment equals a deduction
of $3,060. The land value of each lot is $14,940 ($18,000 – $3,060 = $14,940).
Completing the Land Data and Computations Section of the Property Record Card for
Platted Lots
This section describes how to complete the ―Land Data and Computations‖
section of a Property Record Card for a platted lot. The steps describe how to use
the front foot method to calculate the value of the lot. The steps for completing
the Property Record Card are grouped into two tasks, described in the sections
below:
Task 1—Record the necessary data for the lot.
Task 2—Calculate the land value for the lot.
Task 1—Recording the Necessary Data
Space is provided on both the residential and the commercial/industrial Property
Record Cards to compute the land value of each lot entry for a platted lot. Enter
the data into a series of columns using one row per entry. For example, if a lot is

Chapter 2 Land
Real Property Assessment Guidelines Page 46
composed of a rear lot and a front lot, enter the rear lot and the front lot as
separate entries.
To enter the data for a platted lot, perform these steps:
Step 1 In the ―Land Type‖ column, enter the code corresponding to the land type
classification
of the lot entry. Table 2-9 describes the land type options for platted lot
entries.
Table 2-9. Land Type Options for Platted Lots
This option Indicates
F The lot fronts the street and is
computed as a front lot.
R The lot has no street access and is
computed as a rear lot.
Step 2 In the ―Actual Frontage‖ column, enter the actual front foot dimensions of
the lot entry. Round to the nearest 1/10 (.1) foot.
Step 3 In the ―Effective Frontage‖ column, enter either the figured frontage of an
irregularly shaped lot or the usable frontage of a lot (as determined by the
assessor). Round to the nearest foot. Instructions for determining the
effective frontage of a lot are provided in the section Establishing the
Effective Frontage and Depth of Platted Lots in this chapter.
Step 4 In the ―Effective Depth‖ column, enter the average or computed depth, as
in the case of irregularly shaped lots, or the usable depth (as determined by
the assessor). Round to the nearest foot. Instructions for determining the
effective depth of a lot are provided in the section Establishing the
Effective Frontage and Depth of Platted Lots in this chapter.
Step 5 In the ―Depth Factor‖ column, enter the depth factor used to adjust the
base rate or unit value to account for depth variations from the norm.
Instructions for determining the depth factor of a lot are provided in the
section Determining the Depth Factor for Platted Lots in this chapter.
Step 6 In the ―Base Rate‖ column, enter the front foot rate for the area as
determined by the jurisdiction assessor and modified/approved by the
Property Tax Assessment Board of Appeals.
Step 7 In the ―Influence Factor‖ column, indicate any condition peculiar to the lot
that requires an adjustment to the estimated value to account for variations
from the base lot on which the base unit land value for the neighborhood is

Chapter 2 Land
Real Property Assessment Guidelines Page 47
predicated. Enter a single digit numeric code to indicate the nine most
prevalent factors and the other factors (code 0) not indicated elsewhere on
the Property Record Card. Any time code 0 is entered, describe the
specific factor in the memorandum section on the property record card.
a. Enter the influence code to the left of the brackets.
b. Enter the percentage adjustment to the right of the brackets.
c. Within the brackets, enter a plus (+) to indicate an increase. Enter a
minus (–) to indicate a decrease. Table 2-10 describes the influence factor
codes. Information about influence factors is provided in the section
Determining Influence Factors for Platted Lots in this chapter.
Table 2-10. Influence Factor Codes for Platted Lots
This code Indicates
1 Topography A decrease based on adverse topographical
features.
2 Under Improved A decrease based on the under improvement
of landscaping, residential driveways and
private walkways, and utility hookups.
3 Excess Frontage A decrease based on the lower utility value
of frontage that is significantly in excess of
the base lot frontage.
4 Shape or Size A decrease based on an irregularity in shape
that limits the use of the parcel or a decrease
for an oversized lot whose variations are not
accounted for elsewhere.
An increase based on an irregularity in shape
that enhances the use of the parcel or an
increase for an undersized lot whose
variations are not accounted for elsewhere.
5 Misimprovement A decrease indicating a lot that has been
valued higher than its current use. The value
must be lowered to the level of comparable
properties in the subject neighborhood.
6 Restrictions A decrease based on encumbrances,
restrictive covenants, or obstructions that
limit the use of the land.
7 Traffic Flow A decrease to account for the nuisance of
significantly heavier traffic flow that affects
the base lot and is not considered in the base
lot value.
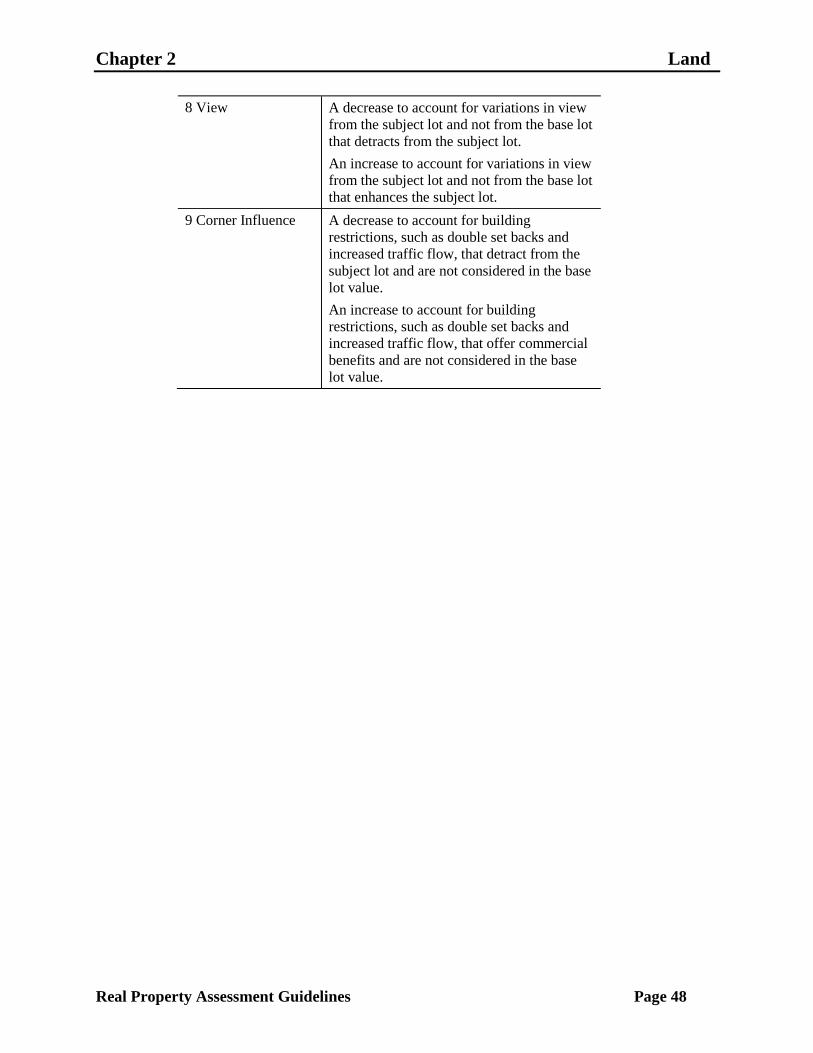
Chapter 2 Land
Real Property Assessment Guidelines Page 48
8 View A decrease to account for variations in view
from the subject lot and not from the base lot
that detracts from the subject lot.
An increase to account for variations in view
from the subject lot and not from the base lot
that enhances the subject lot.
9 Corner Influence A decrease to account for building
restrictions, such as double set backs and
increased traffic flow, that detract from the
subject lot and are not considered in the base
lot value.
An increase to account for building
restrictions, such as double set backs and
increased traffic flow, that offer commercial
benefits and are not considered in the base
lot value.

Chapter 2 Land
Real Property Assessment Guidelines Page 49
O Other An influence, not described above, such as
the following,. Describe the factor in the
memorandum section.
Golf course—An increase to account for
a particular location enhancement, not
characteristic of the base lot.
Water frontage—An increase to account
for proximity to a water front, not
characteristic of the base lot.
Cul-de-sac—An increase to account for
shape or size enhancements due to a cul-de-
sac location, not characteristic of the base
lot.
Location—An increase or decrease to
account for the influence of a particular
location and not considered in the base lot.
Soil conditions—A decrease to account
for adverse soil conditions that prohibit the
subject lot being used the same as the base
lot.
Drainage—A decrease to account for
drainage limitations, indicated by standing
water, not characteristic of the base lot.
Flooding susceptibility—A decrease to
account for a lot or a portion of a lot being in
a flood plain, not characteristic of the base
lot.
Noise nuisance—A decrease to account
for extraneous noise or other such nuisances
not characteristic of the base lot.
Excess depth—A decrease to account for
a disproportionate frontage depth not
accounted for in the size adjustment factor.
Limited access—A decrease to account
for ingress or egress limitations not
characteristic of the base lot.
Step 8 Repeat Step 1 through Step 7 for each lot entry.

Chapter 2 Land
Real Property Assessment Guidelines Page 50
Task 2—Calculating the Land Value
Next, use the data that you entered on the property record card to calculate the
land value for the platted lot. Perform these steps:
Step 1 Calculate the adjusted rate for the lot entry by multiplying the base rate by
the depth factor:
Adjusted rate = Base rate x Depth factor
Round the adjusted rate to the nearest $1 and enter it in the ―Adjusted
Rate‖ column.
Step 2 Calculate the estimated value of the lot entry by multiplying the effective
frontage by the adjusted rate:
Estimated value = Effective frontage x Adjusted rate
Round the estimated value to the nearest $10 and enter it in the ―Estimated
Value‖ column.
Step 3 Calculate the land value of the lot entry by adjusting the estimated value
by the influence factor:
Land value = estimated value x (1.00 – Influence factor
percentage)
Round the land value to the nearest $10 and enter it in the ―Land Value‖
column.
Note: A positive influence factor would be an addition to the influence factor
percentage of 1.00. If there is no influence factor, the land value is the same as
the estimated value.
Step 4 Perform Step 1 through Step 3 for each lot entry.
Step 5 Calculate the total residential land value by summing the entries in the
―Land Value‖ column that represent residential land. Round the total
residential land value to the nearest $100 and enter it in the ―Total
Residential Land Value‖ cell.
Step 6 Calculate the total non-residential land value by summing the entries in
the ―Land Value‖ column that represent non-residential land. Round the
total non-residential land value to the nearest $100 and enter it in the
―Total Non-Residential Land Value‖ cell.
Example: Figure 2-13 shows the dimensions of three lots. The front lot is
100 feet by 100 feet. The rear lot behind it is 100 feet by 120 feet. Another rear lot
is located behind the first rear lot. The second rear lot is 100 feet by 140 feet.
These lots are in a neighborhood where the standard depth is 100 feet and the base
rate is $50 per front foot.

Chapter 2 Land
Real Property Assessment Guidelines Page 51
Use the ―Land Data and Computations‖ section of a property record card for these
lots. This information is used to complete the property record card. As you
review this figure, keep in mind the following points:
The ―Land Type‖ column indicates whether each lot is a front lot or rear lot.
The actual frontage of each lot is determined from the lot plats.
The effective frontage and effective depth are calculated following the
instructions provided in the section Establishing the Effective Frontage and
Depth for Platted Lots in this chapter.
The depth factor is determined following the instructions in the section
Determining the Depth Factor for Platted Lots in this chapter.
The base rate is determined for the neighborhood by the jurisdiction assessor.
The adjusted base rate for the front lot is:
Adjusted base rate = Base rate x Depth factor
$50 = $50 x 1.00
The adjusted base rate for the first rear lot is: $50 x .22 = $11.
The adjusted base rate for the second rear lot is:
$50 x .07 = $3.50 = $4 rounded.
The estimated value of the front lot is:
Estimated value = Effective frontage x Adjusted rate
$5,000 = 100 x $50
The estimated value of the first rear lot is: 100 x $11 = $1,100.
The estimated value of the second rear lot is: 100 x $4 = $400.
Since there is no influence factor for any of the lots, the true tax value of each
lot is the same as the lot‘s estimated value.
The total residential land value for the parcel is the sum of the land values of
the three lots. In this case the total is considered residential land value because it
is less than or equal to one acre.

Chapter 2 Land
Real Property Assessment Guidelines Page 52
100´
140´
120´
100´
Burke Street $50
100´
100´
Figure 2-13. Dimensions of Example Lots

Chapter 2 Land
Real Property Assessment Guidelines Page 53
Valuing Residential Acreage and Agricultural
Homesites
There is a subtle distinction between residential acreage tracts and land valued
using the agricultural soil productivity method. The basis for this distinction is the
different valuation methods used to determine land value for the two types of
land. Agricultural land is valued using a statewide base rate and a soil
productivity index system, as described in the section Valuing Agricultural Land.
All land utilized for agricultural purpose is valued in this manner. Residential
land is land that is utilized or zoned for residential purposes.
The parcel‘s size does not determine the property classification or pricing method
for the parcel. The property classification and pricing method are determined by
the property‘s use or zoning. Land purchased and utilized for residential purposes
is based on market worth as of March 1, 2011.
A land area of one acre per residential dwelling unit is assigned to agricultural
parcels and residential parcels priced on an acreage basis. The value of this one
acre land area is based on the March 1, 2011 cost of a vacant unimproved acre of
land plus the 2011 costs of improving the land. Land improvement costs include
the cost of landscaping, ingress and egress from the property, and the depreciated
2011 cost of improving the land with either a water well and septic system, or in
the case of lands already developed with utility services, the material and labor
costs associated with hook-up fees. The 2011 water and sewage additive reflects
the overall depreciation assigned to existing facilities within the neighborhood,
but may not be less than 50% of the 2011 cost of installing these improvements.
Example: In a neighborhood of the jurisdiction, a vacant unimproved one acre
parcel sold for $6,000. The actual water well and septic system expense is $5,000.
In this neighborhood, it has been determined that the land improvement costs
equal an additional $4,000. That amount was derived by attributing a 60% ratio
for the well and septic and an additional $1,000 for other miscellaneous land
improvements (60% of $5,000 = $3,000 + $1,000 = $4,000).The base rate
applicable to the improved homesite is calculated by adding the vacant land cost
to the land improvement costs ($6,000 + $4,000 = $10,000).
A parcel‘s value is influenced by its location. The value of unimproved land may
vary substantially between two separate neighborhoods. A one acre unimproved
parcel located in a remote neighborhood is less valuable than a one acre
unimproved parcel located in a neighborhood on a lake at the edge of town. The
difference in their value is attributable to the location difference. The demand for
the lake parcel increases the value.
Not all neighborhoods are as diverse as the two in this example. The boundaries
of the neighborhoods and their characteristics determine the amount of variation

Chapter 2 Land
Real Property Assessment Guidelines Page 54
in value. It is impossible to create a precise formula that measures every variable
of location and converts those variables into a precise value. The assessor must
analyze all variables in the market in order to measure the effects location has on
land values.
Valuing Residential Acreage Parcels Larger Than One Acre
Residential acreage parcels of more than one acre and not used for agricultural
purposes are valued using the residential homesite base rate and the excess
acreage base rate established by the assessing official. The excess acreage base
rate represents the 2011 acreage value of land when purchased for residential
purposes. The land value of the subject parcel should represent the March 1, 2011
market value in the neighborhood.
If the parcel has a dwelling, one acre is valued using the residential homesite
value. The remaining acreage is valued using the excess acreage rate. There must
be a residential dwelling unit on the parcel before the homesite acreage rate can
be used.
If there is no dwelling unit on the parcel, the amount of acreage in the entire
parcel is multiplied by the appropriate excess acre rate. The excess acre base rate
represents the 2011 acreage value of the land purchased for residential purposes in
this neighborhood. The value of the subject parcel should represent the March 1,
2011 market value of the property.
The following examples illustrate how residential acreage is valued for parcels
larger than one acre. These examples assume a homesite base rate of $10,000 (per
acre) and an excess acreage base rate of $1,000 (per acre).
Example 1: A residential parcel has 1.36 acres and a dwelling. The value of the
one acre homesite is $10,000. The value of the excess acreage (1.36 acres – 1 acre
= .36 acre) is calculated by multiplying the acreage by the excess acreage base
rate (.36 acre x $1,000 = $360). The total value of the parcel is the sum of the
value of the homesite and the excess acreage ($10,000 + $360 = $10,360 =
$10,400 rounded to the nearest $100).
Example 2: A residential parcel is vacant and has three acres. Its value is
calculated by multiplying the acreage by the excess acreage base rate
(3 acres x $1,000 = $3,000).
Example 3: A residential parcel has 8 acres and a dwelling. The value of the one
acre homesite is $10,000. The value of the excess acreage (8 acres – 1 acre = 7
acres) is: 7 acres x $1,000 = $7,000. The total value of the parcel is: $10,000 +
$7,000 = $17,000.

Chapter 2 Land
Real Property Assessment Guidelines Page 55
Valuing Residential Acreage Parcels One Acre or Smaller
Residential acreage parcels containing one acre or less are valued using the base
rate (per acre) determined by the assessing official and the appropriate factor
obtained from the Acreage Size Adjustment Table. Instructions for determining
the size adjustment factor for a parcel are provided in the section Determining
Size Adjustment Factors for Acreage in this chapter. The size adjustment table
compares smaller improved parcels to the established one acre standard. The
value of the parcel is calculated by multiplying the lot size adjustment factor for
the subject parcel by the base rate, and by multiplying the result by the acreage
size.
Example: A .50 acre parcel is located in a neighborhood where the base rate is
$8,000 (per acre). The Acreage Size Adjustment Table indicates that the
adjustment factor for .50 acres is 1.50. The value of the parcel is:
$8,000 x 1.50 adjustment factor = $12,000 x .50 acres = $6,000
Valuing Residential Acreage Tracts Using the Front Foot Method
It is often necessary to value acreage tracts of land using the front foot method of
pricing instead of the acreage method of pricing. In particular, the front foot
method often is used for tracts less than one acre in size and surrounded by platted
lots. The land value in the same neighborhood is not different merely because the
legal descriptions of the parcels are inconsistent.
The best way to determine the dimensions of a subject property is to read the deed
or inspect a survey of the property. This method is time consuming, but is the
most accurate. In those counties where the plat maps are verified to scale, a
simple measurement of the property will approximate the measurements to an
acceptable level. In either case, if you determine either the frontage or depth for a
rectangular parcel in feet, you can determine the other dimension by multiplying
the acreage of the parcel by 43,560 (the number of square feet per acre) and
dividing the result by the known dimension (in feet).
Establishing Base Rates for Residential Acreage Tracts
To calculate the indicated acreage base rate of small acreage tracts located among
platted lots, the assessor must determine the value of the comparable adjoining
lots and work backwards. The following examples illustrate this process.
Example 1: Neighborhood #4 was platted with lots measuring 60 feet by
120 feet. The established value of these improved lots is $6,000. Scattered among
the platted lots are small acreage tracts of .165 acre. The assessor must determine
the lot size of each tract and price each tract using the front foot method.
However, for purposes of illustration, the acreage base rate can be calculated.
Calculate the size of the platted lots in acres by first determining the number of
square feet in the lot (60 feet x 120 feet = 7,200 square feet). Then, divide the
square footage of the lot by the number of square feet in an acre (7,200 ÷ 43,560

Chapter 2 Land
Real Property Assessment Guidelines Page 56
= .165 acre). The acreage tracts are the same size as the platted lots. It is
important to make this comparison because the base lot for the neighborhood was
established at 60 x 120 or .165 acre. Any acreage tracts above or below this size
may need an influence factor adjustment applied to the estimated value.
To establish the acreage base rate, divide the established value of the platted lots
by the acreage size adjustment factor for .165 acre, and divide the result by the
size of the tract ($6,000 ÷ 2.32 = $2,586 ÷ .165 acre = $15,674). The acreage base
rate needed to calculate the $6,000 estimated value of a .165 acre tract in this
neighborhood is $15,700.
Example 2: Neighborhood #5 is at the edge of town. The sizes of the acreage
tracts range from .41 acre to .5 acre. The assessing official estimates the range of
values for these tracts to be $10,000 to $12,000. The assessor establishes the base
acreage tract in Neighborhood #5 to be .45 acres. The average value of the tracts
is $11,000. Calculate the acreage base rate by dividing the average value of the
tracts by the size adjustment factor for the average size of the tracts, and by
dividing the result by the average tract size ($11,000 ÷ 1.57 = $7,006 ÷ .45 acre =
$15,570). The acreage base rate for Neighborhood #5 is $15,600.
Determining Size Adjustment Factors for Acreage
To determine the size adjustment factor for acreage, perform the following steps:
Step 1 Determine the size of the tract.
Step 2 In the ―Acre‖ column of the size adjustment table, locate the row
corresponding to the actual size of the tract.
Step 3 Find the intersection of the selected row and the ―Factor‖ column. Note
the number that you find—the size adjustment factor for the tract.
To use the size adjustment factor to calculate the value of a parcel that has a size
different from the standard in the area, multiply the acreage base rate by the size
adjustment factor to find the acreage adjusted rate. Then multiply the acreage
adjusted rate by the acreage size of the tract to find the estimated value of the
parcel.
Acreage Adjusted
Rate
= Acreage Base
Rate
x Acreage Size Adjustment
Factor
Estimated Value = Acreage Adjusted Rate x Acreage size
Example: The estimated value of a .50 acre parcel located in Neighborhood #5
with a base rate of $15,600 is
$23,400 = $15,600 x 1.50
$11,700 = $23,400 x .50 acre

Chapter 2 Land
Real Property Assessment Guidelines Page 57
Table 2-11. Acreage Size Adjustment Table
Note: When applying this table to square footage, convert the square footage
into acreage by dividing by 43,560.
Acre Factor Acre Factor Acre Factor Acre Factor
.05 3.00 .30 1.85 .55 1.44 .80 1.19
.06 2.94 .31 1.83 .56 1.44 .81 1.18
.07 2.88 .32 1.81 .57 1.43 .82 1.17
.08 2.82 .33 1.79 .58 1.43 .83 1.15
.09 2.76 .34 1.77 .59 1.42 .84 1.14
.10 2.70 .35 1.75 .60 1.42 .85 1.13
.11 2.64 .36 1.73 .61 1.42 .86 1.12
.12 2.58 .37 1.71 .62 1.41 .87 1.11
.13 2.52 .38 1.69 .63 1.41 .88 1.10
.14 2.46 .39 1.67 .64 1.40 .89 1.09
.15 2.40 .40 1.65 .65 1.40 .90 1.08
.16 2.36 .41 1.63 .66 1.38 .91 1.07
.17 2.32 .42 1.62 .67 1.37 .92 1.06
.18 2.28 .43 1.60 .68 1.35 .93 1.06
.19 2.24 .44 1.59 .69 1.34 .94 1.06
.20 2.20 .45 1.57 .70 1.32 .95 1.04
.21 2.16 .46 1.55 .71 1.30 .96 1.03
.22 2.12 .47 1.54 .72 1.29 .97 1.02
.23 2.08 .48 1.53 .73 1.28 .98 1.02
.24 2.04 .49 1.51 .74 1.26 .99 1.01
.25 2.00 .50 1.50 .75 1.25 1.00 1.00
.26 1.97 .51 1.49 .76 1.24
.27 1.94 .52 1.48 .77 1.23
.28 1.91 .53 1.46 .78 1.21
.29 1.88 .54 1.45 .79 1.20
Example: A .33 acre tract is located in a neighborhood where 1 acre tracts are
valued at $20,000 per acre. The estimated value of the .33 acre tract is calculated
as: $20,000 x 1.79 = $35,800 x .33 acres = $11,814 or $11,810.
Determining Influence Factors for Residential Acreage
Influence factors are applied to residential acreage in the same way that they are
applied to platted lots. When the assessing official establishes base rates for a
neighborhood, the assessor establishes rates for the base acreage tract. The
calculated value of this base entity becomes the standard against which all
remaining acreage tracts within the neighborhood are compared. Often, there are
conditions peculiar to specific tracts within the neighborhood that must be

Chapter 2 Land
Real Property Assessment Guidelines Page 58
analyzed on an individual basis. These conditions require the assessor to make an
adjustment to the value of the tract. This adjustment is an influence factor.
An influence factor refers to an aspect of a lot‘s condition that is different from
the base lot on which the base unit land value for the subject neighborhood is
based. An influence factor requires an adjustment to the estimated value of the lot
to account for variations and is expressed as a percentage. The percentage is
obtained by comparing the estimated dollar amount of the adjustment to the
estimated value of the lot. This ratio is converted to a percentage. If the ratio
represents a negative amount, a negative influence factor percentage is applied to
the subject land. If the ratio represents a positive amount to the subject, a positive
influence factor is applied to the subject‘s land.
The examples below illustrate how to identify and calculate influence factors for
residential acreage.
Example 1: .... Parcel A is a 4 acre parcel with a residential dwelling and a mobile
home situated on it. Because there are two dwelling units, the assessor has
designated two 1 acre residential homesites for the property. Upon investigation,
it is determined that the mobile home has its own septic system, but obtains its
water supply from the residential dwelling. Both 1 acre residential sites are priced
using a base rate of $10,000 per acre. An adjustment is necessary to the 1 acre site
where the mobile home is located because there is no separate water supply to the
mobile home. The amount of the influence factor adjustment equals the dollar
amount attributed to water facilities ($1,000), as established by the assessing
official. Therefore, an adjustment of 10% is applied to the 1 acre homesite for the
mobile home.
Example 2: Area #10 surrounds a lake and contains parcels sized at .30 acre to
.50 acre. The base parcel size of the neighborhood is .40 acre. The base rate for
Area #10 has been established at $121,200 per acre. The value of the base
lakefront parcel is $80,000.
$121,200 x 1.65 x .40 = $79,990
During the analysis of the sales data, it was realized that the individual parcel size
made no significant difference in the market value of the land. Therefore, all
individual parcels should have a land value of approximately $80,000. A .30 acre
parcel receives a positive influence factor of +19%.
$121,200 x 1.85 x .30 acre = $67,270
$80,000 ÷ $67,270 = 1.189 or 1.19
1.19 - 1.00 = .19 or 19%
A .50 of an acre parcel receives a negative influence factor of -12%.
$121,200 x 1.50 x .50 acre = $90,900
$80,000 ÷ $90,000 = .880 or .88
.88 - 1.00 = -.12 or -12%

Chapter 2 Land
Real Property Assessment Guidelines Page 59
Completing the Land Data and Computations Section of the Property Record Card for
Residential Acreage
This section describes how to complete the ―Land Data and Computations‖
section of a residential Property Record Card for residential acreage tracts. The
steps describe how to use the acreage method to calculate the value of the
acreage. The steps for completing the Property Record Card are grouped into two
tasks, described in the sections below:
Task 1—Record the necessary data for the residential acreage.
Task 2—Calculate the land value for the residential acreage.
Task 1—Recording the Necessary Data
Space is provided on the residential Property Record Card to compute the land
value of each residential acreage tract. Enter the data into a series of columns
using one row per entry. Enter the one acre residential homesite, if there is one,
and the excess acreage as separate entries.
To enter the data for residential acreage, perform these steps:
Step 1 In the ―Land Type‖ column, enter the code corresponding to the land type
classification of the entry. Table 2-12 describes the land type options for
residential acreage tracts.
Table 2-12. Land Type Options for Residential Acreage Tracts
This option Indicates
9 The amount of land entered in the ―Acreage‖ column
is used as a residential homesite.
91 The amount of land entered in the ―Acreage‖ column
is classified as residential excess acres.
Step 2 In the ―Acreage‖ column, enter the acreage (in acres) for this entry. For
parcels of one acre or less and containing a residential dwelling, the entire
parcel is designated as a homesite.
Step 3 In the ―Depth Factor‖ column, enter the factor used to adjust the base rate
or unit value. Instructions for determining the size adjustment factor of a
residential acreage tract are provided in the section Determining Size
Adjustment Factor for Acreage in this chapter. The size adjustment factor
is applied to the portion of acreage that is or could be used as a homesite.
Acreage identified as excess acreage (over 1.00 acre) does not require a
size adjustment factor.
Step 4 If the entry is a residential homesite, enter the homesite rate as determined
by the jurisdiction assessor in the ―Base Rate‖ column.

Chapter 2 Land
Real Property Assessment Guidelines Page 60
If the entry is residential excess acreage, enter the excess acre rate as
determined by the jurisdiction in the ―Base Rate‖ column.
Step 5 In the ―Influence Factor‖ column, indicate any condition peculiar to the
acreage tract that requires an adjustment to the estimated value to account
for variations from the norm:
a. Enter the influence code to the left of the brackets.
b. Enter the percentage adjustment to the right of the brackets.
c. Within the brackets, enter a plus (+) to indicate an increase. Enter a
minus (–) to indicate a decrease. Table 2-13 describes the influence factor
codes. Information about determining influence factors is provided in the
section Determining Influence Factors for Residential Acreage in this
chapter.
Table 2-13. Influence Factor Codes for Residential Acreage and
Agricultural Homesites
This code Indicates
1 Topography A decrease based on adverse topographical
features.
2 Under Improved A decrease based on the under improvement
of landscaping, residential driveways and
private walkways, and utility hookups.
3 Excess Frontage A decrease based on the lower utility value
of frontage that is significantly in excess of
the base lot frontage.
4 Shape or Size A decrease based on an irregularity in shape
that limits the use of the parcel or a decrease
for an oversized lot whose variations are not
accounted for elsewhere.
An increase based on an irregularity in shape
that enhances the use of the parcel or an
increase for an undersized lot whose
variations are not accounted for elsewhere.
5 Misimprovement A decrease indicating a lot that has been
valued higher than its current use. The value
must be lowered to the level of comparable
properties in the subject neighborhood.
6 Restrictions A decrease based on encumbrances,
restrictive covenants, or obstructions that
limit the use of the land.
7 Traffic Flow A decrease to account for the nuisance of
significantly heavier traffic flow that affects
the base lot and is not considered in the base
lot value.

Chapter 2 Land
Real Property Assessment Guidelines Page 61
8 View A decrease to account for variations in view
from the subject lot and not from the base lot
that detracts from the subject lot.
An increase to account for variations in view
from the subject lot and not from the base lot
that enhances the subject lot.
9 Corner Influence A decrease to account for building
restrictions, such as double set backs and
increased traffic flow, that detract from the
subject lot and are not considered in the base
lot value.
An increase to account for building
restrictions, such as double set backs and
increased traffic flow, that offer commercial
benefits and are not considered in the base
lot value.

Chapter 2 Land
Real Property Assessment Guidelines Page 62
O Other An influence, not described above, such as
the following. Describe the factor in the
memorandum section.
Golf course—An increase to account for
a particular location enhancement, not
characteristic of the base lot.
Water frontage—An increase to account
for proximity to a water front, not
characteristic of the base lot.
Cul-de-sac—An increase to account for
shape or size enhancements due to a cul-de-
sac location, not characteristic of the base
lot.
Location—An increase or decrease to
account for the influence of a particular
location and not considered in the base lot.
Soil conditions—A decrease to account
for adverse soil conditions that prohibit the
subject lot being used the same as the base
lot.
Drainage—A decrease to account for
drainage limitations, indicated by standing
water, not characteristic of the base lot.
Flooding susceptibility—A decrease to
account for a lot or a portion of a lot being in
a flood plain, not characteristic of the base
lot.
Noise nuisance—A decrease to account
for extraneous noise or other such nuisances
not characteristic of the base lot.
Excess depth—A decrease to account for
a disproportionate frontage depth not
accounted for in the size adjustment factor.
Limited access—A decrease to account
for ingress or egress limitations not
characteristic of the base lot.
Step 6 Repeat Step 1 through Step 5 for each residential tract entry.

Chapter 2 Land
Real Property Assessment Guidelines Page 63
Task 2 Calculating the Land Value
To calculate the land value for the residential acreage, perform these steps:
Step 1 Calculate the adjusted rate for the residential acreage tract entry by
multiplying the base rate by the size adjustment factor:
Adjusted rate = Base rate x Size Adjustment factor
Round the adjusted rate to the nearest $1.
Step 2 Calculate the estimated value of the entry by multiplying the amount of
acreage by the
adjusted rate:
Estimated value = Adjusted Rate x Amount of Acreage
Round the estimated value to the nearest $10.
Step 3 Calculate the land value of the entry by adjusting the estimated value by
the influence
factor:
Land value = Estimated value x (1.00 - Influence Factor Percentage)
....................................................... Round the land value to the nearest $10.
Note: A positive influence factor would be an addition of the influence factor
percentage to 1.00. If there is no influence factor, the land value is the same as
the Estimated value.
Step 4 Perform Step 1 through Step 3 for each residential acreage tract entry.
Example: The subject residential parcel has a size of 2.50 acres and contains a
dwelling. The parcel has a one acre homesite. The remaining 1.50 acres are
considered residential excess acres. This parcel is located in a neighborhood
where the homesite base rate is $10,000 and the residential excess acre base rate
is $2,000 per acre.
The ―Land Type‖ column designates each portion of the acreage.
The ―Acreage‖ column indicates the acreage size for each land type.
The ―Factor‖ column indicates the size adjustment factor for the homesite
portion of the lot.
The assessing official determines the base rate for the neighborhood.
The adjusted base rate for the homesite acreage is
Adjusted Base Rate = Base Rate x Size Adjustment Factor
$10,000 = $10,000 x 1.00

Chapter 2 Land
Real Property Assessment Guidelines Page 64
The adjusted Base Rate for the residential excess acreage is
Adjusted Base Rate = Base Rate x 1.00
$2,000 = $2,000 x 1.00
The estimated value of the homesite acreage is
Estimated Value = Adjusted Base
Rate
x Homesite Acreage
$10,000 = $10,000 x 1.00 acres
The estimated value of the residential excess acreage is
Estimated Value = Adjusted Base
Rate
x Excess Acreage Size
$3,000 = $2,000 x 1.50 acres
Since there are no influence factors on the parcels, the land value of each entry
is the same as the estimated value.
The total residential land value for this parcel is the same as the first entry
($10,000). In this case the total is considered residential land value because it is
less than or equal to one acre.
The total non-residential land value for this parcel is the same as the second
entry ($3,000). In this case the total is considered non-residential land value
because it is the amount over 1 acre.

Chapter 2 Land
Real Property Assessment Guidelines Page 65
Valuing Commercial and Industrial Land
The procedure for valuing commercial and industrial acreage tracts is similar to
the procedure for other types of land. However, sales information for existing
business properties is less reliable and less available. The assessing official must
draw on the expertise within the community to establish the basis of valuing these
types of tracts. The assessing official must delineate general neighborhood areas
on the basis of characteristics that distinguish them from other areas. This
delineation is normally based on such characteristics as:
zoning
major roads or streets
natural geographic features like waterways or lakes
availability of certain modes of transportation.
These neighborhoods are the basis for establishing land values.
Understanding Commercial and Industrial Land Categories
There are four categories of commercial and industrial land described in Table 2-
14.
Table 2-14. Categories of Commercial and Industrial Land
This category Indicates
Primary The primary building or plant site. The following are
examples of primary land:
land located under buildings
regularly used parking areas
roadways
regularly used yard storage
necessary support land
Secondary Land used for purposes that are secondary to the
primary use of the land. The following are examples
of secondary land:
parking areas that are not used regularly
yard storage that is not used regularly
Usable Undeveloped The amount of acreage that is vacant and held for
future development
Unusable Undeveloped The amount of vacant acreage that is unusable for
commercial or industrial purposes, and not used for
agricultural purposes

Chapter 2 Land
Real Property Assessment Guidelines Page 66
Normally, large acreage tracts are partitioned to indicate the various uses of the
individual tract. Small acreage tracts of one acre or less are often used as a
primary building site and require the primary land classification.
The base rate for each use category includes the following items:
For primary land, the base rate represents the estimated March 1, 2011 value of
the vacant land and various costs associated with the development of the land.
The following developmental costs may be included in the base rate for primary
acreage:
sanitary sewers
storm sewers
potable water lines
fire prevention lines
gas lines
septic systems
water wells
grading for general improvement of the site
landscaping.
For secondary land, the base rate represents the March 1, 2011 value of the
vacant land and the various costs associated with the development of the land.
Normally, this acreage does not include developmental costs for water and
sewage. The following developmental costs may be included in the base rate for
secondary acreage:
storm sewers
grading for general improvement of the site.
For usable undeveloped land, the base rate represents the March 1, 2011 value
of vacant or raw land that is zoned for commercial and industrial purposes. This
type of land has incurred no on-site development cost. This category does not
include land utilized for agricultural purposes, as stated in IC 6-1.1-4-13.
For unusable undeveloped land, the base rate represents the March 1, 2011
value of undeveloped land that is zoned for commercial or industrial purposes.
This type of land has incurred no on-site development costs and normally
represents an area of vacant land with restrictions. There may be restrictions
against building because there are environmental hazards on the property or
because the area has been designated as a wetland area by the federal government.
This category does not include land that is utilized for agricultural purposes, as
stated in IC 6-1.1-4-13.

Chapter 2 Land
Real Property Assessment Guidelines Page 67
Establishing Use Classes for Commercial and Industrial Properties
Within each neighborhood, the assessing official may establish broad use classes
based on either the current use or probable use of commercial or industrial
properties. The identification of broad use classes helps ensure that similar types
of properties are analyzed and valued consistently by the assessor. Broad use
classes may be identified for apartments, retail stores, offices, or various zoning
categories. By determining broad use classes for each neighborhood, the assessor
can compare unit values and establish base rates to treat all properties equitably.
The table below shows the recommended unit value for selected use classes.
Table 2-15. Recommended Unit Values for Selected Use Classes
For this use class Use this unit value
Central business district Front foot or square foot
Urban fringe businesses Front foot or square foot
Retail or service strip centers Front foot or square foot
Shopping centers Square foot or acreage
Interchange areas Square foot or acreage
Town centers Front foot or square foot
Suburban office parks Square foot or acreage
Urban renewal projects Front foot, square foot, or acreage
Industrial corridors Front foot or acreage
Industrial parks Acreage
Rural industrials Acreage
Apartment complexes Square foot, acreage, or unit density
Parking accommodations Front foot, square foot, unit density, or
acreage
Determining the Building Density Ratio
For commercial and industrial parcels, the assessor analyzes each individual
parcel to determine what portion of the parcel is considered improved and what
portion of the parcel is considered undeveloped. Site size refers to the improved
portion of the land which may encompass the entire parcel, multiple parcels, or a
portion of a parcel.
Commercial and industrial properties contain certain site requirements for each
specific property. These site requirements differ from use to use, or within the
same use, because of variations in the size of the buildings. For example, a 40,000
square feet store requires more building space and parking area than a comparable
store of 20,000 square feet. There is, within each use category, a definite
relationship between the building size and the required site size, referred to as
building density ratio. This ratio is calculated by dividing the area of the site by

Chapter 2 Land
Real Property Assessment Guidelines Page 68
the gross floor area of the building. The result is rounded to one decimal point
(the nearest tenth).
By analyzing the building density ratios throughout a defined neighborhood, the
assessor develops a norm for that area. Each neighborhood could have a different
norm based on the properties located within it. By thinking about the development
of a community, the assessor can appreciate the need for identifying the different
building density ratios associated with a community.
As commercial and industrial areas develop over a period of time, land
requirements necessary to support the various businesses change. For years,
downtown businesses have relied on limited on-street parking so the commercial
structures normally were built to cover the entire area of a lot. As more
automobiles clogged the downtown streets, many businesses began moving into
recently constructed larger structures at the edge of town. To support these
facilities, the owners provided adequate amounts of parking with pleasantly
landscaped surroundings on larger tracts of land. These facilities served their
purpose well, but as time passed and business patterns change, newer, larger, and
more accessible complexes have been constructed to attract the contemporary
uses. These complexes occupy large acreage tracts and provide efficient parking
facilities, landscaped areas, and/or greenspaces. By analyzing the building
density ratios of these various locations, the assessor can establish standards
relative to the size requirements required to support the various uses by property
use for each neighborhood. Each type of facility located within the area is
compared against its established standard to determine the amount of the
developed site which should be classified as primary land.
Example. An 80,000 square feet strip center occupying a five acre tract would
have a building density ratio calculated by dividing 217,800 square feet
(43,560 x 5 = 217,800) by the 80,000 square foot building (217,800 / 80,000 =
2.72, rounded to 2.7). By comparing this ratio to other strip centers ratios in the
neighborhood, a standard is established by use category for each neighborhood.
Once a standard is established, the assessor can apply it to other strip centers to
determine how much of the improved site is to be classified as primary. No
portion of the improved site shall be classified as secondary until the requirements
of the building density ratio have been met.
Some taxing jurisdictions have an active zoning authority that issues certain
building requirements based on the type of property being constructed. Care
should be taken when consulting local zoning information during the analysis of a
neighborhood‘s building density ratios. Zoning regulations normally mandate
minimum land size and parking requirements which may, but do not necessarily
correspond to the developed portions of all land. What is more, these regulations
change periodically so an analysis using current regulations might misrepresent
the actual situation in a specific neighborhood. It is more applicable to analyze the
building sites within each defined neighborhood and develop the building density
ratio standards based upon specific information obtained from the analysis.

Chapter 2 Land
Real Property Assessment Guidelines Page 69
Establishing Base Rates for Commercial and Industrial Land
To calculate the indicated base rate of small acreage tracts located among platted
lots, the jurisdiction assessor must determine the value of the comparable
adjoining lots and work backwards. The following examples illustrate the process
of calculating acreage values and square foot values.
Example 1: For acreage values, Neighborhood #7 was platted with lots
measuring 60 feet by 120 feet. The established value of the improved lots is
$24,000. Scattered among these lots are small acreage tracts of .20 acre. They are
slightly larger than the platted lots and reflect a slightly higher estimated value.
The acreage rate for the platted lots is calculated by dividing $24,000 by the
factor from the size adjustment table, for the equivalent size of the platted lots.
The result is then divided by the acreage equivalent of the platted lots. ($24,000 ÷
2.36 = $10,169 ÷ .165 acres = $61,630. To calculate the value of the .20 acre
parcels, multiply the rate of $61,630 by the factor from the size adjustment table
for .20 acres. Multiply the result by the parcel size.
($61,630 x 2.20 = $135,586 x .20 acres = $27,117).
Example 2: For acreage values, Neighborhood #7 is analyzed slightly differently
to determine the square foot base rate. The platted lots contain 7,200 square feet
and the value of the lots is $24,000. The square foot base rate is determined by
first dividing the value of the lot by the size adjustment factor from the applicable
table for the equivalent acreage size. The factor is 2.36 for a parcel size of .165
acres (60 x 120 = 7,200 square feet). The rate of $10,169 ($24,000 ÷ 2.36) is
divided by the number of square feet to equal $1.41 per square foot ($10,169 ÷
7200 square feet = $1.41). To calculate the value of the .20 acre parcels, multiply
the square foot rate of $1.41 by the factor from the size adjustment table for .20
acres, and multiply the result by the parcel square footage ($1.41 x 2.20 = $3.10 x
8,712 square feet = $27,007).
To calculate the indicated value of larger acreage tracts, the assessor may analyze
the land using one of the following methods:
The land development method is normally more appropriate for newer
commercial or industrial area because on-site development costs are attributed
directly to the land using the latest construction costs available. The land
development method entails adding the purchase price of vacant land to the
on-site development costs. On large acreage tracts, the value of the development
costs are attributed to the acres affected by the cost.
The comparison method is more reliable when measuring the effects of
location on various commercial and industrial properties. The comparison method
compares properties of similar use against properties of compatible use. By
establishing a broad range of use classes, such as zoning categories, land-to-

Chapter 2 Land
Real Property Assessment Guidelines Page 70
building ratios, and current and probable uses, the assessor develops standards for
each neighborhood. The standards determine the basis for comparison between
the properties within the neighborhood and other neighborhoods. The assessor
applies sales information or written qualified real estate professional estimates to
the standards. The use of an appropriate unit value makes values comparable
between the various neighborhoods.
Determining Influence Factors for Commercial and Industrial Land
Influence factors are applied to small tracts of commercial and industrial acreage
in the same way that they are applied to platted lots. When the assessing official
establishes base rates for a neighborhood, the assessor establishes rates for the
base acreage tract. The calculated value of this base entity becomes the standard
to which all remaining acreage tracts within the neighborhood are compared.
Often, there are conditions peculiar to specific tracts within a neighborhood that
must be analyzed on an individual basis. These conditions require the assessor to
make an adjustment to the value of the tract. This adjustment is an influence
factor.
―Influence Factor‖ refers to a condition peculiar to the lot that dictates an
adjustment to the estimated value to account for variations from the base lot on
which the base unit land value for the subject neighborhood is predicated. A
single digit numeric code is used to indicate the nine most prevalent factors and
provide for the application of other (code O) factors not elsewhere coded.
The examples below illustrate how to identify and calculate influence factors for
commercial and industrial acreage.
Example 1: In a commercial neighborhood, there is a small acreage tract of less
than 1 acre that is vacant and is being held for future development. The remaining
tracts within the neighborhood are equal in size to the subject and are developed.
The vacant small acreage parcel is considered unimproved and a negative
influence factor adjustment equivalent to the cost of improving the parcel is
applied to the parcel.
Example 2: The small acreage commercial tracts located in Neighborhood #32
are similar in size and used for commercial purposes. The base acreage value was
established for the neighborhood to reflect the typical tract which is a parcel that
has restricted access to the highway due to the small number of crossovers located
in the highway. However, parcel Z, located at the intersection of the same
highway and a similar highway, has very good access from both roads. The
assessing official has determined through the analysis of a sale of a comparable
corner tract that parcel Z has a higher value than the tracts used to establish the
base value for the area. The assessor determines that a positive influence factor is
necessary to adjust parcel Z‘s value. The difference between the higher value and
the estimated value is expressed as a percentage and applied to parcel Z ‗s

Chapter 2 Land
Real Property Assessment Guidelines Page 71
estimated value. The corner influence associated with parcel Z is the reason for
assigning this positive influence factor adjustment.
Note: The procedures for calculating the front foot base rate and the true tax
value of commercial platted lots is identical to the procedures for residential
platted lots. Instructions are provided in the section Completing the Land Data
and Computations Section of the Property Record Card for Platted Lots.
Completing the Land Data and Computations Portion of the Property Record Card for
Commercial and Industrial Acreage
This section describes how to complete the ―Land Data and Computations‖
section of a commercial and industrial Property Record Card for commercial or
industrial acreage tracts. The steps describe how to use the acreage method to
calculate the value of the acreage. The steps for completing the property record
card are grouped into two tasks, described in the sections below:
Task 1—Record the necessary data for the lot.
Task 2—Calculate the true tax value for the lot.
Note: The procedures for calculating the front foot base rate and the true tax
value of commercial platted lots is identical to the procedures for residential
platted lots. Instructions are provided in the section Completing the Land Data
and Computations Section of the Property Record Card for Platted Lots in this
chapter.
Task 1—Recording the Necessary Data
Space is provided on the commercial and industrial Property Record Card to
compute the true tax value of platted lots and acreage tracts used for commercial
or industrial purposes. Enter the data into a series of columns using one row per
entry.
To enter the data for a commercial or industrial acreage, perform these steps:
Step 1 In the ―Land Type‖ column, enter the code corresponding to the land type
classification of the entry. Table 2-16 describes the land type options for
commercial and industrial acreage tracts.

Chapter 2 Land
Real Property Assessment Guidelines Page 72
Table 2-16. Land Type Options for Commercial and Industrial
Acreage Tracts
This option Indicates
11 The amount of land entered in the ―Acreage‖ column is
classified as commercial or industrial primary land
12 The amount of land entered in the ―Acreage‖ column is
classified as commercial or industrial secondary land
13 The amount of land entered in the ―Acreage‖ column is
classified as commercial or industrial usable undeveloped
land
14 The amount of land entered in the ―Acreage‖ column is
classified as commercial or industrial unusable
undeveloped land
Step 2 In the ―Acreage‖ column, enter the acreage (in acres) designated as each
specific land type.
Step 3 In the ―Depth Factor‖ column, enter 1.00 as the acreage size adjustment
factor for all commercial and industrial acreage tracts of one acre or more.
For commercial and industrial acreage tracts of less than one acre, the size
adjustment factor is derived by comparing the parcel acreage or square
feet size to the Acreage Size Adjustment Table included in Table 2-11.
This table compares smaller improved tracts of land to an established one
acre standard. In the ―Acre‖ column of the size adjustment table, locate the
row corresponding to the actual size of the tract. Find the intersection of
the selected row and the ―Factor‖ column. Note the number that you find.
This is the size adjustment factor for the tract.
Step 4 In the ―Base Rate‖ column, enter the acreage value as determined by the
assessing official and approved by the Property Tax Assessment Board of
Appeals.
Step 5 In the ―Influence Factor‖ column, indicate any condition peculiar to the
acreage tract that requires an adjustment to the estimated value to account
for variations from the norm, if necessary:
a. Enter the influence code to the left of the brackets.
b. Enter the percentage adjustment to the right of the brackets.
c. Within the brackets, enter a plus (+) to indicate an increase. Enter a
minus (–) to indicate a decrease. Table 2-17 describes the influence factor
codes. Information about determining influence factors is provided in the
section Determining Influence Factors for Commercial and Industrial
Land in this chapter.

Chapter 2 Land
Real Property Assessment Guidelines Page 73
Table 2-17. Influence Factor Codes for Commercial and Industrial Property
This code Indicates
1 Topography A decrease based on adverse topographical features.
2 Under Improved A decrease based on the under improvement of
landscaping, driveways and private walkways, and
utility hookups.
3 Excess Frontage A decrease based on the lower utility value of frontage
that is significantly in excess of the base lot frontage.
4 Shape or Size A decrease based on an irregularity in shape that
limits the use of the parcel or a decrease for an
oversized lot whose variations are not accounted for
elsewhere.
An increase based on an irregularity in shape that
enhances the use of the parcel or an increase for an
undersized lot whose variations are not accounted for
elsewhere.
5 Misimprovement A decrease indicating a lot that has been valued higher
than its current use. The value must be lowered to the
level of comparable properties in the subject
neighborhood.
6 Restrictions A decrease based on encumbrances, restrictive
covenants, or obstructions that limit the use of the
land.
7 Traffic Flow A decrease to account for the nuisance of significantly
heavier traffic flow that affects the base lot and is not
considered in the base lot value.
8 View A decrease to account for variations in view from the
subject lot and not from the base lot that detracts from
the subject lot.
An increase to account for variations in view from the
subject lot and not from the base lot that enhances the
subject lot.
9 Corner Influence A decrease to account for building restrictions, such as
double set backs and increased traffic flow, that
detract from the subject lot and are not considered in
the base lot value.
An increase to account for building restrictions, such
as double set backs and increased traffic flow, that
offer commercial benefits and are not considered in
the base lot value.

Chapter 2 Land
Real Property Assessment Guidelines Page 74
O Other An influence, not described above, such as the
following. Describe the factor in the memorandum
section.
Golf course—An increase to account for a
particular location enhancement, not characteristic of
the base lot.
Water frontage—An increase to account for
proximity to a water front, not characteristic of the
base lot.
Cul-de-sac—An increase to account for shape or
size enhancements due to a cul-de-sac location, not
characteristic of the base lot.
Location—An increase or decrease to account for
the influence of a particular location and not
considered in the base lot.
Soil conditions—A decrease to account for adverse
soil conditions that prohibit the subject lot being used
the same as the base lot.
Drainage—A decrease to account for drainage
limitations, indicated by standing water, not
characteristic of the base lot.
Flooding susceptibility—A decrease to account
for a lot or a portion of a lot being in a flood plain, not
characteristic of the base lot.
Noise nuisance—A decrease to account for
extraneous noise or other such nuisances not
characteristic of the base lot.
Excess depth—A decrease to account for a
disproportionate frontage depth not accounted for in
the size adjustment factor.
Limited access—A decrease to account for ingress
or egress limitations not characteristic of the base lot.
Step 6 Repeat Step 1 through Step 5 for each commercial or industrial acreage
tract entry.

Chapter 2 Land
Real Property Assessment Guidelines Page 75
Task 2: Calculating the True Tax Value
To calculate the true tax value for the commercial or industrial acreage, perform
these steps:
Step 1 Calculate the adjusted rate for the commercial or industrial acreage tract
entry by multiplying the base rate by the size adjustment factor:
Adjusted rate = Base rate x Size Adjustment factor
Round the adjusted rate to the nearest $1.
Step 2 Calculate the estimated value of the entry by multiplying the acreage or
square footage by the adjusted rate:
Estimated value = Adjusted Rate x Acreage or Square Footage
Round the estimated value to the nearest $10.
Step 3 Calculate the true tax value of the entry by adjusting the estimated value
by the influence factor:
True tax value = Estimated value x (1.00 - Influence factor percentage)
Round the true tax value to the nearest $10.
Note: A positive influence factor would be an addition to the influence factor
percentage of 1.00. If there is no influence factor, the true tax value is the same as
the estimated value.
Step 4 Perform Step 1 through Step 3 for each commercial and industrial acreage
entry.
Example 1: A small acreage parcel of .74 acres is developed with a commercial
business. The acreage base rate for the neighborhood has been established at
$120,000 per acre.
The size adjustment factor for .74 acres is 1.26.
The assessing official determines the base rate for the neighborhood to be
$120,000.
The adjusted base rate for the parcel is
Adjusted Base Rate = Base Rate x Size Adjustment Factor
$151,200 = $120,000 x 1.26

Chapter 2 Land
Real Property Assessment Guidelines Page 76
The estimated value of the acreage is
Estimated Value = Adjusted Base Rate x Acreage Size
$111,890 = $151,200 x .74
Example 2: A 10-acre industrial parcel contains a small manufacturing facility.
The parcel has six acres designated as primary land and four acres designated as
undeveloped usable land. The average base rate for this industrial neighborhood is
$25,000 per acre for the primary land and $20,000 per acre for the undeveloped
usable land.
The base rates are
$25,000 for the primary land
$20,000 for the undeveloped usable land
The adjusted base rates are
Adjusted Base Rate = Base Rate x Size Adjustment Factor
Primary = $25,000 = $25,000 x 1.00
Undeveloped Usable = $20,000 = $20,000 x 1.00
The estimated values are
Estimated Value = Adjusted Base Rate x Acreage Size
Primary = $150,000 = $25,000 x 6.00 acres
Undeveloped Usable = $80,000 = $20,000 x 4.00 acres
Valuing Agricultural Land
The agricultural land assessment formula involves the identification of
agricultural tracts using data from detailed soil maps, aerial photography, and
local plat maps. Each variable in the land assessment formula is measured using
appropriate devices to determine its size and effect on the parcel‘s assessment.
Uniformity is maintained in the assessment of agricultural land through the proper
use of soil maps, interpreted data, and unit values.
In order to apply the agricultural land assessment formula, you need to understand
the following topics, which are discussed in the sections below:
agricultural land base rate values
assessment of agricultural land
units of measurement for agricultural land

Chapter 2 Land
Real Property Assessment Guidelines Page 77
classification of agricultural land into land use types
use of soil maps
calculating the soil productivity index
valuation of strip mined agricultural land
valuation of oil and gas interests
Agricultural Land Base Rate Value
The 2011 general reassessment agricultural land value utilizes the land‘s current
market value, which is based on the productive capacity of the land, regardless of
the land's potential or highest and best use. The most frequently used valuation
method for use-value assessment is the income capitalization approach. In this
approach, use-value is based on the residual or net income that will accrue to the
land from agricultural production.
As illustrated in the following equation, the market value of agricultural land is
calculated by dividing the net income of each acre by the appropriate
capitalization rate.
Market value = Net Income ÷ Capitalization Rate
The net income of agricultural land can be based on either the net operating
income or the net cash rent. Net operating income is the gross income received
from the sale of crops less the variable costs (i.e. seed and fertilizer) and fixed
costs (i.e. machinery, labor, property taxes) of producing crops. The net cash rent
income is the gross cash rent of an acre of farmland less the property taxes on the
acre. Both methods assume the net income will continue to be earned into
perpetuity.
The capitalization rate converts the net income into an estimate of value. The
capitalization rate reflects, in percentage terms, the annual income relative to the
value of an asset; in this case agricultural land. Conceptually, this capitalization
rate incorporates the required returns to various forms of capital, associated risks,
and the anticipated changes over time.
Since agricultural land in Indiana is nearly evenly divided between cash rent and
owner-occupied production, the Department utilized a six-year rolling average of
both methods in determining the market value of agricultural land. The
capitalization rate applied to both types of net income was based on the annual
average interest rate on agricultural real estate and operating loans in Indiana for
this same period. The table below summarizes the data used in developing the
average market value.

Chapter 2 Land
Real Property Assessment Guidelines Page 78
Table 2-18 Agricultural Land Value
NET INCOMES VALUE
Year Cash Rent Operating Cap. Rate Cash Rent Operating Average
2005 110 60 7.22% 1,524 831 1,177
2006
2007
2008
2009
2010
Assessing Agricultural Land
The agricultural land assessment formula involves identifying agricultural tracts
using data from a detailed soil map, aerial photography, and local plat maps. Each
variable of the land assessment formula is measured using various devices to
determine its size and effect on the parcel‘s assessment. The proper use of the soil
maps, interpreted data, and unit values results in greater uniformity in the
assessment process of agricultural lands.
Indiana Code section 6-1.1-4-13(a) declares, “In assessing or reassessing land,
the land shall be assessed as agricultural land only when it is devoted to
agricultural use” [emphasis added]. Indiana Code section 6-1.1-4-13(d) states,
―This section does not apply to land purchased for industrial, commercial, or
residential uses.‖
Pursuant to Indiana Code section 6-1.1-4-13, land ―devoted to agricultural use‖
shall be assessed as agricultural land. However, land ―purchased for‖ an
industrial, commercial, or residential uses shall not be assessed as agricultural
land. Additionally, all land utilized for agricultural purposes is valued as
agricultural land -- using a statewide base rate and a soil productivity index
system. Unless provided elsewhere in the law, the Manual, or Guidelines, the
parcel‘s size does not determine the property classification or pricing method for
the parcel. Rather, the property classification and pricing method are determined
by the property‘s use or zoning. For example, some commercial and industrial
zoned acreage tracts devote a portion of the parcel to an agricultural use. The
assessing official must classify these parcels as either commercial or industrial.
However, the portions of land devoted to agricultural use are to be valued using
the agricultural land assessment formula. Portions not used for agricultural
purposes are to be valued using the commercial and industrial acreage guidelines.
To illustrate:
(1) A major industrial corporation purchased a 40 acre cornfield to locate a corn
processing facility in Indiana. After undergoing the local zoning process, the
entire parcel was re-zoned from agricultural zoning to industrial zoning. The
corporation has utilized 15 acres of the parcel by constructing a manufacturing

Chapter 2 Land
Real Property Assessment Guidelines Page 79
and warehouse facility with the idea that the remaining 25 acres would be
available for future expansion, if necessary. The 25 acres in reserve is currently
being cash rented to a local agricultural producer, who row-crops the acreage.
Conclusion: The assessor should assign a property classification of 310 - Food
and Drink Processing Facility - to the 40 acre parcel. The 15 acre portion of the
acreage that is utilized for industrial purposes should be assigned land use codes
representing the industrial acreage base rates for that particular area of the
jurisdiction. The 25 acre portion of the parcel that is being row-cropped by the
local farmer should be priced using the agricultural productivity method of
pricing. The 25 acres would have the soil types delineated by soil type, have each
type soil analyzed for its land cover class, and have its assessment calculated
using the agricultural base rate.
(2) The ACME Development Company purchased a 30 acre parcel of land that
was being used for agricultural purposes. ACME appeared before the local
zoning officials and received a zoning change for the front 10 acres as to be
commercial retail, and the rear 20 acres, which has access from an adjoining state
highway, was zoned for a commercial office. ACME immediately began
constructing a retail shopping complex on the front 10 acres of the parcel. The 20
acres is being cash rented to a local farmer, but is offered for sale by a local real
estate broker.
Conclusion: The 30 acre parcel should have a property class designation of 326 --
Neighborhood Shopping Center assigned to it. The front 10 acre commercial
portion of the parcel should be valued using the commercial acreage base rate for
this area of the jurisdiction. The rear 20 acres that is being farmed should be
priced using the agricultural productivity method of pricing. The 20 acres should
have the soil types delineated by soil type, have each type soil analyzed for its
land cover class, and have its assessment calculated using the agricultural base
rate for that particular year.
(3) The Good Development (GDC) purchased a 20 acre parcel that was being
used for agricultural purposes and had a property class code of 100 – Vacant land.
The agricultural productivity method of calculating an assessment valued the
parcel at $22,800 at the time of the purchase in October 2007. GDC purchased
the land for the purpose of platting and developing a 40 lot residential
subdivision. Once the local Area Planning Commission granted approval for the
subdivision and changed the zoning from agricultural to residential, GDC did all
the necessary paperwork and filed the plat with the county recorder‘s office in
February 2008.
Conclusion: For March 1, 2008, the county auditor follows Indiana Code section
6-1.1-5-3 and assigns parcel numbers to the 40 lots indicated on the plat of the
subdivision and notifies the assessing official that the 20 acre parcel has become
40 lots, which need to be assessed for March 1, 2008. The assessing official

Chapter 2 Land
Real Property Assessment Guidelines Page 80
acknowledges that GDC is the developer by reviewing the plat and, based on
Indiana Code section 6-1.1-4-12(h), knows that the overall assessment cannot be
increased because the acreage has become 40 platted lots. However, the
agricultural base rate within the agricultural productivity formula has increased
from $1,140 to $1,200 for March 1, 2008. Before removing the 20 acre parcel
from the computer system, the assessor recalculates an assessment for that parcel
using the new 2008 rate of $1,200. The True Tax Value for this particular 20 acre
parcel would equal $24,000, if not platted into the 40 lots. Based on the language
of Indiana Code section 6-1.1-4-12(h), each of the 40 parcels would have an
assessed value of $600 ($24,000 / 40 lots = $600 per lot). The application of this
True Tax Value can be achieved in either of two ways:
(a) a flat value amount of $600 can be applied to each of the 40 property
record cards; or
(b) the assessing official can calculate the assessment by determining the lots
size of each parcel, applying a front foot or acreage base rate that
calculates the applicable 2008 value of improved land in the extended
value area of the land summary section of the property record card, and
granting influence factor adjustments to each parcel that makes the value
of each parcel equal to $600 per lot.
Land purchased and used for an agricultural purpose qualifies for all land use
types associated with the agricultural classification and agricultural soil
productivity method of pricing. This includes cropland or pasture land (i.e.,
tillable land) as well as woodlands
Indiana Code section 6-1.1-4-12 states that if land assessed on an acreage basis
(i.e., agricultural land) is subdivided into lots; or land is rezoned for, or put to, a
different use, the land shall be reassessed on the basis of its new classification. If
improvements are added to real property, the improvements shall be assessed.
Such an assessment or reassessment is effective on the next assessment date. For
example, a corporation that purchased farmland, subdivided it into residential lots,
and sold all but one lot, retaining ownership and converting that vacant lot into an
income-producing shopping center, was not entitled to retain the lot‘s agricultural
classification for property tax purposes. The land was properly re-classified from
―agricultural‖ to ―commercial‖ to reflect the land‘s change in use. See Aboite
Corp. v. State Bd. of Tax Com’rs, 762 N.E.2d 254 (Ind. Tax Ct. 2001); see also
Howser Development LLC v. Vienna Twp Assessor, 833 N.E.2d 1108 (Ind. Tax
Ct. 2005).
However, Indiana Code section 6-1.1-4-12(h) and (i), added by Public Law 154-
2006, clarifies the ―developer‘s discount‖ for assessments. The ―developer‘s
discount‖ is designed to encourage developers to buy farmland, subdivide into
lots, and resell the lots. A lot, or a tract that has not been subdivided into lots, to

Chapter 2 Land
Real Property Assessment Guidelines Page 81
which a land developer holds title in the ordinary course of its business, may not
be reassessed until the next assessment date following the earliest of:
(1) the date on which title to the land is transferred by the land developer (or
successor land developer) to a person that is not a land developer; or
(2) the date on which construction of a structure begins on the land; or
(3) the date on which a building permit is issued for construction of a
building or structure on the land.
The ―developer‘s discount‖ applies regardless of whether the lot or tract is
rezoned while a land developer holds title to the land. Thus, until one of the
aforementioned events occurs, the land developer ―reaps the benefit‖ of the lower
agricultural land assessment.
Therefore, the controlling factors that determine whether land is to be assessed as
agricultural land are whether the land was purchased for a non-agricultural use,
and whether the land is currently used or zoned for an agricultural purpose;
however, in some instances, the ―developer‘s discount‖ may apply and
reassessment of the land may not occur until transfer of title to a non-developer,
the start of construction of a building, or the issuance of a construction permit.
The definition of ―agricultural land‖ provides ample basis for the vast majority of
assessor decisions. These guidelines were adopted as directed in IC 6-1.1-4-13(c)
and incorporated by reference into 50 IAC 2.3-1-2.
There is a subtle distinction between residential acreage tracts and land valued
using the agricultural soil productivity method. The basis for this distinction is
the different valuation methods used to determine land value for the two types of
land. ―Agricultural land‖ is valued using a statewide base rate and a soil
productivity index system. All land utilized for agricultural purposes is valued in
this manner. ―Residential land‖ is land that is utilized or zoned for residential
purposes.
Other References
a. Assessors are further directed that all acres enrolled in programs of the United
States Department of Agriculture (USDA), Farm Services Agency, and Natural
Resources Conservation Service and have received a ―farm number‖ are eligible
for classification as ―agricultural.‖ Those acres have been determined by those
administering federal programs to be a part of an ―agricultural operation.‖ This
applies to non-homestead acreage.
b. As further evidence of the proper classification of woodlands as agricultural
land, the Indiana State Department of Agriculture (ISDA) considers the growing

Chapter 2 Land
Real Property Assessment Guidelines Page 82
of timber as an agricultural activity by identifying the need to ―increase Indiana‘s
competitiveness in the hardwood sector‖ as one of its eight major strategies. The
Department‘s practices and rules support the assertion that the growing of timber
is a viable Indiana agricultural crop and should be assessed as such.
c. The Department recognizes that certain circumstances may blur the line
between the residential property class designation and the agricultural designation
when wooded areas are involved. In the preparation of this memorandum, the
Department has consulted with the Department of Natural Resources (DNR). The
DNR monitors Indiana‘s timberland and classified forest programs. In its
implementation of the Classified Forest and Wildland Certification Program
authorized in IC 6-1.1-6, participating woodland owners with 10 acres or more
automatically qualify for the American Tree Farm System‘s certification benefits,
which include marketing the forest‘s products as ―green certified.‖ The Classified
Forest and Wildland Program materials also state that timber harvest is not
required to qualify for the classification program. The Department believes that
the guidelines used for the classified program are applicable when distinguishing
agricultural use from non-agricultural use, but other agricultural uses may qualify
a parcel for the productivity method of valuation.
Parcel Size
As stated above, the issue of parcel size has no bearing on the appropriate
classification or pricing method of agricultural land, whether the parcel is wooded
or used for other agricultural activities.
Other Agricultural Uses
a. A 40 acre parcel, which at one time was a small farm, has since become a
mixture of small, scattered trees and brush with less than 50% canopy cover. The
assessor classified this parcel as residential excess acreage; the effect of which
created a higher assessed value and tax burden than the agricultural soil
productivity method.
Conclusion: The current owner purchased the parcel as an agricultural property
many years ago. The land is currently uncultivated or fallow, but has not changed
use nor been re-zoned. This parcel should continue to be classified as agricultural
as it was purchased for agricultural use and is used as ―non-tillable land‖ as
defined in the Guidelines.
b. A five acre parcel has a one acre homesite and cattle grazing on the remaining
four acres. The assessor classified the four acres using the residential excess
acreage rate and refuses to acknowledge the presence of grazing cattle as an
agricultural activity because the parcel is less than 10 acres. The county has an
unofficial policy of denying agricultural classification to parcels of less than 10
acres.
Chapter 2 Land
Real Property Assessment Guidelines Page 83
Conclusion: The grazing of cattle is an agricultural activity; thus, the parcel
should be assessed using the agricultural productivity method as it meets the
definition of ―agricultural operation‖ in IC 32-30-6-1 and in the Guidelines, which
define agricultural ―tillable land‖ as land used ―for cropland or pasture that has no
impediments to routine tillage.‖ The size of the parcel has no bearing on the
determination of agricultural classification.
c. A five acre parcel has a one acre home site and the remaining four acres is
devoted to hay production. The county classified the hay field using the
residential excess acre rate. The owner has a signed statement from a neighboring
dairy farmer that the neighbor harvests the hay from the field for his cattle.
Conclusion: The acreage meets the criteria of agricultural ―tillable land‖ as
defined in the Guidelines. The four acres should be priced using the agricultural
soil productivity method. The size of the parcel has no bearing on the
determination of agricultural classification.

Chapter 2 Land
Real Property Assessment Guidelines Page 84
Converting Units of Measurement for Agricultural Land
Figure 2-14 shows the units of measurement commonly used to measure agricultural land.
Table 2-19 describes equivalencies for these units of measurement
Figure 2-14. Example of Agricultural Land Measurements

Chapter 2 Land
Real Property Assessment Guidelines Page 85
Table 2-19. Agricultural Land Measurement Equivalencies
This linear
measurement
Equals This area
measurement
Equals
1 link 7.92 inches 1 sq. foot 144 sq. inches
1 foot 12 inches 1 sq. yard 9 sq. feet
1 yard 36 inches
3 feet
1 sq. rod 272.25 sq. feet
30.25 sq. yards
1 rod or 1 pole 25 links
16.5 feet
5.5 yards
1 acre 43, 560 sq. feet
160 sq. rods
10 sq. chains
1 chain 100 links
4 rods
16.5 feet
1 sq. mile or
1 section
640 acres
1 furlong 40 rods
660 feet
1 jurisdiction 36 sq. miles
36 sections
1 mile 320 rods
80 chains
8 furlongs
5,280 feet
Note: One acre is equivalent to an area of about 208.7 feet by 208.7 feet, 8 rods
by 20 rods, or X rods by Y rods where X x Y = 160. One jurisdiction is equivalent
to an area of 6 miles by 6 miles.
Classifying Agricultural Land into Land Use Types
Agricultural land is categorized according to its land use type and soil
identification. The following land use types, described in the sections below,
apply to agricultural acreage:
Type 2—classified land
Type 4—tillable land
Type 5—nontillable land
Type 6—woodland
Type 7—other farmland
Type 8—agricultural support land
Type 9—homesite
Note: Agricultural land use types usually are measured from aerial photographs.
Type 2—Classified Land
Classified land is land that has been applied for and approved for specific
programs administered by the Indiana Department of Natural Resources (DNR) or
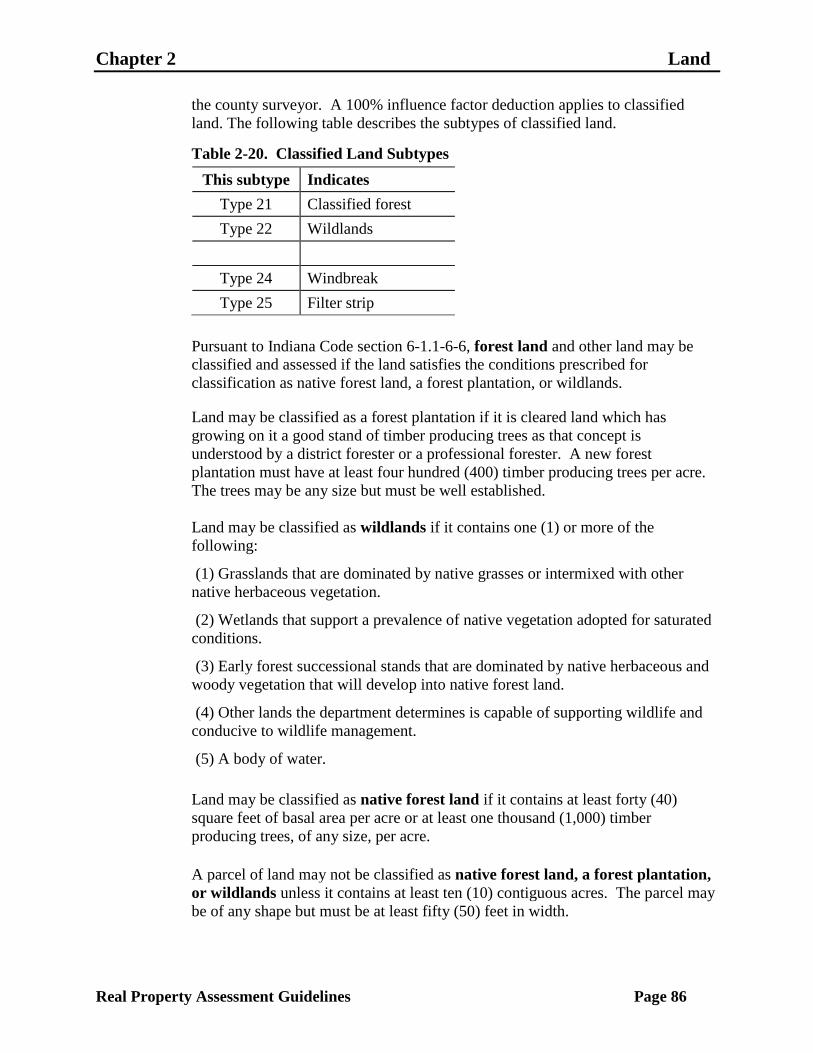
Chapter 2 Land
Real Property Assessment Guidelines Page 86
the county surveyor. A 100% influence factor deduction applies to classified
land. The following table describes the subtypes of classified land.
Table 2-20. Classified Land Subtypes
This subtype Indicates
Type 21 Classified forest
Type 22 Wildlands
Type 24 Windbreak
Type 25 Filter strip
Pursuant to Indiana Code section 6-1.1-6-6, forest land and other land may be
classified and assessed if the land satisfies the conditions prescribed for
classification as native forest land, a forest plantation, or wildlands.
Land may be classified as a forest plantation if it is cleared land which has
growing on it a good stand of timber producing trees as that concept is
understood by a district forester or a professional forester. A new forest
plantation must have at least four hundred (400) timber producing trees per acre.
The trees may be any size but must be well established.
Land may be classified as wildlands if it contains one (1) or more of the
following:
(1) Grasslands that are dominated by native grasses or intermixed with other
native herbaceous vegetation.
(2) Wetlands that support a prevalence of native vegetation adopted for saturated
conditions.
(3) Early forest successional stands that are dominated by native herbaceous and
woody vegetation that will develop into native forest land.
(4) Other lands the department determines is capable of supporting wildlife and
conducive to wildlife management.
(5) A body of water.
Land may be classified as native forest land if it contains at least forty (40)
square feet of basal area per acre or at least one thousand (1,000) timber
producing trees, of any size, per acre.
A parcel of land may not be classified as native forest land, a forest plantation,
or wildlands unless it contains at least ten (10) contiguous acres. The parcel may
be of any shape but must be at least fifty (50) feet in width.
Chapter 2 Land
Real Property Assessment Guidelines Page 87
A parcel of land may not be classified as native forest land, a forest plantation,
or wildlands if a dwelling or other building is situated on the parcel. A parcel of
land may not be classified as native forest land, a forest plantation, or wildlands if
it is grazed by domestic animals or confined nondomesticated animals.
Land classified as native forest land, a forest plantation, or wildlands shall be
assessed at one dollar ($1) per acre for general property taxation purposes. If any
oil, gas, stone, coal, or other mineral is obtained from land which is classified as
native forest land, a forest plantation, or wildlands, the parcel shall immediately
be assessed for the oil, gas, stone, coal, or other mineral wealth. The assessed
value of the mineral wealth shall then be placed on the tax duplicate.
Pursuant to Indiana Code section 6-1.1-6.2-3, a parcel of land may be classified as
a field windbreak if:
(1) it abuts a fence line or a property line;
(2) it abuts arable land;
(3) the landowner enters into an agreement with the department of natural
resources establishing standards of windbreak management for the parcel of land
as that concept is understood by competent professional foresters;
(4) it is at least fifty (50) feet wide;
(5) it does not contain a dwelling or other usable building; and
(6) no part of it lies within a licensed shooting preserve.
Land that is classified as a windbreak shall be assessed at one dollar ($1) per
acre for general property taxation purposes. However, ditch assessments on the
classified land shall be paid. If any oil, gas, stone, coal, or other mineral is
obtained from land that is classified as a windbreak, the parcel shall immediately
be assessed for the oil, gas, stone, coal, or other mineral wealth. The assessed
value of the mineral wealth shall then be placed on the tax duplicate.
In accordance with IC 6-1.1-6-6.7, filter strip refers to a strip or an area of
vegetation for removing sediment, organic matter and other pollutants from
runoff and wastewater. A parcel of land may be classified as a filter strip if the
parcel of land meets all of the following requirements:
(1) The parcel of land is adjacent to an:
(A) open water course such as a ditch, creek, or river; or
(B) open body of water such as a wetland or lake.
(2) The parcel of land is at least twenty (20) feet wide but not more than seventy-
five (75) feet wide.
(3) The parcel of land does not contain a dwelling or other usable building.
(4) The parcel of land is not used for livestock grazing.
(5) No part of the parcel of land lies within a licensed shooting preserve.
(6) The landowner enters into an agreement with the:

Chapter 2 Land
Real Property Assessment Guidelines Page 88
(A) drainage board of jurisdiction along regulated drains; and
(B) county surveyor along nonregulated drains; with concurrence of the local
soil and water conservation district offices.
Land that is classified as a filter strip shall be assessed at one dollar ($1) per
acre for general property taxation purposes. However, ditch assessments on the
classified land shall be paid. If any oil, gas, stone, coal, or other mineral is
obtained from land that is classified as a filter strip, the parcel shall immediately
be assessed for the oil, gas, stone, coal, or other mineral wealth. The assessed
value of the mineral wealth shall then be placed on the tax duplicate.
Type 4—Tillable Land
Tillable land is land used for cropland or pasture that has no impediments to
routine tillage. Cropland is:
land used for production of grain or horticultural crops such as:
corn
soybeans
wheat
rotation pasture
hay
vegetables
orchard crops
land used for cover crops
land in summer fallow
idle cropland
land used for Christmas tree plantations
land used for nursery plantings.
If tillable land is classified as farmed wetlands or experiences flooding from a
nearby river or stream causing substantial damage or loss of crops between April
and November, it is classified by subtype. The table below describes the subtypes
of tillable land.

Chapter 2 Land
Real Property Assessment Guidelines Page 89
Table 2-21. Tillable Land Subtypes
This subtype Indicates
Type 41 Land flooded occasionally—damaging floods occur two to
four times in a ten-year period. A 30% influence factor
deduction applies to this land use type.
Type 42 Land flooded severely—damaging floods occur five times
or more in a ten-year period. A 50% influence factor
deduction applies to this land use type.
Type 43 Farmed wetlands—land that the U.S. Department of
Agriculture has designated as farmed wetlands. This land
type applies only to areas of contiguous land measuring
2.5 acres or more. This land use type must be verified
through records obtained from the U.S. Department of
Agriculture, Farm Service Agency. A 50% influence factor
deduction applies to this land use type.
Type 5—Nontillable Land
Nontillable land is land covered with brush or scattered trees with less than
50% canopy cover, or permanent pasture land with natural impediments that deter
the use of the land for crop production. A 60% influence factor deduction applies
to nontillable land.
Type 6—Woodland
Woodland is land supporting trees capable of producing timber or other wood
products. This land has 50% or more canopy cover or is a permanently planted
reforested area. This land use type includes land accepted and certified by the
Indiana Department of Natural Resources (DNR) as forest plantation under
guidelines established to minimize soil erosion. An 80% influence factor
deduction applies to woodland.
A wooded parcel of land less than 10 acres may be assessed using the agricultural
soil productivity method upon evidence of timber production or other agricultural
use. In addition, smaller than 10 acre parcels not contiguous with other wooded
parcels under the same ownership may qualify as ―agricultural.‖ Of assistance to
the assessor in determining the classification is evidence of enrollment in
programs which assign a ―farm number‖ or programs designed to foster timber
production management. The determining factors are provided in Indiana Code
section 6-1.1-4-13, the Manual, and Guidelines. Of particular interest to the
assessing official is the reason for the purchase of the land.
While not controlling in the assessing official‘s determination, the following
factors may be of assistance:
(1) the acreage is designated by the DNR as qualifying for one of their classified
programs. The DNR has established a 10 acre minimum for its programs; and
Chapter 2 Land
Real Property Assessment Guidelines Page 90
(2) the owner can show an active timber management program in place which
will improve the marketability of the forest for an eventual harvest; and
(3) the owner possesses a DNR management plan to further enhance the forest
quality; and
(4) the owner can show that regular forest harvests have occurred over a long
time period.
Woodland
a. ―Woodland‖ is defined as ―land supporting trees capable of producing timber
or other wood products. This land has 50% or more canopy cover or is a
permanently planted reforested area. This land use type includes land accepted
and certified by the Indiana Department of Natural Resources as forest plantation
under guidelines established to minimize soil erosion. An 80% influence factor
deduction applies to woodland.‖
b. A wooded parcel of land less than 10 acres may be assessed using the
agricultural soil productivity method upon evidence of timber production or other
agricultural use. In addition, smaller than 10 acre parcels not contiguous with
other wooded parcels under the same ownership may qualify as ―agricultural.‖ Of
assistance to the assessor in determining the classification is evidence of
enrollment in programs which assign a ―farm number‖ or programs designed to
foster timber production management. The determining factors are provided in IC
6-1.1-4-13 and the Guidelines. Of particular interest to the assessor is the reason
for the purchase of the land.
c. A wooded parcel of land over 10 acres shall be classified and valued as
agricultural land using the same methods and considerations outlined above.
d. While not controlling in the assessor‘s determination, the following factors
may be of assistance:
(1) the acreage is designated by the DNR as qualifying for one of their
classified programs. The DNR has established a 10 acre minimum for its
programs;
(2) the owner can show an active timber management program in place
which will improve the marketability of the forest for an eventual harvest;
(3) the owner possesses a DNR management plan to further enhance the
forest quality; and

Chapter 2 Land
Real Property Assessment Guidelines Page 91
(4) the owner can show that regular forest harvests have occurred over a
long time period.
Woodland Examples
a. A seven (7) acre parcel of land that comprises a one acre home site and six
acres of woods. The property owner claims that the six acres of woods should be
assessed at the agricultural rate because the increase in the assessment caused by
the residential ―excess acreage‖ classification is exorbitant. The owner
acknowledges that there is no timber management plan in-place. He bought the
seven acre parcel because the Zoning Department requires at least five acres to
construct a dwelling in a non-subdivided rural area.
Conclusion: The owner admits purchasing the parcel to satisfy residential use, not
agricultural use. There is no evidence the land is used for an agricultural purpose.
Additionally, there is no evidence of a timber management plan in-place, or past
timber harvests. The parcel should be priced using the residential excess acreage
rate.
b. Various wooded parcels, both large and small, within a county have been
reclassified from the agricultural productivity method of calculation to a flat
excess acre rate. The following are examples:
(1) An 81 acre parcel has a one acre home site, 61 acres of woods, and 20 acres
of tillable land. The county classified the 61 acres of woods using an excess
acreage rate. The 61 acres of wooded area is determined to be land capable of
producing timber or other wood products and has 50% or more canopy cover.
Conclusion: The parcel‘s segmented land use types should continue to be priced
using the agricultural productivity method because the parcel was purchased for
agricultural use and is utilized for agricultural purposes as described in the
Guidelines. Evidence of a farm number is also a factor in the assessor‘s
determination.
(2) Mr. Zee recently inherited a 54 acre parcel upon the death of his grandfather.
The grandfather pastured the hillside property in the 1970s but had let the pastures
overgrow with vegetation for the past 30 years. The parcel has a one acre home
site and 53 acres of woods. Mr. Zee, who has no affiliation with agriculture, is
planning on moving his family into the dwelling but has no plans for the 53 acre
woods. The property is not enrolled in a Federal Government program, there is no
timber management plan in-place, the parcel is not enrolled in a classified
program, nor has there ever been a timber harvest associated with the parcel. The
parcel‘s assessed value was calculated using the agricultural productivity method
before the 2006 trending. As a result of trending, the 53 acres of woods was
priced at the residential ―excess acre‖ rate.

Chapter 2 Land
Real Property Assessment Guidelines Page 92
Conclusion: The land is appropriately classified because Mr. Zee did not
purchase the land with the intent to pursue agricultural activities. Additional
considerations are that Mr. Zee does not have a farm number, and he has not
produced evidence of a timber management program.
(3) An eight acre parcel contains a one acre home site and seven acres of woods
in an exclusive residential setting. Lots are purchased and sold in this
neighborhood as residential. The owner asserts that the land is properly classified
as agricultural because he cuts and sells firewood. He also files a farm schedule
with his Federal Income Tax claiming that he is an agricultural producer, but does
not have a farm number.
Conclusion: Firewood alone is not evidence of agricultural activity. The assessor
should examine the reasons for the purchase of the land and its current use.
Evidence of a farm number, enrollment in classified forest programs, or timber
harvests may be taken into consideration. In making a final determination, the
assessor should outline statutory or rule reference to support the conclusion.
Type 7—Other Farmland
Land assigned to the ―other farmland‖ land use type is categorized into subtypes.
The following table describes the subtypes.
Table 2-22. Other Farmland Subtypes
This subtype Indicates
Type 71 Land used for farm buildings and barn lots. This land
use subtype does not include homesites. The value is
determined using the appropriate soil map productivity
factor and a 40% influence factor deduction.
Type 72 Land covered by a farm pond or running water. The
value is determined using a productivity factor of .50
and a 40% influence factor deduction.
Type 73 2.5 contiguous acres of land designated by the U.S.
Department of Agriculture as wetlands. This land use
type must be verified through records obtained from the
U.S. Department of Agriculture, Farm Service Agency.
The value is determined using a productivity factor of
.50 and a 40% influence factor deduction.
Type 8—Agricultural Support Land
Agricultural support land is categorized into subtypes. The table below describes
the subtypes.

Chapter 2 Land
Real Property Assessment Guidelines Page 93
Table 2-23. Agricultural Support Land Subtypes
This subtype Indicates
Type 81 A legal ditch. The area used and occupied as part of a legal
drainage ditch is considered to have no value and is deducted
from the total parcel acreage. This area also includes the area
adjacent to the ditch that cannot be farmed because of the
need for access to the ditch.
Type 82 A public road. The right-of-way area dedicated for public
roads is deducted from the total parcel acreage.
Type 83 Land on which public utility transmission towers are situated.
The area of .125 (1/8) acre is deducted from the parcel
acreage. The transmission line right-of-way is assessed
according to the land use of the acreage and is not deducted
from the parcel acreage.
Type 9—Homesite
One acre per dwelling on an agricultural property is classified as agricultural
homesite land. The base rate for an agricultural homesite acre is a flat rate
determined by the assessing official. A soil map productivity factor is not
applied. Information about valuing an agricultural homesite is provided in the
section Valuing Residential Acreage and Agricultural Homesites. Type 92 is a
subtype of Type 9.
Type 92 indicates agricultural excess acres. This land area is presently dedicated
to a non-agricultural use normally associated with the homesite. Areas containing
a large manicured yard over and above the accepted one acre homesite would
qualify for the agricultural excess acre designation. The agricultural excess acre
rate is the same rate that is established for the residential excess acre category.
These rates are determined by the assessing official.
Using Soil Maps
The agricultural land assessment formula values farmland, in part, based on the
productivity of each parcel‘s soil resources. More productive land is rated higher
than less productive land. Therefore, more productive land has a higher value. To
evaluate and categorize land according to its productivity, measurements are
calculated from detailed soil maps published by the U.S. Department of
Agriculture.
Soil maps show where different soils are located within the landscape and
narrative text describes the various soil characteristics. Soils are classified based
on soil series and soil map units.
Soil Series
A soil series is a basic classification of soils. A soil series is a group of soil units
that are similar according to such characteristics as:

Chapter 2 Land
Real Property Assessment Guidelines Page 94
horizons (soil layering)
drainage class
water holding capacity
organic matter content
various other soil characteristics.
Soil series are named with names such as Miami, Crosby, Fox, and Brookston.
Each soil series is formed in a type of parent material and is generally found in a
particular type of location in landscapes. For example, the poorly drained
Brookston series generally is found in depressions or wide, flat areas. The soil
series classification system used in the United States is national in scope.
Therefore, the soil categorized in a particular soil series, such as Miami, is the
same across counties throughout the state.
Soil properties, such as depth, water holding capacity, and organic matter content,
are used to help estimate the productivity of the soil. Because soils are naturally
occurring, not all soils categorized in a particular soil series are exactly alike.
When defining a soil series, a range is defined for the characteristics noted above
to account for variations. However, these variations do not greatly affect the
productivity of the soil.
Soil Map Units
Each soil series is further subdivided into soil map units. After soil scientists
identify a soil series, they further subdivide the series by identifying soil map
units based on variations in:
surface texture, such as silt loam or sandy loam
slope class
amount of previous erosion.
Soil scientists draw lines around each soil map unit on aerial photographs based
on their best estimate of where the soil series or soil map unit changes. In reality,
the change from one soil map unit to another is gradual.
Soil Complexes
The amount of information that can be shown on a soil map is related to the scale
of the map. Soil maps in Indiana are published at a scale of 1 : 15,840 feet or
1 : 20,000 feet. The smallest map unit delineated by a soil scientist generally is
about 3 to 4 acres.
Since soil map unit locations often are smaller than 3 to 4 acres, a delineation on a
soil map often consists of more than one soil unit. The soil properties of these soil
map units may be similar or dissimilar. Each dissimilar component that makes up

Chapter 2 Land
Real Property Assessment Guidelines Page 95
15% or more of the delineation is identified. The soil map unit is named as a
complex, such as the Miami-Xenia complex.
If a dissimilar component makes up less than 15% of the delineation, it is referred
to as an inclusion and is not included in the name of the complex. Inclusions are a
normal characteristic of soil maps and do not affect the usefulness of the maps for
assessment purposes.
Because each component would likely have a different productivity index, the
productivity index of a complex is the weighted average of the productivity
indexes of its identified components. Inclusions are not considered when
determining the productivity index for a delineation.
Understanding the Calculation of the Soil Productivity Index
For the purpose of defining the agricultural land assessment formula, each of the
approximately 2,400 soil map units in Indiana is assigned a productivity rating.
This rating is based on average estimated crop yields, which in turn are based on
the physical properties of the soil, such as:
slope
moisture holding capacity
natural drainage class
depth of rooting
amount of surface soil remaining
organic matter content
various other soil characteristics.
Soil productivity ratings in Indiana are based on corn yield estimates. Estimated
corn yields are the most convenient and reliable yield estimates since no other
crop is grown on a wider range of soils or over a larger area in the state.
Estimated corn yields are based on an average level of crop management and
reflect a 10-year average. Estimates of corn yields for particular soil map units are
tested using data collected by Purdue University and the U.S. Department of
Agriculture, Natural Resource Conservation Service from field trials, yield tests,
and producer experiences. An average level of crop management is assumed to
account for variations in the amount of fertilizer used, time of planting, hybrid
performance, and tillage systems--crop management factors that can cause yield
differences. Thus, the soil productivity ratings reflect the yield differences caused
by the properties of the soil, not the crop management decisions made by
agricultural producers.
The productivity factor for a soil map unit is calculated by dividing the estimated
10-year average corn yield (calculated in bushels per acre) by 100. Productivity
factors do not accurately predict the actual yields for a particular year since

Chapter 2 Land
Real Property Assessment Guidelines Page 96
weather has a great influence on actual yields. However, you can think of the soil
productivity index as a relative ranking of soil map units. The more productive the
soil, the higher the rating. The best soil in the state has a productivity factor of
approximately 1.28; the poorest soil has a productivity factor of .50.
Valuing Strip Mined Agricultural Land
If coal has been strip mined from agricultural land subsequent to the creation of
the detailed soil map for the area, the assessor must apply a special productivity
factor to that land:
For land strip mined on or before December 31, 1977, identify the ―Soil I.D.‖
as ―SBD7‖ and apply a productivity factor of .75.
For land strip mined after December 31, 1977, identify the ―Soil I.D.‖ as
―SAD7‖ and apply a productivity factor of .68.
Valuation of Oil and Gas Interests
Oil or gas interests include, but are not limited to; royalties, overriding royalties,
mineral rights, or working interests in any oil or gas located on or beneath the
surface of the land.
An oil or gas interest is subject to assessment and taxation as real property
annually by the assessing official. This interest is assessed to the person who
owns or operates each oil or gas interest. The total assessed value of interest in
oil located on or beneath the surface or of interest in gas located beneath the
surface of a particular tract of land equals the product of the following:
The average daily production of the oil;
Three hundred and sixty-five (365); and
One hundred percent (100%) of the posted price of oil on the assessment
date
A piece of equipment is an appurtenance to the land and assessable as real
property annually by the assessing official if it is incidental to and necessary for
the production of oil and gas from the land covered by the oil or gas interest.
Each of the appurtenances is assessed to the person who owns or operates the
working interest in the oil or gas interest. This equipment includes, but is not
limited to, the following: wells, pumping units, lines, treaters, separators, tanks,
and secondary recovery facilities.
The assessing official must apportion the total assessed value of all interests in the
oil or gas among the owners of those interests.
Completing the Land Data and Computations Section of the Property Record Card for
Agricultural Acreage

Chapter 2 Land
Real Property Assessment Guidelines Page 97
The valuation of agricultural land is recorded in the ―Land Data and
Computations‖ section of the property record card. Space is provided in the table
to itemize areas of land categorized as Type 2 through Type 7. Each row
corresponds to one area of land based on soil map unit delineations. Acreage
categorized as Type 8 or Type 9, and adjustments, are recorded in the area to the
right of the table.
Note: If the property has more areas of land than there are rows in this section of
the property record card, use an additional card (or cards) to describe those areas.
The steps for completing the property record card for agricultural acreage are
grouped into the following tasks, described in the sections below:
Task 1 Record information for each land area, calculate the land value for
each land area, and calculate the land value for all of the land areas.
Task 2 Record information about special acreage and calculate the total
number of acres of farmland.
Task 3 Calculate the land value of farmland.
Task 4 Calculate the land value of classified land.
Task 5 Calculate the total farmland/classified land value.
Task 6 Calculate the land value of homesite(s) and agricultural excess
acres.
Task 1—Determining the Land Value for the Land Areas
In this task, you record information about each agricultural land area that is
categorized as Type 2 through Type 7, and calculate the land value for the area.
Each row corresponds to a land area. A land area is an area delineated on a
detailed soil map and identified by its soil map unit. After you have calculated the
land value for each land area, you sum these values to determine the land value
for all of the land areas listed.
To record information about each land area, perform these steps:
Step 1 In the ―Land Type‖ column, enter the land use type for the land area.
Table 2-24 describes the land use types. Detailed descriptions of each land
use type are provided in the section Classifying Agricultural Land into
Land Use Types in this chapter.
Note: Acreage classified as Type 8 (agricultural support land) or Type 9
(agricultural homesite) is not valued in this part of the ―Land Data and
Computations‖ section.

Chapter 2 Land
Real Property Assessment Guidelines Page 98
Table 2-24. Agricultural Land Use Types
This type Indicates
21 Classified forest land
22 Wildlands
24 Classified windbreak land
25 Classified filter strip land
4 Tillable land
41 Tillable land that floods occasionally
42 Tillable land that floods severely
43 Designated farmed wetlands
5 Nontillable land
6 Woodland
71 Other farmland: land used for farm buildings and barn
lots
72 Other farmland: land covered with a farm pond or
running water
73 Other farmland: designated wetlands
81 Agricultural support land: legal ditch
82 Agricultural support land: public road right-of-way
83 Agricultural support land: land on which public utility
transmission towers are situated
9 One-acre homesite
92 Agricultural excess acres
Step 2 In the ―Soil I.D.‖ column, enter the letter code that identifies the soil map
unit (or complex) for the land area and is found on the detailed soil survey
map. Information about soil map units is provided in the section Soil Map
Units and the section Soil Complexes in this chapter.
Step 3 In the ―Measured Acreage‖ column, enter the area (in acres) of the land
area.
Note: An agricultural parcel of less than 2.5 acres does not require delineation
of soil types.
Step 4 In the ―Productivity Factor‖ column, enter the productivity factor
corresponding to the land area‘s soil map unit (recorded in the ―Soil I.D.‖
column). Information about soil productivity factors is provided in the
section Understanding the Calculation of the Soil Productivity Index in
this chapter.

Chapter 2 Land
Real Property Assessment Guidelines Page 99
Note: For the Type 72 (land covered with a farm, pond or running water) and the
Type 73 (designated wetlands) land use types, use a productivity factor of .50
instead of the productivity factor associated with the soil map unit.
Step 5 In the ―Base Rate‖ column, record the state-wide base rate established for
valuing farmland soil productivity.
Step 6 Calculate the adjusted rate for the land area by multiplying the base rate
(entered in the ―Base Rate‖ column) by the productivity factor (entered in
the ―Productivity Factor‖ column:
Adjusted rate = Base rate x Productivity factor
Round the adjusted rate to the nearest $1 and enter it in the ―Adjusted
Rate‖ column.
Step 7 Calculate the estimated value of the land area by multiplying the adjusted
rate (entered in the ―Adjusted Rate‖ column) by the measured acreage
(entered in the ―Measured Acreage‖ column):
Estimated value = Adjusted rate x Measured acreage
Round the estimated value to the nearest $10 and enter it in the ―Estimated
Value‖ column.
Step 8 In the ―Influence Factor‖ column, indicate the influence factor, if any,
applicable to the land area based on its land use type. Enter a minus sign
(―–‖), the influence factor, and a percent sign (―%‖). Table 2-25 lists the
automatic influence factor associated with each land use type.

Chapter 2 Land
Real Property Assessment Guidelines Page 100
Table 2-25. Influence Factors for Agricultural Acreage
For this
land use type
Use this influence
factor deduction
21 – 100%
22 – 100%
24 – 100%
25 – 100%
4 None
41 – 30%
42 – 50%
43 – 50%
5 – 60%
6 – 80%
71 – 40%
72 – 40%
73 – 40%
Step 9 If an influence factor does not apply to the land area, enter the estimated
value (entered in the ―Estimated Value‖ column) in the ―Land Value‖
column.
If an influence factor applies to the land area, calculate the land value for
the land area by adjusting the estimated value (entered in the ―Estimated
Value‖ column) by the influence factor (entered in the ―Influence Factor‖
column):
Land value = Estimated value x (1.00 - influence factor percentage)
Round the land value to the nearest $10 and enter it in the ―Land Value‖
column.
Step 10 Perform Step 1 through Step 8 for each land area identified for the
property. If you run out of rows in the ―Land Data and Computations‖
section of the property record card, use an additional card (or cards).
Step 11 If you used only one property record card to describe the land areas for
the property, sum the entries in the ―Measured Acreage‖ column and enter
the total in the ―Measured Acreage‖ cell at the bottom of the column.

Chapter 2 Land
Real Property Assessment Guidelines Page 101
If you used more than one property record card to describe the land areas
for the property:
a. On each card except Card 001, sum the entries in the ―Measured
Acreage‖ column and enter the total in the ―Measured Acreage‖ cell at the
bottom of the column.
b. Sum the entries in the ―Measured Acreage‖ cell of all of the property
record cards except Card 001. Enter the total in the ―Supplemental Card‖
cell at the bottom of the ―Measured Acreage‖ column on Card 001.
c. On Card 001, sum the entries in the ―Measured Acreage‖ column,
including the entry in the ―Supplemental Card‖ cell. Enter the grand total
in the ―Measured Acreage‖ cell at the bottom of the column on Card 001.
Step 12 If you used only one property record card to describe the land areas for
the property, sum the entries in the ―Land Value‖ column and enter the
total in the ―Land Value‖ cell at the bottom of the column.
If you used more than one property record card to describe the land areas
for the property:
a. On each card except Card 001, sum the entries in the ―Land Value‖
column and enter the total in the ―Land Value‖ cell at the bottom of the
column.
b. Sum the entries in the ―Land Value‖ cell of all of the property record
cards except Card 001. Enter the total in the ―Supplemental Card‖ cell at
the bottom of the ―Land Value‖ column on Card 001.
c. On Card 001, sum the entries in the ―Land Value‖ column, including
the entry in the ―Supplemental Card‖ cell. Enter the grand total in the
―Land Value‖ cell at the bottom of the column on Card 001.
Task 2—Calculating the Total Farmland Acreage
In this task, you record information about agricultural acreage that is categorized
as Type 8 (agricultural support land) or Type 9 (agricultural homesite), and
calculate the total number of acres of farmland for the property.
To record information about special agricultural acreage and to calculate the total
farmland acreage, perform these steps:
Step 1 In the ―Parcel Acreage‖ cell, enter the total number of acres in the parcel.
Step 2 In the ―81 Legal Drain NV‖ cell, enter the number of acres categorized as
Type 81 (legal ditch).
Note: Descriptions of the Type 8 land use types are provided in the section
Type 8—Agricultural Support Land in this chapter.

Chapter 2 Land
Real Property Assessment Guidelines Page 102
Step 3 In the ―82 Public Roads NV‖ cell, enter the number of acres categorized as
Type 82 (public road right-of-way).
Step 4 In the ―83 UT Towers NV‖ cell, enter the number of acres (.125 acre per
tower) categorized as Type 83 (utility transmission towers).
Step 5 In the ―Homesite (s)‖ cell, enter the number of acres (1 acre per dwelling)
categorized as agricultural homesite acreage.
Note: A description of the Type 9 (agricultural homesite) land use type is
provided in the section Type 9—Homesite in this chapter.
Step 6 In the ―92 Agricultural Excess Acres‖ cell, enter the number of acres
categorized as Type 92 (agricultural excess acres).
Step 7 Sum the acres entered in the following cells:
―81 Legal Drain NV‖
―82 Public Roads NV‖
―83 UT Towers NV‖
―9 Homesite(s)‖
―92 Agricultural Excess Acres‖.
Step 8 Calculate the total farmland acreage by subtracting the sum calculated in
Step 7 from the parcel acreage (entered in the ―Parcel Acreage‖ cell):
Total farmland
acreage
= Parcel Acreage – Sum calculated in Step 7
Enter the total farmland acreage in the ―Total Acres Farmland‖ cell.
Task 3—Calculating the Value of Farmland
To calculate the value of farmland for the property, you use the measured acreage
and land value calculated in Task 1 to determine the average farmland value per
acre. Then you apply this average value to the total number of acres of farmland,
calculated in Task 2.
To calculate the land value of farmland for the property, perform these steps:
Step 1 In the ―Farmland Value‖ cell below the ―Total Acres Farmland‖ cell, enter
the land value calculated for all of the land areas in Task 1, Step 12
(entered in the ―Land Value‖ cell at the bottom of the ―Land Value‖
column).
Step 2 In the ―Measured Acreage‖ cell, enter the total measured acreage
calculated for all of the land areas in Task 1, Step 11 (entered in the
―Measured Acreage‖ cell at the bottom of the ―Measured Acreage‖
column.
Chapter 2 Land
Real Property Assessment Guidelines Page 103
Step 3 Calculate the average farmland value per acre by dividing the farmland
value (entered in the ―Farmland Value‖ cell) by the measured acreage
(entered in the ―Measured Acreage‖ cell):
Average farmland
value per acre
= Farmland value Measured acreage
Round the average farmland value per acre to the nearest $1 and enter it in
the ―Average Farmland Value / Acre‖ cell.
Step 4 Calculate the value of farmland acreage by multiplying the total farmland
acreage (entered in the ―Total Acres Farmland‖ cell) by the average
farmland value per acre:
Value of
farmland acreage
= Total acres
farmland
x Average farmland
value per acre
Round the value of farmland acreage to the nearest $10 and enter it in the
―Value of Farmland‖ cell.
Task 4—Calculating the Value of Classified Land
To calculate the value for classified land ($1 per acre), perform these steps:
Step 1 Determine the total acreage of classified land by summing the measured
acreage (entered in the ―Measured Acreage‖ column) of all land areas
assigned to the Type 2 land use type (entered in the ―Land Type‖ column).
Step 2 Calculate the classified land adjustment by multiplying the total classified
land acreage (calculated in Step 1) by $1:
Classified land
value
= Total classified
land acreage
x $1
Enter the value of classified land in the ―Classified Land Total‖ cell
Task 5—Calculating the Total Farmland/Classified Land Value
To calculate the total farmland/classified land value for the property sum the
value of farmland (entered in the ―Value of Farmland‖ cell) and the value for
classified land (entered in the ―Classified Land Total‖ cell):
Total farmland/classified
land value
= Value of
farmland
+ Classified land
value
Round the total farmland/classified land value to the nearest $100 and enter it in the ―Total
Farmland/Classified Land Value‖ cell.
Chapter 2 Land
Real Property Assessment Guidelines Page 104
Task 6—Calculating the Land Value of the Homesite(s) and Agricultural Excess Acres
To calculate the land value of the homesite(s) and agricultural excess acres
perform the following steps:
Step 1 Enter the value determined for all homesites on the property in the
―Homesite(s) Value‖ cell. Information about valuing homesites is
provided in the section Valuing Residential Acreage and Agricultural
Homesites in this chapter.
Step 2 Enter the value determined for all agricultural excess acres on the property
in the ―Ag Excess Acres‖ cell. Information about valuing agricultural
excess acres is provided in the section Classifying Agricultural Land into
Land Use Types in this chapter.
Round the land values determined in Steps 1 and 2 to the nearest $100.
Completing the Valuation Record Section of the Property Record Card
Complete the ―Valuation Record‖ section of the property record card, and sign
and date the card, after you have valued the real property as outlined in the
Manual and Guidelines.
Figure 2-15 shows the ―Valuation Record‖ section of the Agricultural Property
Record Card.
Figure 2-16 shows the ―Valuation Record‖ section of the Residential Property
Record Card.
Figure 2-17 shows the ―Valuation Record‖ section of the Commercial and
Industrial Property Record Card.

Chapter 2 Land
Real Property Assessment Guidelines Page 105
Figure 2-15. Valuation Record Section of the Agricultural Property Record Card
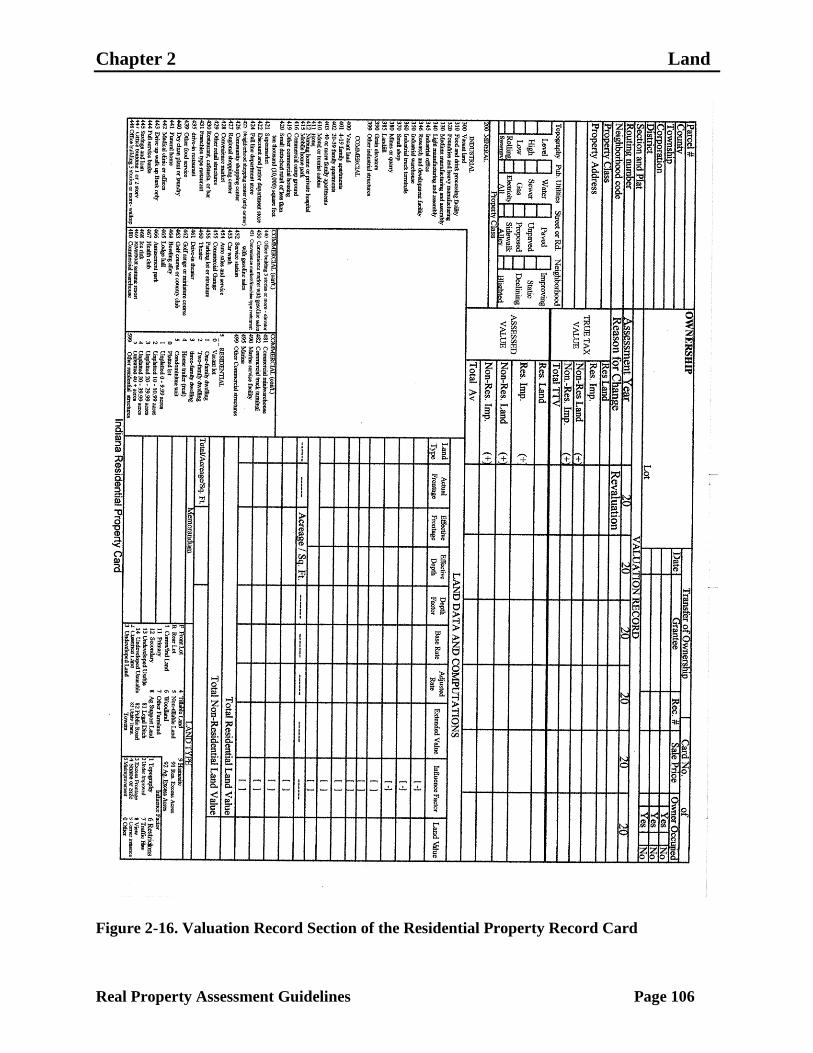
Chapter 2 Land
Real Property Assessment Guidelines Page 106
Figure 2-16. Valuation Record Section of the Residential Property Record Card

Chapter 2 Land
Real Property Assessment Guidelines Page 107
Figure 2-17. Valuation Record Section of the Commercial and Industrial Property Record
Card

Chapter 2 Land
Real Property Assessment Guidelines Page 108
Figure 2-18. Area for Signing and Dating a Property Record Card

Chapter 2 Land
Real Property Assessment Guidelines Page 109
To complete the ―Valuation Record‖ sections of the Agricultural, Residential, and
Commercial and Industrial Property Record Cards, and to sign and date the cards,
perform these steps:
Step 1 In the ―Assessment Year‖ row, enter the year when the assessment is
being conducted.
Step 2 If the assessment is being conducted as part of a general reassessment,
―Revaluation‖ appears in the ―Reason for Change‖ row.
If the assessment is being conducted to change the valuation of the
property for a particular reason, enter the reason for the change in the
―Reason for Change‖ row.
Step 3a Complete the ―True Tax Value‖ rows (Agricultural Property Record
Card):
a. In the ―Res Land‖ row, enter the amount recorded in the ―Homesite(s)
Value‖ cell from the ―Land Data and Computations‖ section of the
property record card.
b. In the ―Res Imp‖ row, enter the amount recorded in the ―Total
Residential Improvement Value‖ cell from the ―Summary of Residential
Improvements‖ section of the property record card.
c. Carry the value determined in sub step a to the ―Adj. Res Land‖ row,
and from sub step b to the ―Adj. Res Imp‖ row.
d. In the ―Ag Excess Land‖ row, enter the amount recorded in the ―92 Ag
Excess Acres‖ cell from the ―Land Data and Computations‖ section of the
property record card.
e. In the ―Non-Res Imp‖ row, enter the amount recorded in the ―Total
Non-Residential Improvement Value‖ cell from the ―Summary of Non-
Residential Improvements‖ section of the property record card.
f. In the ―Farm/Classified Land‖ row, enter the amount recorded in the
"Total Farmland/Classified Land Value‖ cell from the ―Land Data and
Computations‖ section of the property record card.
g. Calculate the total true tax value of the property by summing the ―Adj
Res Land‖ cell, ―Adj Res Imp‖ cell, ―Ag Excess Land‖ cell, ―Non-Res
Imp‖ cell, and ―Farm/Classified Land cell:
h.
Total
True Tax
Value
= Adj.
Res
land
+ Adj.
Res
Imp
+ Ag.
Excess
Land
+ Non-Res
Imp
+ Farm/Classified
Land

Chapter 2 Land
Real Property Assessment Guidelines Page 110
i. Enter the total true tax value, rounded to the nearest $100, in the
―Total TTV‖ row.
Step 4a Complete the ―Assessed Value‖ rows. The assessed values are 100% of
the true tax values.
a. In the ―Adj Res Land‖ row, enter the assessed value of the property‘s
adjusted residential land.
b. In the ―Adj Res Imp‖ row, enter the assessed value of the property‘s
adjusted residential improvements.
c. In the ―Ag Excess Land‖ row, enter the assessed value of the
property‘s agricultural excess acres.
d. In the ―Non-Res Imp‖ row, enter the assessed value of the property‘s
non-residential improvements.
e. In the ―Farm/Classified Land‖ row, enter the assessed value of the
property‘s farmland and classified land.
f. Calculate the total assessed value by summing the ―Adj Res Land‖
cell, ―Adj Res Imp‖ cell, ―Ag Excess Land‖ cell, ―Non-Res Imp‖ cell, and
―Farm/Classified Land cell:
Total
Assessed
Value
= Adj.
Res
Land
+ Adj.
Res
Imp
+ Ag.
Excess
Land
+ Non-Res
Imp
+ Farm/Classified
Land
Enter the total assessed value, rounded to the nearest $100, in the ―Total
AV‖ row.
If an equalization factor is to be applied at the county level, enter (in the
―Reason for Change‖ row) ―County Equalization‖ in the column just to
the right of the valuation being equalized. If an equalization factor is to be
applied at the state level, enter (in the ―Reason for Change‖ row) ―State
Equalization‖ in the column just to the right of the valuation being
equalized. The Department of Local Government Finance will be
promulgating an equalization rule, which will provide more detailed
information on the application of equalization factors.
In the assessment of agricultural properties, an equalization factor would
only apply to the rows ―Res Land‖, ―Res Imp‖, ―Ag Excess Land‖, and
―Non-Res Imp‖.

Chapter 2 Land
Real Property Assessment Guidelines Page 111
Step 3b Complete the ―True Tax Value‖ rows (Residential Property Record
Card)
a. In the ―Res Land‖ row, enter the amount recorded in the ―Total
Residential Land Value‖ cell from the ―Land Data and Computations‖
section of the property record card.
b. In the ―Res Imp‖ row, enter the amount recorded in the ―Total
Residential Improvement Value‖ cell from the ―Summary of Residential
Improvements‖ section of the property record card.
c. In the ―Non-Res Land‖ row, enter the amount recorded in the ―Total
Non-Residential Land Value‖ cell from the ―Land Data and
Computations‖ section of the property record card.
d. In the ―Non-Res Imp‖ row, enter the amount recorded in the ―Total
Non-Residential Improvement Value‖ cell from the ―Summary of Non-
Residential Improvements‖ section of the property record card.
e. Calculate the total true tax value of the property by summing the ―Adj
Res Land‖ cell, ―Adj Res Imp‖ cell, ―Non-Res Land‖ cell, and ―Non-Res
Imp‖ cell.
Total True
Tax Value
= Adj. Res
Land
+ Adj. Res
Imp
+ Non-Res
Land
+ Non-Res
Imp
Enter the total true tax value in the ―Total TTV‖ row.
Step 4b Complete the ―Assessed Value‖ rows. The assessed values are 100%
of the true tax values.
a. In the ―Adj Res Land‖ row, enter the assessed value of the property‘s
adjusted residential land.
b. In the ―Adj Res Imp‖ row, enter the assessed value of the property‘s
adjusted residential improvements.
c. In the ―Non-Res Land‖ row, enter the assessed value of the property‘s
non-residential land.
d. In the ―Non-Res Imp‖ row, enter the assessed value of the property‘s
non-residential improvements.
e. Calculate the total assessed value by summing the ―Adj Res Land‖
cell, ―Adj Res Imp‖ cell, ―Non-Res Land‖ cell, and ―Non-Res Imp‖ cell:
f.

Chapter 2 Land
Real Property Assessment Guidelines Page 112
Total Assessed
Value
= Adj. Res
Land
+ Adj. Res
Imp
+ Non-Res
Land
+ Non-Res
Imp
Enter the total assessed value in the ―Total AV‖ row.
If an equalization factor is to be applied at the county level, enter (in the ―Reason
for Change‖ row) ―County Equalization‖ in the column just to the right of the
valuation being equalized. If an equalization factor is to be applied at the state
level, enter (in the ―Reason for Change‖ row) ―State Equalization‖ in the column
just to the right of the valuation being equalized. The Department of Local
Government Finance will be promulgating an equalization rule, which will
provide more detailed information on the application of equalization factors.
In the assessment of residential properties, an equalization factor would only
apply to the rows ―Res Land‖, ―Res Imp‖, ―Non-Res Land‖, and ―Non-Res Imp‖.
Step 3c Complete the ―True Tax Value‖ rows (Commercial and Industrial
Property Record Card):
a. In the ―Land‖ row, enter the amount recorded in the ―Total True Tax
Land Value‖ cell from the ―Land Data and Computations‖ section of the
property record card.
b. In the ―Improvements‖ row, enter the amount recorded in the ―Total
True Tax Improvement Value‖ cell from the ―Summary of Improvements‖
section of the property record card.
c. Calculate the total true tax value of the property by summing the true
tax value of the property‘s land (entered in the ―Land‖ row) and the true
tax value of the property‘s improvements (entered in the ―Improvements‖
row):
Total true tax value = True tax value of land + True tax value of
improvements
d. Enter the total true tax value in the ―Total TTV‖ row.
Step 4c Complete the ―Assessed Value‖ rows. The assessed values are 100%
of the true tax values.
a. In the ―Land‖ row, enter the assessed value of the property‘s land.
b. In the ―Improvements‖ row, enter the assessed value of the property‘s
improvements.

Chapter 2 Land
Real Property Assessment Guidelines Page 113
c. Calculate the total assessed value of the property by summing the
assessed value of the property‘s land (entered in the ―Land‖ row) and the
assessed value of the property‘s improvements (entered in the
―Improvements‖ row):
Total Assessed Value = Assessed value of
land
+ Assessed value
of improvements
d. Enter the total assessed value, rounded to the nearest $100, in the
―Total AV‖ row.
If an equalization factor is to be applied at the county level, enter (in the
―Reason for Change‖ row) ―County Equalization‖ in the column just to
the right of the valuation being equalized. If an equalization factor is to be
applied at the state level, enter (in the ―Reason for Change‖ row) ―State
Equalization‖ in the column just to the right of the valuation being
equalized. The Department of Local Government Finance will be
promulgating an equalization rule, which will provide more detailed
information on the application of equalization factors.
In the assessment of commercial and industrial properties, an equalization
factor would be applicable to the ―Total TTV‖.
Step 5 In the ―Data Collector/Date‖ cell, have the data collector sign and date the
Property Record Card.
Step 6 In the ―Appraiser/Date‖ cell, have the appraiser sign and date the Property
Record Card.
Related Documents