Chapter 2 INFRASTRUCTURES FOR BRAZIL’S DIGITAL ECONOMY 29 OECD REVIEWS OF DIGITAL TRANSFORMATION: GOING DIGITAL IN BRAZIL © OECD 2020

Welcome message from author
This document is posted to help you gain knowledge. Please leave a comment to let me know what you think about it! Share it to your friends and learn new things together.
Transcript
Chapter 2
INFRASTRUCTURES FOR BRAZIL’S DIGITAL ECONOMY
29OECD REVIEWS OF DIGITAL TRANSFORMATION: GOING DIGITAL IN BRAZIL © OECD 2020
Recent developments in the Brazilian communication market
The availability of high-quality and fixed and mobile communication services at competitive prices are crucial to go digital. In Brazil, one of the most important challenges in this domain concerns expanding quality broadband to rural and remote areas. With a geographical size of 8.5 million square kilometres (km2), the country has an area approximately eight times the size of France and Spain combined, while comprising 60% of the Amazon forest within its borders. In addition, a large percentage of the population is sparsely distributed, which exacerbates the issue. This geographical feature creates important challenges for Brazil to expand communication networks in rural and remote areas.
Overview of the Brazilian communication market
A range of indicators can be examined to assess recent developments in communication markets in Brazil. A key starting point is the size of the communication sector, both in terms of revenues and investments, as well as the overall growth in access paths (i.e. subscriptions to communication services).
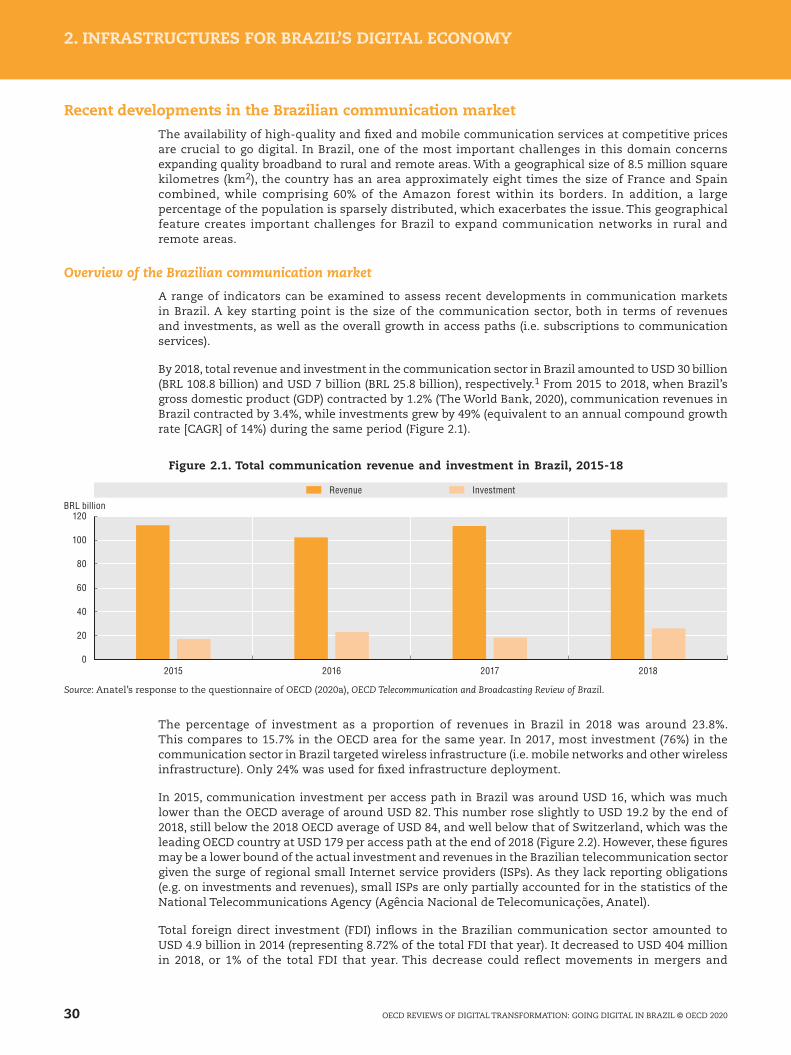
By 2018, total revenue and investment in the communication sector in Brazil amounted to USD 30 billion (BRL 108.8 billion) and USD 7 billion (BRL 25.8 billion), respectively.1 From 2015 to 2018, when Brazil’s gross domestic product (GDP) contracted by 1.2% (The World Bank, 2020), communication revenues in Brazil contracted by 3.4%, while investments grew by 49% (equivalent to an annual compound growth rate [CAGR] of 14%) during the same period (Figure 2.1).
Figure 2.1. Total communication revenue and investment in Brazil, 2015-18
0
20
40
60
80
100
120
2015 2016 2017 2018
BRL billion
Revenue Investment
Source: Anatel’s response to the questionnaire of OECD (2020a), OECD Telecommunication and Broadcasting Review of Brazil.
The percentage of investment as a proportion of revenues in Brazil in 2018 was around 23.8%. This compares to 15.7% in the OECD area for the same year. In 2017, most investment (76%) in the communication sector in Brazil targeted wireless infrastructure (i.e. mobile networks and other wireless infrastructure). Only 24% was used for fixed infrastructure deployment.
In 2015, communication investment per access path in Brazil was around USD 16, which was much lower than the OECD average of around USD 82. This number rose slightly to USD 19.2 by the end of 2018, still below the 2018 OECD average of USD 84, and well below that of Switzerland, which was the leading OECD country at USD 179 per access path at the end of 2018 (Figure 2.2). However, these figures may be a lower bound of the actual investment and revenues in the Brazilian telecommunication sector given the surge of regional small Internet service providers (ISPs). As they lack reporting obligations (e.g. on investments and revenues), small ISPs are only partially accounted for in the statistics of the National Telecommunications Agency (Agência Nacional de Telecomunicações, Anatel).
Total foreign direct investment (FDI) inflows in the Brazilian communication sector amounted to USD 4.9 billion in 2014 (representing 8.72% of the total FDI that year). It decreased to USD 404 million in 2018, or 1% of the total FDI that year. This decrease could reflect movements in mergers and
30 OECD REVIEWS OF DIGITAL TRANSFORMATION: GOING DIGITAL IN BRAZIL © OECD 2020
2. INFRASTRUCTURES FOR BRAZIL’S DIGITAL ECONOMY 2. INFRASTRUCTURES FOR BRAZIL’S DIGITAL ECONOMY

acquisitions, as well as the nature of FDI, which is sensitive to a country’s economic cycle, reflecting a degree of volatility, such as the one experienced after investments related to the World Cup and Olympic Games in 2014 and 2015.
Figure 2.2. Communication investment per access path in Brazil and the OECD
020406080
100120140160180200
USD 2015 2018
Switzerl
and
United
States
Norway
Canad
a
New Ze
aland
Denmark
Icelan
d
Belgium
Sloven
ia
Sweden
Franc
eOEC
D
Finlan
d
Netherl
ands
Spain
Italy
Luxe
mbour
g
German
yChil
eKor
ea
Slovak
Rep
ublic
Czech
Rep
ublic
Japa
n
Eston
ia
Austri
a
Portug
al
Greece
Latvia
Lithu
ania
Brazil
Mexico
Turke
y
Note: Data for Japan are for 2017 instead of 2018.
Source: OECD (2019d), OECD Telecommunication and Internet Statistics (database), http://dx.doi.org/10.1787/tel_int-data-en (accessed in May 2020).
There are no FDI restrictions for communication services in Brazil. Communication service providers are required to be incorporated under Brazilian law or controlled by a Brazilian company, but these can, in turn, be controlled by a foreign company or individual. In the broadcasting sector, however, foreign companies or individuals cannot hold more than 30% of the total and voting capital of TV broadcasting companies, as established in Article 222 of the Constitution. Removing barriers to FDI could further help meet policy objectives in broadcasting, such as increased investment, employment, competition and media plurality in the sector.
Subscriptions to communication services (i.e. total access paths)2 in Brazil have continued to increase. By 2019, there were 315 million access paths, compared to 202 million in 2008. The growth in access paths has mainly been driven by the growth in mobile broadband subscriptions, which more than tripled between 2012 and 2019, from 59.2 million subscriptions to 196.6 million. In contrast, fixed telephony lines have begun to decrease slightly in Brazil since 2014, as they were being replaced by mobile telephony. Fixed broadband subscriptions have also grown in Brazil, passing from 19.8 million access lines in 2012 to 32.9 million in 2019 (Figure 2.3). Brazil, however, lags behind in fixed broadband penetration compared to OECD countries.
Figure 2.3. Evolution of communication access paths in Brazil, 1996-2019
0
50
100
150
200
250
300
1996
1997
1998
1999
2000
2001
2002
2003
2004
2005
2006
2007
2008
2009
2010
2011
2012
2013
2014
2015
2016
2017
2018
2019
Number of access paths (million)
Total access telephone lines Total mobile cellular subscriptions Fixed broadband subscriptions M2M
Notes: M2M = machine to machine. Data is for December 2019. M2M data corresponds to Q2 2019.
Source: Anatel (2020a), Painéis de Dados: Acessos, https://www.anatel.gov.br/paineis/acessos (accessed on 28 May 2020).
31OECD REVIEWS OF DIGITAL TRANSFORMATION: GOING DIGITAL IN BRAZIL © OECD 2020
2. INFRASTRUCTURES FOR BRAZIL’S DIGITAL ECONOMY 2. INFRASTRUCTURES FOR BRAZIL’S DIGITAL ECONOMY

Availability and quality of communication services
Fixed broadband services
In June 2019, fixed broadband penetration in Brazil (15.5%) was similar to countries in the region such as Chile (18%), Mexico (15%) and Colombia (13.8%). This represented about half of the OECD average of 31.4%, and is well below leading OECD countries with levels above 40% (Figure 2.4). The indicator of subscriptions per 100 inhabitants may not entirely reflect the actual use of broadband services by households or individuals. The number of people using the Internet is considerably higher, as Brazilian households tend to be larger than the average OECD household, and there seems to be a phenomenon in Brazil where neighbours share broadband subscriptions. In fact, in 2018, 20% of Brazilian households declared sharing their Internet connection with one or more neighbours according to the Regional Centre for Studies on the Development of the Information Society (Centro Regional de Estudos para o Desenvolvimento da Sociedade da Informação, CETIC.br/NIC.br) (CGI.br, 2019).
Figure 2.4. Fixed broadband subscriptions in Brazil and the OECD, by technology, June 2019
05
101520253035404550
Per 100 inhabitants
DSL Fibre Satellite Fixed wireless OtherCable
Switzerl
and
Franc
e
Denmark
Netherl
ands
Korea
Norway
German
y
United
Kingdo
m
Belgium
Sweden
Canad
a
Icelan
d
Greece
Portug
al
Luxe
mbour
g
Austra
lia
New Ze
aland
United
States
Spain
Hunga
ry
Eston
iaJa
pan
Finlan
dOEC
D
Czech
Rep
ublic
Irelan
d
Sloven
ia
Austri
aIta
ly
Slovak
Rep
ublic
Israe
l
Lithu
aniaLatv
ia
Poland
Chile
Turke
yBra
zil
Mexico
Colombia
Note: DSL = digital subscriber line.
Sources: OECD (2020b), Broadband Portal (database), www.oecd.org/sti/broadband/broadband-statistics/ (accessed on 20 May 2020); data for Brazil are from Anatel (2020a), Painéis de Dados: Acessos, https://www.anatel.gov.br/paineis/acessos/ (accessed on 28 May 2020).
At the end of June 2019, most fixed broadband subscriptions in Brazil were digital subscriber line (DSL) subscriptions (34% of total broadband subscriptions), followed by fibre subscriptions (24%). While the share of high-speed fibre in Brazil is higher than in Mexico (22%) and Colombia (14%), Brazil still lags behind the OECD average (27%). The gap in terms of fibre is even larger when compared to leading OECD countries, such as Korea, Japan and Lithuania (above 70%) (Figure 2.4).
Another useful indicator to assess the quality of communication services is the penetration rate by speed tiers. In Brazil, more than half of fixed broadband subscriptions (58%) exhibited speeds above 12 Mbps in June 2019. In particular, 25% of fixed broadband subscriptions in Brazil belonged to the “12-34 Mbps” speed- tier, and 33% of subscriptions exhibited speeds above 34 Mbps. In contrast, in Switzerland, the leading OECD country in terms of fixed broadband penetration, 52% of fixed broadband subscriptions had speeds above 100 Mbps (Figure 2.5).
Actual speeds may differ from advertised speeds and can be measured using different methodologies. M-Lab and Ookla compile results from voluntary speed tests by users, while Steam data, for example, reflect the speeds of online gaming users and thus often a more demanding user group of broadband services.3 According to M-Lab data, the average fixed broadband download speed in Brazil was 4.84 Mbps in July 2019, which points to a large gap in comparison to an OECD average of 26.8 Mbps. On the Steam platform, the average download speed for fixed broadband in Brazil was 22.7 Mbps, whereas the OECD average was 36.1 Mbps (Figure 2.6).
32 OECD REVIEWS OF DIGITAL TRANSFORMATION: GOING DIGITAL IN BRAZIL © OECD 2020
2. INFRASTRUCTURES FOR BRAZIL’S DIGITAL ECONOMY 2. INFRASTRUCTURES FOR BRAZIL’S DIGITAL ECONOMY
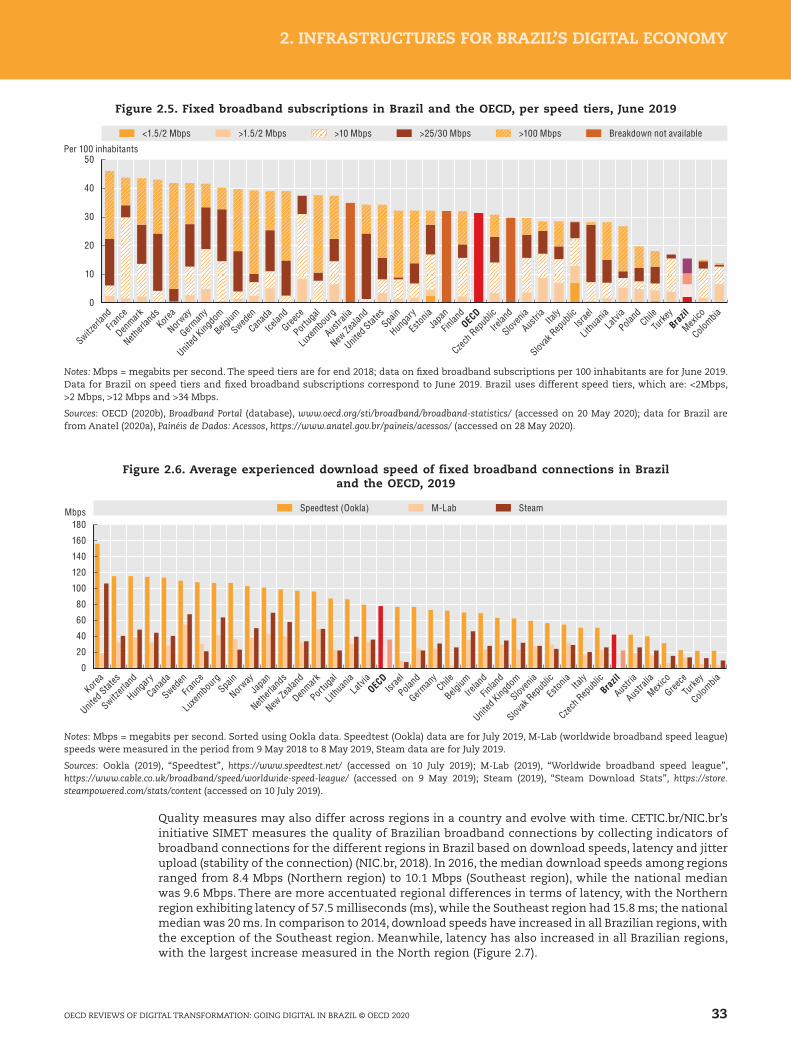
Figure 2.5. Fixed broadband subscriptions in Brazil and the OECD, per speed tiers, June 2019
0
10
20
30
40
50
Switzerl
and
Franc
e
Denmark
Netherl
ands
Korea
Norway
German
y
United
Kingdo
m
Belgium
Sweden
Canad
a
Icelan
d
Greece
Portug
al
Luxe
mbour
g
Austra
lia
New Ze
aland
United
States
Spain
Hunga
ry
Eston
iaJa
pan
Finlan
dOEC
D
Czech
Rep
ublic
Irelan
d
Sloven
ia
Austri
aIta
ly
Slovak
Rep
ublic
Israe
l
Lithu
aniaLatv
ia
Poland
Chile
Turke
yBra
zil
Mexico
Colombia
Per 100 inhabitants
<1.5/2 Mbps >10 Mbps >25/30 Mbps >100 Mbps Breakdown not available>1.5/2 Mbps
Notes: Mbps = megabits per second. The speed tiers are for end 2018; data on fixed broadband subscriptions per 100 inhabitants are for June 2019. Data for Brazil on speed tiers and fixed broadband subscriptions correspond to June 2019. Brazil uses different speed tiers, which are: <2Mbps, >2 Mbps, >12 Mbps and >34 Mbps.
Sources: OECD (2020b), Broadband Portal (database), www.oecd.org/sti/broadband/broadband-statistics/ (accessed on 20 May 2020); data for Brazil are from Anatel (2020a), Painéis de Dados: Acessos, https://www.anatel.gov.br/paineis/acessos/ (accessed on 28 May 2020).
Figure 2.6. Average experienced download speed of fixed broadband connections in Brazil and the OECD, 2019
0
20
40
60
80
100
120
140
160
180
Speedtest (Ookla) SteamM-LabMbps
Korea
United
States
Switzerl
and
Hunga
ry
Canad
a
Sweden
Franc
e
Luxe
mbour
gSpa
in
Norway
Japa
n
Netherl
ands
New Ze
aland
Denmark
Portug
al
Lithu
ania
Latvia
OECD
Israe
l
Poland
German
yChil
e
Belgium
Irelan
d
Finlan
d
United
Kingdo
m
Sloven
ia
Slovak
Rep
ublic
Eston
iaIta
ly
Czech
Rep
ublic
Brazil
Austri
a
Austra
lia
Mexico
Greece
Turke
y
Colombia
Notes: Mbps = megabits per second. Sorted using Ookla data. Speedtest (Ookla) data are for July 2019, M-Lab (worldwide broadband speed league) speeds were measured in the period from 9 May 2018 to 8 May 2019, Steam data are for July 2019.
Sources: Ookla (2019), “Speedtest”, https://www.speedtest.net/ (accessed on 10 July 2019); M-Lab (2019), “Worldwide broadband speed league”, https://www.cable.co.uk/broadband/speed/worldwide-speed-league/ (accessed on 9 May 2019); Steam (2019), “Steam Download Stats”, https://store.steampowered.com/stats/content (accessed on 10 July 2019).
Quality measures may also differ across regions in a country and evolve with time. CETIC.br/NIC.br’s initiative SIMET measures the quality of Brazilian broadband connections by collecting indicators of broadband connections for the different regions in Brazil based on download speeds, latency and jitter upload (stability of the connection) (NIC.br, 2018). In 2016, the median download speeds among regions ranged from 8.4 Mbps (Northern region) to 10.1 Mbps (Southeast region), while the national median was 9.6 Mbps. There are more accentuated regional differences in terms of latency, with the Northern region exhibiting latency of 57.5 milliseconds (ms), while the Southeast region had 15.8 ms; the national median was 20 ms. In comparison to 2014, download speeds have increased in all Brazilian regions, with the exception of the Southeast region. Meanwhile, latency has also increased in all Brazilian regions, with the largest increase measured in the North region (Figure 2.7).
33OECD REVIEWS OF DIGITAL TRANSFORMATION: GOING DIGITAL IN BRAZIL © OECD 2020
2. INFRASTRUCTURES FOR BRAZIL’S DIGITAL ECONOMY 2. INFRASTRUCTURES FOR BRAZIL’S DIGITAL ECONOMY
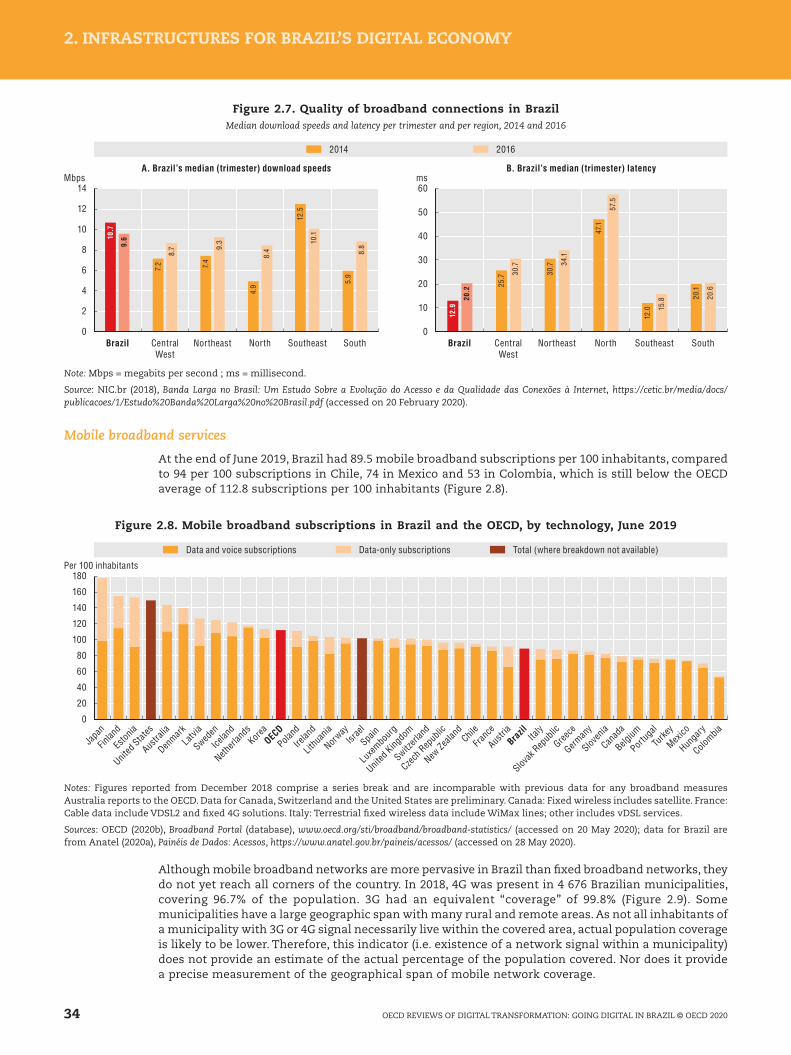
Figure 2.7. Quality of broadband connections in Brazil Median download speeds and latency per trimester and per region, 2014 and 2016
0
10
20
30
40
50
60
0
2
4
6
8
10
12
14
10.7
7.2 7.4
4.9
12.5
5.9
9.6
8.7 9.
3
8.4
10.1
8.8
12.9
25.7 30
.7
47.1
12.0
20.1
20.2
30.7 34
.1
57.5
15.8 20
.6
Mbps ms
2014 2016
Brazil CentralWest
Northeast North Southeast South
A. Brazil’s median (trimester) download speeds B. Brazil’s median (trimester) latency
Brazil CentralWest
Northeast North Southeast South
Note: Mbps = megabits per second ; ms = millisecond.
Source: NIC.br (2018), Banda Larga no Brasil: Um Estudo Sobre a Evolução do Acesso e da Qualidade das Conexões à Internet, https://cetic.br/media/docs/publicacoes/1/Estudo%20Banda%20Larga%20no%20Brasil.pdf (accessed on 20 February 2020).
Mobile broadband services
At the end of June 2019, Brazil had 89.5 mobile broadband subscriptions per 100 inhabitants, compared to 94 per 100 subscriptions in Chile, 74 in Mexico and 53 in Colombia, which is still below the OECD average of 112.8 subscriptions per 100 inhabitants (Figure 2.8).
Figure 2.8. Mobile broadband subscriptions in Brazil and the OECD, by technology, June 2019
0
20
40
60
80
100
120
140
160
180Per 100 inhabitants
Data and voice subscriptions Total (where breakdown not available)Data-only subscriptions
Japa
n
Finlan
d
Eston
ia
United
States
Austra
lia
Denmark
Latvia
Sweden
Icelan
d
Netherl
ands
Korea
OECD
Poland
Irelan
d
Lithu
ania
Norway
Israe
l
Spain
Luxe
mbour
g
United
Kingdo
m
Switzerl
and
Czech
Rep
ublic
New Ze
aland
Chile
Franc
e
Austri
aBra
zil Italy
Slovak
Rep
ublic
Greece
German
y
Sloven
ia
Canad
a
Belgium
Portug
al
Turke
y
Mexico
Hunga
ry
Colombia
Notes: Figures reported from December 2018 comprise a series break and are incomparable with previous data for any broadband measures Australia reports to the OECD. Data for Canada, Switzerland and the United States are preliminary. Canada: Fixed wireless includes satellite. France: Cable data include VDSL2 and fixed 4G solutions. Italy: Terrestrial fixed wireless data include WiMax lines; other includes vDSL services.
Sources: OECD (2020b), Broadband Portal (database), www.oecd.org/sti/broadband/broadband-statistics/ (accessed on 20 May 2020); data for Brazil are from Anatel (2020a), Painéis de Dados: Acessos, https://www.anatel.gov.br/paineis/acessos/ (accessed on 28 May 2020).
Although mobile broadband networks are more pervasive in Brazil than fixed broadband networks, they do not yet reach all corners of the country. In 2018, 4G was present in 4 676 Brazilian municipalities, covering 96.7% of the population. 3G had an equivalent “coverage” of 99.8% (Figure 2.9). Some municipalities have a large geographic span with many rural and remote areas. As not all inhabitants of a municipality with 3G or 4G signal necessarily live within the covered area, actual population coverage is likely to be lower. Therefore, this indicator (i.e. existence of a network signal within a municipality) does not provide an estimate of the actual percentage of the population covered. Nor does it provide a precise measurement of the geographical span of mobile network coverage.
34 OECD REVIEWS OF DIGITAL TRANSFORMATION: GOING DIGITAL IN BRAZIL © OECD 2020
2. INFRASTRUCTURES FOR BRAZIL’S DIGITAL ECONOMY 2. INFRASTRUCTURES FOR BRAZIL’S DIGITAL ECONOMY
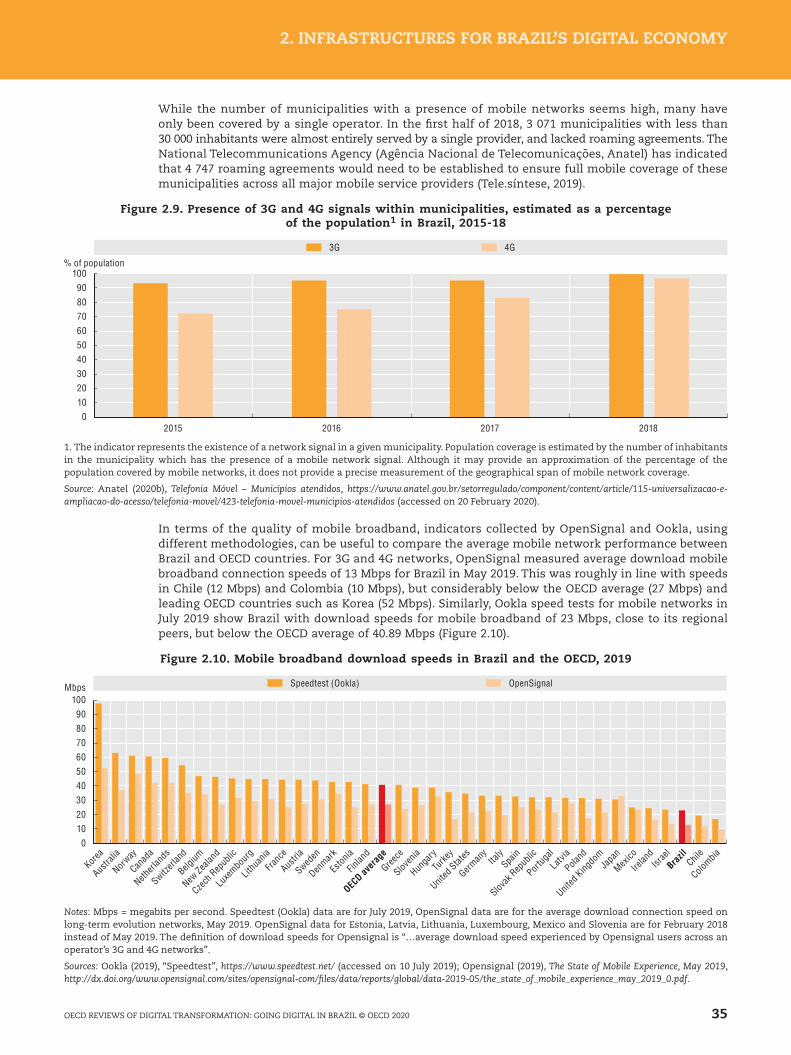
While the number of municipalities with a presence of mobile networks seems high, many have only been covered by a single operator. In the first half of 2018, 3 071 municipalities with less than 30 000 inhabitants were almost entirely served by a single provider, and lacked roaming agreements. The National Telecommunications Agency (Agência Nacional de Telecomunicações, Anatel) has indicated that 4 747 roaming agreements would need to be established to ensure full mobile coverage of these municipalities across all major mobile service providers (Tele.síntese, 2019).
Figure 2.9. Presence of 3G and 4G signals within municipalities, estimated as a percentage of the population1 in Brazil, 2015-18
0102030405060708090
100
2015 2016 2017 2018
% of population
3G 4G
1. The indicator represents the existence of a network signal in a given municipality. Population coverage is estimated by the number of inhabitants in the municipality which has the presence of a mobile network signal. Although it may provide an approximation of the percentage of the population covered by mobile networks, it does not provide a precise measurement of the geographical span of mobile network coverage.
Source: Anatel (2020b), Telefonia Móvel – Municípios atendidos, https://www.anatel.gov.br/setorregulado/component/content/article/115-universalizacao-e-ampliacao-do-acesso/telefonia-movel/423-telefonia-movel-municipios-atendidos (accessed on 20 February 2020).
In terms of the quality of mobile broadband, indicators collected by OpenSignal and Ookla, using different methodologies, can be useful to compare the average mobile network performance between Brazil and OECD countries. For 3G and 4G networks, OpenSignal measured average download mobile broadband connection speeds of 13 Mbps for Brazil in May 2019. This was roughly in line with speeds in Chile (12 Mbps) and Colombia (10 Mbps), but considerably below the OECD average (27 Mbps) and leading OECD countries such as Korea (52 Mbps). Similarly, Ookla speed tests for mobile networks in July 2019 show Brazil with download speeds for mobile broadband of 23 Mbps, close to its regional peers, but below the OECD average of 40.89 Mbps (Figure 2.10).
Figure 2.10. Mobile broadband download speeds in Brazil and the OECD, 2019
0102030405060708090
100Mbps Speedtest (Ookla) OpenSignal
Korea
Austra
lia
Norway
Canad
a
Netherl
ands
Switzerl
and
Belgium
New Ze
aland
Czech
Rep
ublic
Luxe
mbour
g
Lithu
ania
Franc
e
Austri
a
Sweden
Denmark
Eston
ia
Finlan
d
OECD av
erag
e
Greece
Sloven
ia
Hunga
ry
Turke
y
United
States
German
yIta
lySpa
in
Slovak
Rep
ublic
Portug
al
Latvia
Poland
United
Kingdo
mJa
pan
Mexico
Irelan
dIsr
ael
Brazil
Chile
Colombia
Notes: Mbps = megabits per second. Speedtest (Ookla) data are for July 2019, OpenSignal data are for the average download connection speed on long-term evolution networks, May 2019. OpenSignal data for Estonia, Latvia, Lithuania, Luxembourg, Mexico and Slovenia are for February 2018 instead of May 2019. The definition of download speeds for Opensignal is “…average download speed experienced by Opensignal users across an operator’s 3G and 4G networks”.
Sources: Ookla (2019), “Speedtest”, https://www.speedtest.net/ (accessed on 10 July 2019); Opensignal (2019), The State of Mobile Experience, May 2019, http://dx.doi.org/www.opensignal.com/sites/opensignal-com/files/data/reports/global/data-2019-05/the_state_of_mobile_experience_may_2019_0.pdf.
35OECD REVIEWS OF DIGITAL TRANSFORMATION: GOING DIGITAL IN BRAZIL © OECD 2020
2. INFRASTRUCTURES FOR BRAZIL’S DIGITAL ECONOMY 2. INFRASTRUCTURES FOR BRAZIL’S DIGITAL ECONOMY

Another indicator linked to the service experience of mobile subscribers is the amount of data used. The OECD average mobile data usage per month was 4.65 GB in 2018, up from 2.42 in 2016 (out of 34 OECD countries for which data were available). The top OECD countries for data usage in 2018 were Finland (19.4 GB) and Austria (16.4 GB). In comparison, Brazil’s average monthly mobile data consumption was 1.25 GB in 2018, up from 0.47 GB in 2016. Brazil also lags behind its regional peers of Colombia (1.62 GB) and Mexico (2.11 GB) (Figure 2.11).
Figure 2.11. Mobile data usage per mobile broadband subscription in Brazil and the OECD, 2016-18
02468
101214161820
GB per month20182016 2017
Finlan
d
Austri
aLatv
ia
Lithu
ania
Eston
ia
Icelan
d
Denmark
Sweden
Irelan
dChil
eKor
ea
Poland
Switzerl
and
Franc
e
United
States
Norway
Sloven
iaOEC
DTu
rkeyJa
pan
Italy
Luxe
mbour
g
Hunga
ry
Austra
lia
Czech
Rep
ublic
United
Kingdo
mSpa
in
Portug
al
Netherl
ands
German
y
New Ze
aland
Canad
a
Mexico
Belgium
Colombia
Greece
Brazil
Slovak
Rep
ublic
Notes: GB = gigabyte. Methodology: The multiplier 1 024 is used to convert terabyte into gigabyte; the total amount of gigabytes is divided by the yearly average number of mobile broadband subscriptions. For Australia, data reported for December 2018 and onwards are being collected by a new entity using a different methodology. Figures reported from December 2018 comprise a series break and are incomparable with previous data for any broadband measures Australia reports to the OECD.
Sources: OECD (2020b), Broadband Portal (database), www.oecd.org/sti/broadband/broadband-statistics/ (accessed on 20 May 2020); data for Brazil are from Anatel’s response to the questionnaire of OECD (2020a), OECD Telecommunication and Broadcasting Review of Brazil.
Internet of Things
The OECD has been collecting data on machine-to-machine (M2M) embedded mobile cellular subscriptions, a subset of the Internet of Things (IoT), since 2012.4 The OECD has also developed a framework to measure different IoT categories according to their network requirements (OECD, 2018a). By June 2019, there were 298 million M2M subscriptions in the OECD, up from 108 million at the end of 2014. In Brazil, the number of M2M connections has also increased since 2014, passing from 10 million in 2014 to 22 million in June 2019. The level of M2M SIM cards per 100 inhabitants was 22 in the OECD and 10.6 in Brazil in June 2019 (Figure 2.12).
In Brazil, one of the key barriers to the development of the IoT relates to the high taxes and fees for these services. In particular, charging contributions to the Telecommunications Oversight Fund (Fundo de Fiscalização das Telecomunicações, FISTEL) over IoT devices results in those services being partially unprofitable or simply unviable in the country. Beyond taxation issues, establishing separate numbering plans and fostering the deployment of the numbering protocol IPv6 could also foster the IoT in Brazil.
Backhaul and backbone connectivity
Fibre backhaul and backbone connectivity are important to bring fibre closer to the end-user to support projected capacity demands, including those raised by 5G networks (OECD, 2019e). According to Anatel, by 2015, only 48.2% of municipalities in Brazil were served by fibre backhaul. By 2019, this indicator had risen to 70% (Figure 2.13); that is, 3 882 municipalities connected to fibre backhaul. While a municipality may have the presence of backhaul, given the heterogeneity in the size of municipalities, the presence of backhaul is not a measure of full geographic coverage of this wholesale input. Moreover, the presence of fibre backhaul does not imply that the wholesale operator is under any open access obligations (Anatel, 2019b).
36 OECD REVIEWS OF DIGITAL TRANSFORMATION: GOING DIGITAL IN BRAZIL © OECD 2020
2. INFRASTRUCTURES FOR BRAZIL’S DIGITAL ECONOMY 2. INFRASTRUCTURES FOR BRAZIL’S DIGITAL ECONOMY
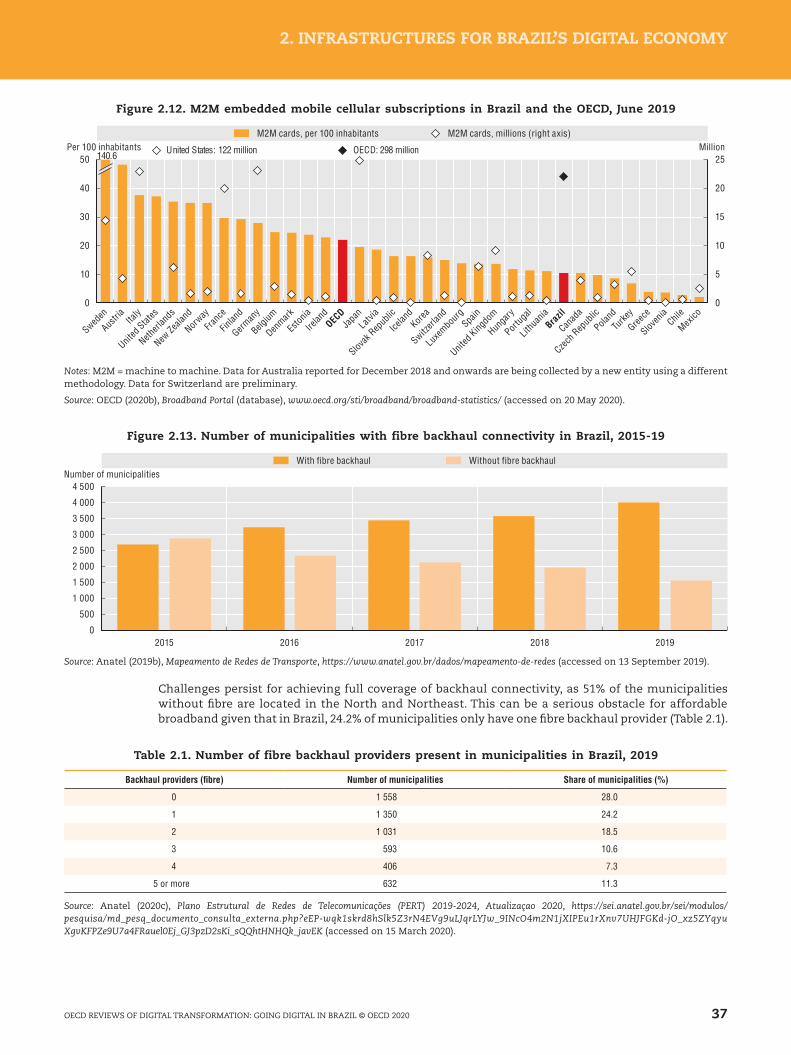
Figure 2.12. M2M embedded mobile cellular subscriptions in Brazil and the OECD, June 2019
0
10
20
30
40
50 25
20
15
10
5
0
Per 100 inhabitants MillionM2M cards, per 100 inhabitants M2M cards, millions (right axis)
140.6
Sweden
Austri
aIta
ly
United
States
Netherl
ands
New Ze
aland
Norway
Franc
e
Finlan
d
German
y
Belgium
Denmark
Eston
ia
Irelan
dOEC
DJa
panLatv
ia
Slovak
Rep
ublic
Icelan
dKor
ea
Switzerl
and
Luxe
mbour
gSpa
in
United
Kingdo
m
Hunga
ry
Portug
al
Lithu
ania
Brazil
Canad
a
Czech
Rep
ublic
Poland
Turke
y
Greece
Sloven
iaChil
e
Mexico
United States: 122 million OECD: 298 million
Notes: M2M = machine to machine. Data for Australia reported for December 2018 and onwards are being collected by a new entity using a different methodology. Data for Switzerland are preliminary.
Source: OECD (2020b), Broadband Portal (database), www.oecd.org/sti/broadband/broadband-statistics/ (accessed on 20 May 2020).
Figure 2.13. Number of municipalities with fibre backhaul connectivity in Brazil, 2015-19
0
500
1 000
1 500
2 000
2 500
3 000
3 500
4 000
4 500
2015 2016 2017 2018 2019
Number of municipalitiesWith fibre backhaul Without fibre backhaul
Source: Anatel (2019b), Mapeamento de Redes de Transporte, https://www.anatel.gov.br/dados/mapeamento-de-redes (accessed on 13 September 2019).
Challenges persist for achieving full coverage of backhaul connectivity, as 51% of the municipalities without fibre are located in the North and Northeast. This can be a serious obstacle for affordable broadband given that in Brazil, 24.2% of municipalities only have one fibre backhaul provider (Table 2.1).
Table 2.1. Number of fibre backhaul providers present in municipalities in Brazil, 2019
Backhaul providers (fibre) Number of municipalities Share of municipalities (%)
0 1 558 28.0
1 1 350 24.2
2 1 031 18.5
3 593 10.6
4 406 7.3
5 or more 632 11.3
Source: Anatel (2020c), Plano Estrutural de Redes de Telecomunicações (PERT) 2019-2024, Atualizaçao 2020, https://sei.anatel.gov.br/sei/modulos/pesquisa/md_pesq_documento_consulta_externa.php?eEP-wqk1skrd8hSlk5Z3rN4EVg9uLJqrLYJw_9INcO4m2N1jXIPEu1rXnv7UHJFGKd-jO_xz5ZYqyu XgvKFPZe9U7a4FRauel0Ej_GJ3pzD2sKi_sQQhtHNHQk_javEK (accessed on 15 March 2020).
37OECD REVIEWS OF DIGITAL TRANSFORMATION: GOING DIGITAL IN BRAZIL © OECD 2020
2. INFRASTRUCTURES FOR BRAZIL’S DIGITAL ECONOMY 2. INFRASTRUCTURES FOR BRAZIL’S DIGITAL ECONOMY
Autonomous systems and IPv6
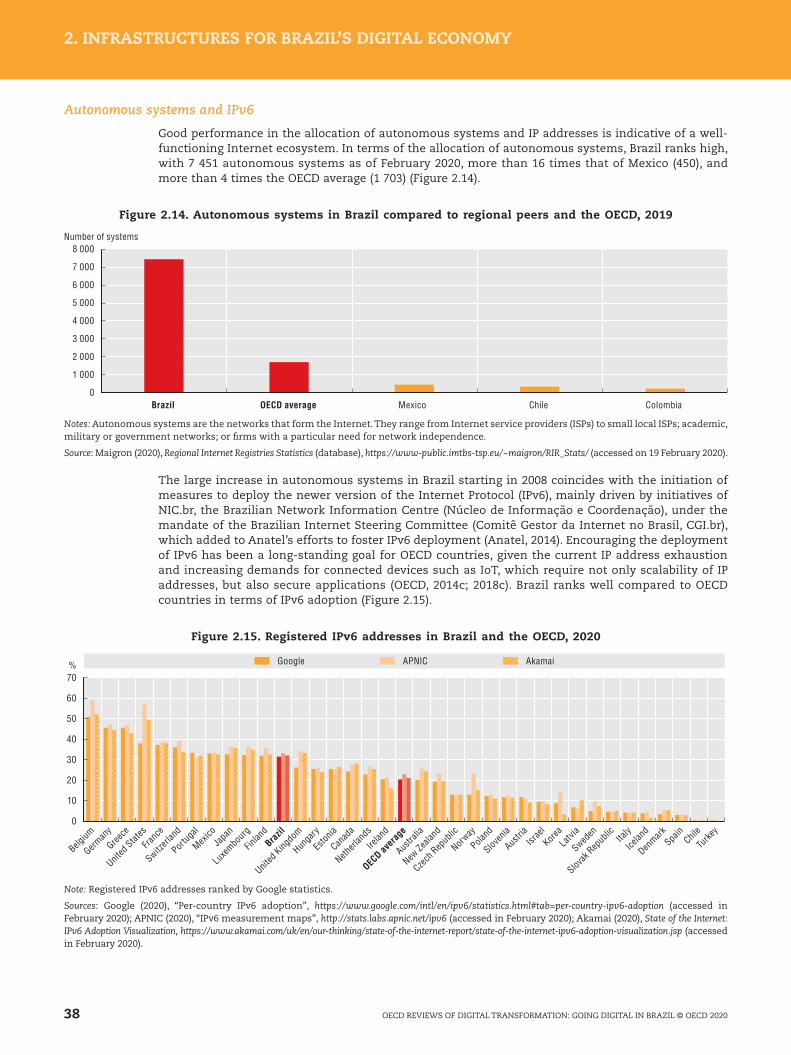
Good performance in the allocation of autonomous systems and IP addresses is indicative of a well-functioning Internet ecosystem. In terms of the allocation of autonomous systems, Brazil ranks high, with 7 451 autonomous systems as of February 2020, more than 16 times that of Mexico (450), and more than 4 times the OECD average (1 703) (Figure 2.14).
Figure 2.14. Autonomous systems in Brazil compared to regional peers and the OECD, 2019
0
1 000
2 000
3 000
4 000
5 000
6 000
7 000
8 000Number of systems
Brazil OECD average Mexico Chile Colombia
Notes: Autonomous systems are the networks that form the Internet. They range from Internet service providers (ISPs) to small local ISPs; academic, military or government networks; or firms with a particular need for network independence.
Source: Maigron (2020), Regional Internet Registries Statistics (database), https://www-public.imtbs-tsp.eu/~maigron/RIR_Stats/ (accessed on 19 February 2020).
The large increase in autonomous systems in Brazil starting in 2008 coincides with the initiation of measures to deploy the newer version of the Internet Protocol (IPv6), mainly driven by initiatives of NIC.br, the Brazilian Network Information Centre (Núcleo de Informação e Coordenação), under the mandate of the Brazilian Internet Steering Committee (Comitê Gestor da Internet no Brasil, CGI.br), which added to Anatel’s efforts to foster IPv6 deployment (Anatel, 2014). Encouraging the deployment of IPv6 has been a long-standing goal for OECD countries, given the current IP address exhaustion and increasing demands for connected devices such as IoT, which require not only scalability of IP addresses, but also secure applications (OECD, 2014c; 2018c). Brazil ranks well compared to OECD countries in terms of IPv6 adoption (Figure 2.15).
Figure 2.15. Registered IPv6 addresses in Brazil and the OECD, 2020
0
10
20
30
40
50
60
70% Google APNIC Akamai
Belgium
German
y
Greece
United
States
Franc
e
Switzerl
and
Portug
al
Mexico
Japa
n
Luxe
mbour
g
Finlan
dBra
zil
United
Kingdo
m
Hunga
ry
Eston
ia
Canad
a
Netherl
ands
Irelan
d
OECD av
erag
e
Austra
lia
New Ze
aland
Czech
Rep
ublic
Norway
Poland
Sloven
ia
Austri
aIsr
aelKor
eaLatv
ia
Sweden
Slovak
Rep
ublic Ita
ly
Icelan
d
Denmark
Spain
Chile
Turke
y
Note: Registered IPv6 addresses ranked by Google statistics.
Sources: Google (2020), “Per-country IPv6 adoption”, https://www.google.com/intl/en/ipv6/statistics.html#tab=per-country-ipv6-adoption (accessed in February 2020); APNIC (2020), “IPv6 measurement maps”, http://stats.labs.apnic.net/ipv6 (accessed in February 2020); Akamai (2020), State of the Internet: IPv6 Adoption Visualization, https://www.akamai.com/uk/en/our-thinking/state-of-the-internet-report/state-of-the-internet-ipv6-adoption-visualization.jsp (accessed in February 2020).
38 OECD REVIEWS OF DIGITAL TRANSFORMATION: GOING DIGITAL IN BRAZIL © OECD 2020
2. INFRASTRUCTURES FOR BRAZIL’S DIGITAL ECONOMY 2. INFRASTRUCTURES FOR BRAZIL’S DIGITAL ECONOMY
Internet exchange points
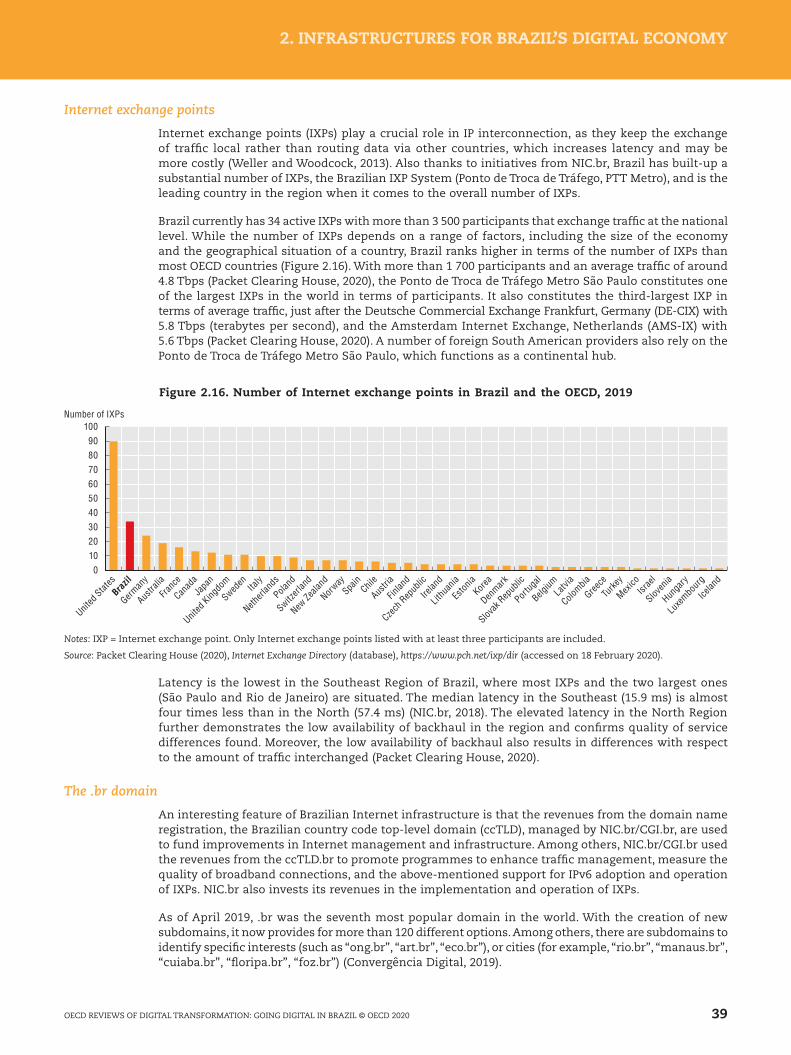
Internet exchange points (IXPs) play a crucial role in IP interconnection, as they keep the exchange of traffic local rather than routing data via other countries, which increases latency and may be more costly (Weller and Woodcock, 2013). Also thanks to initiatives from NIC.br, Brazil has built-up a substantial number of IXPs, the Brazilian IXP System (Ponto de Troca de Tráfego, PTT Metro), and is the leading country in the region when it comes to the overall number of IXPs.
Brazil currently has 34 active IXPs with more than 3 500 participants that exchange traffic at the national level. While the number of IXPs depends on a range of factors, including the size of the economy and the geographical situation of a country, Brazil ranks higher in terms of the number of IXPs than most OECD countries (Figure 2.16). With more than 1 700 participants and an average traffic of around 4.8 Tbps (Packet Clearing House, 2020), the Ponto de Troca de Tráfego Metro São Paulo constitutes one of the largest IXPs in the world in terms of participants. It also constitutes the third-largest IXP in terms of average traffic, just after the Deutsche Commercial Exchange Frankfurt, Germany (DE-CIX) with 5.8 Tbps (terabytes per second), and the Amsterdam Internet Exchange, Netherlands (AMS-IX) with 5.6 Tbps (Packet Clearing House, 2020). A number of foreign South American providers also rely on the Ponto de Troca de Tráfego Metro São Paulo, which functions as a continental hub.
Figure 2.16. Number of Internet exchange points in Brazil and the OECD, 2019
0102030405060708090
100Number of IXPs
United
States
Brazil
German
y
Austra
lia
Franc
e
Canad
aJa
pan
United
Kingdo
m
Sweden Ita
ly
Netherl
ands
Poland
Switzerl
and
New Ze
aland
Norway
Spain
Chile
Austri
a
Finlan
d
Czech
Rep
ublic
Irelan
d
Lithu
ania
Eston
iaKor
ea
Denmark
Slovak
Rep
ublic
Portug
al
Belgium
Latvia
Colombia
Greece
Turke
y
Mexico
Israe
l
Sloven
ia
Hunga
ry
Luxe
mbour
g
Icelan
d
Notes: IXP = Internet exchange point. Only Internet exchange points listed with at least three participants are included.
Source: Packet Clearing House (2020), Internet Exchange Directory (database), https://www.pch.net/ixp/dir (accessed on 18 February 2020).
Latency is the lowest in the Southeast Region of Brazil, where most IXPs and the two largest ones (São Paulo and Rio de Janeiro) are situated. The median latency in the Southeast (15.9 ms) is almost four times less than in the North (57.4 ms) (NIC.br, 2018). The elevated latency in the North Region further demonstrates the low availability of backhaul in the region and confirms quality of service differences found. Moreover, the low availability of backhaul also results in differences with respect to the amount of traffic interchanged (Packet Clearing House, 2020).
The .br domain
An interesting feature of Brazilian Internet infrastructure is that the revenues from the domain name registration, the Brazilian country code top-level domain (ccTLD), managed by NIC.br/CGI.br, are used to fund improvements in Internet management and infrastructure. Among others, NIC.br/CGI.br used the revenues from the ccTLD.br to promote programmes to enhance traffic management, measure the quality of broadband connections, and the above-mentioned support for IPv6 adoption and operation of IXPs. NIC.br also invests its revenues in the implementation and operation of IXPs.
As of April 2019, .br was the seventh most popular domain in the world. With the creation of new subdomains, it now provides for more than 120 different options. Among others, there are subdomains to identify specific interests (such as “ong.br”, “art.br”, “eco.br”), or cities (for example, “rio.br”, “manaus.br”, “cuiaba.br”, “floripa.br”, “foz.br”) (Convergência Digital, 2019).
39OECD REVIEWS OF DIGITAL TRANSFORMATION: GOING DIGITAL IN BRAZIL © OECD 2020
2. INFRASTRUCTURES FOR BRAZIL’S DIGITAL ECONOMY 2. INFRASTRUCTURES FOR BRAZIL’S DIGITAL ECONOMY
To date, around 89% of Brazilian companies use the .br domain and 3% use one of the various Brazilian subdomains (CGI.br, 2018). Nevertheless, high usage of .br does not necessarily indicate that the respective content is also hosted in Brazil. In fact, data collected in 2013 showed that only 54% of Brazilian websites using the ccTLD.br are hosted in the country (OECD, 2014a), which could indicate that certain website owners do not consider it to be cost-effective to host their content locally.
Submarine fibre cables
Another crucial infrastructure for connectivity are submarine cables. In this regard, Brazil is well-served, with a total of 19 cables, giving the country access to a network of cables amounting to almost 180 000 km (TeleGeography, 2020). Many of the landing stations are located in Fortaleza (Northeast), the closest point to Africa and Europe, and in Santos and Rio de Janeiro (Southeast), the most populated region. Seven cables were added between 2017 and 2018, and five new ones are planned to be ready for service in 2020 or 2021, reflecting the growth of submarine fibre connectivity. The largest cables, South America-1 (SAm-1) and GlobeNet, with 25 000 km and 23 800 km respectively, were deployed in 2000 and 2001.
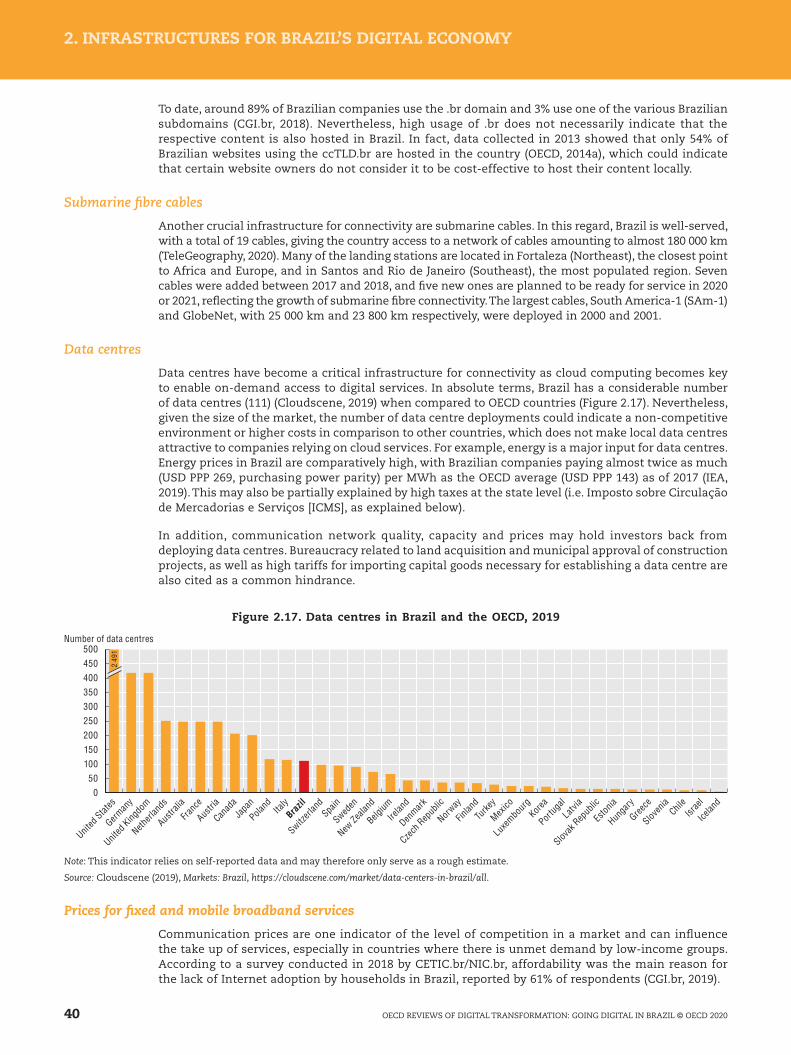
Data centres
Data centres have become a critical infrastructure for connectivity as cloud computing becomes key to enable on-demand access to digital services. In absolute terms, Brazil has a considerable number of data centres (111) (Cloudscene, 2019) when compared to OECD countries (Figure 2.17). Nevertheless, given the size of the market, the number of data centre deployments could indicate a non-competitive environment or higher costs in comparison to other countries, which does not make local data centres attractive to companies relying on cloud services. For example, energy is a major input for data centres. Energy prices in Brazil are comparatively high, with Brazilian companies paying almost twice as much (USD PPP 269, purchasing power parity) per MWh as the OECD average (USD PPP 143) as of 2017 (IEA, 2019). This may also be partially explained by high taxes at the state level (i.e. Imposto sobre Circulação de Mercadorias e Serviços [ICMS], as explained below).
In addition, communication network quality, capacity and prices may hold investors back from deploying data centres. Bureaucracy related to land acquisition and municipal approval of construction projects, as well as high tariffs for importing capital goods necessary for establishing a data centre are also cited as a common hindrance.
Figure 2.17. Data centres in Brazil and the OECD, 2019
2 49
1
050
100150200250300350400450500
Number of data centres
United
States
German
y
United
Kingdo
m
Netherl
ands
Austra
lia
Franc
e
Austri
a
Canad
aJa
pan
Poland Ita
lyBra
zil
Switzerl
and
Spain
Sweden
New Ze
aland
Belgium
Irelan
d
Denmark
Czech
Rep
ublic
Norway
Finlan
d
Turke
y
Mexico
Luxe
mbour
gKor
ea
Portug
al
Latvia
Slovak
Rep
ublic
Eston
ia
Hunga
ry
Greece
Sloven
iaChil
eIsr
ael
Icelan
d
Note: This indicator relies on self-reported data and may therefore only serve as a rough estimate.
Source: Cloudscene (2019), Markets: Brazil, https://cloudscene.com/market/data-centers-in-brazil/all.
Prices for fixed and mobile broadband services
Communication prices are one indicator of the level of competition in a market and can influence the take up of services, especially in countries where there is unmet demand by low-income groups. According to a survey conducted in 2018 by CETIC.br/NIC.br, affordability was the main reason for the lack of Internet adoption by households in Brazil, reported by 61% of respondents (CGI.br, 2019).
40 OECD REVIEWS OF DIGITAL TRANSFORMATION: GOING DIGITAL IN BRAZIL © OECD 2020
2. INFRASTRUCTURES FOR BRAZIL’S DIGITAL ECONOMY 2. INFRASTRUCTURES FOR BRAZIL’S DIGITAL ECONOMY
The OECD’s telecommunication baskets provide detailed information on Brazil’s prices for fixed and mobile communication services compared to OECD countries and its regional peers. The OECD uses a pricing methodology that designs usage baskets (i.e. low, medium and high usage) for different consumption patterns. It collects the data twice a year, using prices on websites that are shown for consumers at a certain date. This assumes that rational consumers can make decisions based on the information available to them.
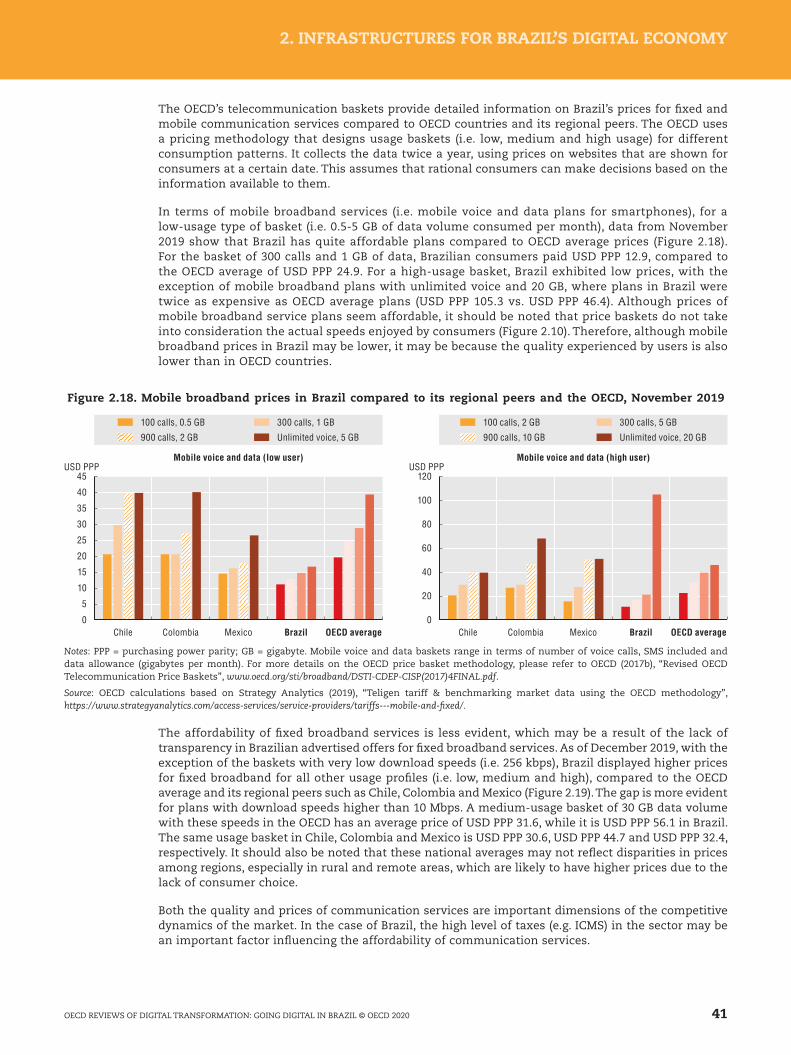
In terms of mobile broadband services (i.e. mobile voice and data plans for smartphones), for a low-usage type of basket (i.e. 0.5-5 GB of data volume consumed per month), data from November 2019 show that Brazil has quite affordable plans compared to OECD average prices (Figure 2.18). For the basket of 300 calls and 1 GB of data, Brazilian consumers paid USD PPP 12.9, compared to the OECD average of USD PPP 24.9. For a high-usage basket, Brazil exhibited low prices, with the exception of mobile broadband plans with unlimited voice and 20 GB, where plans in Brazil were twice as expensive as OECD average plans (USD PPP 105.3 vs. USD PPP 46.4). Although prices of mobile broadband service plans seem affordable, it should be noted that price baskets do not take into consideration the actual speeds enjoyed by consumers (Figure 2.10). Therefore, although mobile broadband prices in Brazil may be lower, it may be because the quality experienced by users is also lower than in OECD countries.
Figure 2.18. Mobile broadband prices in Brazil compared to its regional peers and the OECD, November 2019
0
5
10
15
20
25
30
35
40
45
0
20
40
60
80
100
120USD PPP
Mobile voice and data (low user)USD PPP
Unlimited voice, 5 GB
300 calls, 1 GB100 calls, 0.5 GB
900 calls, 2 GB
Mobile voice and data (high user)
Chile Colombia Mexico Brazil OECD average Chile Colombia Mexico Brazil OECD average
Unlimited voice, 20 GB
300 calls, 5 GB100 calls, 2 GB
900 calls, 10 GB
Notes: PPP = purchasing power parity; GB = gigabyte. Mobile voice and data baskets range in terms of number of voice calls, SMS included and data allowance (gigabytes per month). For more details on the OECD price basket methodology, please refer to OECD (2017b), “Revised OECD Telecommunication Price Baskets”, www.oecd.org/sti/broadband/DSTI-CDEP-CISP(2017)4FINAL.pdf.
Source: OECD calculations based on Strategy Analytics (2019), “Teligen tariff & benchmarking market data using the OECD methodology”, https://www.strategyanalytics.com/access-services/service-providers/tariffs---mobile-and-fixed/.
The affordability of fixed broadband services is less evident, which may be a result of the lack of transparency in Brazilian advertised offers for fixed broadband services. As of December 2019, with the exception of the baskets with very low download speeds (i.e. 256 kbps), Brazil displayed higher prices for fixed broadband for all other usage profiles (i.e. low, medium and high), compared to the OECD average and its regional peers such as Chile, Colombia and Mexico (Figure 2.19). The gap is more evident for plans with download speeds higher than 10 Mbps. A medium-usage basket of 30 GB data volume with these speeds in the OECD has an average price of USD PPP 31.6, while it is USD PPP 56.1 in Brazil. The same usage basket in Chile, Colombia and Mexico is USD PPP 30.6, USD PPP 44.7 and USD PPP 32.4, respectively. It should also be noted that these national averages may not reflect disparities in prices among regions, especially in rural and remote areas, which are likely to have higher prices due to the lack of consumer choice.
Both the quality and prices of communication services are important dimensions of the competitive dynamics of the market. In the case of Brazil, the high level of taxes (e.g. ICMS) in the sector may be an important factor influencing the affordability of communication services.
41OECD REVIEWS OF DIGITAL TRANSFORMATION: GOING DIGITAL IN BRAZIL © OECD 2020
2. INFRASTRUCTURES FOR BRAZIL’S DIGITAL ECONOMY 2. INFRASTRUCTURES FOR BRAZIL’S DIGITAL ECONOMY

Figure 2.19. Fixed broadband prices (medium-usage basket) in Brazil compared to its regional peers and the OECD average, December 2019
0
20
40
60
80
100
120USD PPP
100 Mbps10 Mbps0.25 Mbps 25 Mbps
Chile Colombia Mexico Brazil OECD average
Notes: PPP = purchasing power parity; Mbps = megabits per second. In the low-usage alternative, data allowances of plans range from 5 GB to 100 GB/month; in the medium-usage alternative, the data allowance ranges from 15 GB to 300 GB/month; in the high-usage alternative it ranges from 45 GB to 900 GB/month following the OECD methodology approved by all member countries. Price baskets take into account data volumes per month (measured in GB) as well as download speeds (measured in Mbps). Since 2014, Anatel has banned data caps in the commercial offers from the largest players; the leading feature of the fixed broadband baskets in Brazil is download speeds. For more details on the OECD price basket methodology, please refer to OECD (2017b), “Revised OECD telecommunication price baskets”, http://www.oecd.org/sti/broadband/DSTI-CDEP-CISP(2017)4FINAL.pdf. The prices taken into account in Brazil for the OECD baskets consider promotional prices for the valid period of the offers (e.g. 12 months), and revert to the price-cap tariff afterwards.
Source: OECD calculations based on Strategy Analytics (2019), “Teligen tariff & benchmarking market data using the OECD methodology”, https://www.strategyanalytics.com/access-services/networks/tariffs---mobile-and-fixed.
Developments in market structure
Communication market participants
The liberalisation of the communication sector in Brazil took place during the 1990s. Following the enactment of the General Telecommunications Law (Lei Geral de Telecomunicações [LGT], No. 9 472 of 1997), the state-owned company Telebrás was privatised in July 1998 and split-up into a long-distance privately owned operator (Embratel), three regional fixed line companies and eight wireless carriers. Telebrás was re-established as a state-owned company in 2010.
Currently, the largest players in the communication market in Brazil are Telefônica, under the brand Vivo (owned by Telefónica Spain); Telecom Americas, under the brand Claro (owned by America Móvil); Oi; and TIM Brasil, owned by Telecom Italia. For fixed broadband players, the operators with the largest market shares are Claro, Vivo and Oi. For mobile voice and mobile broadband, the main players by market share are Vivo, Claro, TIM and Oi. The evolution of the market shares in the last eight to ten years regarding these services are analysed further below, as they are useful to comprehend the competitive environment in Brazil.
In terms of broadcasting services, in December 2018, Brazil had 862 commercial free-to-air (FTA) nationwide television channels, 131 public nationwide channels (generating own content), 20 874 commercial regional channels and 75 public regional channels (as relay stations). According to audience rankings from Kantar Ibope Media, Globo is the most-watched channel. It is part of the Globo Group, which is owned by the Marinho family. Among all TV channels, the three most-watched have been Globo, SBT (owned by Silvio Santos Group) and Record (Record Group), which are all FTA channels.
Pay TV service providers have a particular standing in Brazil. Although they provide audio-visual services similar to those of FTA broadcasting, pay TV is categorised in the country as a telecommunication service and regulated according to each activity within its value chain. Two main economic groups dominated the Brazilian pay TV market in 2019, with a combined market share of 78.9%. Claro (also owning Embratel and Net) had 49.2% of the market followed by Sky/DirecTV at 29.7%. Two other large groups – Oi, Vivo (also owning GVT)– together shared 18.1% of the market. Algar, which in December 2018 had 0.5% of the pay TV market, exited the market in February 2020.
42 OECD REVIEWS OF DIGITAL TRANSFORMATION: GOING DIGITAL IN BRAZIL © OECD 2020
2. INFRASTRUCTURES FOR BRAZIL’S DIGITAL ECONOMY 2. INFRASTRUCTURES FOR BRAZIL’S DIGITAL ECONOMY
In terms of content production and content packaging, the market is also concentrated. From the total subscriptions in terms of individual pay TV channels registered by the National Film Agency (Agência Nacional do Cinema, Ancine) in December 2018, 50.4% were divided between only two economic groups, Globo and Warner Media (Ancine, 2019).
As in OECD countries, there are various over-the-top (OTT) media services offers in Brazil. Under the current Brazilian legislation, OTT services and applications are classified as value-added services (serviço de valor adicionado, SVA) and are neither considered telecommunication nor broadcasting services. In terms of audio-visual services, several commercial offers exist in terms of video-on-demand subscriptions (SVoD) (e.g. Netflix and Globoplay) and transactional video on demand (TVoD) (e.g. Telecine On and Sky Play App). Estimates for 2018 indicate that the number of unique OTT audio-visual service subscriptions in Brazil was around 21.3 million, a subscription base which has been constantly growing since 2011 (Katz, 2019).
Fixed and mobile broadband market dynamics
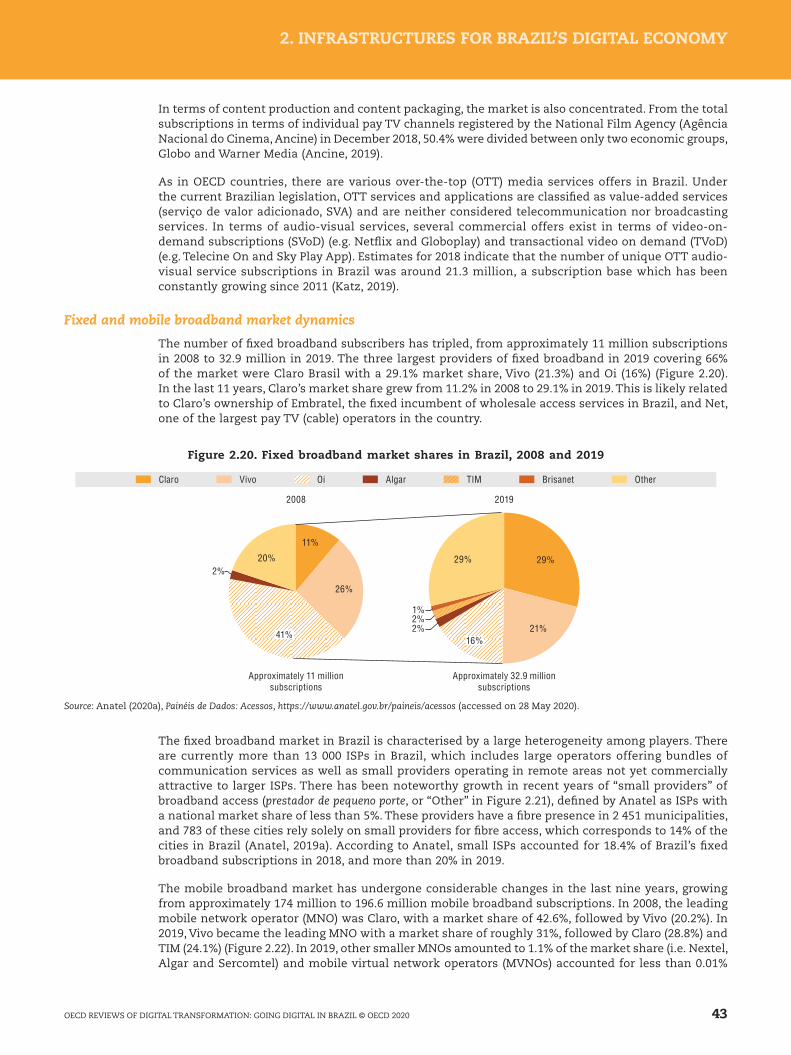
The number of fixed broadband subscribers has tripled, from approximately 11 million subscriptions in 2008 to 32.9 million in 2019. The three largest providers of fixed broadband in 2019 covering 66% of the market were Claro Brasil with a 29.1% market share, Vivo (21.3%) and Oi (16%) (Figure 2.20). In the last 11 years, Claro’s market share grew from 11.2% in 2008 to 29.1% in 2019. This is likely related to Claro’s ownership of Embratel, the fixed incumbent of wholesale access services in Brazil, and Net, one of the largest pay TV (cable) operators in the country.
Figure 2.20. Fixed broadband market shares in Brazil, 2008 and 2019
29%
21%2%2%1%
29%
11%
26%
2%20%
20192008
41%16%
Algar TIM Brisanet OtherVivoClaro Oi
Approximately 32.9 millionsubscriptions
Approximately 11 millionsubscriptions
Source: Anatel (2020a), Painéis de Dados: Acessos, https://www.anatel.gov.br/paineis/acessos (accessed on 28 May 2020).
The fixed broadband market in Brazil is characterised by a large heterogeneity among players. There are currently more than 13 000 ISPs in Brazil, which includes large operators offering bundles of communication services as well as small providers operating in remote areas not yet commercially attractive to larger ISPs. There has been noteworthy growth in recent years of “small providers” of broadband access (prestador de pequeno porte, or “Other” in Figure 2.21), defined by Anatel as ISPs with a national market share of less than 5%. These providers have a fibre presence in 2 451 municipalities, and 783 of these cities rely solely on small providers for fibre access, which corresponds to 14% of the cities in Brazil (Anatel, 2019a). According to Anatel, small ISPs accounted for 18.4% of Brazil’s fixed broadband subscriptions in 2018, and more than 20% in 2019.
The mobile broadband market has undergone considerable changes in the last nine years, growing from approximately 174 million to 196.6 million mobile broadband subscriptions. In 2008, the leading mobile network operator (MNO) was Claro, with a market share of 42.6%, followed by Vivo (20.2%). In 2019, Vivo became the leading MNO with a market share of roughly 31%, followed by Claro (28.8%) and TIM (24.1%) (Figure 2.22). In 2019, other smaller MNOs amounted to 1.1% of the market share (i.e. Nextel, Algar and Sercomtel) and mobile virtual network operators (MVNOs) accounted for less than 0.01%
43OECD REVIEWS OF DIGITAL TRANSFORMATION: GOING DIGITAL IN BRAZIL © OECD 2020
2. INFRASTRUCTURES FOR BRAZIL’S DIGITAL ECONOMY 2. INFRASTRUCTURES FOR BRAZIL’S DIGITAL ECONOMY
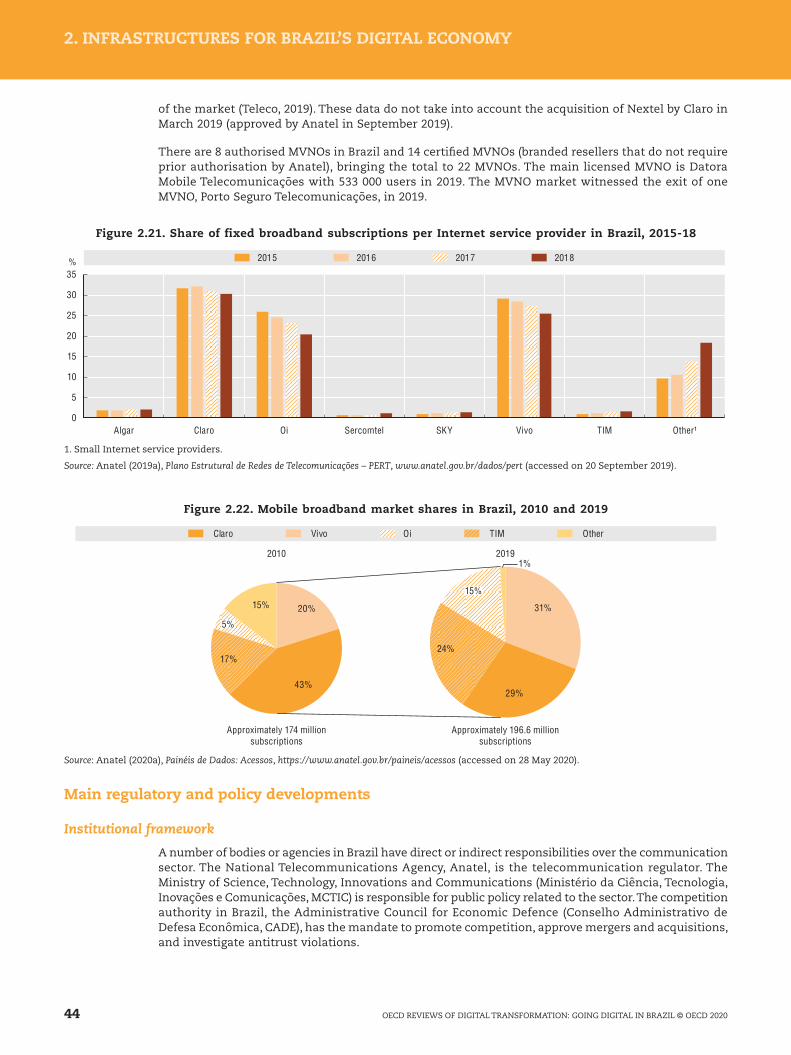
of the market (Teleco, 2019). These data do not take into account the acquisition of Nextel by Claro in March 2019 (approved by Anatel in September 2019).
There are 8 authorised MVNOs in Brazil and 14 certified MVNOs (branded resellers that do not require prior authorisation by Anatel), bringing the total to 22 MVNOs. The main licensed MVNO is Datora Mobile Telecomunicações with 533 000 users in 2019. The MVNO market witnessed the exit of one MVNO, Porto Seguro Telecomunicações, in 2019.
Figure 2.21. Share of fixed broadband subscriptions per Internet service provider in Brazil, 2015-18
0
35%
5
10
15
20
25
30
201820162015 2017
Algar Claro Oi Sercomtel SKY Vivo TIM Other¹
1. Small Internet service providers.
Source: Anatel (2019a), Plano Estrutural de Redes de Telecomunicações – PERT, www.anatel.gov.br/dados/pert (accessed on 20 September 2019).
Figure 2.22. Mobile broadband market shares in Brazil, 2010 and 2019
20192010
20%
43%
31%
29%
1%
15%
17%24%
5%
15%
Approximately 196.6 millionsubscriptions
Approximately 174 millionsubscriptions
Other Claro Vivo TIMOi
Source: Anatel (2020a), Painéis de Dados: Acessos, https://www.anatel.gov.br/paineis/acessos (accessed on 28 May 2020).
Main regulatory and policy developments
Institutional framework
A number of bodies or agencies in Brazil have direct or indirect responsibilities over the communication sector. The National Telecommunications Agency, Anatel, is the telecommunication regulator. The Ministry of Science, Technology, Innovations and Communications (Ministério da Ciência, Tecnologia, Inovações e Comunicações, MCTIC) is responsible for public policy related to the sector. The competition authority in Brazil, the Administrative Council for Economic Defence (Conselho Administrativo de Defesa Econômica, CADE), has the mandate to promote competition, approve mergers and acquisitions, and investigate antitrust violations.
44 OECD REVIEWS OF DIGITAL TRANSFORMATION: GOING DIGITAL IN BRAZIL © OECD 2020
2. INFRASTRUCTURES FOR BRAZIL’S DIGITAL ECONOMY 2. INFRASTRUCTURES FOR BRAZIL’S DIGITAL ECONOMY
For broadcasting, and specifically for FTA, the MCTIC acts as a public policy maker and a quasi-regulator (i.e. responsible for the monitoring and control of the broadcasting sector, directly and indirectly). Concerning pay TV, which is defined as a telecommunication service within the legal framework in Brazil, the role of regulating this service is shared by Anatel and Ancine, as established by the 2011 SeAC Law which defines production, programming, packaging and distribution activities in the pay TV value chain. Anatel is responsible for regulating the pay TV distribution, and Ancine for programming and packaging of pay TV. Ancine also has the mandate to foster competition and regulate issues related to the development of the Brazilian film industry, including content-related issues.
Within the executive power, the Ministry of Economy, particularly through the Secretariat of Competition Advocacy and Competitiveness (Secretaria de Advocacia da Concorrência e Competitividade, SEAE), has an important mandate on competition advocacy. The Ministry of Justice carries out its consumer protection role through the National Consumer Secretariat (Secretaria Nacional do Consumidor, Senacon), as well as a general audio-visual content classification role.
Senacon is in charge of formulating, promoting, co-ordinating and implementing the national consumer protection policy. There are also more than 800 state and local departments for consumer protection, Procons, linked to the executive power, which also oversee communication companies. Anatel also has some consumer protection functions.
Moreover, judicial institutions such as the Federal Supreme Court (Supremo Tribunal Federal) and the independent bodies that do not belong to the executive, legislative or judiciary branches, such as the Federal Court of Accounts (Tribunal de Contas da União, TCU) and the Public Prosecutor’s Office (Ministério Público), have important roles related to constitutional, legal and budgetary external controls.
Finally, non-governmental organisations such as the CGI.br and the Self-Regulatory Advertising Council (Conselho Nacional de Autorregulamentação Publicitária, CONAR), play key roles in integrating Internet service initiatives and promoting ethical advertising, respectively.
Main recommendations from the OECD Telecommunication and Broadcasting Review of Brazil
Improving the institutional and regulatory framework
Creating a converged regulator and separating policy from regulatory functions
Particularly in the area of broadcasting (including pay TV services), regulatory and policy roles are not clearly defined. Multiple authorities are tasked with developing and implementing policy and regulation (e.g. the MCTIC, Ancine and Anatel). Contrary to international best practices, there is no clear distinction between general policy formulation and the issuance of ex ante regulation to tackle market failures, promote competition and protect consumers. This poses considerable challenges for the coherence of regulation and policies.
In addition, multi-purpose IP-based networks have enabled the provision of different services over the same network. The increase of convergence that blurs the contours of previously distinct sectors rises the complexity of how these institutions interact.
To address the convergence of communication and broadcasting services, a number of OECD countries such as Australia, Hungary and the United Kingdom have merged their broadcasting and communication regulators, while others have taken concrete actions to increase the flexibility of the regulators to limit the overlapping of functions and facilitate the implementation of converged regulation (OECD, 2008; 2017a).
In order to strengthen the institutional framework and following good international practice, it is recommended to create an independent convergent authority responsible for communication and broadcasting markets (including pay TV) and for monitoring evolving OTT services, while ensuring that an arm’s-length principle be kept between regulation and policy making.
45OECD REVIEWS OF DIGITAL TRANSFORMATION: GOING DIGITAL IN BRAZIL © OECD 2020
2. INFRASTRUCTURES FOR BRAZIL’S DIGITAL ECONOMY 2. INFRASTRUCTURES FOR BRAZIL’S DIGITAL ECONOMY
Increasing the independence of the regulator and creating an independent oversight for regulatory impact assessments
The existence of a strong sectoral regulator is key for the effective implementation of the objectives set by the government and reducing market uncertainty and promoting a well-functioning sector (OECD, 2014b). It is paramount for the communication sector to ensure the adequate funding of the regulator and its financial independence, through a multiannual, clearly defined budget, ring-fenced from the rest of the government budget.
Despite improvements in Anatel’s budget setting and stability since 2018, its financial autonomy is not secured due to the lack of budgetary control Anatel has over sector fees to fund the regulator (Fundo de Fiscalização das Telecomunicações, FISTEL).
In addition, the control exercised by the TCU is potentially undermining Anatel’s independence, limiting its capacity to properly carry out its functions. As previously acknowledged by the OECD in 2008, performance assessment by national audit offices can serve to protect the public interest. However, the extent to which ex ante assessment and advice from the TCU is applied to the regulatory agencies in Brazil is an unusual practice (OECD, 2008). A clear accountability framework needs to be balanced with effective autonomy of the regulator, as the maintenance of certain prerogatives is essential to ensure the technicality, impartiality and predictability of the regulatory function (Moreira, 2004). Moreover, the personal liability of public servants should be limited.
Finally, despite improvements in the regulatory impact assessment (RIA) framework, and the fact that Anatel being the most active regulator in Brazil to promote RIAs, Anatel has limited experience with the implementation of quantitative RIAs (Aquila et al, 2019). Brazil should implement an independent body to systematically review RIA reports of different institutions with regulatory roles, ensuring oversight and quality, through a “whole-of-government” approach and with permanent co-ordination mechanisms and bodies that address the need for policy coherence and strategic commitment in the long term (OECD, 2016).
Establishing a converged regulatory and policy framework
Establishing regulatory and policy regimes that are attuned to convergence and emerging market trends requires that regulators and policy makers rethink existing frameworks to ensure that they are still applicable and coherent. The first step is ensuring that the rules are clear and consistent for operators across the communication sector. The second is eliminating any double windows and overlap of functions that may cause confusion and legal uncertainty.
Licensing of communication services in Brazil is still considerably fragmented. Different authorisations are required for each type of communication service provided. Anatel has gradually simplified its classification of communication services and licensing framework over the years. There are currently four main service categories in Brazil that require an authorisation: 1) fixed telephony; 2) mobile telephony; 3) “multimedia services” such as fixed broadband; and 4) pay TV. In addition, under the current licensing framework, some services are classified as value-added services, which are neither considered telecommunication nor broadcasting services. Value-added services can include OTT, but also layers of the Internet service provision excluding “last-mile” access. The most prominent example of a value-added service is the Internet connection service (i.e. authentication of the user in the network that originated in the past due to dial-up Internet services).
For broadcasting services, the licensing regime applies different requirements to FTA broadcasting and equivalent pay TV services. In addition, it is also cumbersome and may enable political influence in the granting of FTA licences.
All service categories are subject to a number of different regulations, fees and taxes, which are not only burdensome for companies, but also pose barriers to entry in a convergent ecosystem. Moreover, the plurality of definitions, even for the same service (i.e. broadband service provision), leads to arbitrage opportunities of both regulatory measures and taxation.
A good practice to be applied to all communication services would be to abandon all individual authorisations required for communication service providers and to replace them with a single class-licensing regime, valid for all services, except for where there is resource scarcity, such as spectrum.
46 OECD REVIEWS OF DIGITAL TRANSFORMATION: GOING DIGITAL IN BRAZIL © OECD 2020
2. INFRASTRUCTURES FOR BRAZIL’S DIGITAL ECONOMY 2. INFRASTRUCTURES FOR BRAZIL’S DIGITAL ECONOMY
Enhancing the co-ordination of policies and regulation at all levels of government
In order to ensure that norms are applied coherently, roles must be well-defined, double windows eliminated and overlap of functions reduced. From a general level, it is paramount that federal, state and municipal levels co-ordinate efficiently, particularly on broadband expansion in the country. Co-ordination among the three levels of government is particularly important for streamlining rights of way, easing antenna deployment and harmonising power density regulations. It is also vital for ensuring pluralism related to broadcasting services.
More specifically, other institutions that should improve co-ordination and reduce overlap are the competition authority, CADE and sector regulators, particularly concerning the audio-visual sector and pay TV services, as well as those regarding institutions responsible for consumer protection, such as Senacon, Procons and Anatel. For competition issues concerning the audio-visual sector, in the absence of a converged regulator, it is important to clarify the role of each sector regulator and to anticipate dispute resolution procedures in the event of divergent opinions. For consumer issues, it is important that already existing co-operation mechanisms are further formalised to improve transparency and enhance the exchange of information.
Ensuring effective regulatory enforcement
An important aspect of a well-functioning regulator is the efficacy of its regulatory enforcement measures, extending to how the regulator’s decisions are reviewed through administrative or judiciary processes. Despite its sanctioning powers, Anatel has imposed far more fines than it has been able to collect. Between 2010 and 2017, Anatel imposed 60 000 fines; only 66% of them were fully paid by operators, representing 13% of the monetary value of the total fines imposed (Anatel, 2017). To improve enforcement of applied fines and increase collection, Anatel should carefully substantiate the sanctions, which should fit the nature of the offence. Fines should be high enough to deter behaviour, but at the same time follow the principle of proportionality to deter appeals.
Moreover, as Anatel reflects on a variety of alternatives beyond purely monetary sanctions, such as warnings, Conduct Adjustment Agreements (Termos de Compromisso de Ajustamento de Conduta, TAC) and future obligations (obrigação de fazer), whereby operators can trade the fines for investment obligations, it is important that they be based on granular data and on the establishment of a coherent sanctioning framework. A thorough analysis ex ante to establish where such obligations should be imposed, and ex post monitoring of their implementation are warranted.
Overhauling the taxation, fees and tariff framework
The high level of fees and special taxes severely impacts the communication sector in Brazil. The high fees likely contribute to the total cost of communication services, compromise the sector’s potential for innovation and investment, thus hindering the adoption and affordability of communication services.
In light of the extensive positive spill-over effects of communication services on the Brazilian economy and society, the high taxes and fees should be reconsidered and ways identified to reduce them. Brazilian states levy the ICMS, which applies to the movement of goods and transport and telecommunication services. The ICMS burden is of particular concern as it potentially effects the cost of communication services and consequently their use. Brazilian states should therefore consider harmonising the ICMS across states and reducing the applicable ICMS rate to communication services to the extent possible.
In the long run, it is recommended to pursue the efforts for a fundamental reform of the indirect tax framework to reduce the distortions caused by the current indirect tax treatment of the communication sector. In line with former OECD work on taxation issues in Brazil, it is suggested to consolidate consumption taxes at the state and federal levels into one value-added tax with a broad base and full refunds for input VAT paid (OECD, 2018b; 2019a).
Another important aspect regarding the simplification of the fees framework in Brazil concerns sectoral funds. Fees paid to FISTEL have been integrated into the Contribution for the Development of the National Film Industry (Contribuição para o Desenvolvimento da Indústria Cinematográfica Nacional, CONDECINE) and the Contribution to Foster Public Broadcasting (Contribuição para o Fomento da Radiodifusão pública, CFRP). However, the Universal Service Fund (Fundo de Universalização dos
47OECD REVIEWS OF DIGITAL TRANSFORMATION: GOING DIGITAL IN BRAZIL © OECD 2020
2. INFRASTRUCTURES FOR BRAZIL’S DIGITAL ECONOMY 2. INFRASTRUCTURES FOR BRAZIL’S DIGITAL ECONOMY
Serviços de Telecomunicações, FUST) and the Telecommunications Technological Development Fund (Fundo para o Desenvolvimento Tecnológico das Telecomunicações, FUNTTEL) are still accounted for separately, which results in three different funds in Brazil (FISTEL, FUST, FUNTTEL). In line with streamlining and convergence, Brazil should consider integrating all contributions into one, as was done, for example, recently in Colombia (OECD, 2019c). Integrating all fund contributions into one single contribution may furthermore reduce administrative costs and increase efficiency.
Improving market conditions
Lowering barriers to entry and easing infrastructure deployment
The deployment of communication infrastructure, especially concerning access to rights of way and the installation of cellular sites, continues to be a rather cumbersome process in Brazil. Operators must comply with federal as well as local regulations, which may vary by municipality and state. To reduce the costs of infrastructure deployment, Brazil should further establish dig-once policies, including for the construction of highways, energy transmission lines, etc. The federal government should harmonise the application of the Antennas Law by issuing norms that promote the deployment of infrastructure under the principle of positive silence.
Streamlining rights of way will also be key to increase backhaul and backbone connectivity. Fibre backhaul, if accompanied by an effective open access regime and continued monitoring of competition dynamics, should also help decrease the costs of deploying 4G and 5G mobile networks, which will be important for reaching end users in rural and remote areas of Brazil.
Ensuring efficient spectrum management
One prerequisite for mobile communication services in Brazil is the availability of spectrum, which is assigned through spectrum auctions. In general, the design of such an auction should take into account policy objectives of increasing the coverage of communication networks while enhancing competition in mobile markets. The converged regulator should balance public policy objectives and avoid coverage obligations from becoming an impediment for certain actors to bid, as well as eliminating any industrial policy obligations that may distort auction results or raise deployment costs.
As the upcoming 5G auction in Brazil has been hailed as being the largest auction for 5G spectrum ever, stakeholders are observing the auction’s design very closely. The design of spectrum auctions depends on three main elements: reserve prices, coverage obligations and spectrum caps. In Brazil, auctions have, in general, followed good practices. With the approval of Law 13.879 on 3 October 2019, spectrum licences in Brazil can now be successively renewed, without limit, after the first 20-year term. Each renewal is accompanied by a payment, determined by Anatel, which operators may exchange for investment commitments. As spectrum auctions are one of the main tools countries use to foster competition in mobile markets, Anatel should closely observe and analyse the effects of this new arrangement on the market entry of new mobile operators.
Fostering competition in communication and broadcasting markets
The competitive dynamics of the communication sector in Brazil, at a national level, have been relatively stable over time when measured by market shares. Particularly in the mobile telephony market, the level of concentration, measured by the number of operators and the Herfindahl-Hirschman Index, is relatively low, but this continues to evolve dynamically with the vertical integration among network operators and service providers. In Brazil, challenges to competition in the communication sector relate to access to essential infrastructure and potential anticompetitive conduct tending to foreclose the market. As the availability of services and number of service providers is not homogenous across the country, barriers to competition vary considerably, and are determined by the specific circumstances in each municipality.
Competition is a serious concern for broadcasting. There has been no effective enforcement of competition principles in the case of FTA broadcasting services, with content production being concentrated among a few major FTA broadcasters and insufficient development of independent domestic content production (Mendel and Salomon, 2011). For pay TV, despite the recent contraction in the number of subscribers, the market is also rather concentrated, varying across the pay TV value
48 OECD REVIEWS OF DIGITAL TRANSFORMATION: GOING DIGITAL IN BRAZIL © OECD 2020
2. INFRASTRUCTURES FOR BRAZIL’S DIGITAL ECONOMY 2. INFRASTRUCTURES FOR BRAZIL’S DIGITAL ECONOMY
chain, with higher concentration in the market of content distribution and significant concentration in the programming and packaging of content (Ancine, 2019).
Competition in the communication sector in Brazil is protected and promoted via ex ante sectoral regulation and ex post antitrust regulation. In this regard, CADE, the Brazilian competition authority, has ex post independent jurisdiction over investigations of anticompetitive practices and ex ante jurisdiction for mergers in the telecommunication sector. Anatel also has specific ex ante competition attributions in the sector. The Secretariat of Competition Advocacy and Competitiveness conducts competition advocacy in general towards government agencies and society.
In order to improve Brazil’s Competition Law and policy framework, it is crucial to refer to recommendations provided by the OECD Competition Committee in its 2019 Peer Review of Brazil (OECD, 2019b), which lists a number of recommendations to CADE in terms of its institutional governance, prioritisation of cases, settlement policies and merger notification thresholds. These recommendations also apply for the review of the communications and broadcasting sectors, particularly in the case of removing the 20% threshold for market share. For communication services, it is important that market power determinations be based on a rigorous assessment of all the factors affecting competitive conditions in the market under investigation, rather than market shares alone (OECD, 2019b). The low threshold established in the Brazilian jurisdiction means that the likelihood of false positive is high, that the inference can be easily contested by defendants, and should therefore be removed.
Strengthening national policies and evidence-based policy making
Expanding broadband networks and services
E-Digital is an important step towards establishing a coherent governance model for digital initiatives. However, with the exception of the number of public schools to be connected, no quantitative targets have been defined, and rely on aggregate global comparison indexes. Moreover, while high-speed broadband is mentioned in both the decree and background document, no minimum desired speed for broadband is indicated (as is done in most OECD countries, with concrete targets measured in terms of percentage of population, households or business connected with 30 Mbps, 50 Mbps or even 100 Mbps).
To ensure effective evaluation of policy programmes (such as Connected Brazil), clear milestones and specific targets must be defined from the start regarding coverage, speed, population, number of schools and health centres connected, etc. (by geographic market), with complete measurements taken at the beginning to serve as baseline values. Broadband connectivity initiatives supported by the government should seek to be sustainable and involve local stakeholders, privileging infrastructure sharing (such as ditches, ducts and poles), and implementing reasonable, cost-based and objective access rates for such infrastructure.
Promoting inclusive and forward-looking audio-visual public policies
Contrary to the national policy strategies that exist in the communication sector (e.g. E-Digital 2018-2020, Connected Brazil Programme), there is currently no overarching public policy for broadcasting, pay TV and emerging OTT services/VoD, which is necessary in an increasingly convergent environment. FTA broadcasting, in particular, has not received much attention in sector regulation and public policy making. In a country like Brazil, where FTA is the predominant means for consumers to access information, this is a particular concern with respect to inclusion, media pluralism and diversity.
In an increasingly converged landscape, it is important to define a holistic technology-neutral policy vision for the broadcasting, pay TV and VoD markets, once the regulatory and institutional reform is carried out and clear roles are assigned between the sector or converged regulator and the policy-making institutions (ministerial or as a separate audio-visual authority).
Improving data collection for evidence-based policy making
Well-functioning institutions that develop evidence-based regulations and policies should continue to improve the collection and analysis of sector information. The lack of consistency of the overall institutional and regulatory framework of the broadcasting sector in Brazil has led to a profound scarcity
49OECD REVIEWS OF DIGITAL TRANSFORMATION: GOING DIGITAL IN BRAZIL © OECD 2020
2. INFRASTRUCTURES FOR BRAZIL’S DIGITAL ECONOMY 2. INFRASTRUCTURES FOR BRAZIL’S DIGITAL ECONOMY
of data on broadcasting services, for both the most basic and the more advanced indicators. There is a deficiency of systematically collecting and reporting data which are needed to analyse market performance, the state of competition in the sector and the effectiveness of broadcasting policies.
For communication services, data collection and reporting is done by Anatel, the MCTIC and CETIC.br. In 2019, Anatel launched an ambitious data portal that compiles data on access, product certification, consumers, spectrum, concessions and licensing, quality, and regulation (Anatel, 2020a). The portal continues to be enhanced, but users can already access the original data, broken down by service and region, and use the system to conduct their own analysis. Moreover, CETIC.br, a department of NIC.br, also produces and monitors indicators through household and enterprise surveys (as well as educational, health and cultural organisations) on access, use and adoption of ICT. Improvements are still needed regarding connectivity coverage maps.
To allow consistent communication public policy and regulatory design, detailed and updated data must be available on deployment, adoption and usage of communication and broadcasting services, including emerging trends.
Box 2.1. Key recommendations to improve communication infrastructure and services in Brazil
Improving the institutional and regulatory framework
Creating a converged regulator and separating policy from regulatory functions
Create a converged independent regulator overseeing the Brazilian communication and broadcasting sectors by merging the regulatory functions of Anatel, Ancine and the Ministry of Science, Technology, Innovations and Communications.
Introduce a clear separation between policy making and regulation in the areas of broadcasting, pay TV and emerging OTT/VoD.
Increasing the independence of the regulator and creating an independent oversight for regulatory impact assessments
Increase the independence of the sector – or converged – regulator.
Promote an independent decision-making process on the part of the regulator. Focus the important role of the Federal Court of Accounts on ex post assessments. Limit the personal liability of public servants.
Establish an independent oversight body to review the regulatory impact assessments of different institutions with regulatory roles.
Establishing a converged regulatory and policy framework
To adapt the legal framework to a converging communication and broadcasting market, reform the legal framework to introduce a simple class-licensing regime for communication and broadcasting services.
Remove legal restrictions on the integration of the pay TV value chain and cross-ownership between telecommunication and pay TV services on both foreign and domestic service providers.
Enhancing the co-ordination of policies and regulation at all levels of government
Enhance the co-ordination of the federal, state and municipal levels on issues such as streamlining rights of way and easing antenna deployment to promote broadband deployment, particularly in underserved areas.
Promote co-operation arrangements between the Administrative Council for Economic Defence and sector regulators to eliminate multiple and possibly competing decisions (“double windows”), particularly on broadcasting issues (including pay TV).
50 OECD REVIEWS OF DIGITAL TRANSFORMATION: GOING DIGITAL IN BRAZIL © OECD 2020
2. INFRASTRUCTURES FOR BRAZIL’S DIGITAL ECONOMY 2. INFRASTRUCTURES FOR BRAZIL’S DIGITAL ECONOMY
Box 2.1. Key recommendations to improve communication infrastructure and services in Brazil (cont.)
Improve co-operation and reduce overlapping functions in the regulatory design and enforcement of consumer protection regulations by upscaling co-operation instruments among Senacon, Procons and Anatel.
Ensuring effective regulatory enforcement
Anatel should strengthen its enforcement framework, seeking to establish proportionate sanctions (monetary or non-monetary) based on quantitative evidence and targets, considering the severity of the violation and the resulting harm.
If Anatel wishes to continue promoting Conduct Adjustment Agreement (TAC) as a regulatory compliance tool that allows operators to commit to investment obligations instead of paying fines, it should carefully set and monitor these obligations.
Overhauling the taxation, fees and tariff framework
Harmonise the ICMS across states, as also recommended in Chapter 3 of this Review. Reduce the high ICMS rates for communication services to the extent possible because of their negative effects on adoption. In the long run, pursue the fundamental reform of the indirect tax framework to reduce the distortions caused by the current indirect tax treatment of the communication and broadcasting sector.
Merge sectoral funds into one single fund to reduce costs and increase efficiency. Ensure that the contributions to the funds are used for the further development of the digital economy in Brazil, including broadband deployment. In the long term, consider abolishing all sectoral contributions.
Actively promote the entry of Mercosur countries into the WTO Information Technology Agreement, which creates a credible schedule for the reduction of tariffs on an increasing number of ICT goods, as also recommended in Chapter 6 of this Review.
Improving market conditions
Lowering barriers to entry and easing infrastructure deployment
Reduce barriers to entry as much as possible.
Further increase backhaul and backbone connectivity and promote open wholesale access models.
Foster the Internet of Things (IoT) by eliminating taxes such as FISTEL establishing a separate IoT numbering plan, and re-examining outright IoT permanent roaming restrictions.
Consider removing the legal restrictions on foreign direct investment in broadcasting in which foreign companies or individuals cannot hold more than 30% of the total and voting capital of free-to-air broadcasting companies.
Ensuring efficient spectrum management
Closely monitor the effects of the changes introduced by Law 13.879 regarding a successive renewal of spectrum licences on market entry and competition in mobile markets.
Carefully design the upcoming 5G auction as the vast amount of spectrum planned to be placed in the market combined with the possibility of successive renewal of spectrum licenses translates into high stakes of the effects of this auction on the competitive dynamics of the market.
Fostering competition in communication and broadcasting markets
Follow the recommendations of the 2019 OECD Peer Review of Competition Law and Policy in Brazil (OECD, 2019b). Remove the 20% threshold for market share as a proxy for market power from the Competition Law. Issue guidelines for a clear analytical framework to assess market dominance.
51OECD REVIEWS OF DIGITAL TRANSFORMATION: GOING DIGITAL IN BRAZIL © OECD 2020
2. INFRASTRUCTURES FOR BRAZIL’S DIGITAL ECONOMY 2. INFRASTRUCTURES FOR BRAZIL’S DIGITAL ECONOMY
Box 2.1. Key recommendations to improve communication infrastructure and services in Brazil (cont.)
Strengthening national policies and evidence-based policy making
Expanding broadband networks and services
Establish targets for the Connected Brazil programme and other programmes aiming to expand networks and monitor their implementation. Improve co-operation among governmental entities and across the different levels of government (national, state and municipal) for the implementation of broadband connectivity initiatives.
Expand high-quality broadband networks to underserved regions by fostering investment in infrastructure in order to bridge the digital divide.
Promoting inclusive and forward-looking audio-visual public policies
Design an integrated and overarching public policy vision for broadcasting, pay TV and emerging OTT services/VoD.
Improving data collection for evidence-based policy making
Substantially improve the data collection of the broadcasting sector and continue to improve the collection and analysis of statistical information with respect to connectivity coverage maps and the use of communication services.
52 OECD REVIEWS OF DIGITAL TRANSFORMATION: GOING DIGITAL IN BRAZIL © OECD 2020
2. INFRASTRUCTURES FOR BRAZIL’S DIGITAL ECONOMY 2. INFRASTRUCTURES FOR BRAZIL’S DIGITAL ECONOMY
References
Akamai (2020), State of the Internet: IPv6 Adoption Visualization, Akamai, https://www.akamai.com/uk/en/our-thinking/state-of-the-internet-report/state-of-the-internet-ipv6-adoption-visualization.jsp (accessed on 12 February 2020).
Anatel (2020a), Painéis de Dados: Acessos [Data sets: Subscriptions], Agência Nacional de Telecomunicações, Brasilia, https://www.anatel.gov.br/paineis/acessos (accessed on 28 May 2020).
Anatel (2020b), Telefonia Móvel – Municípios Atendidos [Mobile Telephony: Covered Municipalities], Agência Nacional de Telecomunicações, Brasilia, https://www.anatel.gov.br/setorregulado/component/content/article/115-universalizacao-e-ampliacao-do-acesso/telefonia-movel/423-telefonia-movel-municipios-atendidos (accessed on 20 February 2020).
Anatel (2020c), Plano Estrutural de Redes de Telecomunicações (PERT) 2019-2024, Atualizaçao 2020 [Structural Plan of Telecommunication Networks (PERT) 2019-2024: Update 2020], Agência Nacional de Telecomunicações, Brasilia, https://sei.anatel.gov.br/sei/modulos/pesquisa/md_pesq_documento_consulta_externa.php?eEP-wqk1skrd8hSlk5Z3rN4EVg9uLJqrLYJw_9INcO4m2N1jXIPEu1rXnv7UHJFGKd-jO_xz5ZYqyuXgvKFPZe9U7a4FRauel0Ej_GJ3pzD2sKi_sQQhtHNHQk_javEK (accessed on 15 March 2020).
Anatel (2019a), Plano Estrutural de Redes de Telecomunicações – PERT [Structural Plan of Telecommunication Networks (PERT)], Agência Nacional de Telecomunicações, Brasilia, https://www.anatel.gov.br/dados/pert (accessed on 20 September 2019).
Anatel (2019b), Mapeamento de Redes de Transporte [Backhaul Network Maps], Agência Nacional de Telecomunicações, Brasilia, https://www.anatel.gov.br/dados/mapeamento-de-redes (accessed on 13 September 2019).
Anatel (2017), Relatório Anual 2017 [Annual Report 2017], Agência Nacional de Telecomunicações, Brasilia, https://www.anatel.gov.br/Portal/verificaDocumentos/documentoVersionado.asp?numeroPublicacao=348395&documentoPath=348395.pdf&Pub=&URL=/Portal/verificaDocumentos/documento.asp.
Anatel (2014), GT-IPv6 Grupo de Trabalho para Implantação do Protocolo IP-Versão 6 nas Redes das Prestadoras de Serviços de Telecomunicações: Relatório Final de Atividades [GT-IPv6 Working Group to Implement the Internet Protocol Version 6 (IPv6) on Telecommunication Providers’ Networks: Final Report of Activities], Agência Nacional de Telecomunicações, Brasilia, https://www.anatel.gov.br/Portal/verificaDocumentos/documento.asp?numeroPublicacao=325769 (accessed on 17 March 2020).
Ancine (2019), Assinantes no Mercado de Programação na TV por Assinatura 2019 [Programming Market Subscribers For Subscribers to Pay TV], Agência Nacional do Cinema, Brasilia,https://oca.ancine.gov.br/sites/default/files/repositorio/pdf/informe_assinantes_no_mercado_de_programacao_-_versao_diagramada.pdf.
APNIC (2020), “IPv6 measurement maps”, http://stats.labs.apnic.net/ipv6 (accessed on 20 February 2020).
Aquila, G. et al. (2019), “Quantitative regulatory impact analysis: Experience of regulatory agencies”, Utilities Policy, Vol. 59, https://doi.org/10.1016/j.jup.2019.100931.
CGI.br (2019), ICT Households 2018: Survey on the Use of Information and Communication Technologies in Brazilian Households, Comitê Gestor da Internet no Brasil, São Paulo, https://cetic.br/pt/tics/domicilios/2018/domicilios/ (accessed on 11 September 2019).
CGI.br (2018), ICT Enterprises 2017: Survey on the use of Information and Communication Technologies in Brazilian Enterprises, Comitê Gestor da Internet no Brasil, São Paulo, https://www.cetic.br/media/docs/publicacoes/2/TIC_Empresas_2017_livro_eletronico.pdf.
Cloudscene (2019), Markets: Brazil (database), https://cloudscene.com/market/data-centers-in-brazil/all (accessed on 5 October 2019).
Convergência Digital (2019), .br Completa 30 Anos com 4 Milhões de Domínios Registrados [.br Celebrates 30 Years with 4 Million Registered Domains], Convergência Digital, https://www.convergenciadigital.com.br/cgi/cgilua.exe/sys/7start.htm?UserActiveTemplate=site&infoid=50498&sid=4 (accessed on 20 February 2020).
Google (2020), “Per-country IPv6 adoption”, https://www.google.com/intl/en/ipv6 (accessed in February 2020).
IEA (2019), Energy Prices and Taxes for OECD Countries 2019, OECD Publishing, Paris, https://dx.doi.org/10.1787/71612f7e-en (accessed on 18 February 2020).
Katz, R. (2019), Alterações nos Mercados de Audiovisual Global e Brasileiro: Dinâmica Competitiva, Impacto no Bem Estar do Consumidor e Implicações em Políticas Públicas e no Modelo de Concorrência [Changes in the Global and Brazilian Audiovisual Market: Competitive Dynamics, Impact on Consumer Welfare, and Implications for Public Policy and Competition Model], Telecom Advisory Services, www.teleadvs.com/wp-content/uploads/PTBR-Changes-in-the-Global-and-Brazilian-Audiovisual-Market-Raul-Katz.pdf (accessed on 14 February 2020).
Maigron, P. (2020), Regional Internet Registries Statistics (database), https://www-public.imtbs-tsp.eu/~maigron/RIR_Stats/ (accessed on 19 February 2020).
53OECD REVIEWS OF DIGITAL TRANSFORMATION: GOING DIGITAL IN BRAZIL © OECD 2020
2. INFRASTRUCTURES FOR BRAZIL’S DIGITAL ECONOMY 2. INFRASTRUCTURES FOR BRAZIL’S DIGITAL ECONOMY
References and Notes
Mendel, T. and E. Salomon (2011), The Regulatory Environment for Broadcasting: An International Best Practice Survey for Brazilian Stakeholders, United Nations Educational, Scientific and Cultural Organization, Brasilia, www.unesco.org/new/fr/communication-and-information/resources/publications-and-communication-materials/publications/full-list/the-regulatory-environment-for-broadcasting-an-international-best-practice-survey-for-brazilian-stakeholders.
M-Lab (2019), “Worldwide broadband speed league”, https://www.cable.co.uk/broadband/speed/worldwide-speed-league/ (accessed on 9 May 2019).
Moreira, V. (2004), Estudos de Regulação Pública [Public Regulation Studies - I. Centre for Public Law and Regulation Studies], Centro de Estudos de Direito Público e Regulação, Universidade de Coimbra Faculdade de Direito, Coimbra Editora.
NIC.br (2018), Banda Larga no Brasil: Um Estudo Sobre a Evolução do Acesso e da Qualidade das Conexões à Internet [Broadband in Brazil: A Study on the Evolution and Access], Comitê Gestor da Internet no Brasil, São Paulo, https://cetic.br/media/docs/publicacoes/1/Estudo%20Banda%20Larga%20no%20Brasil.pdf (accessed on 20 February 2020).
OECD (2020a), OECD Telecommunication and Broadcasting Review of Brazil, OECD Publishing, Paris.
OECD (2020b), Broadband Portal (database), OECD, Paris, www.oecd.org/sti/broadband/broadband-statistics (accessed on 20 May 2020).
OECD (2019a), Economic Policy Reforms 2019: Going for Growth, OECD Publishing, Paris, https://dx.doi.org/10.1787/aec5b059-en.
OECD (2019b), OECD Peer Reviews of Competition Law and Policy: Brazil 2019, OECD, Paris, www.oecd.org/daf/competition/oecd-peer-reviews-of-competition-law-and-policy-brazil-2019.htm.
OECD (2019c), OECD Reviews of Digital Transformation: Going Digital in Colombia, OECD Publishing, Paris, https://dx.doi.org/10.1787/781185b1-en.
OECD (2019d), OECD Telecommunication and Internet Statistics (database), OECD, Paris, http://dx.doi.org/10.1787/tel_int-data-en (accessed in May 2019).
OECD (2019e), “The road to 5G networks: Experience to date and future developments”, OECD Digital Economy Papers, No. 284, OECD Publishing, Paris, https://dx.doi.org/10.1787/2f880843-en.
OECD (2018a), “IoT measurement and applications”, OECD Digital Economy Papers, No. 271, OECD Publishing, Paris, https://dx.doi.org/10.1787/35209dbf-en.
OECD (2018b), OECD Economic Surveys: Brazil 2018, OECD Publishing, Paris, https://dx.doi.org/10.1787/eco_surveys-bra-2018-en.
OECD (2018c), OECD Reviews of Digital Transformation: Going Digital in Sweden, OECD Publishing, Paris, https://dx.doi.org/10.1787/9789264302259-en.
OECD (2017a), OECD Digital Economy Outlook 2017, OECD Publishing, Paris, https://dx.doi.org/10.1787/9789264276284-en.
OECD (2017b), “Revised OECD telecommunication price baskets”, OECD, Paris, http://www.oecd.org/sti/broadband/DSTI-CDEP-CISP(2017)4FINAL.pdf.
OECD (2016), Indicators of Regulatory Policy and Governance Latin America 2016: Brazil, OECD, Paris, www.oecd.org/gov/regulatory-policy/Brazil-regulatory-policy-ireg-2016.pdf.
OECD (2014a), “International cables, gateways, backhaul and international exchange points”, OECD Digital Economy Papers, No. 232, OECD Publishing, Paris, https://dx.doi.org/10.1787/5jz8m9jf3wkl-en.
OECD (2014b), The Governance of Regulators, OECD Best Practice Principles for Regulatory Policy, OECD Publishing, Paris, https://doi.org/10.1787/9789264209015-en.
OECD (2014c), “The Internet in transition: The state of the transition to IPv6 in today’s Internet and measures to support the continued use of IPv4”, OECD Digital Economy Papers, No. 234, OECD Publishing, Paris, https://dx.doi.org/10.1787/5jz5sq5d7cq2-en.
OECD (2008), OECD Reviews of Regulatory Reform: Brazil 2008: Strengthening Governance for Growth, OECD Reviews of Regulatory Reform, OECD Publishing, Paris, https://doi.org/10.1787/9789264042940-en.
Ookla (2019), “Speedtest”, https://www.speedtest.net/ (accessed on 10 July 2019).
Opensignal (2019), The State of Mobile Experience, May 2019, Opensignal, London, http://dx.doi.org/www.opensignal.com/sites/opensignal-com/files/data/reports/global/data-2019-05/the_state_of_mobile_experience_may_2019_0.pdf.
Packet Clearing House (2020), Internet Exchange Directory (database), https://www.pch.net/ixp/dir (accessed on 18 February 2020).
Steam (2019), “Steam Download Stats”, https://store.steampowered.com/stats/content (accessed on 10 July 2019).
Strategy Analytics (2019), “Teligen tariff & benchmarking market data using the OECD methodology”, https://www.strategyanalytics.com/access-services/networks/tariffs---mobile-and-fixed.
Tele.síntese (2019), Morais: Roaming em Cidades Pequenas, uma Realidade em Transformação [Morais: Roaming in Small Cities, an Ever-changing Reality], Tele.Síntese, www.telesintese.com.br/morais-roaming-em-cidades-pequenas-uma-realidade-em-transformacao (accessed on 30 October 2019).
Teleco (2019), Market Share das Operadoras de Celular no Brasil [Market Share of Cellular Operators in Brazil], webpage, https://www.teleco.com.br/mshare_3g.asp (accessed on 30 October 2019).
54 OECD REVIEWS OF DIGITAL TRANSFORMATION: GOING DIGITAL IN BRAZIL © OECD 2020
2. INFRASTRUCTURES FOR BRAZIL’S DIGITAL ECONOMY 2. INFRASTRUCTURES FOR BRAZIL’S DIGITAL ECONOMY
References and Notes
TeleGeography (2020), Submarine Cable Map, TeleGeography, https://www.submarinecablemap.com (accessed on 20 February 2020).
The World Bank (2020), World Bank National Accounts Data, and OECD National Accounts Data Files: GDP Constant LCU Brazil, The World Bank, Washington, DC, https://data.worldbank.org/indicator/NY.GDP.MKTP.KN?end=2018&locations=BR&start=2006.
Weller, D. and B. Woodcock (2013), “Internet traffic exchange: Market developments and policy challenges”, OECD Digital Economy Papers, No. 207, OECD Publishing, Paris, http://dx.doi.org/10.1787/5k918gpt130q-en.
Notes
IsraelThe statistical data for Israel are supplied by and under the responsibility of the relevant Israeli authorities. The use of such data by the OECD is without prejudice to the status of the Golan Heights, East Jerusalem and Israeli settlements in the West Bank under the terms of international law.
1. Using an exchange rate of 3.8742 BRL/USD for the year 2018 from https://stats.oecd.org.
2. Total communication access paths = Total access telephone lines + total fixed broadband subscriptions + cellular mobile subscriptions.
3. It is worth noting some of the features of the different measuring tools for download speeds when drawing conclusions from these data. M-Lab and Ookla compile results from speed tests conducted by users who actively measure their actual speed to access the Internet. Steam data are a further way to consider download speeds across countries, which reflects the speeds of users using one of the most Internet Protocol (IP)-intensive applications: online games.
4. To calculate the number of M2M embedded mobile cellular subscriptions, the OECD defines M2M on mobile networks as “the number of SIM cards that are assigned for use in machines and devices (cars, smart meters and consumer electronics) and are not part of a consumer subscription”.
55OECD REVIEWS OF DIGITAL TRANSFORMATION: GOING DIGITAL IN BRAZIL © OECD 2020
2. INFRASTRUCTURES FOR BRAZIL’S DIGITAL ECONOMY 2. INFRASTRUCTURES FOR BRAZIL’S DIGITAL ECONOMY
References and Notes

From:Going Digital in Brazil
Access the complete publication at:https://doi.org/10.1787/e9bf7f8a-en
Please cite this chapter as:
OECD (2020), “Infrastructures for Brazil’s digital economy”, in Going Digital in Brazil, OECD Publishing,Paris.
DOI: https://doi.org/10.1787/2f42e299-en
This work is published under the responsibility of the Secretary-General of the OECD. The opinions expressed and argumentsemployed herein do not necessarily reflect the official views of OECD member countries.
This document, as well as any data and map included herein, are without prejudice to the status of or sovereignty over anyterritory, to the delimitation of international frontiers and boundaries and to the name of any territory, city or area. Extracts frompublications may be subject to additional disclaimers, which are set out in the complete version of the publication, available atthe link provided.
The use of this work, whether digital or print, is governed by the Terms and Conditions to be found athttp://www.oecd.org/termsandconditions.
Related Documents