https://manual-solution.com/downloads/accounting/solution-manual-for- financial-management-core-concepts-2nd-edition-raymond-brooks/ 15 ©2013 Pearson Education, Inc. Publishing as Prentice Hall Chapter 2 Financial Statements LEARNING OBJECTIVES (Slide 2-2) 1. Explain the foundations of the balance sheet and income statement 2. Use the cash flow identity to explain cash flow. 3. Provide some context for financial reporting. 4. Recognize and view Internet sites that provide financial information. IN A NUTSHELL…. Although many business students find accounting to be rather boring and dry as a subject, it is important to remind them that accounting is the official “language” of finance. It provides managers and business owners vital information via financial statements, which can be used to assess the current health of the business, figure out where it has been, how it is doing, and chalk up a planned route for its future performance. In this chapter, we review the basic financial statements i.e. the income statement, the balance sheet, and the cash flow statement. However, unlike a formal course in Accounting, which trains students to actually prepare financial statements, the material in this chapter mainly helps students read financial statements and understand how they are linked together in calculating the cash flow of a company. Publicly traded companies are required by law to file quarterly (10-Q), and annual (10-K), reports with the Securities Exchange Commission (SEC). Privately-held firms compile financial statements so as to keep track of their performance, file taxes, and provide information to the owners. Thus, a knowledge of the the relationship between the three primary financial statements, i.e. The Income Statement, The Balance Sheet, and The Statement of Cash Flows, is essential for business students to assess the condition of the firms that they are associated with, and can help them immensely in planning and forecasting for future growth. The value of a firm depends on the present value of its future cash flows. Thus, it is imperative that students learn how to estimate the cash flows of a firm. Accounting income that is reported in financial statements is typically not the same as the cash flow of a firm, since most firms use accrual accounting principles for recording revenues and expenditures. Under accrual accounting, firms may recognize revenues at the time of sale, even if cash is received at a later date. Similarly, the expenses recorded over a period may not be the same as the actual payments made, since firms are billed in units of calendar time, i.e. monthly or quarterly, while the actual usage and payment may follow a different pattern. As a result, accounting

Welcome message from author
This document is posted to help you gain knowledge. Please leave a comment to let me know what you think about it! Share it to your friends and learn new things together.
Transcript

https://manual-solution.com/downloads/accounting/solution-manual-for-financial-management-core-concepts-2nd-edition-raymond-brooks/
15
©2013 Pearson Education, Inc. Publishing as Prentice Hall
Chapter 2 Financial Statements
LEARNING OBJECTIVES (Slide 2-2) 1. Explain the foundations of the balance sheet and income statement
2. Use the cash flow identity to explain cash flow.
3. Provide some context for financial reporting.
4. Recognize and view Internet sites that provide financial information.
IN A NUTSHELL…. Although many business students find accounting to be rather boring and dry as a subject, it is important to remind them that accounting is the official “language” of finance. It provides managers and business owners vital information via financial statements, which can be used to assess the current health of the business, figure out where it has been, how it is doing, and chalk up a planned route for its future performance.
In this chapter, we review the basic financial statements i.e. the income statement, the balance sheet, and the cash flow statement. However, unlike a formal course in Accounting, which trains students to actually prepare financial statements, the material in this chapter mainly helps students read financial statements and understand how they are linked together in calculating the cash flow of a company.
Publicly traded companies are required by law to file quarterly (10-Q), and annual (10-K), reports with the Securities Exchange Commission (SEC). Privately-held firms compile financial statements so as to keep track of their performance, file taxes, and provide information to the owners. Thus, a knowledge of the the relationship between the three primary financial statements, i.e. The Income Statement, The Balance Sheet, and The Statement of Cash Flows, is essential for business students to assess the condition of the firms that they are associated with, and can help them immensely in planning and forecasting for future growth.
The value of a firm depends on the present value of its future cash flows. Thus, it is imperative that students learn how to estimate the cash flows of a firm. Accounting income that is reported in financial statements is typically not the same as the cash flow of a firm, since most firms use accrual accounting principles for recording revenues and expenditures. Under accrual accounting, firms may recognize revenues at the time of sale, even if cash is received at a later date. Similarly, the expenses recorded over a period may not be the same as the actual payments made, since firms are billed in units of calendar time, i.e. monthly or quarterly, while the actual usage and payment may follow a different pattern. As a result, accounting
Chapter 2 Financial Statements 16
©2013 Pearson Education, Inc. Publishing as Prentice Hall
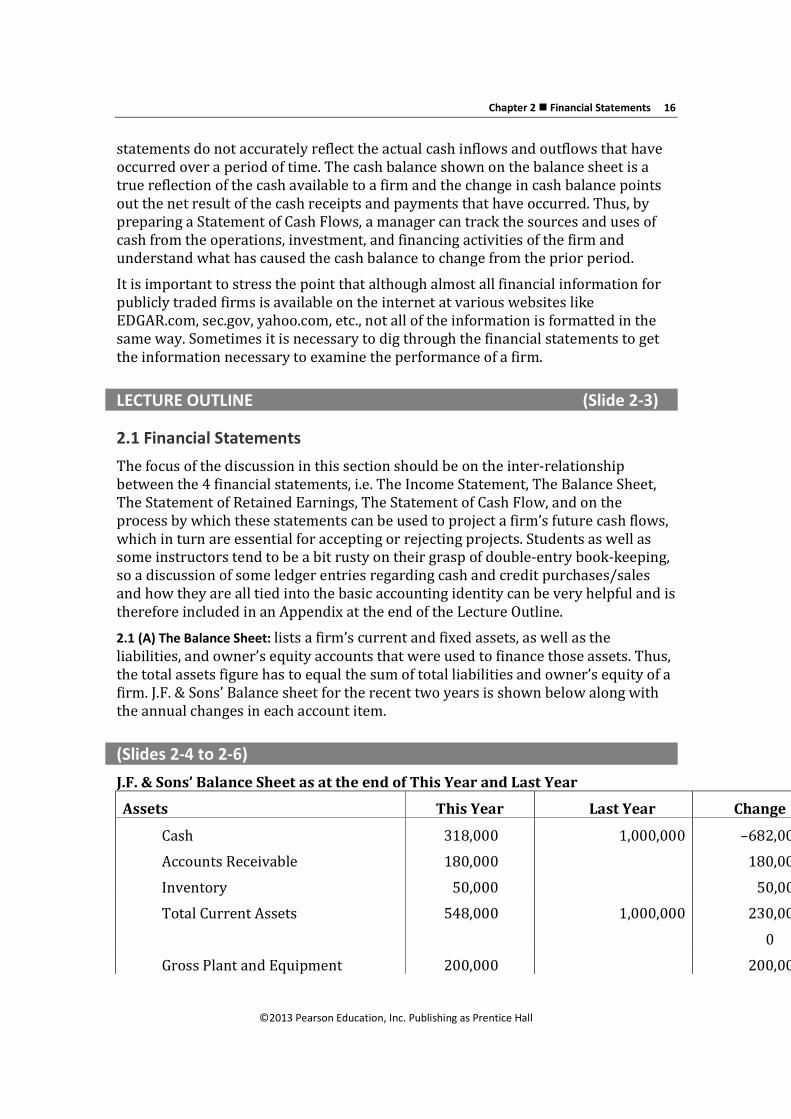
statements do not accurately reflect the actual cash inflows and outflows that have occurred over a period of time. The cash balance shown on the balance sheet is a true reflection of the cash available to a firm and the change in cash balance points out the net result of the cash receipts and payments that have occurred. Thus, by preparing a Statement of Cash Flows, a manager can track the sources and uses of cash from the operations, investment, and financing activities of the firm and understand what has caused the cash balance to change from the prior period.
It is important to stress the point that although almost all financial information for publicly traded firms is available on the internet at various websites like EDGAR.com, sec.gov, yahoo.com, etc., not all of the information is formatted in the same way. Sometimes it is necessary to dig through the financial statements to get the information necessary to examine the performance of a firm.
LECTURE OUTLINE (Slide 2-3)
2.1 Financial Statements The focus of the discussion in this section should be on the inter-relationship between the 4 financial statements, i.e. The Income Statement, The Balance Sheet, The Statement of Retained Earnings, The Statement of Cash Flow, and on the process by which these statements can be used to project a firm’s future cash flows, which in turn are essential for accepting or rejecting projects. Students as well as some instructors tend to be a bit rusty on their grasp of double-entry book-keeping, so a discussion of some ledger entries regarding cash and credit purchases/sales and how they are all tied into the basic accounting identity can be very helpful and is therefore included in an Appendix at the end of the Lecture Outline.
2.1 (A) The Balance Sheet: lists a firm’s current and fixed assets, as well as the liabilities, and owner’s equity accounts that were used to finance those assets. Thus, the total assets figure has to equal the sum of total liabilities and owner’s equity of a firm. J.F. & Sons’ Balance sheet for the recent two years is shown below along with the annual changes in each account item.
(Slides 2-4 to 2-6) J.F. & Sons’ Balance Sheet as at the end of This Year and Last Year
Assets This Year Last Year Change
Cash 318,000 1,000,000 –682,000
Accounts Receivable 180,000 180,000
Inventory 50,000 50,000
Total Current Assets 548,000 1,000,000 230,000
0
Gross Plant and Equipment 200,000 200,000
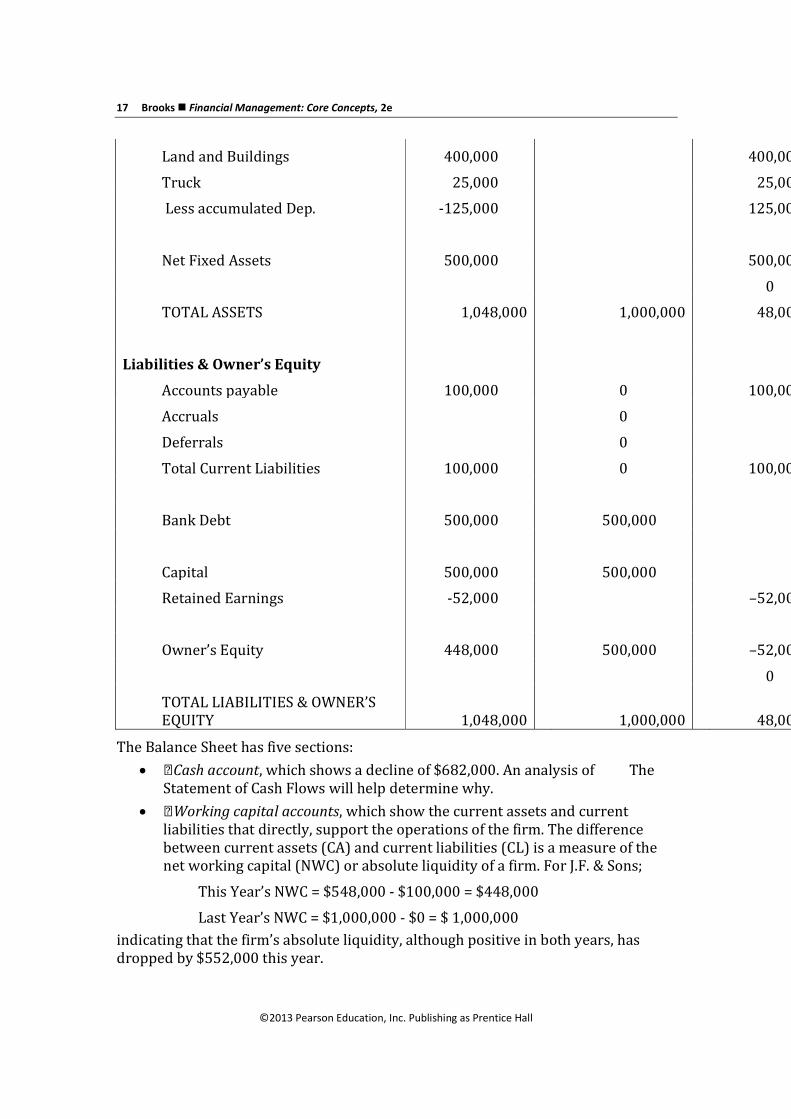
17 Brooks Financial Management: Core Concepts, 2e
©2013 Pearson Education, Inc. Publishing as Prentice Hall
Land and Buildings 400,000 400,000
Truck 25,000 25,000
Less accumulated Dep. -125,000 125,000
Net Fixed Assets 500,000 500,000
0
TOTAL ASSETS 1,048,000 1,000,000 48,000
Liabilities & Owner’s Equity
Accounts payable 100,000 0 100,000
Accruals 0
Deferrals 0
Total Current Liabilities 100,000 0 100,000
Bank Debt 500,000 500,000
Capital 500,000 500,000
Retained Earnings -52,000 –52,000
Owner’s Equity 448,000 500,000 –52,000
0
TOTAL LIABILITIES & OWNER’S EQUITY 1,048,000 1,000,000 48,000
The Balance Sheet has five sections:
Cash account, which shows a decline of $682,000. An analysis of The Statement of Cash Flows will help determine why.
Working capital accounts, which show the current assets and current liabilities that directly, support the operations of the firm. The difference between current assets (CA) and current liabilities (CL) is a measure of the net working capital (NWC) or absolute liquidity of a firm. For J.F. & Sons;
This Year’s NWC = $548,000 - $100,000 = $448,000
Last Year’s NWC = $1,000,000 - $0 = $ 1,000,000 indicating that the firm’s absolute liquidity, although positive in both years, has dropped by $552,000 this year.

Chapter 2 Financial Statements 18
©2013 Pearson Education, Inc. Publishing as Prentice Hall
Long-term capital assets accounts - which show the gross and net book values of the long-term assets that the firm has invested into since its inception. The accumulated depreciation figure shows how much of the original value of the assets has already been expensed as depreciation.
Long-term liabilities (debt) accounts - which include all the outstanding loans that the firm has taken on for periods greater than one year. As part of the loan is paid off this balance will decline. For J.F. & Sons it is assumed that the loan will be paid off after 10 years.
Ownership Accounts - include the capital contributed by the owners (common stock account) and the retained earnings of the firm since its inception. The sum of both these components is known as owners’ equity or stockholders’ equity on the balance sheet. The year-end retained earnings figure is determined by adding net income for the year to the beginning retained earnings figure and subtracting dividends paid during the year (if any).
Note: It is important to stress the point to students that the retained earnings figure is an accumulated total of the undistributed earnings of a company since its inception and that it is not cash available for future expenses or investment, since it has already been used in the business
2.1 (B) The Income Statement: shows the expenses and income generated by a firm over a past period, typically over a quarter or a year. It can be thought of as a video recording of expenses and revenues. Revenues are listed first, followed by cost of goods sold, depreciation, and other operating expenses to calculate Earnings before Interest and Taxes (EBIT) or operating income. From EBIT, we deduct interest expenses to get taxable income or earnings before taxes (EBT), and finally after applying the appropriate tax rate, we deduct taxes and arrive at net income or Earnings after Taxes (EAT).
(Slides 2-7 to 2-9) J. F. & Sons’ Annual Income Statement
Revenues 300,000
Cost of Goods Sold 150,000
Wages 20,000
Utilities 5,000
Other Expenses 2,000
Earnings Before Depreciation, Interest, Taxes 123,000
less Depreciation 125,000
Earnings Before Interest & Taxes –2,000

19 Brooks Financial Management: Core Concepts, 2e
©2013 Pearson Education, Inc. Publishing as Prentice Hall
less Interest 50,000
Earnings Before Taxes –52,000
Taxes 0
Net Income (Loss) –52,000
J.F. & Sons had earned an operating income of -$2,000 during their first year and after accounting for interest they would show a loss of $52,000, thus no taxes would be paid. Now, the net loss of $52,000 is not the same as their change in cash balance (-682,000) because of three reasons: accrual accounting, non-cash expense items, and interest being treated as a financing rather than an operating expense item.
Issue 1: Generally accepted accounting principles (GAAP). Based on GAAP, firms typically recognize revenues at the time of sale, even if cash is not received in the same accounting period. Similarly, firms are billed for expenses that may correspond to a later period. This is known as accrual-based accounting. Thus, the yearly net income figure could be different from the change in cash balance that has occurred during that year. As shown below, the cash account shows that the cash balance would have declined from $1,000,000 to $318,000 or a net decline of $682,000, while the net income figure shows a loss of only $52,000.
Issue 2: Non-cash expense items. Some expenses shown on the income statement e.g. depreciation of $125,000, are actually annual charges (20%) being shown based on the initial year expense of $625,000 for acquiring the truck, the plant and equipment, and the land and buildings.
J.F. & Sons’ Cash Account details for the year ended December 31, 20XX
Debit Credit
Owner's Capital 500,000 Plant & Equipment 200,000
Bank Loan 500,000 Land & Bldg 400,000
Revenues 120,000 Inventory 100,000
Truck 25,000
Wages 20,000
Utilities 5,000
Other Exp 2,000
Interest Exp 50,000
Ending Balance 318,000
Issue 3: Classifying interest expense as part of the financing decision. In finance, there is a preference to separate operating decisions (investment-

Chapter 2 Financial Statements 20
©2013 Pearson Education, Inc. Publishing as Prentice Hall
related) from financing decisions. Thus, interest expense is not deducted as part of operating cash flow.
Thus, we can calculate J.F. & Sons’ operating cash flow (OCF) by adding back depreciation and interest expense to its net income, i.e.
Operating Cash Flow = Net Income + Depreciation + Interest
$123,000 = $-52,000 + $125,000 + 50,000
or by using an alternative method, i.e.
Operating Cash Flow (OCF) = EBIT + Depreciation – Taxes
$123,000 = $-2000 + $125,000 - 0
Thus, although the firm is showing a negative net income (loss) of -$52,000 its cash flow from operations of $123,000 is positive and considerably higher.
2.1 (C) The Statement of Retained Earnings: is considered to be the 4th financial statement that firms prepare and report. It shows how the net income for the past period was allocated between dividends (if any) and retained earnings. For J.F. & Sons, the net loss of $52,000 for the year has resulted in negative retained earnings, since this is their first year of operation, and has caused a reduction in the owner’s equity from $500,000 to $448,000. (Slide 2-10)
J. F. & Sons’ Statement of Retained Earnings
Beginning balance 500,000
Add net income (Loss) (52,000)
Subtract dividends 0
Ending balance 448,000
2.2 Cash Flow Identity and the Statement of Cash Flows (Slides 2-11 to 2-20) The cash flow identity states that the cash flow from the left hand side of the balance sheet is equal to the cash flow on the right hand side of the balance sheet. That is,
Cash Flow from Assets ≡ Cash Flow to Creditors and Cash Flow to Owners
Where;
Cash Flow from Assets = Operating Cash Flow – Net Capital Spending - Change in Net Working Capital,
Operating Cash Flow = EBIT + Depreciation – Taxes;
Net Capital Spending = Ending Net Fixed Assets - Beginning Net Fixed Assets + Depreciation
Change in Net Working Capital = Ending NWC – Beginning NWC

21 Brooks Financial Management: Core Concepts, 2e
©2013 Pearson Education, Inc. Publishing as Prentice Hall
Net Working Capital = Current Assets – Current Liabilities
Cash Flow to Creditors = Interest Expense – Net New Borrowing from Creditors
Net New Borrowing = Ending Long-term Liabilities – Beginning Long-term Liabilities
Cash Flow to Owners = Dividends – Net New Borrowing from Owners
Net New Borrowing from Owners = Change in Equity
Change in Equity = Ending Common Stock and Paid-in-Surplus - Beginning Common Stock and Paid-in-Surplus
For J.F. & Sons,
Operating Cash Flow = -$2000+$125,000-0 = $123,000
Net Capital Spending = $500,000 - 0 + $125,000 = $625,000
Change in Net Working Capital = $448,000 - $1,000,000 = -552,000
So, Cash Flow from Assets = 123,000 - 625,000 - (-552,000)
= 675,000 - 625,000 = $50,000
Cash Flow to Creditors = $50,000 - $0 (since the loan amount was neither increased nor decreased)
Cash Flow to Owners = 0 (since no shares were issued or repurchased nor were any dividends paid)
Hence, the cash flow identity holds,
i.e., Cash Flow from Assets = $50,000 = Cash Flow to Creditors and Owners
The Statement of Cash Flows, or the Sources and Uses of Cash Statement, as it is often called, is compiled by taking information from the Income Statement and the Balance Sheet and organizing it into three sections, i.e. cash flow from operating activities, cash flow from investment activities, and cash flow from financing activities, so as to reflect the change in the ending cash balance of the firm during that reporting period i.e., quarter or year. So the three sections of the cash flow identity explained above are related to the three sections of the statement of cash flows in the following manner:
Cash flow from Assets = Cash flow to Creditors + Cash flow to Owners
Cash flow from Cash flow from Cash flow from operating activitiesinvestment activitiesfinancing activities
Note: Remind students that based on the accounting identity and double-entry accounting principles explained earlier, an increase in an asset (except cash) would result in a use of cash, while a decrease (sale) of an asset would result

Chapter 2 Financial Statements 22
©2013 Pearson Education, Inc. Publishing as Prentice Hall
in a source of cash. Similarly, an increase in a liability or owners’ equity would bring in cash while a decrease would take away cash.
J. F. & Sons’ Statement of Cash Flow
Operating Cash Flow
EBIT –2,000
Depreciation 125,000
Increase in Inventory (Use) –50,000
Increase in Accounts Receivable (Use) –180,000
Increase in Accounts payable (Source) 100,000
Cash Flow from Operating Activities –7,000
Investment Cash Flow
Invested in Plant & Equipment (Use) –200,000
Invested in a Truck (Use) –25,000
Land & Buildings (Use) –400,000
Cash Flow from Investment Activities –625,000
Financing Cash Flow
Interest Paid –50,000
Cash flow from financing activities –50,000
Net Sources (Uses) or Change in Cash Account – 682,000
Beginning Cash Balance 1,000,000
Net Cash Flow during current year –682,000

23 Brooks Financial Management: Core Concepts, 2e
©2013 Pearson Education, Inc. Publishing as Prentice Hall
Ending Cash Balance 318,000
Cash flow from operating activities - would include the firm’s operating cash flow calculated as follows:
Operating Cash Flow (OCF) = EBIT + Depreciation – Taxes as well as the changes in the current assets (except cash) and current liabilities of the firm for that reporting period. For J.F. & Sons during the past year, cash flow from operations was -$7,000, indicating that the firm had to dip into it its cash account to fund its operations for the year.
Cash flow from investing activities - includes the cash used/generated in purchasing/disposing fixed assets and other investments. For J.F. & Sons, given that this has been its first year of operations, a fairly large use of cash ($625,000) has resulted from the purchase of its plant, equipment, land, buildings, and a delivery truck.
Note: Since we have already added back depreciation for the year ($125,000) as part of the sources of funds from operations, we account for the change in gross value of the assets (–$625,000) in this section. Sometimes, the Balance Sheet shows only net fixed assets and accumulated depreciation figures. In such a case we would add together the change in value in each of the 2 items to represent the change in gross fixed assets.
Cash flow from financing activities- includes the payment of interest, dividends, reduction of the principal balance on debt, repurchase of stock, floating of new issues of stock and/or bonds and increase/decrease in treasury stock. For J.F. & Sons, this past year, the only cash flow from financing in the payment of interest of $50,000 on its outstanding loan.
Free Cash Flow: is another term used in conjunction with the cash flow from assets of a firm. It refers to the cash available to pay the creditors and owners once the firm has made the investments in working capital and capital assets necessary for continuing and growing the business. The timing and amount of free cash flow generated by a firm is critical to its valuation.
2.3 Financial Performance Reporting (Slide 2-21) Publicly traded companies provide current and potential shareholders financial performance information, company highlights, and management perspectives by compiling annual reports. In addition, they are required to file quarterly (10-Q) and annual (10-K) reports with the SEC
Regulation Fair Disclosure (Reg. FD): requires companies to release all material information (which would include financial statements)to all investors at the same time so that no single investor or group of investors has privileged access to the information and is able to profit from it at the expense of others.
Chapter 2 Financial Statements 24
©2013 Pearson Education, Inc. Publishing as Prentice Hall
Notes to the Financial Statements are included to provide details and clarifications regarding the various items and methods use to report a firm’s financial performance. Unusual items such as sudden increases in debt, losses, or financial impact from lawsuits are clarified in the Notes section.
2.4 Financial Statements on the Internet (Slide 2-22) EDGAR (Electronic Data Gathering Analysis and Retrieval) is the SEC’s website (www.sec.gov/edgar.shtml) for obtaining financial reports and filings of all publicly listed companies, free of charge. The internet is replete with other sites such as finance.yahoo.com, etc. that offer similar financial statement data for publicly listed companies. It is important to note that often times the formatting and grouping of the data can be different and some adjustments would have to be made so as to standardize the data.
Appendix
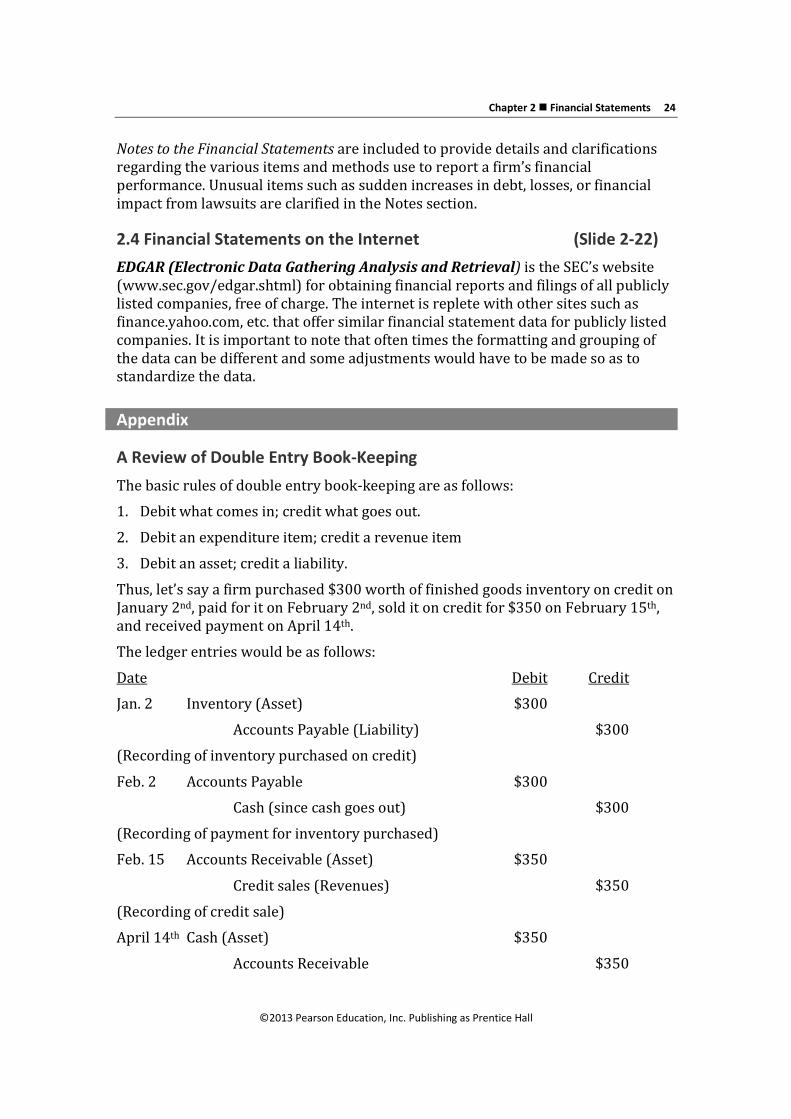
A Review of Double Entry Book-Keeping The basic rules of double entry book-keeping are as follows:
1. Debit what comes in; credit what goes out.
2. Debit an expenditure item; credit a revenue item
3. Debit an asset; credit a liability.
Thus, let’s say a firm purchased $300 worth of finished goods inventory on credit on January 2nd, paid for it on February 2nd, sold it on credit for $350 on February 15th, and received payment on April 14th.
The ledger entries would be as follows:
Date Debit Credit
Jan. 2 Inventory (Asset) $300
Accounts Payable (Liability) $300
(Recording of inventory purchased on credit)
Feb. 2 Accounts Payable $300
Cash (since cash goes out) $300
(Recording of payment for inventory purchased)
Feb. 15 Accounts Receivable (Asset) $350
Credit sales (Revenues) $350
(Recording of credit sale)
April 14th Cash (Asset) $350
Accounts Receivable $350

25 Brooks Financial Management: Core Concepts, 2e
©2013 Pearson Education, Inc. Publishing as Prentice Hall
(Recording of receipt of payment for credit sale)
A Comprehensive Example to show how the 3 statements are prepared from the ledger entries
Let’s say that J.F. & Sons decide to start a business by contributing $500,000 of their own money and borrowing $500,000 from a bank (10-year note) at the rate of
10%, per year. It is the last week in December.
During the first quarter of the following year, they complete the following transactions:
Amount Transaction
200,000 Bought Equipment
400,000 Bought Land & Bldg
100,000 Paid Cash for Raw Materials
100,000 Bought Raw Materials on Credit
25,000 Bought Truck for cash
By the end of the year, they have made the following transactions as well…
First Year transactions
Sales 300,000 [40% (Cash); 60% (Credit)]
CGS 150,000 Assume 50% of Sales
Wages 20,000
Utilities 5,000
Other Exp 2,000
Interest 50,000
Selling & Adm. Exp. 50,000
Depreciation 120,000 20% of Fixed Assets
Let’s start by preparing the journal entries:
Journal Entries
Debit Credit
1) Cash 500,00
0
Owner's Equity 500,00
0

Chapter 2 Financial Statements 26
©2013 Pearson Education, Inc. Publishing as Prentice Hall
Journal Entries
Debit Credit
2) Cash 500,00
0
Bank Loan 500,00
0
3) Plant & Equipment 200,00
0
Cash 200,00
0
4) Land & Bldg 400,00
0
Cash 400,00
0
5) Inventory 100,00
0
Cash 100,00
0
6) Inventory 100,00
0
Accounts Payable 100,00
0
7) Truck 25,000
Cash 25,000
8) Cash 120,00
0
Revenues 120,00
0
9) Accounts Receivable 180,00
0
Revenues 180,00

27 Brooks Financial Management: Core Concepts, 2e
©2013 Pearson Education, Inc. Publishing as Prentice Hall
Journal Entries
Debit Credit 0
10) Cost of Goods Sold 150,00
0
Inventory 150,00
0
11) Wages 20,000
Cash 20,000
12) Utilities 5,000
Cash 5,000
13) Other Exp. 2,000
Cash 2,000
14) Interest Exp. 50,000
Cash 50,000
15) Selling & Adm. Exp. 50,000
Cash 50,000
16) Depreciation 120,00
0
Accumulated Dep. 120,00
0
Now, keeping in mind the accounting identity
Assets ≡ Liabilities + Owners’ Equity
i.e. investment in assets is made by either borrowing funds or by using the owner’s funds; and the cash flow identity, i.e.
Chapter 2 Financial Statements 28
©2013 Pearson Education, Inc. Publishing as Prentice Hall
Cash Flow from Assets ≡ Cash Flow to Creditors + Cash Flow to Owners
i.e. Cash flow generated from the investment in assets is paid back to creditors and the owners, we can prepare the Income Statement, the Balance Sheet, and the Statement of Cash Flows for the year.
Questions 1. Debits always equal credits. What type of accounting system uses this
requirement? What is the accounting identity? What is the connection between “debits always equal credits” and the accounting identity?
This system is known in accountancy as double-entry book-keeping (or double-entry accounting). It is what ensures that the Balance Sheet balances and maintains that the accounting identity will always hold.
2. What is the difference between a current asset and a long-term asset? What is the difference between a current liability and a long-term liability? What is the difference between a debtor’s claim and an owner’s claim?
A current asset is cash or items such as accounts receivable and inventory that would normally be turned into cash during the business cycle. Long-term assets are assets of the firm used to make the products of the firm but are not expected to turn into cash during the business cycle. These assets are items such as buildings and equipment. A current liability is an obligation of the company that the company expects to pay off during the coming business cycle. Long-term liabilities are obligations that will be paid off in future business cycles or years. A debtor’s claim is a liability and has a fixed dollar amount to the claim. An owner’s claim is a residual claim and this claim is for all the remaining value of the company once the debtor’s are satisfied.
3. Why is the term residual claimant applied to a shareholder (owner) of a business?
The term “residual claimant” is applied to a shareholder because the value of their claim is what is left over from the company assets once the creditors’ claims have been satisfied. The positive side of this is that if the company value is high and the creditors’ claims low, a substantial amount of value goes to the owners (shareholders).
4. What is the difference between net income and operating cash flow?
To arrive at net income, companies record non-cash expense items and record revenue and expenses on an accrual basis. Therefore, net income does not reflect the true cash flow for the current period.
5. What is the purpose of the statement of retained earnings?
The Statement of Retained Earnings explains the distribution of the net income from the past year. Net income is either retained in the company or paid out to owners in the form of dividends.
6. Why do financial notes accompany the annual report? Give an example of a financial note from an annual report. (Look up the annual report of a company on its web site and read its financial notes.)

29 Brooks Financial Management: Core Concepts, 2e
©2013 Pearson Education, Inc. Publishing as Prentice Hall
Notes to the financial statements help explain many of the details necessary to gain a more complete picture of the firm’s performance. An example from PepsiCo’s financial notes is on how they account for employee stock options. In note #6 the final paragraph with the heading “Method of Accounting and Our Assumptions” states:
“We account for our employee stock options under the fair value method of accounting using the Black-Scholes valuation method to measure stock-based compensation expense at the date of grant.” (Page 62 of 2005 Annual Report)
7. What are the three components of the cash flow from assets?
The three components of the cash flow from assets include: operating cash flow, capital spending, and change in net working capital.
8. What does an increase in net working capital mean with regard to cash flow?
An increase in net working capital means that there has been a net increase in cash outflows since the increases in current assets have outweighed the increases in sources of funds resulting from an increase in current liabilities.
9. How does a company return money to debt lenders? How do you determine how much was returned over the past year?
Companies return money to debt lenders by paying the interest (cost of the borrowed money) and principal. The interest expense paid from the income statement and the change in the long-term debt account shows how much was returned to debtors over the past year. It is also shown in the Cash Flow to Creditors section of the Statement of Cash Flow.
10. Who receives the annual reports of a company? What effect does regulation fair disclosure have on the distribution of financial information?
The annual report of a company is sent to current owners (shareholders) and the SEC and is also made available to prospective owners, financial analysts, and others interested in a company’s performance. As a result of the Fair Disclosure regulation, companies are required to release all material information to all investors at the same time.
Prepping for exams 1. b. 2. c. 3. d. 4. d. 5. c. 6. a. 7. c. 8. c. 9. a.

Chapter 2 Financial Statements 30
©2013 Pearson Education, Inc. Publishing as Prentice Hall
10. a.
Problems
1. From the balance sheet accounts listed below:
a. construct a balance sheet for 2010 and 2011.
b. list all the working capital accounts.
c. find the net working capital for the years ending 2010 and 2011.
d. calculate the change in net working capital for the year 2011.
Balance Sheet Accounts of Roman Corporation Account Balance 12/31/2010Balance 12/31/2011 Accumulated Depreciation $2,020 $2,670 Accounts Payable $1,800 $2,060 Accounts Receivable $2,480 $2,690 Cash $1,300 $1,090 Common Stock $4,990 $4,990 Inventory $5,800 $6,030 Long-Term Debt $7,800 $8,200 Plant, Property & Equipment $8,400 $9,200 Retained Earnings $1,370 $1,090
ANSWER
a. The Balance Sheets for the two years are: Assets: 2010 2011
Current Assets Cash $1,300 $1,090 Accounts Receivable $2,480 $2,690 Inventory $5,800 $6,030 Total Current Assets $9,580 $9,810
Long-Term Assets: Plant, Prop. & Equip $8,400 $9,200 Minus Acc. Depreciation ($2,020) ($2,670) Net P P & E $6,380 $6,530
TOTAL Assets $15,960 $16,340 Liabilities
Current Liabilities Accounts Payable $1,800 $2,060 Long-Term Liabilities Long-term Debt $7,800 $8,200 Total Liabilities $9,600 $10,260
Owner’s Equity Common Stock $4,990 $4,990

31 Brooks Financial Management: Core Concepts, 2e
©2013 Pearson Education, Inc. Publishing as Prentice Hall
Retained Earnings $1,370 $1,090 Total Owner’s Equity $6,360 $6,080
TOTAL Liab. & O.E. $15,960 $16,340
b. The Working Capital Accounts are:
Cash, Accounts Receivable, Inventory, and Accounts Payable
c. The Net Working Capital for 2006 and 2007:
Net Working Capital = Cash + Accounts Receivable + Inventory – Accounts Payable
2006 Net Working Capital = $1,300 + $2,480 + $5,800 - $1,800 = $7,780
2007 Net Working Capital = $1,090 + $2,690 + $6,030 - $2,060 = $7,750 d. The Change in Net Working Capital for 2007 is, $7,750 - $7,780 = -$30 or a
decrease in Net Working Capital of $30.
2. From the income statement accounts on the next page:
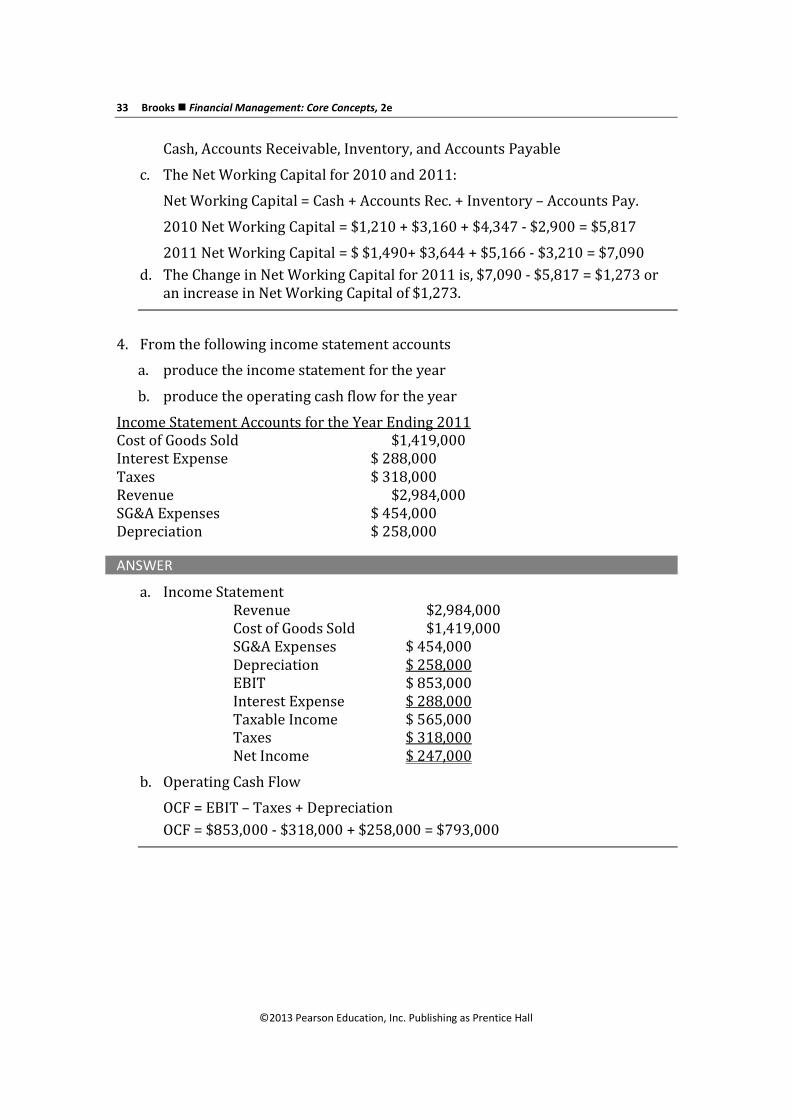
a. produce the income statement for the year b. produce the operating cash flow for the year
Income Statement Accounts for the Year Ending 2011 Cost of Goods Sold $345,000 Interest Expense $ 82,000 Taxes $ 42,000 Revenue $744,000 SG&A Expenses $ 66,000 Depreciation $112,000
ANSWER
a. Income Statement Revenue $744,000 -Cost of Goods Sold $342,000 -SG&A Expenses $ 66,000 -Depreciation $112,000 EBIT $224,000 -Interest Expense $ 82,000 Taxable Income $142,000 -Taxes $ 42,000 Net Income $100,000
b. Operating Cash Flow
OCF = EBIT – Taxes + Depreciation OCF = $224,000 - $42,000 + $112,000 = $294,000

Chapter 2 Financial Statements 32
©2013 Pearson Education, Inc. Publishing as Prentice Hall
3. From the following balance sheet accounts:
a. construct a balance sheet for 2010 and 2011
b. list all the working capital accounts
c. find the net working capital for the years ending 2010 and 2011
d. calculate the change in net working capital for the year 2011
Balance Sheet Accounts of Athens Corporation Account Balance 12/31/2010 Balance 12/31/2011 Accumulated Depreciation $4,234 $4,866 Accounts Payable $2,900 $3,210 Accounts Receivable $3,160 $3,644 Cash $1,210 $1,490 Common Stock $4,778 $7,278 Inventory $4,347 $5,166 Long-Term Debt $3,600 $2,430 Plant, Property & Equipment $8,675 $9,840 Retained Earnings $1,880 $2,356
ANSWER
a. The Balance Sheets for the two years are:
Assets: 2010 2011 Current Assets Cash $1,210 $1,490 Accounts Receivable $3,160 $3,644 Inventory $4,347 $5,166 Total Current Assets $8,717 $10,300 Long-Term Assets Plant, Prop. & Equip $8,675 $9,840 Minus Acc. Depreciation ($4,234) ($4,866) Net P P & E $4,441 $4,974 TOTAL Assets $13,158 $15,274 Liabilities Current Liabilities Accounts Payable $2,900 $3,210 Long-Term Liabilities Long-term Debt $3,600 $2,430 Total Liabilities $6,500 $5,640 Owner’s Equity
Common Stock $4,778 $7,278 Retained Earnings $1,880 $2,356 Total Owner’s Equity $6,658 $9,634
TOTAL Liab. & O.E. $13,158 $15,274
b. The Working Capital Accounts are:
33 Brooks Financial Management: Core Concepts, 2e
©2013 Pearson Education, Inc. Publishing as Prentice Hall
Cash, Accounts Receivable, Inventory, and Accounts Payable
c. The Net Working Capital for 2010 and 2011:
Net Working Capital = Cash + Accounts Rec. + Inventory – Accounts Pay.
2010 Net Working Capital = $1,210 + $3,160 + $4,347 - $2,900 = $5,817
2011 Net Working Capital = $ $1,490+ $3,644 + $5,166 - $3,210 = $7,090 d. The Change in Net Working Capital for 2011 is, $7,090 - $5,817 = $1,273 or
an increase in Net Working Capital of $1,273.
4. From the following income statement accounts
a. produce the income statement for the year
b. produce the operating cash flow for the year
Income Statement Accounts for the Year Ending 2011 Cost of Goods Sold $1,419,000 Interest Expense $ 288,000 Taxes $ 318,000 Revenue $2,984,000 SG&A Expenses $ 454,000 Depreciation $ 258,000
ANSWER
a. Income Statement Revenue $2,984,000 Cost of Goods Sold $1,419,000 SG&A Expenses $ 454,000 Depreciation $ 258,000 EBIT $ 853,000 Interest Expense $ 288,000 Taxable Income $ 565,000 Taxes $ 318,000 Net Income $ 247,000
b. Operating Cash Flow
OCF = EBIT – Taxes + Depreciation OCF = $853,000 - $318,000 + $258,000 = $793,000

Chapter 2 Financial Statements 34
©2013 Pearson Education, Inc. Publishing as Prentice Hall
5. Find the operating cash flow for the year for Harper Brothers Incorporated if they had sales revenue of $300,000,000, cost of goods sold of $140,000,000, sales and administrative costs of $40,000,000, depreciation expense of $65,000,000, and a tax rate of 40%.
ANSWER
Using income statement format we have, Sales $300,000,000 COGS $140,000,000 SG&A $ 40,000,000 Depreciation $ 65,000,000 EBIT $ 55,000,000 Taxes (@ 40%) $ 22,000,000 Net Income $ 33,000,000
Operating Cash Flow = EBIT + Depreciation – Taxes Operating Cash Flow = $55,000,000 + $65,000,000 - $22,000,000 =
$98,000,000
6. Find the operating cash flow for the year for Robinson and Sons if they had sales revenue of $80,000,000, cost of goods sold of $35,000,000, sales and administrative costs of $6,400,000, depreciation expense of $7,600,000, and a tax rate of 30%.
ANSWER
Using income statement format we have, Sales $80,000,000 COGS $35,000,000 SG&A $ 6,400,000 Depreciation $ 7,600,000 EBIT $31,000,000 Taxes (@ 30%) $ 9,300,000
Net Income $21,700,000

35 Brooks Financial Management: Core Concepts, 2e
©2013 Pearson Education, Inc. Publishing as Prentice Hall
For problems 7 through 14 use the data from the following financial statements:
Partial Income Statement Year Ending 2011 Sales Revenue $350,000 COGS $140,000 Fixed Costs $ 43,000 SG&A Expenses $ 28,000 Depreciation $ 46,000
Partial Balance Sheet 12/31/2010 Assets: Liabilities: Cash $ 16,000 Notes Payable $ 14,000 Accounts Rec. $ 28,000 Accounts Payable $ 19,000 Inventories $ 48,000 Long-Term Debt $190,000 Fixed Assets $368,000 Owners’ Equity: Acc. Depreciation $142,000 Retained Earnings $ ??????? Intangible Assets $ 82,000 Common Stock $130,000
Partial Balance Sheet 12/31/2011 Assets: Liabilities: Cash $ 26,000 Notes Payable $ 12,000 Accounts Rec. $ 19,000 Accounts Payable $ 24,000 Inventories $ 53,000 Long-Term Debt $162,000 Fixed Assets $448,000 Owners’ Equity: Acc. Depreciation $ ??????? Retained Earnings $ ?????? Intangible Assets $ 82,000 Common Stock $180,000
7. Complete the partial income statement if the company paid interest expense of $18,000 for 2011 and had an overall tax rate of 40% for 2011.
ANSWER
Income Statement for the Year Ending 12/31/2011 Sales Revenue $350,000 COGS $140,000 Fixed Costs $ 43,000 SG&A Expenses $ 28,000 Depreciation $ 46,000 EBIT $ 93,000 Interest Expense $ 18,000 Taxable Income $ 75,000 Taxes @ 40% $ 30,000 Net Income $ 45,000

Chapter 2 Financial Statements 36
©2013 Pearson Education, Inc. Publishing as Prentice Hall
8. Complete the balance sheet (Hint, find accumulated depreciation for 2011 first).
ANSWER
To complete the balance sheet for 2010 add up all the asset accounts and subtract off the accumulated depreciation (contra asset account) for a total of $400,000. Now balance the balance sheet by determining the total liabilities and owner’s equity accounts ($353,000) and filling in the difference between this total and Total Assets as the balance in Retained Earnings, i.e. $47,000.
Balance Sheet 12/31/2010 Assets: Liabilities: Cash $ 16,000 Notes Payable $ 14,000 Accounts Rec. $ 28,000 Accounts Payable $ 19,000 Inventories $ 48,000 Long-Term Debt $190,000 Fixed Assets $368,000 Owner’s Equity Acc. Depreciation $142,000 Retained Earnings $ 47,000 Intangible Assets $ 82,000 Common Stock $130,000 Total Assets $400,000 Total Liab. & OE $400,000
Do the same for the year 2011 but now we must first find accumulated depreciation total. The prior year was $142,000 and the current year’s depreciation from the income statement is $46,000 so the accumulated depreciation for 2007 is $188,000. Now balance the balance sheet by finding the Retained Earnings that makes the total liabilities and the owner’s equity equal $440,000.
Balance Sheet 12/31/2011 Assets: Liabilities: Cash $ 26,000 Notes Payable $ 12,000 Accounts Rec. $ 19,000 Accounts Payable $ 24,000 Inventories $ 53,000 Long-Term Debt $162,000 Fixed Assets $448,000 Owner’s Equity Acc. Depreciation $188,000 Retained Earnings $ 62,000 Intangible Assets $ 82,000 Common Stock $180,000 Total Assets $440,000 Total Liab. & O.E. $440,000

37 Brooks Financial Management: Core Concepts, 2e
©2013 Pearson Education, Inc. Publishing as Prentice Hall
9. Complete the statement of retained earnings for 2011 and determine the dividends paid last year.
ANSWER
Retained Earnings increases by Net Income minus dividends paid and we have an increase of $15,000 for retained earnings ($62,000 - $47,000). Net Income is $45,000 so if $15,000 went to Retained Earnings then the rest, $30,000 was paid out in dividends.
Statement of Retained Earnings for 2011 Beginning Balance $47,000 Add Net Income $45,000 Minus Dividends $30,000 Ending Balance $62,000
10. What are the net fixed assets for the years 2010 and 2011?
ANSWER
Net Fixed Assets = Fixed assets minus accumulated depreciation
For 2010,
Net Fixed Assets = $368,000 - $142,000 = $226,000
For 2011,
First find the new accumulated depreciation for 2007 which is the accumulated depreciation balance in 2006 plus the depreciation expense for 2011:
Accumulated Depreciation 2007 = $142,000 + $46,000 = $188,000 Net Fixed Assets = $448,000 - $188,000 = $260,000
11. Find the cash flow from assets for 2011 and break it down into its three parts: operating cash flow, capital spending, and change in net working capital.
ANSWER
Find the three parts that make up Cash Flow from Assets, i.e. Operating Cash Flow, Change in Net Working Capital and Capital Spending.
Operating Cash Flow is EBIT – Taxes + Depreciation so,
OCF = $93,000 - $30,000 + $46,000 = $109,000
Change in Net Working Capital is 2011 NWC – 2010 NWC
Net Working Capital is Current Assets minus Current Liabilities
2010 NWC = $16,000 + $28,000 + $48,000 - $14,000 - $19,000 = $59,000

Chapter 2 Financial Statements 38
©2013 Pearson Education, Inc. Publishing as Prentice Hall
2011 NWC = $26,000 + $19,000 + $53,000 - $12,000 - $24,000 = $62,000
Change in NWC = $62,000 - $59,000 = $3,000
Capital spending for 2011 is the Change in Net Fixed Assets (Fixed Assets minus Depreciation) plus 2011 Depreciation Expense. Note there is no change in Intangible Assets so we need only Fixed Assets and Accumulated Depreciation.
Capital Spending = ($448,000 - $188,000) – ($368,000 - $142,000) + $46,000 =$80,000
And Cash Flow from Assets is:
CF from Assets = OCF - Increase in NWC - Increase in Capital Spending CF from Assets = $109,000 - $3,000 - $80,000 = $26,000
12. Find the cash flow to creditors for 2011 by parts and total, with the parts being interest income paid and increases in borrowing.
ANSWER
First the Interest Paid to Creditors comes from the income statement and is $18,000 for the year. Second, the change in Long-Term Debt reflects an increase or decrease in cash flows to creditors. Here we have a decrease from 2010 to 2011 reflecting a reduction or retirement of debt, a cash flow to creditors:
Decrease in Long-Term Debt 2011 = $190,000 – $162,000 = $28,000 Cash Flow to Creditors for 2011 = $18,000 + $28,000 = $46,000
13. Find the cash flow to owners for 2011 by parts and total, with the parts being dividends paid and increase in borrowing.
ANSWER
Dividends Paid for 2011 were $30,000 and the Common Stock account changed from $130,000 in 2010 to $180,000 in 2011 for an increase of $50,000 so we have the following Cash Flow to Owners: 2011 CF to Owners = $30,000 - $50,000 = -$20,000
14. Verify the cash flow identity: cash flow from assets = cash flow to creditors + cash flow to owners.
ANSWER $26,000 ≡ $46,000 - $20,000

39 Brooks Financial Management: Core Concepts, 2e
©2013 Pearson Education, Inc. Publishing as Prentice Hall
For problems 15 through 17, obtain the balance sheet, income statement, and statement of cash flow for PepsiCo (ticker symbol PEP) for the most recent year from Yahoo! Finance and answer the following questions.
15. Provide the following amounts for PepsiCo:
a. net income b. depreciation (see cash flow statement) c. cash flow from operating activities d. cash flow from investing activities e. cash flow from financing activities f. change in cash and equivalents
ANSWER: All value in (‘000s)
a. Net Income 2010 is $6,320,000 b. Depreciation Expense for 2010 is $2,327,000 c. Cash Flow From Operating Activities is (source) $8,448,000 d. Cash Flow From Investing Activities is (use) $7,668,000 e. Cash Flow From Financing Activities is (source) $1,386,000 f. Change in Cash and Equivalents for 2010 is an increase of $2,000,000
16. For PepsiCo for the most recent year explain the difference between net income and the change in cash and equivalents. In other words, why is the profit or loss of PepsiCo different from the change in their cash and equivalents account?
ANSWER: Pepsi generated $8.448 billion from operating activities and $1.386 billion from financing activities for the year and spent only $7.668 billion investing in new assets. Thus, after adjusting for exchange rate losses of $166 million, it ended up with an increase in cash of $2 billion.
17. Using the cash flow statement find the dividends paid to the PepsiCo owners in the most recent year.
ANSWER: Dividends in 2010 for PepsiCo were $2,978,000,000.
For problems 18 through 20, obtain the balance sheet, income statement, and statement of cash flow for Pfizer (ticker symbol PFE) for the most recent year from Yahoo! Finance and answer the following questions.
18. Provide the following amounts for Pfizer:
a. net income b. depreciation (see cash flow statement)

Chapter 2 Financial Statements 40
©2013 Pearson Education, Inc. Publishing as Prentice Hall
c. cash flow from operating activities d. cash flow from investing activities e. cash flow from financing activities f. change in cash and equivalents
ANSWER:
a. Net Income 2010 is negative $8,257,000 b. Depreciation Expense for 2010 is $8,487,000 c. Cash Flow From Operating Activities is (source) $11,454,000 d. Cash Flow From Investing Activities is (use) $492,000 e. Cash Flow From Financing Activities is (use) $11,174,000 f. Change in Cash and Equivalents for 2010 is a decrease of $243,000
19. Explain the difference between net income and the change in cash and equivalents for Pfizer. In other words, why is the profit or loss of Pfizer different from the change in their cash and equivalents account?
ANSWER: Pfizer generated over $11.454 billion in operating activities for the year. It used 0.492 billion for investing in fixed assets and 11.174 billion dollars for financing activities such as paying dividends, buying back stock, and paying off debt, leaving it with a reduction in cash of $212 million, which after adjusting for a currency translation loss of $31 million, caused the Cash and equivalents balance to fall by $243 million.
20. Using the cash flow statement find the dividends paid to the Pfizer owners in the most recent year.
ANSWER: Dividends in 2010 paid to Pfizer stockholders $6,088,000,000.
41 Brooks Financial Management: Core Concepts, 2e
©2013 Pearson Education, Inc. Publishing as Prentice Hall
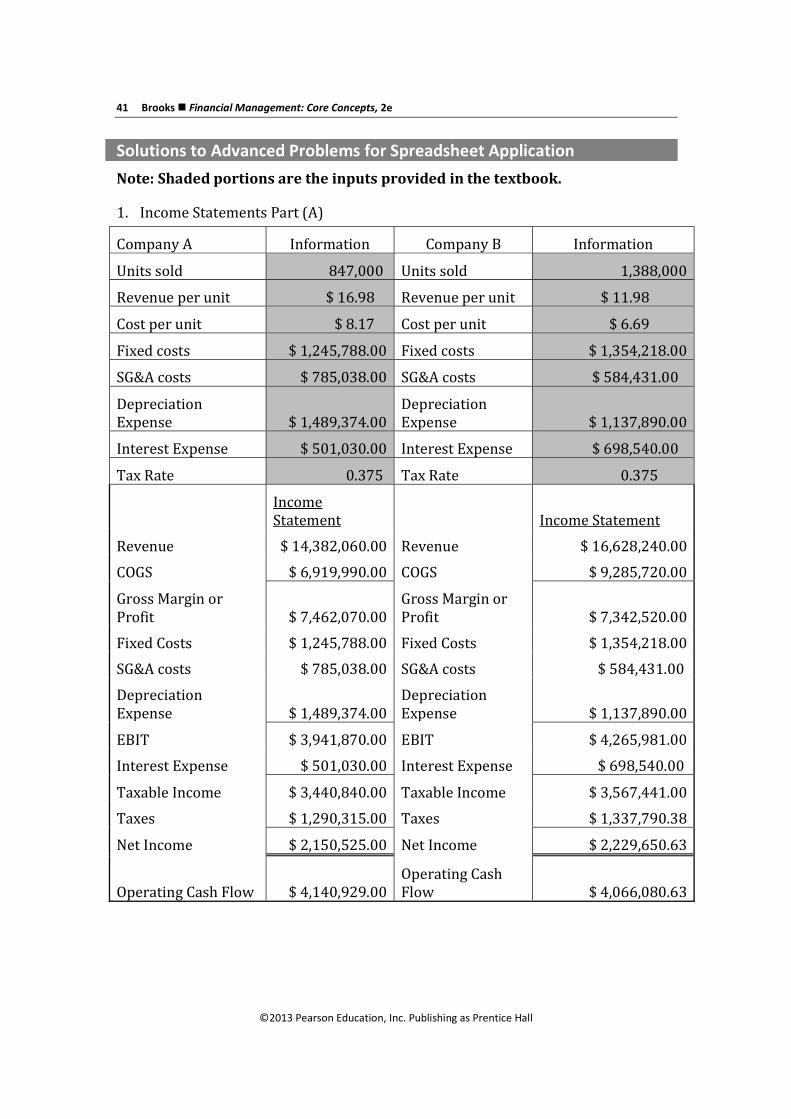
Solutions to Advanced Problems for Spreadsheet Application Note: Shaded portions are the inputs provided in the textbook.
1. Income Statements Part (A)
Company A Information Company B Information
Units sold 847,000 Units sold 1,388,000
Revenue per unit $ 16.98 Revenue per unit $ 11.98
Cost per unit $ 8.17 Cost per unit $ 6.69
Fixed costs $ 1,245,788.00 Fixed costs $ 1,354,218.00
SG&A costs $ 785,038.00 SG&A costs $ 584,431.00
Depreciation Expense $ 1,489,374.00
Depreciation Expense $ 1,137,890.00
Interest Expense $ 501,030.00 Interest Expense $ 698,540.00
Tax Rate 0.375 Tax Rate 0.375
Income Statement Income Statement
Revenue $ 14,382,060.00 Revenue $ 16,628,240.00
COGS $ 6,919,990.00 COGS $ 9,285,720.00
Gross Margin or Profit $ 7,462,070.00
Gross Margin or Profit $ 7,342,520.00
Fixed Costs $ 1,245,788.00 Fixed Costs $ 1,354,218.00
SG&A costs $ 785,038.00 SG&A costs $ 584,431.00
Depreciation Expense $ 1,489,374.00
Depreciation Expense $ 1,137,890.00
EBIT $ 3,941,870.00 EBIT $ 4,265,981.00
Interest Expense $ 501,030.00 Interest Expense $ 698,540.00
Taxable Income $ 3,440,840.00 Taxable Income $ 3,567,441.00
Taxes $ 1,290,315.00 Taxes $ 1,337,790.38
Net Income $ 2,150,525.00 Net Income $ 2,229,650.63
Operating Cash Flow $ 4,140,929.00 Operating Cash Flow $ 4,066,080.63

Chapter 2 Financial Statements 42
©2013 Pearson Education, Inc. Publishing as Prentice Hall
Company B has the higher Net Income but lower Operating Cash Flow.
Part (B)
Company A Information Company B Information
Units sold 847,000 Units sold 1,179,800
Revenue per unit $ 16.98 Revenue per unit $ 14.98
Cost per unit $ 8.17 Cost per unit $ 7.89
Fixed costs $ 1,245,788.00 Fixed costs $ 1,354,218.00
SG&A costs $ 785,038.00 SG&A costs $ 1,168,862.00
Depreciation Expense $ 1,489,374.00
Depreciation Expense $ 1,137,890.00
Interest Expense $ 501,030.00 Interest Expense $ 698,540.00
Tax Rate 0.375 Tax Rate 0.375
Income Statement
Income Statement
Revenue $ 14,382,060.00 Revenue $ 17,667,505.00
COGS $ 6,919,990.00 COGS $ 9,313,577.16
Gross Margin or Profit $ 7,462,070.00
Gross Margin or Profit $ 8,353,927.84
Fixed Costs $ 1,245,788.00 Fixed Costs $ 1,354,218.00
SG&A costs $ 785,038.00 SG&A costs $ 1,168,862.00
Depreciation Expense $ 1,489,374.00
Depreciation Expense $ 1,137,890.00
EBIT $ 3,941,870.00 EBIT $ 4,692,957.84
Interest Expense $ 501,030.00 Interest Expense $ 698,540.00
Taxable Income $ 3,440,840.00 Taxable Income $ 3,994,417.84
Taxes $ 1,290,315.00 Taxes $ 1,497,906.69
Net Income $ 2,150,525.00 Net Income $ 2,496,511.15
Operating Cash Flow $ 4,140,929.00
Operating Cash Flow $ 4,332,941.15

43 Brooks Financial Management: Core Concepts, 2e
©2013 Pearson Education, Inc. Publishing as Prentice Hall
Company B’s Net Income and Operating Cash Flow are both higher than those of Company A.
2. Balance Sheets (Part A)
Reach Manufacturing
2010 2011 Change Verification
Assets:
Current Assets
Cash $ 23,000.00 $ 26,000.00 $ 3,000.00 $ 3,000.00
Marketable Securities $ 62,000.00 $ 58,000.00 $ (4,000.00) $ (4,000.00)
Accounts Receivable $ 518,000.00 $ 796,000.00 $
278,000.00 $
278,000.00
Inventory $ 639,000.00 $ 910,000.00 $
271,000.00 $
271,000.00
Total Current Assets $
1,242,000.00 $
1,790,000.00 $
548,000.00 $
548,000.00
Long-term Assets
Fixed Assets $
4,387,000.00 $
4,975,000.00 $
588,000.00 $
588,000.00
Accumulated Depreciation
$(1,009,000.00)
$(1,364,000.00)
$ (355,000.00
)
$ (355,000.00
)
Intangible Assets $ 465,000.00 $ 431,000.00 $
(34,000.00) $
(34,000.00)
Total Long-Term Assets $
3,843,000.00 $
4,042,000.00 $
199,000.00 $
199,000.00
TOTAL ASSETS $
5,085,000.00 $
5,832,000.00 $
747,000.00 $
747,000.00
Liabilities:
Current Liabilities
Accounts Payable $ 419,000.00 $ 679,000.00 $
260,000.00 $
260,000.00
Notes Payable $ 390,000.00 $ 210,000.00
$ (180,000.00
)
$ (180,000.00
)
Total Current Liabilities $ 809,000.00 $ 889,000.00 $ 80,000.00 $ 80,000.00
Long-Term Liabilities

Chapter 2 Financial Statements 44
©2013 Pearson Education, Inc. Publishing as Prentice Hall
Long-Term Debt $
3,540,000.00 $
3,912,000.00 $
372,000.00 $
372,000.00
TOTAL LIABILITIES $
4,349,000.00 $
4,801,000.00 $
452,000.00 $
452,000.00
Owner’ Equity:
Common Stock $ 330,000.00 $ 330,000.00 $ - $ -
Retained Earnings $ 406,000.00 $ 701,000.00 $
295,000.00 $
295,000.00
TOTAL OWNER’s EQUITY $ 736,000.00 $
1,031,000.00 $
295,000.00 $
295,000.00
TOTAL LIAB. AND O.E. $
5,085,000.00 $
5,832,000.00 $
747,000.00 $
747,000.00
Part (B)
PART B: 2010 2011 Change
Net Working Capital $ 433,000.00 $ 901,000.00 $ 468,000.00
Capital Spending
2011 Fixed Assets $ 4,975,000.00
plus 2011 Intangible Assets $ 431,000.00
minus 2010 Fixed Assets $ 4,387,000.00
minus 2010 Intangible Assets $ 465,000.00
Change In Capital Spending $ 554,000.00
Cash Flow From Assets:
OCF $ 389,000.00
minus increase in NWC $ 468,000.00
minus increase in capital sp. $ 554,000.00
Cash Flow From Assets $ (633,000.00)

45 Brooks Financial Management: Core Concepts, 2e
©2013 Pearson Education, Inc. Publishing as Prentice Hall
Solutions to Mini-Case Questions Hudson Valley Realty
This case focuses on the interpretation rather than the preparation of financial statements. Students should understand how the statements are important for outside stakeholders who need to make decisions concerning a company. The case reinforces the chapter’s emphasis on cash flow rather than accrual-based measures of income. The statements are loosely based on Ethan Allen Co., but have been modified to eliminate complexities that are not important at this level.
1. Look at Vermont Heritage’s sales revenue, EBIT, and net income over the three-year period. Would you classify it as a growing, diminishing, or a stable company?
Sales were up a little in 2010, down a little in 2011. Overall, sales are trendless. EBIT and net income also remain remarkably stable, indicating that the company can adjust expenses as a response to falling sales. The company appears to be stable, but not growing.
2. Look at Vermont Heritage’s expense accounts, cost of goods sold, and selling and administrative expenses. Do they seem to be roughly proportional to sales? Do any of these categories seem to be growing out of control?
Cost of goods sold decreases when sales decrease, which suggests that sales revenue is responding to lower volume. Selling and administrative expenses are increasing relative to sales, and this is a matter for some concern. Perhaps the company is making an extra marketing effort to increase sales.
3. Depreciation expense is the same for all three years. What does that tell you about Vermont Heritage’s growth?
It is highly unusual for depreciation expense to remain the same, at least when the figures are rounded to millions, for three years in a row. It would suggest that the company is not selling off assets, but neither is it investing in new assets. At most, it is replacing assets as needed.
4. Look at Vermont Heritage’s EBIT, interest expense, and debt accounts (current liabilities, long-term debt, and other liabilities) over the three-year period. Comparing debt to equity, do you think the company seems to have excessive debt? Would you expect the company to have any problems meeting its interest payments?
Interest expense is minimal compared to EBIT, which shows that the company is in a strong financial position. Vermont Heritage has been using surplus cash to reduce long-term liabilities over the last few years. The company is now almost entirely equity-financed.
5. Dividends have increased as a percentage of net income. Why do you think the company decided to pay out more of its earnings to shareholders?

Chapter 2 Financial Statements 46
©2013 Pearson Education, Inc. Publishing as Prentice Hall
The company has paid off most of its debt and seems to have limited growth opportunities at the present time, so it is appropriately returning cash to the stockholders.
6. Compare current assets with current liabilities. Would you expect Vermont Heritage to have any problems meeting its short-term obligations?
Current assets are approximately 10 times current liabilities, implying that the company is highly liquid. Excess liquidity may imply inefficiency, but since Peter Cortland is only concerned with safety, it is a good thing from his point of view.
7. Overall, do you think Vermont Heritage will be a relatively safe tenant for Hudson Valley’s building?
Vermont Heritage should be a very safe and stable tenant for Hudson Valley’s building. Although it doesn’t seem to be growing rapidly, it has very low debt, stable profits, excellent liquidity, and low interest obligations.
Additional Problems with Solutions 1. Balance Sheet. Chuck Enterprises has current assets of $300,000, and total
assets of $750,000. It also has current liabilities of $125,000, common equity of $250,000, and retained earnings of $85,000. How much long-term debt and fixed assets does the firm have?
ANSWER (Slides 2-23 to 2-24)
Current Assets + Fixed Assets = Total Assets
$300,000+Fixed Assets = $750,000
Fixed Assets = $750,000 - $300,000 = $400,000
Total Assets = Current Liabilities + Long-term debt + Common equity + Retained Earnings
$750,000 = $125,000 + Long-term debt + $250,000 + 85,000
Long-term debt = $750,000 - $125,000-$250,000 - $85,000 Long-term debt = $290,000
2. Income Statement. The Top Class Company had revenues of $925,000in 2011. Its operating expenses (excluding depreciation) amounted to $325,000, depreciation charges were $125,000, and interest costs totaled $55,000. If the firm pays a marginal tax rate of 34 percent, calculate its net income after taxes.
ANSWER (Slides 2-25 to 2-26) Revenues $925,000 Less operating expenses 325,000 = EBITDA 600,000 Less depreciation 125,000

47 Brooks Financial Management: Core Concepts, 2e
©2013 Pearson Education, Inc. Publishing as Prentice Hall
= EBIT 475,000 Less interest expenses 55,000 = Taxable Income 420,000 Less taxes (34%) 142,800 = Net Income after taxes 277,200
3. Retained Earnings: The West Hanover Clay Co. had, at the beginning of the fiscal year, November 1, 2010, retained earnings of $425,000. During the year ended October 31, 2011, the company generated net income after taxes of $820,000 and paid out 35 percent of its net income as dividends. Construct a statement of retained earnings and compute the year-end balance of retained earnings.
ANSWER (Slides 2-27 to 2-28)
Statement of Retained Earnings for the year ended October 31, 2011 Balance of Retained Earnings, November 1, 2010 ........................................$425,000 Add: Net income after taxes, October 31, 2011 ..............................................$820,000 Less: Dividends paid for the year ended October 31, 2011.......................$287,000 Balance of Retained Earnings, October 31, 2011 ..........................................$958,000
4. Working Capital: D.K. Imports Incorporated reported the following information at its last annual meeting:
Cash and cash equivalents = $1,225,000; Accounts payables = $3,200,000 Inventory = $625,000; Accounts receivables = $3,500,000; Notes payables = $1,200,000; other current assets = $125,000; Calculate the company’s net working capital.
ANSWER (Slides 2-29 to 2-30)
Net Working Capital = Current Assets - Current Liabilities
(Cash & Cash Equivalents + Accts. Rec. + Inventory + other current assets) - (Accounts payables + Notes Payables)
($1,225,000+$3,500,000+$625,000+$125,000) - ($3,200,000+$1,200,000)
$5,475,000 - $4,400,000
Net Working Capital $1,075,000
Chapter 2 Financial Statements 48
©2013 Pearson Education, Inc. Publishing as Prentice Hall
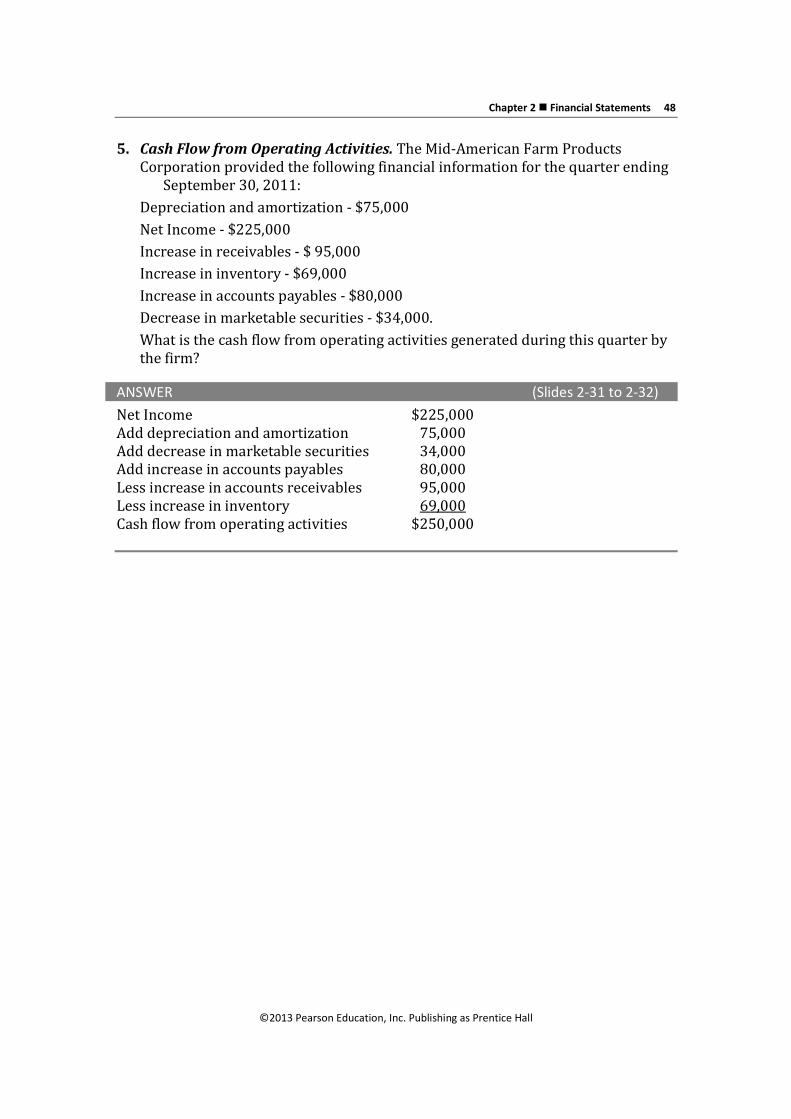
5. Cash Flow from Operating Activities. The Mid-American Farm Products Corporation provided the following financial information for the quarter ending September 30, 2011: Depreciation and amortization - $75,000 Net Income - $225,000 Increase in receivables - $ 95,000 Increase in inventory - $69,000 Increase in accounts payables - $80,000 Decrease in marketable securities - $34,000. What is the cash flow from operating activities generated during this quarter by the firm?
ANSWER (Slides 2-31 to 2-32) Net Income $225,000 Add depreciation and amortization 75,000 Add decrease in marketable securities 34,000 Add increase in accounts payables 80,000 Less increase in accounts receivables 95,000 Less increase in inventory 69,000 Cash flow from operating activities $250,000
Related Documents