Comments on the Province’s Financial Position Report of the Auditor General – 2016 Volume IV Contents Eighth Consecutive Deficit………………………..………………...………………….. 11 Continued Growth in Net Debt…….…………………………………………………… 13 Comments on the Province’s Financial Health………………..……………………….. 20 Comments on Significant Trends Observed in the Province’s Consolidated Financial Statements…………………………….………………………………………………... 38 Chapter 2 Comments on the Province’s Financial Position

Welcome message from author
This document is posted to help you gain knowledge. Please leave a comment to let me know what you think about it! Share it to your friends and learn new things together.
Transcript
Comments on the Province’s Financial Position
Report of the Auditor General – 2016 Volume IV
Contents
Eighth Consecutive Deficit………………………..………………...………………….. 11
Continued Growth in Net Debt…….…………………………………………………… 13
Comments on the Province’s Financial Health………………..……………………….. 20
Comments on Significant Trends Observed in the Province’s Consolidated Financial Statements…………………………….………………………………………………... 38
Chapter 2 Comments on the Province’s
Financial Position

Chapter 2 Comments on the Province’s Financial Position
Report of the Auditor General – 2016 Volume IV 11
Eighth Consecutive Annual Deficit
2.1 The Province’s March 31, 2016 audited consolidated financial statements reported a deficit of $260.5 million and an increase in Net Debt for the fiscal year of $541.4 million. The Province now has a Net Debt of $13.7 billion.
2.2 The $260.5 million annual deficit was lower than the budgeted deficit of $326.8 million and was lower than the prior year deficit of $361.4 million.
Action is Required 2.3 This represents the eighth consecutive annual deficit. To assist in financing these deficits, the Province has incurred additional debt. This trend is very concerning. Significant changes are required to improve the financial health of the Province.
Comments on the Province’s Financial Position

Comments on the Province’s Financial Position Chapter 2
Report of the Auditor General – 2016 Volume IV 12
Exhibit 2.1 - Annual Surpluses (Deficits)
As restated
Exhibit 2.2 - Annual Surpluses (Deficits) Data
Annual Surpluses (Deficits)
($ millions)
2007 2008 2009 2010 2011 2012 2013 2014 2015 2016
As restated
277.3 241.1 (152.0) (695.9) (617.2) (244.8) (533.2) (600.4) (361.4) n/a
As originally recorded
236.8 86.7 (192.3) (737.9) (633.0) (260.6) (507.7) (498.7) (388.6) (260.5)
See paragraphs 2.5 and 2.24 for further information on restatements of prior years.
2.4 Exhibits 2.1 and 2.2 show the surplus or deficit for the past ten years. The preceding years’ amounts have been restated as per Note 17 of the Province’s March 31, 2016 consolidated financial statements.
2.5 It is important to note that the years prior to 2015 have not been restated in the exhibits above or in other exhibits in this chapter for the impact of the nursing homes consolidation in 2016 as the information is not available. Significant variances to data presented in this chapter may have occurred for 2014 and earlier years as a result of this
‐$750
‐$650
‐$550
‐$450
‐$350
‐$250
‐$150
‐$50
$50
$150
$250
$350
2007 2008 2009 2010 2011 2012 2013 2014 2015 2016
($ m
illions)
Fiscal Year
Province of New BrunswickAnnual Surpluses (Deficits)
Chapter 2 Comments on the Province’s Financial Position
Report of the Auditor General – 2016 Volume IV 13
accounting change. Further information on the nursing homes consolidation accounting is contained in Chapter 3.
Continued Growth in Net Debt
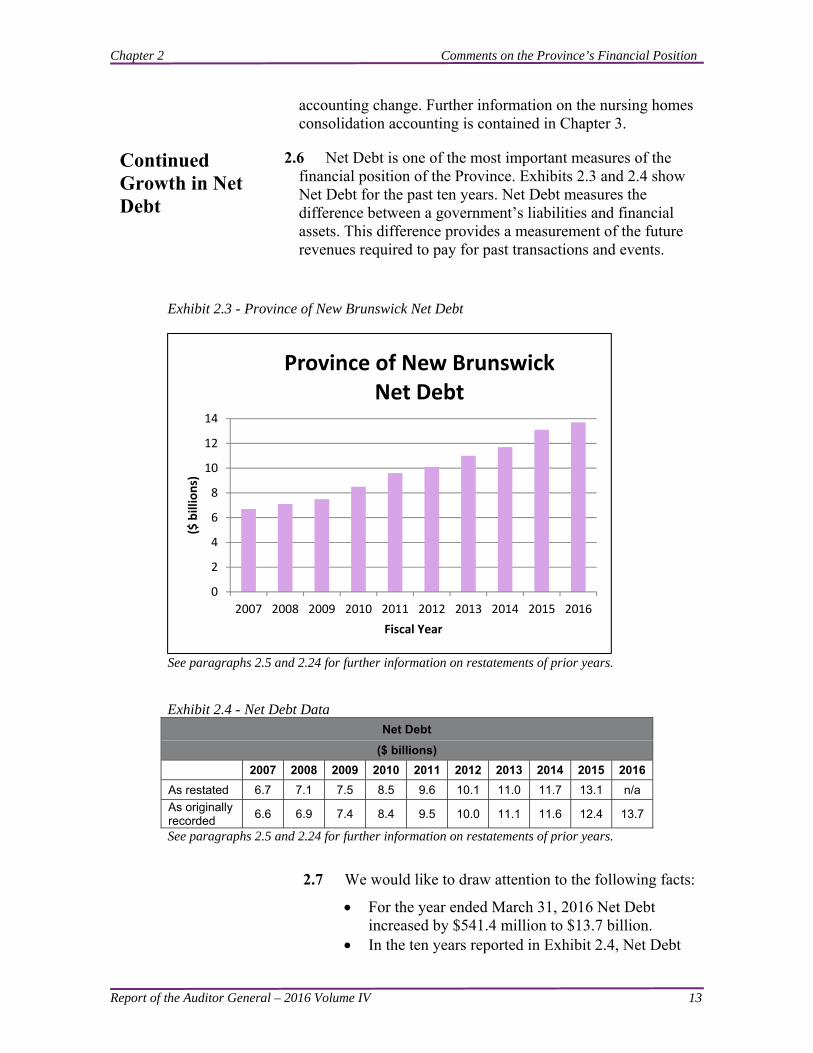
2.6 Net Debt is one of the most important measures of the financial position of the Province. Exhibits 2.3 and 2.4 show Net Debt for the past ten years. Net Debt measures the difference between a government’s liabilities and financial assets. This difference provides a measurement of the future revenues required to pay for past transactions and events.
Exhibit 2.3 - Province of New Brunswick Net Debt
See paragraphs 2.5 and 2.24 for further information on restatements of prior years.
Exhibit 2.4 - Net Debt Data Net Debt
($ billions)
2007 2008 2009 2010 2011 2012 2013 2014 2015 2016
As restated 6.7 7.1 7.5 8.5 9.6 10.1 11.0 11.7 13.1 n/a
As originally recorded
6.6 6.9 7.4 8.4 9.5 10.0 11.1 11.6 12.4 13.7
See paragraphs 2.5 and 2.24 for further information on restatements of prior years.
2.7 We would like to draw attention to the following facts:
For the year ended March 31, 2016 Net Debt increased by $541.4 million to $13.7 billion.
In the ten years reported in Exhibit 2.4, Net Debt
0
2
4
6
8
10
12
14
2007 2008 2009 2010 2011 2012 2013 2014 2015 2016
($ billions)
Fiscal Year
Province of New Brunswick Net Debt
Comments on the Province’s Financial Position Chapter 2
Report of the Auditor General – 2016 Volume IV 14
has increased $7.0 billion. The 2016-2017 Main Estimates budgets for an
increase in Net Debt of $468.5 million for the year ended March 31, 2017.
Based on 2016-2017 Main Estimates, Net Debt of the Province could be in excess of $14 billion for the year ended March 31, 2017.
Net Debt Growth through Budget Deficits
2.8 Exhibit 2.5 shows the annual budgeted deficit for the Province for the last five years. Even though expenditure growth is slowing, deficits have been budgeted in the last five years which have contributed to Net Debt growth.
Exhibit 2.5 - Annual Budgeted Deficit
Annual Budgeted Deficit
($ millions)
2012 2013 2014 2015 2016
Budgeted Deficit (448.8) (182.9) (478.7) (391.1) (326.8)
Budget Improvements Required
2.9 The combination of annual budgeted deficits and overruns in budgeted expenses is contributing to the increase in Net Debt. In order to reduce Net Debt, the budgeted deficit needs improvement (i.e. through either increases to revenues, reductions to expenses, or a combination of both). If no other plan of action is taken, the deficit and Net Debt increases will continue.
Budget Plan Forecasts Future Deficits Until 2020-2021
2.10 The government announced in its 2016-2017 budget a multi-year plan to return to a balanced budget state in 2020-2021. This plan includes annual revenue and expense targets, but lacks a Net Debt reduction target.
2.11 The plan indicates from 2016-17 to 2019-2020 annual deficits will be incurred each year, which will further increase the Province’s accumulated deficit and Net Debt at the end of fiscal 2019-2020 by a total of $830 million. In 2020-2021, a surplus is planned of $21 million. We are very concerned with the government’s fiscal plan that continues New Brunswick’s Net Debt growth by almost $1 billion until 2020-2021.

Chapter 2 Comments on the Province’s Financial Position
Report of the Auditor General – 2016 Volume IV 15
Comparison to Other Provinces
2.12 Another way to assess the significance of the size of the Province’s Net Debt is to compare it to the Net Debt of other provinces in absolute amount, per capita and as a percentage of GDP. Provinces used in our comparison include, Nova Scotia, Manitoba and Saskatchewan. These provinces presented for comparison purposes were selected based on application of judgment where certain similarities in population or economic circumstances were considered. The provinces’ application of accounting principles may differ upon comparing financial information, depending on particular circumstances. Population data for provinces used in our comparison is found in Exhibits 2.6 and 2.7.
2.13 In the next eight exhibits: information from the audited summary
financial statements of the individual provinces is used;
information about population is taken from the Statistics Canada website, and
GDP figures are from the financial statement discussion and analysis attached to the individual provinces’ audited summary financial statements.
Exhibit 2.6 - Provincial Population as of July 1
Source: Statistics Canada (filtered data) http://www5.statcan.gc.ca/cansim/a26?lang=eng&retrLang=eng&id=0510001&&pattern=&stByVal=1&p1=1&p2=-1&tabMode=dataTable&csid=
600
700
800
900
1,000
1,100
1,200
1,300
1,400
2010 2013 2014 2015 2016
Per Th
ousands
Years
Provincial population as of July 1
Nova Scotia
New Brunswick
Manitoba
Saskatchewan

Comments on the Province’s Financial Position Chapter 2
Report of the Auditor General – 2016 Volume IV 16
Exhibit 2.7 - Provincial Population as of July 1 Data
Provincial Population Data as of July 1
Province (thousands)
2010 2013 2014 2015 2016
Nova Scotia 938.2 944.9 943.5 943.3 943.4
New Brunswick 750.0 756.8 755.8 754.9 754.3
Manitoba 1,208.6 1,250.3 1,265.6 1,281.0 1,296.0
Saskatchewan 1,034.8 1,086.0 1,105.0 1,121.3 1,132.3
Exhibit 2.8 - Net Debt Comparison to Other Provinces
See paragraphs 2.5 and 2.24 for further information on restatements of prior years.
012345678910111213141516171819202122
2007 2011 2015 2016
($ billions)
Years
Net Debt Comparison to Other Provinces
New Brunswick
Manitoba
Nova Scotia
Saskatchewan
Chapter 2 Comments on the Province’s Financial Position
Report of the Auditor General – 2016 Volume IV 17
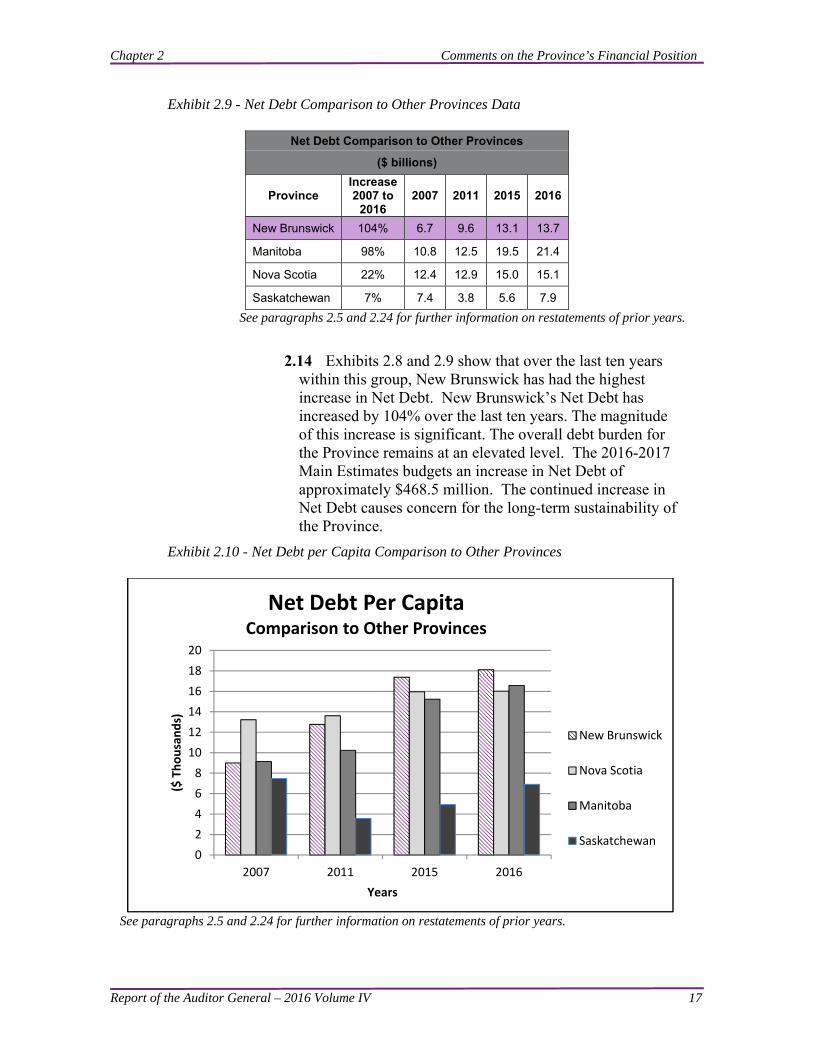
Exhibit 2.9 - Net Debt Comparison to Other Provinces Data
Net Debt Comparison to Other Provinces
($ billions)
Province Increase2007 to
2016 2007 2011 2015 2016
New Brunswick 104% 6.7 9.6 13.1 13.7
Manitoba 98% 10.8 12.5 19.5 21.4
Nova Scotia 22% 12.4 12.9 15.0 15.1
Saskatchewan 7% 7.4 3.8 5.6 7.9
See paragraphs 2.5 and 2.24 for further information on restatements of prior years.
2.14 Exhibits 2.8 and 2.9 show that over the last ten years within this group, New Brunswick has had the highest increase in Net Debt. New Brunswick’s Net Debt has increased by 104% over the last ten years. The magnitude of this increase is significant. The overall debt burden for the Province remains at an elevated level. The 2016-2017 Main Estimates budgets an increase in Net Debt of approximately $468.5 million. The continued increase in Net Debt causes concern for the long-term sustainability of the Province.
Exhibit 2.10 - Net Debt per Capita Comparison to Other Provinces
See paragraphs 2.5 and 2.24 for further information on restatements of prior years.
0
2
4
6
8
10
12
14
16
18
20
2007 2011 2015 2016
($ Thousands)
Years
Net Debt Per CapitaComparison to Other Provinces
New Brunswick
Nova Scotia
Manitoba
Saskatchewan
Comments on the Province’s Financial Position Chapter 2
Report of the Auditor General – 2016 Volume IV 18
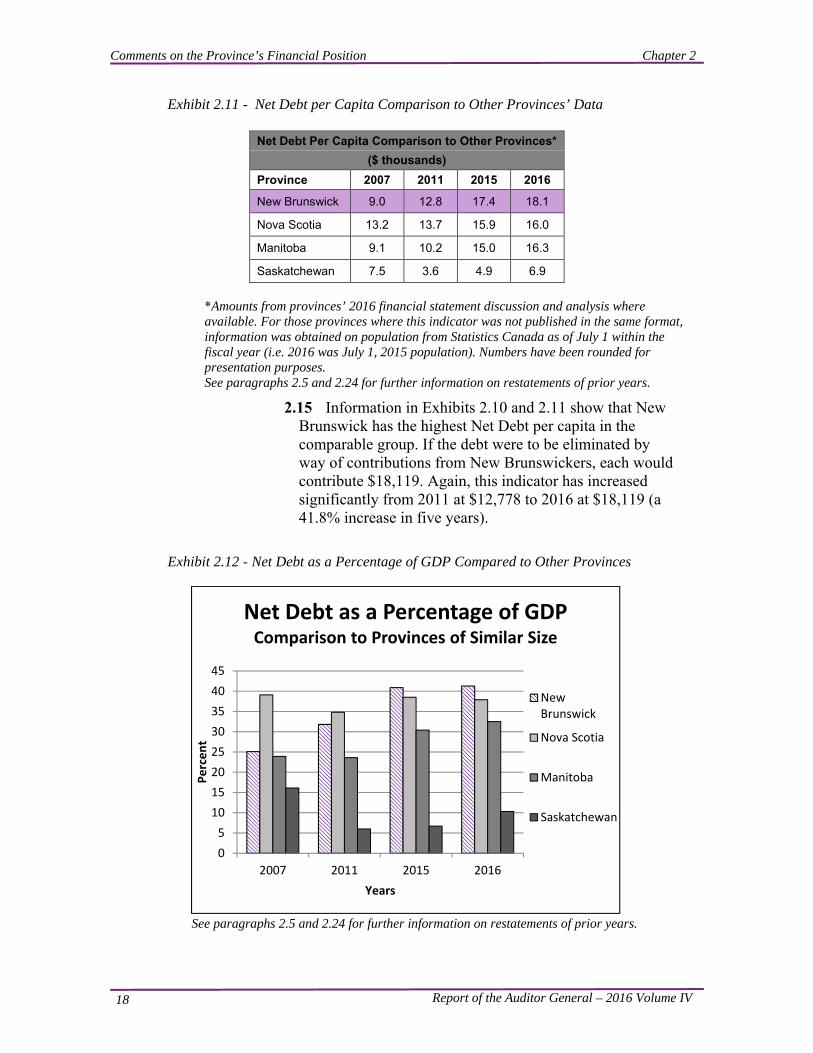
Exhibit 2.11 - Net Debt per Capita Comparison to Other Provinces’ Data
Net Debt Per Capita Comparison to Other Provinces*
($ thousands)
Province 2007 2011 2015 2016
New Brunswick 9.0 12.8 17.4 18.1
Nova Scotia 13.2 13.7 15.9 16.0
Manitoba 9.1 10.2 15.0 16.3
Saskatchewan 7.5 3.6 4.9 6.9
*Amounts from provinces’ 2016 financial statement discussion and analysis where available. For those provinces where this indicator was not published in the same format, information was obtained on population from Statistics Canada as of July 1 within the fiscal year (i.e. 2016 was July 1, 2015 population). Numbers have been rounded for presentation purposes. See paragraphs 2.5 and 2.24 for further information on restatements of prior years.
2.15 Information in Exhibits 2.10 and 2.11 show that New Brunswick has the highest Net Debt per capita in the comparable group. If the debt were to be eliminated by way of contributions from New Brunswickers, each would contribute $18,119. Again, this indicator has increased significantly from 2011 at $12,778 to 2016 at $18,119 (a 41.8% increase in five years).
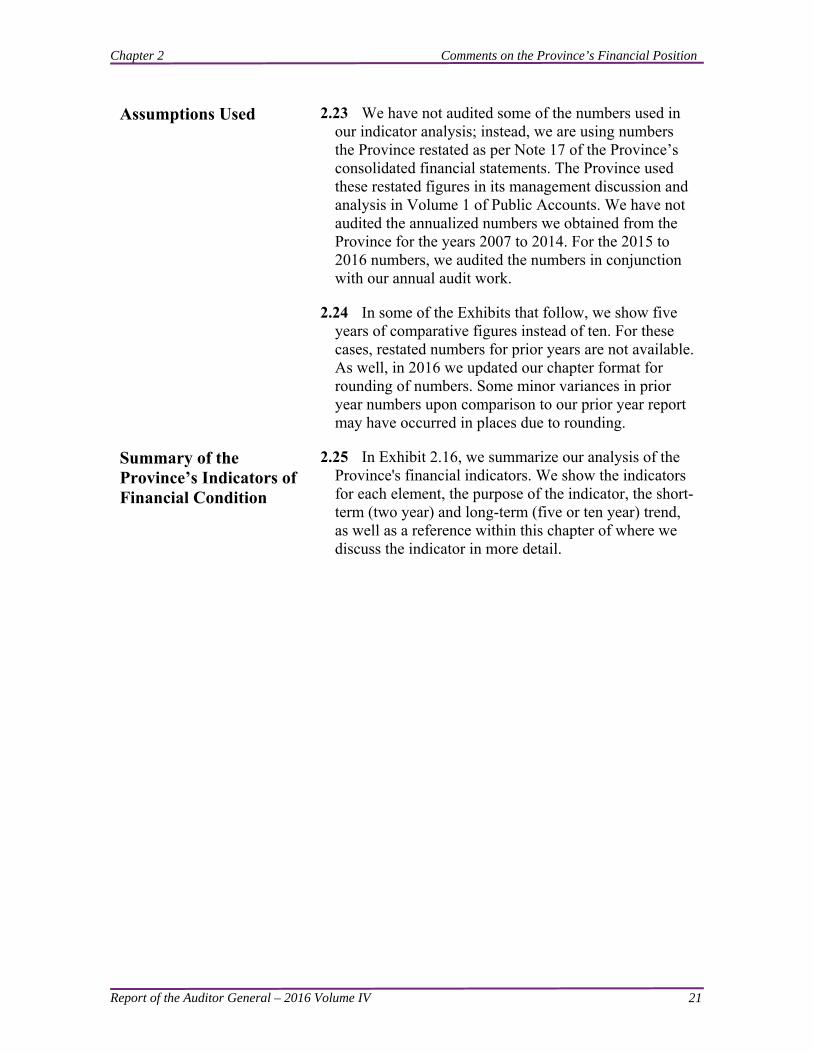
Exhibit 2.12 - Net Debt as a Percentage of GDP Compared to Other Provinces
See paragraphs 2.5 and 2.24 for further information on restatements of prior years.
0
5
10
15
20
25
30
35
40
45
2007 2011 2015 2016
Percent
Years
Net Debt as a Percentage of GDPComparison to Provinces of Similar Size
NewBrunswick
Nova Scotia
Manitoba
Saskatchewan

Chapter 2 Comments on the Province’s Financial Position
Report of the Auditor General – 2016 Volume IV 19
Exhibit 2.13 - Net Debt as a Percentage of GDP Compared to Other Provinces Data
Net Debt as a Percentage of GDP Compared to Other Provinces
(percent)
Province 2007 2011 2015 2016 % Increase (Decrease)
from 2007 to 2016
New Brunswick 25.1 31.8 40.9 41.3 16.2
Nova Scotia 39.1 34.8 38.5 37.9 (1.2)
Manitoba 23.9 23.6 30.4 32.5 8.6
Saskatchewan 16.1 6.0 6.7 10.3 (5.8)
See paragraphs 2.5 and 2.24 for further information on restatements of prior years.
2.16 As shown in Exhibits 2.12 and 2.13, New Brunswick had the highest increase of Net Debt as a percentage of GDP from 2007 to 2016, and the highest Net Debt as a percentage of GDP among comparable provinces for 2016. For the year ended March 31, 2007, New Brunswick’s result for this calculation was 64.2% of Nova Scotia’s; for the year ended March 31, 2016 it was 109.0%.
Net Debt Comparison Summary
2.17 New Brunswick’s Net Debt performance compared to other provinces remains a significant concern. New Brunswick’s increase in Net Debt of $7.0 billion from 2007 indicates the need for continued efforts to address the level of Net Debt.
New Brunswick’s Credit Rating
2.18 This continued increase in Net Debt represents a very disturbing trend. An even higher demand will exist on future revenues to pay past expenses. Such continued negative trends could have a negative impact on the Province’s credit rating (for example, Standard & Poor’s decision to downgrade the Province’s credit rating from AA- to A+ in 2012.) Downgrades in credit ratings result in more expensive borrowing costs and may constrain future borrowing capacity of the Province.
Exhibit 2.14 shows the Province's credit rating as determined by various credit rating agencies for the past 5 years. All three ratings remained unchanged from previous years and show a stable trend. However, even with stable ratings the Province's borrowing capacity may be negatively affected with New Brunswick’s increased debt burden.

Comments on the Province’s Financial Position Chapter 2
Report of the Auditor General – 2016 Volume IV 20
Exhibit 2.14 - New Brunswick’s Credit Ratings
Year Dominion Bond Rating Services (DBRS) Moody’s Investors Services Standard & Poor’s
2016 A (high) Aa2 A+
2015 A (high) Aa2 A+
2014 A (high) Aa2 A+
2013 A (high) Aa2 A+
2012 A (high) Aa2 A+
2.19 Exhibit 2.15 shows the most recent credit ratings for other provinces compared to New Brunswick. While some provinces have a higher credit rating, overall all provinces noted in Exhibit 2.15 are rated in a good credit quality range.
Exhibit 2.15 - Credit Ratings of Other Provinces
Province Dominion Bond Rating Services (DBRS) Moody’s Investors
Services Standard &
Poor’s
New Brunswick A (high) Aa2 A+
Nova Scotia A (high) Aa2 A+
Manitoba A (high) Aa2 AA-
Saskatchewan AA Aaa AA+
Comments on the Province’s Financial Health
2.20 For the past number of years, we included in our annual report a historical trend analysis of the Province’s financial condition by looking at measures of sustainability, flexibility and vulnerability.
2.21 Starting in 2009, the Province began reporting some of these measures as part of Volume 1 of Public Accounts (Indicators of Financial Health section). As we commented in previous years, we are pleased to see the Province report this historical information.
2.22 In this section, we report on twelve indicators of financial condition identified by the Public Sector Accounting Board (PSAB) in a Statement of Recommended Practice (SORP). This analysis is intended to give a broader view of the financial health of the Province as the analysis shows trends. The analysis expands on the information reported in the audited consolidated financial statements which only reflect the Province’s fiscal status at a point in time.
Chapter 2 Comments on the Province’s Financial Position
Report of the Auditor General – 2016 Volume IV 21
Assumptions Used 2.23 We have not audited some of the numbers used in our indicator analysis; instead, we are using numbers the Province restated as per Note 17 of the Province’s consolidated financial statements. The Province used these restated figures in its management discussion and analysis in Volume 1 of Public Accounts. We have not audited the annualized numbers we obtained from the Province for the years 2007 to 2014. For the 2015 to 2016 numbers, we audited the numbers in conjunction with our annual audit work.
2.24 In some of the Exhibits that follow, we show five years of comparative figures instead of ten. For these cases, restated numbers for prior years are not available. As well, in 2016 we updated our chapter format for rounding of numbers. Some minor variances in prior year numbers upon comparison to our prior year report may have occurred in places due to rounding.
Summary of the Province’s Indicators of Financial Condition
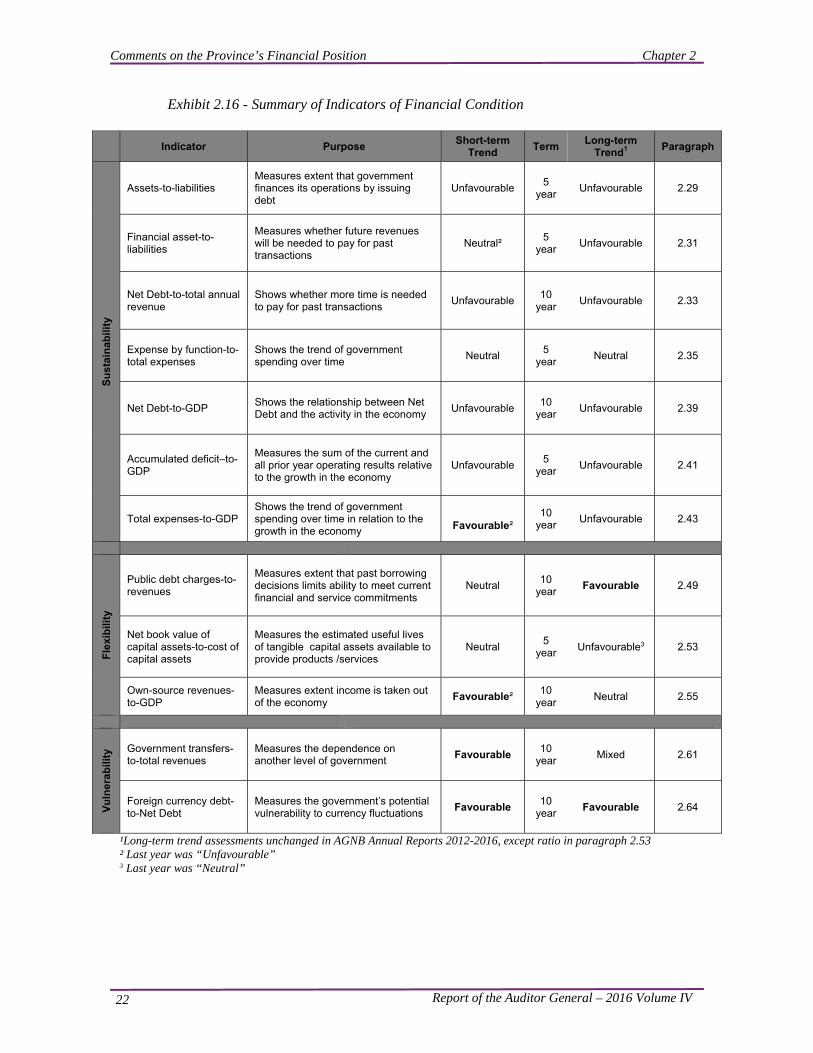
2.25 In Exhibit 2.16, we summarize our analysis of the Province's financial indicators. We show the indicators for each element, the purpose of the indicator, the short-term (two year) and long-term (five or ten year) trend, as well as a reference within this chapter of where we discuss the indicator in more detail.
Comments on the Province’s Financial Position Chapter 2
Report of the Auditor General – 2016 Volume IV 22
Exhibit 2.16 - Summary of Indicators of Financial Condition
Indicator Purpose Short-term
Trend Term
Long-term Trend1
Paragraph
Su
stai
nab
ility
Assets-to-liabilities Measures extent that government finances its operations by issuing debt
Unfavourable 5
year Unfavourable 2.29
Financial asset-to-liabilities
Measures whether future revenues will be needed to pay for past transactions
Neutral² 5
year Unfavourable 2.31
Net Debt-to-total annual revenue
Shows whether more time is needed to pay for past transactions
Unfavourable 10
year Unfavourable 2.33
Expense by function-to-total expenses
Shows the trend of government spending over time
Neutral 5
year Neutral 2.35
Net Debt-to-GDP Shows the relationship between Net Debt and the activity in the economy
Unfavourable 10
year Unfavourable 2.39
Accumulated deficit–to-GDP
Measures the sum of the current and all prior year operating results relative to the growth in the economy
Unfavourable 5
year Unfavourable 2.41
Total expenses-to-GDP Shows the trend of government spending over time in relation to the growth in the economy Favourable²
10 year
Unfavourable 2.43
Fle
xib
ility
Public debt charges-to-revenues
Measures extent that past borrowing decisions limits ability to meet current financial and service commitments
Neutral 10
year Favourable 2.49
Net book value of capital assets-to-cost of capital assets
Measures the estimated useful lives of tangible capital assets available to provide products /services
Neutral 5
year Unfavourable3 2.53
Own-source revenues-to-GDP
Measures extent income is taken out of the economy
Favourable² 10
year Neutral 2.55
Vu
lner
abili
ty Government transfers-
to-total revenues Measures the dependence on another level of government
Favourable 10
year Mixed 2.61
Foreign currency debt-to-Net Debt
Measures the government’s potential vulnerability to currency fluctuations
Favourable 10
year Favourable 2.64
¹Long-term trend assessments unchanged in AGNB Annual Reports 2012-2016, except ratio in paragraph 2.53 ² Last year was “Unfavourable” 3 Last year was “Neutral”
Chapter 2 Comments on the Province’s Financial Position
Report of the Auditor General – 2016 Volume IV 23
Conclusion 2.26 The long-term and short-term trends continue to show a number of unfavourable sustainability indicators. Flexibility and vulnerability indicators show more positive results. Overall, eleven of twelve of the Province's long-term indicators of financial condition have remained unchanged since 2012. The other long-term indicator declined in 2016 from neutral to unfavourable. Nine of twelve of the Province's short-term indicators of financial condition have not changed since the prior year. Three short-term indicators showed improvement in 2016.
2.27 We remain concerned about the sustainability indicator trends. The level of Net Debt, now $13.7 billion, and its increase of over 100% since 2007, is undesirable. This pace of Net Debt growth is not sustainable in the long term, and action is required to address this problem. It may eventually impact the Province's ability to meet its existing financial obligations, both in respect of its service commitments to the public and financial commitments to creditors, employees and others. We again this year, in addition to addressing the annual deficit, encourage the Province to set and achieve targets for long-term Net Debt control and reduction.
Sustainability Indicators
2.28 Sustainability indicates whether the Province can maintain programs and meet existing creditor requirements without increasing the debt burden on the economy.
Assets-to-Liabilities 2.29 The sustainability indicator assets-to-liabilities is presented in Exhibit 2.17.

Comments on the Province’s Financial Position Chapter 2
Report of the Auditor General – 2016 Volume IV 24
Exhibit 2.17 - Comparison of Assets-to-Liabilities
Comparison of Assets-to-Liabilities
Year ended
Total assets
($ billions)
Total liabilities ($ billions)
Total assets/ total
liabilities (percent)
2012 15.0 17.4 86.2%
2013 15.9 18.7 85.0%
2014 16.1 19.4 83.0%
2015 17.0 21.3 79.8%
2016 17.5 22.2 78.8%
See paragraphs 2.5 and 2.24 for further information on restatements of prior years. Note: 2014 numbers present audited financial statement figures with no restatements from subsequent years.
2.30 An assets-to-liability indicator below 100% indicates a government has accumulated deficits and has been financing its operations by issuing debt. For the past five years, the Province’s rate was less than 100%. Recent trends are negative due to continuous decline in this ratio. Overall we have assessed the short-term and long-term trend as unfavourable.
Financial Assets-to-Liabilities
2.31 Another sustainability indicator, financial assets-to-liabilities, is presented in Exhibit 2.18.
65%
70%
75%
80%
85%
90%
2012 2013 2014 2015 2016
Percent
Year
Assets‐to‐Liabilities

Chapter 2 Comments on the Province’s Financial Position
Report of the Auditor General – 2016 Volume IV 25
Exhibit 2.18 - Comparison of Financial Assets-to-Liabilities
Comparison of Financial Assets-to-Liabilities
Year ended
Total financial assets
($ billions)
Total liabilities ($ billions)
Total financial
assets/ total liabilities (percent)
2012 7.3 17.4 42.0%
2013 7.7 18.7 41.2%
2014 7.8 19.4 40.2%
2015 8.2 21.3 38.5%
2016 8.6 22.2 38.7%
See paragraphs 2.5 and 2.24 for further information on restatements of prior years. Note: 2014 numbers present audited financial statement figures with no restatements from subsequent years.
2.32 When liabilities exceed financial assets the government is in a Net Debt position, and the implication is that future surpluses will be required to pay for past transactions and events. The Province’s percentage overall decreased from 2012 to 2016 indicating liabilities are increasing more than assets. We have assessed the short-term trend as neutral and the long-term trend as unfavourable.
Net Debt-to-Total Annual Revenue
2.33 Net Debt-to-total annual revenue is another indicator of sustainability and is presented in Exhibit 2.19.
30%
35%
40%
45%
50%
2012 2013 2014 2015 2016
Percent
Year
Financial Assets‐to‐Liabilities

Comments on the Province’s Financial Position Chapter 2
Report of the Auditor General – 2016 Volume IV 26
Exhibit 2.19 - Comparison of Net Debt-to-Total Annual Revenue
Comparison of Net Debt-to-Total Annual Revenue
Year ended
Net Debt ($ billions)
Total revenue ($ billions)
Net Debt/ total
revenue (percent)
2007 6.7 6.8 98.5%
2008 7.1 7.2 98.6%
2009 7.5 7.2 104.2%
2010 8.5 7.1 119.7%
2011 9.6 7.5 128.0%
2012 10.1 7.8 129.5%
2013 11.0 7.8 141.0%
2014 11.7 7.8 150.0%
2015 13.1 8.4 156.0%
2016 13.7 8.4 163.1%
See paragraphs 2.5 and 2.24 for further information on restatements of prior years.
2.34 Net Debt provides a measure of the future revenue required to pay for past transactions and events. A Net Debt-to-total revenue percentage that is increasing indicates that the Province will need more time to eliminate the Net Debt. The Province’s percentage has been increasing between 2009 and 2016. The increase in 2013 attributed mainly to the annual deficit and the net capital asset transactions of highways, hospitals, schools and other buildings. Overall, we have assessed this trend as unfavourable.
Expense by Function-to-Total Expenses
2.35 Exhibit 2.20 presents expense by function-to-total expenses.
80%
90%
100%
110%
120%
130%
140%
150%
160%
170%
07 08 09 10 11 12 13 14 15 16Percent
Year
Net Debt‐to‐Total Annual Revenue
Chapter 2 Comments on the Province’s Financial Position
Report of the Auditor General – 2016 Volume IV 27
Exhibit 2.20 - Comparison of Expense by Function-to-Total Expenses
Comparison of Expense by Function-to-Total Expenses
2012 2013 2014 2015 2016
($ billions) (%) ($ billions) (%) ($ billions) (%) ($ billions) (%) ($ billions) (%)
Health 2.9 35.8 2.8 33.8 2.9 34.5 2.9 33.0 2.9 33.7
Education and Training
1.7 21.0 1.8 21.7 1.8 21.4 2.1 23.8 1.8 20.9
Social Development
1.0 12.3 1.1 13.3 1.1 13.1 1.2 13.6 1.2 14.0
Service of the Public Debt
0.7 8.6 0.7 8.4 0.7 8.3 0.7 8.0 0.7 8.1
Transportation and Infrastructure
0.5 6.2 0.5 6.0 0.6 7.1 0.6 6.8 0.6 7.0
Central Government
0.5 6.2 0.6 7.2 0.6 7.1 0.5 5.7 0.6 7.0
Protection Services
0.2 2.5 0.2 2.4 0.2 2.4 0.3 3.4 0.3 3.5
Economic Development
0.3 3.7 0.3 3.6 0.2 2.4 0.2 2.3 0.2 2.3
Resources 0.2 2.5 0.2 2.4 0.2 2.4 0.2 2.3 0.2 2.3
Labour and Employment
0.1 1.2 0.1 1.2 0.1 1.2 0.1 1.1 0.1 1.2
Total 8.1 100 8.3 100 8.4 100 8.8 100 8.6 100
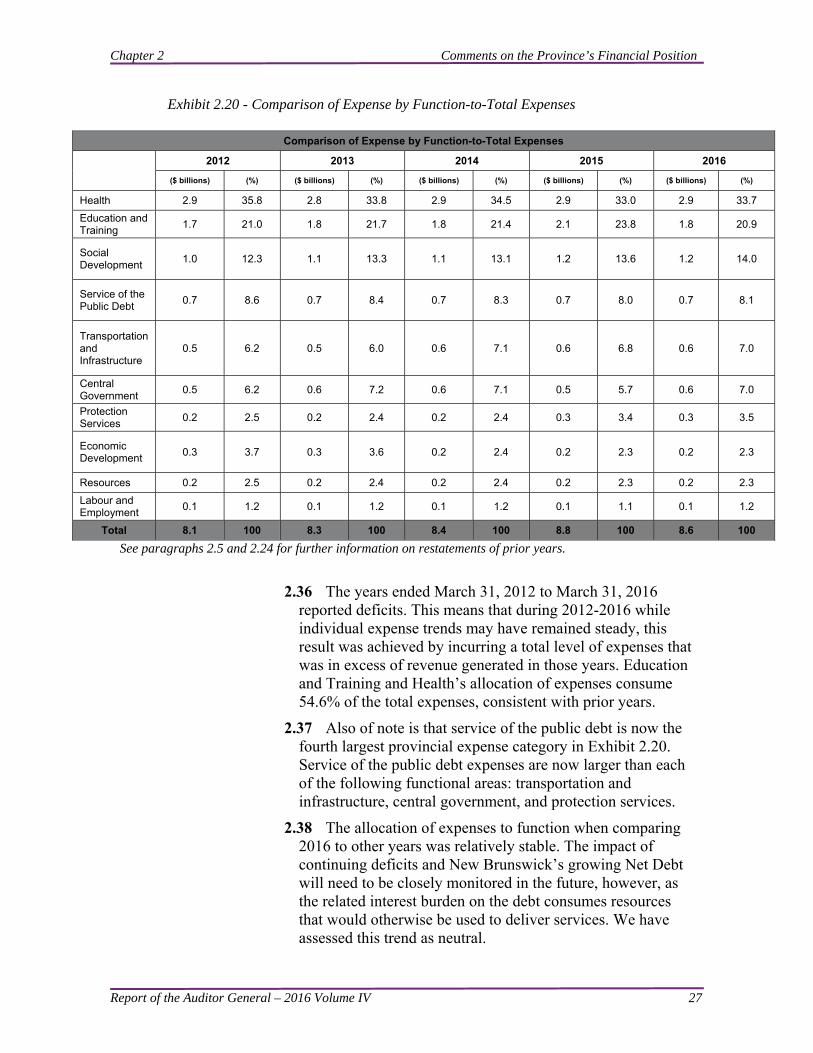
See paragraphs 2.5 and 2.24 for further information on restatements of prior years. 2.36 The years ended March 31, 2012 to March 31, 2016
reported deficits. This means that during 2012-2016 while individual expense trends may have remained steady, this result was achieved by incurring a total level of expenses that was in excess of revenue generated in those years. Education and Training and Health’s allocation of expenses consume 54.6% of the total expenses, consistent with prior years.
2.37 Also of note is that service of the public debt is now the fourth largest provincial expense category in Exhibit 2.20. Service of the public debt expenses are now larger than each of the following functional areas: transportation and infrastructure, central government, and protection services.
2.38 The allocation of expenses to function when comparing 2016 to other years was relatively stable. The impact of continuing deficits and New Brunswick’s growing Net Debt will need to be closely monitored in the future, however, as the related interest burden on the debt consumes resources that would otherwise be used to deliver services. We have assessed this trend as neutral.

Comments on the Province’s Financial Position Chapter 2
Report of the Auditor General – 2016 Volume IV 28
Net Debt-to-GDP 2.39 The sustainability indicator, Net Debt-to-GDP is presented in the Exhibit 2.21.
Exhibit 2.21 - Comparison of Net Debt-to-GDP
Comparison of Net Debt-to-GDP
Year ended
Net Debt ($ billions)
GDP ($ billions)
Net Debt/ GDP
(percent)
2007 6.7 26.7 25.1%
2008 7.1 28.3 25.1%
2009 7.5 28.8 26.0%
2010 8.5 28.9 29.4%
2011 9.6 30.2 31.8%
2012 10.1 31.5 32.1%
2013 11.0 31.7 34.7%
2014 11.7 31.9 36.7%
2015 13.1 32.1 40.8%
2016 13.7 33.1 41.4%
See paragraphs 2.5 and 2.24 for further information on restatements of prior years. 2.40 This indicator compares the Province’s Net Debt, the
difference between its liabilities and its financial assets, to its GDP. The ratio increased from 2009 to 2016 because the rate of growth of Net Debt exceeded the rate of growth in GDP over that time period. In 2016, the ratio reached its highest level in ten years. This means the Net Debt of the Province is increasing faster than the growth in the economy. We have assessed the trend as unfavourable.
Accumulated Deficit-to-GDP
2.41 In the Exhibit 2.22, we present the sustainability indicator accumulated deficit-to-GDP.
0%
10%
20%
30%
40%
50%
07 08 09 10 11 12 13 14 15 16
Percent
Year
Net Debt‐to‐GDP

Chapter 2 Comments on the Province’s Financial Position
Report of the Auditor General – 2016 Volume IV 29
Exhibit 2.22 - Comparison of Accumulated Deficit-to-GDP
Comparison of Accumulated Deficit-to-GDP
Year ended
Accumulated deficit
($ billions)
GDP ($ billions)
Accumulated deficit/GDP
(percent)
2012 2.4 31.5 7.6%
2013 2.8 31.7 8.8%
2014 3.3 31.9 10.3%
2015 4.3 32.1 13.4%
2016 4.7 33.1 14.2%
See paragraphs 2.5 and 2.24 for further information on restatements of prior years. Note: 2014 numbers present audited financial statement figures with no restatements from subsequent years.
2.42 The accumulated deficit is the extent to which annual revenues have been insufficient to cover the annual costs of providing services. The information above shows that from 2012 to 2016, the accumulated deficit has increased faster than the growth of the economy. This represents an unfavourable trend.
Total Expenses-to-GDP
2.43 Exhibit 2.23 presents the total expenses-to-GDP indicator.
0%2%4%6%8%
10%12%14%16%
2012 2013 2014 2015 2016
Percent
Year
Accumulated Deficit‐to‐GDP

Comments on the Province’s Financial Position Chapter 2
Report of the Auditor General – 2016 Volume IV 30
Exhibit 2.23 - Comparison of Total Expenses-to-GDP
Comparison of Total Expenses-to-GDP
Year ended
Total expenses ($ billions)
GDP ($ billions)
Total expenses/GDP
(percent)
2007 6.5 26.7 24.3%
2008 6.9 28.3 24.4%
2009 7.4 28.8 25.7%
2010 7.8 28.9 27.0%
2011 8.2 30.2 27.2%
2012 8.1 31.5 25.7%
2013 8.3 31.7 26.2%
2014 8.4 31.9 26.3%
2015 8.8 32.1 27.4%
2016 8.6 33.1 26.0%
2.44 Exhibit 2.23 indicates in 2007 and 2008, government expenses were held to about 24% of GDP, however, this percentage has increased over time. In 2016, the percentage decreased slightly from 27.4% in 2015 to 26.0%. In the long term this represents an unfavourable trend as expenses are growing faster than the economy is expanding. In 2016 we have assessed the short term as favourable, given the decline in the 2016 ratio.
Exhibit 2.24 - Sustainability Indicator Trends
Sustainability Indicator Trends
Sustainability indicator Short-term trend Long-term trend
Assets-to-liabilities Unfavourable Unfavourable
Financial assets-to-liabilities Neutral Unfavourable
Net Debt-to-total annual revenue Unfavourable Unfavourable
Expense by function-to-total expenses Neutral Neutral
Net Debt-to-GDP Unfavourable Unfavourable
Accumulated deficit-to-GDP Unfavourable Unfavourable
Total expenses-to-GDP Favourable Unfavourable
15%
20%
25%
30%
07 08 09 10 11 12 13 14 15 16
Percent
Year
Total Expenses‐to‐GDP

Chapter 2 Comments on the Province’s Financial Position
Report of the Auditor General – 2016 Volume IV 31
Summary of Sustainability Indicators
2.45 Exhibit 2.24 presents a summary of the Province’s sustainability indicators. We note six of seven sustainability indicators are unfavourable in the long term, and four of seven are unfavourable in the short term, and therefore our overall assessment of these trends remains unfavourable.
2.46 The summary of sustainability indicators is particularly concerning when considering recent important economic events in the Province, all of which are not yet fully reflected in the data presented in this chapter due to timing. Some of these economic events are detailed in the Department of Finance’s Economic Outlook 2016-17. The following economic events are not considered in the sustainability indicators:
a significant mine closing and related losses in tax revenue and employment numbers;
weakening economic forecasts for New Brunswick including declining GDP forecasts;
demographic changes increasing the need for care services and changing the taxpayer base;
tax and fee increases including an HST increase; and an apparent growing reliance on the Federal
government for infrastructure investment and economic growth.
2.47 The Province’s financial sustainability remains a significant concern and these overall negative sustainability trends should be of concern to New Brunswickers.
Flexibility Indicators
2.48 Flexibility is the degree to which the government can change its debt or tax burden on the economy to maintain programs and meet existing creditor requirements.
Public Debt Charges-to-Revenues
2.49 One of the most publicized factors which affect the flexibility of governments is the cost of servicing the public debt. This is considered to be an indicator of flexibility, since the government’s first payment commitment is to service its debt, leaving no flexibility in the timing of these payments.
2.50 The cost of servicing the public debt is comprised mainly of interest on the funded debt of the Province. It also includes foreign exchange paid on interest and maturities during the year, the amortization of foreign exchange gains and losses, and the amortization of discounts and premiums which were incurred on the issuance of provincial debt. It does not include principal repayments on the funded debt of the

Comments on the Province’s Financial Position Chapter 2
Report of the Auditor General – 2016 Volume IV 32
Province.
2.51 In Exhibit 2.25, we present the public debt charges-to-revenues.
Exhibit 2.25 - Comparison of the Public Debt Charges-to-Revenues
Comparison of the Public Debt Charges-to-Revenues
Year ended
Cost of servicing
public debt
($ billions)
Revenue ($ billions)
Cost of servicing
public debt/
revenue (percent)
2007 0.6 6.8 8.8%
2008 0.6 7.2 8.3%
2009 0.6 7.2 8.3%
2010 0.6 7.1 8.5%
2011 0.6 7.5 8.0%
2012 0.7 7.8 9.0%
2013 0.7 7.8 9.0%
2014 0.7 7.8 9.0%
2015 0.7 8.4 8.3%
2016 0.7 8.4 8.3%
See paragraphs 2.5 and 2.24 for further information on restatements of prior years.
2.52 Exhibit 2.25 shows that the cost of servicing the public debt as a percentage of the Province’s total revenues has remained relatively consistent between 8.0% and 9.0% for the past ten years. We are assessing the short-term trend as neutral. We are assessing the long-term trend as favourable as the 2015 and 2016 ratios are less than the ratio in 2007. A decreasing ratio indicates a favourable trend, as less revenue is needed to service the public debt. Although we are assessing this indicator as favourable, caution is needed when looking at this indicator. The cost of servicing the Province’s debt is increasing in a time when interest rates have declined and the Province’s debt is increasing significantly.
Net Book Value of Capital Assets-to-Cost of Capital Assets
2.53 We present the net book value of capital assets-to-cost of capital assets in the Exhibit 2.26.
0%
2%
4%
6%
8%
10%
12%
07 08 09 10 11 12 13 14 15 16
Percent
Year
Public Debt Charges‐to‐Revenues

Chapter 2 Comments on the Province’s Financial Position
Report of the Auditor General – 2016 Volume IV 33
Exhibit 2.26 - Comparison of Net Book Value of Capital Assets-to-Cost of Capital Assets
Comparison of Net Book Value of Capital Assets-to-Cost of Capital Assets
Year ended
Net book value
($ billions)
Capital cost ($ billions)
Net book value/ capital cost (percent)
2012 7.5 12.2 61.5%
2013 8.0 13.1 61.1%
2014 8.0 13.5 59.3%
2015 8.6 14.5 59.3%
2016 8.7 15.0 58.0%
See paragraphs 2.5 and 2.24 for further information on restatements of prior years. Note: 2014 numbers present audited financial statement figures with no restatements from subsequent years. 2.54 This data indicates that the Province’s inventory of
capital assets as at March 31, 2016 has 58.0% of its average useful life remaining. This roughly means that on average any provincial assets that were originally expected to be useable for ten years still had just under six years of remaining useful life at March 31, 2016, and assets with original useful lives of twenty years were still considered useable for just under twelve years on average. As the ratios have declined over the past five years, we are assessing the short-term trend as neutral and the long-term trend as unfavourable.
Own Source Revenues-to-GDP
2.55 We present own source revenues-to-GDP in Exhibit 2.27.
50%
55%
60%
65%
2012 2013 2014 2015 2016
Percent
Year
Net Book Value‐to‐Cost of Capital Assets

Comments on the Province’s Financial Position Chapter 2
Report of the Auditor General – 2016 Volume IV 34
Exhibit 2.27 - Comparison of Own Source Revenues-to-GDP
Comparison of Own Source Revenues-to-GDP
Year ended
Own source revenues ($ billions)
GDP ($ billions)
Own source
revenues/ GDP
(percent)
2007 4.2 26.7 15.7%
2008 4.5 28.3 15.9%
2009 4.5 28.8 15.6%
2010 4.2 28.9 14.5%
2011 4.6 30.2 15.2%
2012 4.9 31.5 15.6%
2013 4.8 31.7 15.1%
2014 4.9 31.9 15.4%
2015 5.4 32.1 16.8%
2016 5.4 33.1 16.3%
See paragraphs 2.5 and 2.24 for further information on restatements of prior years. 2.56 The own source revenues-to-GDP indicator measures the
extent to which the Province is raising its revenue through extracting it from the provincial economy. If the ratio increases, more of the Province’s revenue is generated from the provincial economy. For example, an increase in this ratio could result if the Province increased taxes. If the ratio decreases, less of the Province’s revenue is generated from the provincial economy. A decreasing ratio increases the Province’s ability to raise taxes, thus, making the Province more flexible in how it can generate revenue. Generally, this ratio has stayed the same over the long term and we have assessed this indicator as neutral. In the short term, this ratio is decreasing and we have assessed this trend as favourable.
2.57 There was a decrease in the year 2010 mostly as a result of a large loss by the then New Brunswick Electric Finance Corporation (EFC) (now amalgamated with New Brunswick Power Corporation). In that year, the reduction in own source revenue was not as a result of lower fees or taxes.
2.58 A note of caution should be taken when looking at this indicator for the last eight years. The Province incurred deficits which means expenses were higher than the revenue
10%
12%
14%
16%
18%
20%
07 08 09 10 11 12 13 14 15 16
Percent
Year
Own Source Revenues‐to‐GDP

Chapter 2 Comments on the Province’s Financial Position
Report of the Auditor General – 2016 Volume IV 35
generated.
Exhibit 2.28 - Flexibility Indicator Trends
Flexibility Indicator Trends
Flexibility indicator Short-term trend Long-term trend
Public debt charges-to-revenues Neutral Favourable Net book value of capital assets-to-cost of capital assets
Neutral Unfavourable
Own source revenues-to-GDP Favourable Neutral
Summary of Flexibility Indicators
2.59 As summarized in Exhibit 2.28, our overall assessment on flexibility in the short term and long term is mixed. However, caution should be used in interpreting these results. This result occurred in a period where the Province incurred its eighth consecutive deficit and the cost of servicing the Province’s debt was increasing (i.e. in a period when interest rates are generally decreasing and the Province’s debt load is increasing).
Vulnerability Indicators
2.60 Vulnerability is the degree to which a government is dependent on sources of funding outside its control or influence.
Government Transfers-to-Total Revenues
2.61 By comparing the proportion of total revenue that comes from the Federal government to the total revenue of the Province, we get a measure of the degree to which the Province is dependent on the Federal government. If that dependence increases, the Province is more vulnerable to funding decisions made by the Federal government.
2.62 Exhibit 2.29 presents the comparison of government transfers-to-total revenues.

Comments on the Province’s Financial Position Chapter 2
Report of the Auditor General – 2016 Volume IV 36
Exhibit 2.29 - Comparison of Government Transfers-to-Total Revenues
Comparison of Government Transfers-to-Total Revenues
Year ended
Federal government
transfer revenue
($ billions)
Total revenue
($ billions)
Federal government
transfer revenue/
total revenue (percent)
2007 2.5 6.8 36.8%
2008 2.7 7.2 37.5%
2009 2.8 7.2 38.9%
2010 2.9 7.1 40.8%
2011 2.9 7.5 38.7%
2012 2.9 7.8 37.2%
2013 3.0 7.8 38.5%
2014 2.9 7.8 37.2%
2015 3.0 8.4 35.7%
2016 3.0 8.4 35.7%
See paragraphs 2.5 and 2.24 for further information on restatements of prior years. 2.63 Exhibit 2.29 shows the Province’s reliance on federal
government transfers has been decreasing from 2010. Revenues increased in 2013 in part due to a one-time capital revenue received related to the Route One Gateway Project. The reliance on federal transfers decreased in 2016 and has remained relatively consistent with prior years. Thus we are assessing the short-term trend as favourable and the long-term trend as mixed.
Foreign Currency Debt-to-Net Debt
2.64 The foreign currency debt-to-net debt indicator measures the Province’s potential vulnerability to currency fluctuations and is presented in Exhibit 2.30.
20%
25%
30%
35%
40%
45%
07 08 09 10 11 12 13 14 15 16
Percent
Year
Government Transfers‐to‐Total Revenues
Chapter 2 Comments on the Province’s Financial Position
Report of the Auditor General – 2016 Volume IV 37
Exhibit 2.30 - Comparison of Foreign Currency Debt-to-Net Debt
Comparison of Foreign Currency Debt-to-Net Debt
Year ended
Foreign currency
debt ($ billions)
Net Debt ($ billions)
Foreign currency debt/ Net
Debt (percent)
Foreign currency debt/ Net
Debt after
hedge (percent)
2007 0.4 6.7 6.0% 3.9%
2008 0.9 7.1 12.7% 0.7%
2009 1.3 7.5 17.3% 0.8%
2010 1.3 8.5 15.3% 0.7%
2011 1.2 9.6 12.5% 0.6%
2012 2.0 10.1 19.8% 0.0%
2013 1.9 11.0 17.3% 0.0%
2014 1.7 11.7 14.5% 0.0%
2015 1.7 13.1 13.0% 0.0%
2016 1.2 13.7 8.8% 0.0%
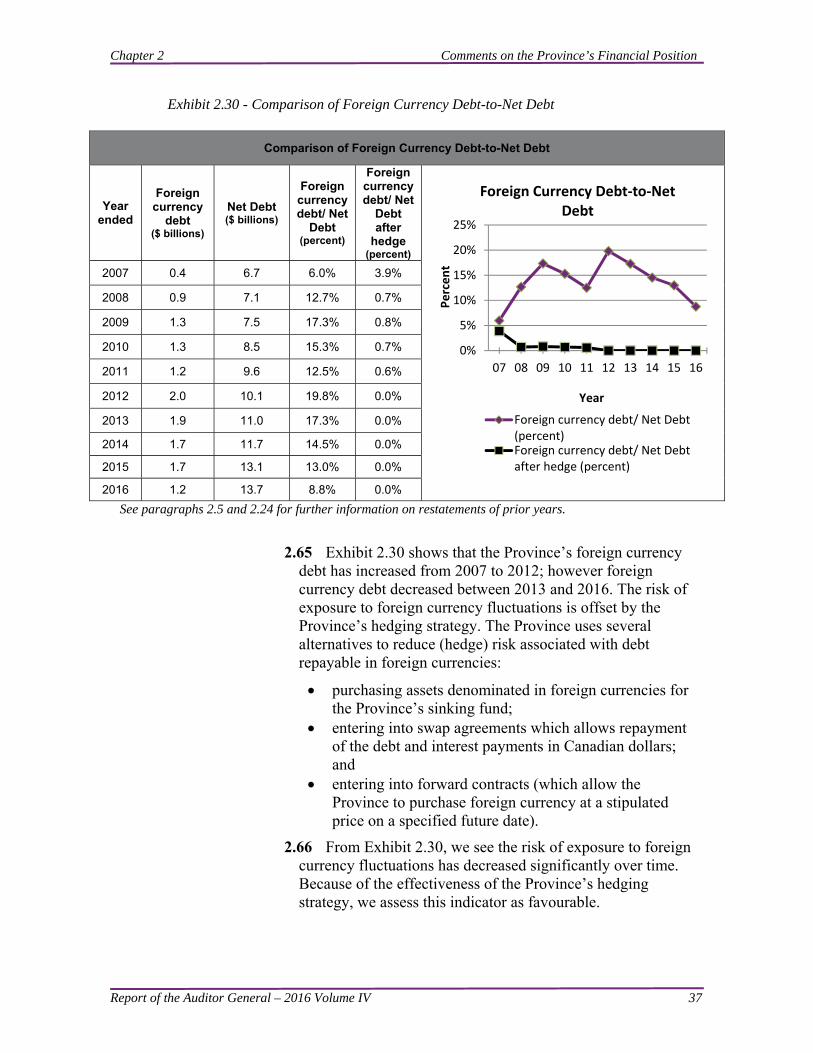
See paragraphs 2.5 and 2.24 for further information on restatements of prior years. 2.65 Exhibit 2.30 shows that the Province’s foreign currency
debt has increased from 2007 to 2012; however foreign currency debt decreased between 2013 and 2016. The risk of exposure to foreign currency fluctuations is offset by the Province’s hedging strategy. The Province uses several alternatives to reduce (hedge) risk associated with debt repayable in foreign currencies:
purchasing assets denominated in foreign currencies for the Province’s sinking fund;
entering into swap agreements which allows repayment of the debt and interest payments in Canadian dollars; and
entering into forward contracts (which allow the Province to purchase foreign currency at a stipulated price on a specified future date).
2.66 From Exhibit 2.30, we see the risk of exposure to foreign currency fluctuations has decreased significantly over time. Because of the effectiveness of the Province’s hedging strategy, we assess this indicator as favourable.
0%
5%
10%
15%
20%
25%
07 08 09 10 11 12 13 14 15 16
Percent
Year
Foreign Currency Debt‐to‐Net Debt
Foreign currency debt/ Net Debt(percent)Foreign currency debt/ Net Debtafter hedge (percent)

Comments on the Province’s Financial Position Chapter 2
Report of the Auditor General – 2016 Volume IV 38
Exhibit 2.31 - Vulnerability Indicator Trends
Vulnerability Indicator Trends
Vulnerability indicator Short-term trend Long-term trend
Government transfers-to-total revenues Favourable Mixed
Foreign currency debt-to-net debt Favourable Favourable
Summary of Vulnerability Indicators
2.67 As summarized in Exhibit 2.31, the Province’s vulnerability exposure is generally favourable. In years when New Brunswick Electric Finance Corporation (now amalgamated with NB Power) generated income through its investment in NB Power, the Province’s reliance on federal revenue lessened and this indicator improves. As well, there is reliance on the Federal government in certain years to assist in funding major infrastructure projects. Also of note is that the Province is effectively managing and controlling its exposure to fluctuations in foreign currency.
Comments on Significant Trends Observed in the Province’s Consolidated Financial Statements
2.68 In this section, we discuss significant trends we have observed in the Province’s consolidated financial statements. We have highlighted these trends to raise public awareness and to provide legislators with an independent assessment of the areas we believe should be a focus for the government.
2.69 For the year ended March 31, 2016, the Province reported a deficit of $260.5 million. This is a decrease of $100.9 million from the $361.4 million deficit reported for the year ended March 31, 2015 (restated).
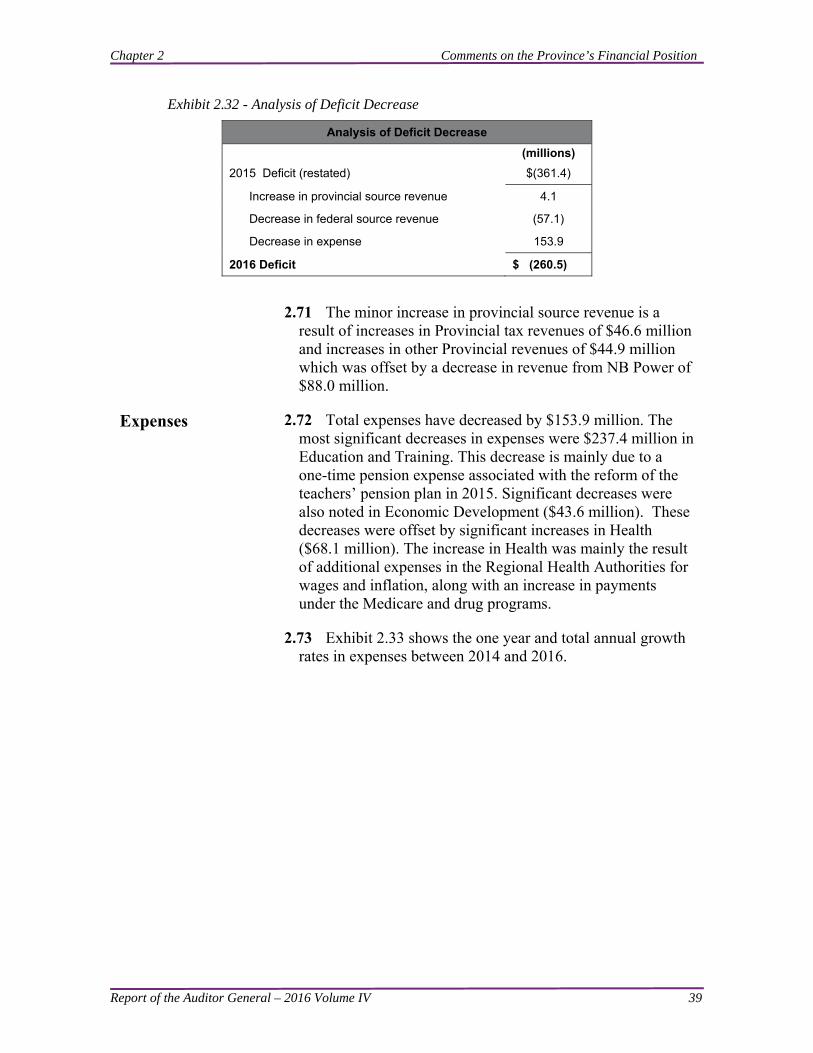
Deficit 2.70 Exhibit 2.32 shows, at a high level, the reasons for the change in the deficit from March 31, 2015 to March 31, 2016.
Chapter 2 Comments on the Province’s Financial Position
Report of the Auditor General – 2016 Volume IV 39
Exhibit 2.32 - Analysis of Deficit Decrease
Analysis of Deficit Decrease
(millions)
2015 Deficit (restated) $(361.4)
Increase in provincial source revenue 4.1
Decrease in federal source revenue (57.1)
Decrease in expense 153.9
2016 Deficit $ (260.5)
2.71 The minor increase in provincial source revenue is a result of increases in Provincial tax revenues of $46.6 million and increases in other Provincial revenues of $44.9 million which was offset by a decrease in revenue from NB Power of $88.0 million.
Expenses 2.72 Total expenses have decreased by $153.9 million. The most significant decreases in expenses were $237.4 million in Education and Training. This decrease is mainly due to a one-time pension expense associated with the reform of the teachers’ pension plan in 2015. Significant decreases were also noted in Economic Development ($43.6 million). These decreases were offset by significant increases in Health ($68.1 million). The increase in Health was mainly the result of additional expenses in the Regional Health Authorities for wages and inflation, along with an increase in payments under the Medicare and drug programs.
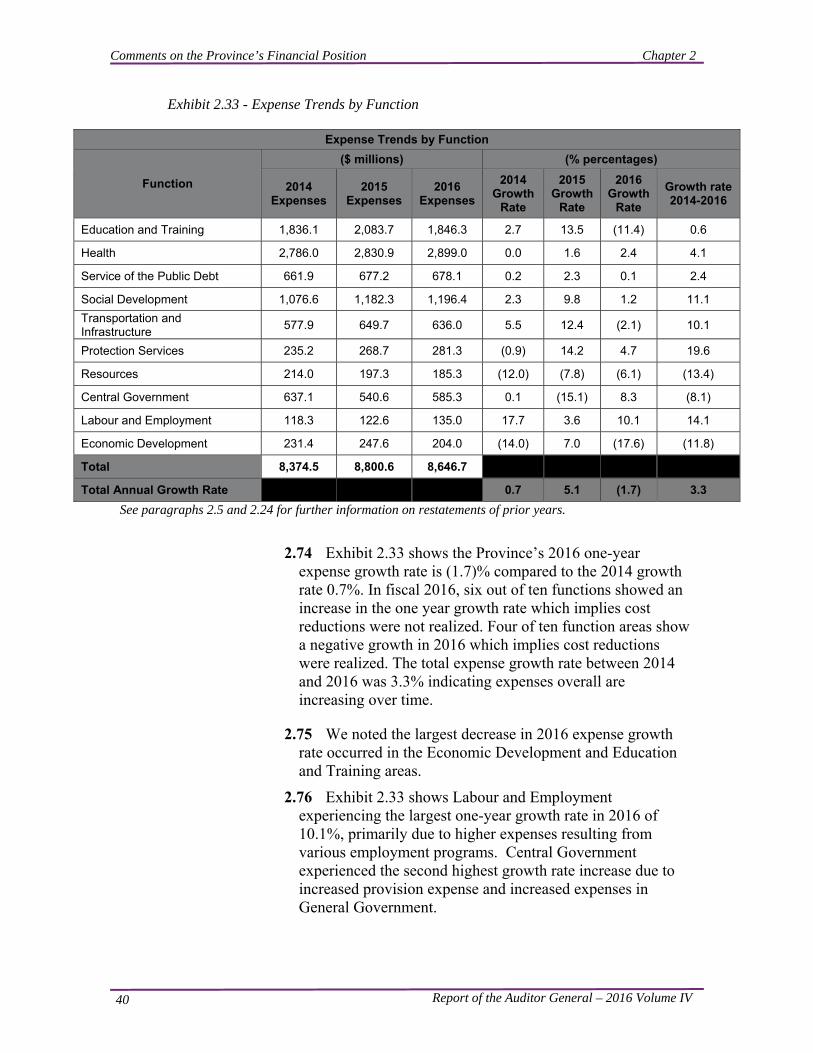
2.73 Exhibit 2.33 shows the one year and total annual growth rates in expenses between 2014 and 2016.
Comments on the Province’s Financial Position Chapter 2
Report of the Auditor General – 2016 Volume IV 40
Exhibit 2.33 - Expense Trends by Function
Expense Trends by Function
Function
($ millions) (% percentages)
2014 Expenses
2015 Expenses
2016 Expenses
2014 Growth
Rate
2015 Growth
Rate
2016 Growth
Rate
Growth rate 2014-2016
Education and Training 1,836.1 2,083.7 1,846.3 2.7 13.5 (11.4) 0.6
Health 2,786.0 2,830.9 2,899.0 0.0 1.6 2.4 4.1
Service of the Public Debt 661.9 677.2 678.1 0.2 2.3 0.1 2.4
Social Development 1,076.6 1,182.3 1,196.4 2.3 9.8 1.2 11.1
Transportation and Infrastructure
577.9 649.7 636.0 5.5 12.4 (2.1) 10.1
Protection Services 235.2 268.7 281.3 (0.9) 14.2 4.7 19.6
Resources 214.0 197.3 185.3 (12.0) (7.8) (6.1) (13.4)
Central Government 637.1 540.6 585.3 0.1 (15.1) 8.3 (8.1)
Labour and Employment 118.3 122.6 135.0 17.7 3.6 10.1 14.1
Economic Development 231.4 247.6 204.0 (14.0) 7.0 (17.6) (11.8)
Total 8,374.5 8,800.6 8,646.7
Total Annual Growth Rate 0.7 5.1 (1.7) 3.3
See paragraphs 2.5 and 2.24 for further information on restatements of prior years.
2.74 Exhibit 2.33 shows the Province’s 2016 one-year expense growth rate is (1.7)% compared to the 2014 growth rate 0.7%. In fiscal 2016, six out of ten functions showed an increase in the one year growth rate which implies cost reductions were not realized. Four of ten function areas show a negative growth in 2016 which implies cost reductions were realized. The total expense growth rate between 2014 and 2016 was 3.3% indicating expenses overall are increasing over time.
2.75 We noted the largest decrease in 2016 expense growth rate occurred in the Economic Development and Education and Training areas.
2.76 Exhibit 2.33 shows Labour and Employment experiencing the largest one-year growth rate in 2016 of 10.1%, primarily due to higher expenses resulting from various employment programs. Central Government experienced the second highest growth rate increase due to increased provision expense and increased expenses in General Government.

Chapter 2 Comments on the Province’s Financial Position
Report of the Auditor General – 2016 Volume IV 41
Revenue 2.77 Exhibit 2.34 shows the one year growth rate and the total annual growth rate of revenue between 2014-2016.
2.78 Total revenues have decreased from 2015 by $53 million. This is attributable to decreased revenue from federal sources of $57.1 million and increases in revenue from provincial sources of $4.1 million.
Exhibit 2.34 - Revenue Trends by Source
Revenue Trends by Source
Source
($ millions) (% percentages)
2014 Revenue Amount
2015 Revenue Amount
2016 Revenue Amount
2014 Growth
Rate
2015 Growth
Rate
2016 Growth
Rate
Growth rate 2014-
2016
Provincial Sources
Taxes 3,595.3 3,983.1 4,029.7 1.5 10.8 1.2 12.1
Licenses and Permits
148.7 149.4 153.8 2.8 0.5 2.9 3.4
Royalties 90.9 97.5 89.3 5.6 7.3 (8.4) (1.8)
Other Provincial Revenue
856.8 1,003.5 966.6 8.3 16.6 (3.7) 12.8
Sinking Fund Earnings
204.5 195.9 194.1 (7.3) (4.2) (0.9) (5.1)
Federal Sources Fiscal Equalization Payments
1,562.0 1,666.0 1,668.0 (2.2) 6.7 0.1 6.8
Unconditional Grants
948.9 955.8 994.7 6.1 0.7 4.1 4.8
Conditional Grants
367.0 388.0 290.0 (27.8) 5.7 (25.3) (21.0)
Total 7,774.1 8,439.2 8,386.2
Total Annual Growth Rate
(0.1) 8.6 (0.6) 7.9
As restated
2.79 Exhibit 2.34 shows the Province’s 2016 revenue growth rate was (0.6)% which implies revenue is contracting in 2016 compared to 2015. However, from 2014-2016 the Province had a revenue growth rate of 7.9%, which implies overall growth during this time period.

Comments on the Province’s Financial Position Chapter 2
Report of the Auditor General – 2016 Volume IV 42
Other Provinces – Revenue and Expense Comparison
2.80 Exhibit 2.35 presents a revenue and expense comparison to certain other provinces.
Exhibit 2.35 - Revenue and Expense (Comparison to other provinces)
Revenue and Expense (Comparison to other provinces)($ millions)
Gross Revenues Gross Expenses
2014 2015 2016 Growth
Rate 2014-2016
2014 2015 2016 Growth
Rate 2014-2016
New Brunswick 7,774.1 8,439.2 8,386.2 7.9% 8,374.5 8,800.6 8,646.7 3.3%
Nova Scotia 10,060.2 10,661.9 10,937.6 8.7% 10,737.1 10,805.6 10,948.2 2.0%
Saskatchewan 14,418.0 14,058.7 13,633.7 (5.4)% 13,829.0 13,996.8 15,153.2 9.6%
Manitoba 14,414.0 14,963.0 15,054.0 4.4% 14,936.0 15,393.0 15,900.0 6.5%
2.81 Exhibit 2.35 shows New Brunswick’s 2014-2016 revenue growth rate was 7.9%, the second highest growth rate for this group. Exhibit 2.35 also shows New Brunswick’s 2014-2016 expense growth rate was 3.3%, the second lowest growth rate in gross expenses during this time period.
Exhibit 2.36 – Comparison to Other Provinces – Deficit
Deficit (Comparison to other provinces)
($ millions)
Annual Surplus (Deficit)
2014 2015 2016
Growth rate between 2014 and
2016
New Brunswick (600.4) (361.4) (260.5) (56.6)%
Nova Scotia (676.9) (143.7) (10.7) (98.4)%
Saskatchewan 589.0 61.9 (1,519.5) 358.0%
Manitoba (522.0) (430.0) (846.0) 62.1%
2.82 As shown in Exhibit 2.36 in comparison to other provinces, New Brunswick has the second largest deficit in 2014 and 2015, and the third largest deficit in 2016. While much has been done to address government expense growth, action is needed still to address New Brunswick's deficit and continued Net Debt growth. Overall, New Brunswick’s revenues continue to fall short of its expenses for the eighth consecutive year.
Related Documents


