Introduction to Management Accounting Chapter 19

Welcome message from author
This document is posted to help you gain knowledge. Please leave a comment to let me know what you think about it! Share it to your friends and learn new things together.
Transcript

Introduction toManagement Accounting
Chapter 19

Planning Acting
Feedback
Controlling
The Functions of Management

Objective 1
Distinguish between financial accounting and management accounting.

Primary Users
Financial
Investors
Creditors
Government authorities (IRS, SEC, etc.)
Management
Internal managers of the business

Purpose of Information
Financial
• Help investors, creditors, and others make investment, credit, and other decisions
Management
• Help managers plan and control business operations

Focus and Time Dimension
Financial
• Reliability, objectivity, and focus on the past
Management
• Relevance

Type of Report
Financial
• Financial statements restricted by GAAP
Management
• Internal reports not restricted by GAAP; determined by cost-benefit analysis
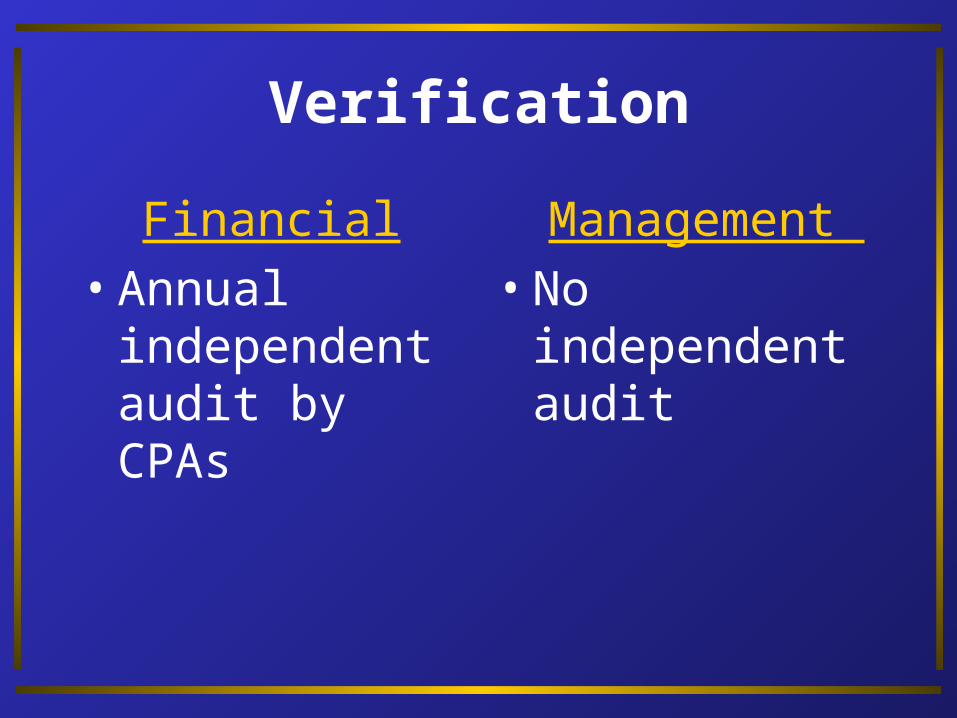
Verification
Financial
• Annual independent audit by CPAs
Management
• No independent audit

Scope of Information
Financial
• Summary reports primarily on the company as a whole
Management
• Detailed reports on parts of the company

Behavioral Implications
Financial
• Concern about adequacy of disclosure
Management
• Concern about how reports will affect employees behavior
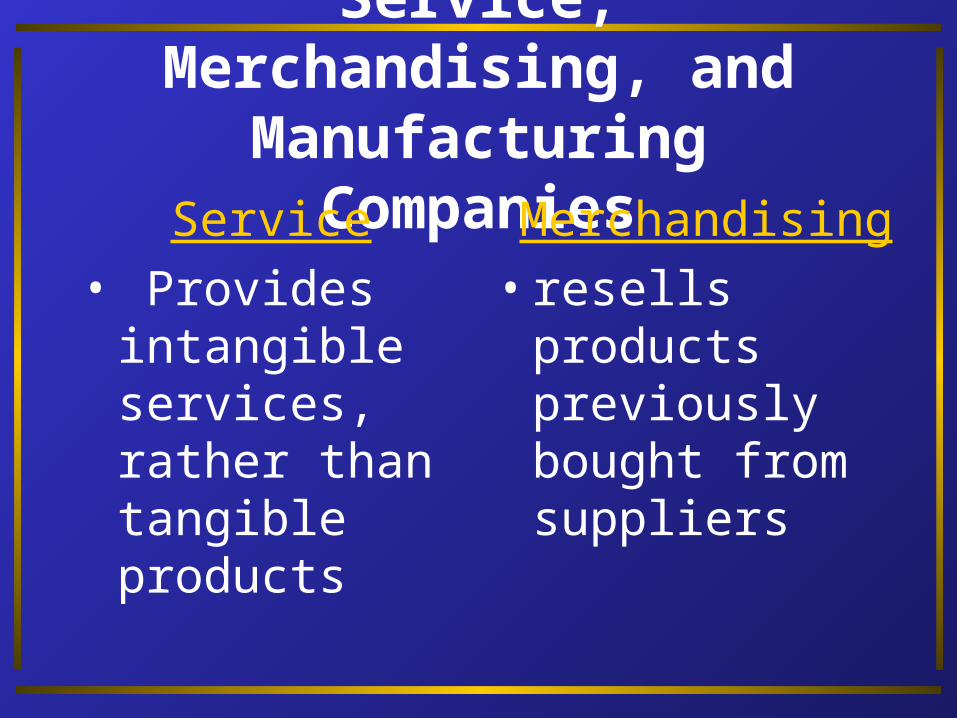
Service, Merchandising, and Manufacturing Companies
Service
• Provides intangible services, rather than tangible products
Merchandising
• resells products previously bought from suppliers

Service, Merchandising, and Manufacturing Companies
Manufacturing Company:• uses labor, plant, and equipment to
convert raw materials into finished products
• Materials inventory• Work in process inventory• Finished goods inventory

Describe the value chainand classify costs byvalue-chain functions.
Objective 2

Value Chain
Research &Development
DesignProduction or
Purchases
Marketing Distribution CustomerServices

S19-3

Distinguish direct costsfrom indirect costs.
Objective 3

Cost Objects, Direct Costs,and Indirect Costs
• Cost objects are anything for which a separate measurement of costs is desired.
• Cost drivers are any factors that affect cost.

Cost Objects, Direct Costs,and Indirect Costs
• What are examples of cost objects?– individual products–alternative marketing strategies–geographic segments of the
business–departments

Cost Objects, Direct Costs,and Indirect Costs
• What are direct costs?
• Direct costs are those costs that can be specifically traced to the cost object.
• What are indirect costs?
• Indirect costs are costs that cannot be specifically traced to the cost object.

Distinguish among full product costs,
inventoriable productcosts, and period costs.
Objective 4

Product Costs
• What are product costs?
• They are the costs to produce (or purchase) tangible products intended for sale.
Inventoriableproduct
costs
Inventoriableproduct
costs
Fullproduct
costs
Fullproduct
costs
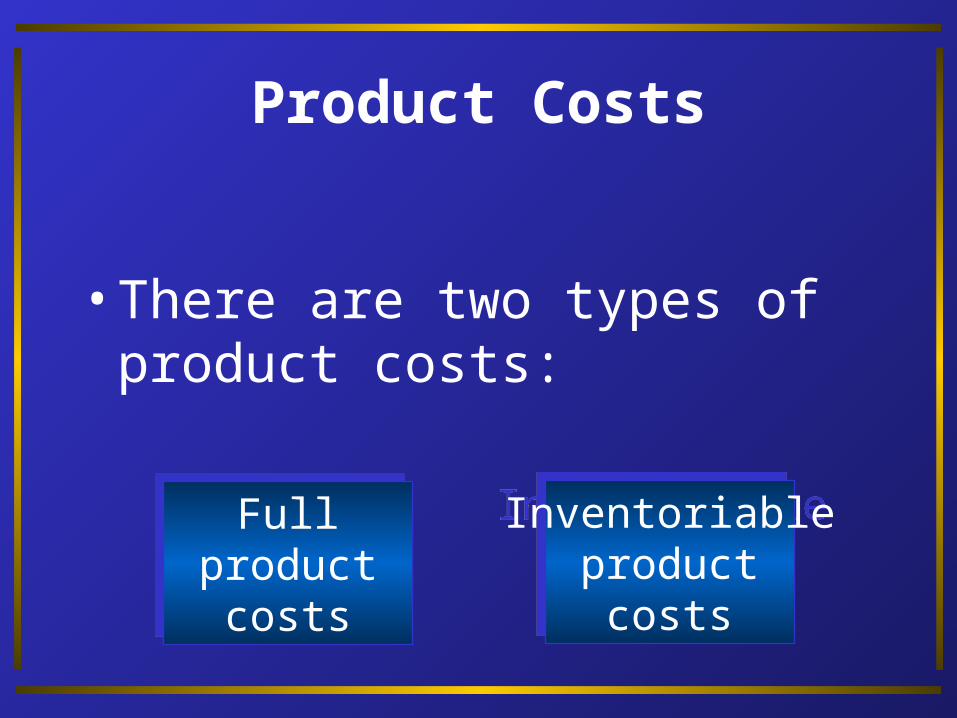
Product Costs
• There are two types of product costs:

External Reporting
Inventoriableproduct
costs
Inventoriableproduct
costs
PeriodcostsPeriodcosts
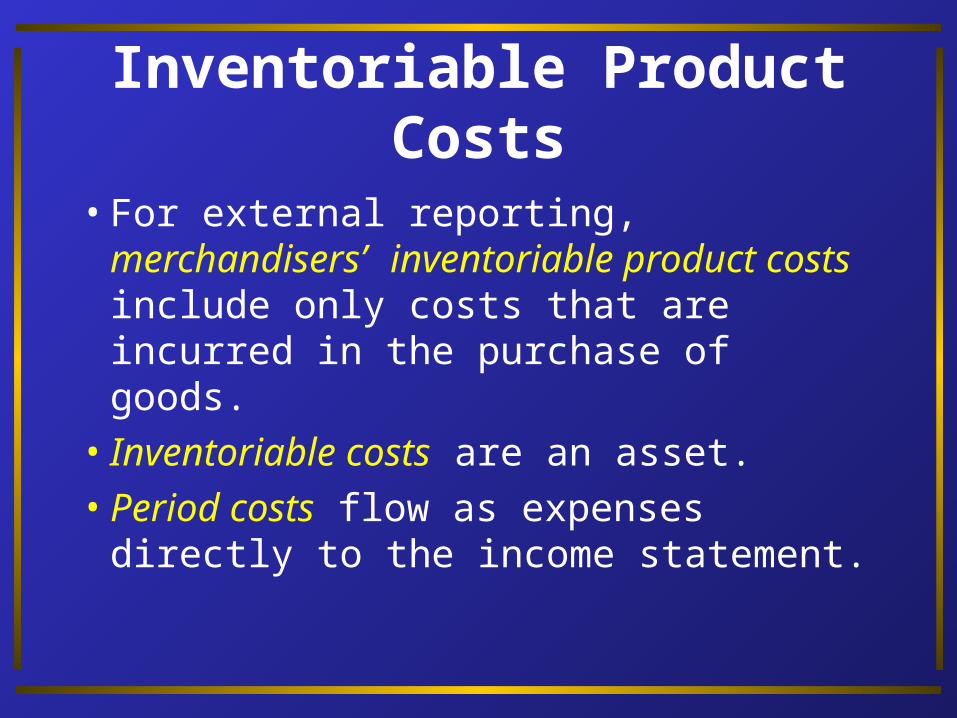
Inventoriable Product Costs
• For external reporting, merchandisers’ inventoriable product costs include only costs that are incurred in the purchase of goods.
• Inventoriable costs are an asset.
• Period costs flow as expenses directly to the income statement.

Inventoriable Product Costs
• For external reporting, manufacturers’ inventoriable product costs include raw materials plus all other costs incurred in the manufacturing process.
• Inventoriable product costs are incurred only in the third element of the value chain.
• Costs incurred in other elements of the value chain are period costs.

DirectMaterials
DirectLabor
IndirectLabor
IndirectMaterials
Other
Manufacturing Overhead
Inventoriable Product Costs

Inventoriable Product Costs
DirectMaterials
DirectLabor
Prime Costs = Direct Materials + Direct Labor

Inventoriable Product Costs
Conversion Costs = Direct Labor + Manufacturing Overhead
DirectLabor
IndirectLabor
IndirectMaterials
Other

Prepare the financial statementsof a manufacturing company.
Objective 5

Revenues – Expenses = Operating income
Financial Statements forService Companies
• There is no inventory and thus no inventoriable costs.
• The income statement does not include cost of goods sold.

Financial Statements for Merchandising Companies
Purchases ofInventory plus
Freight-In Inventory
Sales Revenue
Cost ofGoods Sold
INCOME STATEMENT
Operating Expenses
InventoriableCosts
BALANCE SHEET
equals Operating Income
whensalesoccur
deduct
equals Gross Margindeduct
PeriodCosts

Financial Statements forManufacturing Companies
MaterialsInventory
FinishedGoods
Inventory
Sales Revenue
Cost ofGoods Sold
INCOME STATEMENT
Operating Expenses
InventoriableCosts
BALANCE SHEET
equals Operating Income
whensalesoccur
deduct
equals Gross Margindeduct
Work inProcess
Inventory
PeriodCosts

Manufacturing Company Example
• Kendall Manufacturing Company:• Beginning and ending work-in-process
inventories were $20,000 and $18,000.• Direct materials used were $70,000.• Direct labor was $100,000.• Manufacturing overhead incurred was
$150,000.

Manufacturing Company Example
• What is the cost of goods manufactured?
Beginning work in process $ 20,000Direct labor $100,000Direct materials 70,000Mfg. overhead 150,000 320,000Ending work in process (18,000)Cost of goods manufactured $322,000

Manufacturing Company Example
• Kendall Manufacturing Company’s beginning finished goods inventory was $60,000 and its ending finished goods inventory was $55,000.
• How much is the cost of goods sold?

Manufacturing Company Example
Beg. finished goods inventory $ 60,000+ Cost of goods manufactured 322,000= Cost of goods available for sale $382,000– Ending finished goods 55,000= Cost of goods sold $327,000

Manufacturing Company Example
• Kendall Manufacturing Company had sales of $627,000 for the period.
• How much is the gross margin?Sales $627,000– Cost of goods sold 327,000= Gross margin $300,000

Manufacturing Company Example
• Kendall Manufacturing Company had operating expenses as follows:
• $80,000 Sales salaries 10,000 Delivery expense
30,000 Administrative expenses $120,000 Total
• What is Kendall’s operating income?

Manufacturing Company Example
Gross margin $300,000– Operating expenses 120,000= Operating income $180,000

Flow of Costs through a Manufacturer’s Accounts
• Direct Materials Inventory• Beginning inventory+ Purchases and freight-in
= Direct materials availablefor use
– Ending inventory= Direct materials used
• Work in Process Inventory• Beginning inventory+ Direct materials used+ Direct labor+ Manufacturing overhead= Total manufacturing costs
to account for– Ending inventory= Cost of goods manufactured
Flow of Costs through a Manufacturer’s Accounts
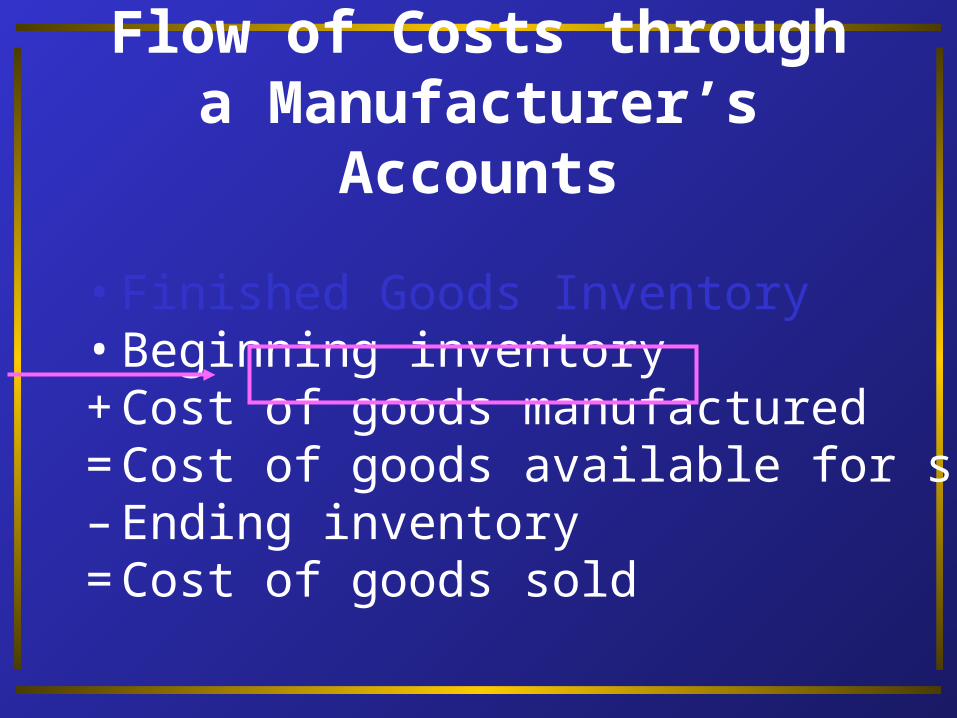
• Finished Goods Inventory• Beginning inventory+ Cost of goods manufactured= Cost of goods available for sale– Ending inventory= Cost of goods sold

Identify major trends in thebusiness environment, and usecost-benefit analysis to make
business decisions.
Objective 6

Shift to a Service Economy
In the U.S., 55% of the workforceis employed in service companies.
Service Industries Other

Competing in the Global Marketplace
Foreign Operations Other
Foreign operations accountfor over 30% of GE’s revenues.

Just-in-Time
• JIT philosophy means that the company schedules production just in time to satisfy needs.
• Speeding up of the production process reduces throughput time.
• Throughput time is the time between buying raw materials and selling the finished products.

Total Quality Management
• The goal of total quality management (TQM) is to please customers by providing them with superior products and services.
• TQM emphasizes educating, training, and cross-training employees.
• Quality improvement programs cost money today.
• The benefits usually do not occur until later.

Total Quality Management
Initial benefits and costs $170 million $200 million
Additionalexpected benefits 68 million
Total $238 million $200 million
Total Benefits Total Cost

Use reasonable standards tomake ethical judgments.
Objective 7

Professional Ethics for Management Accountants
• In many situations the ethical path is not so clear.
• The Institute of Management Accountants (IMA) has developed standards to help management accountants deal with these situations.
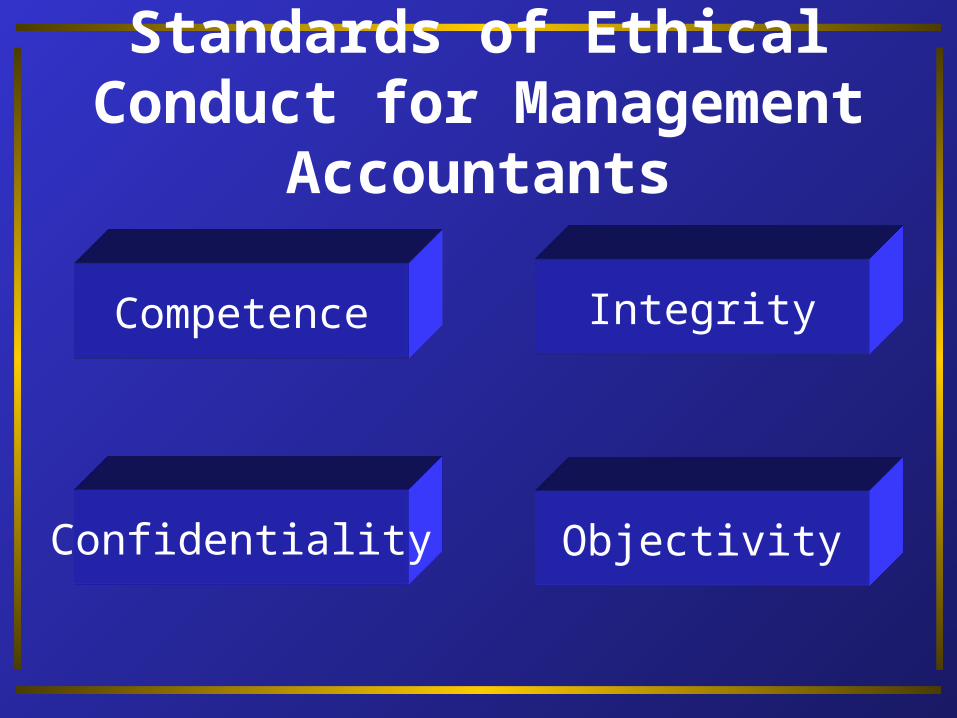
Standards of Ethical Conduct for Management
Accountants
Confidentiality
Integrity
Objectivity
Competence

End of Chapter 19
Related Documents