Chapter 18 Equity Valuation Models

Welcome message from author
This document is posted to help you gain knowledge. Please leave a comment to let me know what you think about it! Share it to your friends and learn new things together.
Transcript

Chapter 18
Equity Valuation Models
2
• Balance Sheet Models
– Book Value
• Dividend Discount Models
• Price/Earning Ratios
Models of Equity Valuation

3
• Intrinsic Value
– Self assigned Value
– Variety of models are used for estimation
• Market Price (MP)
– Consensus value of all potential traders
• Trading Signal
– IV > MP Buy
– IV < MP Sell or Short Sell
– IV = MP Hold or Fairly Priced
Intrinsic Value and Market Price
4
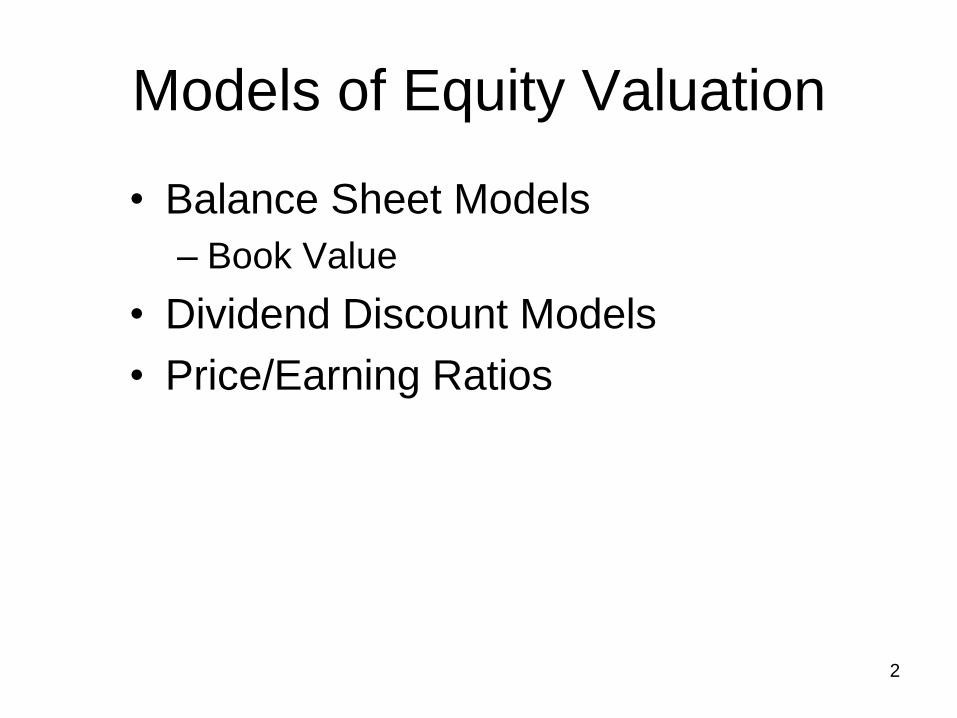
Dividend Discount Models:
General Model
V0 = Value of Stock
Dt = Dividend
k = required return
𝑉0 = 𝐷𝑡1 + 𝑘 𝑡
∞
𝑡=1

5
No Growth Model
The no growth model would work for common stocks that have earnings and dividends that are expected to remain constant (this assumption is probably not too realistic).
A good example of a claim that has constant dividends is Preferred Stock
𝑉0 =𝐷1𝑘

6
D1 = $5.00
k = 0.15
V0 = $5.00 / 0.15 = $33.33
No Growth Model: Example
𝑉0 =𝐷1𝑘

7
The constant growth model
Where D1 = D0(1+g)
D2 = D1(1+g) = D0(1+g)2
and so on …..
As long as k > g, the sum will converge to:
𝑉0 = 𝐷0 1 + 𝑔
𝑡
(1 + 𝑘)𝑡
∞
𝑡=1
𝑉0 =𝐷0(1 + 𝑔)
𝑘 − 𝑔=𝐷1𝑘 − 𝑔
8
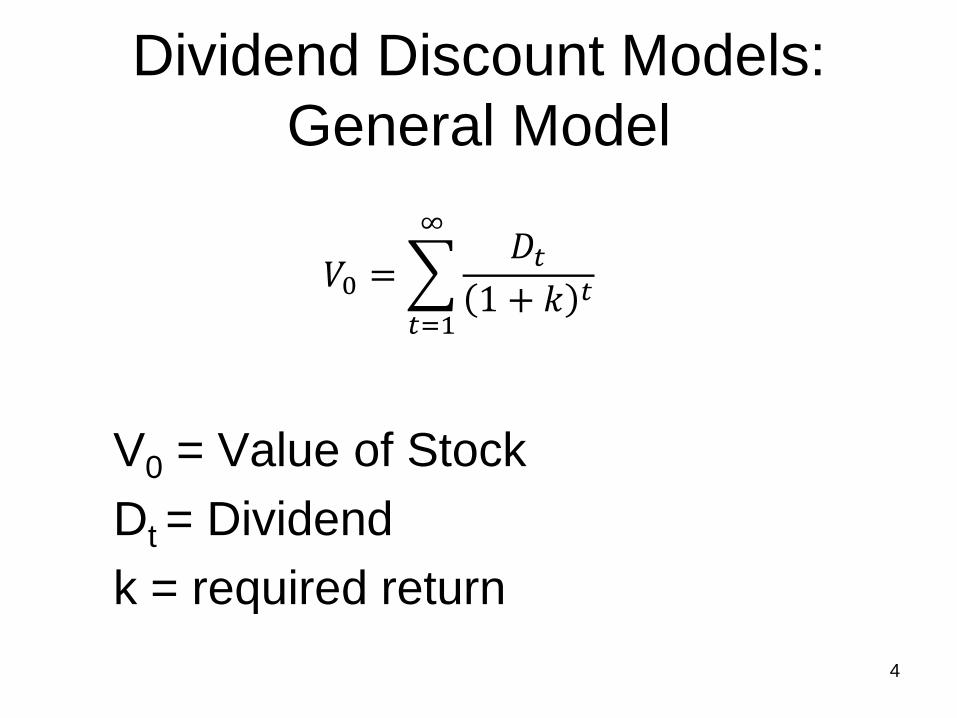
k = 15% D1 = $3.00 g = 8%
(therefore: D0 = 3/1.08)
V0 = 3.00 / (0.15 - 0.08) = $42.86
Constant Growth Model: Example
𝑉0 =𝐷0(1 + 𝑔)
𝑘 − 𝑔=𝐷1𝑘 − 𝑔

9
Constant growth continued
On the previous slide we computed the intrinsic value as
V0 = 3/(0.15-0.08)=$42.86. Based on the constant growth model, what is
the intrinsic value at t=1, V1?
Because D2 = D1(1+g), we can substitute this value for D2 into the
expression for V1 as follows:
In words, the intrinsic value grows at the same rate, g, as
dividends.
𝑉1 =𝐷2𝑘 − 𝑔
𝑉1 =𝐷1 1 + 𝑔
𝑘 − 𝑔=𝐷1𝑘 − 𝑔
1 + 𝑔 = 𝑉0(1 + 𝑔)
10
Constant growth continued
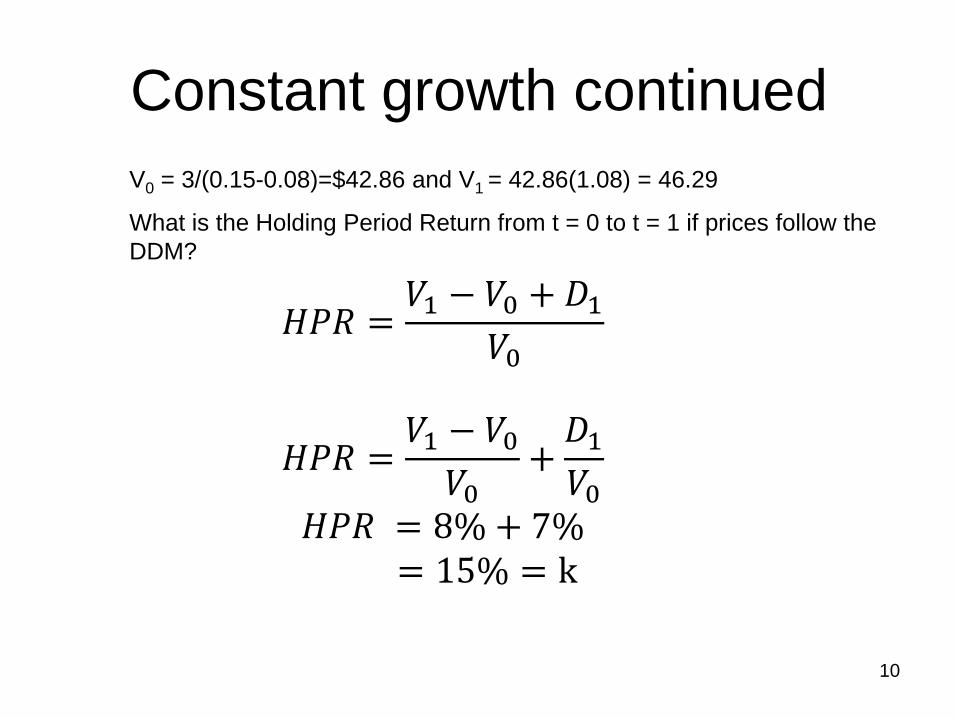
V0 = 3/(0.15-0.08)=$42.86 and V1 = 42.86(1.08) = 46.29
What is the Holding Period Return from t = 0 to t = 1 if prices follow the
DDM?
𝐻𝑃𝑅 =𝑉1 − 𝑉0 + 𝐷1𝑉0
𝐻𝑃𝑅 =𝑉1 − 𝑉0𝑉0+𝐷1𝑉0
𝐻𝑃𝑅 = 8%+ 7%= 15% = k

11
Specified Holding Period Model
PN = the expected price for the stock at time N
N = the specified number of years the stock is expected to be held
𝑃𝑁 = 𝐷𝑡1 + 𝑘 𝑡
∞
𝑡=𝑁+1
𝑃𝑁 =𝐷𝑁+1𝑘 − 𝑔2
Where the growth rate during the stage from N+1 to ∞, g2, may
differ from the growth rate used from periods 1 to N.
𝑉0 =𝐷11 + 𝑘+𝐷21 + 𝑘 2
+⋯+𝐷𝑁 + 𝑃𝑁1 + 𝑘 𝑁

12
Example of 2-stage model Assume that the current dividend is D0 = 1.00 and dividends are expected
to grow at 10% for the next 3 years (i.e., from t=0 to t=1, t=1 to t=2, and t=2
to t=3). Starting in year 3, dividends will grow at 4% indefinitely (i.e., from
t=3 to infinity). Calculate the current intrinsic value based on these
assumptions, given k = 8%.
Step 1: Trace out all the dividends
Growth in the first stage, g1 = 10%
D1 = 1.00 x 1.10 = $1.10
D2 = 1.00 x 1.102 = $1.21
D3 = 1.00 x 1.103 = $1.33
D4 = D3 x 1.04 = $1.33 x 1.04 = $1.38 growing at 4% forever.
13
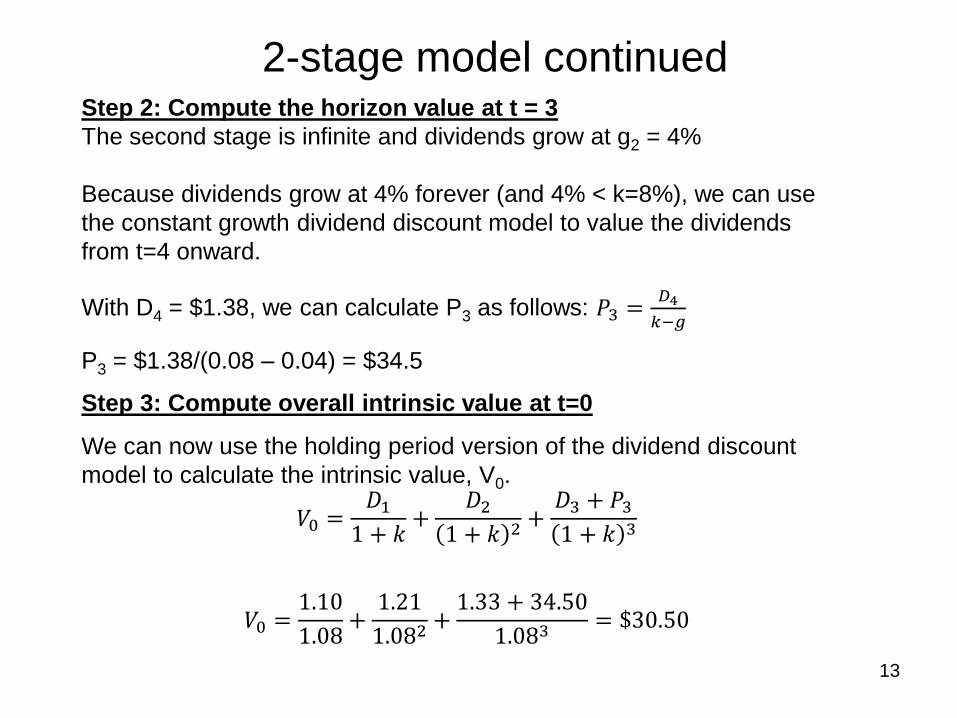
2-stage model continued Step 2: Compute the horizon value at t = 3
The second stage is infinite and dividends grow at g2 = 4%
Because dividends grow at 4% forever (and 4% < k=8%), we can use
the constant growth dividend discount model to value the dividends
from t=4 onward.
With D4 = $1.38, we can calculate P3 as follows: 𝑃3 =𝐷4
𝑘−𝑔
P3 = $1.38/(0.08 – 0.04) = $34.5
Step 3: Compute overall intrinsic value at t=0
We can now use the holding period version of the dividend discount
model to calculate the intrinsic value, V0.
𝑉0 =𝐷11 + 𝑘+𝐷21 + 𝑘 2
+𝐷3 + 𝑃31 + 𝑘 3
𝑉0 =1.10
1.08+1.21
1.082+1.33 + 34.50
1.083= $30.50
14
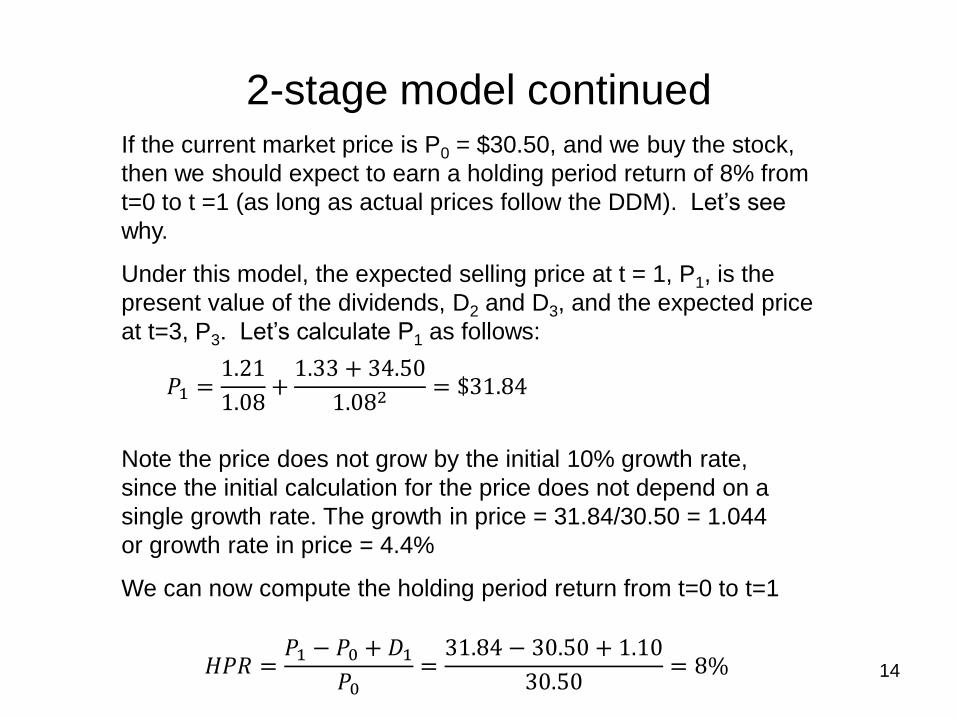
2-stage model continued If the current market price is P0 = $30.50, and we buy the stock,
then we should expect to earn a holding period return of 8% from
t=0 to t =1 (as long as actual prices follow the DDM). Let’s see
why.
Under this model, the expected selling price at t = 1, P1, is the
present value of the dividends, D2 and D3, and the expected price
at t=3, P3. Let’s calculate P1 as follows:
Note the price does not grow by the initial 10% growth rate,
since the initial calculation for the price does not depend on a
single growth rate. The growth in price = 31.84/30.50 = 1.044
or growth rate in price = 4.4%
We can now compute the holding period return from t=0 to t=1
𝑃1 =1.21
1.08+1.33 + 34.50
1.082= $31.84
𝐻𝑃𝑅 =𝑃1 − 𝑃0 + 𝐷1𝑃0
=31.84 − 30.50 + 1.10
30.50= 8%

15
g = growth rate in dividends
ROE = Return on Equity for the firm
b = plowback or retention percentage rate
(1- dividend payout percentage rate)
Estimating Dividend Growth Rates
𝑔 = 𝑅𝑂𝐸 × 𝑏

16
ROE = 20%, b = 40% and (1-b) = 60%
E1 = $5.00 D1 = $3.00 k = 15%
g = 0.20 x 0.40 = 0.08 or 8%
Partitioning Value: Example

17
V0= value with growth
NGV0 = no growth component value
PVGO = Present Value of Growth Opportunities
Partitioning Value: Example
𝑉0 =3.00
0.15 − 0.08= $42.86
𝑁𝐺𝑉0 =5.00
0.15= $33.33
𝑃𝑉𝐺𝑂 = 42.86 − 33.33 = $9.52

18
• P/E Ratios are a function of two factors
– Required Rates of Return (k)
– Expected growth in Dividends
• Uses
– Relative valuation
– Extensive Use in industry
Price Earnings Ratios

19
E1: expected earnings for next year
E1 is equal to D1 under no growth
k: required rate of return
P/E Ratio: No Expected Growth
𝑃0 =𝐸1𝑘
𝑃0𝐸1=1
𝑘
20
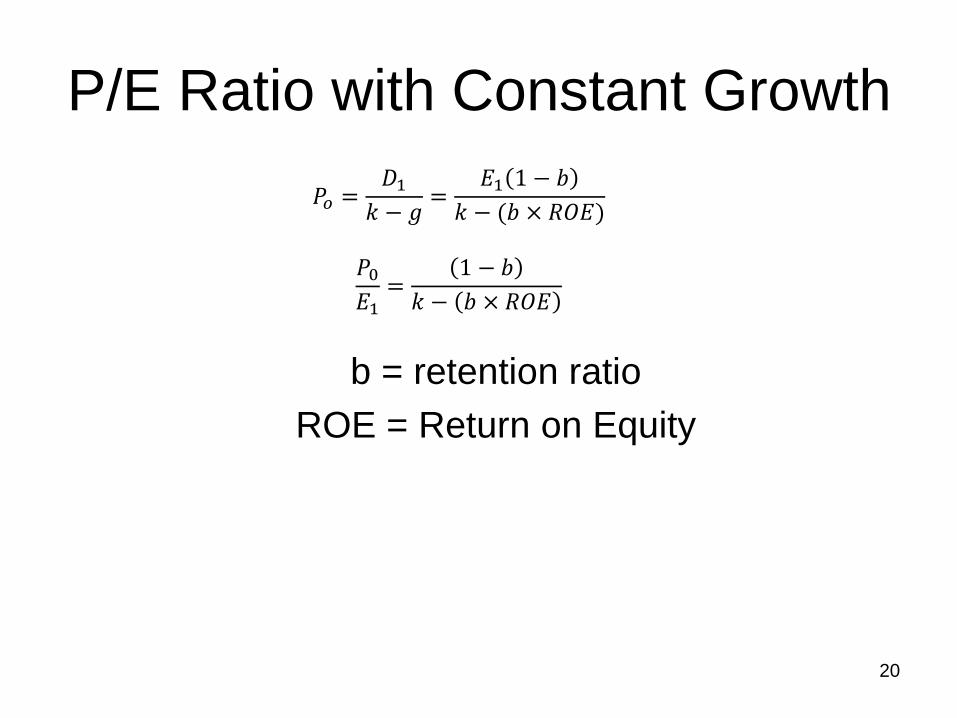
b = retention ratio
ROE = Return on Equity
P/E Ratio with Constant Growth
𝑃𝑜 =𝐷1𝑘 − 𝑔
=𝐸1 1 − 𝑏
𝑘 − (𝑏 × 𝑅𝑂𝐸)
𝑃0𝐸1=
1 − 𝑏
𝑘 − 𝑏 × 𝑅𝑂𝐸

21
E0 = $2.50 g = 0 k = 12.5%
P0 = D/k = $2.50/0.125 = $20.00
PE = 1/k = 1/0.125 = 8
Numerical Example: No Growth
22
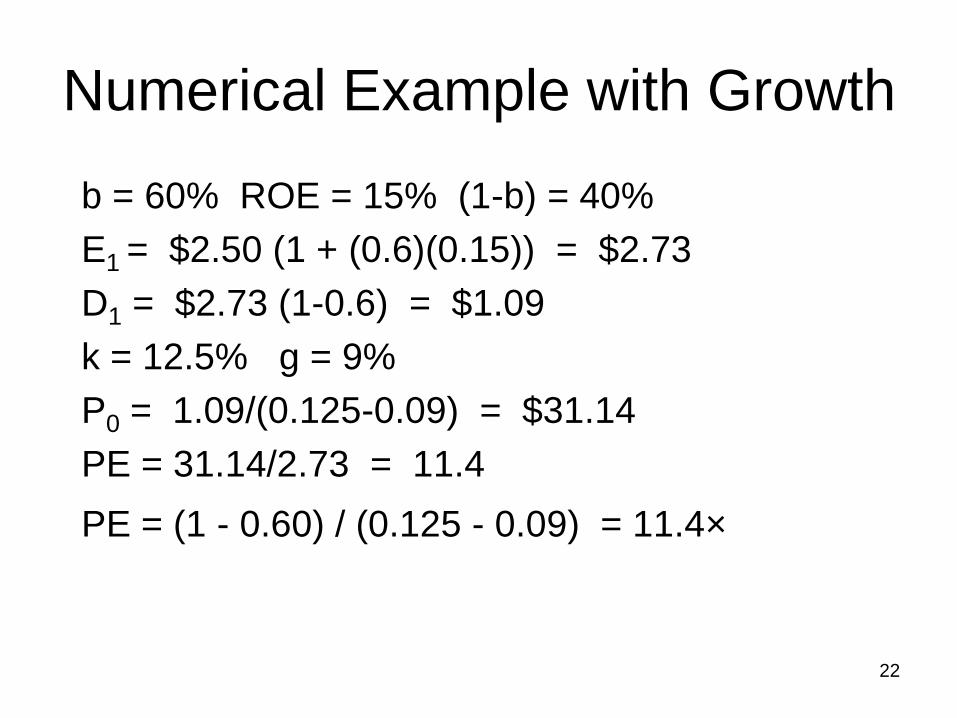
b = 60% ROE = 15% (1-b) = 40%
E1 = $2.50 (1 + (0.6)(0.15)) = $2.73
D1 = $2.73 (1-0.6) = $1.09
k = 12.5% g = 9%
P0 = 1.09/(0.125-0.09) = $31.14
PE = 31.14/2.73 = 11.4
PE = (1 - 0.60) / (0.125 - 0.09) = 11.4×
Numerical Example with Growth

23
Table 18.3 Effect of ROE and Plowback on Growth
and the P/E Ratio

24
Free Cash Flow Approach
• Discount the free cash flow for the firm
• Discount rate is the firm’s cost of capital
• Components of free cash flow
– After tax EBIT
– Depreciation
– Capital expenditures
– Increase in net working capital
25
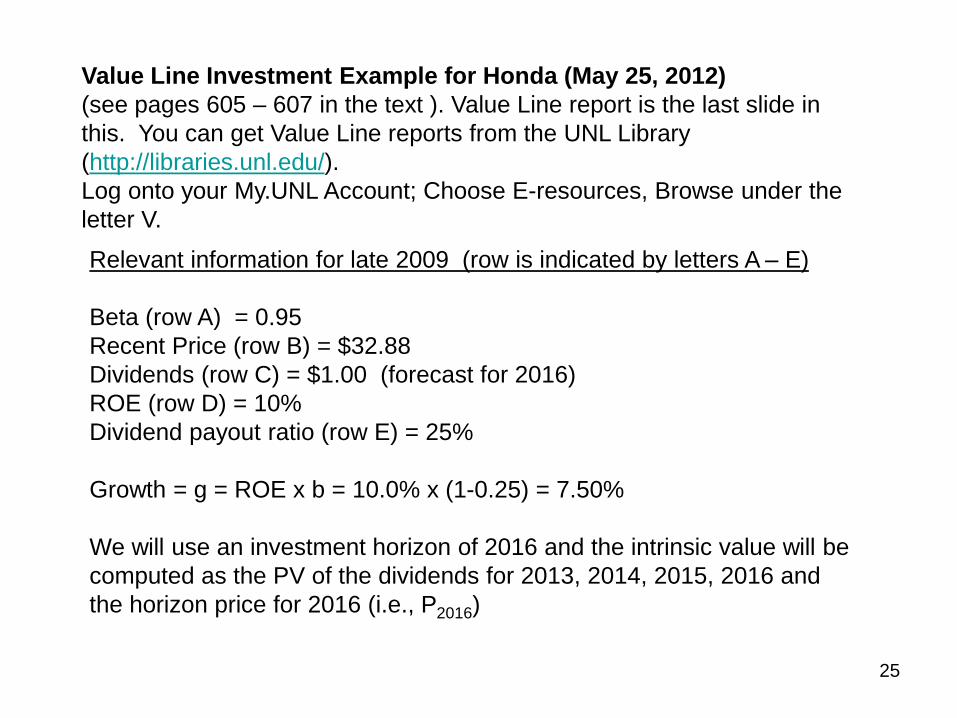
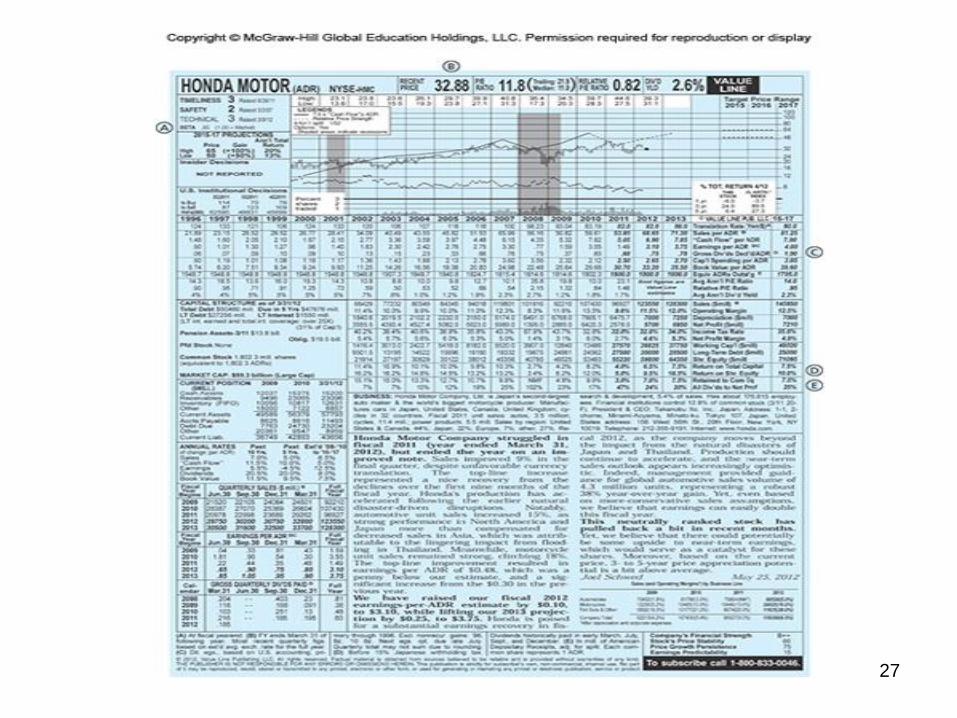
Value Line Investment Example for Honda (May 25, 2012)
(see pages 605 – 607 in the text ). Value Line report is the last slide in
this. You can get Value Line reports from the UNL Library
(http://libraries.unl.edu/).
Log onto your My.UNL Account; Choose E-resources, Browse under the
letter V.
Relevant information for late 2009 (row is indicated by letters A – E)
Beta (row A) = 0.95
Recent Price (row B) = $32.88
Dividends (row C) = $1.00 (forecast for 2016)
ROE (row D) = 10%
Dividend payout ratio (row E) = 25%
Growth = g = ROE x b = 10.0% x (1-0.25) = 7.50%
We will use an investment horizon of 2016 and the intrinsic value will be
computed as the PV of the dividends for 2013, 2014, 2015, 2016 and
the horizon price for 2016 (i.e., P2016)
26
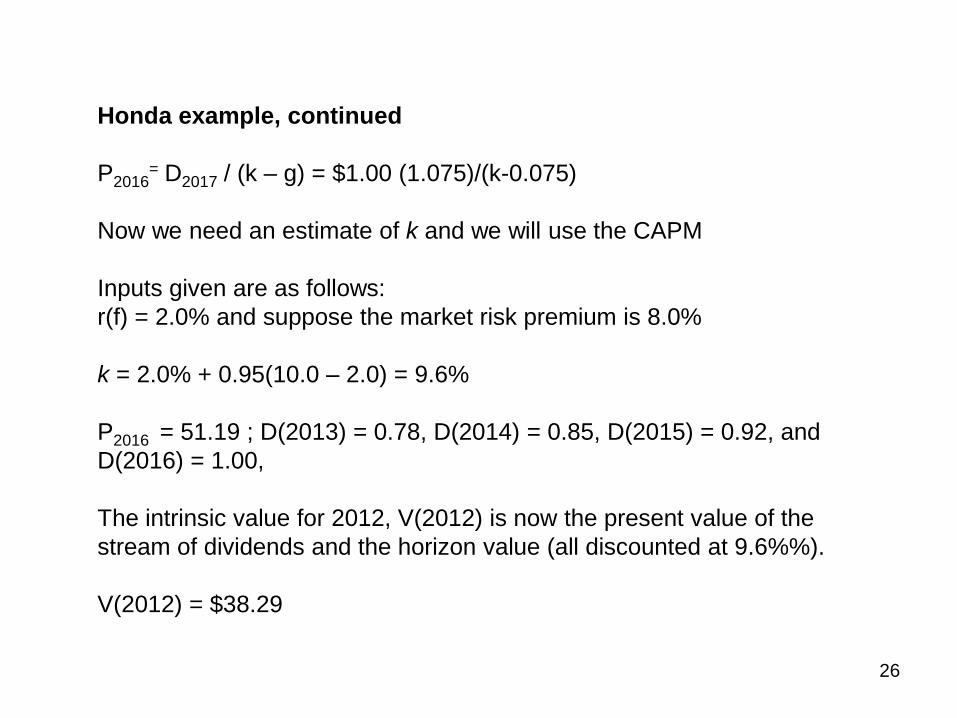
Honda example, continued
P2016= D2017 / (k – g) = $1.00 (1.075)/(k-0.075)
Now we need an estimate of k and we will use the CAPM
Inputs given are as follows:
r(f) = 2.0% and suppose the market risk premium is 8.0%
k = 2.0% + 0.95(10.0 – 2.0) = 9.6%
P2016 = 51.19 ; D(2013) = 0.78, D(2014) = 0.85, D(2015) = 0.92, and
D(2016) = 1.00,
The intrinsic value for 2012, V(2012) is now the present value of the
stream of dividends and the horizon value (all discounted at 9.6%%).
V(2012) = $38.29
27
Related Documents


![Module 4.ppt [Read-Only] - Business | Nebraskacba.unl.edu/class/OnlineMBA/MBAWebsite/NarratedPowerPointExamples/...DuPont Disaggregation Analysis ... (independent of the capital structure](https://static.cupdf.com/doc/110x72/5aefbccc7f8b9abc788c6b56/module-4ppt-read-only-business-disaggregation-analysis-independent-of.jpg)