12-1 CHAPTER 12 PERIPHERAL NERVES The compound action potential If we took a 10-mm length of mixed peripheral nerve, for example, the sciatic nerve, and recorded changes in electrical potential from one end of it while electrically stimulating the other end, as illustrated in Figure 12-1A, we could make some interesting observations that tell us a great deal about peripheral nerves. Sample records from such an experiment are shown in Figure 12-1B 1 . In the uppermost trace, the strength of the stimulus is very low, and we see no response from the nerve. This stimulus strength is subthreshold. If the strength is raised, a tiny response appears in the record and, as the strength is increased even more, the response grows to a maximum value (next to bottom trace); further increases in shock strength do not further augment the response. The stimulus strength that just gives a response is termed a threshold stimulus ; any stimulus of greater strength is suprathreshold. The strength that just gives the maximal response is a maximal stimulus; any strength greater is supramaximal. The response of the nerve is called the compound action potential. The compound action potential is graded in nature, in striking contrast to the all-or-none response of single axons. There is a simple explanation for why the response of a nerve is graded and that of a single fiber is all-or-none. The nerve is composed of many fibers of different diameters, with these different diameters seemingly distributed at random throughout the nerve. It turns out that the threshold for discharge of an axon in response to externally applied current is inversely related to the diameter of the axon, so that for a large and small axon equidistant from the stimulating electrode, the large axon will have the lower threshold. Furthermore, if two axons of the same size are at different distances from the stimulating electrode (that is, one is buried deeper in the nerve or on the other side of the nerve from the electrode), the one closer to the electrode will pick up more current and therefore reach threshold at a lower stimulus strength than the one farther away. Thus, as the stimulus strength was increased in Figure 12-1B, the largest axons closest to the electrode began responding at lowest stimulus strengths. Then, at higher strengths, smaller axons close to the electrode and large axons farther away from the electrode responded, and their individual action potentials were added to the compound action potential. Finally, at maximal stimulus strength, every axon in the nerve was contributing its own all-or-none action potential, whence no further increase in the response was possible. It should be kept in mind that at all strengths, the recorded response is the sum over time of the action potentials of all of the discharging cells. The shape of the compound action potential in Figure 12-1 may look like a temporally expanded action potential followed by an after-hyperpolarization; 1 The recording trace deflects upward when the left recording electrode is negative with respect to the right one.

Welcome message from author
This document is posted to help you gain knowledge. Please leave a comment to let me know what you think about it! Share it to your friends and learn new things together.
Transcript
12-1
CHAPTER 12
PERIPHERAL NERVES
The compound action potential If we took a 10-mm length of mixed
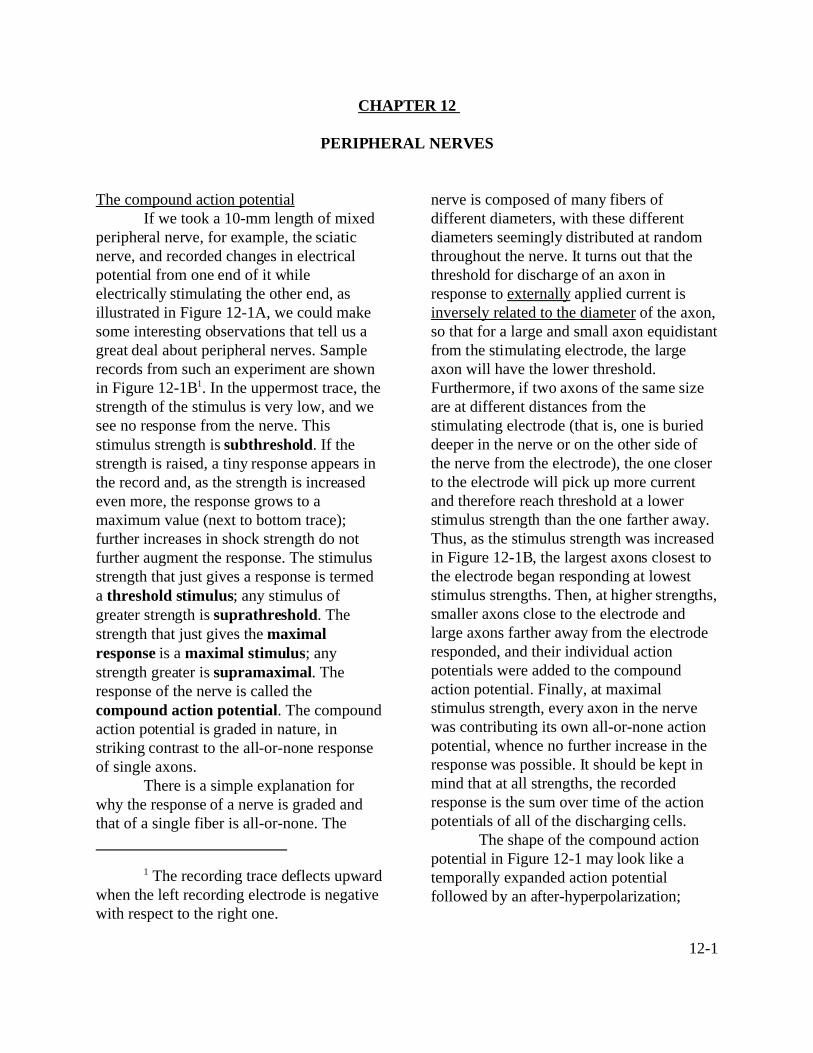
peripheral nerve, for example, the sciaticnerve, and recorded changes in electricalpotential from one end of it whileelectrically stimulating the other end, asillustrated in Figure 12-1A, we could makesome interesting observations that tell us agreat deal about peripheral nerves. Samplerecords from such an experiment are shownin Figure 12-1B1. In the uppermost trace, thestrength of the stimulus is very low, and wesee no response from the nerve. Thisstimulus strength is subthreshold. If thestrength is raised, a tiny response appears inthe record and, as the strength is increasedeven more, the response grows to amaximum value (next to bottom trace);further increases in shock strength do notfurther augment the response. The stimulusstrength that just gives a response is termeda threshold stimulus; any stimulus ofgreater strength is suprathreshold. Thestrength that just gives the maximalresponse is a maximal stimulus; anystrength greater is supramaximal. Theresponse of the nerve is called thecompound action potential. The compoundaction potential is graded in nature, instriking contrast to the all-or-none responseof single axons.
There is a simple explanation forwhy the response of a nerve is graded andthat of a single fiber is all-or-none. The
nerve is composed of many fibers ofdifferent diameters, with these differentdiameters seemingly distributed at randomthroughout the nerve. It turns out that thethreshold for discharge of an axon inresponse to externally applied current isinversely related to the diameter of the axon,so that for a large and small axon equidistantfrom the stimulating electrode, the largeaxon will have the lower threshold.Furthermore, if two axons of the same sizeare at different distances from thestimulating electrode (that is, one is burieddeeper in the nerve or on the other side ofthe nerve from the electrode), the one closerto the electrode will pick up more currentand therefore reach threshold at a lowerstimulus strength than the one farther away.Thus, as the stimulus strength was increasedin Figure 12-1B, the largest axons closest tothe electrode began responding at loweststimulus strengths. Then, at higher strengths,smaller axons close to the electrode andlarge axons farther away from the electroderesponded, and their individual actionpotentials were added to the compoundaction potential. Finally, at maximalstimulus strength, every axon in the nervewas contributing its own all-or-none actionpotential, whence no further increase in theresponse was possible. It should be kept inmind that at all strengths, the recordedresponse is the sum over time of the actionpotentials of all of the discharging cells.
The shape of the compound actionpotential in Figure 12-1 may look like atemporally expanded action potentialfollowed by an after-hyperpolarization;
1 The recording trace deflects upwardwhen the left recording electrode is negativewith respect to the right one.
12-2
Fig. 12-1. A. Setup for recording the
compound action potential from the
sciatic nerve. B. Sample records taken at
stimulus strengths increasing from top to
bottom. Trace deflects upward when left
recording electrode is negative with
respect to the right one. Note the graded
nature of the compound action potential.
(Katz B: Nerve, Muscle and Synapse. New
York, McGraw-Hill, 1966)
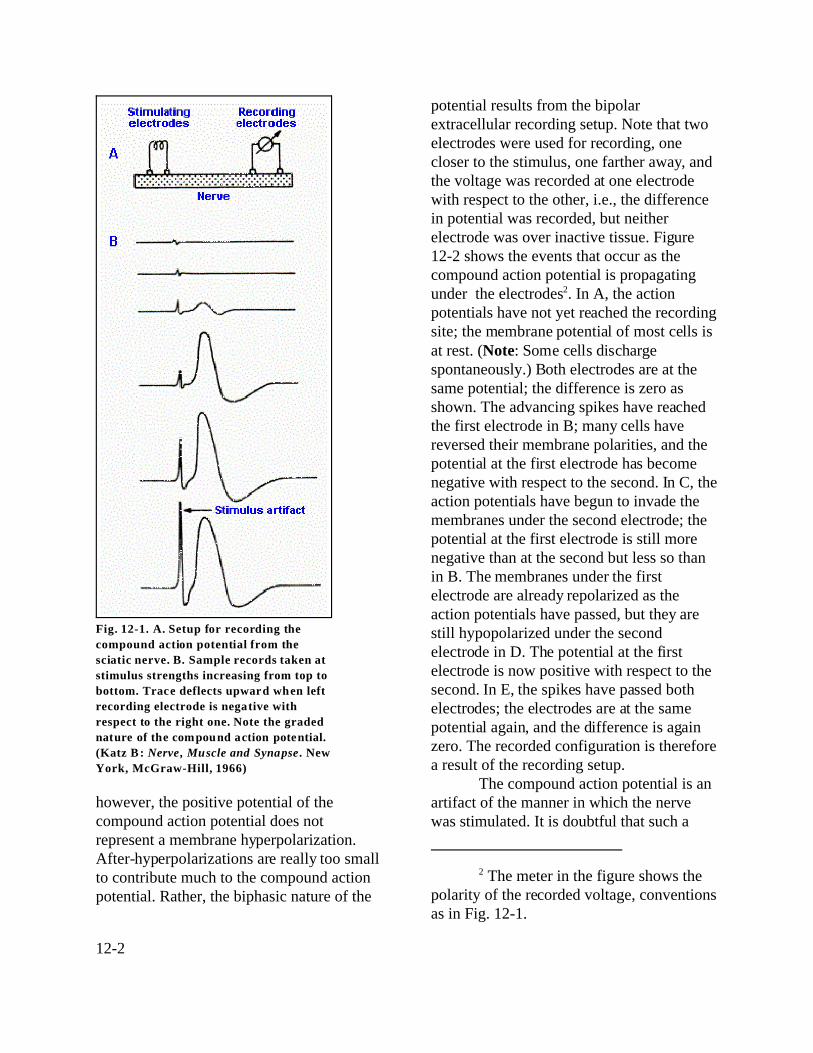
however, the positive potential of thecompound action potential does notrepresent a membrane hyperpolarization.After-hyperpolarizations are really too smallto contribute much to the compound actionpotential. Rather, the biphasic nature of the
potential results from the bipolarextracellular recording setup. Note that twoelectrodes were used for recording, onecloser to the stimulus, one farther away, andthe voltage was recorded at one electrodewith respect to the other, i.e., the differencein potential was recorded, but neitherelectrode was over inactive tissue. Figure12-2 shows the events that occur as thecompound action potential is propagatingunder the electrodes2. In A, the actionpotentials have not yet reached the recordingsite; the membrane potential of most cells isat rest. (Note: Some cells dischargespontaneously.) Both electrodes are at thesame potential; the difference is zero asshown. The advancing spikes have reachedthe first electrode in B; many cells havereversed their membrane polarities, and thepotential at the first electrode has becomenegative with respect to the second. In C, theaction potentials have begun to invade themembranes under the second electrode; thepotential at the first electrode is still morenegative than at the second but less so thanin B. The membranes under the firstelectrode are already repolarized as theaction potentials have passed, but they arestill hypopolarized under the secondelectrode in D. The potential at the firstelectrode is now positive with respect to thesecond. In E, the spikes have passed bothelectrodes; the electrodes are at the samepotential again, and the difference is againzero. The recorded configuration is thereforea result of the recording setup.
The compound action potential is anartifact of the manner in which the nervewas stimulated. It is doubtful that such a
2 The meter in the figure shows thepolarity of the recorded voltage, conventionsas in Fig. 12-1.

12-3
Fig. 12-2. Axon membrane polarization at various
times during conduction of an action potentia l.
Shown are polarizations when the spike is
approaching the segment (A), under one electrode
(B, D), under both electrodes (C), and retreating
from the segment (E). The meter, connected to
two external electrodes, shows the polarity of the
recorded voltage.
potential is often elicited in nerves undernormal conditions of sensation ormovement, but they may occur in somespecial circumstances. For example, inmuscle nerves, when a person jumps off anobject and lands on the ground, a relativelysynchronous volley of action potentials is set
up in the group Ia afferent fibers from thequadriceps muscles, and this in turn resultsin a relatively synchronous volley in thealpha motoneurons of the quadricepsmuscles, as we will see in Chapter 15.Usually, however, there is a constant,asynchronous trickle of action potentialscoming into the central nervous system andalso leaving it. However, the study of thecompound action potential has given us a lotof information about conduction inperipheral nerves. Types of fibers in peripheral nerves.
If, now, a greater length of sciaticnerve is used in the same experiment (say 80mm of nerve), a new phenomenon appearsin the recording. Figure 12-3 shows astimulus-intensity series (increasing strengthfrom top to bottom) recorded under theseconditions. At just suprathreshold strength, aresponse (the A-alpha response) appears inthe record at about 2 msec after the shockartifact. At higher shock strengths, thisresponse grows in size, and a new response(the A-beta response) appears in the recordabout 4 msec after the artifact. Furtherincreases in shock strength result in furtherincreases in both the alpha and betaresponses and the addition successively ofthe new responses: A-gamma, A-delta andB, and C. Based on the discussion of theprecious paragraph, it is appropriate toassume that the components added to theresponse at higher stimulus strengthsrepresent the responses of successivelysmaller fibers, and this is indeed the case.Notice also that the responses ofsuccessively smaller fibers occur later andlater in time after the artifact. This isbecause the conduction velocity of an axonis a direct function of its diameter, and itrequires a longer time for the actionpotentials in more slowly conducting axons

12-4
Figure 12-3. Sample records from the sciatic nerve
of responses elicited by electrical stimuli applied to
the nerve 80 mm away. The various components of
the compound action potential are labeled where
they appear. Shock strengths increase from top to
bottom.
(smaller ones) to travel the 80 mm than foraction potentials in more rapidly conductingaxons (larger ones).
These different responses weren'tseen in the experiment in Figure 12-1because the short conduction distance in thatexperiment caused the action potentials inall sizes of fibers to arrive at the recordingelectrode at nearly the same time; therewasn't sufficient time for differences inconduction velocity to show up. Theindividual responses were all bunched uptogether and were thus superimposed in therecord. Nevertheless, the same fibers weredischarging at the same shock strengths inboth experiments.
Take a moment at this point to notein Figure 5-13, that the smallest fibers arethe most numerous by far, whereas thelargest are least numerous. In cutaneousnerves, measurements have indicated thatthere are about twice as many A-delta fibersas A-alpha fibers and about 4.6 times asmany C fibers as A fibers3. Though this isthe case, the maximal response (Fig. 12-3)recorded from the largest fibers, the A-alphafibers, is many times larger than thatrecorded from the smallest fibers, the Cfibers. This is because fibers contributevoltage to the recording in proportion to thesquare of their diameters. The result is that afiber 2 times as large as another contributes4 times as much voltage to the recording. In
our case, the largest A fiber is 22micrometers in diameter, the largest C fiberonly 1 micrometer in diameter; they differby a factor of 22, and they contribute voltageto the recording in the ratio of (22)2:(1)2 or484:1.
We find that fibers of particularreceptor systems are often separable to someextent on the basis of their conductionvelocities. Table 12-1 summarizes the two
different classification schemes forperipheral neurons based upon theirconduction velocity or diameter. The Romannumeral scheme (lower part of the table)refers to afferent fibers only, whereas theletter scheme (upper part of the table)includes both afferent and efferent fibers. Itmay help to note that A-alpha, Ia and Ibfibers are mostly of muscle origin or
3 The precise ratios vary withposition on the body. The lingual nerve,which supplies the tongue, contains fewunmyelinated fibers, and the nervessupplying the extremities, especiallyglabrous skin, contain fewer unmyelinatedfibers than those supplying proximal skin.Larger animals also have relatively fewerunmyelinated fibers than smaller ones.

12-5
Table 12-1Two Systems for Classifying Axons in Peripheral Nerve by Diameter
Letter System
Type offiber
Diameter,micrometers
Conductionvelocity,m/sec
General Function
A-alpha 13-22 70-120 alpha-motoneurons, muscle spindle primaryendings, Golgi tendon organs, touch
A-beta 8-13 40-70 touch, kinesthesia, muscle spindle secondaryendings
A-gamma
4-8 15-40 touch, pressure, gamma-motoneurons
A-delta 1-4 5-15 pain, crude touch, pressure, temperature
B 1-3 3-14 preganglionic autonomic
C 0.1-1 0.2-2 pain, touch, pressure, temperature,postganglionic autonomic
Roman Numeral System
Type offiber
Diameter,micrometers
Conductionvelocity,m/sec
General Function
Ia 12-20 70-120 muscle spindle primary endings
Ib 11-19 66-114 Golgi tendon organs
II 5-12 20-50 touch, kinesthesia, muscle spindle secondaryendings
III 1-5 4-20 pain, crude touch, pressure, temperature
IV 0.1-2 0.2-3 pain, touch, pressure, temperature
destination, and C and group IV fibers areall unmyelinated. Normally, we use the letterclassification scheme to designatecutaneous-afferent fiber types and theRoman numeral scheme to designatemuscle-afferent fiber types, butunfortunately this is not always the case, socare must be exercised. The fiber diameter
spectra of a muscle nerve (B) and acutaneous nerve (A) are indicated in Figure12-4 for comparison with classifications inTable 12-1. The sum of the two fiber spectrain Figure 12-4 is approximately equivalentin shape to that in Figure 5-13. Be carefulnot to confuse the fiber spectra of Figure12-4 with the compound action potential of

12-6
Figure 12-4. Fiber diameter spectra for a cutaneous (A) and a muscle nerve (B) to indicate the types of fibers
in each and the use of the naming systems of Table 12-1. (Boyd IA, Davey MR: Composition of Peripheral
Nerve. Edinburgh, Livingstone, 1968)
Figure 12-3.
Properties of different types of nerve fibers Nerve fiber types differ in their
response to local anesthetics, in theirsusceptibility to anoxia, and in theirsusceptibility to pressure block. Using theletter classification, these differences aresummarized in Table 12-2. B fibers are mostinfluenced by anoxia, A fibers are mostsusceptible to pressure block, and C fibersare most readily blocked by local
anesthetics. You may be acutely aware thathypoxia blocks A fibers before C fibers ifyou are in the habit of sleeping with yourarm under your head. Upon waking, youmay commonly observe that your sense oftouch is dulled (you may have a tinglingsensation), but your pain sensitivity is eithernormal or perhaps even slightly greater thannormal.

12-7
Figure 12-5. Recordings of compound action
potentials (arrows) in the medial and lateral
plantar nerves in a normal person (A) and in a
patient with tarsal tunnel syndrome (B). Note that
tarsal tunnel syndrome is accompanied by slowing
of conduction and reduction in amplitude of the
compound action potential. (Oh SJ, Sarala PK,
Elmore RS: Ann Neurol 5:327-330, 1979)
Table 12-2Susceptibility of Different Types of Fibers to
Conduction Block by Various Agents
Effect Most susceptible Intermediate Least susceptible
Block by hypoxia B A C
Block by pressure A B C
Block by localanesthetics
C B A
The measurement of conduction velocities It is common in peripheral nerve
damage that the conduction velocity isslowed drastically in the damaged portion.For example, in carpal tunnel syndrome,where the bones of the wrist are broken insuch a way that the fragments put pressureon the median nerve, partially blockingconduction, it is possible to assess the extent
of the damage by measuring the conductionvelocity of the nerve and comparing it withthat in the normal arm.
Measurement of the velocity isstraightforward. First, two sets ofstimulating electrodes are placed on the skinover the median nerve, one near the top ofthe forearm and one 10 cm closer to thewrist. It is important that this distance ismeasured accurately or, at least, that it is thesame on both arms if they are to becompared. Next, a pair of surface electrodesor needle electrodes, pushed through theskin into the belly of the abductor policisbrevis muscle, is used to record the muscleactivity. Recordings are made from musclebecause recordings from nerves are moredifficult to obtain. The position of thestimulating electrodes can be checked bystimulating and looking for abduction andflexion of the thumb, the action of theabductor policis brevis. Electrode position isadjusted to obtain the lowest threshold forcontraction with both pairs of stimulatingelectrodes. The nerve is then stimulated witheach set of electrodes, while looking at theelectromyogram, EMG, from the muscle andconduction time between the shock artifactand the beginning of the EMG response ismeasured. Ten centimeters divided by thedifference between the conduction times for

12-8
the two electrodes is the maximumconduction velocity for axons in the nerve.Two pairs of electrodes are used instead ofjust one because this procedure eliminatesthe need to estimate and compensate for theutilization time in the nerve, i.e., the time ittakes for the membrane potential to reachthe critical firing level and discharge a spike,and the delay in transmission at theneuromuscular junction, that is, the time ittakes for chemical transmission (see chapteron synapses). In the normal individual thevelocity should be nearly the same in botharms. Tarsal tunnel syndrome is the lowerlimb equivalent of carpal tunnel syndrome,but rarer. In tarsal syndrome, there iscompression neuropathy of the posteriortibial nerve associated with burning pain andparesthesia in the toes and on the sole of thefoot. Figure 12-5 shows recordings from themedial and lateral plantar nerves of a normalperson (A) and a patient with tarsal tunnelsyndrome (B). Note that the compoundaction potentials are smaller and later in thepatient than in the normal person, because ofthe slowing of conduction in some fibers andblock of conduction in others. Conductionvelocities measured in normal records are41.25 and 34.80 m/sec respectively, whereasthose in the patient are 26.10 and 17.78m/sec, a slowing of 37% and 49%,respectively.
Summary The compound action potential is the
graded response of a peripheral nerve toelectrical stimulation. It is graded becauseaxons of the nerve are of differing diameters,and their thresholds to externally appliedcurrent vary with diameter. The conductionvelocity of an axon is a function of itsdiameter, so the fastest component of the
compound action potential is contributed bythe fastest and largest fibers, whereas latercomponents are contributed by slower andsmaller fibers. Fibers contribute voltage tothe compound potential in proportion to thesquare of their diameters. The result is thatlarge fibers, though they are fewer in nerves,give the largest components to thecompound action potential. There are twoclassification systems for peripheral nervebased on conduction velocity. The letterscheme is for both afferent and efferentfibers. A and B fibers are myelinated; Cfibers are not. The Roman numeral system isonly for afferent fibers. Groups I, II and IIIare myelinated, group IV is not. The letterscheme is most often used for cutaneousfibers, the Roman numeral scheme formuscle afferent fibers. B fibers are mostsensitive to hypoxic block; A fibers are mostsensitive to pressure block; and C fibers aremost susceptible to anesthetic block.
Suggested Reading
1.Hodgkin AL: Evidence for electricaltransmission in nerve. Part I. J Physiol(Lond) 90:183-210, 1937.2.Hodgkin AL: Evidence for electricaltransmission in nerve. Part II. J Physiol(Lond) 90:211-232, 1937.3.Junge D: Nerve and Muscle Excitation.Sunderland MA, Sinauer, 1976.4.Katz B: Nerve, Muscle, and Synapse. NewYork, McGraw-Hill, 1966.5.Lloyd DPC: Neuron patterns controllingtransmission of ipsilateral hind limb reflexesin cat. J Neurophysiol 6:293-315, 1943.6.Patton HD: Special properties of nervetrunks and tracts. In Ruch TC, Patton HD(eds): Physiology and Biophysics, 19th ed.Philadelphia, WB Saunders, 1965.
Related Documents