Chapter 11 – Part I Chapter 11 – Part I Total Quality Management Total Quality Management COB 300 COB 300 Busing Busing

Chapter 11 – Part I Total Quality Management COB 300 Busing.
Jan 04, 2016
Welcome message from author
This document is posted to help you gain knowledge. Please leave a comment to let me know what you think about it! Share it to your friends and learn new things together.
Transcript
Chapter 11 – Part IChapter 11 – Part ITotal Quality ManagementTotal Quality Management
COB 300COB 300
BusingBusing

Problems Hidden by Inventory

Simplifying the Process
• Plant layout
• Group technology
• U-shaped layout
• Reducing setup time
• Total preventive maintenance
Simplified
Process
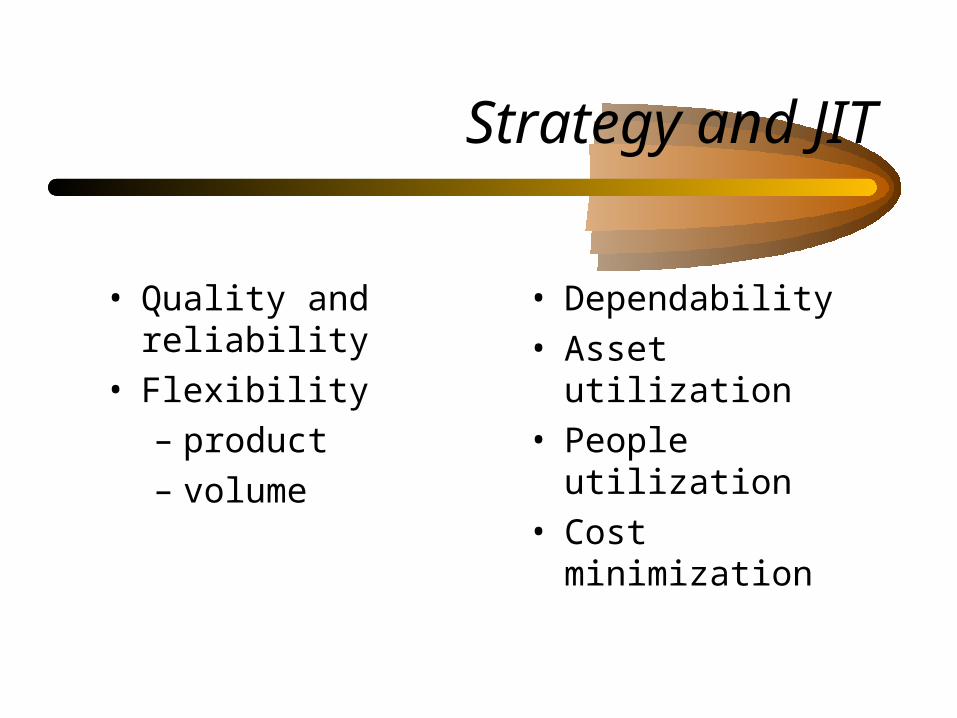
Strategy and JIT
• Quality and reliability
• Flexibility
– product
– volume
• Dependability
• Asset utilization
• People utilization
• Cost minimization

Internally OrientedInternally OrientedDefinitions of QualityDefinitions of Quality
Quality is the degree to which a specific product conforms to a design or specification
Differences in quality amount to differences in the quantity of some desired ingredient or attribute

Externally OrientedDefinitions of Quality
• Quality is fitness for use• Quality consists of the capacity to satisfy wants

A Definition of Quality Used by Many Companies
Quality is consistently meeting or exceeding the customer’s needs and expectations.
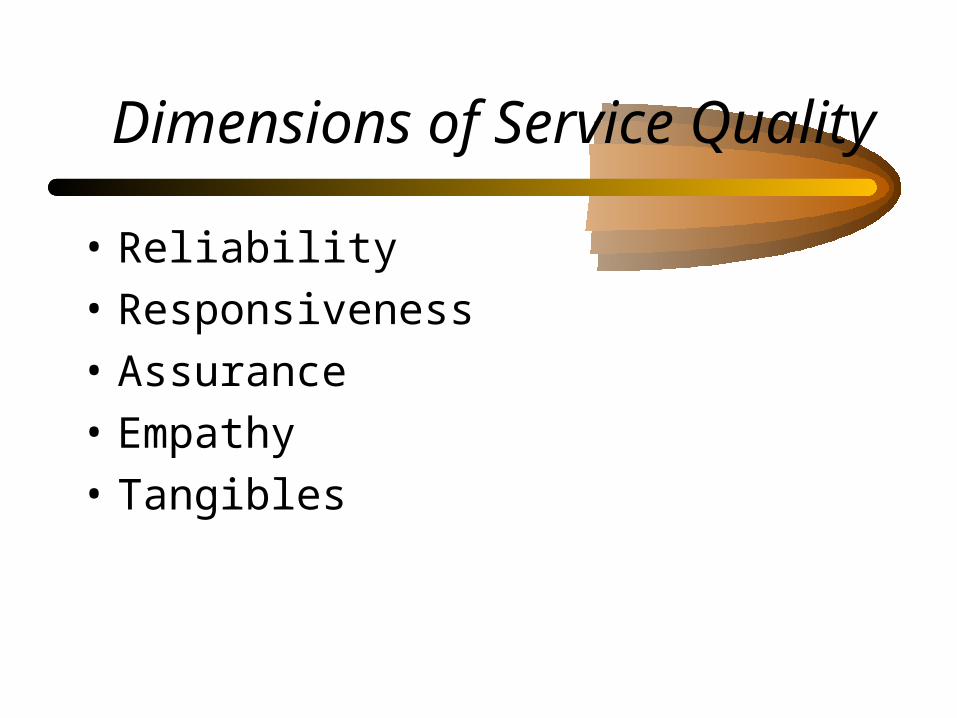
Dimensions of Service Quality
• Reliability
• Responsiveness
• Assurance
• Empathy
• Tangibles
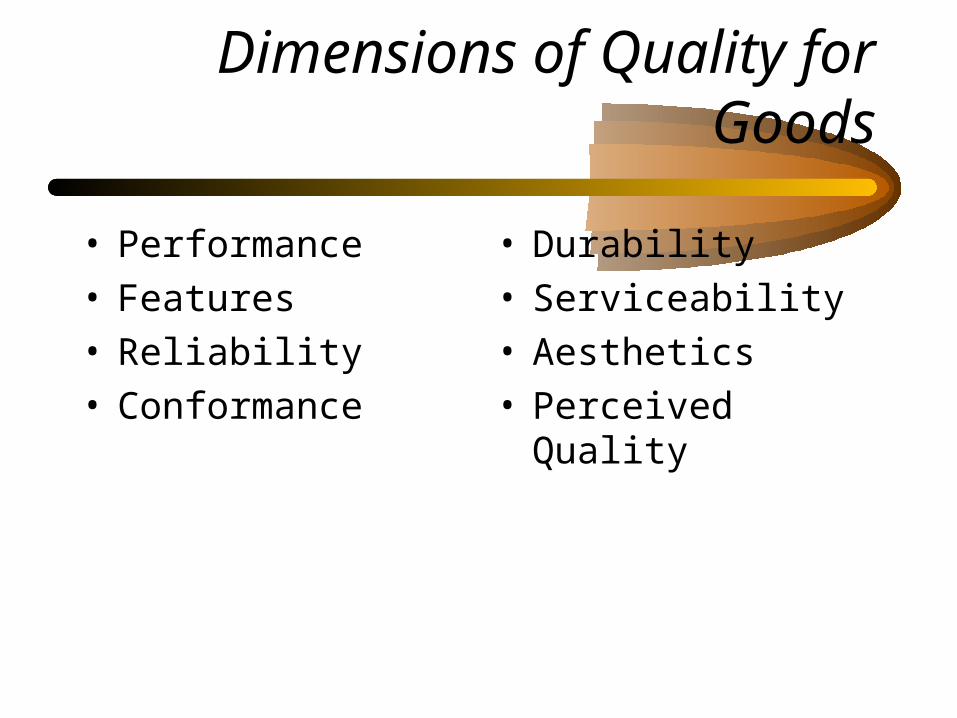
Dimensions of Quality for Goods
• Performance• Features• Reliability• Conformance
• Durability• Serviceability• Aesthetics• Perceived Quality
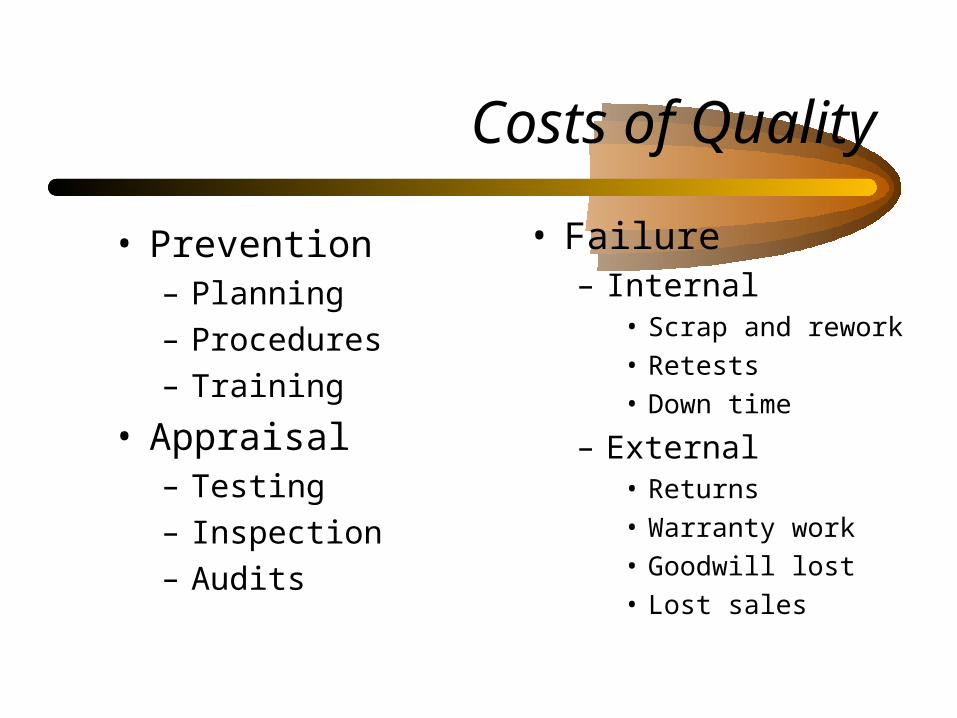
Costs of Quality
• Prevention– Planning
– Procedures
– Training
• Appraisal– Testing
– Inspection
– Audits
• Failure– Internal
• Scrap and rework
• Retests
• Down time
– External• Returns
• Warranty work
• Goodwill lost
• Lost sales
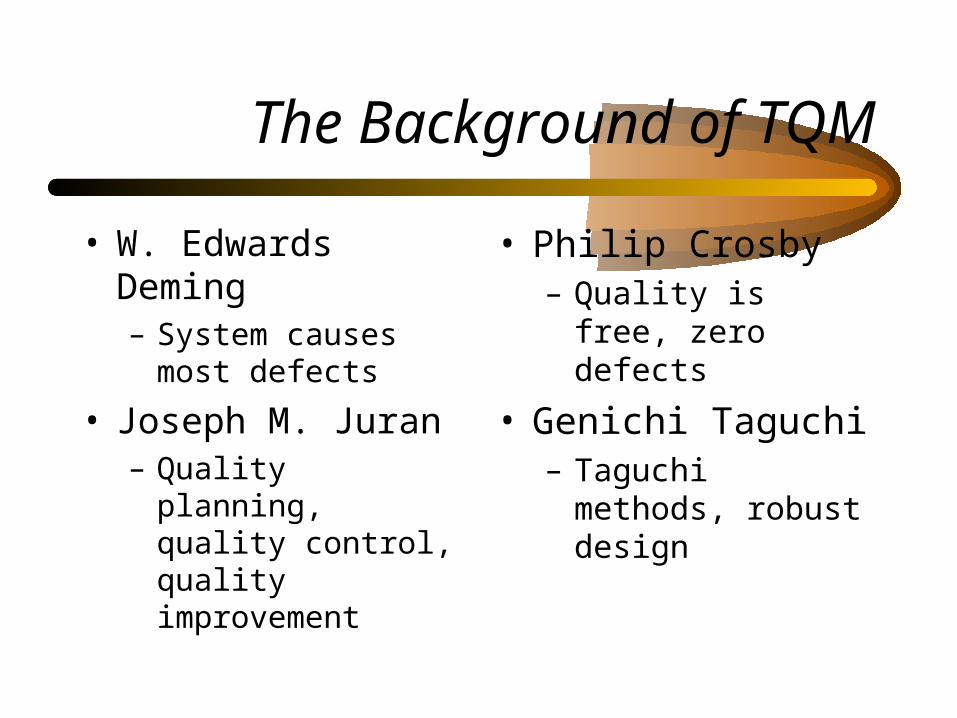
The Background of TQM
• W. Edwards Deming– System causes most
defects
• Joseph M. Juran– Quality planning,
quality control, quality improvement
• Philip Crosby– Quality is free, zero
defects
• Genichi Taguchi– Taguchi methods,
robust design

Components of TQM
• Focus on the customer
• Everyone responsible for quality
• Team problem solving
• Employee training
• Fact-based management
• Philosophy of continuous improvement

Components ofContinuous Improvement
• Standardize and document procedures
• Assign teams to identify areas for improvement
• Use methods analysis and problem-solving tools
• Use the Plan-Do-Check-Act cycle
• Document improved procedures
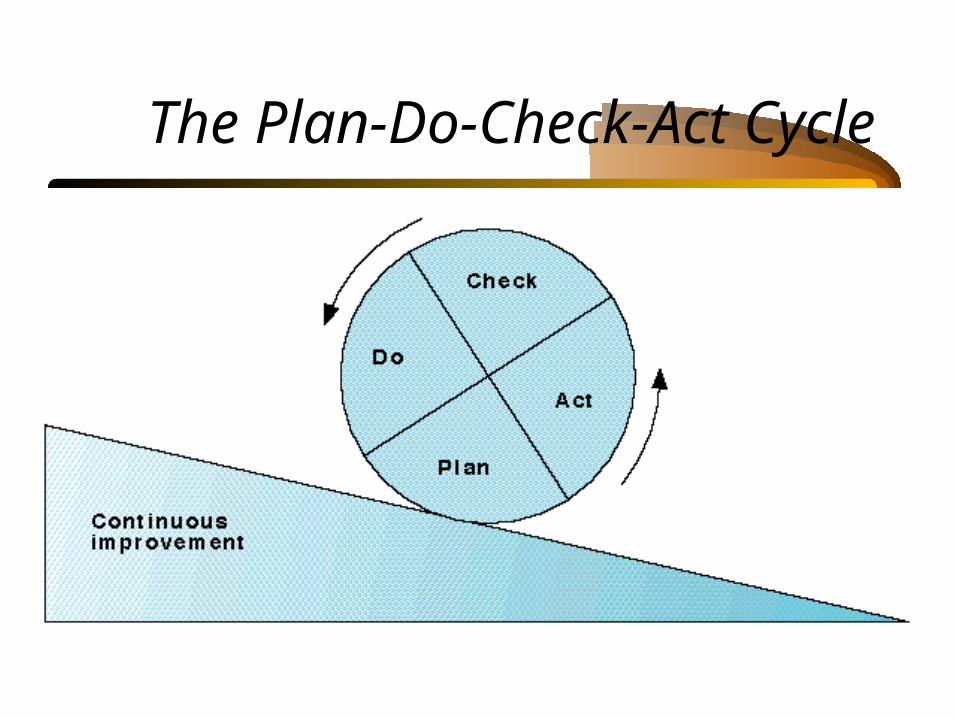
The Plan-Do-Check-Act Cycle

Baldridge Award
• Baldridge Award Criteria for 00
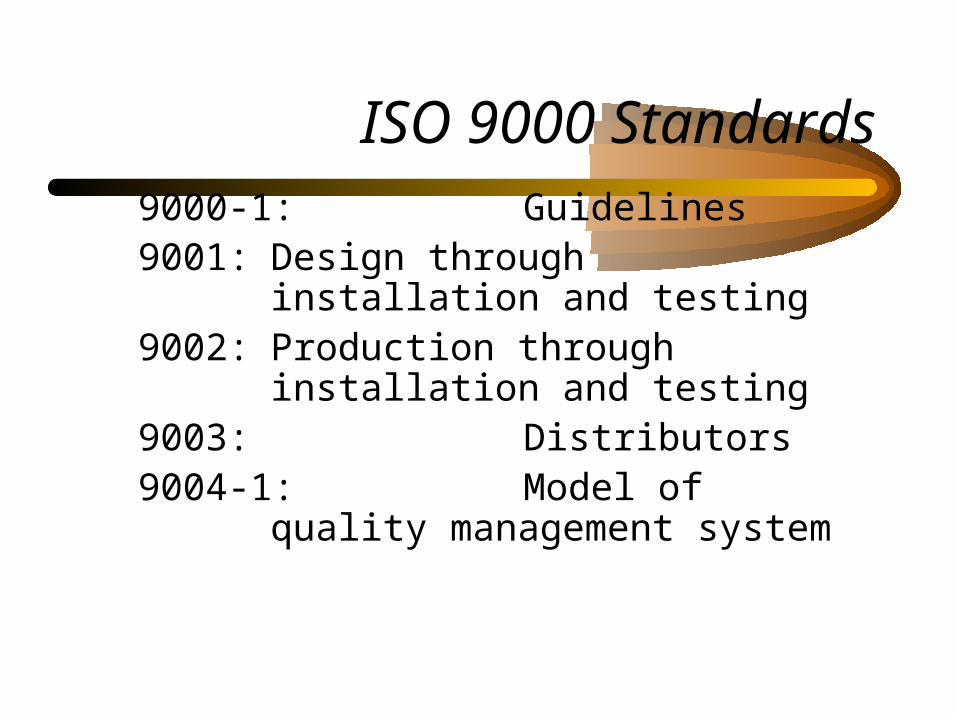
ISO 9000 Standards
9000-1: Guidelines9001: Design through installation and
testing9002: Production through installation
and testing9003: Distributors9004-1: Model of quality management
system
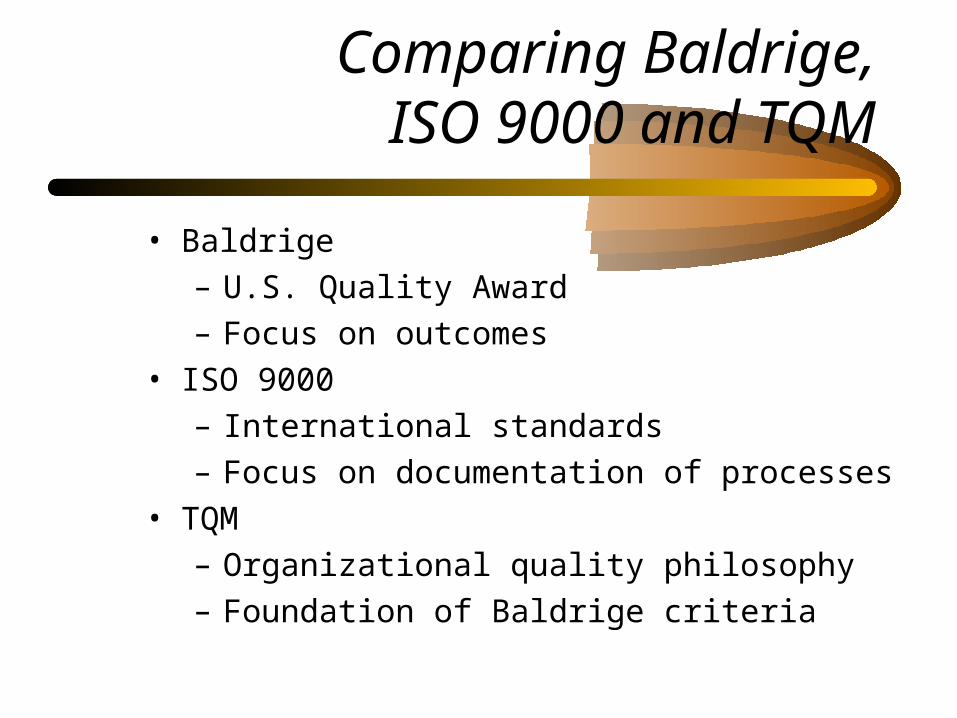
Comparing Baldrige,ISO 9000 and TQM
• Baldrige
– U.S. Quality Award
– Focus on outcomes
• ISO 9000
– International standards
– Focus on documentation of processes
• TQM
– Organizational quality philosophy
– Foundation of Baldrige criteria

Chapter 11 – Part IIChapter 11 – Part IIQuality Control Quality Control
COB 300 C - The Operations DimensionCOB 300 C - The Operations Dimension
BusingBusing
Causes of Variation
• Random Causes
– difficult or expensive to control
– e.g., outside humidity, line voltage
• Assignable Causes
– easier to correct
– e.g., employee error, new materials

Comparing Process Variation to Tolerance Limits

High Process Capability After Technological Process Change

Control Charts• Variables - concentrates on mean for some
measurable characteristic.– diameter
– length
• Attribute - data is based on counts or the number of times we observe a particular event.– proportion defective/non-defective
– go/no go
– proportion pass/fail

Control Limits - Variables Charts
X-Bar Chart
R Chart
UCLx x 3
LCLx x 3
X A R2
UCL D RR 4
LCL D RR 3
X A R2

Variables Control Chart Examples: Compute the 3 control charts for X and R from 15 samples of
size n=3. Plot the control limits and the Xand R values and comment about the underlying process.
Sample OBSERVED DIMENSIONS (cm)1 4.843 4.863 4.8592 4.925 4.882 4.8913 4.866 4.914 4.8734 4.852 4.883 4.885 4.92 4.884 4.8216 4.915 4.902 4.8987 4.887 4.892 4.8588 4.868 4.888 4.8429 4.904 4.863 4.86610 4.921 4.92 4.89411 4.914 4.884 4.89912 4.892 4.896 4.88713 4.866 4.829 4.8814 4.85 4.875 4.87215 4.867 4.9 4.885

Variables Control Chart Examples: Compute the 3 control charts for X and R from 15 samples of size n=3. Plot the control limits and the
Xand R values and comment about the underlying process.
Sample OBSERVED DIMENSIONS (cm) mean range1 4.843 4.863 4.859 4.855 0.0202 4.925 4.882 4.891 4.899 0.0433 4.866 4.914 4.873 4.884 0.0484 4.852 4.883 4.88 4.872 0.0315 4.92 4.884 4.821 4.875 0.0996 4.915 4.902 4.898 4.905 0.0177 4.887 4.892 4.858 4.879 0.0348 4.868 4.888 4.842 4.866 0.0469 4.904 4.863 4.866 4.878 0.041
10 4.921 4.92 4.894 4.912 0.02711 4.914 4.884 4.899 4.899 0.03012 4.892 4.896 4.887 4.892 0.00913 4.866 4.829 4.88 4.858 0.05114 4.85 4.875 4.872 4.866 0.02515 4.867 4.9 4.885 4.884 0.033
4.882 0.037

Factors for Control Limits(Slide 1 of 2)
23456789
10
1.8801.0230.7290.5770.4830.4190.3730.3370.308
000000.0760.1360.1840.223
3.2682.5742.2822.1142.0041.9241.8641.8161.777
n A2 D3 D4
Sample of Size

844.4)037(.023.1882.4
920.4)037(.023.1882.4
x
x
LCL
UCL
x-bar Chart Example (cont’d)
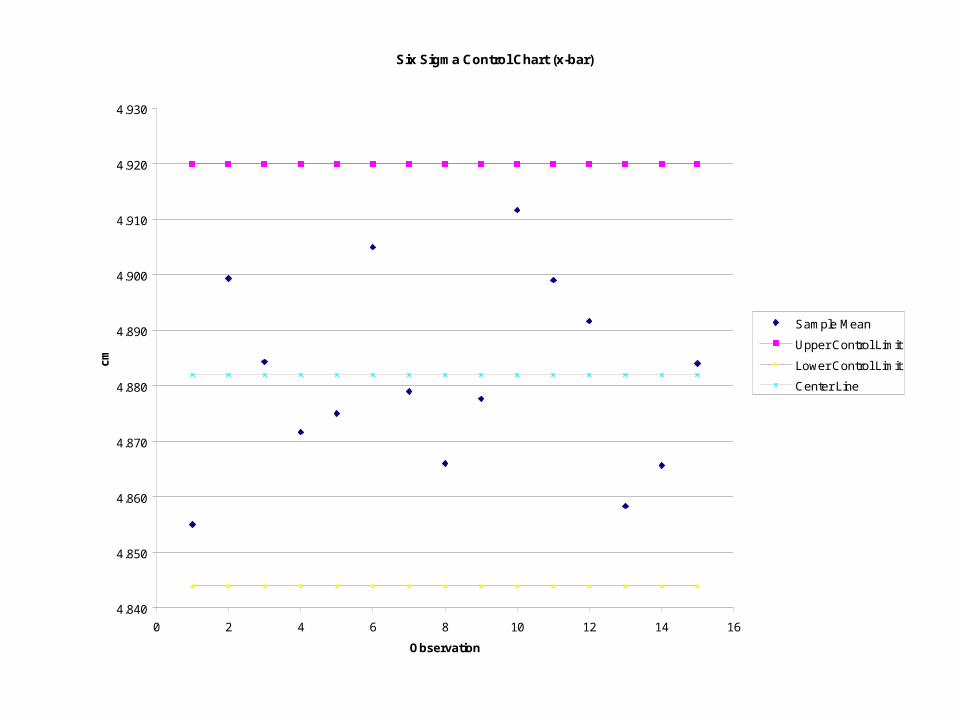
Six Sigma Control Chart (x-bar)
4.840
4.850
4.860
4.870
4.880
4.890
4.900
4.910
4.920
4.930
0 2 4 6 8 10 12 14 16
Observation
cm
Sample Mean
Upper Control Limit
Lower Control Limit
Center Line

Range Chart
0951.037.57.24 RD
0037.03 RD

Range Example
0
0.02
0.04
0.06
0.08
0.1
0.12
0 2 4 6 8 10 12 14 16
Sample Number
ran
ge
(cm
) Upper Control Limit
Center Line
Lower Control Limit
Sample Range

Warning Conditions
• Two successive points near limit
• Run of five above or below mean
• Trend
• Erratic behavior

Process Control for AttributesProportion defective:
Number of defects per unit:
pp p
n
( )1
UCL p
LCL p
p p
p p
3
3
UCL cc c 3LCL cc c 3
c c

P-Chart
0
0.02
0.04
0.06
0.08
0.1
0.12
0.14
1 2 3 4 5 6 7 8 9 10 11 12 13 14 15 16 17 18 19 20
observation
pro
po
rtio
n d
efe
cti
ve
observation proportion defective
lower control limit
center line
upper control limit

Homework
• Chapter 11 – 4, 8, 9
Related Documents