Intermolecular Forces © 2009, Prentice-Hall, Inc. Adapted from Chapter 11 Intermolecular Forces; Liquids, and Solids John D. Bookstaver St. Charles Community College Cottleville, MO Chemistry, The Central Science, 11th edition Theodore L. Brown, H. Eugene LeMay, Jr., and Bruce E. Bursten

Welcome message from author
This document is posted to help you gain knowledge. Please leave a comment to let me know what you think about it! Share it to your friends and learn new things together.
Transcript

IntermolecularForces
© 2009, Prentice-Hall, Inc.
Adapted from Chapter 11Intermolecular Forces;
Liquids, and Solids
John D. BookstaverSt. Charles Community College
Cottleville, MO
Chemistry, The Central Science, 11th editionTheodore L. Brown, H. Eugene LeMay, Jr.,
and Bruce E. Bursten
IntermolecularForces
© 2009, Prentice-Hall, Inc.
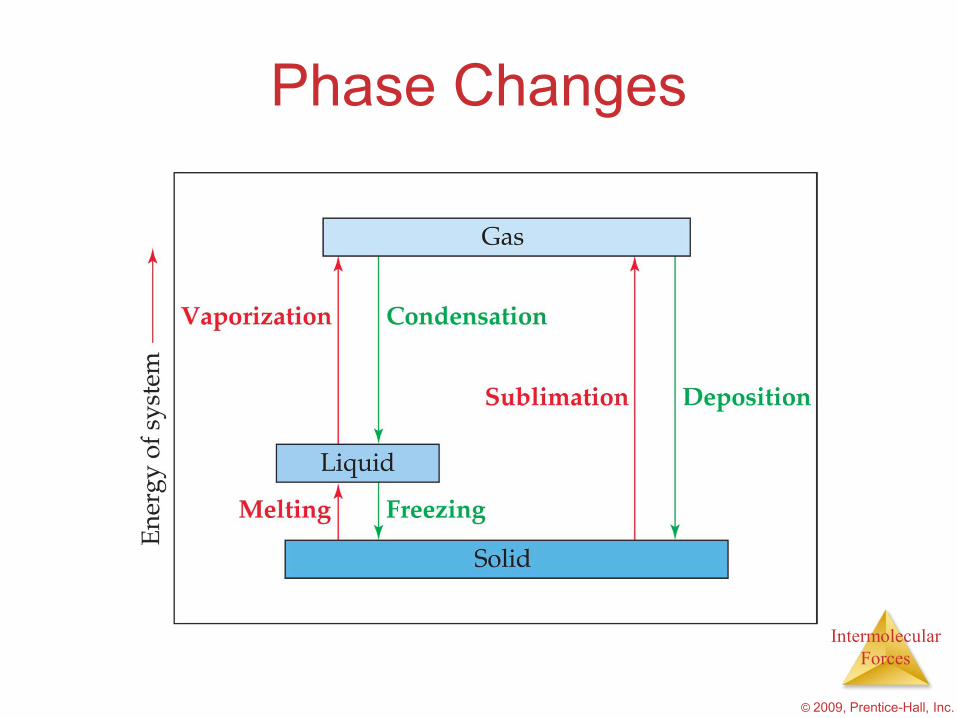
Phase Changes
IntermolecularForces
© 2009, Prentice-Hall, Inc.
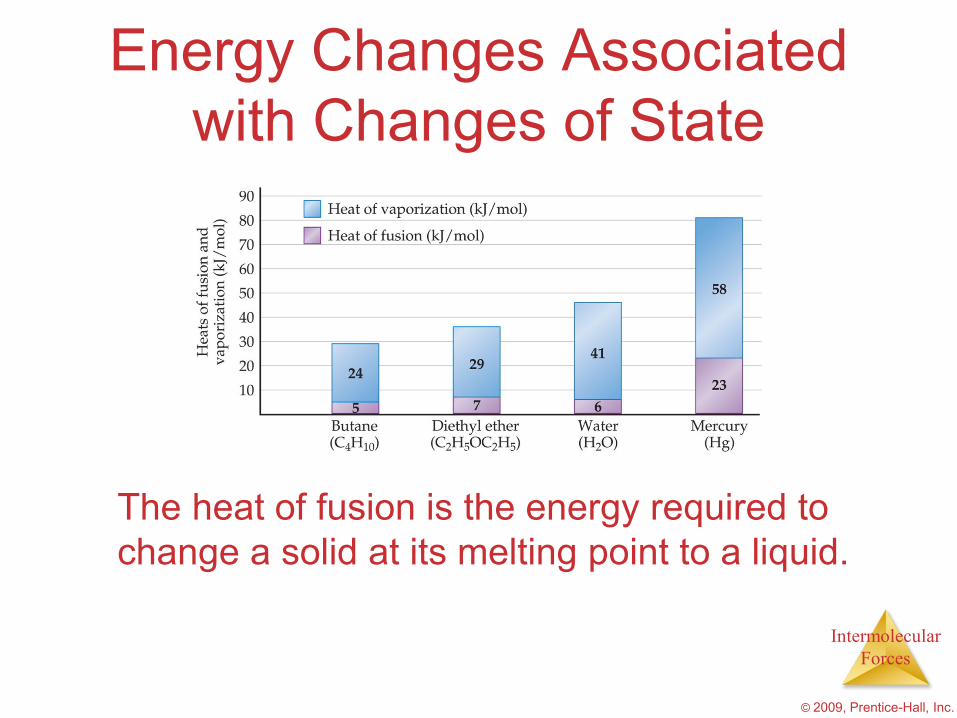
Energy Changes Associated with Changes of State
The heat of fusion is the energy required to change a solid at its melting point to a liquid.
IntermolecularForces
© 2009, Prentice-Hall, Inc.
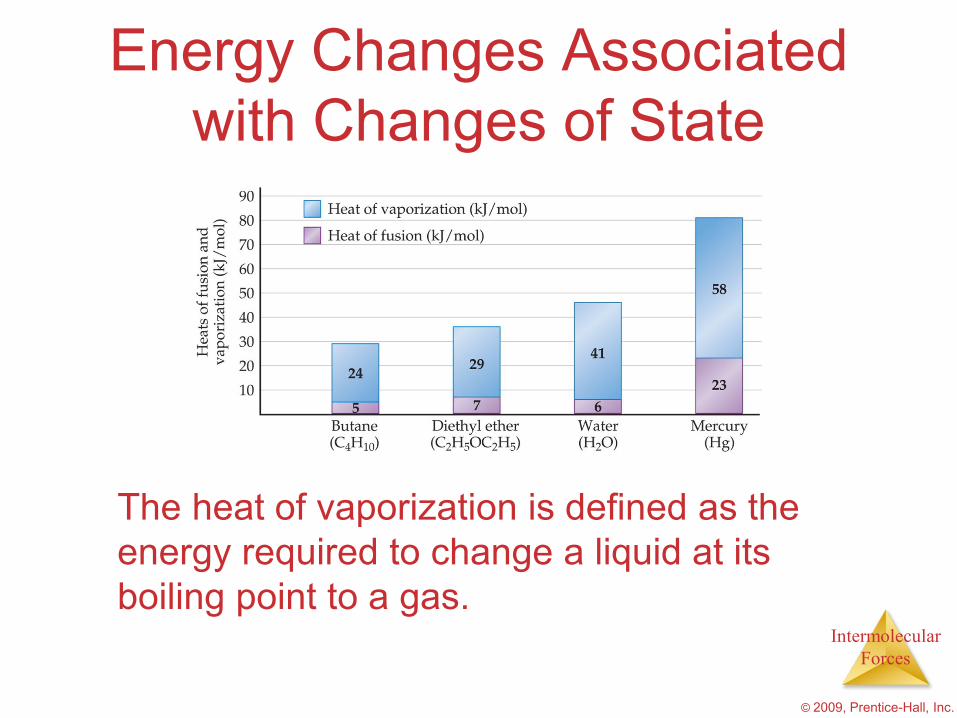
Energy Changes Associated with Changes of State
The heat of vaporization is defined as the energy required to change a liquid at its boiling point to a gas.
IntermolecularForces
© 2009, Prentice-Hall, Inc.
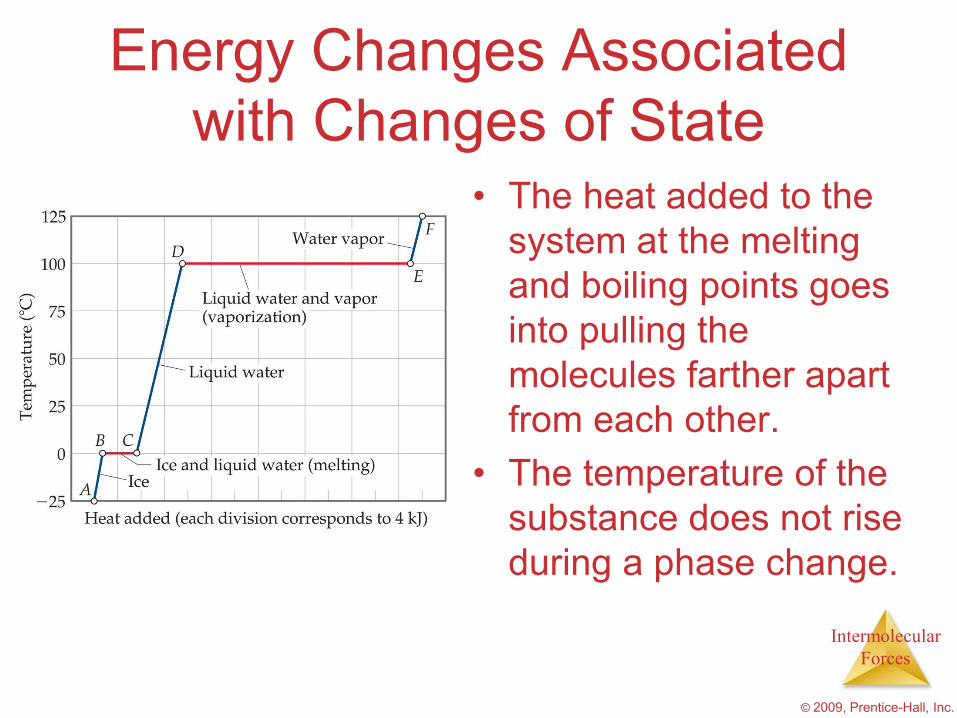
Energy Changes Associated with Changes of State
• The heat added to the system at the melting and boiling points goes into pulling the molecules farther apart from each other.
• The temperature of the substance does not rise during a phase change.
IntermolecularForces
© 2009, Prentice-Hall, Inc.
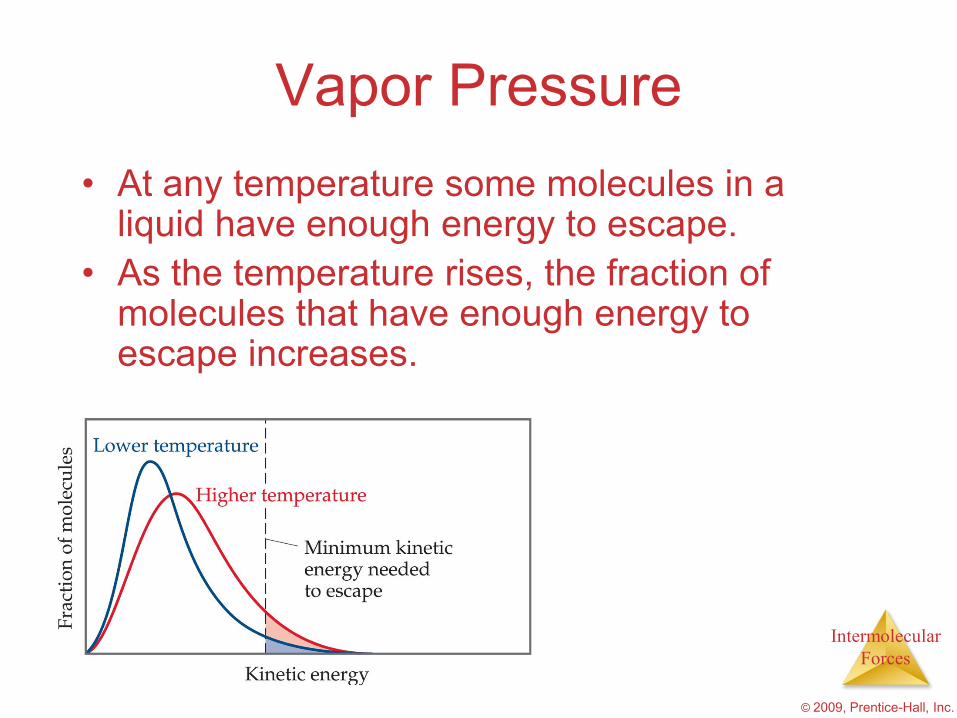
Vapor Pressure• At any temperature some molecules in a
liquid have enough energy to escape.• As the temperature rises, the fraction of
molecules that have enough energy to escape increases.
IntermolecularForces
© 2009, Prentice-Hall, Inc.
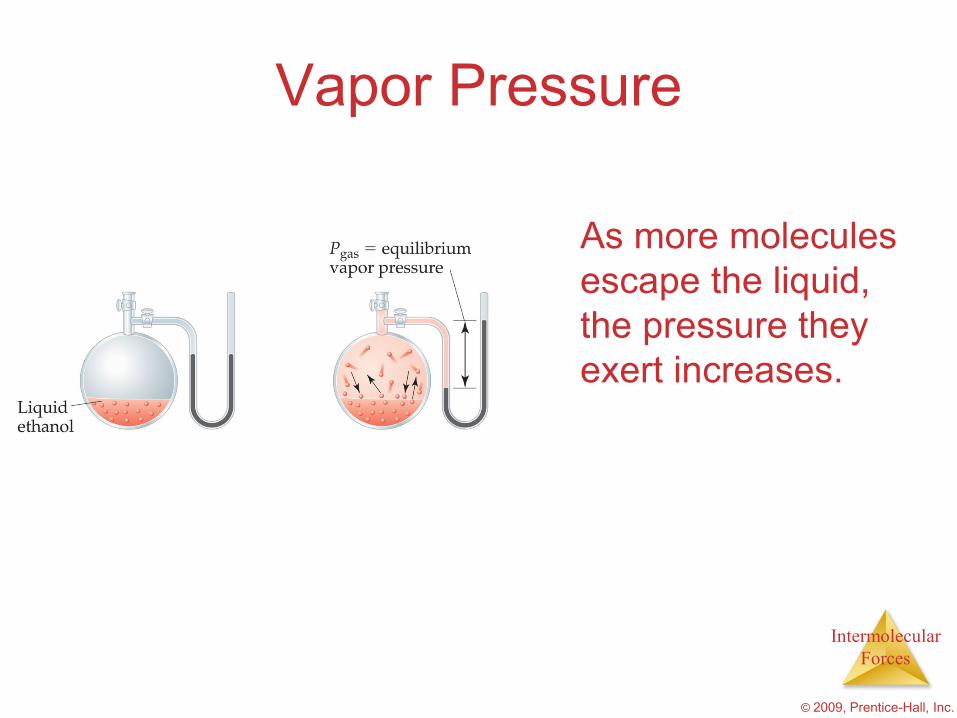
Vapor Pressure
As more molecules escape the liquid, the pressure they exert increases.

IntermolecularForces
© 2009, Prentice-Hall, Inc.
Vapor Pressure
The liquid and vapor reach a state of dynamic equilibrium: liquid molecules evaporate and vapor molecules condense at the same rate.
IntermolecularForces
© 2009, Prentice-Hall, Inc.
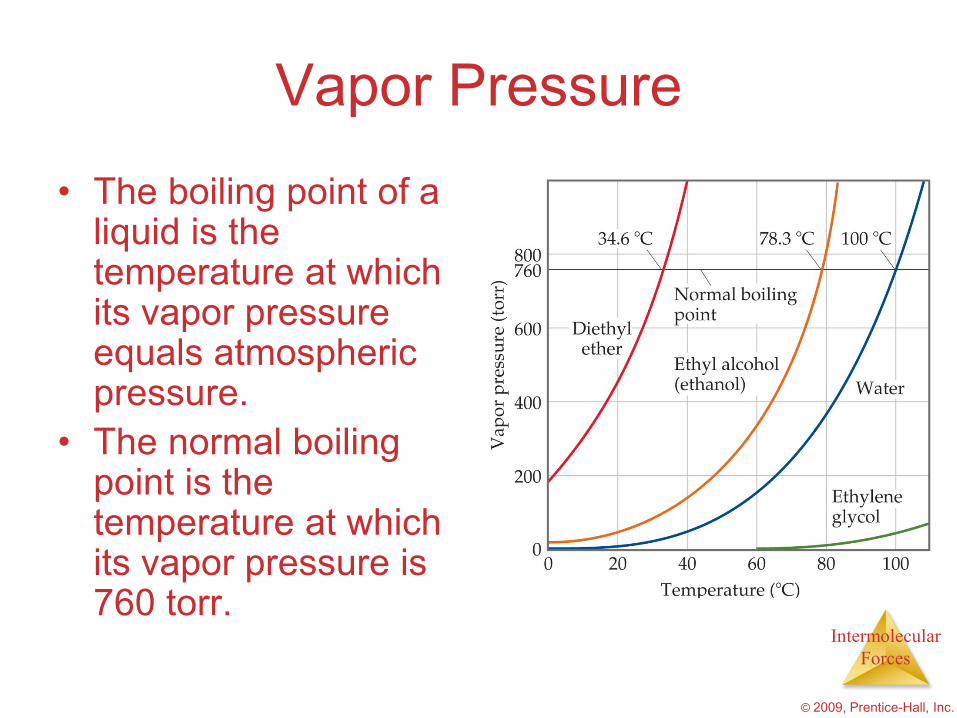
Vapor Pressure• The boiling point of a
liquid is the temperature at which its vapor pressure equals atmospheric pressure.
• The normal boiling point is the temperature at which its vapor pressure is 760 torr.
IntermolecularForces
© 2009, Prentice-Hall, Inc.
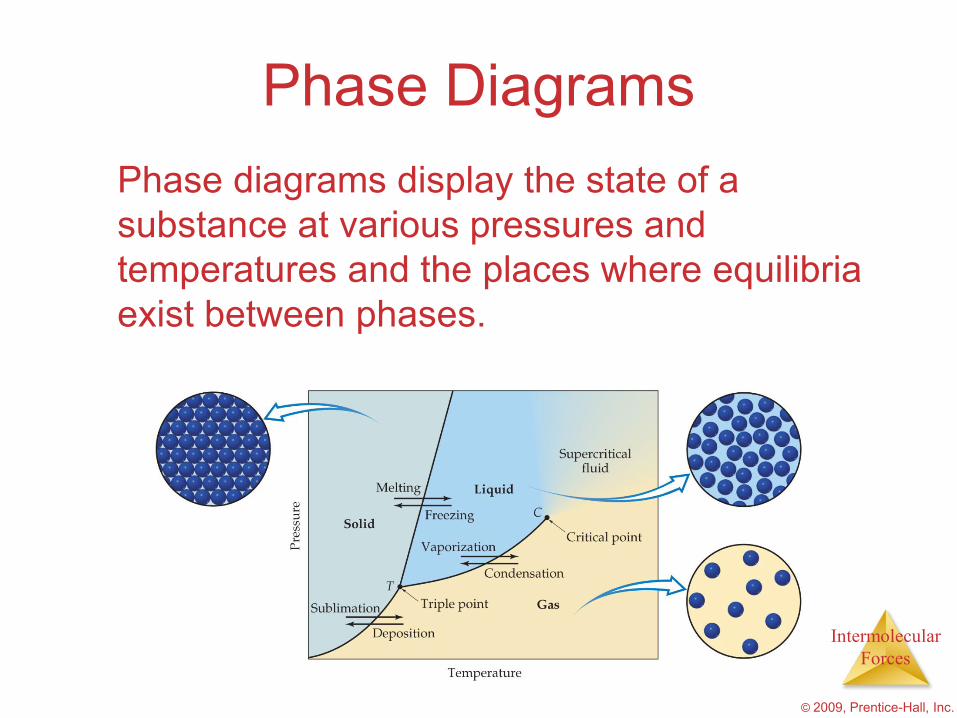
Phase DiagramsPhase diagrams display the state of a substance at various pressures and temperatures and the places where equilibria exist between phases.

IntermolecularForces
© 2009, Prentice-Hall, Inc.
Phase Diagrams• The circled line is the liquid-vapor interface.• It starts at the triple point (T), the point at
which all three states are in equilibrium.

IntermolecularForces
© 2009, Prentice-Hall, Inc.
Phase DiagramsIt ends at the critical point (C); above this critical temperature and critical pressure the liquid and vapor are indistinguishable from each other.
IntermolecularForces
© 2009, Prentice-Hall, Inc.
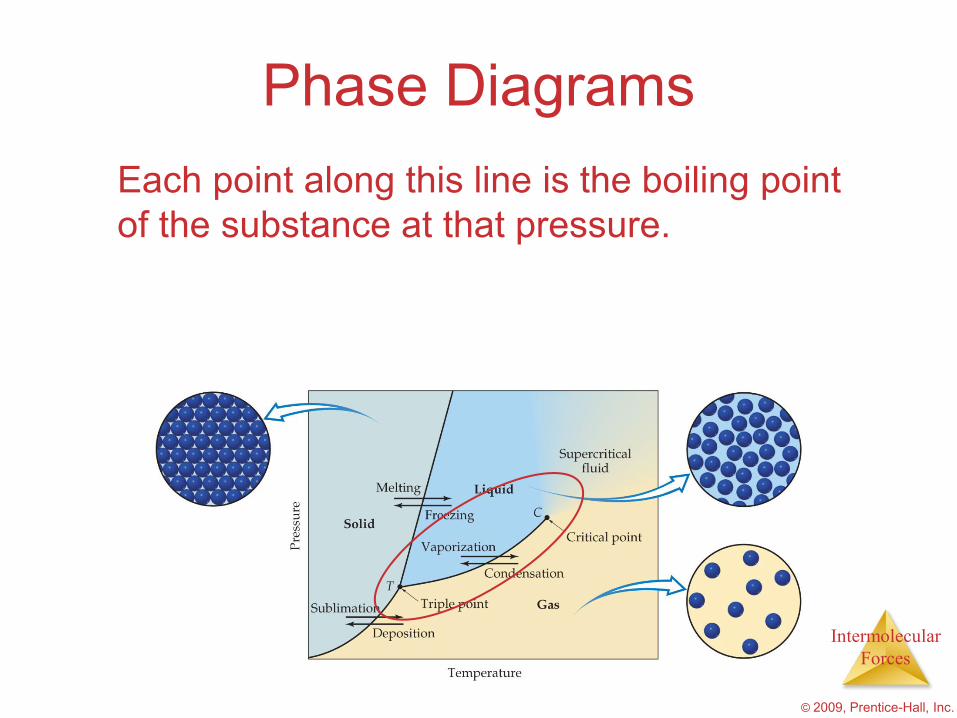
Phase DiagramsEach point along this line is the boiling point of the substance at that pressure.
IntermolecularForces
© 2009, Prentice-Hall, Inc.
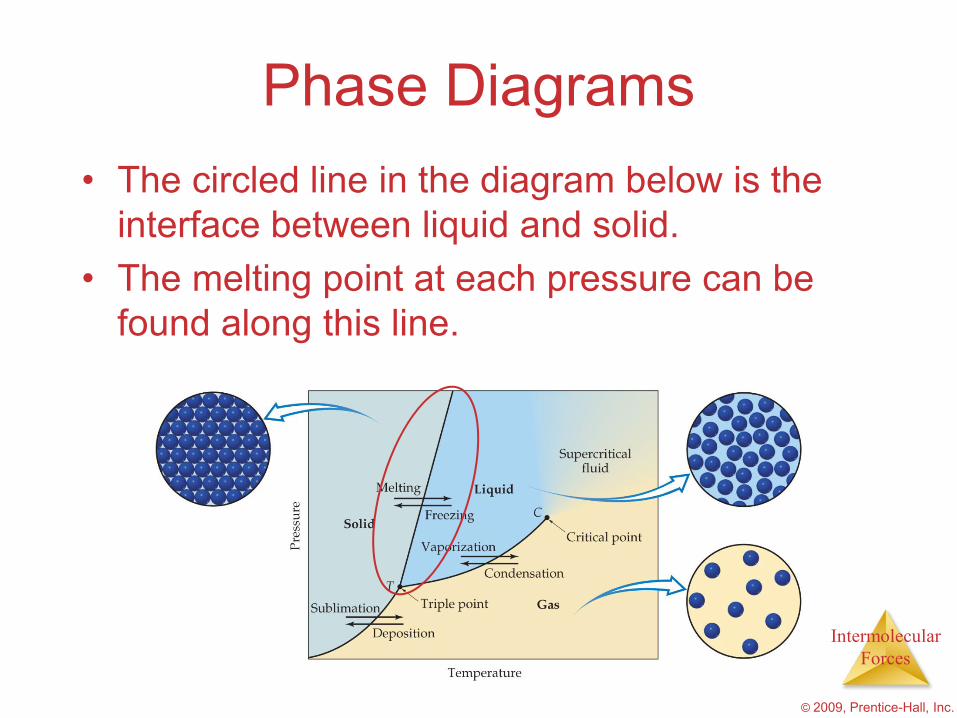
Phase Diagrams• The circled line in the diagram below is the
interface between liquid and solid.• The melting point at each pressure can be
found along this line.

IntermolecularForces
© 2009, Prentice-Hall, Inc.
Phase Diagrams• Below the triple point the substance cannot
exist in the liquid state.• Along the circled line the solid and gas
phases are in equilibrium; the sublimation point at each pressure is along this line.

IntermolecularForces
© 2009, Prentice-Hall, Inc.
Phase Diagram of Water• Note the high critical
temperature and critical pressure.– These are due to the
strong van der Waals forces between water molecules.

IntermolecularForces
© 2009, Prentice-Hall, Inc.
Phase Diagram of Water• The slope of the solid-
liquid line is negative.– This means that as the
pressure is increased at a temperature just below the melting point, water goes from a solid to a liquid.

IntermolecularForces
© 2009, Prentice-Hall, Inc.
Phase Diagram of Carbon Dioxide
Carbon dioxide cannot exist in the liquid state at pressures below 5.11 atm; CO2sublimes at normal pressures.
Related Documents


