Chapter 10: Graphic Organizers Veronica Lugo Nereida Antunez

Chapter 10 presentation graphic organizers
Jul 11, 2015
Welcome message from author
This document is posted to help you gain knowledge. Please leave a comment to let me know what you think about it! Share it to your friends and learn new things together.
Transcript
Chapter 10:Graphic Organizers
Veronica LugoNereida Antunez
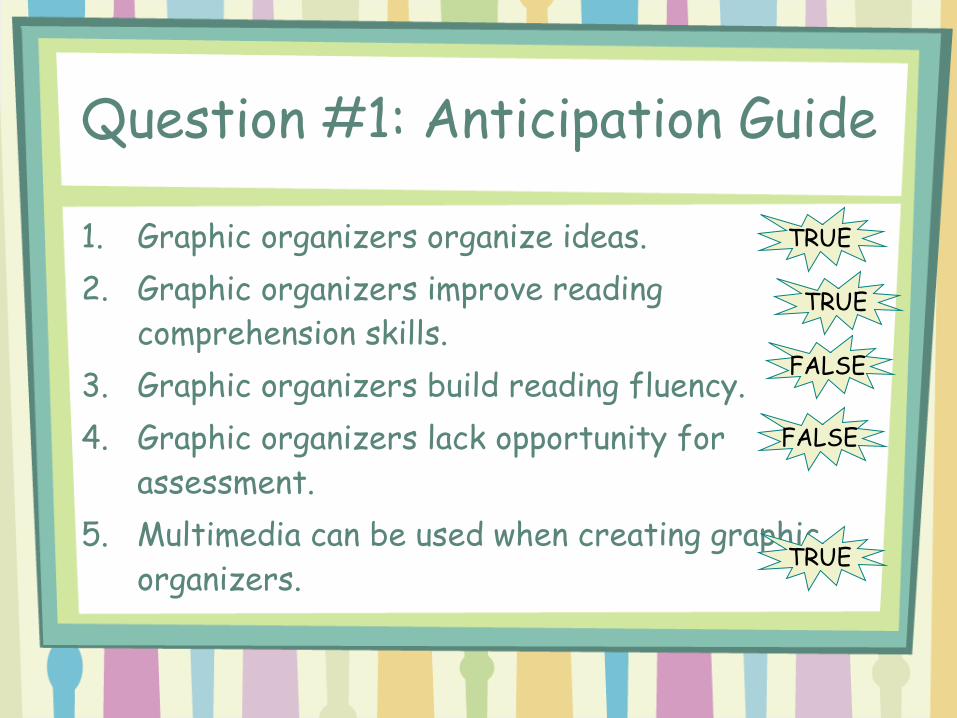
Question #1: Anticipation Guide
1. Graphic organizers organize ideas.2. Graphic organizers improve reading
comprehension skills.3. Graphic organizers build reading fluency.4. Graphic organizers lack opportunity for
assessment.5. Multimedia can be used when creating graphic
organizers.
TRUE
TRUE
FALSE
TRUE
FALSE
Graphic Organizers
• Models that form a visual representation of concepts and ideas
• Lead to a more meaningful learning experience at various levels
• Provide displays of relationships among and between elements.
Other Names Include…
• Concept Maps
• Mind Maps
• Advance Organizers
• Mental Models
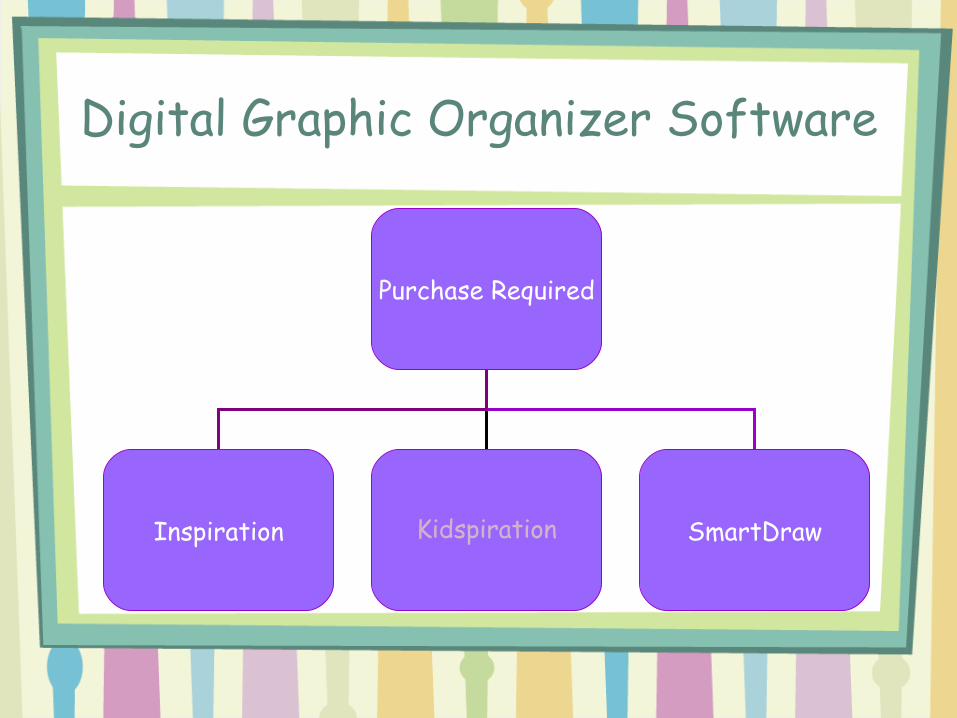
Digital Graphic Organizer Software
Purchase Required
Inspiration Kidspiration SmartDraw
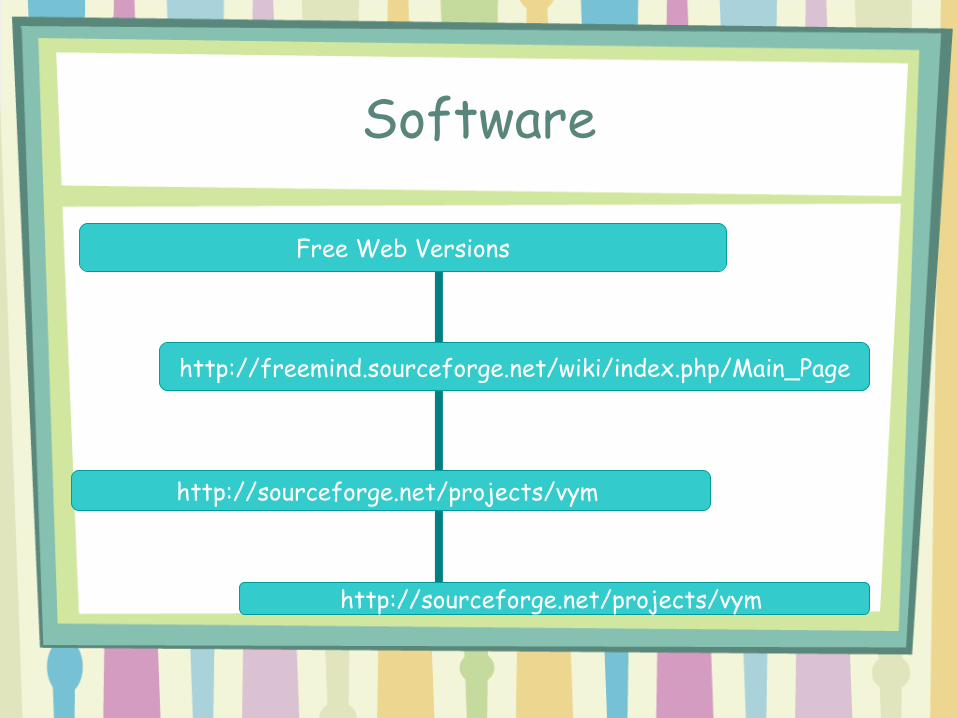
Software
http://freemind.sourceforge.net/wiki/index.php/Main_Page
Free Web Versions
http://sourceforge.net/projects/vym
http://sourceforge.net/projects/vym
Basic Functions
• Insert graphics• Add text• Create links• Insert/record sound and narrations• Generate outlines• Organize graphics, text, and links
Question #2
What are the differences/similarities
between paper-based and digital graphic organizers?
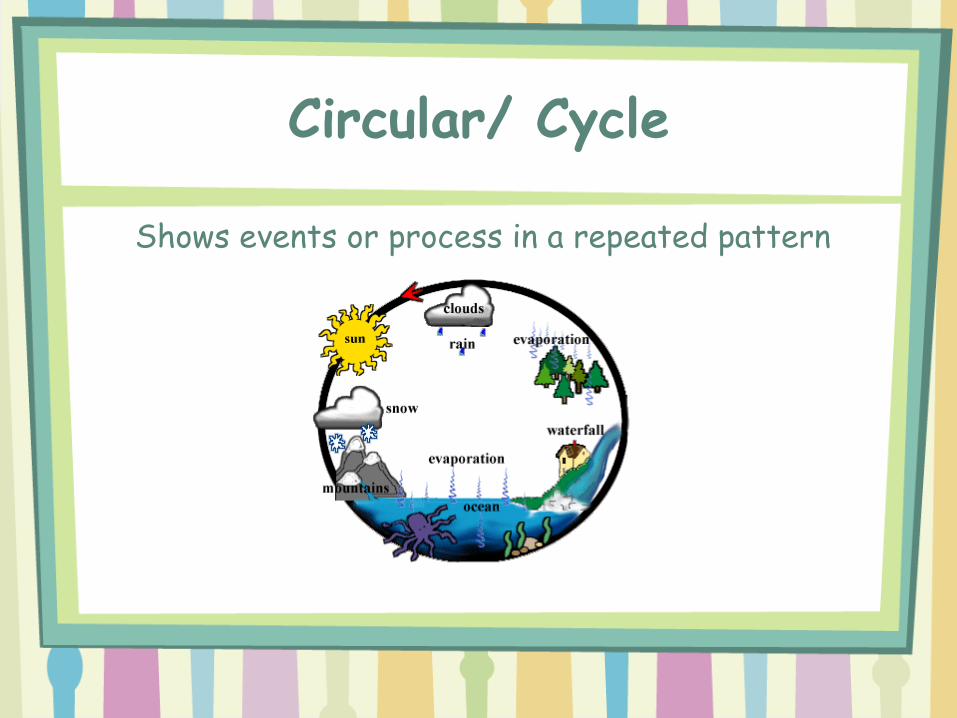
Circular/ Cycle
Shows events or process in a repeated pattern
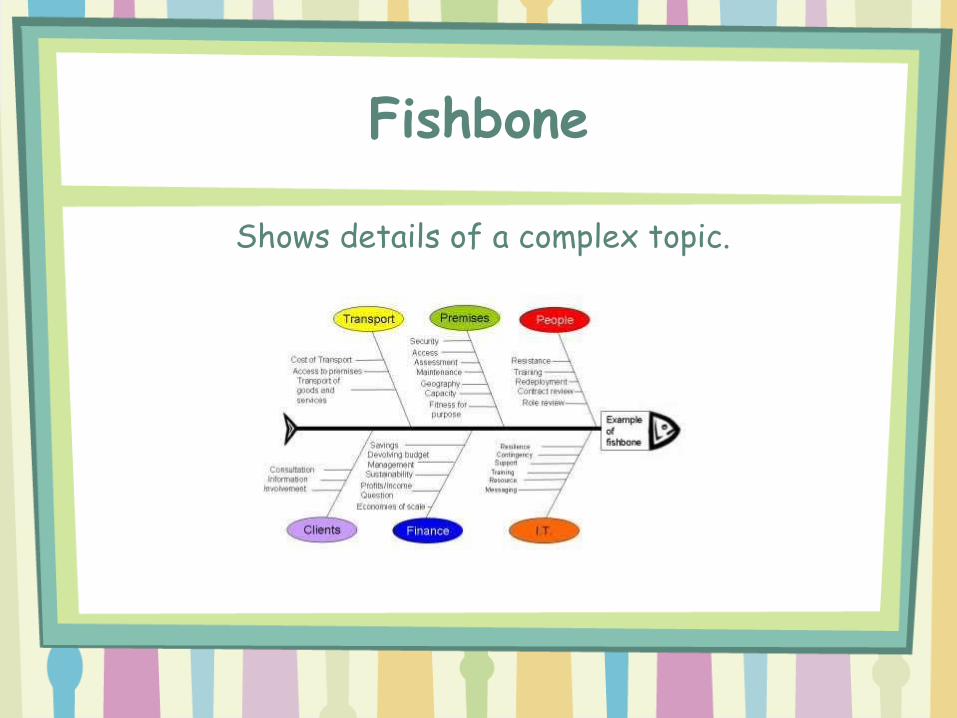
Fishbone
Shows details of a complex topic.
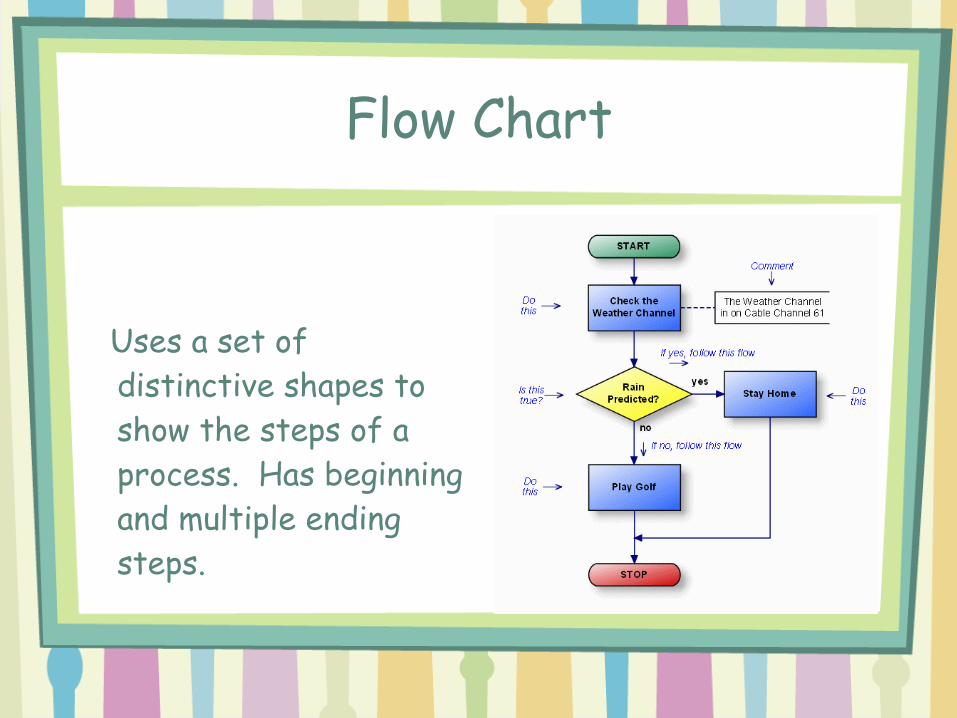
Flow Chart
Uses a set of distinctive shapes to show the steps of a process. Has beginning and multiple ending steps.
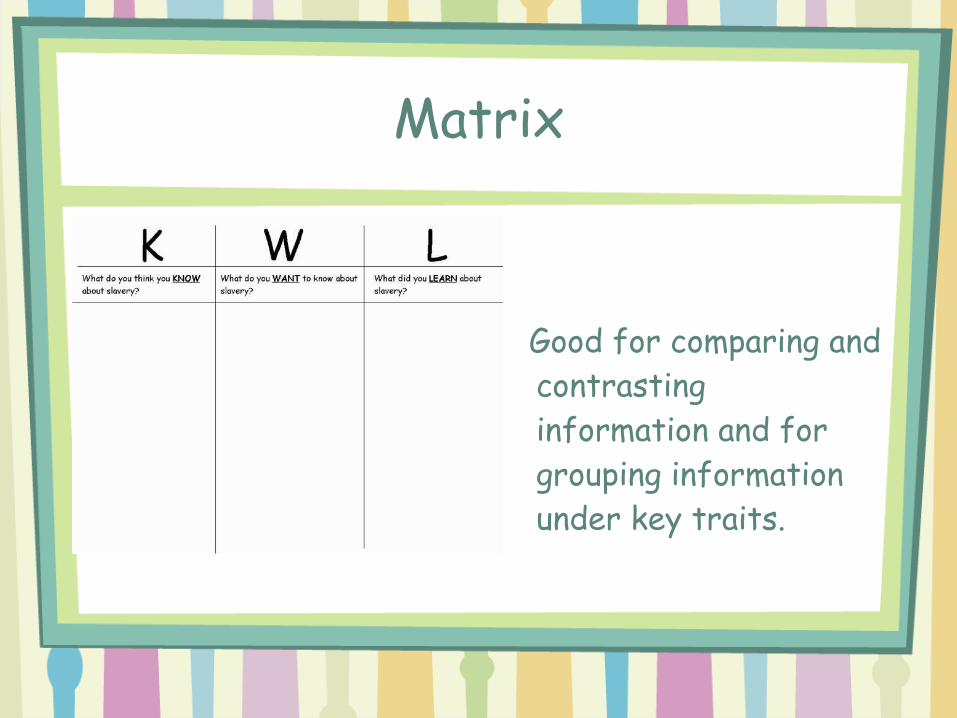
Matrix
Good for comparing and
contrasting information and for grouping information under key traits.
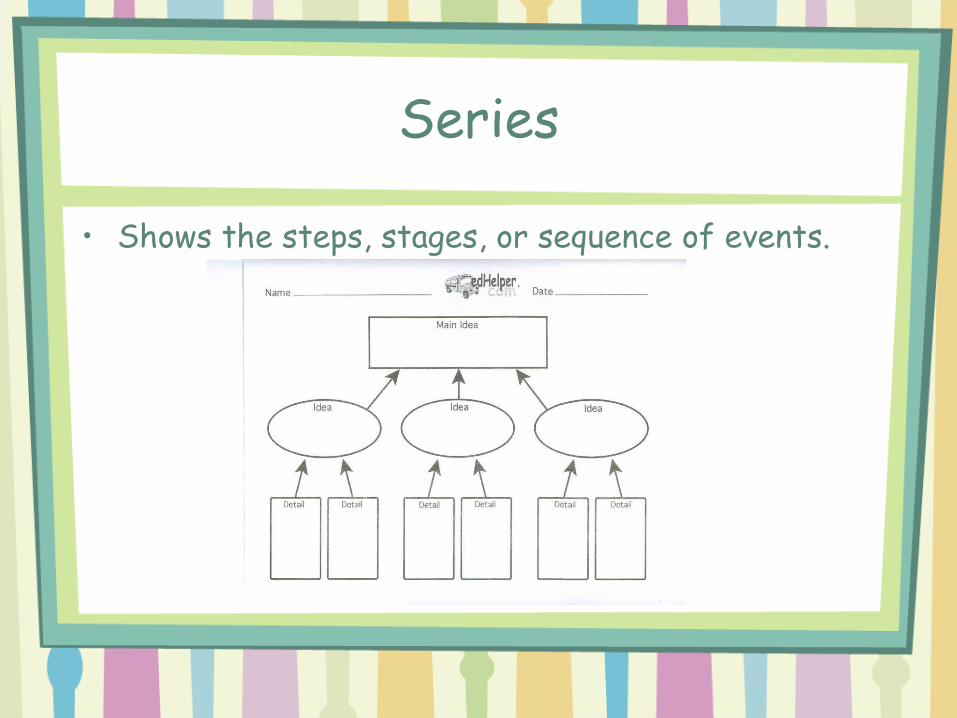
Series
• Shows the steps, stages, or sequence of events.
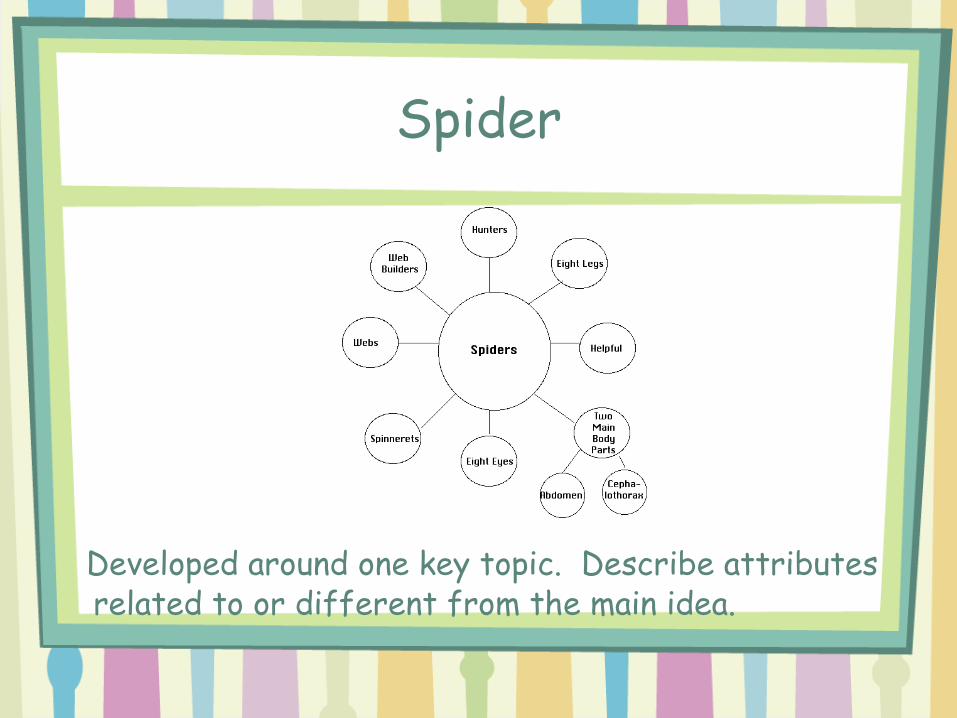
Spider
Developed around one key topic. Describe attributes related to or different from the main idea.
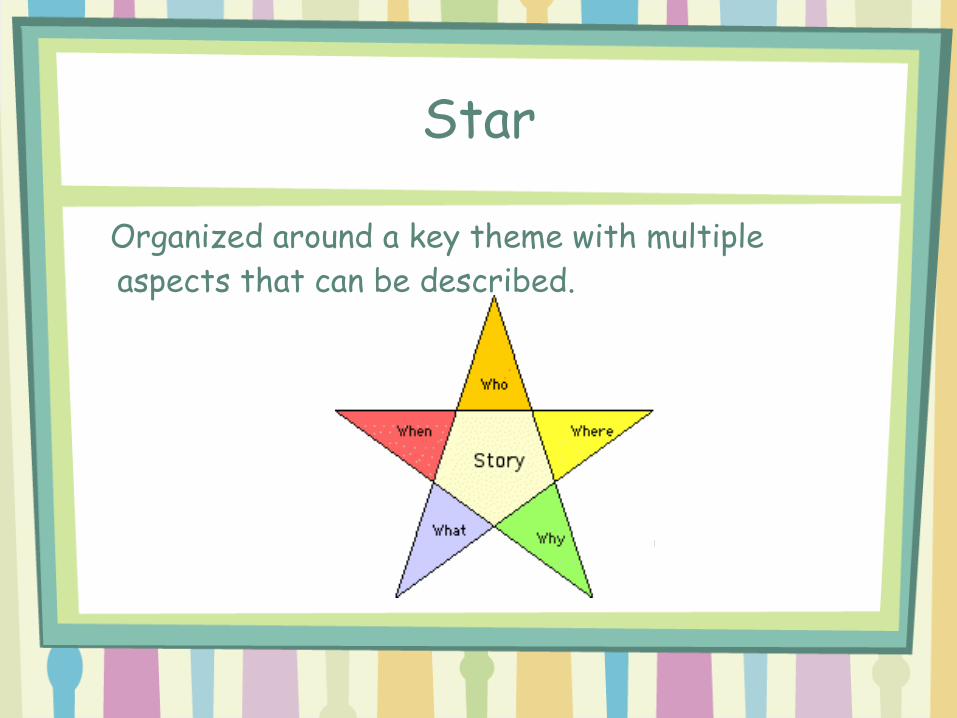
Star
Organized around a key theme with multiple aspects that can be described.
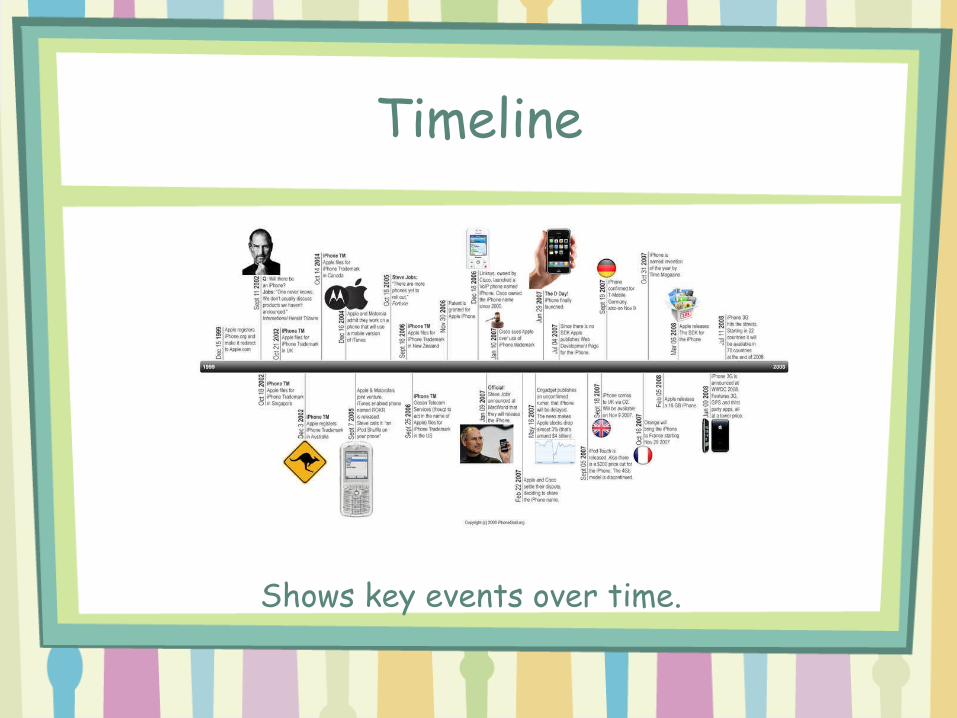
Timeline
Shows key events over time.
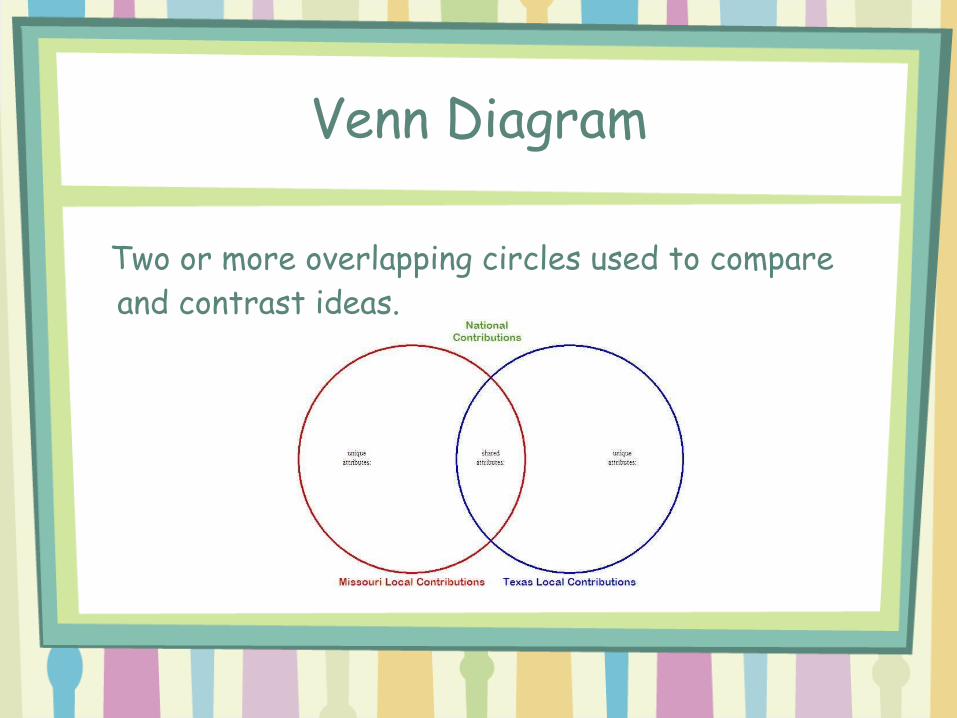
Venn Diagram
Two or more overlapping circles used to compare and contrast ideas.
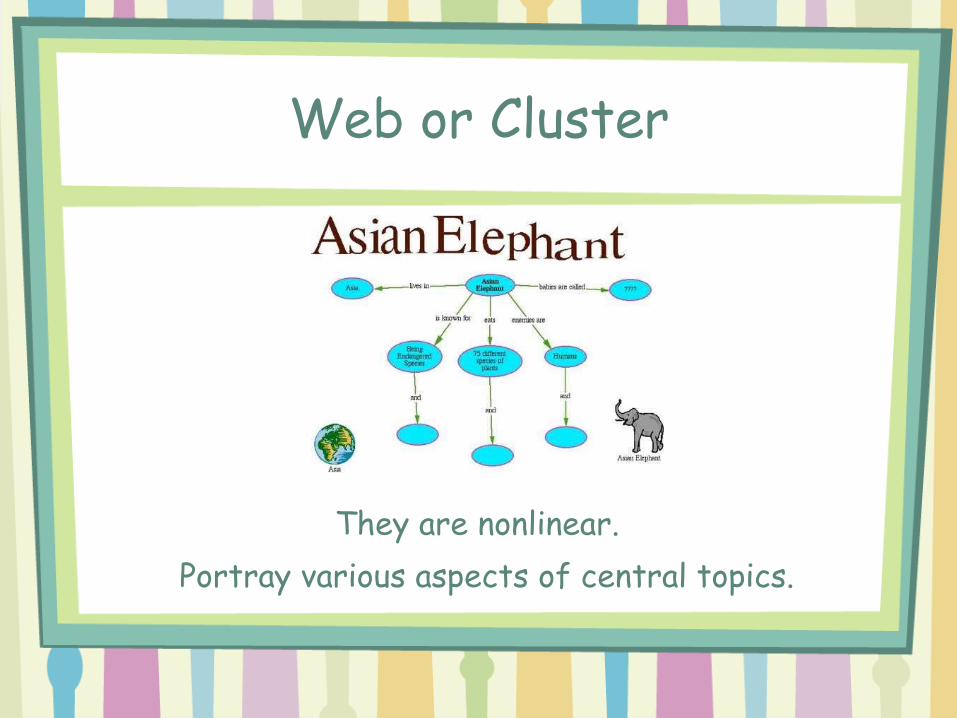
Web or Cluster
They are nonlinear. Portray various aspects of central topics.
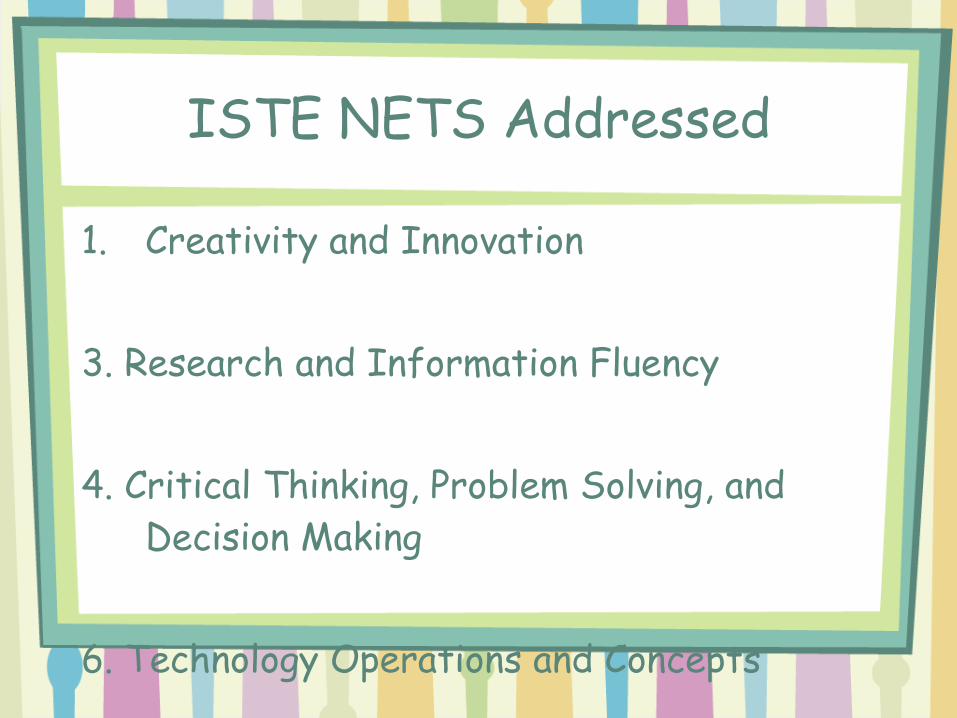
ISTE NETS Addressed
1. Creativity and Innovation
3. Research and Information Fluency
4. Critical Thinking, Problem Solving, and Decision Making
6. Technology Operations and Concepts
Question #3
What new knowledge did you acquire about graphic
organizers and how will you use it in your classroom?
Activity!
1. Select a card2. Choose one of the four suggestions.3. Create the type of graphic organizer
shown on your card that reflects the content area you selected.
4. Have Fun! Be Creative! Share!
Related Documents