173 Chapter 10 Groundwater Models of the Gulf Coast Aquifer of Texas Ali H. Chowdhury, Ph.D., P.G. 1 , and Robert E. Mace, Ph.D., P.G. 1 Introduction Models of groundwater flow are useful for better understanding aquifers and, ultimately, for better managing groundwater resources. Groundwater models allow hydrogeologists and engineers to bring available information and estimates on aquifers together to see how this information interacts with itself. Once a model is developed, it can be used to predict how water levels in the aquifer might respond to pumping and drought. For the Gulf Coast area, land subsidence, where the sediments compress in response to pumping groundwater, is another concern that groundwater models can be used to predict. Groundwater modeling in Texas has had a long history (Mace, 2001) that starts with an electric analog model developed for the Gulf Coast aquifer in the Houston area in 1965 and continues today as our understanding of the aquifer and the development of modeling tools improve. The Texas Legislature approved funding for the Groundwater Availability Modeling (GAM) program at the Texas Water Development Board (TWDB) in recognition of the importance of obtaining accurate estimations of groundwater availability. The goal of the GAM program is to provide useful and timely information on groundwater availability to the citizens of Texas. In order to achieve this, the TWDB developed or acquired models of all the major aquifers in Texas, including the Gulf Coast aquifer. The TWDB continues work to develop groundwater models for the minor aquifers of Texas. Groundwater models are useful tools for entities charged with managing groundwater resources. Groundwater in the Gulf Coast aquifer of Texas is managed by several groundwater conservation districts and two subsidence districts (Figure 10-1). Outside the districts, groundwater is managed by the rule of capture (Mace and others, 2004). With the passage of House Bill 1763 in 2005, groundwater conservation districts in each groundwater management area are required to meet to determine the desired future conditions for each of their aquifers. The TWDB is then charged with providing estimates of managed available groundwater to groundwater conservation districts and regional water planning groups for use in their plans. It is likely that 1 Texas Water Development Board

Welcome message from author
This document is posted to help you gain knowledge. Please leave a comment to let me know what you think about it! Share it to your friends and learn new things together.
Transcript

173
Chapter 10
Groundwater Models of the Gulf Coast Aquifer of Texas Ali H. Chowdhury, Ph.D., P.G.1, and Robert E. Mace, Ph.D., P.G.1
Introduction
Models of groundwater flow are useful for better understanding aquifers and, ultimately, for better managing groundwater resources. Groundwater models allow hydrogeologists and engineers to bring available information and estimates on aquifers together to see how this information interacts with itself. Once a model is developed, it can be used to predict how water levels in the aquifer might respond to pumping and drought. For the Gulf Coast area, land subsidence, where the sediments compress in response to pumping groundwater, is another concern that groundwater models can be used to predict.
Groundwater modeling in Texas has had a long history (Mace, 2001) that starts with an electric analog model developed for the Gulf Coast aquifer in the Houston area in 1965 and continues today as our understanding of the aquifer and the development of modeling tools improve. The Texas Legislature approved funding for the Groundwater Availability Modeling (GAM) program at the Texas Water Development Board (TWDB) in recognition of the importance of obtaining accurate estimations of groundwater availability. The goal of the GAM program is to provide useful and timely information on groundwater availability to the citizens of Texas. In order to achieve this, the TWDB developed or acquired models of all the major aquifers in Texas, including the Gulf Coast aquifer. The TWDB continues work to develop groundwater models for the minor aquifers of Texas.
Groundwater models are useful tools for entities charged with managing groundwater resources. Groundwater in the Gulf Coast aquifer of Texas is managed by several groundwater conservation districts and two subsidence districts (Figure 10-1). Outside the districts, groundwater is managed by the rule of capture (Mace and others, 2004). With the passage of House Bill 1763 in 2005, groundwater conservation districts in each groundwater management area are required to meet to determine the desired future conditions for each of their aquifers. The TWDB is then charged with providing estimates of managed available groundwater to groundwater conservation districts and regional water planning groups for use in their plans. It is likely that
1 Texas Water Development Board

174
Figure 10-1. Map showing the extent of the Texas Gulf Coast aquifer, confirmed groundwater conservation districts, and groundwater management areas for the Texas Gulf Coast aquifer.
groundwater models will play an important role in the assessment of desired future conditions and managed available groundwater.
Under the GAM program, the TWDB developed or obtained groundwater availability models for the northern (Kasmarek and Robinson, 2004), central (Waterstone, 2003; Chowdhury and others, 2004), and southern parts (Chowdhury and Mace, 2003) of the Gulf Coast aquifer (Figure 10-2). The model for the northern part of the Gulf Coast aquifer was completed by the U.S. Geological Survey (Kasmarek and Robinson, 2004); the central part of the Gulf Coast aquifer was initially undertaken by Waterstone (2003) and later recalibrated by TWDB (Chowdhury and others, 2004); and the southern part of the Gulf Coast aquifer was completed by TWDB (Chowdhury and Mace, 2003). In this paper, we discuss results of these modeling efforts for the Texas Gulf Coast aquifer. We also summarize previous modeling studies of the Texas Gulf Coast aquifer. Prior to discussing the modeling results, we provide a brief description of geology, recharge, discharge, the conceptual model, and approaches followed in completing the GAM models.

175
Figure 10-2. Map showing groundwater model areas for the northern, central, and southern parts of the Gulf Coast aquifer. Types of model boundaries for each model area are also indicated.
Following this, we discuss model calibration results for steady-state and transient conditions and present the amount of groundwater flowing through the aquifer in respective model areas.
Past and Present Models of the Gulf Coast of Texas
Several state and federal agencies have conducted studies on the geology and hydrogeology of the Texas Gulf Coast aquifer (for example, Wood and Gabrysch, 1965; Jorgensen, 1975; Baker and Wall, 1976; Baker, 1979; Meyer and Carr, 1979; Carr and others, 1985; Groschen, 1985; Baker, 1986; Ryder, 1988; Dutton and Richter, 1990; McCoy, 1990; Hay, 1999; Harden and Associates, 2002; Kasmarek and Strom, 2002). Most of these studies involved characterizing the
176
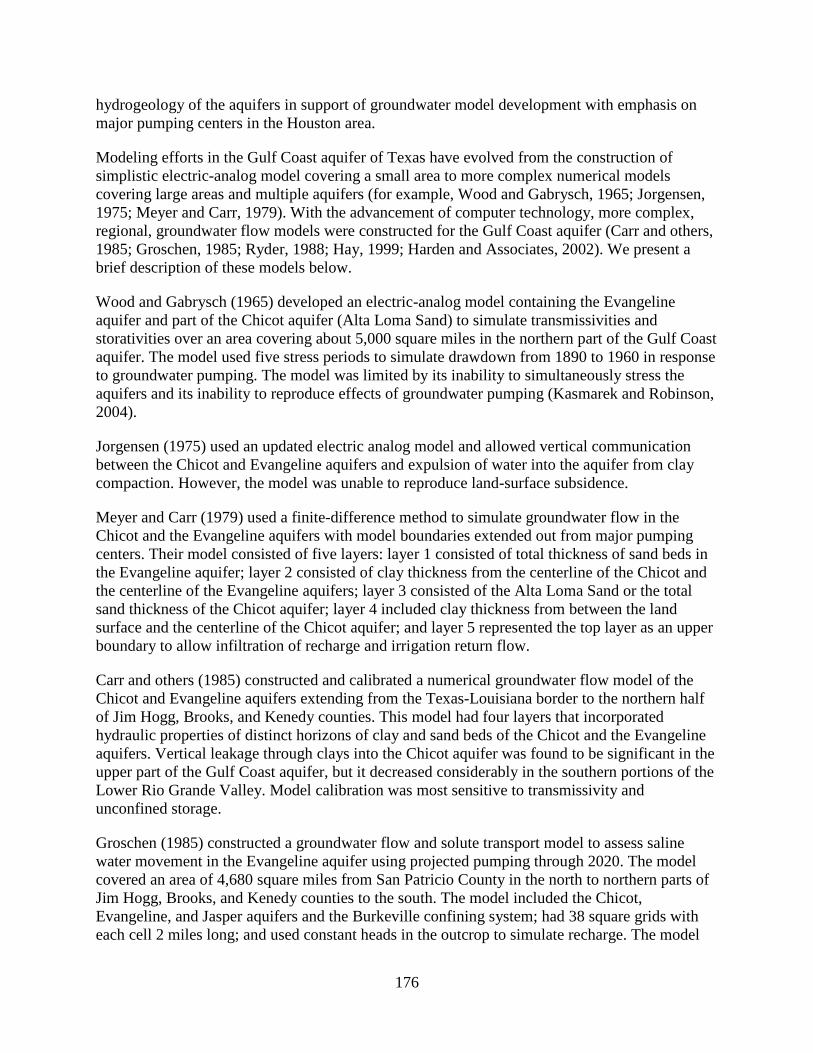
hydrogeology of the aquifers in support of groundwater model development with emphasis on major pumping centers in the Houston area.
Modeling efforts in the Gulf Coast aquifer of Texas have evolved from the construction of simplistic electric-analog model covering a small area to more complex numerical models covering large areas and multiple aquifers (for example, Wood and Gabrysch, 1965; Jorgensen, 1975; Meyer and Carr, 1979). With the advancement of computer technology, more complex, regional, groundwater flow models were constructed for the Gulf Coast aquifer (Carr and others, 1985; Groschen, 1985; Ryder, 1988; Hay, 1999; Harden and Associates, 2002). We present a brief description of these models below.
Wood and Gabrysch (1965) developed an electric-analog model containing the Evangeline aquifer and part of the Chicot aquifer (Alta Loma Sand) to simulate transmissivities and storativities over an area covering about 5,000 square miles in the northern part of the Gulf Coast aquifer. The model used five stress periods to simulate drawdown from 1890 to 1960 in response to groundwater pumping. The model was limited by its inability to simultaneously stress the aquifers and its inability to reproduce effects of groundwater pumping (Kasmarek and Robinson, 2004).
Jorgensen (1975) used an updated electric analog model and allowed vertical communication between the Chicot and Evangeline aquifers and expulsion of water into the aquifer from clay compaction. However, the model was unable to reproduce land-surface subsidence.
Meyer and Carr (1979) used a finite-difference method to simulate groundwater flow in the Chicot and the Evangeline aquifers with model boundaries extended out from major pumping centers. Their model consisted of five layers: layer 1 consisted of total thickness of sand beds in the Evangeline aquifer; layer 2 consisted of clay thickness from the centerline of the Chicot and the centerline of the Evangeline aquifers; layer 3 consisted of the Alta Loma Sand or the total sand thickness of the Chicot aquifer; layer 4 included clay thickness from between the land surface and the centerline of the Chicot aquifer; and layer 5 represented the top layer as an upper boundary to allow infiltration of recharge and irrigation return flow.
Carr and others (1985) constructed and calibrated a numerical groundwater flow model of the Chicot and Evangeline aquifers extending from the Texas-Louisiana border to the northern half of Jim Hogg, Brooks, and Kenedy counties. This model had four layers that incorporated hydraulic properties of distinct horizons of clay and sand beds of the Chicot and the Evangeline aquifers. Vertical leakage through clays into the Chicot aquifer was found to be significant in the upper part of the Gulf Coast aquifer, but it decreased considerably in the southern portions of the Lower Rio Grande Valley. Model calibration was most sensitive to transmissivity and unconfined storage.
Groschen (1985) constructed a groundwater flow and solute transport model to assess saline water movement in the Evangeline aquifer using projected pumping through 2020. The model covered an area of 4,680 square miles from San Patricio County in the north to northern parts of Jim Hogg, Brooks, and Kenedy counties to the south. The model included the Chicot, Evangeline, and Jasper aquifers and the Burkeville confining system; had 38 square grids with each cell 2 miles long; and used constant heads in the outcrop to simulate recharge. The model
177
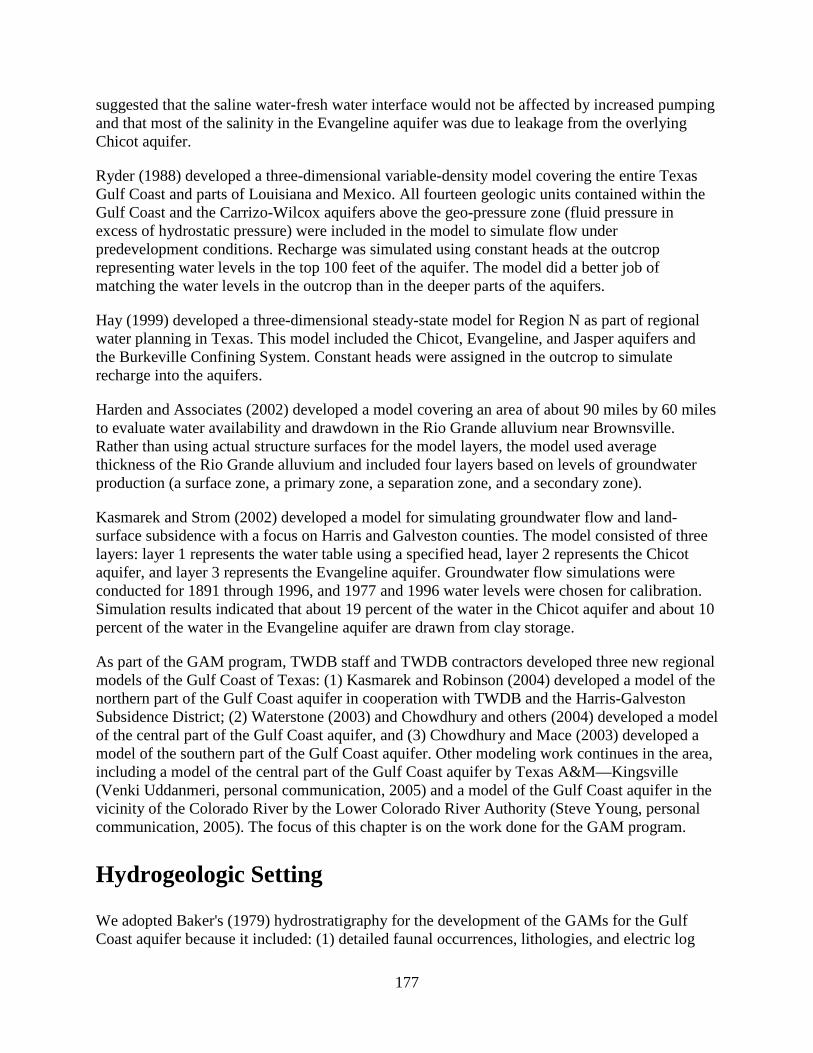
suggested that the saline water-fresh water interface would not be affected by increased pumping and that most of the salinity in the Evangeline aquifer was due to leakage from the overlying Chicot aquifer.
Ryder (1988) developed a three-dimensional variable-density model covering the entire Texas Gulf Coast and parts of Louisiana and Mexico. All fourteen geologic units contained within the Gulf Coast and the Carrizo-Wilcox aquifers above the geo-pressure zone (fluid pressure in excess of hydrostatic pressure) were included in the model to simulate flow under predevelopment conditions. Recharge was simulated using constant heads at the outcrop representing water levels in the top 100 feet of the aquifer. The model did a better job of matching the water levels in the outcrop than in the deeper parts of the aquifers.
Hay (1999) developed a three-dimensional steady-state model for Region N as part of regional water planning in Texas. This model included the Chicot, Evangeline, and Jasper aquifers and the Burkeville Confining System. Constant heads were assigned in the outcrop to simulate recharge into the aquifers.
Harden and Associates (2002) developed a model covering an area of about 90 miles by 60 miles to evaluate water availability and drawdown in the Rio Grande alluvium near Brownsville. Rather than using actual structure surfaces for the model layers, the model used average thickness of the Rio Grande alluvium and included four layers based on levels of groundwater production (a surface zone, a primary zone, a separation zone, and a secondary zone).
Kasmarek and Strom (2002) developed a model for simulating groundwater flow and land- surface subsidence with a focus on Harris and Galveston counties. The model consisted of three layers: layer 1 represents the water table using a specified head, layer 2 represents the Chicot aquifer, and layer 3 represents the Evangeline aquifer. Groundwater flow simulations were conducted for 1891 through 1996, and 1977 and 1996 water levels were chosen for calibration. Simulation results indicated that about 19 percent of the water in the Chicot aquifer and about 10 percent of the water in the Evangeline aquifer are drawn from clay storage.
As part of the GAM program, TWDB staff and TWDB contractors developed three new regional models of the Gulf Coast of Texas: (1) Kasmarek and Robinson (2004) developed a model of the northern part of the Gulf Coast aquifer in cooperation with TWDB and the Harris-Galveston Subsidence District; (2) Waterstone (2003) and Chowdhury and others (2004) developed a model of the central part of the Gulf Coast aquifer, and (3) Chowdhury and Mace (2003) developed a model of the southern part of the Gulf Coast aquifer. Other modeling work continues in the area, including a model of the central part of the Gulf Coast aquifer by Texas A&M—Kingsville (Venki Uddanmeri, personal communication, 2005) and a model of the Gulf Coast aquifer in the vicinity of the Colorado River by the Lower Colorado River Authority (Steve Young, personal communication, 2005). The focus of this chapter is on the work done for the GAM program.
Hydrogeologic Setting
We adopted Baker's (1979) hydrostratigraphy for the development of the GAMs for the Gulf Coast aquifer because it included: (1) detailed faunal occurrences, lithologies, and electric log

178
signatures along with several cross-sections; (2) hydraulic characteristics of the sediments; and (3) water-level information. From oldest to youngest, the Tertiary rocks have been classified into the Frio Formation, the Anahuac Formation, and the Catahoula Tuff or Sandstone (Early Miocene); the Oakville Sandstone and the Fleming Formation (Mid- to Late-Miocene); the Goliad Sand (Pliocene); the Willis Sand, Bentley Formation, Montgomery Formation, Beaumont Clay (Pleistocene); and alluvium (Holocene) (Baker, 1979).
Excessive groundwater pumping has caused water-level declines in various parts of the Gulf Coast aquifer (Chowdhury and others, 2004; Kasmarek and Robinson, 2004). Major cones of depression occur in Harris-Galveston, Wharton-Jackson-Matagorda, and Kleberg counties, where water levels have historically declined by up to 350, 50, and 200 feet, respectively (Chowdhury and others, 2004; Kasmarek and Robinson, 2004). Excessive pumping of the aquifer caused subsequent land-surface subsidence due to compaction and expulsion of water from the clays contained in the aquifer materials and shale beds (Gabrysch, 1984). For example, in the Houston area, the land surface has subsided up to ten feet locally (Kasmarek and Robinson, 2004).
Groundwater in the Texas Gulf Coast aquifer generally flows from the outcrop areas in the west towards the Gulf of Mexico in the east. Most of the water-level contours parallel the coastline except near major pumping centers where natural flow system is altered and water is diverted toward major cones of depression (Chowdhury and others, this volume). Water levels in wells vary widely depending on their locations with respect to the groundwater flow system. In the unconfined parts of the outcrop, most of the wells respond quickly to precipitation events. In the confined parts of the aquifer away from the outcrop, groundwater movement is slow and water levels in wells do not respond to precipitation, due to the long travel time through the subsurface. Groundwater pumping perhaps is probably the most important control in shaping water-level changes in wells. For example, many wells in the confined parts of the aquifer that record historical decline in water levels display significant recovery over time due to reduction in pumping.
Recharge
Recharge mainly occurs from rainfall that falls on the outcrop areas. Only a small portion of the rainfall reaches the water table. Water also drains into the aquifer from some reaches of the numerous streams that cross the Gulf Coast. In other reaches of the streams, groundwater discharges into streams as baseflow. In addition, major pumping centers that form large cones of depression may capture recharged water that was naturally discharging to local streams, thereby increasing downdip recharge. Recharge through the unconfined, permeable, sandy portions of the Gulf Coast aquifer may be relatively fast, while recharge to the confined portions of the aquifer may be considerably slow. Recharge through the Beaumont Clay that outcrops along the coast is generally small except in areas where valleys have been cut into the formation. Water not evaporated, consumed by plants through transpiration, or drained by streams from surface runoff infiltrates into the subsurface and eventually reaches the water table.
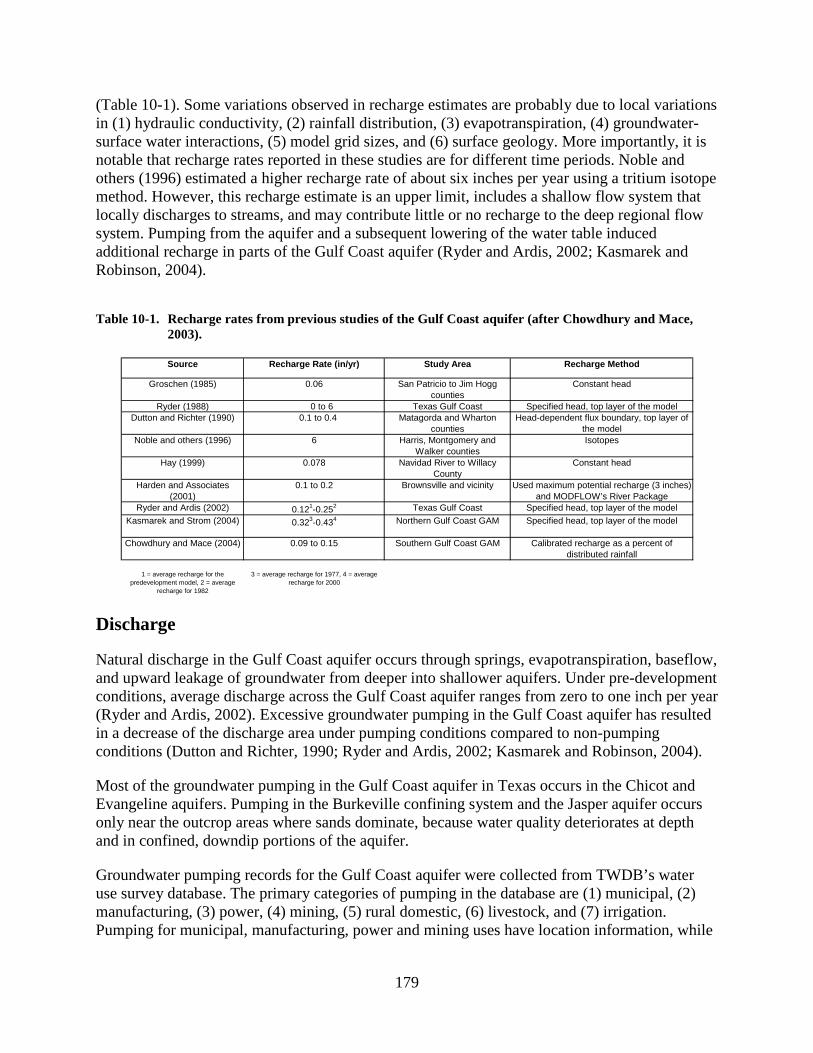
Several investigators have estimated recharge rates for the Gulf Coast aquifer (Groschen, 1985; Ryder, 1988; Dutton and Richter, 1990; Ryder and Ardis, 2002; Kasmarek and Robinson, 2004) (Table 10-1). Recharge rates derived from most of the model simulations are generally similar
179
(Table 10-1). Some variations observed in recharge estimates are probably due to local variations in (1) hydraulic conductivity, (2) rainfall distribution, (3) evapotranspiration, (4) groundwater-surface water interactions, (5) model grid sizes, and (6) surface geology. More importantly, it is notable that recharge rates reported in these studies are for different time periods. Noble and others (1996) estimated a higher recharge rate of about six inches per year using a tritium isotope method. However, this recharge estimate is an upper limit, includes a shallow flow system that locally discharges to streams, and may contribute little or no recharge to the deep regional flow system. Pumping from the aquifer and a subsequent lowering of the water table induced additional recharge in parts of the Gulf Coast aquifer (Ryder and Ardis, 2002; Kasmarek and Robinson, 2004).
Table 10-1. Recharge rates from previous studies of the Gulf Coast aquifer (after Chowdhury and Mace, 2003).
Groschen (1985) 0.06 San Patricio to Jim Hogg counties
Constant head
Ryder (1988) 0 to 6 Texas Gulf Coast Specified head, top layer of the modelDutton and Richter (1990) 0.1 to 0.4 Matagorda and Wharton
countiesHead-dependent flux boundary, top layer of
the modelNoble and others (1996) 6 Harris, Montgomery and
Walker countiesIsotopes
Hay (1999) 0.078 Navidad River to Willacy County
Constant head
Harden and Associates (2001)
0.1 to 0.2 Brownsville and vicinity Used maximum potential recharge (3 inches) and MODFLOW’s River Package
Ryder and Ardis (2002) 0.121-0.252 Texas Gulf Coast Specified head, top layer of the modelKasmarek and Strom (2004) 0.323-0.434 Northern Gulf Coast GAM Specified head, top layer of the model
Chowdhury and Mace (2004) 0.09 to 0.15 Southern Gulf Coast GAM Calibrated recharge as a percent of distributed rainfall
1 = average recharge for the predevelopment model, 2 = average
recharge for 1982
3 = average recharge for 1977, 4 = average recharge for 2000
Source Study Area Recharge MethodRecharge Rate (in/yr)
Discharge
Natural discharge in the Gulf Coast aquifer occurs through springs, evapotranspiration, baseflow, and upward leakage of groundwater from deeper into shallower aquifers. Under pre-development conditions, average discharge across the Gulf Coast aquifer ranges from zero to one inch per year (Ryder and Ardis, 2002). Excessive groundwater pumping in the Gulf Coast aquifer has resulted in a decrease of the discharge area under pumping conditions compared to non-pumping conditions (Dutton and Richter, 1990; Ryder and Ardis, 2002; Kasmarek and Robinson, 2004).
Most of the groundwater pumping in the Gulf Coast aquifer in Texas occurs in the Chicot and Evangeline aquifers. Pumping in the Burkeville confining system and the Jasper aquifer occurs only near the outcrop areas where sands dominate, because water quality deteriorates at depth and in confined, downdip portions of the aquifer.
Groundwater pumping records for the Gulf Coast aquifer were collected from TWDB’s water use survey database. The primary categories of pumping in the database are (1) municipal, (2) manufacturing, (3) power, (4) mining, (5) rural domestic, (6) livestock, and (7) irrigation. Pumping for municipal, manufacturing, power and mining uses have location information, while

180
irrigation and livestock pumping are distributed based on land-use maps. Rural domestic pumping is distributed in the model area based on population density distribution.
Over 1.1 million acre-feet of water were pumped from the Texas Gulf Coast aquifer in 1999 (TWDB, 2002). Estimated groundwater availability in the aquifer under drought conditions was about 1.6 million acre-feet in 2000 (TWDB, 2002). A large fraction of the groundwater pumped from the aquifer is consumed by irrigation. Thus, pumping is heavily skewed towards the summer months when most of the irrigation water is used. Groundwater pumping in the northern part of the Gulf Coast aquifer reached a high of about 1.23 million acre-feet per year during the period from 1971 to 1975. In subsequent years (1975 to 2000), groundwater pumping declined to about 950,000 acre-feet per year (Kasmarek and Robinson, 2004) (Figure 10-3).
Figure 10-3. Groundwater pumping estimates for the model areas of the northern part of the Gulf Coast aquifer (1891 to 1999) (from Kasmarek and Robinson, 2004).
Groundwater pumping in the central part of the Gulf Coast aquifer declined from about 600,000 acre-feet per year in 1980 to about 420,000 acre-feet per year in 1987. In the subsequent years (1988 to 1999), groundwater pumping fluctuated between about 550,000 acre-feet per year in 1988 to about 420,000 acre-feet per year in 1999 (Figure 10-4) In the southern part of the Gulf Coast aquifer, groundwater pumping progressively increased from about 17,000 acre-feet per year in 1980 to 32,000 acre-feet per year in 2000 (Chowdhury and Mace, 2003) (Figure 10-5).
Most of the rivers in the Gulf Coast aquifer are gaining except for the Colorado River, which is mainly a losing stream. Other rivers have segments that gain or lose along different reaches. In the southern part of the Gulf Coast aquifer, the Rio Grande switches from a gaining stream in Starr County to a losing stream in central Hidalgo County and switches back to a gaining stream near Brownsville (Chowdhury and others, 2004).

181
Figure 10-4. Groundwater pumping estimates for the model areas of the central part of the Gulf Coast aquifer (1980 to 1999) (from Chowdhury and others, 2004).
Figure 10-5. Groundwater pumping estimates for the model areas of the southern part of the Gulf Coast aquifer (1980 to 1999) (from Chowdhury and Mace, 2003).
Conceptual Model
A conceptual model is our best understanding of the natural groundwater flow system. It describes how recharge, discharge, groundwater-surface water interactions, and cross-formational flow take place through the aquifers and the confining units of a flow system (Figure 10-6). When rain falls on the outcrop areas, much of it runs off to the rivers, a portion of it is lost through evaporation and transpiration, and less than about one percent reaches the saturated groundwater zone of the Gulf Coast aquifer. A portion of the water that reaches the saturated

182
Figure 10-6. A conceptual model of the Gulf Coast aquifer flow system, showing (a) groundwater flow components overlain on a cross-section through the middle of Jim Hogg, Brooks, and Kenedy counties; and (b) a numerical translation of the conceptual model (from Chowdhury and Mace, 2003).
groundwater zone flows laterally over small distances and discharges locally to streams. A small portion of the flow reaches the intermediate flow system at depth and a much smaller amount joins the deeper regional flow system, traveling considerable distances from the outcrop areas towards the Gulf of Mexico. As the flow reaches the saltwater-fresh water boundary near the coast, density differences between the fresh water and the salt water cause the regional groundwater flow to shift direction and move vertically upward toward coastal areas at lower elevations.

183
In general, groundwater flows from areas of higher topography towards lower topography. In this case, groundwater flows from the west towards the Gulf of Mexico in the east. However, considerable groundwater pumping in parts of the model area has greatly changed groundwater flow directions. For example, decades of extensive groundwater pumping in Harris-Galveston, Wharton, Victoria, and Kleberg counties has altered the natural flow system (Chowdhury and others, this volume). In these areas, a decline in the potentiometric (or water-level) surface and an increase in the hydraulic gradient are inducing greater flow into the deeper parts of the aquifer than would have otherwise occurred under natural conditions. The increase in the hydraulic gradient due to groundwater pumping also allows more interaction between the aquifers and their confining units.
Model Boundaries and Grid Design
The boundaries for the GAMs of the Gulf Coast aquifer are defined by (1) the limits of the outcrop in the west, (2) the Gulf of Mexico in the east or downdip limit of the freshwater (location where the total dissolved solids concentration reaches 10,000 milligrams per liter), (3) hydrologic divides along major rivers, and (4) groundwater divides away from major pumping centers. The model area for the northern part of the Gulf Coast aquifer extends from across the Louisiana border at the Sabine River to the Lavaca River in the south. The model area for the central part of the Gulf Coast aquifer extends along a groundwater divide through Colorado-Fort Bend-Brazoria counties to the north to a groundwater divide through Jim Hogg, Brooks, and Kenedy counties in the south. The model area for the southern part of the Gulf Coast aquifer extends from a groundwater divide through Jim Hogg, Brooks, and Kenedy counties to the north to the Rio Grande along the Texas-Mexico border in the south (Figure 10-2).
Modelers designed the models such that they can reproduce the groundwater flow system. We used MODFLOW-96 (Harbaugh and McDonald, 1996) to model groundwater flow in the Gulf Coast aquifer. All the cells have a uniform area of one square mile. TWDB staff chose this cell size to be small enough to reflect the density of input data and the desired output detail and large enough for the model to be manageable. Model layer 1 represents the Chicot aquifer; model layer 2 represents the Evangeline aquifer; model layer 3 represents the Burkeville Confining System; and model layer 4 represents the Jasper aquifer.
Model cells were made inactive when they fell outside the model area or when they were thin, because they were found to cause convergence problems during calibration. For the model of the northern part of the Gulf Coast aquifer, each model layer consisted of 137 rows and 245 columns for a total of 134,260 cells and 61,082 active cells. For the model of the central part of the Gulf Coast aquifer, each model layer consisted of 177 rows and 269 columns for a total of 190,452 cells and 56,736 active cells. For the model of the southern part of the Gulf Coast, each model layer consisted of 125 rows and 135 columns for a total of 67,500 cells and 27,000 active cells.
Modeling Approach
The modeling approach included: (1) calibrating a steady-state model to reproduce pre-development conditions and (2) calibrating a transient model to reproduce seasonal fluctuations

184
in water levels and flows in streams. Modelers first calibrated the steady-state model to determine stable boundary conditions and to simulate static water levels under pre-pumping or near equilibrium conditions. This time period ranges from 1890 to the 1940s for the northern part of the Gulf Coast aquifer, 1910 to 1940 for the central part of the Gulf Coast aquifer, and 1930 to 1980 for the southern part of the Gulf Coast aquifer. Modelers calibrated the steady-state models separately to reproduce water levels during these time periods.
The approach for calibrating the model was to reproduce water levels under steady-state conditions and reproduce seasonal water-level changes under transient conditions. Modelers focused their calibration on the Chicot and the Evangeline aquifers that are more widely used and contain numerous wells with water-level measurements.
Modelers quantified the calibration, or goodness of fit, between the simulated and measured water-level values using root mean square error (RMSE):
RMSE = 5.0
2)(/1
−∑ i
n
ism hhn
where n is the number of calibration points, hm is the measured hydraulic head at any point i, and hs is the simulated hydraulic head at the same point i.
Once the modelers completed calibrating the steady-state model, they used the model as a starting point for transient calibration. The TWDB requested the years 1981 to 2000 because this period contained the most accurate and recent water-use and water-level information.
There are considerable similarities in the modeling approaches used for the northern, central, and southern parts of the Gulf Coast aquifer. For example: (1) the conceptual model for all three models is the same in that groundwater recharges in the outcrop mainly from rainfall and discharges in the downdip areas near the coast; (2) the Chicot, Evangeline, and Jasper aquifers and Burkeville confining system form four model layers providing a uniform lateral extent and thickness to each model layer; (3) model cells have uniform one mile dimensions; and (4) models use the U.S. Geological Survey’s MODFLOW-96 code to simulate the groundwater flow system.
The main differences between the models lie in the MODFLOW packages used for simulation:
• MODFLOW’s Interbed Storage package was only used in the northern part of the Gulf Coast aquifer to simulate land-surface subsidence. There is a lack of documented information on land-surface subsidence in the central and southern parts of the aquifer.
• Recharge was simulated in the model for the northern part of the Gulf Coast aquifer using a General Head Boundary package; recharge was simulated in the central part of the Gulf Coast aquifer using MODFLOW’s Recharge package and applying a percent of spatially distributed rainfall according to soil characteristics; and recharge was calibrated in the southern part of the Gulf Coast aquifer using MODFLOW’s Recharge package and applying a percent of the spatially distributed rainfall.
185
• MODFLOW’s Evapotranspiration package was used in the models for the central and the southern parts of the Gulf Coast aquifer but not for the model in the northern part.
• MODFLOW’s General Head Boundary package, used in the northern part of the Gulf Coast aquifer for recharge simulations, was considered inclusive of the groundwater-surface water interaction; MODFLOW’s Streamflow Routing package was used in simulating groundwater-surface water interaction in the central part of the Gulf Coast aquifer; and MODFLOW’s River package was used in simulating groundwater-surface water interaction in the southern part of the Gulf Coast aquifer.
Northern Part of the Gulf Coast Aquifer
The MODFLOW’s General Head Boundary package was used to simulate recharge and discharge in the outcrops of the model area. The General Head Boundary package acts as a head-dependent flux boundary and flow depends on the head differences and vertical conductance between the water table and adjacent deeper zones. Application of the General Head Boundary as a constant-head source of water requires that the groundwater flow system does not show any long term trends in water-level change, which is probably valid for most of the model area except for in areas with excessive groundwater pumping (Kasmarek and Robinson, 2004).
Water-table altitudes were constructed using topography and subtracting a “trend surface” (a dataset of measured depths to water supplemented by interpolated depths to water). Flow between the streams and the aquifer system was not explicitly simulated, with the understanding that the General Head Boundary would account for the stream discharges to the level of accuracy at which such discharges are known (Kasmarek and Robinson, 2004). Initial transmissivity distributions were constructed with data from Wesselman (1967), Carr and others (1985), Baker (1986), and Kasmarek and Strom (2002). For outcrop areas, the initial vertical hydraulic conductivity was computed by dividing a constant vertical hydraulic conductivity by the cumulative clay thickness from land surface to the centerline of the outcropping hydrogeologic unit. For the subcrop areas, vertical hydraulic conductivity is computed internally by MODFLOW by multiplying a leakance by the grid-block area. Initial storativities of the sands are from Kasmarek and Strom (2002).
Land-surface subsidence and compaction of clays were simulated using MODFLOW’s Interbed-Storage package (Leake and Prudic, 1991). Initial values of elastic and inelastic clay storativity (specific storage multiplied by clay thickness) are taken from Kasmarek and Strom (2002), Gabrysch (1982), and Strom and others (2003a, 2003b, 2003c).
Central Part of the Gulf Coast Aquifer
To calibrate the model for the central part of the Gulf Coast aquifer, Chowdhury and others (2004) adjusted several parameters to observe which parameter had the greatest effect on simulated water levels. Through this initial sensitivity analysis, it was observed that the horizontal hydraulic conductivity of the Evangeline aquifer, recharge rate, and vertical leakance of the Chicot aquifer affected the model results. Calibration efforts revealed that the model calibration was non-unique, particularly with respect to the use of hydraulic conductivity and

186
leakance values. Application of increased recharge has no significant bearing on the water levels, because excess recharge discharges to the streams as baseflow.
An initial attempt was made to calibrate the model using distributed horizontal hydraulic conductivity. However, when Chowdhury and others (2004) assigned pumpage values in the model layers, they were unable to reproduce the water levels, particularly in the Evangeline and Jasper aquifers. The best-fit simulated water levels that they were able to produce use zoned horizontal hydraulic conductivity for the Evangeline aquifer. Chowdhury and others (2004) zoned the hydraulic conductivity into three smaller sub-zones and adjusted the values following the median of the distributed hydraulic conductivity. The vertical leakance values that they used are similar to other Gulf Coast models (Chowdhury and Mace, 2003; Kasmarek and Robinson, 2004).
Southern Part of the Gulf Coast Aquifer
To calibrate the model for the southern part of the Gulf Coast aquifer, Chowdhury and Mace (2003) assigned recharge as a percent of distributed mean annual rainfall from 1930 to 1980. They used MODFLOW’s Evapotranspiration package to simulate transpiration. They used vegetation coverage maps to locate vegetation types and density and observed that mesquite is the dominant vegetation in the model area, with the highest density occurring in central Kenedy and Jim Hogg counties. Chowdhury and Mace (2003) applied three sets of multipliers (0.001, 0.0012, and 0.0015) to the distributed rainfall grid to account for varying evapotranspiration rates due to differences in the density of mesquite. Using these multipliers, they obtained evapotranspiration rates that range from 4.14×10⁻⁶ to 9.11×10⁻⁶ feet per day.
Chowdhury and Mace (2003) used MODFLOW’s River package to simulate flow between the Chicot aquifer and the Rio Grande. Surface elevations for different segments of the river were estimated from topographic maps and the U.S. Geological Survey’s digital elevation model. River bottom elevation was set at ten feet below the river head elevation. River bed conductance was estimated using the formulation (K×L×W)/M where K is the hydraulic conductivity, L is the length of the river cell, W is the width of the river cell, and M is the sediment thickness. In the final calibration, Chowdhury and Mace (2003) used a river bed conductance of 100,000 feet per day, a sediment thickness of 1 foot, an average width of 10 feet, and a length of 5,280 feet. They assigned layer 1 as unconfined and layers 2, 3, and 4 as unconfined/confined. They allowed the model to calculate transmissivity and storativity based on saturated thickness. To simulate the movement of water out of the model and into the Gulf of Mexico, Chowdhury and Mace (2003) assigned constant heads across 10 miles of an area offshore, including the area of Matagorda Bay in layer 1. In the subsequent layers, they assigned a no-flow boundary in the east to allow upward vertical flow of water towards the discharge areas of the coastline.
To calibrate the model, Chowdhury and Mace (2003) adjusted the various parameters to observe which parameter had the most effect on simulated water levels. Through this initial sensitivity analysis, they observed that the recharge rate, evapotranspiration rate, and horizontal hydraulic conductivity of layers 1 and 2 had the greatest effect on the model results.

187
Calibration Results
Each of the modeling teams calibrated each of the GAMs for the Gulf Coast aquifer. We summarized below the steady state and transient calibration results of each effort.
Northern Part of the Gulf Coast Aquifer
The simulated water levels of the Chicot, Evangeline, and Jasper aquifers for the steady-state model show a general agreement with the measured water levels and conform to the conceptual model of a flow system where recharge enters in the outcrop and flows relatively short distances to discharge into streams or longer distances through deeper zones where it is discharged by upward leakage in topographically low areas near the coast (Kasmarek and Robinson, 2004). Transmissivities used for the calibration of the northern parts of the Gulf Coast aquifer are of the same orders of magnitude as those reported in previous studies (Wesselman, 1967; Jorgensen, 1975; Carr and others, 1985; Baker, 1986; Kasmarek and Strom, 2002; Ryder and Ardis, 2002). However, it was noted that higher transmissivity areas were coincident with larger drawdowns, which the authors considered an artifact of the model (Kasmarek and Robinson, 2004).
The simulated and measured cones of depression were nearly coincident. However, the simulations for 1977 and 2000 were unable to reproduce maximum depth of the cones of depression. In most cases, the simulated cones were about 100 feet smaller than the measured cones. The simulated cones of depression for 2000 match better to measured cones of depression than in 1977, which the authors attributed to an underestimation of groundwater pumping in 1977. Storativities used to simulate water level changes in the Chicot and Evangeline aquifers range from 1×10⁻⁴ to 0.2 and 4×10⁻⁵ to 0.2, respectively, reflecting aquifer conditions from water table to semi-confined to confined conditions (Kasmarek and Robinson, 2004).
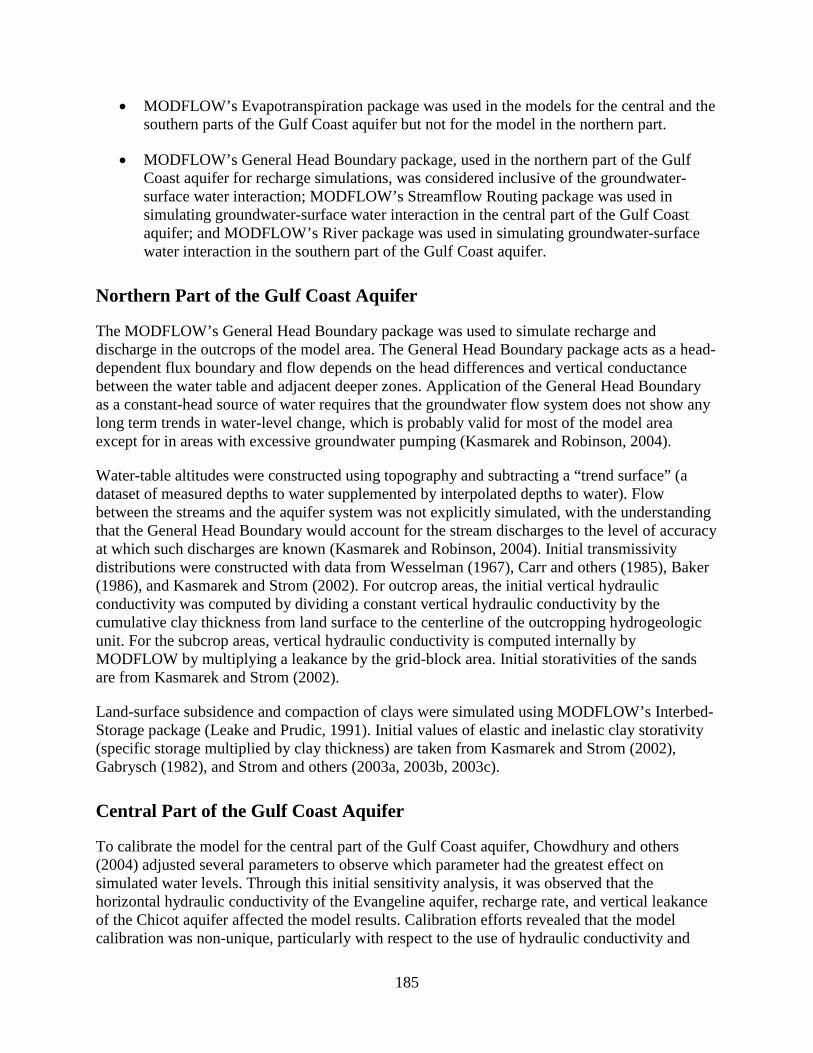
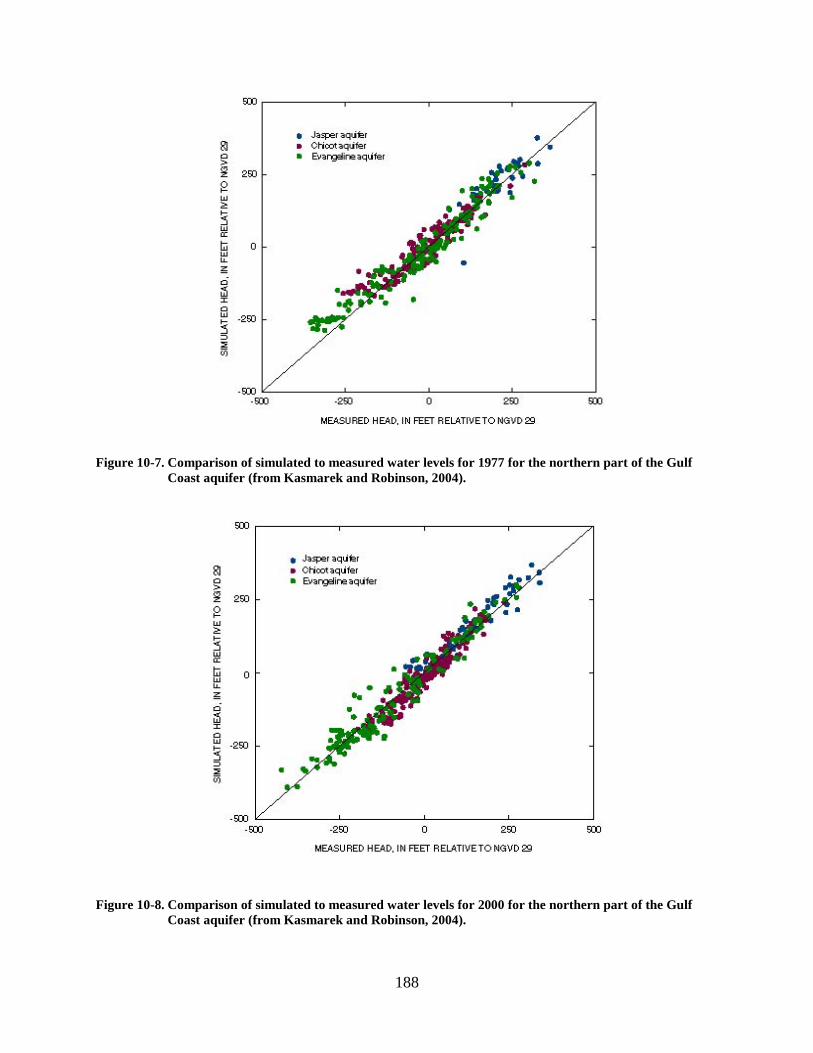
The root mean square error for 1977 were 34 feet for the Chicot aquifer, 43 feet for the Evangeline aquifer, and 47 feet for the Jasper aquifer which corresponds to 7, 8, and 17 percent of the hydraulic head drop across the model area (Figure 10-7). The root mean square error for 2000 was about 31 feet for the Chicot aquifer, about 40 feet for the Evangeline aquifer, and about 34 feet for the Jasper aquifer (Figure 10-8).
Simulated land-surface subsidence closely matches measured subsidence in the Harris-Galveston-Fort Bend county area (Kasmarek and Robinson, 2004). Land-surface subsidence measuring up to ten feet has been measured in southeastern Harris County. Land surface has subsided by at least six feet over a larger area covering central to southeastern Harris County. Land surface has subsided by up to three feet in southeastern Jasper County (Kasmarek and Robinson, 2004).
188
Figure 10-7. Comparison of simulated to measured water levels for 1977 for the northern part of the Gulf Coast aquifer (from Kasmarek and Robinson, 2004).
Figure 10-8. Comparison of simulated to measured water levels for 2000 for the northern part of the Gulf Coast aquifer (from Kasmarek and Robinson, 2004).

189
Central Part of the Gulf Coast Aquifer
The calibrated model reasonably reproduces the spatial distribution of water levels in the Chicot, Evangeline, and Jasper aquifers and the Burkeville confining system for the steady-state conditions of 1910 to 1940. The root mean square error is about 21 feet (Figure 10-9). The root mean square error that we obtained from calibration is about five percent of the hydraulic head-drop across the model area and is well within the ten percent error usually sought for model calibration. The model accurately replicates the interpreted flow directions towards the Gulf of Mexico and the streams. The spatial distribution of water-level residuals (differences between simulated and measured water levels) appears unbiased towards any specific location in the model area.
Figure 10-9. Comparison of simulated to measured water levels for the steady-state calibration model for the southern part of the Gulf Coast aquifer (from Chowdhury and Mace, 2003).
Chowdhury and others (2004) compared simulated net gain-loss values produced by the model through some of the stream reaches with the measured streamflow values. The three stations that they examined included the Guadalupe River at Victoria, the San Bernard River near Boling, and the San Antonio River near Goliad. Historical stream-flow data from 1910 to 1940 were compared with steady-state simulated baseflow from the model. Their simulated values are somewhat lower than the baseflow. After they calibrated the steady-state model to water levels in the 1940s, they calibrated the model to transient water levels for 1980 to 1990.
An initial attempt to calibrate the transient model by adjusting specific storage and specific yield values within an acceptable range failed. When Chowdhury and others (2004) only adjusted storage values, they were unable to reproduce the drawdowns in Wharton, Victoria, and Kleberg counties. Therefore, they developed three sub-zones of hydraulic conductivity based on the median of the distributed hydraulic conductivity values. They assigned a vertical leakance of

190
1×10⁻⁹ feet per day over a small area near Kingsville to represent local beds and lenses of silt and fine sand.
Chowdhury and others (2004) reproduced seasonal water-level changes in the transient model using recharge based on climate changes. They used specific storage values of 0.000008, 0.000001, 0.00001, and 0.000008 for layers 1, 2, 3 and 4, respectively, and specific yield values of 0.05, 0.01, 0.005, and 0.05 for layers 1, 2, 3, and 4, respectively. The specific yield values of 0.01 to 0.005 that they used in the transient calibration may seem low for the unconfined portions of the aquifer. Typical specific yields of sedimentary materials in unconfined aquifers range from 0.14 to 0.38 (Freeze and Cherry, 1979). Chowdhury and others (2004) attempted to calibrate the model using higher specific yields, but they were unable to reproduce the required fluctuations to match the measured water levels. The lower specific yield that they used is more typical of semi-confined aquifers. They felt that the lower specific yields are appropriate for the Chicot, Evangeline, and the Jasper aquifers as they contain numerous interbedded silt and clay lenses.
The root mean squared error for calibration is 46 feet for 1989 and 36 feet for 1999 (Figure 10-10). Improvement in the root mean squared error for the 1999 transient calibration period was probably caused by (1) a much lower drawdown observed in 1999 than in 1989, which absorbed the effects of underestimated drawdown, and (2) fewer observations wells available with water-level measurements. The root mean squared error for the 1989 and 1999 calibration periods are 5.1 percent and 4.8 percent, respectively, of the hydraulic head drop across the model area.
Simulated distribution of the water-level surfaces for all model layers in 1989 and 1999 reasonably reproduces the measured values. Spatial distribution of the water-level residuals (measured water-levels at calibration well points subtracted from the simulated water-levels) appear unbiased across the model area (Chowdhury and others, 2004). In some areas, they were more successful in minimizing errors. For example, most of the central portion of the model has errors close to zero, while in parts of the southern portion of the model area near Kingsville where they have underestimated the drawdown, the errors are as large as 100 feet. When they compared the distribution of the residuals and their magnitudes for 1989 and 1999, we observe that there is an improvement in the water-level residuals because of a general recovery of the water levels in 1999.
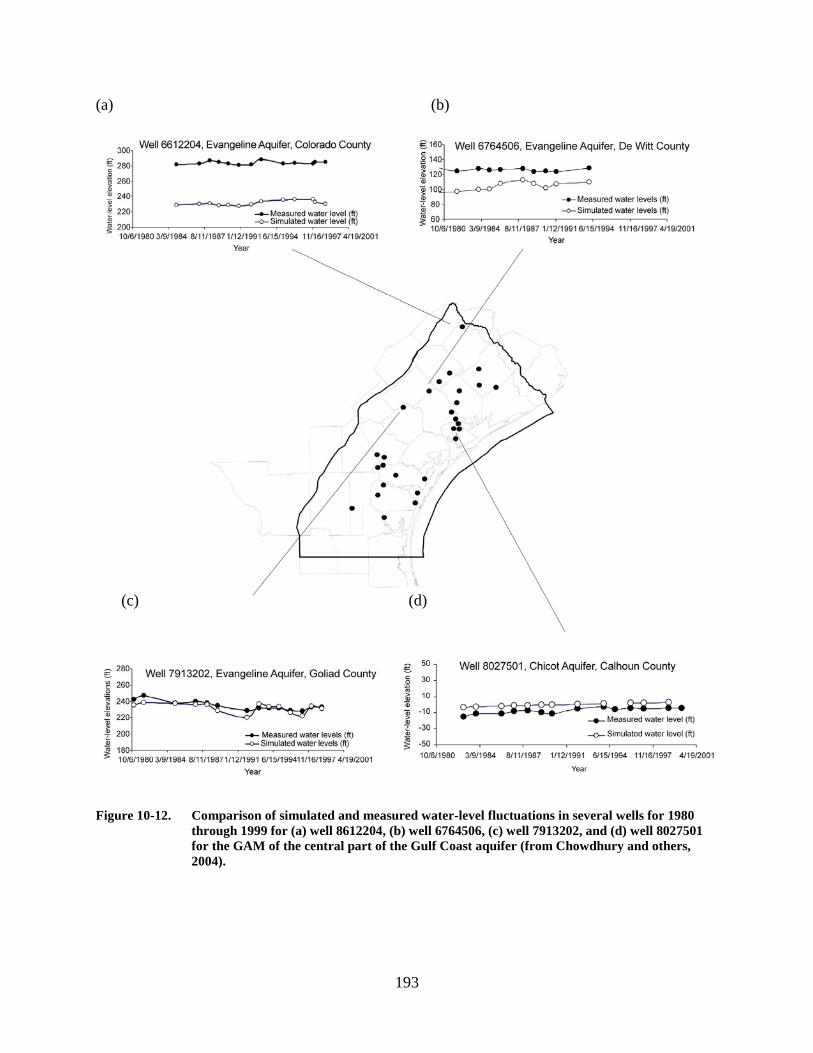
The transient model does a reasonable job in matching the measured monthly and annual water-level trends throughout most of the model area, with the exception of a shift between simulated and measured water levels in some wells. In many wells, however, there is a good match between measured and simulated water levels throughout the model area (Figures 10-11 and 10-12).
Chowdhury and others (2004) compared simulated net gain-loss values on several stream reaches. Their simulated values were somewhat lower than the baseflow that would be expected from the streamflow hydrographs. However, the trend in the simulated net gain-loss follows the

191
Figure 10-10. Comparison of simulated water-levels to measured water levels for the central part of the Gulf Coast aquifer for (a) 1989 and (b) 1999 (from Chowdhury and others, 2004).

192
(a) (b)
Figure 10-11. Comparison of simulated and measured water-level fluctuations in several wells for 1980 through 1999 for (a) well 7942702, (b) well 8011401, (c) well 8431201, and (d) well 8322801 for the GAM of the central part of the Gulf Coast aquifer (from Chowdhury and others, 2004).
(c)
(d)
193
(a) (b)
Figure 10-12. Comparison of simulated and measured water-level fluctuations in several wells for 1980 through 1999 for (a) well 8612204, (b) well 6764506, (c) well 7913202, and (d) well 8027501 for the GAM of the central part of the Gulf Coast aquifer (from Chowdhury and others, 2004).
(c)
(d)
194
trend observed in measured streamflow hydrographs. Chowdhury and others (2004) compared simulated net gain-loss with the measured gain-loss values through stream reaches in Colorado, Lavaca, and Nueces rivers. They observed that the net gain-loss values for Lavaca and Nueces rivers are similar to measured values, but that the Colorado River showed much lower values. A global increase in stream conductance causes too much of a hydraulic interaction between the aquifers and the streams (Waterstone, 2003) and would require unreasonable recharge values to calibrate the model.
Southern Part of the Gulf Coast Aquifer
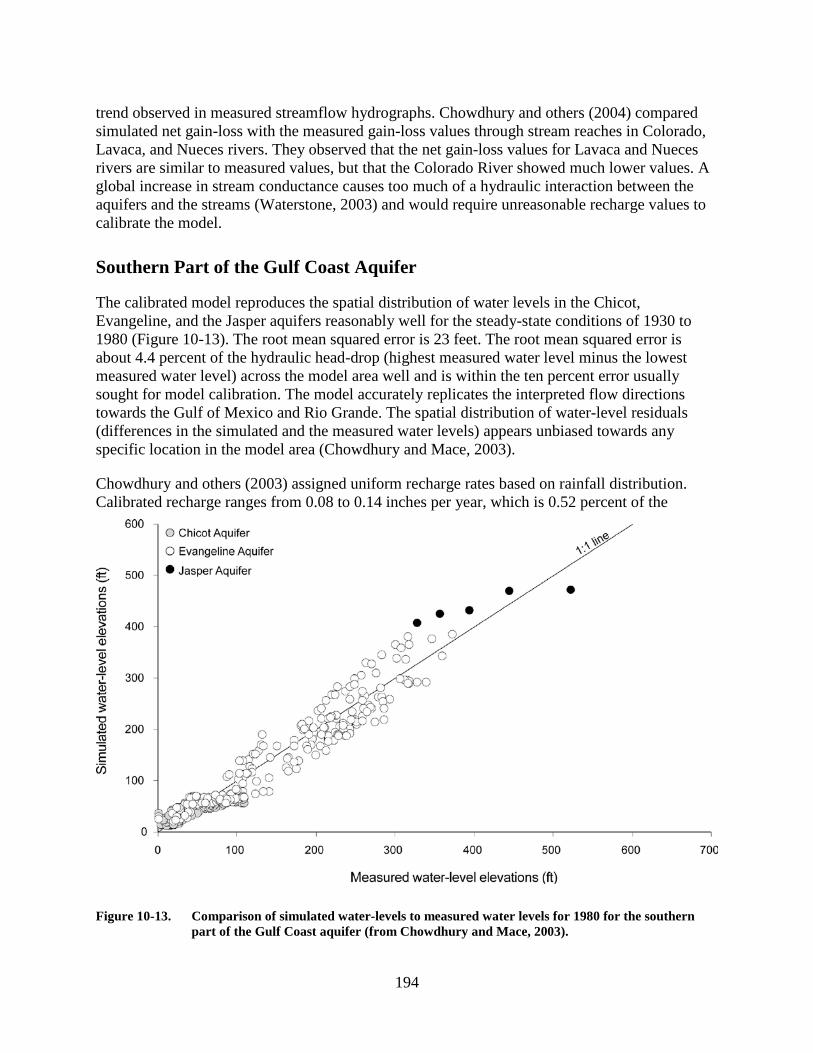
The calibrated model reproduces the spatial distribution of water levels in the Chicot, Evangeline, and the Jasper aquifers reasonably well for the steady-state conditions of 1930 to 1980 (Figure 10-13). The root mean squared error is 23 feet. The root mean squared error is about 4.4 percent of the hydraulic head-drop (highest measured water level minus the lowest measured water level) across the model area well and is within the ten percent error usually sought for model calibration. The model accurately replicates the interpreted flow directions towards the Gulf of Mexico and Rio Grande. The spatial distribution of water-level residuals (differences in the simulated and the measured water levels) appears unbiased towards any specific location in the model area (Chowdhury and Mace, 2003).
Chowdhury and others (2003) assigned uniform recharge rates based on rainfall distribution. Calibrated recharge ranges from 0.08 to 0.14 inches per year, which is 0.52 percent of the
Figure 10-13. Comparison of simulated water-levels to measured water levels for 1980 for the southern part of the Gulf Coast aquifer (from Chowdhury and Mace, 2003).

195
average annual rainfall for the years 1930 through 1980. A slightly lower recharge rate in the southern part of the Gulf Coast aquifer is more realistic, due to higher evaporation and lower rainfall than the rest of the Gulf Coast aquifer.
The maximum evapotranspiration rate was determined by trial and error during calibration. Groundwater extraction through evapotranspiration was assigned locally in areas where mesquite occurs. Given that the mean recharge is close to 0.5 percent of the mean annual rainfall, evapotranspiration could locally amount to as much as 19 to 29 percent of the recharge applied to calibrate the steady-state model.
The model has annual stress periods for 1980 to 2000 except for the drought years in each decade when monthly stress periods were assigned (1988, 1989, 1990 and 1994, 1995, and 1996). Chowdhury and others (2003) reproduced the water levels using recharge that reflects rainfall distribution for the time period and corresponding groundwater pumpage during that period. They reproduced the seasonal changes in the water levels by calibrating the specific storage and the specific yield values. They were able to best reproduce water-level changes using specific storage values of 0.000001, 0.000001, 0.00001, and 0.00001 for layers 1, 2, 3 and 4, respectively, and specific yield values of 0.001, 0.0005, 0.0001, and 0.001 for layers 1, 2, 3, and 4, respectively. The root mean squared error is 17 feet for 1980-1990 and 18 feet for 1990-2000 (Figures 10-14 and 10-15). The slight improvement in the root mean squared error for the transient calibration could simply be due to considering fewer wells than in the steady-state calibration.
The transient model does a reasonably good job of matching the measured monthly and annual water-level trends throughout most of the model area, with the exception of a shift between simulated and measured water levels (Figure 10-16). This shift in water levels has been carried over to the transient model from the steady-state model. In some wells, the shift was more pronounced than in others. This discrepancy is probably due to local-scale heterogeneity in the aquifer materials that we were unable to capture at the scale of the regional model as we averaged the aquifer properties within a model cell. Chowdhury and others (2003) also observed that, in some wells, simulated water levels for 1991 and 1992 were underestimated when there was considerable pumping. It is possible that the measured water levels for these years were taken during the winter months when the water level was high or that the wells had screen intervals in more than one aquifer. It is also possible that the shift in water levels could be caused by the calibration values that should coincide with the nodes of the model cells but in most cases they do not.
The specific yield values of 0.001 to 0.0005 that Chowdhury and others (2003) used in the transient calibration may appear low for the unconfined portions of the aquifer. Typical specific yields of sedimentary materials in unconfined aquifers range from 0.14 to 0.38 (Freeze and Cherry, 1979). They attempted to calibrate the model using higher specific yields but were unable to reproduce the required fluctuations to match the measured water levels. The lower specific yield that they used is more typical of semi-confined aquifers. They felt that the lower specific yields were appropriate for the Chicot, Evangeline, and the Jasper aquifers as the aquifers contain numerous clay beds and silt and clay lenses within the sands.

196
Figure 10-14. Comparison of simulated to measured water levels for 1990 for the southern part of the Gulf Coast aquifer (from Chowdhury and Mace, 2003).
Figure 10-15. Comparison of simulated to measured water levels for 2000 for the southern part of the Gulf Coast aquifer (from Chowdhury and Mace, 2003).

197
Figure 10-16. Comparison of simulated and measured water-level fluctuations in several wells for 1980 through 1999 for (a) well 8860701, (b) well 8756701, and (c) well 8763601 for the GAM of the southern part of the Gulf Coast aquifer (from Chowdhury and Mace, 2003).

198
Water Budget
A useful result of groundwater modeling is the ability to account for water budget on various components of flow in the aquifer. Water budgets provide information on where the water is coming from and where it is going. We summarize the results of the water budgets for each of the modeling projects below.
Northern Part of the Gulf Coast Aquifer
Simulation results indicate that total recharge through the outcrop areas in the steady-state was about 220,000 acre-feet per year (0.17 inches per year). Recharge mainly occurs through the outcrop of the Chicot aquifer (about 140,000 acre-feet per year); smaller quantities recharge through the Evangeline (about 49,000 acre-feet per year) and the Jasper aquifers (about 33,000 acre-feet per year); and negligible quantities recharge through the Burkeville Confining System (Kasmarek and Robinson, 2004). There are considerable differences between the pre-development and post-development recharge. Post-development recharge more than doubles to about 550,000 acre-feet per year in 1977 and 700,000 acre-feet per year in 2000 (Kasmarek and Robinson, 2004). Similarly, post-development discharge decreases from about 220,000 acre-feet per year to about 120,000 acre-feet per year in 1977 and to about 120,000 acre-feet per year in 2000. Therefore, much of the rejected recharge under pre-development condition is captured by the groundwater flow system to sustain groundwater pumping. It is notable that most of the recharge naturally discharges in the respective outcrops with only small fractions joining deeper, downdip parts of the aquifer.
Central Part of the Gulf Coast Aquifer
Chowdhury and others (2004) estimated the total volume of water that enters or leaves the system using the calibrated steady-state model. They found that about 540,000 acre-feet of water flows annually through the aquifer system. Of this total flow, 33 percent sources from rainfall that directly falls on the land surface in the outcrop areas of the model and 65 percent seeps into the aquifers from the numerous streams that cross the model area. When recharge values from rainfall alone are considered, they observed that about 66 percent of the recharge from rainfall infiltrates through the outcrops of the Chicot aquifer; about 21 percent infiltrates through the outcrops of the Evangeline aquifer; about 5 percent infiltrates through the outcrops of the Burkeville confining system; and about 8 percent through the outcrops of the Jasper aquifer.
Cross-formational flow between the different aquifers and the confining units are (1) about 20,000 acre-feet per year from the Evangeline aquifer to the overlying Chicot aquifer, (2) about 6,000 acre-feet per year from the Burkeville confining system to the overlying Evangeline aquifer, and (3) about 1,400 acre-feet per year from the Jasper aquifer to the Burkeville confining system.
Of the total annual flow of about 540,000 acre-feet, about 81 percent discharges into the streams and about 19 percent discharges into the Gulf of Mexico. Net loss of water from the aquifers

199
(baseflow discharge minus water inflow from the river) is about 46,500 acre-feet per year through the Chicot outcrop, about 24,000 acre-feet per year through the Evangeline outcrop, about 5,500 acre-feet per year through the Burkeville Confining System, and about 13,000 acre-feet per year through the Jasper outcrop. Both the reservoirs/lakes and the drains used to simulate the wetlands near the coast have only small volumes of water flowing through them.
The estimated water budget for the 1989 and 1999 calibration years are presented in Chowdhury and others (2004). They observed that stream discharge in 1989 is much lower than the pre-development model. The reduction in stream discharge in the transient model could presumably be attributed to groundwater pumping. Groundwater pumping is likely to capture groundwater flow that would have otherwise discharged naturally, causing reduced flow into and out of the streams. Discharge to the Gulf of Mexico is reduced in 1989 compared to the pre-development model. This observation is consistent with the findings from other recently developed models on the Gulf Coast aquifer system (Dutton and Richter, 1990; Ryder and Ardis, 2002; Kasmarek and Robinson, 2004).
Total recharge was considerably higher in 1989 than in the pre-development model probably due to capture of natural discharge (Chowdhury and others, 2004). Under natural conditions, groundwater recharge is balanced by discharge (Theis, 1940; Domenico and Schwartz, 1998). However, with continued decline in water level, a dynamic equilibrium is achieved either by increasing recharge and/or decreasing natural discharge. Recharge decreases again in 1999, coincident with the recovery of the water levels in the aquifer. Recovery of the water levels in 1999 occurs despite the fact that groundwater pumping in 1999 is at the same level as in 1989. Pumping in 1989 and 1999 are, however, considerably lower (by about 33 percent) compared to pumping of the early 1980s. This is probably why there is more recovery of the water levels in 1999. With the recovery of water levels in 1999, there is also a sharp decline in the amount of water movement out of storage into the flow system. This recovery in the water levels also results in an increase in stream discharge.
Southern Part of the Gulf Coast Aquifer
Chowdhury and Mace (2003) estimated the total volume of water that enters or leaves the system using the calibrated steady-state model. They found that about 87,000 acre-feet per year of water flows through the aquifer system. Of this total flow, 47 percent comes from rainfall that directly falls on the land surface in the outcrop areas of the model and 53 percent seeps into the aquifers from the Rio Grande. Nearly 62 percent of the total recharge from rainfall percolates through the Chicot outcrop; 32 percent percolates through the Evangeline outcrop; and the remainder (6 percent) percolates through the thin sliver of the Jasper outcrop. Of the total flow of about 87,000 acre-feet per year, 3 percent is lost through evapotranspiration, 15 percent discharges through pumping that existed during the 1980s, 32 percent flows into the Rio Grande and Arroyo Colorado, and 50 percent discharges to the Matagorda Bay and Gulf of Mexico. The amount of groundwater lost through evapotranspiration may appear low at the regional scale, but evapotranspiration may locally comprise up to 30 percent of recharge under steady-state conditions.

200
Conclusions
The Gulf Coast aquifer of Texas has had a number of models developed to better understand its flow characteristics and to provide management tools. The most recent models have been developed under the GAM program. Conclusions resulting from these modeling efforts are described below.
Northern Part of the Gulf Coast Aquifer
The calibrated model shows general agreement between simulated and measured water levels. The model reproduces the cones of depression in areas with excessive groundwater pumping. However, the model was unable to reproduce maximum depths of the cones of depression in some drawdown areas. The root mean squared errors that measure differences between simulated and measured water levels for 1977 are 34 feet for the Chicot aquifer, 43 feet for the Evangeline aquifer, and 47 feet for the Jasper aquifer. The root mean squared error for 2000 was 31 feet for the Chicot aquifer, 40 feet for the Evangeline aquifer, and 34 feet for the Jasper aquifer. Simulated hydrographs recording water level changes through the calibration period matches closely to measured hydrographs. Simulation results indicate that total recharge through the outcrop areas in the steady-state was about 220,000 acre-feet per year (0.17 inches per year). There are considerable differences between the pre-development and post-development recharge. Post-development recharge more than doubles to 550,000 acre-feet per year in 1977 and 700,000 acre-feet per year in 2000. Post-development discharge similarly decreases from about 220,000 acre-feet per year to about 120,000 acre-feet per year in 1977, and about 120,000 acre-feet per year in 2000. Therefore, much of the rejected recharge under pre-development conditions is captured by the groundwater flow system to sustain groundwater pumping. Most of the recharge naturally discharges in the respective outcrops, with only small fractions joining deeper, downdip parts of the aquifer. Simulated land-surface subsidence closely matches measured subsidence in the Harris-Galveston-Fort Bend county area.
Central Part of the Gulf Coast Aquifer
The calibrated model does a reasonable job of matching spatial distributions of water levels and water-level changes in well hydrographs with our data. The model reproduces the drawdown cones observed in Wharton, Victoria, and Kleberg counties in 1989 and 1999. The root mean squared error for calibration is about 21 feet for the pre-development period, 46 feet for 1989, and 36 feet for 1999.
About 540,000 acre-ft of water flows annually through the central Gulf Coast aquifer system in the pre-development model. Of this flow, 33 percent comes from rainfall and 65 percent seeps into the aquifers from the streams. Of the total annual flow of about 540,000 acre-feet, about 81 percent discharges into the streams, and about 18 percent discharges through the general head boundary into the Gulf of Mexico. Net loss of water from the aquifers (baseflow discharge minus water inflow from the river) is about 46,500 acre-feet per year through the Chicot outcrop, about 24,000 acre-feet per year through the Evangeline outcrop, about 5,500 acre-feet per year through

201
the Burkeville Confining System outcrop, and about 13,000 acre-feet per year through the Jasper outcrop.
Southern Part of the Gulf Coast Aquifer
The calibrated model generally replicates the spatial distribution of the water levels, maintaining the interpreted groundwater flow direction towards Gulf of Mexico and Rio Grande. The root mean squared error of the calibrated steady-state model is 23 feet—about 4.4 percent of the hydraulic head drop across the model area. The modelers used about 0.52 percent of the average annual rainfall for 1930 to 1980 to calibrate the steady-state model. They found that about 87,000 acre-feet per year of water flows through the aquifer system. Of the total flow, 47 percent comes from rainfall and 53 percent seeps into the aquifers from the Rio Grande. Cross-formational flow is a significant component of the total flow, with deeper groundwater from the Evangeline aquifer reaching upwards into the down-dip areas of the Chicot aquifer.
Acknowledgments
The U.S. Geological Survey developed the model for the northern part of the Gulf Coast aquifer with financial support from the Texas Water Development Board and the Harris-Galveston Subsidence District. Mr. Mark Kasmarek of the U.S. Geological Survey graciously provided figures and information for the northern part of the Gulf Coast aquifer.
References
Anderson, M. P., and Woessner, W. W., 1992, Applied groundwater modeling—Simulation of flow and advective transport: Academic Press, San Diego, 381 p.
Baker, Jr., E. T., and Wall, J. R., 1976, Summary appraisals of the nation’s groundwater resources—Texas Gulf region: U.S. Geological Survey Open-File Report, 61 p.
Baker, Jr., E. T., 1979, Stratigraphic and hydrogeologic framework of part of the coastal plain of Texas: Texas Department of Water Resources, Report 236, 43 p.
Baker, Jr., E. T., 1986, Hydrogeology of the Jasper aquifer in the southeast coastal plain: Texas Water Development Board Report 295, 64 p.
Carr, J. E., Sandeen, W. M., and McLane, I. R., 1985, Digital models for simulation of groundwater hydrology of the Chicot and Evangeline aquifers along the Gulf Coast of Texas: Texas Department of Water Resources Report 289, 101 p.
Chowdhury, A. H., and Mace, R. E., 2003, A groundwater availability model of the Gulf Coast aquifer in the Lower Rio Grande Valley, Texas—Numerical simulations through 2050: Texas Water Development Board Report, 171 p.
Chowdhury, A. H., Wade, S., Mace, R. E., and Ridgeway, C., 2004, Groundwater availability model for the central part of the Gulf Coast aquifer—Numerical simulations through 1999: Texas Water Development Board Report, 163 p.

202
Chowdhury, A. H., Bogichi, R., and Hopkins, J., this volume, Hydrochemistry, salinity distribution, and trace constituents—Implications for salinity sources, geochemical evolution, and flow system characterization, Texas Gulf Coast aquifer: Texas Water Development Board Report 365, p. 81–128.
Domenico, P. A. and Schwartz, F. W., 1998, Physical and chemical hydrogeology, New York, Wiley, 506 p.
Dutton, A. R., and Richter, B. C., 1990, Regional hydrogeology of the gulf coast aquifer in Matagorda and Wharton counties, Texas—Development of a numerical flow model to estimate the impact of water management strategies: Report prepared for the Lower Colorado River Authority under contract (88-89) 0910, Bureau of Economic Geology, The University of Texas at Austin, 118 p.
Freeze, R. A., and Cherry, J. A., 1979, Groundwater: Prentice Hall, Englewood Cliffs, New Jersey, 604 p.
Gabrysch, R. K., 1982, Groundwater withdrawals and land-surface subsidence in the Houston-Galveston region, Texas, 1906-80: U.S. Geological Survey Open-File Report 82-571, 58 p.
Gabrysch, R. K., 1984, Case history no. 9.12. The Houston-Galveston region, Texas, USA. in Poland, J. F., editor, Guidebook to studies of land subsidence due to groundwater withdrawal: UNESCO Studies and Reports in Hydrology 20, p. 253–262.
Groschen, G. E., 1985, Simulated effects of projected pumping on the availability of freshwater in the Evangeline aquifer in an area southwest of Corpus Christi, Texas: U.S. Geological Survey Water Resources Investigation Report 85-4182, 103 p.
Harbaugh, A. W., and McDonald, M. G., 1996, User’s documentation for MODFLOW-96, an update to the U.S. Geological Survey modular finite-difference ground-water flow model: U.S. Geological Survey Open-File Report 96-485, 56 p.
Harden and Associates, 2002, Availability of brackish groundwater from the Rio Grande alluvium, Cameron County, Texas: consultant report for the Southmost Regional Water Authority, 23 p.
Hay, R., 1999, A numerical groundwater flow model of the Gulf Coast aquifer along the South Texas Gulf Coast: M. S. Thesis, Texas A&M University—Corpus Christi, 47 p.
Jorgensen, D. G., 1975, Analog model studies of groundwater hydrology in the Houston district, Texas: Texas Water Development Board Report 190, 84 p.
Kasmarek, M. C., and Strom, E. W., 2002, Hydrogeology and simulation of ground-water flow and land surface subsidence in the Chicot and Evangeline aquifers, Houston area, Texas: U.S. Geological Survey, Water Resources Investigation Report 02-4022, 62 p.
Kasmarek, M. C., and Robinson, J. L., 2004, Hydrogeology and simulation of groundwater flow and land surface subsidence in the northern part of the Gulf Coast Aquifer System: U.S. Geological Survey Scientific Investigations Report, 2004-5102, 111 p.
Leake, S. A., and Prudic, D. E., 1991, Documentation of a computer program to simulate aquifer-system compaction using the modular finite-difference groundwater flow model:

203
U.S. Geological Survey Techniques of Water-Resources Investigations, Book 6, chapter A 2, 68 p.
Mace, R. E., 2001, Regional groundwater flow modeling in Texas: Texas Water Development Board (http://www.twdb.state.tx.us/gam/GAM_documents/texas_modeling.pdf).
Mace, R. E., Ridgeway, C., and Sharp, J., 2004, Groundwater is no longer secret and occult—A historical and hydrological analysis of the East case: Texas Water Development Board Report 361, Conference Proceedings 100 Years of Rule of Capture: From East to Groundwater Management, 26 p.
McCoy, T. W., 1990, Evaluation of groundwater resources in the Lower Rio Grande Valley, Texas: Texas Water Development Board Report 316, 47 p.
Meyer, W. R., and Carr, J. E., 1979, A digital model for simulation of groundwater hydrology in the Houston area, Texas: Texas Department of Water Resources LP-103, 27 p.
Noble, J. E., Bush, P. W., Kasmarek, M. C., and Barbie, D. L., 1996, Estimated depth to the water table and estimated rate of recharge in outcrops of the Chicot and Evangeline aquifers near Houston, Texas: U.S. Geological Survey Water Resources Investigations Report 96-4018, 19 p.
Ryder, P. D., 1988, Hydrogeology and pre-development flow in the Texas Gulf Coast aquifer systems: U.S. Geological Survey Water Resources Investigation report 87-4248, 109 p.
Ryder , P. D., and Ardis, A. F., 2002, Hydrology of the Texas Gulf Coast aquifer systems: U. S. Geological Survey Professional Paper 1416-E, 77 p.
Strom, E. W., Houston, N. A., and Garcia, C.A., 2003a, Selected hydrogeologic datasets for the Chicot aquifer, Texas: U.S. Geological Survey Open file Report 03-297, 1 CD-ROM.
Strom, E. W., Houston, N. A., and Garcia, C.A., 2003b, Selected hydrogeologic datasets for the Evangeline aquifer, Texas: U.S. Geological Survey Open file Report 03-298, 1 CD-ROM.
Strom, E. W., Houston, N. A., and Garcia, C. A., 2003c, Selected hydrologic data sets for the Jasper aquifer: U.S. Geological Survey Open File Report 03-299, 1 CD-ROM.
Theis, C. V., 1940, The source of water derived from wells—Essential factors controlling the response of an aquifer to development: Civil Engineering, American Society of Civil Engineers, p. 277-280.
TWDB, 2002, Water for Texas 2002: Texas Water Development Board Report, variously paginated.
Waterstone, 2003, Groundwater availability of the central Gulf Coast aquifer—Numerical simulations to 2050, Central Gulf Coast, Texas: Draft contract report submitted to Texas Water Development Board, Austin, Texas, variously paginated.
Wesselman, J. B., 1967, Groundwater resources of Jasper and Newton counties, Texas: Texas Water Development Board Report 59, 167 p.
Wood, L. A., and Gabrysch, R. K., 1965, Analog model study of groundwater in the Houston district, Texas: Texas Water Commission Bulletin 6503, 103 p.

204
This page intentionally blank.
Related Documents