324 CHAPTER 10 FINITE ELEMENT SIMULATION OF CUTTING PROCESSES 10.1 INTRODUCTION This chapter deals with the Finite-Element Method (FEM) of machining and simulation. Results about the influence of working conditions and tool geometry (cutting-edge finishing) on tool forces, temperatures, stresses, strain and velocity when machining Al7075-T6 are presented. The aim of the chapter is to demonstrate the possibilities of FEM for understanding the chip formation process in machining and to show its capabilities in areas like tool insert design. There have been numerous applications of FEM in chip formation processes. Initially, custom-made codes and later, basically with general- purpose software like Abaqus TM , ALGOR TM (metal forming), DEFORM- 3D TM , MARC TM , LS DYNA TM , and FLUENT TM . In addition, two specific commercial software programs seemed on the market during the last decade: AdvantEdge™ and DEFORM™. Advant- Edge and DEFORM-2D/-3D both programs provide an interface to the end user, in order to ease the introduction of process parameters and in a way make transparent those subjects dealing with the mathematical theory of the finite-element method. DEFORM is software specialized in modeling machining operations in 2D and 3D based on an

Welcome message from author
This document is posted to help you gain knowledge. Please leave a comment to let me know what you think about it! Share it to your friends and learn new things together.
Transcript
324
CHAPTER 10
FINITE ELEMENT SIMULATION OF
CUTTING PROCESSES
10.1 INTRODUCTION
This chapter deals with the Finite-Element Method (FEM) of
machining and simulation. Results about the influence of working conditions
and tool geometry (cutting-edge finishing) on tool forces, temperatures,
stresses, strain and velocity when machining Al7075-T6 are presented. The
aim of the chapter is to demonstrate the possibilities of FEM for
understanding the chip formation process in machining and to show its
capabilities in areas like tool insert design.
There have been numerous applications of FEM in chip formation
processes. Initially, custom-made codes and later, basically with general-
purpose software like AbaqusTM, ALGORTM (metal forming), DEFORM-
3DTM, MARCTM, LS DYNATM, and FLUENTTM. In addition, two specific
commercial software programs seemed on the market during the last decade:
AdvantEdge™ and DEFORM™.
Advant- Edge and DEFORM-2D/-3D both programs provide an
interface to the end user, in order to ease the introduction of process
parameters and in a way make transparent those subjects dealing with the
mathematical theory of the finite-element method. DEFORM is software
specialized in modeling machining operations in 2D and 3D based on an

325
implicit integration method, with fully coupled thermo-mechanical analysis.
Since the formulation is Lagrangian, an adaptive remeshing technique is used
to reduce the mesh distortions when the chip is formed. Several material
constitutive laws can be used to model the material behavior (Oxley’s
equation, Johnson–Cook equation, among others). A material database can be
found in this software, both for tool and workpiece materials. For modeling
the contact at the tool–chip interface, a constant shear factor friction law or
Coulomb friction law can be employed. Workpiece and tool geometries
should be configured by the user, both in terms of the external dimensions and
those of the mesh of the two parts. However, coating layers can be
implemented in the tool. Also remarkable is the availability of loading some
existing geometries of tools and tool holders from a database incorporated in
the program.
The objective of this work is to set up two FEM reference models
to study two dimensional and three-dimensional cutting operations. In order
to reduce the experimental costs, FEM of machining can be employed to
qualitatively predict tool forces, stress, temperature, strain, strain rate and
velocity fields.
10.2 CONSTITUTIVE MODELS FOR WORK MATERIAL FLOW
STRESS
The flow stress or instantaneous yield strength at which work
material starts to plastically deform or flow is mostly influenced by
temperature, strain, strain rate, and other factors. Accurate and reliable flow
stress models are considered highly necessary to represent work material
constitutive behavior under high-speed cutting conditions especially for a
(new) material. Therefore, semi-empirical constitutive models are widely
utilized. The constitutive model proposed by Johnson and Cook (Johnson
&Cook 1983) describes the flow stress of a material with the product of
326
strain, strain rate and temperature effects that are individually determined as
given in Equation (10.1). In order to reduce the number of experiments
constitutive material laws are needed. The constitutive material law has to
describe the plastic behaviour in dependence for a wide range of strain, strain
rate and temperature. For the simulation several material models have been
developed, which consider strain hardening, strain rate hardening and thermal
softening. Most of material laws are of empirical nature. Empirical material
laws ( Flow stressdf ( , ,T)dt
) describe the flow stress as a function of strain,
strain rate and temperature. Empirical material laws contain specific material
constants, which will be determined by regression analyses or by the least
squares method based on the experimental measured flow stress curves.
m
n room
0 melt room
T TA B .(1 Cln( )). 1T T
(10.1)
0
(1 Cln( )) viscous damping,m
room
melt room
T T1T T
, temperature
function, Material constants: A, B, n, C, m,Reference velocity: 0 ,Room
temperature: roomT ,Melting temperature: meltT .In the Johnson–Cook (JC)
model, the parameter A is in fact the initial yield strength of the material at
room temperature and a strain rate of 1s-1 and represents the plastic
equivalent strain. The strain rate is normalized with a reference strain rate 0.
Temperature term in the JC model reduces the flow stress to zero at the
melting temperature of the work material, leaving the constitutive model with
no temperature effect. In general, the parameters A, B, C, n and m of the
model are fitted to the data obtained by several material tests conducted at
low strains and strain rates. The JC model provides a good fit for strain-
327
hardening behavior of metals and it is numerically robust and can easily be
used in finite element simulation models (Jaspers &Dautzenberg 2002).
10.3 TWO-DIMENSIONALFINITE ELEMENT SIMULATION
OF CUTTING PROCESSES
Machining operations such as orthogonal metal cutting are complex
nonlinear and coupled thermomechanical processes. The complexities are due
to large strain and high strain-rate in the primary shear zone and due to the
contact and friction between the chip and tool along the secondary shear zone.
In addition to the above, complexities are also caused by local heat generated
through the conversion of plastic work in the chip during.
Chip formation and the frictional work between the tool and chip.
An undesired byproduct of the metal cutting process is the creation of residual
stresses and strains in the freshly cut workpiece, which is known to affect the
integrity of the newly finished surface, including shortened creep and fatigue
lives of the machined component under service loads. Hence a careful
assessment of the residual stress and strain fields in the workpiece is
necessary for optimizing the cutting process and for safeguarding against the
premature failure of machined parts under creep and fatigue loading
conditions.
A simulation procedure has been developed through the use of
several advanced modeling options in the general-purpose code deform 2D.
An updated Lagrangian formulation suitable for large strain deformations is
employed. Plane strain conditions are assumed. Strain-rate effects are
included with an overstress viscoplastic constitutive model. Frictional contact
along the tool-chip interface is made to obey a modified moulombfriction law.
Adiabatic heating conditions are used to account for temperature rise due to
local heating induced by plasticity and friction. Chip separation from the

328
workpiece is modeled using a stress-based chip separation criterion.
Temperature-dependent material properties are considered. This investigation
provides a detailed exposition of stress, strain, temperature, velocity and
cutting force field evolution at different stages after cutting, and of the
formation of residual stresses and strains near the finished surface of the
workpiece.
This two-dimensional finite element simulation of cutting processes
investigates the effect of nose radius, cutting speed, cutting feed with a
constant depth of cut.
The material properties (Mechanical Properties, Thermal Properties),
cutting tool properties and material constants for the process simulation is as
shown below Tables10.1- 10.3.
Table 10.1 Material properties of Al7075-T6
Mechanical Properties Hardness ,brinell 150Ultimate tensile strength 572MPaTensile yield strength 503MPaModulus of elasticity 71.7GpaPoission’s ratio 0.33Fatigue strength 159MPaShear modulus 26.9GPaShear strength 330MPa
Thermal Properties Heat capacity 0.96J/gºCThermal conductivity 130W/m-K Melting point 477-635ºC
329
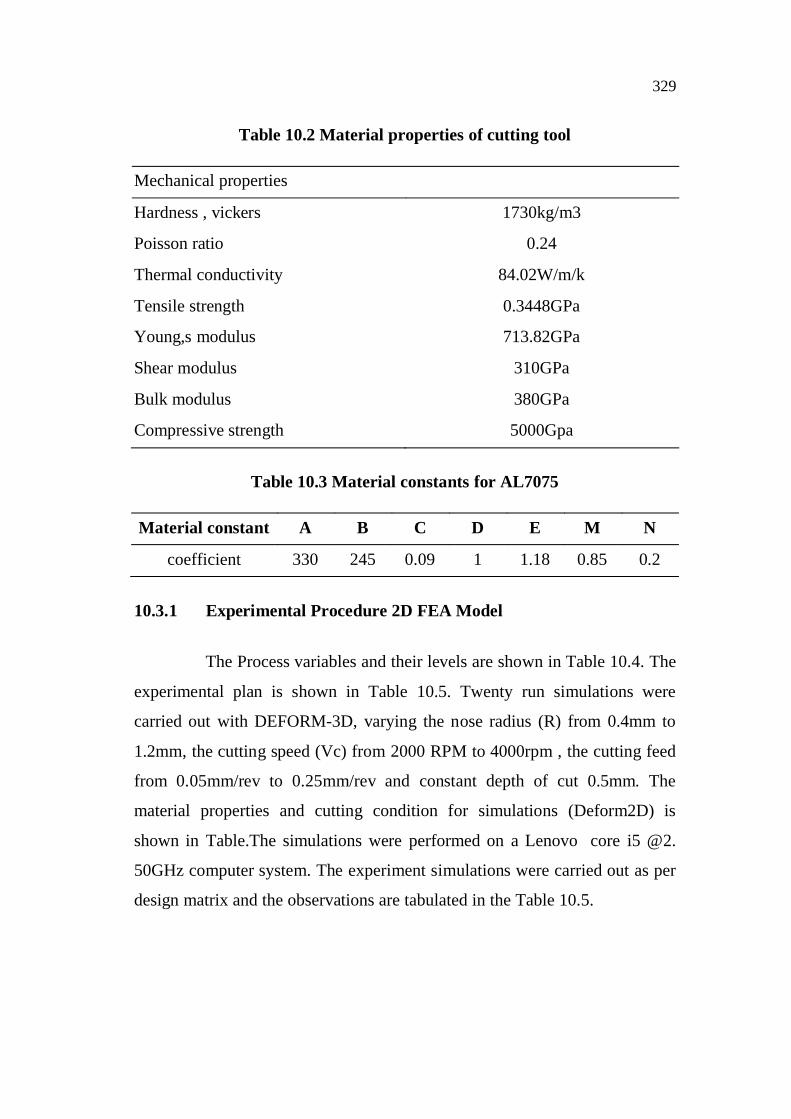
Table 10.2 Material properties of cutting tool
Mechanical properties
Hardness , vickers 1730kg/m3
Poisson ratio 0.24
Thermal conductivity 84.02W/m/k
Tensile strength 0.3448GPa
Young,s modulus 713.82GPa
Shear modulus 310GPa
Bulk modulus 380GPa
Compressive strength 5000Gpa
Table 10.3 Material constants for AL7075
Material constant A B C D E M N
coefficient 330 245 0.09 1 1.18 0.85 0.2
10.3.1 Experimental Procedure 2D FEA Model
The Process variables and their levels are shown in Table 10.4. The
experimental plan is shown in Table 10.5. Twenty run simulations were
carried out with DEFORM-3D, varying the nose radius (R) from 0.4mm to
1.2mm, the cutting speed (Vc) from 2000 RPM to 4000rpm , the cutting feed
from 0.05mm/rev to 0.25mm/rev and constant depth of cut 0.5mm. The
material properties and cutting condition for simulations (Deform2D) is
shown in Table.The simulations were performed on a Lenovo core i5 @2.
50GHz computer system. The experiment simulations were carried out as per
design matrix and the observations are tabulated in the Table 10.5.
330
Table10.4 Process variables and their lives – (3 factors and 5 levels) for two dimensional finite element simulation of cutting processes
Parameters Notation Units Levels
-1.682 -1 0 1 1.682
Nose radius R mm 0.4 0.6 0.8 1 1.2
Cutting speed Vc rpm 2000 2500 3000 3500 4000
Cutting Feed fz mm/rev 0.05 0.1 0.15 0.20 0.25
Table 10.5 Experimental plan and results obtained from 2D FEA model
Test No.
Control factors Responses
R(mm)
Vc (mm/rev)
Vf
(mm/tooth) StrainStress(Mpa)
Velocity(mm/sec)
Cutting zone
Temp (ºC)
Fx
(N)Fy
(N)
Resultant cutting force F(N)
1 -1 -1 -1 8.2 707 7350 434 96.4 53.5 110.25072 1 -1 -1 11.3 705 5650 406 117 113 162.65923 -1 1 -1 8.24 715 6710 421 101 49.8 112.61014 1 1 -1 11.1 712 6730 438 116 118 165.4695 -1 -1 1 5.08 717 4500 444 185 57.4 193.70026 1 -1 1 8.4 698 3760 449 203 132 242.14257 -1 1 1 4.74 704 6540 469 184 59 193.22788 1 1 1 8.76 692 7120 476 199 138 242.16739 -1.682 0 0 4.21 735 5940 435 135 36.6 139.873410 1.682 0 0 10.5 697 5650 452 164 149 221.578411 0 -1.682 0 9.29 707 4210 409 159 98.6 187.090812 0 1.682 0 7.2 700 7400 467 152 98.6 171.179413 0 0 -1.682 11.6 730 7690 387 70.4 84.4 109.906914 0 0 1.682 5.94 702 5260 476 239 107 261.858715 0 0 0 8.73 705 5750 443 154 106 186.954516 0 0 0 8.93 709 5760 443 154 106 189.954517 0 0 0 8.73 704 5740 443 154 106 182.954518 0 0 0 8.83 707 5760 443 154 106 189.954519 0 0 0 8.76 704 5770 443 154 106 181.954520 0 0 0 8.73 702 5750 443 154 106 187.9545
331
The simulations were run as per design matrix and simulation
example output results are shown below the Figures 10.1 -10.5.
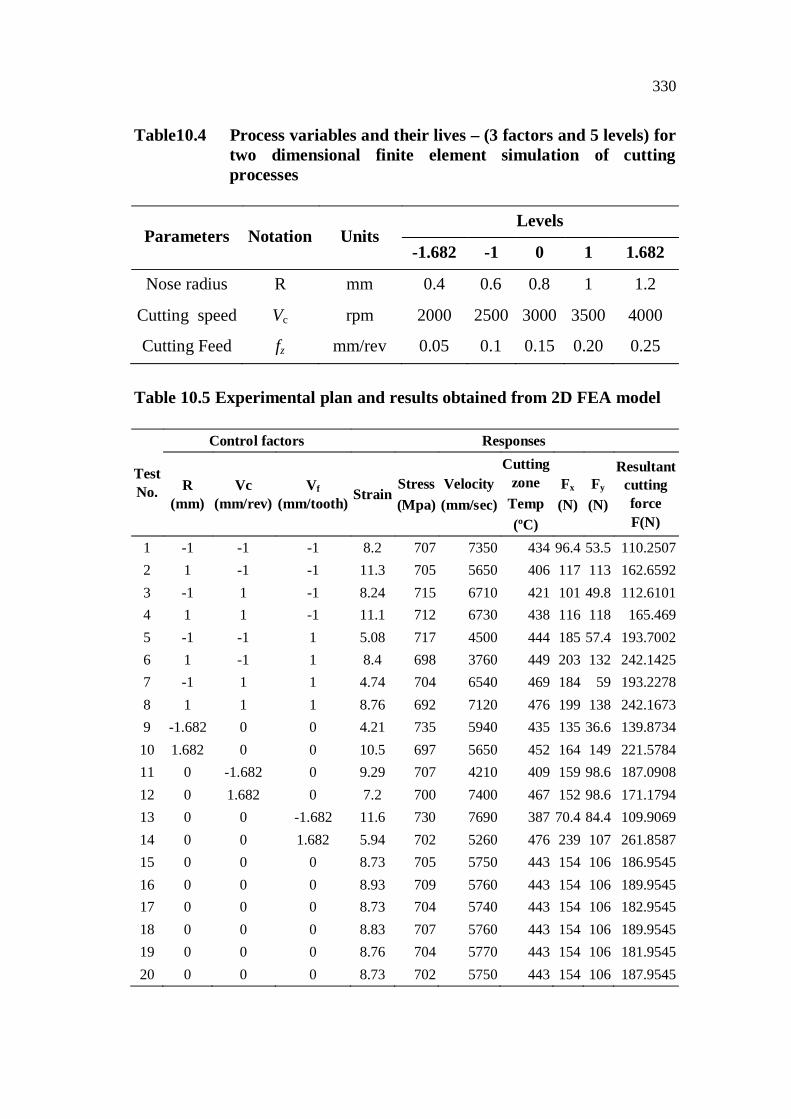
Figure10.1Anexample of cutting force obtained from the 2D FEA model
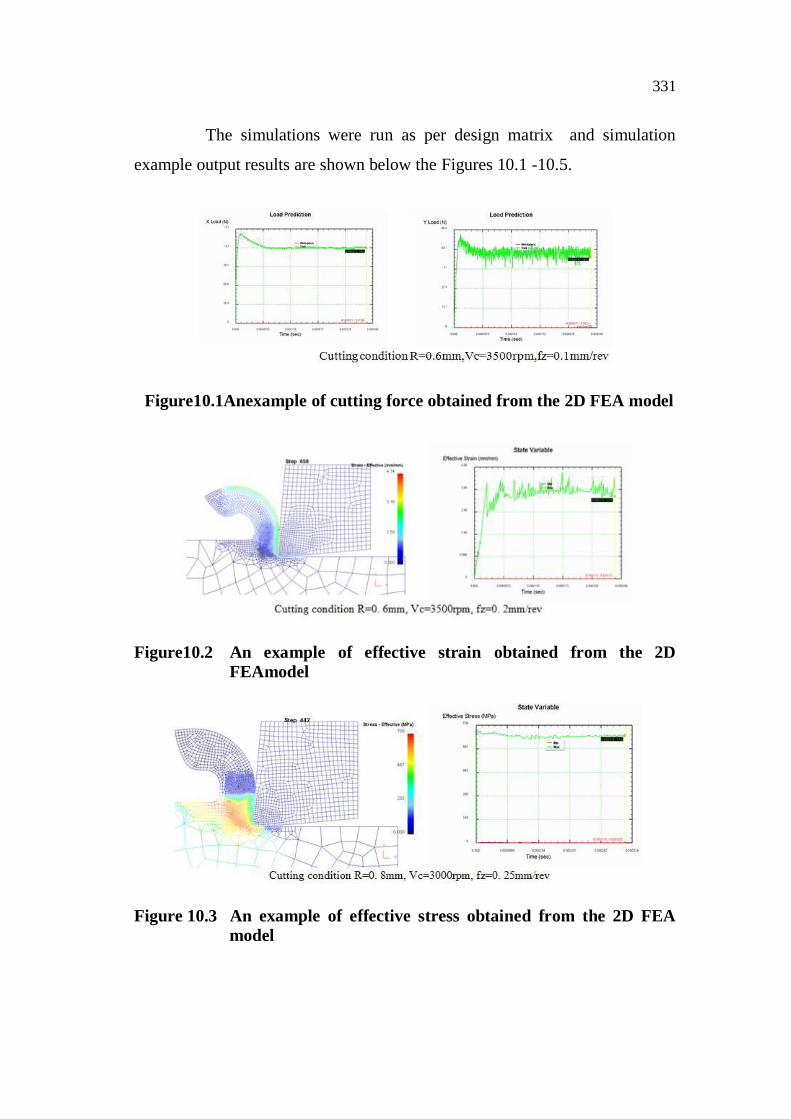
Figure10.2 An example of effective strain obtained from the 2D FEAmodel
Figure 10.3 An example of effective stress obtained from the 2D FEA model
332
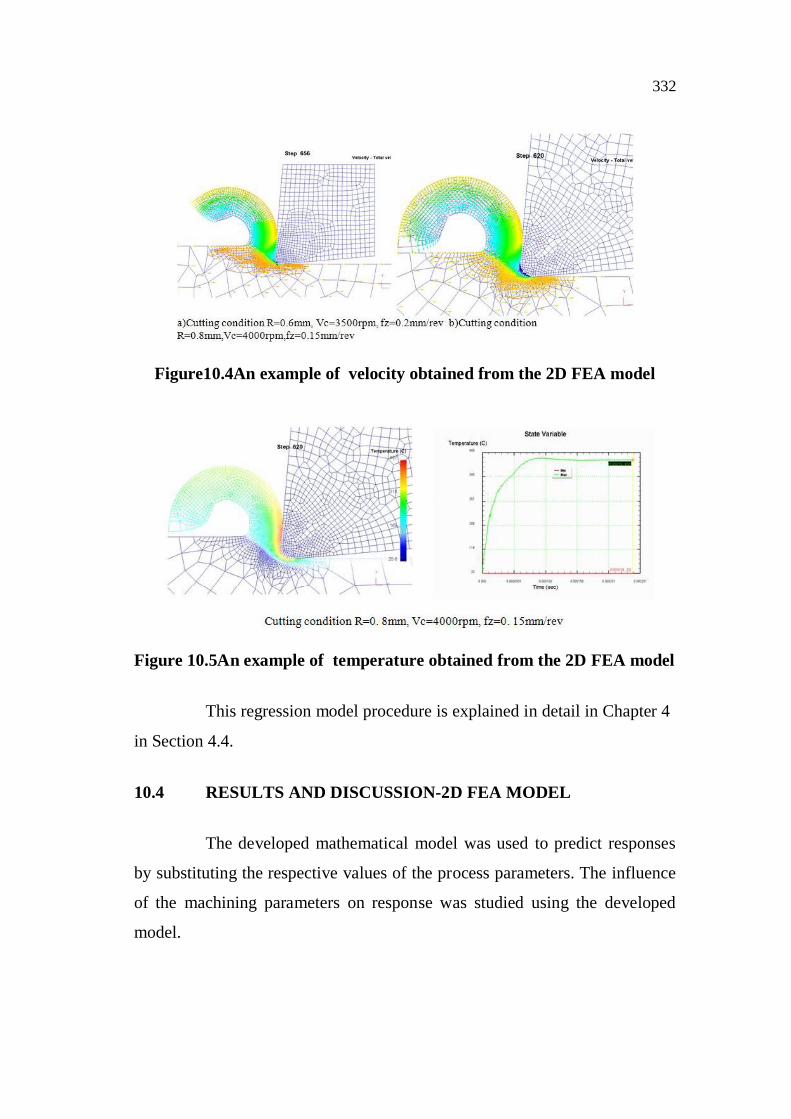
Figure10.4An example of velocity obtained from the 2D FEA model
Figure 10.5An example of temperature obtained from the 2D FEA model
This regression model procedure is explained in detail in Chapter 4
in Section 4.4.
10.4 RESULTS AND DISCUSSION-2D FEA MODEL
The developed mathematical model was used to predict responses
by substituting the respective values of the process parameters. The influence
of the machining parameters on response was studied using the developed
model.
333
10.4.1 Direct Effects of Machining Parameter on Response
The direct effect of process parameters was studied by keeping all
the machining parameters at the middle level except the parameter whose
direct effect was studied.
10.4.1.1 Effect of machining parameter on cutting force
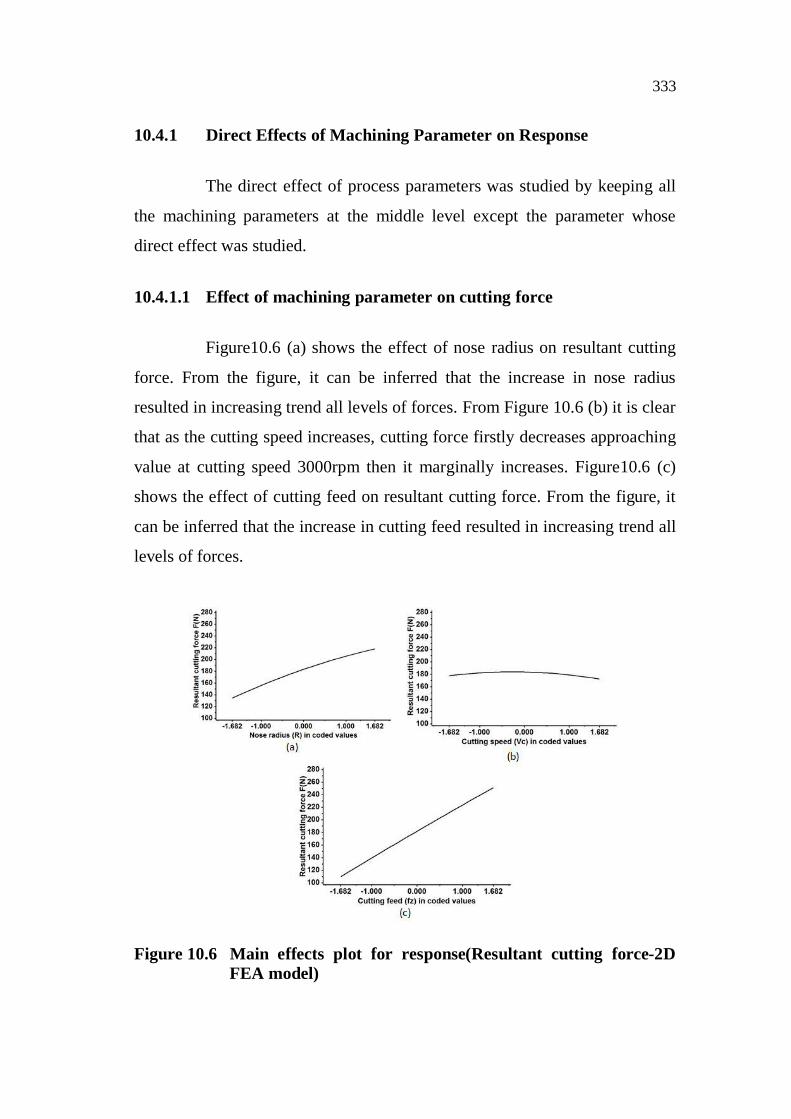
Figure10.6 (a) shows the effect of nose radius on resultant cutting
force. From the figure, it can be inferred that the increase in nose radius
resulted in increasing trend all levels of forces. From Figure 10.6 (b) it is clear
that as the cutting speed increases, cutting force firstly decreases approaching
value at cutting speed 3000rpm then it marginally increases. Figure10.6 (c)
shows the effect of cutting feed on resultant cutting force. From the figure, it
can be inferred that the increase in cutting feed resulted in increasing trend all
levels of forces.
Figure 10.6 Main effects plot for response(Resultant cutting force-2D FEA model)
334
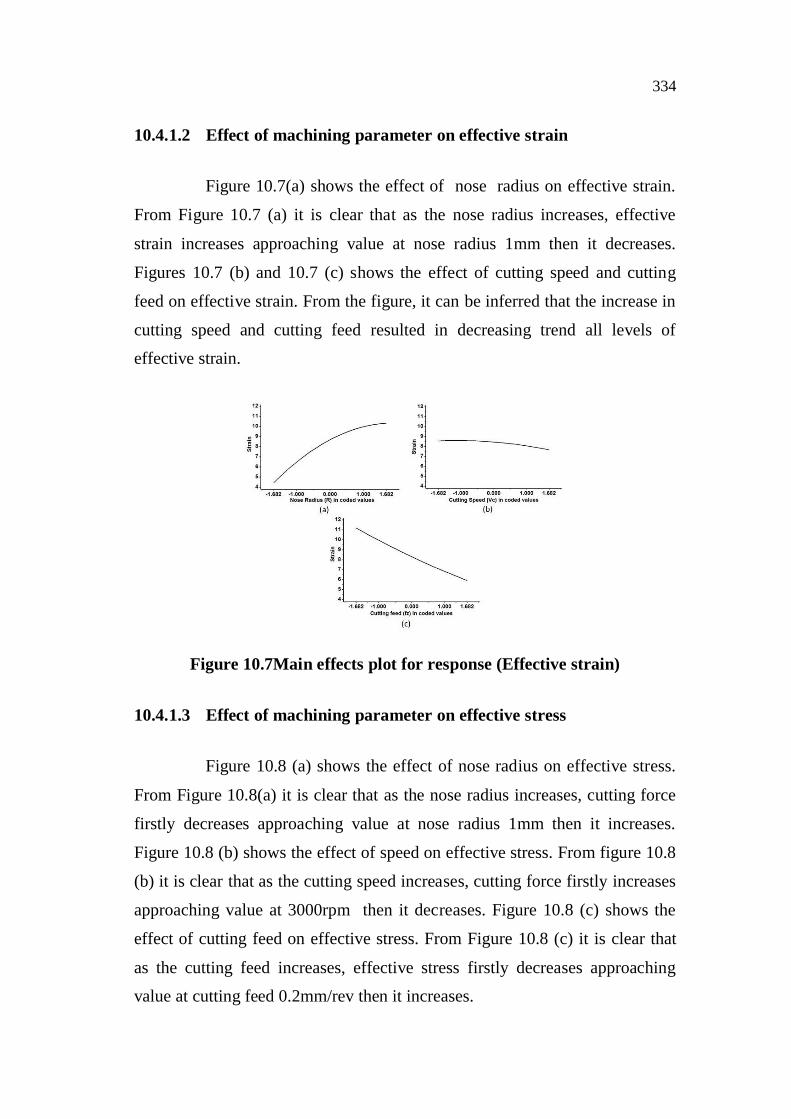
10.4.1.2 Effect of machining parameter on effective strain
Figure 10.7(a) shows the effect of nose radius on effective strain.
From Figure 10.7 (a) it is clear that as the nose radius increases, effective
strain increases approaching value at nose radius 1mm then it decreases.
Figures 10.7 (b) and 10.7 (c) shows the effect of cutting speed and cutting
feed on effective strain. From the figure, it can be inferred that the increase in
cutting speed and cutting feed resulted in decreasing trend all levels of
effective strain.
Figure 10.7Main effects plot for response (Effective strain)
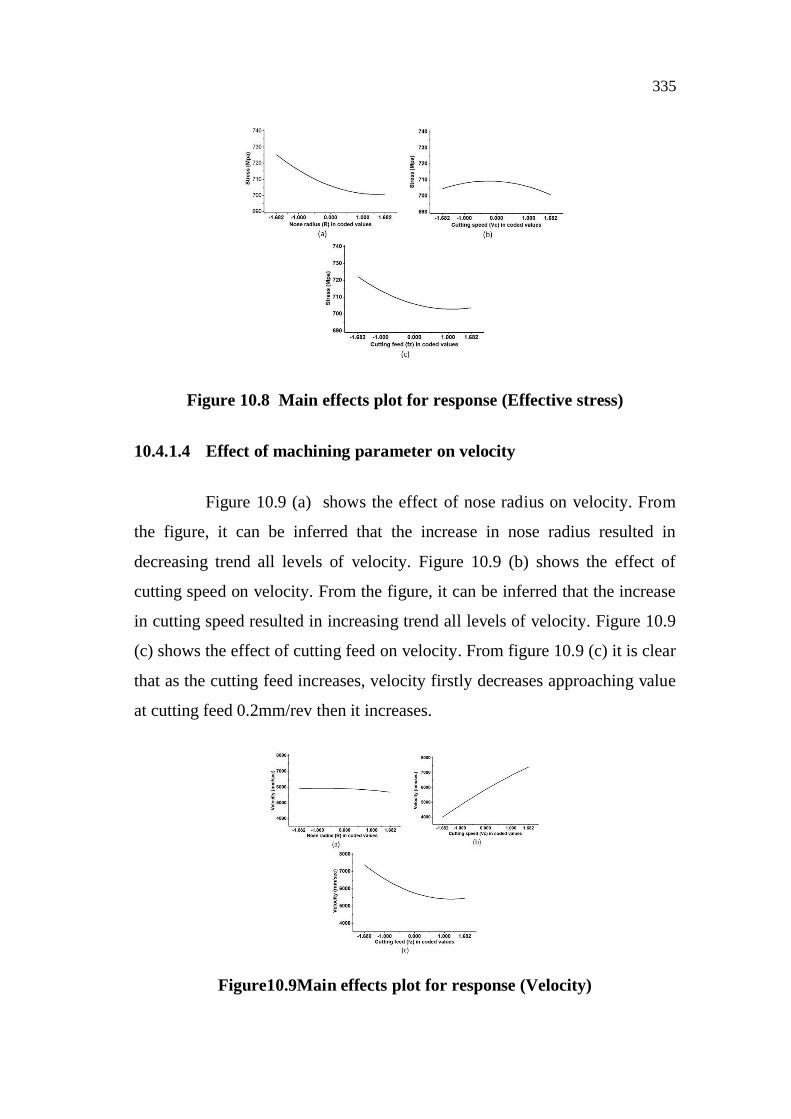
10.4.1.3 Effect of machining parameter on effective stress
Figure 10.8 (a) shows the effect of nose radius on effective stress.
From Figure 10.8(a) it is clear that as the nose radius increases, cutting force
firstly decreases approaching value at nose radius 1mm then it increases.
Figure 10.8 (b) shows the effect of speed on effective stress. From figure 10.8
(b) it is clear that as the cutting speed increases, cutting force firstly increases
approaching value at 3000rpm then it decreases. Figure 10.8 (c) shows the
effect of cutting feed on effective stress. From Figure 10.8 (c) it is clear that
as the cutting feed increases, effective stress firstly decreases approaching
value at cutting feed 0.2mm/rev then it increases.
335
Figure 10.8 Main effects plot for response (Effective stress)
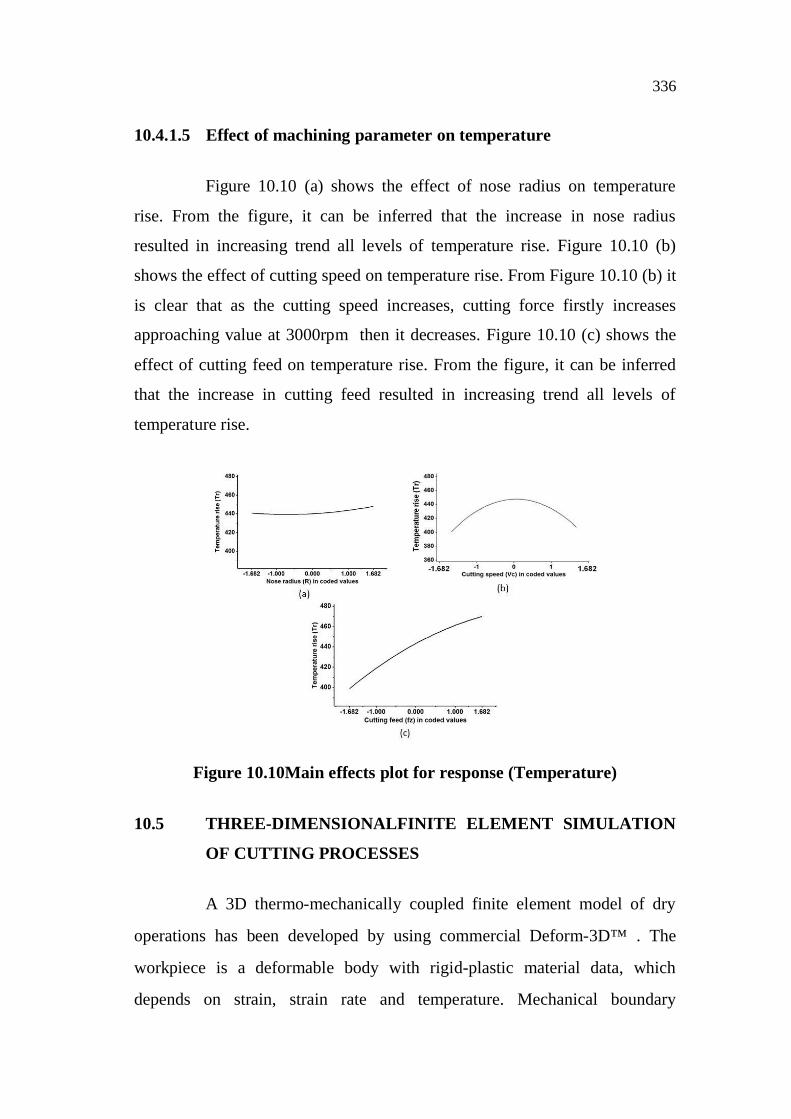
10.4.1.4 Effect of machining parameter on velocity
Figure 10.9 (a) shows the effect of nose radius on velocity. From
the figure, it can be inferred that the increase in nose radius resulted in
decreasing trend all levels of velocity. Figure 10.9 (b) shows the effect of
cutting speed on velocity. From the figure, it can be inferred that the increase
in cutting speed resulted in increasing trend all levels of velocity. Figure 10.9
(c) shows the effect of cutting feed on velocity. From figure 10.9 (c) it is clear
that as the cutting feed increases, velocity firstly decreases approaching value
at cutting feed 0.2mm/rev then it increases.
Figure10.9Main effects plot for response (Velocity)
336
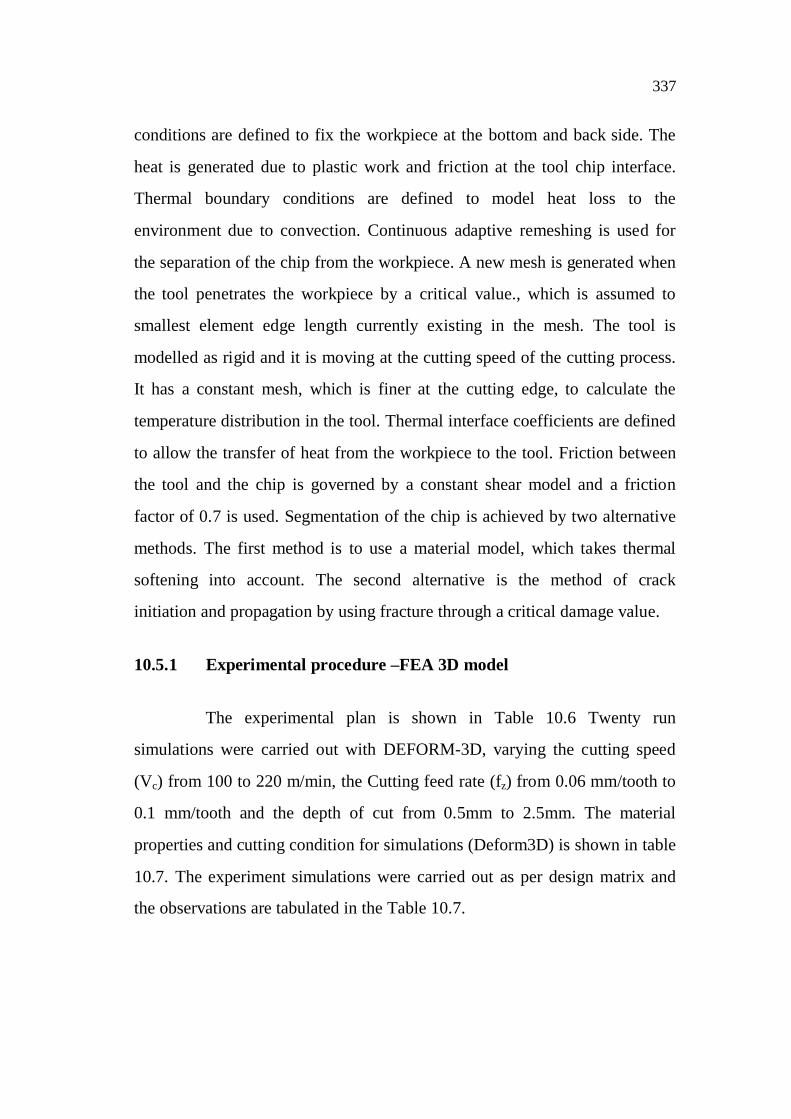
10.4.1.5 Effect of machining parameter on temperature
Figure 10.10 (a) shows the effect of nose radius on temperature
rise. From the figure, it can be inferred that the increase in nose radius
resulted in increasing trend all levels of temperature rise. Figure 10.10 (b)
shows the effect of cutting speed on temperature rise. From Figure 10.10 (b) it
is clear that as the cutting speed increases, cutting force firstly increases
approaching value at 3000rpm then it decreases. Figure 10.10 (c) shows the
effect of cutting feed on temperature rise. From the figure, it can be inferred
that the increase in cutting feed resulted in increasing trend all levels of
temperature rise.
Figure 10.10Main effects plot for response (Temperature)
10.5 THREE-DIMENSIONALFINITE ELEMENT SIMULATION
OF CUTTING PROCESSES
A 3D thermo-mechanically coupled finite element model of dry
operations has been developed by using commercial Deform-3D™ . The
workpiece is a deformable body with rigid-plastic material data, which
depends on strain, strain rate and temperature. Mechanical boundary
337
conditions are defined to fix the workpiece at the bottom and back side. The
heat is generated due to plastic work and friction at the tool chip interface.
Thermal boundary conditions are defined to model heat loss to the
environment due to convection. Continuous adaptive remeshing is used for
the separation of the chip from the workpiece. A new mesh is generated when
the tool penetrates the workpiece by a critical value., which is assumed to
smallest element edge length currently existing in the mesh. The tool is
modelled as rigid and it is moving at the cutting speed of the cutting process.
It has a constant mesh, which is finer at the cutting edge, to calculate the
temperature distribution in the tool. Thermal interface coefficients are defined
to allow the transfer of heat from the workpiece to the tool. Friction between
the tool and the chip is governed by a constant shear model and a friction
factor of 0.7 is used. Segmentation of the chip is achieved by two alternative
methods. The first method is to use a material model, which takes thermal
softening into account. The second alternative is the method of crack
initiation and propagation by using fracture through a critical damage value.
10.5.1 Experimental procedure –FEA 3D model
The experimental plan is shown in Table 10.6 Twenty run
simulations were carried out with DEFORM-3D, varying the cutting speed
(Vc) from 100 to 220 m/min, the Cutting feed rate (fz) from 0.06 mm/tooth to
0.1 mm/tooth and the depth of cut from 0.5mm to 2.5mm. The material
properties and cutting condition for simulations (Deform3D) is shown in table
10.7. The experiment simulations were carried out as per design matrix and
the observations are tabulated in the Table 10.7.

338
Table10.6Process variables and their levels –(3 factors and 5 levels )for three dimensional Finite Element Simulation of Cutting Processes
Parameters Notation Units Levels-1.682 -1 0 1 1.682
Cutting speed Vc m/min 100 130 160 190 220 Cutting Feed fz mm/tooth 0.06 0.07 0.08 0.09 0.10 Depth of cut ap mm 0.5 1 1.5 2 2.5
Table 10.7 shows the Experimental plan and results obtained from
3D FEA model
Table 10.7 Experimental plan and results obtained from 3D FEA model
Test No.
Control factors Observed value
Cutting speed Vc (m/min)
Feed rate Vf
(mm/tooth)
Depth of cut ap
(mm) strain
Stress (Mpa)
Velocity(mm/sec)
Cutting zone
Temp (ºC)
Fx
NFy
NFz
N
Tool Temperature
(ºC)
1 -1 -1 -1 19 692 19050 413 32.3 250 50.2 72.7 2 1 -1 -1 36.4 2858.7 27600 450 22.5 269 63.8 60.8 3 -1 1 -1 36.4 1449 14900 470 30.0 306 53 67.2 4 1 1 -1 67.3 99 24900 457 10.4 220 45.3 68.1 5 -1 -1 1 34.3 123 7300 466 52.9 688 101 69.4
6 1 -1 1 33.6 2970 40900 481 214 830 141 54.098
7 -1 1 1 29 1189 17700 539 92.9 719 109 78.2 8 1 1 1 32 495 55000 463 53.1 535 78.6 90.1
9 -1.682 0 0 40.7 318 18900 424 55 418 72.5 78.2
10 1.682 0 0 69.7 1524 56500 611 65.4 415 115 80.8 11 0 -1.682 0 9.8 2181 21100 535 27.5 531 78.3 67.3
12 0 1.682 0 32.7 696 29900 631 82.8 876 225 79.4 13 0 0 -1.682 22.9 1393 13700 537 15.2 149 41.9 57.3
14 0 0 1.682 18.2 1173 26700 509 69.9 726 76 58.7
15 0 0 0 38.9 942 69800 735 53.5 323 46.6 79.2 16 0 0 0 36.3 949 69700 466 63.5 404 77.1 80.2
17 0 0 0 38.9 942 69600 735 42.5 323 69.4 80.1
18 0 0 0 36.6 963 69500 469 266 544 134 77.5 19 0 0 0 38.9 942 69700 735 53.5 323 46.6 80.1 20 0 0 0 38.9 942 69400 735 53.5 323 46.6 79.2
The 3D simulations were run as per design matrix and simulation
example output results are shown below the Figures 10.11 -10.16.
339
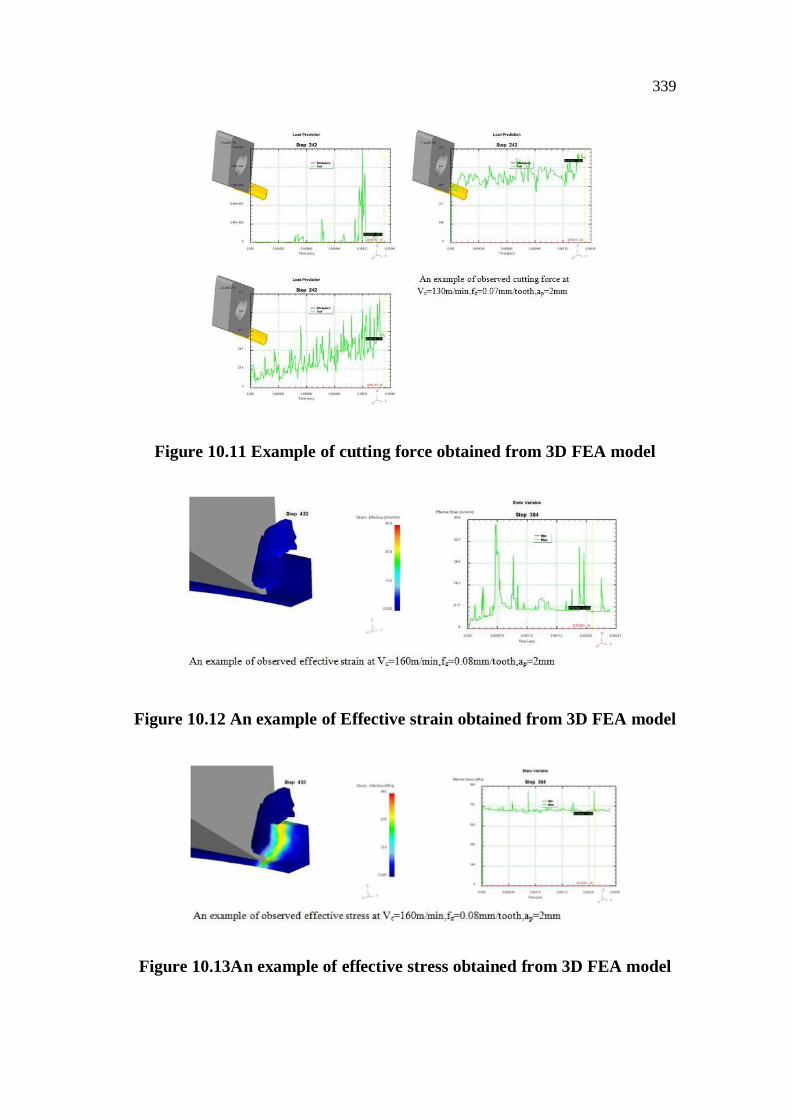
Figure 10.11 Example of cutting force obtained from 3D FEA model
Figure 10.12 An example of Effective strain obtained from 3D FEA model
Figure 10.13An example of effective stress obtained from 3D FEA model
340
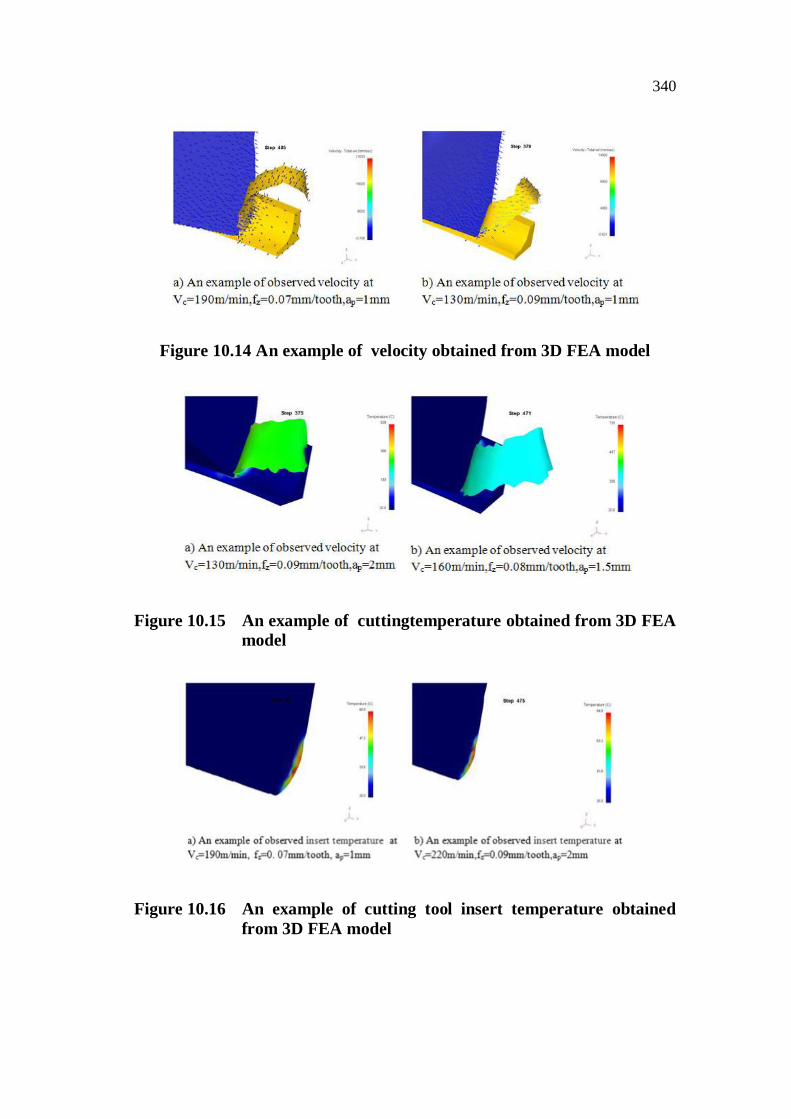
Figure 10.14 An example of velocity obtained from 3D FEA model
Figure 10.15 An example of cuttingtemperature obtained from 3D FEA model
Figure 10.16 An example of cutting tool insert temperature obtained from 3D FEA model
341
This regression model procedure is explained in detail in Chapter 4
in Section 4.3.1.
10.6 RESULTS AND DISCUSSION 3D FEA MODEL
The developed mathematical model was used to predict responses
by substituting the respective values of the process parameters. The influence
of the machining parameters on responses was studied using the developed
model.
10.6.1 Direct Effects of Machining Parameter on Response
The direct effect of process parameters was studied by keeping all
the machining parameters at the middle level except the parameter whose
direct effect was studied.
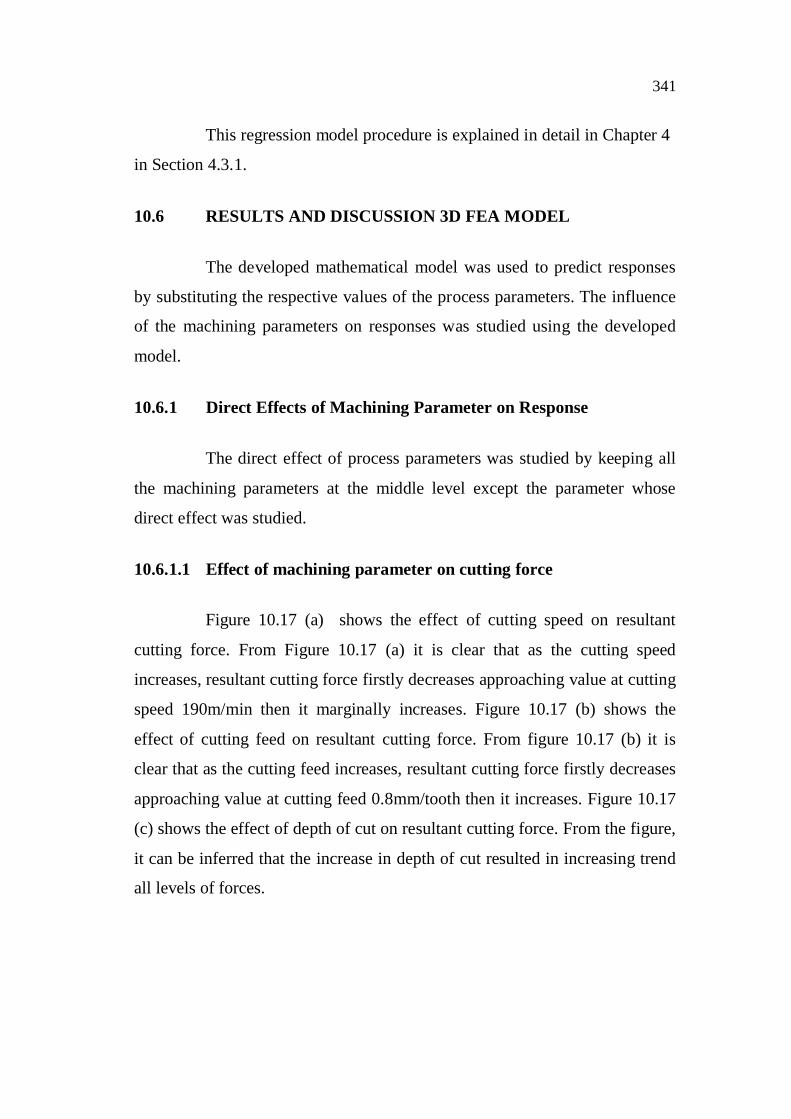
10.6.1.1 Effect of machining parameter on cutting force
Figure 10.17 (a) shows the effect of cutting speed on resultant
cutting force. From Figure 10.17 (a) it is clear that as the cutting speed
increases, resultant cutting force firstly decreases approaching value at cutting
speed 190m/min then it marginally increases. Figure 10.17 (b) shows the
effect of cutting feed on resultant cutting force. From figure 10.17 (b) it is
clear that as the cutting feed increases, resultant cutting force firstly decreases
approaching value at cutting feed 0.8mm/tooth then it increases. Figure 10.17
(c) shows the effect of depth of cut on resultant cutting force. From the figure,
it can be inferred that the increase in depth of cut resulted in increasing trend
all levels of forces.
342
Figure 10.17 Main effects plot for response (Resultant cutting force)
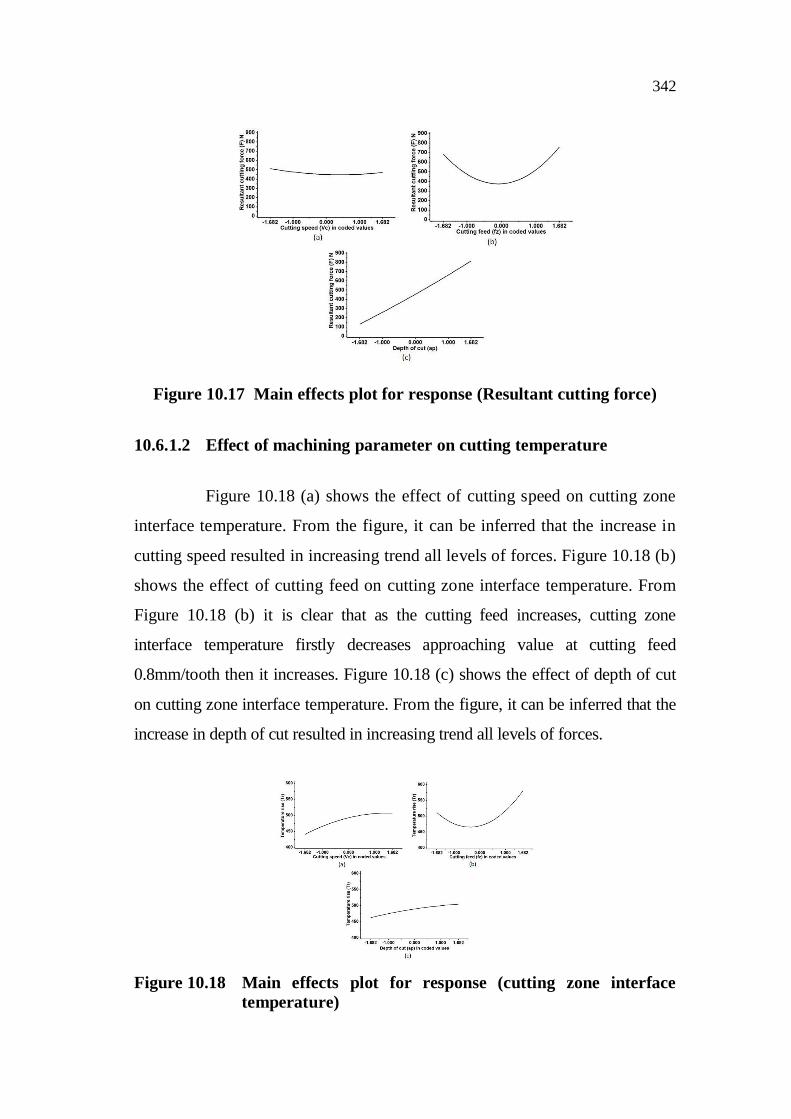
10.6.1.2 Effect of machining parameter on cutting temperature
Figure 10.18 (a) shows the effect of cutting speed on cutting zone
interface temperature. From the figure, it can be inferred that the increase in
cutting speed resulted in increasing trend all levels of forces. Figure 10.18 (b)
shows the effect of cutting feed on cutting zone interface temperature. From
Figure 10.18 (b) it is clear that as the cutting feed increases, cutting zone
interface temperature firstly decreases approaching value at cutting feed
0.8mm/tooth then it increases. Figure 10.18 (c) shows the effect of depth of cut
on cutting zone interface temperature. From the figure, it can be inferred that the
increase in depth of cut resulted in increasing trend all levels of forces.
Figure 10.18 Main effects plot for response (cutting zone interface temperature)
343
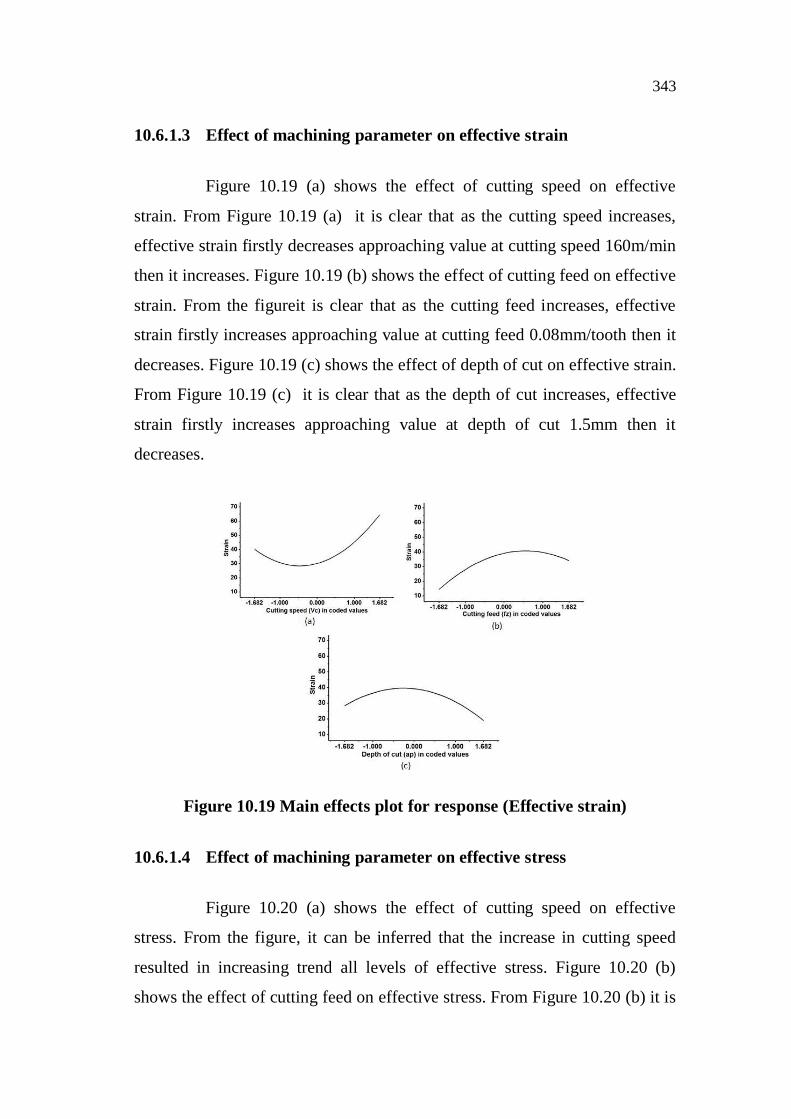
10.6.1.3 Effect of machining parameter on effective strain
Figure 10.19 (a) shows the effect of cutting speed on effective
strain. From Figure 10.19 (a) it is clear that as the cutting speed increases,
effective strain firstly decreases approaching value at cutting speed 160m/min
then it increases. Figure 10.19 (b) shows the effect of cutting feed on effective
strain. From the figureit is clear that as the cutting feed increases, effective
strain firstly increases approaching value at cutting feed 0.08mm/tooth then it
decreases. Figure 10.19 (c) shows the effect of depth of cut on effective strain.
From Figure 10.19 (c) it is clear that as the depth of cut increases, effective
strain firstly increases approaching value at depth of cut 1.5mm then it
decreases.
Figure 10.19 Main effects plot for response (Effective strain)
10.6.1.4 Effect of machining parameter on effective stress
Figure 10.20 (a) shows the effect of cutting speed on effective
stress. From the figure, it can be inferred that the increase in cutting speed
resulted in increasing trend all levels of effective stress. Figure 10.20 (b)
shows the effect of cutting feed on effective stress. From Figure 10.20 (b) it is
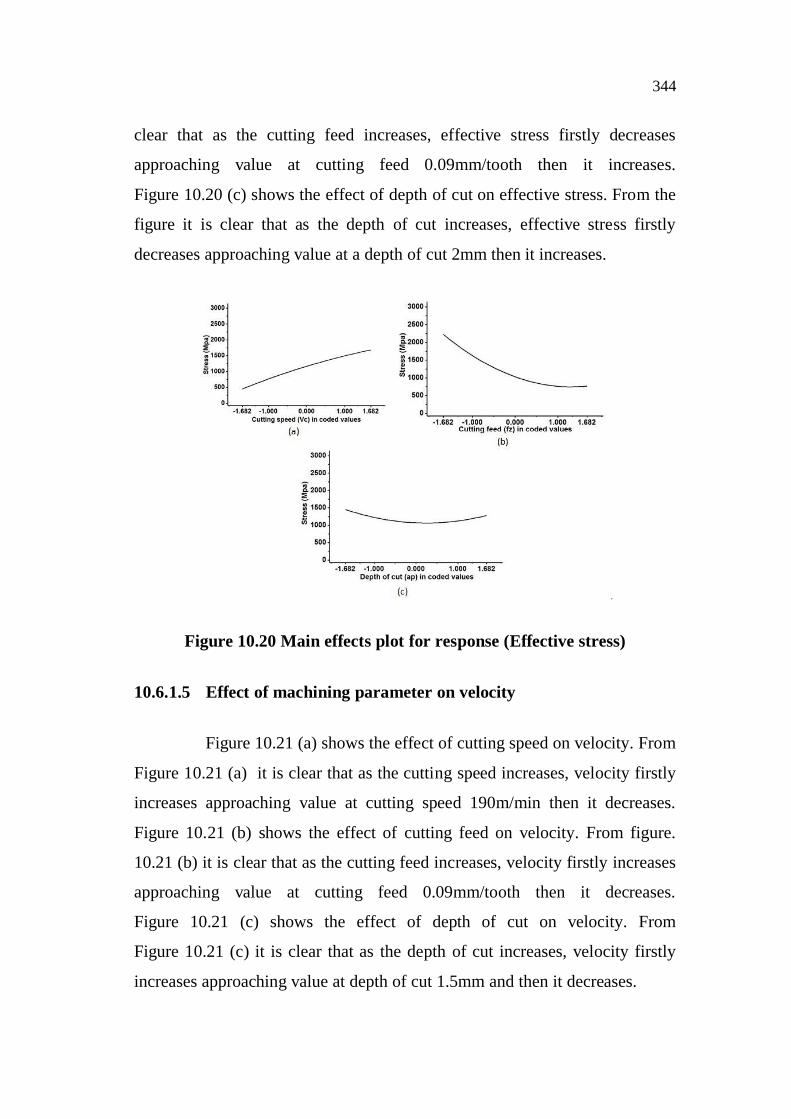
344
clear that as the cutting feed increases, effective stress firstly decreases
approaching value at cutting feed 0.09mm/tooth then it increases.
Figure 10.20 (c) shows the effect of depth of cut on effective stress. From the
figure it is clear that as the depth of cut increases, effective stress firstly
decreases approaching value at a depth of cut 2mm then it increases.
Figure 10.20 Main effects plot for response (Effective stress)
10.6.1.5 Effect of machining parameter on velocity
Figure 10.21 (a) shows the effect of cutting speed on velocity. From
Figure 10.21 (a) it is clear that as the cutting speed increases, velocity firstly
increases approaching value at cutting speed 190m/min then it decreases.
Figure 10.21 (b) shows the effect of cutting feed on velocity. From figure.
10.21 (b) it is clear that as the cutting feed increases, velocity firstly increases
approaching value at cutting feed 0.09mm/tooth then it decreases.
Figure 10.21 (c) shows the effect of depth of cut on velocity. From
Figure 10.21 (c) it is clear that as the depth of cut increases, velocity firstly
increases approaching value at depth of cut 1.5mm and then it decreases.

345
Figure 10.21Main effects plot for response (Velocity)
10.6.1.6 Effect of response on cutting tool insert temperature
Figure 10.22 (a) shows the effect of cutting speed on cutting tool insert temperature. From Figure 10.22 (a) it is clear that as the cutting speed increases, cutting tool insert temperature firstly decreases approaching value at cutting speed 160m/min then it increases. Figure 10.22 (b) shows the effect of cutting feed on cutting tool insert temperature. From the figure, it can be inferred that the increase in cutting feed resulted in increasing trend all levels of cutting tool insert temperature. Figure 10.22 (c) shows the effect of depth of cut on cutting tool insert temperature. From Figure 10.22 (c) it is clear that as the depth of increases, cutting tool insert temperature firstly increases approaching value at a depth of cut 2mm then it decreases.
Figure 10.22 Main effects plot for response (cutting tool insert temperature)

346
10.7 CONCLUSION
The experiments were carried out to estimate response (cutting force, cutting zone interface temperature, effective strain, effective stress, velocity and cutting tool insert temperature) and to gauge the effect of machining parameters such as cutting speed, cutting feed rate and depth of cut on AL7075-T6 aluminum alloy in FEA cutting processes. The following conclusions were derived after the investigation.
1. The cutting force, cutting zone interface temperature, effective strain, effective stress, velocity and cutting tool insert temperature of an AL7075-T6 aluminum alloy can be computed efficiently through FEA model developed in this work.
2. The direct effects of process parameters on cutting force, cutting zone interface temperature, effective strain, effective stress, velocity and cutting tool insert temperature within the range of investigation can be studied with ease from the central composite design.
3. FEM can give quite interesting qualitative values about the influence of input parameters on the results like temperature, stresses, velocity, etc. that are fairly difficult to be measured experimentally. 2D &3D modeling would be needed to meet industrial requirements regarding stresses, tool wear, etc.
4. This research is limited to one type of tool insert and one type of workpiece material. Enlarging this system to include more cutting tools and materials for workpieces could provide a better position for this study to be adopted into industrial use.
5. This system can accurately predict the contact time, Interface pressure, folding angle, chip morphology (chip thickness) within a wide range of machining parameters, and has practical potential application in industry.
Related Documents