Chapter 10: Atomic Emission Spectrometry Chapter 10: Atomic Emission Spectrometry Read: pp. 254 – Problems: 10-2,5,6 • Excited-state atoms emit UV-visible line spectra that are useful for qualitative and quantitative analysis. • Flame and plasma sources are commonly used for AES. • Plasma sources offer several advantages: – Lower interelement interference due to high temperature – Good emission spectra are obtained for a single set of excitation conditions – Simultaneous detection of multiple elements – Improved detection figures of merit compared to flame AAS and AES

Welcome message from author
This document is posted to help you gain knowledge. Please leave a comment to let me know what you think about it! Share it to your friends and learn new things together.
Transcript
Chapter 10: Atomic Emission SpectrometryChapter 10: Atomic Emission SpectrometryRead: pp. 254 – 266 Problems: 10-2,5,6
• Excited-state atoms emit UV-visible line spectra that are useful for qualitative and quantitative analysis.
• Flame and plasma sources are commonly used for AES.
• Plasma sources offer several advantages:– Lower interelement interference due to high temperature– Good emission spectra are obtained for a single set of
excitation conditions– Simultaneous detection of multiple elements– Improved detection figures of merit compared to flame AAS
and AES
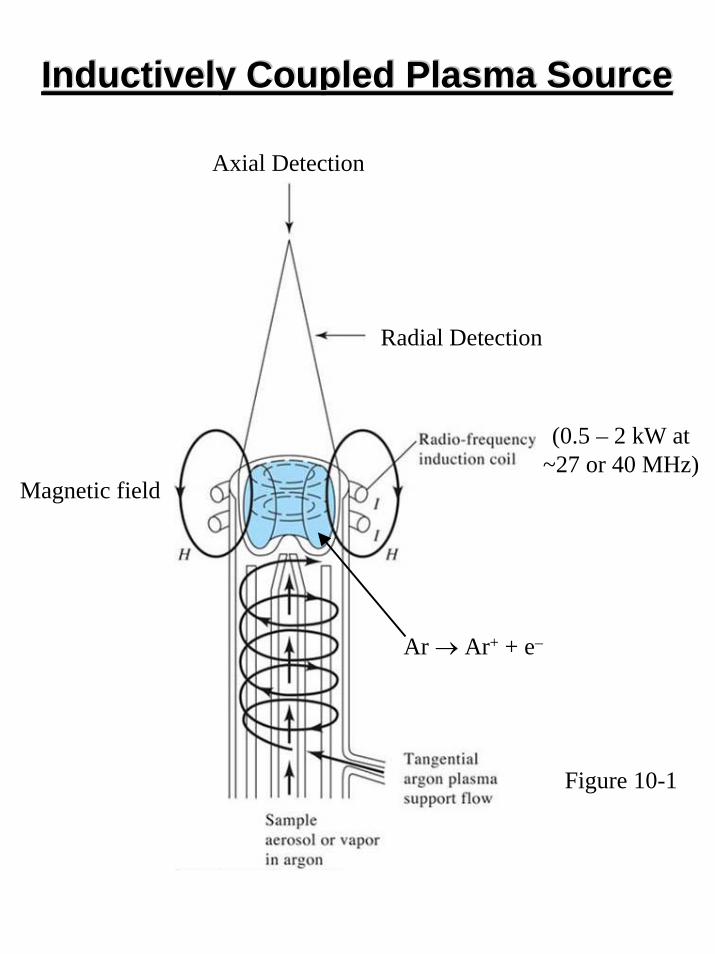
Inductively Coupled Plasma SourceInductively Coupled Plasma Source
Magnetic field
Figure 10-1
Radial Detection
Axial Detection
(0.5 – 2 kW at~27 or 40 MHz)
Ar → Ar+ + e–

Inductively Coupled Plasma SourceInductively Coupled Plasma Source
• High temperature
• Uniform temperature
• Inert environment (Ar)
Leads to more complete atomization and fewer chemical interferences. Lower detection limits and broader linear range than flame sources.
Figure 10-4
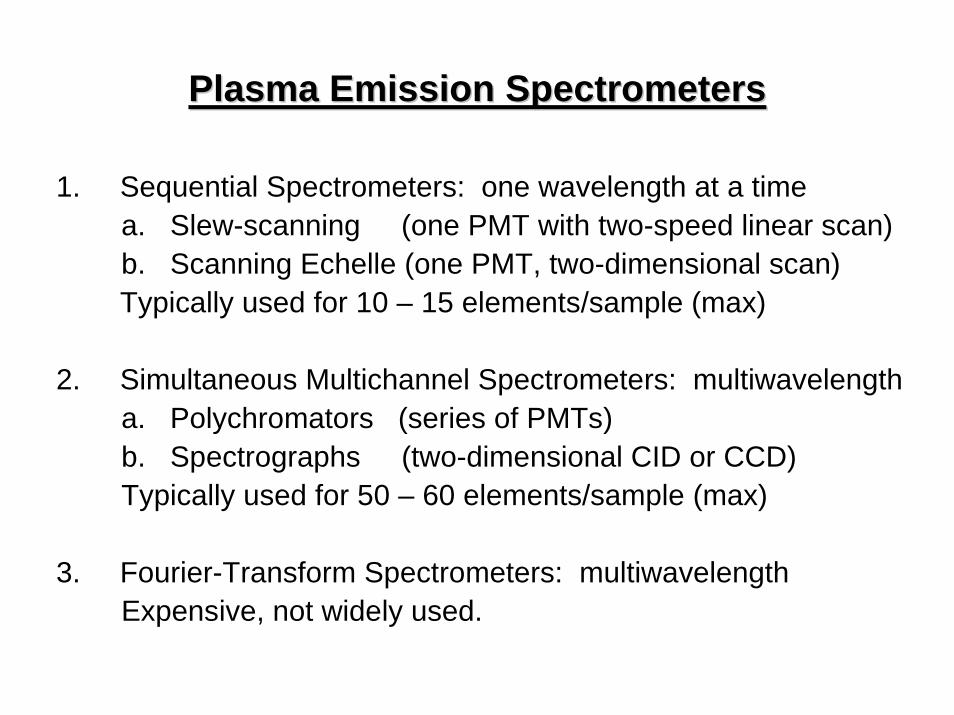
Plasma Emission SpectrometersPlasma Emission Spectrometers
1. Sequential Spectrometers: one wavelength at a timea. Slew-scanning (one PMT with two-speed linear scan)b. Scanning Echelle (one PMT, two-dimensional scan)Typically used for 10 – 15 elements/sample (max)
2. Simultaneous Multichannel Spectrometers: multiwavelengtha. Polychromators (series of PMTs)b. Spectrographs (two-dimensional CID or CCD)Typically used for 50 – 60 elements/sample (max)
3. Fourier-Transform Spectrometers: multiwavelengthExpensive, not widely used.

A Typical A Typical MultichannelMultichannel SpectrographSpectrograph
Figure 10-9
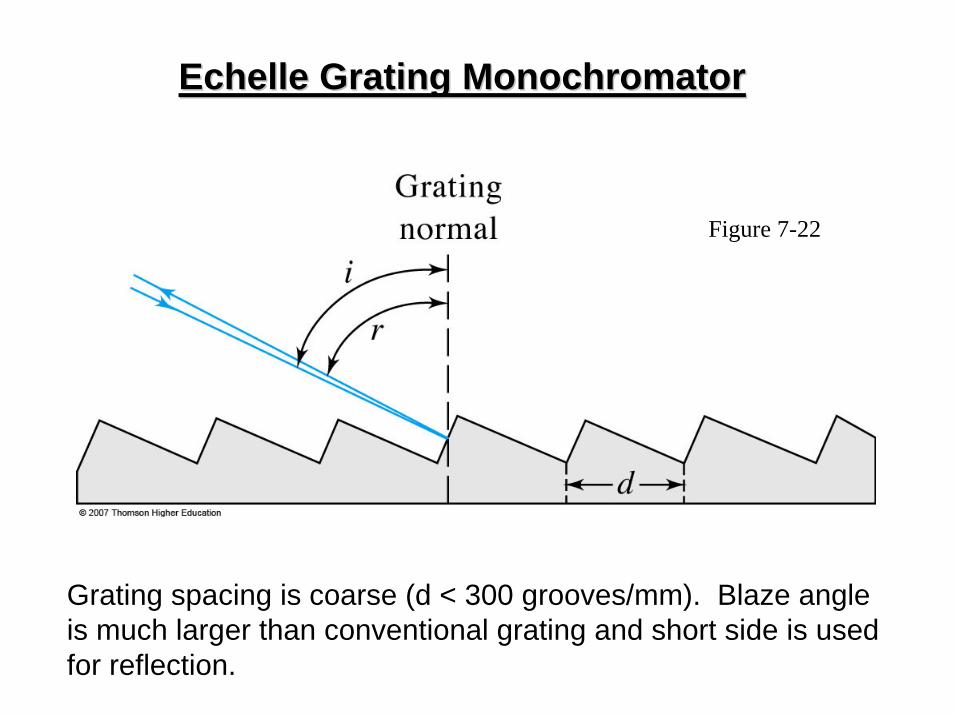
EchelleEchelle Grating Grating MonochromatorMonochromator
Figure 7-22
Grating spacing is coarse (d < 300 grooves/mm). Blaze angle is much larger than conventional grating and short side is used for reflection.
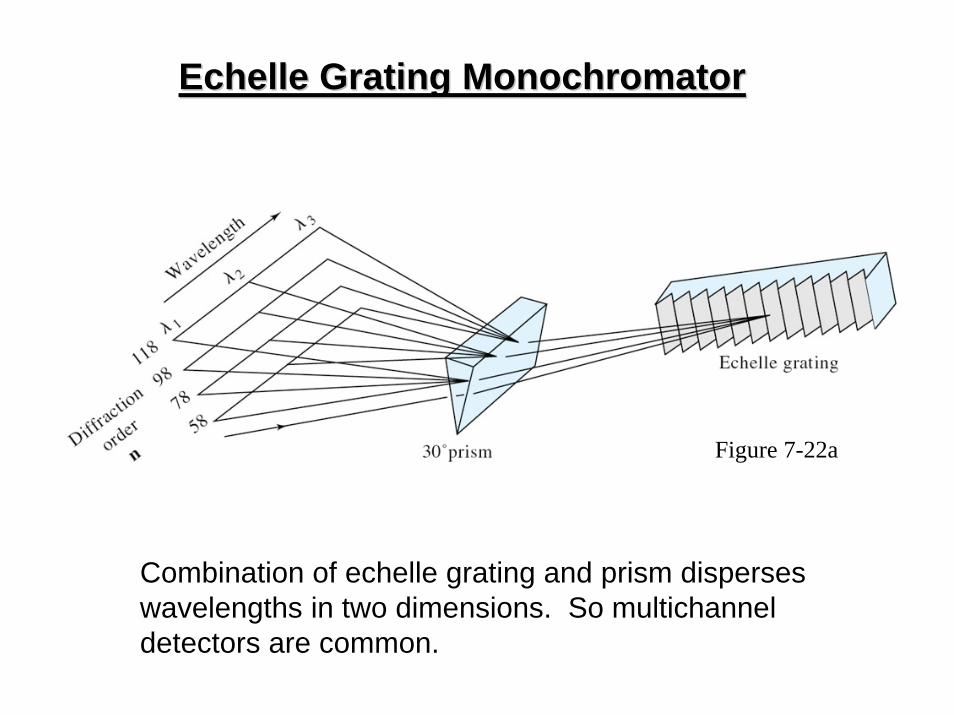
EchelleEchelle Grating Grating MonochromatorMonochromator
Figure 7-22a
Combination of echelle grating and prism disperses wavelengths in two dimensions. So multichanneldetectors are common.
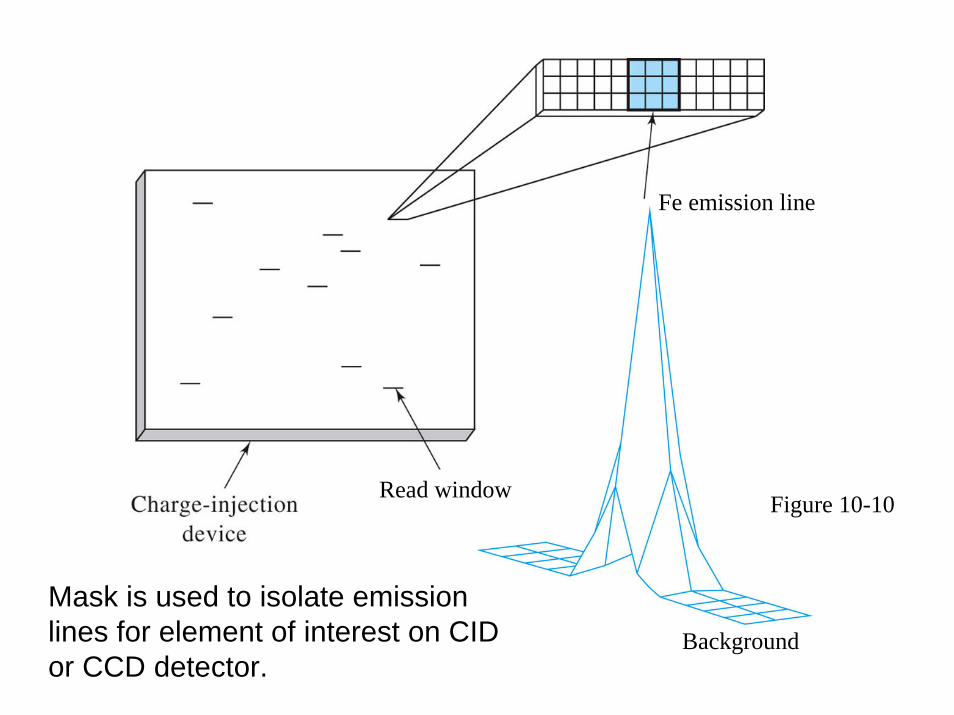
Read window Figure 10-10
Mask is used to isolate emission lines for element of interest on CID or CCD detector.
Fe emission line
Background
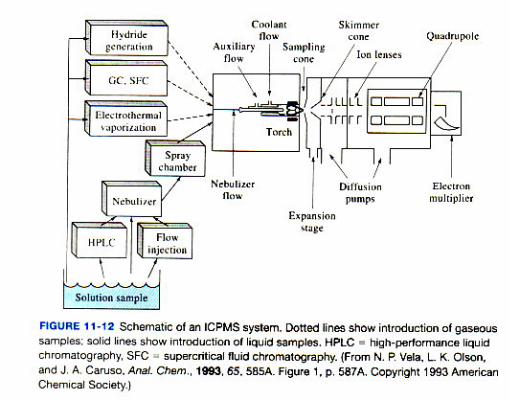

Mass spectra are simpler and easier to interpret than emission spectra (100’s-1000’s lines). 90% of elements in table can be detected, measurement times of 10s per element, LODs are 0.1 to 10 ppb for many elements, and RSDs are 2-4%.
Related Documents