Chapter 1 Introduction The construction of new transport and utilities infrastructure in urban environments fre- quently involves the construction of tunnels under existing surface structures. As increasing population pressures drive the need for more infrastructure while simultaneously leading to the consumption of more surface space for housing and other developments, underground construction will continue to flourish as the preferred solution for infrastructure provision. Economic factors are also contributing to the increase in tunnel construction. Compared to surface developments, tunnels can be significantly cheaper when costs for acquiring land or moving utilities are considered in urban areas. Tunnel construction costs in urban areas are around £50 million per kilometre, although this cost has been falling at around four per cent each year in recent times (Automobile Association, 2001) making the underground option even more attractive. Tunnel construction, however, particularly in soft ground conditions, can cause ground movements which have the potential to damage existing buildings and other structures. At particular risk are masonry buildings. An increasingly significant portion of the cost of tunnelling in is due to protective measures required to reduce the risk of damage to these structures. As a result of both the increased physical congestion in urban environments and the in- creasing involvement of more cost conscious private investors in infrastructure projects,

Welcome message from author
This document is posted to help you gain knowledge. Please leave a comment to let me know what you think about it! Share it to your friends and learn new things together.
Transcript

Chapter 1
Introduction
The construction of new transport and utilities infrastructure in urban environments fre-
quently involves the construction of tunnels under existing surface structures. As increasing
population pressures drive the need for more infrastructure while simultaneously leading to
the consumption of more surface space for housing and other developments, underground
construction will continue to flourish as the preferred solution for infrastructure provision.
Economic factors are also contributing to the increase in tunnel construction. Compared
to surface developments, tunnels can be significantly cheaper when costs for acquiring land
or moving utilities are considered in urban areas. Tunnel construction costs in urban areas
are around £50 million per kilometre, although this cost has been falling at around four
per cent each year in recent times (Automobile Association, 2001) making the underground
option even more attractive.
Tunnel construction, however, particularly in soft ground conditions, can cause ground
movements which have the potential to damage existing buildings and other structures.
At particular risk are masonry buildings. An increasingly significant portion of the cost of
tunnelling in is due to protective measures required to reduce the risk of damage to these
structures.
As a result of both the increased physical congestion in urban environments and the in-
creasing involvement of more cost conscious private investors in infrastructure projects,

CHAPTER 1. INTRODUCTION 2
the assessment of the potential impact of new tunnels on existing structures is increasingly
important. The efficient and accurate prediction of damage to structures is an important
part of the planning and feasibility stage of any urban tunnelling project. General geotech-
nical conditions, and more particularly soil-structure interaction considerations, can have
a significant impact on the choice of the horizontal and vertical alignment, the design
of the works and the contractual arrangements under which the construction ultimately
takes place (Attewell, 1988). For example a more circuitous route or deeper tunnel may
be required to ameliorate predicted damage to structures or expensive protective mea-
sures may be required. If building damage assessment methods are overly conservative this
could lead to more expensive tunnelling or excessive and unnecessarily costly protective
works. As a result, the construction and operating costs of the tunnel project can increase,
threatening the viability of the project (New and Bowers, 1994). With more accurate and
efficient methods of assessing tunnel-induced ground movements and the risk of associated
building damage, such costs can be minimised and construction operation and contractual
arrangements can be more easily made.
Investigating methods of assessing the impact of soft ground tunnelling on buildings is thus
the thrust of the research described in this thesis. In particular, this research is concerned
with developing improved numerical methods to model the response of masonry structures
to soft ground tunnelling in urban areas.
A review of current literature can be found in Chapter 2, followed by a discussion of
the gaps in current knowledge, opportunities for research and the aim and scope of this
project in Chapter 3. The research undertaken is presented in the Chapters comprising
the main body of the thesis and the concluding Chapter provides a summary of the new
developments and an assessment of their potential for wider use or further development.

Chapter 2
Prediction of Damage to Buildings
due to Soft Ground Tunnelling:
A Review of Literature
2.1 Introduction to tunnelling methods
The method chosen to construct a tunnel is dependent firstly on the ground conditions
expected on site and secondly on other considerations such as the availability of plant,
time and cost constraints and other construction considerations.
Tunnelling in hard rock is generally undertaken by drill and blast, road headers, tunnel
boring machines or a combination of methods followed by the installation of tunnel support
such as rock bolts, steel sets or concrete lining. As this research is concerned with damage
to buildings due to tunnelling in soft ground, hard ground methods are not considered.
The construction of tunnels in soft ground (sands and clays) was historically achieved by
hand excavation using shovels and picks with openings supported temporarily by timber
and later lined with masonry. Collapses of tunnel excavations were frequent, however,
prompting the invention of the protective tunnelling shield, patented by Marc Brunel
in 1820. Brunel’s rectangular faced shield was used during the construction of the first

CHAPTER 2. REVIEW OF LITERATURE 4
Thames Tunnel between 1825 and 1843 with excavation carried out by hand within the
shield followed by the erection of a brick lining (Sandstrom, 1963). Peter Barlow patented
a cylindrical tunnelling shield in 1865 which was used to construct a foot tunnel under
the Thames at Tower Hill in 1869 using bolted cast iron lining instead of masonry, against
which the shield was jacked forward. The engineer for the works was J. H. Greathead who
made improvements to the shield tunnelling process developing what is now considered the
forerunner of modern tunnelling shields (Sandstrom, 1963). Permanent linings currently
used in shield tunnelling include precast concrete segments, steel or cast iron segments, cast
insitu concrete or reinforced shotcrete (Potts and Zdravkovic, 2001). Tunnelling shields
can be divided into two general categories: open and closed shields.
Open shields have an unsupported face where material is excavated by mechanical means
such as excavators, cutters or road headers within the shield. These can only be used in
conditions such as stiff clays, where the soil is relatively self-supporting. Where ground
conditions are too unstable for open shield tunnelling, closed shield tunnelling is used.
Closed shields, known as Tunnel Boring Machines (TBMs) support the face as the tunnel is
excavated. A rotating cutting head is advanced by jacks reacting on the completed lining,
with the face supported by controlling the applied thrust and rate of removal of excavated
material (Potts and Zdravkovic, 2001). Where the ground is less stable, additional support
can be provided by using slurry shield or Earth Pressure Balance (EPB) TBMs.
Slurry shield TBMs were introduced to the UK in the 1960’s and use bentonite slurry
under pressure to stabilise the working face (Leca et al., 2000). Excavated soil mixes with
the slurry and is pumped back to the surface. The use of slurry shield TBMs is now
common, with recent projects utilising the method including the Sophia railway tunnel
near Rotterdam in the Netherlands (Netzel, 2002).
In an EPB machine the face is supported by retaining excavated spoil in the working
chamber under pressure, thus balancing the earth pressures in the ground (Fujita, 1989).
Recent uses of EPB machines include the construction of the Madrid Metro (Hernandez
et al., 2000) and the Lisbon Underground (Maranha and Marahna das Neves, 2000).

CHAPTER 2. REVIEW OF LITERATURE 5
Recent advances in the use of TBMs include large diameter machines such as the 14.2m
diameter TBM used for the fourth crossing of the Elbe River in Hamburg, Germany (Leca
et al., 2000) and mixed or universal TBMs designed to handle a range of soil and rock
conditions by operating in any one of the different modes described above.
Another tunnelling method now used in urban tunnelling projects, including the Heathrow
Express rail tunnel (New and Bowers, 1994), involves the use of a sprayed concrete lin-
ing. Known as the New Austrian Tunnelling Method, it came to prominence under von
Rabcewicz during the construction of the Schwaikheim Tunnel in 1964. The first use of
the method in soft ground in an urban area was in 1968 in Frankfurt am Main, Germany
(Sauer, 1988). The process involves the excavation of a section of tunnel followed by the
application of shotcrete (or other temporary support) to the excavated surface before the
installation of a permanent lining. Such lining is usually a second application of reinforced
shotcrete (or permanent rock bolts for a hard ground tunnel). For large diameter excava-
tions, the advance is usually undertaken by using headings and side drifts to limit the size
of the open excavation face (Potts and Zdravkovic, 2001).
2.2 Prediction of settlements - semi-empirical methods
The construction of a tunnel in soft ground results in deformations of the surrounding soil
which manifest on the surface as a surface settlement trough. It is commonly accepted that
the transverse profile of these surface settlements can be described by a Gaussian curve,
shown in figure 2.1 and represented by the formula,
Sv = Smaxe−y2
2i2 (2.1)
where Sv is the vertical settlement at the surface, Smax is the maximum vertical settlement
over the axis of the tunnel, y is the transverse distance from the tunnel axis and i is
the transverse distance to the point of inflexion of the curve. This description was first
put forward by Martos (1958) and subsequently shown to be a valid approximation for

CHAPTER 2. REVIEW OF LITERATURE 6
Sv
Smax
i
y
z
Figure 2.1: Transverse Gaussian settlement profile
the shape of the settlement trough above a tunnel in soft ground (Peck, 1969). This
formulation assumes that the tunnel is passing under a greenfield site where there are no
buildings present. The extent of the surface settlement trough at a greenfield site in three
dimensions is shown in figure 2.2.
It is accepted that i is a linear function of the depth of the tunnel axis, z0, below the
surface when the assumption is made that all movement of soil occurs along radial paths
towards the tunnel axis under constant volume (O’Reilly and New, 1982). Thus,
i = Kz0 (2.2)
where K is a trough width parameter which depends on the soil type and condition. Values
of trough width parameter K vary in the range of 0.2 to 0.3 for granular materials above
the water table and from 0.4 for stiff clays to approximately 0.7 for soft silty clay (O’Reilly
and New, 1982; Rankin, 1988; and Mair et al., 1993). Choice of K requires judgment
depending on the soil type as well as the level of the water table.
The trough width parameter K can be considered approximately constant for different
soil depths when determining surface settlements but varies with depth when considering
subsurface settlements (Mair et al, 1993). Various alternative empirical expressions for i
and K exist including those suggested by Schmidt (1969), Gunn (1993) and Selby (1988)
but equation 2.2 is generally used in practice.
The volume of the settlement trough Vs, per unit length of tunnel advance can be evaluated

CHAPTER 2. REVIEW OF LITERATURE 7
Extent of surface
settlement trough
Smax
z0
y
x
z
Figure 2.2: 3D surface settlement profile (after Attewell, 1986)
by integrating equation 2.1,
Vs =
∫ ∞
−∞Smaxe
−y2
2i2 =√
2πiSmax (2.3)
The volume loss, VL is the volume of the settlement trough per unit length expressed as a
percentage of the total excavated volume of the tunnel,
VL =Vs
Vo
× 100 (2.4)
where Vo is the volume required to construct the tunnel. This is based on the assumption
that soil movements occur under constant volume.
Volume loss is caused by the difference in the volume of soil excavated for the tunnel and
the volume of the completed lined tunnel taking its place. Soil around the tunnel moves
to fill this volume loss, the magnitude of which is also termed the ground loss and is
dependent on the tunnelling method, soil type and care taken by the excavation contractor
(Potts and Zdravkovic, 2001). Sources of volume loss as shown in figure 2.3 include four

CHAPTER 2. REVIEW OF LITERATURE 8
major contributors (Leca et al., 2000):
• Movement of soil towards the tunnel face, face loss, due to face stress release;
• Displacements along the tunnelling shield, shield loss, due to deviations of the ma-
chine or shear stresses along the side;
• Ground movements into the tail gap, tail loss, from transition to the liner; and
• Permanent liner deformations (much less significant than the previous three).
Volume loss for London clay is likely to be in the range of 1.0-3.0% for shield tunnelling
(O’Reilly and New, 1982) and 1.0-1.5% for NATM tunnelling (New and Bowers, 1994).
������������
Shield loss
Face loss
Tunnelling shield Lining
Tail loss
GROUND SURFACE
Figure 2.3: Sources of ground loss during soft ground tunnelling
The vertical settlement at any surface position can thus be found by combining equations
2.1, 2.2 and 2.3 to give,
Sv =Vs√
2πKzo
e−y2
2K2zo2 (2.5)
The slope and curvature of the settlement profile can thus be obtained by differentiation,
dSv
dy=
−Vsy√2πi3
e−y2
2i2 (2.6)
d2Sv
dy2=
Vs√2πi3
[y2
i2− 1
]e
−y2
2i2 (2.7)

CHAPTER 2. REVIEW OF LITERATURE 9
The vertical ground strain εv is thus,
εv =dSv
dz=
Vs√2πKzo
2
[y2
i2− 1
]e
−y2
K2zo2 (2.8)
In addition to vertical movements the soil undergoes horizontal displacement at the surface.
The assumption that all particulate movement of soil occurs along radial paths towards the
tunnel axis under incompressible plain strain conditions (New and O’Reilly, 1991; O’Reilly
and New, 1982) allows the determination of the horizontal displacement Sh,
Sh = Svy
zo(2.9)
Differentiating equation 2.9 with respect to y and including equation 2.3 gives the horizontal
strain εh as,
εh =dSh
dy=
Vs√2πKzo
2
[1 − y2
i2
]e
−y2
K2zo2 (2.10)
The plane strain constant volume deformation condition is thus satisfied as εh = −εv.
Longitudinal settlement profiles in the direction of tunnelling are assumed to take the form
of a cumulative probability curve (Attewell and Woodman, 1982) which advances with
tunnel construction. The settlement directly above the excavation face is assumed to be
equal to 0.5Smax.
Where multiple tunnels are present, as occurs with twin tunnels carrying traffic in opposite
directions, it is generally assumed that ground movements arising from the construction of
each tunnel (calculated using the semi-empirical methods above) can be superimposed. For
tunnels that are separated by less than one tunnel diameter, this may be unconservative
(Burland, 1997). Settlements at a monitored greenfield reference site at Old Jamaica Road
in London show this assumption to be unconservative for two 19.5m deep, 4.85m diameter
tunnels separated by 26m in the Lambeth Group (Withers, 2001a). Chapman et al. (2002)
use the results of finite element analyses of twin tunnels to demonstrate that twin piggy

CHAPTER 2. REVIEW OF LITERATURE 10
back tunnels result in surface settlements that agree well with superimposed semi-empirical
predictions but that settlements due to the construction of the second of side by side tunnels
exhibit greater settlements on the side of the first tunnel. They propose that this is due
to the soil near the first tunnel having been previously strained by its construction. Mecsi
(2002), however, finds that for the twin 5.5m diameter tunnels of the Budapest Metro,
separated by 22m in Kiscell clay, the superposition of predicted Gaussian settlements from
each tunnel compares favourably with measured field data.
The prediction of subsurface displacements has been undertaken in London clay by various
researchers. Mair et al. (1993) propose that the relationship for i for a subsurface settlement
trough at a depth z (equation 2.2) be amended to iz = K(zo − z). New and Bowers (1994)
improved their subsurface predictions by assuming that all ground movements are towards
a ribbon sink along the longitudinal tunnel axis rather than a line sink at the tunnel centre.
Moh and Hwang (1996) proposed the use of the following formulation for i for subsurface
settlement troughs at depth z which is based on the expression proposed by Schmidt (1969),
iz =
(D
2
)(zo
D
)0.8(
zo − z
zo
)m
(2.11)
where m is a constant based on the soil type and D is the tunnel diameter. Values of
m = 0.4 for silty sand and m = 0.8 for silty clays are recommended. The formulation is
based on case study data from the construction of the Taipei Rapid Transit System.
The majority of physical modelling of settlements due to tunnelling has been undertaken in
laboratory centrifuge tests. Centrifuge tests undertaken by Mair (1979) are referred to by
Mair et al. (1993) who use the detailed subsurface measurements to propose the relation-
ship above. Leca et al. (2000) give a summary of centrifuge modelling including tests by
Stallebrass et al. (1996) and Grant and Taylor (1996) whose results indicated smaller and
thinner settlement troughs than expected. Grant et al. (1999) also describe a centrifuge
test of a tunnel heading in kaolin clay where ground movement results were compared to
a three-dimensional finite element analysis and found to give reasonable agreement. In
general it appears that, as might be expected, field data from real tunnels is more useful

CHAPTER 2. REVIEW OF LITERATURE 11
for theoretical model validation or formulation than laboratory data due to the difficulties
inherent in physically modelling the complex tunnelling processes at small scale.
The semi-empirical approach described above provides a simple means of estimating surface
settlements due to tunnelling in soft ground while ignoring the presence of any structures.
The key parameters of the volume loss and trough width parameter have been widely
investigated and shown to be sensitive to soil type and condition, tunnel construction
method and the care taken by the excavation contractor.
2.3 Prediction of settlements - analytical methods
2.3.1 Closed form solutions
Closed form solutions can at best only provide a rough approximation of ground behaviour
as they cannot account for the inherent complexities of tunnel construction methods and
the non-linearity and anisotropy evident in tunnelling problems (Mair, 1999). They can,
however, provide a useful and quick method of settlement prediction.
Two closed form solutions are described by Chow (1994). The first, by Poulos and Davies
(1980), uses the solution for vertical displacements due to a point load in elastic half
space. Vertical displacements are obtained by integrating the solution for a line load equal
to the magnitude of the weight of material excavated. As this prediction only accounts
for unloading, not volume loss, heave is predicted. The Sagaseta (1987) method is also
described by Chow. This method accounts for volume loss and is based on incompressible
irrotational fluid flow solutions. Chow derives the solution for vertical displacements as,
S = − γD2zo2
4G(y2 + zo2)
(2.12)
where S is the vertical settlement, γ is the soil density, G is the shear modulus and D is
the tunnel diameter.
Predictions using this method are compared to the Gaussian profile and field measurements

CHAPTER 2. REVIEW OF LITERATURE 12
from the Caracas Metro and M-40 Motorway in Madrid (Oteo and Sagaseta, 1996) and
data from the construction of the Valencia Underground Line 5 (Celma and Izquierdo,
1999). The method is found to produce a wider settlement trough than the Gaussian
profile and case study data but similar maximum settlement.
Celma and Izquierdo (1999) also consider the method of Verrujit and Booker (1996). This
solution is a generalisation of the Sagaseta method and includes the factors ε and δ which
take into account the ground loss and ovalisation of circular tunnels respectively. The
settlement is given by,
S = 2εa2 zo
(y2 + zo2)
− 2δa2 z(y2 − zo2)
(y2 + zo2)2
(2.13)
where a is the tunnel radius. Predictions based on this method are found to be similar to
those predicted using the semi-empirical Gaussian profile.
Loganathan and Poulos (1998) proposed a solution for the surface settlement which also
incorporates the ground loss ratio ε as,
S = 2εa2 4zo(1 − v)
(y2 + zo2)
e
(−1.38y2
(a+zo)2
)(2.14)
where v is the Poisson’s ratio of the soil. Predictions using this method are compared with
data from the New Southern Railway in Sydney, by Loganathan et al. (2000). Predictions
gave higher than maximum field settlements, and a wider settlement profile.
Bobet (2001) presents an elastic solution assuming uniform circular radial deformation
which is modified by Park (2005) to account for ovalisation. Park compares this method
with those described above and with five case studies (including the Heathrow Express
and Jubilee Line Extension tunnels in London), concluding that while the closed form
elastic solutions are limited in scope, they produce similar displacement profiles which agree
reasonably well with case study data and are thus useful for preliminary investigations.
Plasticity solutions are used to predict subsurface settlement profiles by Mair and Taylor
(1993). They use the solution for a cylindrical contracting cavity in a linear elastic-perfectly
CHAPTER 2. REVIEW OF LITERATURE 13
plastic soil for transverse ground movements and the solution for a spherical cavity for
movements ahead of the tunnel advance. For an unloaded spherical cavity the solution is,
δ
a=
su
3G
(a
r
)2
e(0.75N∗−1) (2.15)
where, δ is the radial movement at radius r, a is the inner radius of the tunnel, su is the
undrained shear strength, N∗ is the stability ratio given by σo/su, σo is the initial total
stress at the cavity boundary and G is the shear modulus. An amended version of the
spherical cavity equation is presented for lined tunnels. For an unloaded cylinder,
δ
a=
su
2G
(a
r
)e(N∗−1) (2.16)
Grant and Taylor (2000) evaluate these plasticity solutions by comparing them to measured
data from centrifuge tests and express confidence in the use of the unloaded cylinder
approach for interpreting data from field measurements.
Stochastic methods provide analytical justification for the use of the Gaussian profile ac-
cording to Attewell and Woodman (1982) who show that for moderate subsidence, the
surface trough of a stochastic model in two dimensions follows the Gaussian distribution.
2.3.2 Numerical methods
The use of numerical methods for the prediction of settlements due to tunnelling is becom-
ing increasingly common in engineering practice. In particular, finite element methods are
commonly used in the analysis of tunnelling problems. There exists a significant number
of texts on the subject (for example Zienkiewicz, 1977; Dawe, 1984; and Astley, 1992), in-
cluding recent texts on the application of finite element analysis in geotechnical engineering
(Potts and Zdravkovic, 1999 and 2001). A detailed description of the fundamentals of the
method is thus not given here. A good summary of the use of finite element models for
tunnelling analyses prior to 1989 is given by Clough and Leca (1989) and a more recent
summary is given by Negro and de Queiroz (2000).

CHAPTER 2. REVIEW OF LITERATURE 14
The majority of numerical tunnelling models (92% according to Negro and de Queiroz),
especially early work, are two-dimensional (2D), with most assuming plane strain condi-
tions. Papers including Mair et al. (1981), Finno and Clough (1985), van Jaarsveld (1999),
Karakus and Fowell (2000), Romera et al. (2000), Drakos et al. (2002) and Tolis and
Dounias (2002) describe plane strain finite element analyses and compare the settlements
predicted with field data. Plane strain analyses are commonly used for the reason that
they require less computer resources and time than three-dimensional (3D) analyses (Au-
garde, 1997). Two-dimensional representations, however, cannot model the effects of the
passage of a tunnel in the longitudinal direction, complex 3D geometries such as tunnel
joints or other inherent three-dimensional effects as noted by Augarde (1997), Mahranha
and Maranha das Neeves (2000), Fricker and Alder (2001) and Vermeer (2001).
Three-dimensional numerical analyses are increasingly evident in the literature (8% of re-
ported analyses in the last decade according to Negro and de Queiroz although the percent-
age in immediately recent years appears to be much higher) due to advances in computer
hardware and the increasing availability of appropriate commercial software. It is gener-
ally accepted that 3D analyses are required to fully capture all the mechanisms of ground
deformation around a tunnel (Burd et al., 1994; Attewell et al., 1986; and Potts, 2003).
Three-dimensional analyses are commonly used now both for research, typically utilising
in-house finite element software at research institutions (Rowe et al., 1983, Augarde, 1997,
Hernandez et al., 2000 and Franzius, 2004) and for commercial design, using software
packages such as FLAC 3D (Dias et al., 2000 and Fricker and Alder, 2001), ABAQUS
(Guedes de Melo and Santos Pereira, 2002) and PLAXIS 3D Tunnel (Vermeer, 2001 and
Schweiger, 2001). The number of papers describing the use of 3D finite element modelling
of tunnels is also increasing and includes Lee and Rowe (1989, 1990 and 1990a), Augarde
et al. (1999), Maranha and Maranha das Neves (2000), Hernandez et al. (2000), Vermeer
(2001), Truty and Zimmermann (2002), Lee and Ng (2002) and Kasper and Meschke (2004).
Three-dimensional analyses are more time consuming to prepare and use considerably more
computer resources and time in comparison to 2D analyses, a fact which which continues
to limit their use in industry (Fricker, 2001 and Miliziano et al., 2002).

CHAPTER 2. REVIEW OF LITERATURE 15
When modelling tunnelling in soft ground using finite elements there are a number of
key areas to be considered, which influence the quality of predictions. These include the
constitutive soil model, modelling of the tunnel lining and the modelling of excavation.
A range of constitutive models for overconsolidated clays, such as London clay, are reported
in the literature. Considering such soil as a linear elastic material has been found to be
unsuitable as the predicted displacements involve heave due to unloading effects and stress
relief (Rowe et al., 1983, Rankin, 1988 and Chow, 1994). Linear elastic-perfectly plastic
models are investigated by Rowe et al. (1983) who find that they give much more realistic
surface settlements than elastic models; they are also used by Chow (1994) who does not
find any significant improvement. Chow notes that the use of a linear elastic model where
stiffness increases linearly with depth provides improved results. Guedes de Melo and
Santos Pereira (2002) use a linear elastic-perfectly plastic soil to model the construction of
the Shanghai Metro Line 2 and find that it predicts shallower and wider surface settlement
troughs than observed during construction. The Modified Cam-clay model is used by Mair
et al. (1981) but is also found to produce wider and flatter profiles due to the soil elasticity
dominating the surface response. Modified Cam-clay plasticity with non-linear elasticity
is found to give reasonable predictions by Karakus and Fowell (2000).
It is generally accepted that simple linear elastic-plastic models lead to the prediction of
profiles that are too wide and shallow as they cannot correctly account for the non-linear
and inelastic soil behaviour which has been shown to occur at small strains and is an
important feature of soil-structure interaction (Calabresi et al., 1999).
Recent work has highlighted the necessity of modelling soil non-linearity at small (pre-
failure) strains which occur in overconsolidated clays. The review of reported numerical
analyses by Negro and de Queiroz (2000) concluded that maximum surface settlements
predicted in finite element analyses were close to the measured field value in 71% of cases
but that over half of the analyses gave poor predictions of overall soil movement profiles.
The reason was considered to be oversimplification of soil constitutive models and the
authors recommended the use of a non-linear pre-yield soil model to overcome this prob-
lem. The significance of the non-linear behaviour of soil at small strains was investigated

CHAPTER 2. REVIEW OF LITERATURE 16
using laboratory tests by Jardine et al. (1986) who proposed an empirical stress strain
relationship which matched their obseverved non-linear response of undrained clay. This
non-linear pre-yield model combined with a Mohr-Coulomb failure criterion and plastic
potential was used by Addenbrooke et al. (1997) and compared with a linear elastic model
to conclude that modelling non-linear pre-failure stiffness is required to predict reasonable
surface settlements. The same model has been used in other reported numerical analyses
including those of Potts and Addenbrooke (1997) and Franzius (2004). Gunn (1993) also
used a model combining non-linear elasticity at small strains with a Tresca yield crite-
rion which predicted wider troughs than the Gaussian profile but good ground loss values.
Kinematic yield hardening models have been developed by Atkinson and Stallebrass (1992)
and Houlsby (1999) which model the variation of stiffness at small pre-failure strains. In
these models multiple nested von Mises yield surfaces exist inside an outer surface. The
surfaces translate in stress space as the stress point moves until the outermost boundary
is reached which defines the undrained shear strength of the material. Chow (1994) found
that predictions using such a model with ten surfaces gave reasonable results in 2D. The
Houlsby (1999) model has been used in 3D analyses by Augarde (1997), Liu (1997), Blood-
worth (2002), Wisser (2002) and is also described by Burd et al. (2000). A recent study by
Grammatikopoulou et al. (2002) found that both two and three surface models gave good
results but slightly shallower and wider settlement troughs than a Gaussian profile.
Soil anisotropy and the choice of Ko are also found to influence surface settlement pre-
dictions to varying degrees. Simpson et al. (1996) undertook a range of 2D analyses of
the Heathrow Express trial tunnel using linear and non-linear anisotropic soil models and
a non-linear isotropic model and concluded that modelling soil anisotropy gave improved
settlement predictions. Addenbrooke et al. (1997), however, concluded that the modelling
of soil anisotropy did not enhance plane strain predictions for surface settlement if non-
linear pre-failure stiffness is included. Potts and Zdravkovic (2001) compare settlement
profiles obtained from 2D finite element models using linear isotropic, linear anisotropic
and non-linear elastic constitutive models with field data. For all cases stiffness increased
with depth and plastic behaviour was modelled using the Mohr-Coulomb model. All three

CHAPTER 2. REVIEW OF LITERATURE 17
cases give settlement profiles that are too wide and shallow in comparison with the field
data. The role of stiffness anisotropy in 3D analyses was investigated by Lee and Ng (2002)
who used an elastic-perfectly plastic model and concluded that anisotropy is less important
than an appropriate choice of Ko for the realistic prediction of both transverse and longi-
tudinal settlements and that 3D modelling also leads to improved predictions. Franzius et
al. (2005) present a suite of both 2D and 3D analyses using non-linear elastic-plastic soil for
both isotropic and anisotropic conditions. They conclude that for the isotropic model, 3D
modelling does not significantly improve predictions, nor does the inclusion of anisotropic
soil in both 2D and 3D analyses.
Early numerical models of tunnels did not include the effect of a tunnel lining; unlined
tunnels were modelled for simplicity. Methods of modelling the tunnel lining are described
by Potts and Zdravkovic (2001) who suggest zero thickness curved shell elements in 2D
analyses in preference to solid elements. A bedded beam model in 2D is described by
Fricker and Alder (2001) where beam elements are used to model the lining. Karakus and
Fowell (2000) also describe the use of curved beam elements. Augarde (1997) describes the
formulation of overlapping three noded beam elements for use in 2D and overlapping shell
elements for use in 3D. Augarde et al. (1999) and Augarde and Burd (2001) compare the
use of these overlapping shells with the use of continuum elements for the modelling of the
lining in 3D and conclude that while there may be situations in which solid elements are
poorly conditioned geometrically, any associated errors are not significant and their use is
more robust when compared to the overlapping shell elements which have a tendency to
respond in an over-stiff manner when embedded in a continuum mesh. Continuum lining
elements are used to good effect by Wisser (2002) who also asserts their benefits over shell
elements in contributing to the prediction of realistic surface settlements.
The modelling of a tunnel excavation should ideally be a continuous process to simulate
the construction of a real tunnel. An analytical method for solving problems with such a
constantly changing domain is presented by Aubry and Modaressi (1989) but its practical
numerical application is unclear (Augarde, 1997). Using discrete finite elements, excavation
can be modelled by the incremental removal of groups of soil elements in stages. The

CHAPTER 2. REVIEW OF LITERATURE 18
unloading due to the excavation is then considered. Previous examples (Gioda and De
Donato, 1979; Swoboda et al., 1989; and Chow, 1994) use a method to calculate the nodal
loads to be applied to the mesh but ignore the body forces and surface tractions of the
elements remaining after excavation has taken place. Augarde et al. (1995) and Augarde
(1997) describe a method based on the procedure proposed by Brown and Booker (1985)
which gives the correct nodal loads to be applied at the excavation stage. This method
has also been used successfully by Rowe and Lee (1991).
Recognising the importance of capturing the full 3D effects of tunnel construction, a num-
ber of methods used previously for modelling 3D aspects of excavation in two dimensions
are summarised by Potts and Zdravkovic (2001). These include the gap method where a
predefined void is inserted into the mesh representing the expected value of the ground loss.
This is achieved by keeping the tunnel invert on the soil and specifying a gap parameter at
the crown. The movement of soil towards the tunnel lining is limited by the magnitude of
the gap. The convergence confinement method involves prescribing the proportion of un-
loading during excavation and prior to lining construction. A progressive softening method
is described which reduces the stiffness of the soil in the heading by a factor β before the
excavation of the soil and construction of the lining. A volume loss control method is also
described where the volume loss on completion is prescribed. This is used by Potts and
Addenbrooke (1997) where the volume loss is calculated at the end of each incremental
excavation of soil elements. Once it reaches a specified value the calculation is terminated.
These methods are proposed for use only in two dimensions and are intended to account
for the stress and strain changes ahead of tunnel advancing in the longitudinal direction.
Despite the ability of 2D methods to model some of the 3D aspects of tunnelling, three-
dimensional analyses are required to fully capture all necessary facets of tunnel construction
and as such a number of different methods have been used for the process of simulating
tunnel construction and lining erection methods in 3D. Lee and Rowe (1990 and 1990a)
describe an investigation into various simple 3D methods including the staged excavation
of a tunnel with no lining and a perfectly rigidly lined tunnel where soil elements to be
excavated are removed from the analysis progressively in steps. Rowe and Lee (1992)

CHAPTER 2. REVIEW OF LITERATURE 19
used these 3D methods, as well as simplified 2D methods including an axisymmetric and
a longitudinal plain strain analysis, to compare the predictions with case study data from
the Thunder Bay sewer tunnel. The three-dimensional analysis was found to give much
more realistic surface displacements than either of the two simplified 2D approaches.
Two different construction techniques are simulated by Guedes de Melo and Santos Pereira
(2000); the NATM method with delayed lining construction and slurry shield tunnelling.
For NATM simulation the analysis takes place in stages each involving the removal of
a 2m section of tunnel elements followed by the installation of concrete lining after soil
displacements have occurred (Vermeer (2001) uses an identical technique for NATM con-
struction). For slurry shield tunnelling, the steps within each phase involve the removal of
soil elements and the simultaneous placement of a shield and pressure on the excavation
face with a gap allowing the soil to deform. Lining elements are installed in the previous
2m step at this time with a void around them into which a low stiffness grout is inserted
and pressure applied. Surface displacements and tunnel lining loads predicted by these
methods are compared to 2D predictions using the convergence confinement method and
are found to give more realistic results in both cases. It is noted that the 2D analyses only
agree with the 3D analyses for certain choices of model parameters. The importance of
the choice of parameters is emphasised by Dias et al. (2000) who use a similar approach to
modelling TBM tunnelling in 3D and find that on comparison with 2D predictions using
the convergence confinement method, reasonable agreement was only reached once appro-
priate parameters were obtained by back analysis. Modelling of tunnel construction in
3D is becoming more detailed with the model described by Kasper and Meschke (2004)
including the simulation of a TBM with frictional soil contact, hydraulic jacks, installation
of lining, tail grouting and a control algorithm for tunnelling shield.
Augarde et al. (1998) describe a 3D method where soil elements in the tunnel are removed
and lining elements activated simultaneously with no unsupported section. The lining
elements are then subjected to uniform hoop shrinkage to develop the required ground
loss. This method has been used to effectively by Bloodworth (2002) and Wisser (2002).
A good recent comparison of some previous 3D numerical analyses is given by Franzius and

CHAPTER 2. REVIEW OF LITERATURE 20
Potts (2005) who compare physical mesh dimensions and excavation stage lengths used by
previous authors. They conclude that a distance of 13 times the tunnel diameter is required
in front of the excavation face for the vertical end mesh boundary not to affect settlement
results at a location of interest; that no steady state longitudinal settlement was possible
for the mesh dimensions compared and that there is a trade off between the longitudinal
tunnel stage excavation length and computational efficiency.
2.4 Case studies of greenfield settlement
There is now a significant amount of data available on surface settlements at greenfield
sites. Many papers contain case study data for the purpose of validation of models, while
there are others which present general data comparing key parameters from a range of
tunnelling projects (Rankin, 1988; O’Reilly and New, 1982; and Lee, 1996), and a small
number containing detailed data from specifically instrumented greenfield sites.
Many of the papers cited so far in this thesis contain case study data for the validation
of empirical or analytical methods of predicting settlement. Data are presented from such
projects as the Lisbon Underground (Marahna and Marahna das Neves, 2000), Madrid
Metro (Hernandez et al., 2000 and Romera et al., 2000), the London Underground (Mair
and Taylor, 1993 and Cooper and Chapman, 2000) and the Budapest Metro (Mecsi, 2002).
The number of reported measured parameters is typically small and the number of data
points scarce, as mostly monitoring was not conducted for the specific purpose of research.
New and Bowers (1994) present the results of a comparison of empirical and analyti-
cal prediction methods with surface settlements specifically measured for research at the
Heathrow Express trial tunnel in a uniform strata of London clay overlain by a thin gravel
layer. The tunnel was constructed using the sprayed concrete lining technique and instru-
mented extensively. The measured transverse settlement trough confirmed the assumption
of a Gaussian profile and the finite element model described in the paper predicted the
surface settlement profiles reasonably well. No details are given regarding the composition
of the model. Ground loss values were also found to be in reasonable agreement with

CHAPTER 2. REVIEW OF LITERATURE 21
the measured values. The data from the same site were also used by Karakus and Fowell
(2000) for validation of a finite element model for sprayed concrete lining construction in
soft ground. The soil was modelled using a non-linear elastic model with modified Cam-clay
plasticity. Maximum settlements predicted by the model, which simulated nine separate
construction stages, were found to be similar to those in the field, but simulations with
five stages and one stage resulted in shallower and wider settlement troughs.
As part of a research project coordinated by Imperial College and sponsored by government
bodies and industry centred on the construction of the Jubilee Line extension in London,
four greenfield sites were instrumented to measure surface displacements due to tunnelling.
The sites were located at St James’s Park, Westminster (London Clay) (Nyren et al., 2001)
and Southwark Park, Old Jamaica Road and Niagara Court, Berdmonsey (Lambeth Group
beds) (Withers, 2001a). At each site, instrumentation comprising surface survey points,
rod extensometers and electrolevel inclinometers was installed transverse to the direction
of tunnel advance. Vertical surface and subsurface movements as well as horizontal surface
movements were recorded from prior to the construction of the tunnels.
Vertical settlements at the St James’s Park site for the 4.9m diameter, 20.5m deep East-
bound tunnel are shown in figure 2.4. The settlement profile can be seen to be approx-
imately Gaussian from the inset plot of lnS/Smax versus the square of the distance from
the centre line, which is almost straight. Volume loss was found to be 2.8% with a max-
imum settlement of 23.4mm (Nyren et al., 2001) for the eastbound tunnel and 3.3% and
20.4mm for the west bound tunnel (Standing and Burland, 2006). This level of volume
loss was unexpected; what was thought to be a conservative value of 2% having been used
for design. Standing and Burland (2006) attribute the larger than expected ground losses
to the tunnelling technique (length of unsupported heading) and the particular geological
conditions at this location and tunnel depth (sand and silt partings in the London Clay).
Settlement at the Southwark Park site for both tunnels is shown in figure 2.5. The trans-
verse settlement is reasonably close to a Gaussian curve. Much smaller volume losses of
the order of 0.4% and settlements of the order of 3.5mm were recorded for both the 21m
deep west and east bound tunnels constructed in Glauconitic sands of the Lambeth group.

CHAPTER 2. REVIEW OF LITERATURE 22
Figure 2.4: St James’s Park settlement (after Nyren et al., 2001)
Figure 2.5: Southwark Park settlement (after Withers, 2001a)
Transverse settlement profiles at the Niagara Court and Old Jamaica Road sites were
found to give reasonable agreement with the Gaussian profile (Withers, 2001a). For all
the reference sites, longitudinal settlement profiles were found to have a shape similar
to a cumulative probability curve. The magnitudes of the horizontal strains induced at
the surface differed between the Southwark and St James’s Park sites with the former
having around a third of the tensile strain magnitude of the latter. Horizontal strains were

CHAPTER 2. REVIEW OF LITERATURE 23
determined by measuring horizontal ground movements between adjacent survey stations
with a micrometer stick. Values determined for the trough width parameter K were around
0.4 for the London clay and 0.5 for the Lambeth Group sites.
Measurements of the St James’s Park site confirm the assertions of Burland (1997) and the
finite element predictions of Chapman et al. (2002) that simple superimposition of Gaussian
settlements for multiple tunnels can be unconservative. Ground movements associated
with the second of the driven tunnels were found to be asymmetrical with a larger zone
of movement and greater volume loss on the side of the existing tunnel. Shear strains in
the soil, caused by the construction of the first tunnel, which reduce the soil stiffness were
found (with the help of numerical predictions), to be the cause of this phenomenon.
Numerical predictions of the ground movements at these greenfield sites, described by
Addenbrooke and Potts (2001) for St James’s Park and Kovacevic et al. (2001) for the
other sites, predicted surface settlement troughs which were wider and shallower than the
measured values described above. The maximum settlement predicted at the St James’s
Park site for each tunnel was 12mm (eastbound) and 11mm (westbound) as compared to
the measured values of 23mm and 20mm respectively.
2.5 Prediction of damage to buildings
2.5.1 Early empirical methods and definitions
Early work relating to building damage due to settlements was based on an empirical
approach which was not specific to the cause of the settlements. The studies by Skemp-
ton and Macdonald (1956) and Polshin and Tokar (1957) led to recommendations on the
allowable settlement of structures. Skempton and MacDonald used as their criterion for
damage the angular distortion, β defined as the ratio of the differential settlement δ and
the distance l between two points. They found that cracking of walls and partitions would
commence when β > 1/300 and structural damage would occur when β > 1/150. The
recommendation was made to limit β to a value of 1/500. Polshin and Tokar used three

CHAPTER 2. REVIEW OF LITERATURE 24
criteria including the slope, defined as the difference in settlement of two adjacent supports
relative to the distance between them. Maximum slopes were recommended as 1/500 for
steel and concrete frame buildings or 1/200 where there is no infill. These recommendations
agreed well with those of Skempton and MacDonald.
Current physical definitions relating to the prediction of damage, as given by Burland and
Wroth (1974) and updated by Burland (1997), are given below and shown in figure 2.6:
• Rotation or slope, θ is the change in gradient of a line joining two points;
• Angular strain, α is the change in angle between adjacent straight lines joining two
points on the building base;
• Relative deflection, Δ, is the displacement of a point relative to a line connecting two
reference points on either side;
• Deflection ratio is given by Δ/L where L is the distance between reference points
that define Δ;
• Tilt, ω, defines the rigid body rotation of the structure;
• Angular distortion or relative rotation, β, is the rotation of the line joining two points
relative to the tilt; and
• Average horizontal strain, εh , is the change in length δL over the length L.
A system of classifying building damage for masonry structures was first proposed by
Burland et al. (1977) and is summarised in table 2.1.
Damage to structures usually occurs initially as visible cracking caused by tensile strains
induced in the building. Polshin and Tokar (1957) introduced this concept and suggested a
critical tensile strain, εcrit, which when reached would result in cracking. The critical value
they suggested was 0.05%. Burland and Wroth (1974) further investigated tensile strain
and suggested that εcrit for the onset of cracking was in the range of 0.05-0.1% for masonry
structures and 0.03-0.05% for reinforced concrete beams. They also noted that the onset

CHAPTER 2. REVIEW OF LITERATURE 25
max
L
max
smax
smax
max
max
Figure 2.6: Physical definitions (after Burland, 1997)
Table 2.1: Classification of building damage (after Burland et al., 1977)
Damage Degree Description ofCategory of severity typical damage
0 Negligible Hairline cracks less than about 0.1mm wide.1 Very slight Fine cracks easily treated during normal decoration.
Crack width up to 1mm.2 Slight Cracks are easily filled. Redecoration probably required.
Crack width up to 5mm.3 Moderate Cracks can be patched by a mason. Repointing and
possibly replacement of some brickwork. Crack widthfrom 5-15mm.
4 Severe Extensive repair work involving replacement. Crackwidths from 15-25mm.
5 Very severe Major repairs required including partial or complete re-building. Crack width typically greater than 25mm.

CHAPTER 2. REVIEW OF LITERATURE 26
Table 2.2: Damage categories (after Boscardin and Cording, 1989)
Category of damage Normal degree of severity Limiting tensile strain0 Negligible 0.000 - 0.0501 Very slight 0.050 - 0.0752 Slight 0.075 - 0.1503 Moderate 0.150 - 0.300
4 to 5 Severe to very severe >0.300
of cracking does not necessarily compromise the serviceability of the structure. Burland et
al. (1977) replaced the concept of critical tensile strain with that of limiting tensile strain
εlim used as a serviceability parameter.
Boscardin and Cording (1989) further developed the use of limiting tensile strain as a
damage criterion by examining case studies and linking the damage category directly with
εlim as shown in table 2.2.
2.5.2 Calculation of building strains
An analytical method of calculating the tensile strains caused by ground settlement that
can then be used to predict damage is given in the key paper by Burland and Wroth (1974).
The building is treated as a weightless, uniform, deep elastic beam of length, L, and height,
H , with unit thickness. Relationships are derived to determine the deflection ratio Δ/L
in hogging and sagging at which cracking is initiated, from the calculated tensile strain in
the building. Tensile strains can occur either due to bending, with vertical cracks due to
direct tensile strain, or shear, with diagonal cracks due to diagonal tensile strain. In most
cases both modes of deformation will occur at the same time. The deflection of a simply
supported deep beam under a central point load flexing in both bending and shear is given
by Timoshenko (1957) as,
Δ =PL3
48EI
[1 +
18EI
L2HG
](2.17)
where E is Young’s Modulus, G is the shear modulus, I is the second moment of area,
H is the height of the beam and P is the central point load. The use of the point load

CHAPTER 2. REVIEW OF LITERATURE 27
equation is justified by Burland and Wroth (1974) on the basis that other load cases give
a similar result. Equation 2.17 can be rewritten in terms of the maximum bending strain
in the extreme fibre εbmax and the deflection ratio Δ/L,
Δ
L=
[L
12t+
3EI
2tLHG
]εbmax (2.18)
where t is the distance between the neutral axis and the edge of the beam in tension. For
beams in sagging it is assumed that the neutral axis is in the middle of the beam as the
ground foundation provides no restraint. For beams in hogging, however it is assumed
that the foundation provides restraint and that the neutral axis lies along the base. The
maximum diagonal strain εdmax can be written in the same way,
Δ
L=
[1 +
HL2G
18EI
]εdmax (2.19)
Using these equations the maximum tensile strain can be calculated from a given deflection
ratio by setting εmax equal to εlim.
Boscardin and Cording (1989) extended the above work by considering lateral ground
movements induced by tunnelling rather than just vertical settlement. From case studies,
they found that the component of horizontal strain was significant and previously unac-
counted for. They included the horizontal strain by assuming that under the influence of
lateral ground movements, the beam uniformly extended over its full depth. In the bending
region the limiting tensile strain thus becomes,
εbr = εbmax + εh (2.20)
In the diagonal strain due to shearing region, the horizontal strain can be combined using
Mohr’s circle of strain giving,
εdr = ε
(1 − v
2
)+
√εh
2
(1 − v
2
)2
+ εdmax2 (2.21)

CHAPTER 2. REVIEW OF LITERATURE 28
where v is Poisson’s ratio. The maximum tensile strain is then the greater of εbr and
εdr. This maximum tensile strain can be used in table 2.2 to predict the damage category.
Boscardin and Cording also developed the chart shown in figure 2.7 for predicting potential
damage by relating the horizontal strain to the angular distortion β.
Burland (1997) proposed the use of a similar interaction chart by adapting the values of
εlim associated with the various damage categories in table 2.2 and using deflection ratio
rather than angular distortion. Such a diagram for L/H=1 is shown in figure 2.8.
Figure 2.7: Relationship of damage to angular distortion and horizontal strain(after Boscardin and Cording, 1989)
0.00
0.10
0.20
0.30
0 0.1 0.2 0.3
Horizontal strain (%)
De
fle
cti
on
ra
tio
/L
(%
)
Category 1
Category 2
Category 3 dam
age
Category 4 and 5 dam
age
0
Figure 2.8: Relationship of damage category to deflection ratio and horizontalstrain for L/H=1 (after Burland, 1997)
CHAPTER 2. REVIEW OF LITERATURE 29
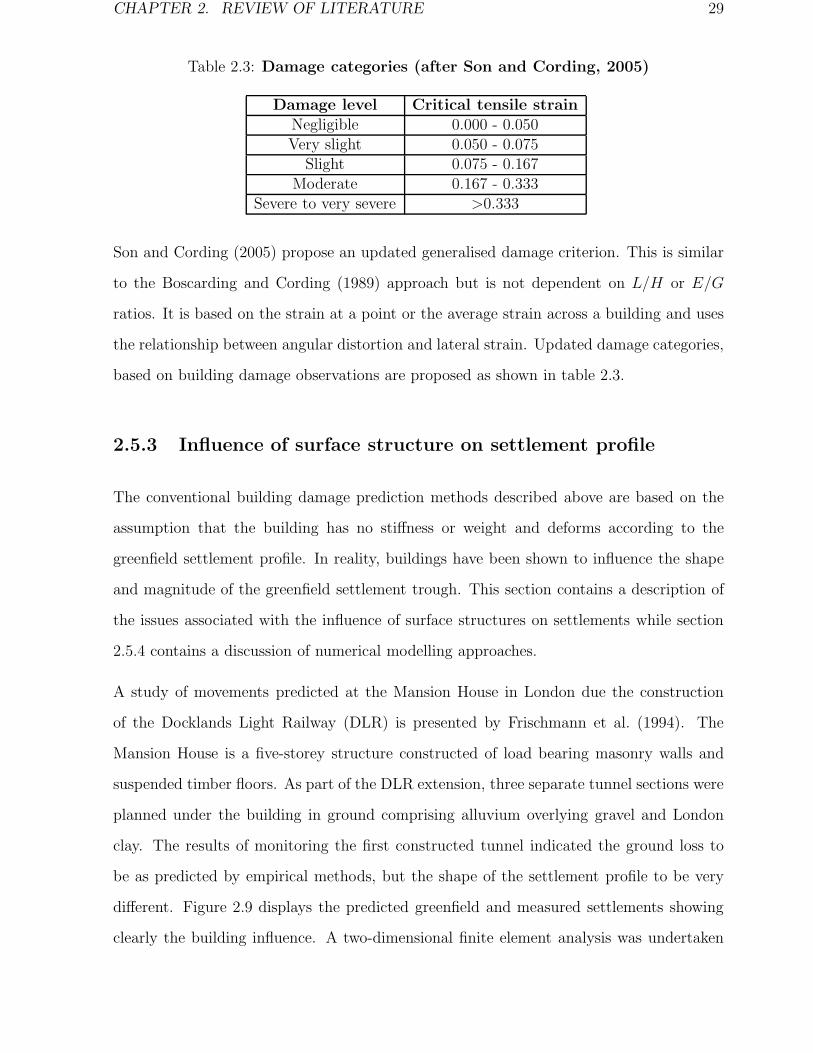
Table 2.3: Damage categories (after Son and Cording, 2005)
Damage level Critical tensile strainNegligible 0.000 - 0.050Very slight 0.050 - 0.075
Slight 0.075 - 0.167Moderate 0.167 - 0.333
Severe to very severe >0.333
Son and Cording (2005) propose an updated generalised damage criterion. This is similar
to the Boscarding and Cording (1989) approach but is not dependent on L/H or E/G
ratios. It is based on the strain at a point or the average strain across a building and uses
the relationship between angular distortion and lateral strain. Updated damage categories,
based on building damage observations are proposed as shown in table 2.3.
2.5.3 Influence of surface structure on settlement profile
The conventional building damage prediction methods described above are based on the
assumption that the building has no stiffness or weight and deforms according to the
greenfield settlement profile. In reality, buildings have been shown to influence the shape
and magnitude of the greenfield settlement trough. This section contains a description of
the issues associated with the influence of surface structures on settlements while section
2.5.4 contains a discussion of numerical modelling approaches.
A study of movements predicted at the Mansion House in London due the construction
of the Docklands Light Railway (DLR) is presented by Frischmann et al. (1994). The
Mansion House is a five-storey structure constructed of load bearing masonry walls and
suspended timber floors. As part of the DLR extension, three separate tunnel sections were
planned under the building in ground comprising alluvium overlying gravel and London
clay. The results of monitoring the first constructed tunnel indicated the ground loss to
be as predicted by empirical methods, but the shape of the settlement profile to be very
different. Figure 2.9 displays the predicted greenfield and measured settlements showing
clearly the building influence. A two-dimensional finite element analysis was undertaken

CHAPTER 2. REVIEW OF LITERATURE 30
to establish the influence of the stiffness of the building with the settlements predicted by
the model agreeing well with the measured settlements after optimisation. Discussion of
the methods used in the finite element analysis is presented in section 2.5.4.
-14
-12
-10
-8
-6
-4
-2
0
0 10 20 30 40 50 60
Distance from north portico (m)
Se
ttle
me
nt
(mm
)
Actual
Predicted green field
Tunnel CL
Figure 2.9: Settlements at the Mansion House (after Frischmann et al., 1994)
Potts and Addenbrooke (1997) carried out a parametric study of the effect of building
stiffness on settlement profiles using 2D finite element methods. The building was repre-
sented as a beam with bending stiffness EI and axial stiffness EA with the soil modelled
as non-linear elastic perfectly plastic. A discussion of the finite element analysis is given
in section 2.5.4. The geometry considered in the analysis included the building half width
H , its eccentricity with respect to the tunnel centre line, e, and the tunnel depth. The
tunnel diameter was fixed. Two relative soil-structure stiffness parameters were defined,
the relative axial stiffness α∗ and the relative bending stiffness ρ∗ given as,
ρ∗ =EI
EsH4(2.22)
α∗ =EA
EsH(2.23)
where Es is the soil stiffness. A comprehensive range of finite element analyses was per-
formed. The effect of relative bending stiffness as measured by ρ∗ is shown in figure 2.10.
For each analysis, a settlement profile and a horizontal displacement profile were generated

CHAPTER 2. REVIEW OF LITERATURE 31
Figure 2.10: Influence of relative bending stiffness on settlement profile (afterPotts and Addenbrooke, 1997)
and the building distortion parameters of deflection ratio in sagging and hogging (DRsag
and DRhog respectively) and horizontal strain in tension and compression (εht and εhc)
interpreted from the results. For each building size and location the greenfield ground
movements were used to obtain the greenfield values of deflection ratio and horizontal
strain. The greenfield values were then compared to the values including the building, and
modification factors derived to relate the two. The modification factors are defined as
MDRsag =DRsag
DRgsag
, MDRhog =DRhog
DRghog
(2.24)
M εht =εht
εght
, M εhc =εhc
εghc
(2.25)
where DRgsag and DRg
hog are the deflection ratios for the greenfield settlement trough
beneath the building and εght and εg
hc are the maximum horizontal tensile and compressive
strains of a greenfield trough beneath the building.
The modification factors were then plotted against ρ∗ and α∗ respectively for each e/B,
where B is the building width. Empirical design curves were fitted through the data and

CHAPTER 2. REVIEW OF LITERATURE 32
charts presented. Modification factors read from the charts can be used by designers to
modify the empirically obtained greenfield parameters of horizontal strain and deflection
ratio to account for the relative building stiffness before imposing these on the structure
and assessing any potential damage. The damage assessment method proposed is the use
of the chart similar to that given as figure 2.8 in this thesis.
An evaluation of the relative stiffness approach using centrifuge modelling was undertaken
by Taylor and Grant (1998). A rubber pad placed on the surface of the soil model was used
to simulate a building and surface and sub-surface ground movements were observed. Re-
sults indicated that the relative stiffness of the building (although quite flexible) influenced
the settlement profile by reducing the curvature. Modification factors for deflection ratios
estimated from the observed settlements agreed reasonably well with those suggested by
Potts and Addenbrooke (1997).
The relative stiffness method proposed by Potts and Addenbrooke is a significant improve-
ment on the empirical methods without the building, but in its original form does not in-
clude 3D effects or the effect of vertical loads imposed by the building. Three-dimensional
effects not considered by the 2D analyses include the transitory effect of the longitudinal
settlement trough or geometrical considerations when a tunnel is constructed obliquely
under a building. Consideration of the impact of including the building weight and 3D
effects on the relative stiffness method are presented by Franzius et al. (2004) based on the
work by Franzius (2004). Design charts and amended definitions of the modification factors
based on parametric studies are presented, however it is concluded that the impact of these
additional factors on the original Potts and Addenbrooke (1997) method are minimal and
that, as the original method is conservative, it can be used with confidence. The 3D stud-
ies, however, only consider a building represented by an elastic slab lying symmetrically
above a tunnel, not at an oblique angle to the route alignment.
Son and Cording (2005) investigate the influence of relative shear stiffness of masonry
facades in relation to soil stiffness and recommend that this be considered when using strain
damage criteria for predicting building damage. The relative stiffness (RS) relationship is

CHAPTER 2. REVIEW OF LITERATURE 33
given between the building shear stiffness and the soil as
RS =EsL
2
GbuildHb(2.26)
where Es is the soil stiffness, L the length of the building, H the building height, Gbuild
the elastic shear stiffness of the building and b the wall thickness. Relationships between
this relative stiffness and the ratio of angular distortion of a building (β) to the change in
ground slope of a greenfield profile (ΔGS) are given for a range of numerical and model
tests. Using these charts a modified (normalised) angular distortion is determined and
used in conjunction with the tensile strain to determine the modified building damage
parameter. Interaction with the Potts and Addenbrooke (1997) method using relative
axial and bending stiffnesses is not explored nor is the method referenced.
The influence of a building on surface settlements in 3D has also been under investigation
at Oxford University using finite element methods. Work presented in theses by Lui (1997),
Augarde (1997), Bloodworth (2002) and Wisser (2002) detailing the development and use
of 3D finite element models of masonry structures and tunnels is discussed in section 2.5.4.
The results of their analyses show the effect of a masonry structure on surface settlements
and include the effects of building weight and tunnelling obliquely beneath a building. A
plot of surface settlements is given in figure 2.11 comparing a greenfield profile (a) and
the profile including a building after tunnel construction underneath (b). This research
confirms the importance of the influence of soil-structure interaction including both the
building stiffness and weight and that this problem is an inherently three-dimensional one.
The prediction of damage to buildings due to tunnel induced ground movements in 2D is
generally based on the methods of Burland and Wroth (1974) and Boscardin and Cord-
ing (1989). The influence of the building stiffness in two dimensions can be included by
using the relative stiffness method of Potts and Addenbrooke (1997). For assessments in-
corporating full 3D soil-structure interaction effects though, conventional methods cannot
handle the problem (Potts, 2003) and numerical methods must be used.

CHAPTER 2. REVIEW OF LITERATURE 34
Figure 2.11: Settlement contours (mm): (a) greenfield tunnel; (b) building in-cluded (after Burd et al., 2000)
2.5.4 Numerical methods
Numerical methods are now being used increasingly frequently for the prediction of damage
to buildings due to tunnelling. Inadequate computing hardware and software resources
have previously been a significant barrier to the use of numerical methods for modelling
tunnel-induced building damage however, as the number of recent papers discussed below
shows, the use, particularly of finite element methods, is now relatively common.
Two-dimensional modelling
Frischmann et al. (1994) present results of the prediction of settlements and damage of the
Mansion House in London due to tunnelling using finite element methods. A description
of the project and the results of the modelling and the field measurement of displacements
is given in section 2.5.3 of this thesis. The soil was modelled using a linear elastic model,
justified on the grounds that the area of interest was outside the zone of possible non-
linear behaviour. This is a simplification as the non-linear effects of the typical response of
London clay under small strains have been shown to be significant as discussed in section
2.3.2. The ground loss of 2.0-2.5% was modelled by applying radial displacements to the
excavated tunnel. The masonry facade was modelled as simple beam elements with uniform
elastic modulus of 1GPa and Poisson’s ratio of 0.2. It is interesting that the predictions
only gave a reasonable fit to the field data when the vertical support of orthogonal walls was

CHAPTER 2. REVIEW OF LITERATURE 35
modelled using vertical springs at the ends of the wall under investigation and the stiffness
of the springs optimised. This indicates that the 3D geometry of the building needed to
be taken into account. Reduced stiffness expected in the hogging mode of deformation of
walls due to existing cracks was considered. Settlements predicted using this method were
then applied to detailed models of the walls to predict crack damage.
The work of Potts and Addenbrooke (1997) is discussed in section 2.5.3 of this thesis
in relation to the influence of building stiffness on settlement profiles due to tunnelling.
Further aspects of the finite element models used in their parametric study are discussed
here. Modelling was undertaken assuming plane strain conditions with soil modelled as
a non-linear elastic-plastic material. Non-linear pre-yield behaviour was modelled and a
Mohr-Coulomb yield surface and plastic potential used to model the plastic behaviour.
The soil was given properties representative of London Clay. A linear elastic surface beam
was used to represent the building and its interface with the soil was assumed to be rough.
Stiffness properties for the beam were a variable in the analyses and independent bending
and axial stiffnesses were prescribed. In addition, analyses were undertaken where the beam
was given the stiffness of a one, three or five story structure with concrete slab floors each
with a value of Ec = 23x106kN/m2, area A = 0.15m2/m and Islab = 2.8125x10⁻⁴m4/m.
The analysis did not include the building weight or any three-dimensional effects.
Calabresi et al. (1999) use a plane strain finite element model to prediction damage to the
Castel S. Angelo in Rome due to tunnelling. Ground conditions consisted of silty alluvial
sands overlying stiff clay at a depth of 30m. The tunnel depth ranged between 23 and 26m
and was 11.8m in diameter. Soil was modelled using an elastic-plastic model with pre-
failure non-linearity implemented as the Hard Soil model in the software PLAXIS. The
structure is a massive masonry cylinder 64m in diameter and 35m high, founded on a 6m
thick slab. The justification for the use of a plane strain idealisation of the structures was
that its out of plane dimension is large in comparison to the tunnel diameter. This method
is not appropriate for modelling a building over a long tunnel in a soil-structure interaction
problem. The foundation slab and masonry cylinder were modelled as linearly elastic-
perfectly plastic materials with compressive strength of 1.6MPa and modulus of 1.5GPa

CHAPTER 2. REVIEW OF LITERATURE 36
for the slab and a reduced modulus to account for internal voids in the masonry cylinder.
Volume losses ranging from 0.5-1.5% were prescribed by imposing radial contractions on the
tunnel outline. Finite element results were compared to empirical predictions including the
building stiffness modification factors of Potts and Addenbrooke (1997). The finite element
analysis gave good agreement in terms of damage prediction parameters. No case study
data was presented to verify the predictions.
Throughout the literature, both for analytical studies and for the plane strain analyses
discussed above, beams representing buildings are generally given simple linear isotropic
elastic properties based on the material of the wall or building. The methods used to derive
properties for the beam are empirical and are not consistently undertaken. Recognition
that beams may need to be more complicated than simply linear elastic isotropic is found
initially in Burland and Wroth (1974) who consider that the properties of beams repre-
senting facades might be affected by the physical geometry of the facade. They note that
the ratio E/G may vary from isotropic elastic theory (E/G=2(1+ν)) due to the number
of openings affecting the relative bending and shear stiffness. Examples are given for the
relationship between L/H ratio and critical tensile strain for values of E/G of 0.5 (very
stiff in shear), 2.6 (isotropic) and 12.5 (very flexible) which exhibit differing responses. No
indication is given as to the appropriate choice of a value of E/G to use for any particular
facade geometry or independent consideration of E or G values.
In addition to these elastic considerations, cracking is generally dealt with by reducing the
modulus of the representative beam by arbitrary amounts or the introduction of measures
such as hinges where cracks were observed to develop. No rigorous analyses of the effects
on beam properties of such factors as material, cracks, windows or the building dimensions,
especially for short buildings is used to assign properties to the simple equivalent beams.
An evaluation of damage to masonry buildings using 2D numerical analysis, including the
modelling of a non-linear masonry wall (rather than using simplified elastic beams) was
undertaken by Miliziano et al. (2002). For a tunnel driven symmetrically under a series of
regularly spaced (in the longitudinal direction) orthogonal masonry walls, each structure
was represented by an equivalent masonry wall made up of a number of discrete linear

CHAPTER 2. REVIEW OF LITERATURE 37
elastic elements (representing the masonry bricks) separated by horizontal and vertical in-
terfaces of elastic-perfectly plastic material with a tensile limit strength (representing the
mortar). An elasto-plastic Mohr Coulomb model was used for the soil with Young’s modu-
lus increasing linearly with depth. The main conclusion is to confirm the importance of the
inclusion of the surface structures in tunnelling-induced damage prediction as neglecting
the soil-structure interaction lead to an overprediction of damage. Further analyses of ma-
sonry walls are presented by Boonpichetvong and Rots (2004) who present 2D tunnelling
analyses including a full masonry facade modelled using a fracture mechanics approach.
Despite the soil being modelled as simply linear elastic, the impact of soil-structure inter-
action is still clear.
Three-dimensional modelling
The ground movements around the advancing heading of a tunnel develop as a 3D process.
The geometric considerations when tunnels pass obliquely under a building, the transitory
nature of soil movements during the passage of the tunnel and the thickness of the build-
ing walls are also 3D effects. Finite element analysis in 3D is therefore needed to capture
fully the appropriate geometry and thus predict damage to structures more realistically.
Barriers to the wide use of three-dimensional finite element modelling include the mod-
elling of tunnel installation procedure including the tunnel lining, the choice of a suitable
constitutive model for the soil and the computer hardware required to run large complex
models. These barriers are progressively being tackled due to research into 3D modelling
and the use of improved commercial software capable of modelling in 3D.
Research at Oxford University has been described in section 2.3.2 in relation to the mod-
elling of greenfield sites. The focus of the work has been the development of a three-
dimensional model that provides realistic simulation of the interaction between a structure
and the ground during tunnelling. The work by Chow (1994) and Houlsby (1999) on the
development of constitutive soil models and Augarde (1997) on three-dimensional mod-
elling of tunnel excavation and tunnel lining has already been described. Work by Lui
(1997) as part of the same project involved the development of a numerical model for a

CHAPTER 2. REVIEW OF LITERATURE 38
masonry building and a scheme to connect the building to the ground surface. The masonry
structure was modelled as a series of facades constructed from 2D plane stress elements
connected using specially developed tie elements. The material model for the masonry
was an elastic no tension model with a small residual tensile strength. Elastic lintels were
introduced above door and window openings in the facade.
Finite element analyses including the building were undertaken as described by Lui (1997),
Augarde (1997) and presented by Burd et al. (2000). The building was shown to influence
the greenfield settlements as discussed in section 2.5.3. The damage predicted on the
facades was also significantly different when the building was included in the analysis with
the tunnel, compared to the case when the greenfield settlements were applied to the
building. The result of the research to date is the development of a detailed 3D model.
Verification of the model by comparison with case studies was reported by Bloodworth
and Houlsby (1999) and Bloodworth (2002). Wisser (2002) described the extension of the
model to include the ability to model compensation grouting. There exist opportunities
for further verification using new case study information described in section 2.6.
Computer resources used in the simulation of tunnelling using the model developed at
Oxford are significant. The non-linear soil model combined with the no tension masonry
model and the large number of solution steps required to fully capture the details of the
interaction lead to large memory requirements and long run times. Bloodworth et al. (1999)
note that for a typical large analysis, run times were of the order of two weeks on the
fastest serial platform available to the research group at the time, a Sun Ultra 2 having
300MHz and 512Mb of RAM. The use of the (now superseded) Oxford Supercomputing
Centre machine, OSCAR, significantly reduced run times from around 20 minutes per
calculation step to four minutes. This time is still a significant barrier, however, to the
widespread use of such complex models, as design consultants are unlikely to have access
to high powered supercomputers and will want analyses that can be completed in matters
of hours. Possibilities for reducing run times include the development of more efficient
solvers, more advanced hardware (such as the newer, more powerful supercomputers) or
more efficient methods of numerical modelling.

CHAPTER 2. REVIEW OF LITERATURE 39
Examples of 3D finite element modelling used on commercial projects include the Netzel
and Kaalberg (2000) description of damage assessment of masonry structures in Amster-
dam for the construction of the North/South Metroline. Construction in soft sandy soil,
generally 21 to 32m below ground level, of 6.5m twin tunnels was assessed for potential
damage to the adjacent masonry structures. A long building comprising ten 16m high, 18m
long and 7m wide connected apartments was modelled. The foundation of the building
consists of 14m long timber end bearing piles. A 3D finite element analysis was under-
taken using a no-tension model for the masonry using plane stress elements with openings
for windows and doors. Piles were modelled using truss elements and non-linear springs
represented the toe resistance and skin friction. In this study, however, the tunnel was not
modelled. Theoretical greenfield subsurface settlements at pile toe level were imposed on
the piles sequentially at depth to model the passage of the tunnel. By imposing greenfield
settlements rather than modelling the tunnel construction, the building-soil interaction
was ignored. Nevertheless, the results of the study are interesting as they indicate that
the worst damage was due to the transient effects of the longitudinal settlements. No field
data is given as a comparison with the numerical model.
An investigation of the influence on tunnel induced settlements of a multistorey framed
structure is described by Dias and Kastner (2002). Tunnel construction on Line 2 of the
Cairo Metro through soft alluvial soils 25m under a six-storey structure is simulated. The
soil was modelled as elastic-perfectly plastic material and the building frame as elastic
beams representing columns supporting floors comprised of shell elements. The building
was found to influence the transverse settlement profile by acting in a rigid manner causing
the profile to become a straight slope and maximum settlement to increase. Moments and
shear forces in the building members were found to be affected by the transient passage
of the tunnel, but no damage assessments were undertaken, nor were the results compared
to field measurements. Further work on the interaction of framed concrete structures in
tunnelling situations is presented by Mroueh and Shahrour (2002 and 2003) who simulated
tunnel construction in an elastic-perfectly plastic soil based on the Mohr-Coulomb criterion
under a linear elastic framed building. Two analyses were performed, one including the

CHAPTER 2. REVIEW OF LITERATURE 40
building self weight and one with a weightless building. For both cases a fully coupled
analysis with the building included produced less relative displacements at foundation
level and lower induced forces in the building frame than an uncoupled analysis with the
greenfield displacements simply applied to the building. The authors also concluded that
to ignore the building weight in the assessment leads to underestimation of the tunnelling
induced forces in the building. A similar analysis of tunnelling under a full model of a
concrete frame building is presented by Jenck and Dias (2004). The soil was modelled
as elastic-perfectly plastic and the building frame as elastic concrete beams representing
columns supporting floors comprised of shell elements. The influence of the building weight
and stiffness are shown, with the soil settlement profile and the member forces in the frame
building changing depending on the stiffness and weight of the building.
All of the analyses described above include a full finite element model of the building. This
uses significant computer hardware and means that run times are quite long. Modelling
of the full building in three dimensions is often thought to be inappropriate for design in
practice as design programmes can be too long if they include such analyses as noted by
Fricker and Alder (2001). The author is unaware of any current research into the simplified
modelling of buildings in three dimensions using surface beams that aims to make analysis
easier and faster. In 2D, building facades and load bearing walls are represented by surface
beams with properties derived in a number of empirical ways as described in this review.
The methods discussed for the formulation of such simplified beams are not consistent,
however, and differ greatly between models. There is no equivalent of the building as a
beam in two dimensions in use in 3D analysis. The development of such a simplified model
would facilitate analysis without the need to model the complete structure to determine
its influence on ground settlements. This is one of the primary aims of this project and
will be discussed in Chapter 3.
2.5.5 Current damage assessment methodology
Currently the assessment of structural damage is undertaken in a three-stage process.
A preliminary Stage 1 assessment is carried out based on predicted greenfield settlements

CHAPTER 2. REVIEW OF LITERATURE 41
(ignoring any soil-structure interaction). Buildings at locations where maximum settlement
is greater than 10mm and slope greater than 1 in 500 are deemed to be at risk and are
thus subjected to a second stage assessment. In Stage 2, hand methods are used to predict
the limiting tensile strains in the structure and classify the risk of damage according to the
categories of Boscardin and Cording (1989). In this stage current practice accounts for the
contribution of the structure’s stiffness in 2D using the relative stiffness method of Potts
and Addenbrooke (1997). These stage one and two methods are known to be conservative
and are widely used. For buildings classified to be at moderate risk (or worse) of damage,
a third stage of assessment is carried out. It is only in Stage 3 that engineers might utilise
finite element models to fully assess individual structures in 3D.
2.6 Case studies of building damage prediction
Many of the papers discussed above in relation to numerical modelling contain case study
data which is compared to the numerical predictions. In general, the case studies in the
literature all provide evidence that buildings modify the greenfield settlement profile. A
large proportion of these are commercial projects where the case study data were not
intended to be used for further research, merely presented as a description of the project.
Case study data that were obtained specifically for the purpose of research is generally of
higher quality and more useful.
Recently published data from the collaborative research project undertaken by Imperial
College and sponsored by London Underground Limited, the Department of the Envi-
ronment Transport and the Regions (DETR) and the Engineering and Physical Sciences
Research Council (EPSRC) and other industry partners contained in Burland et al. (2001)
includes numerous case studies where data were collected during the construction of the
Jubilee Line Extension in London. The volumes include case studies of 21 buildings, 14 of
which are load bearing masonry with five reinforced concrete and two steel and masonry
framed structures. The majority are on pad or strip footings, with five on piles and five on
rafts. The ground conditions existing at the sites are mostly London Clay or the Lambeth

CHAPTER 2. REVIEW OF LITERATURE 42
Group. All of the structures lie above the twin tunnels of the Jubilee Line extension.
A large number of the structures were protected from damage by compensation grouting.
This process, while interesting in itself, has been the subject of other research at Oxford
University (Wisser, 2002) so case studies where this technique is employed are not consid-
ered here. The most appropriate case studies for the research on soil-structure interaction
described in this thesis are those where no protective measures have been implemented.
These include the site at the Murdoch, Clegg and Neptune House complex at Moodkee
Street, Rotherhithe. The buildings on the site are load bearing masonry. The full case
studies are presented by Withers (2001b) but a brief description of the case is given below.
Murdoch, Clegg and Neptune Houses in Rotherhithe are three storey masonry buildings
containing flats founded on strip footings (Withers, 2001b). The tunnels underneath were
driven by two EPB TBMs in the lower sandy strata of the Lambeth Group. Monitoring
took place during early 1996 prior to and during construction and continued until Au-
gust 2000 and included precise levelling of points on the exterior walls of all buildings and
horizontal measurements with tape extensometer along two external walls. The predicted
and measured settlement response of the buildings were compared (Withers, 2001b) and
some unexpected results relating to the stiffness effect of the buildings are evident. All
three buildings were assumed to behave in a rigid manner during the settlement predic-
tions. From the measured data, only Clegg House behaved as rigidly as expected, whereas
the other two buildings responded more flexibly than predicted and displayed settlement
profiles closer to the greenfield profile, particularly Murdoch House. Differences were at-
tributed to assumptions about volume loss and trough parameter.
A significant pointer to the expected uses of this data is given by the editors, stating
that they have “opened up access to a ‘gold mine’ of data. Now that gold has to be
mined. This further sifting, assimilation, processing, analysis and interpretation of data is
a vital. . . activity”.

Chapter 3
Aims and Outline
3.1 Conclusions from literature review and research
opportunities
This chapter summarises current approaches to analysing building response to tunnelling
from the literature, identifying opportunities for current research. The aims and outline of
the project are then described.
The assessment of ground movements and building damage due to soft ground tunnelling
has historically been undertaken in practice using empirical methods. These methods, as
described in section 2.2, did not include the building stiffness, weight or three-dimensional
effects. The building stiffness can be included in two-dimensions by using the relative
stiffness method of Potts and Addenbrooke (1997). This method however, does not include
the building weight and only considers two dimensions. The recent extensions to the model
described by Franzius (2004) and Franzius et al. (2004) allow for the building weight
and consider a three-dimensional situation with a tunnel passing symmetrically under a
building. The need to include full three-dimensional effects is apparent not only due to the
potential for damage caused by the transient longitudinal settlement trough but also the
possibility of asymmetric and eccentric geometric situations and the twisting of buildings.
Equally important, as noted by Franzius (2004), is the ability to include a model for the

CHAPTER 3. AIMS AND OUTLINE 44
building capable of modelling the behaviour of masonry (not just an elastic model) and
to utilise further comparisons with the Jubilee Line Extension (JLE) case studies in the
development of fully 3D capable methods.
This echoes the conclusions presented by Burland in summarising the lessons learned from
the research on the JLE project (Burland et al., 2002). These lessons included that load
bearing walls in hogging can be significantly more flexible than those in sagging and that
this behaviour should be considered in any relative stiffness analysis; that transitory move-
ments during the passage of a tunnel can be more severe than the final movements after
the tunnel has passed (as evidenced by the measurements made at the Treasury building
and at Keeton’s Estate where transitory deflection ratios were more severe than final val-
ues); that the relative stiffness approach of Potts and Addenbrooke (1997) was used to
good effect in improving the previous methods of building damage assessment; and finally
that, despite these improvements, damage to some buildings was less than predicted by the
assessment methods used which may have resulted in too much protective compensation
grouting work being undertaken. It was noted that methods for including buildings in set-
tlement predictions “urgently need extending to three dimensions” (Burland et al., 2002).
To include three-dimensional effects fully in predictions relating to complex soil-structure
interactions, numerical models must be used as conventional methods cannot handle this
problem as noted by Potts (2003).
The body of numerical analysis discussed in sections 2.3.2 and 2.5.4 includes analyses in
which the modelling of tunnels and buildings is undertaken in two dimensions. In the
majority of these analyses the building is represented by a simple linear elastic beam
(for example Frischmann et al. (1994) and Potts and Addenbrooke (1997)). In general,
no rigorous analysis of the methods for determining properties for such beams has been
undertaken to ensure that the beam responds to ground movements in the same way that
the building does. Franzius (2004) also notes the importance of the need to develop beam
models capable of including masonry behaviour and accounting for twist in 3D.
Numerical models developed at Oxford University include three-dimensional models with a
non-linear soil model, masonry structure, staged tunnel excavation and lining installation.
CHAPTER 3. AIMS AND OUTLINE 45
These models capture 3D ground effects associated with tunnelling, the impact of the
building on ground movements and damage caused to a masonry structure. These 3D
models, however, are quite complex, and their use too time consuming to be applied
routinely on all design projects or for parametric investigations. Another result of this
complexity is the fact that only a single building is usually modelled. In urban areas the
ability to model multiple buildings simultaneously to model their combined interaction
with tunnel induced ground movements would be beneficial. This could involve the use of
multiple buildings comprised of simplified surface beams or the surrounding of a full model
of a building of interest with simplified beam models of adjacent buildings.
The conclusions above drawn from the review of literature indicate opportunities for current
research. The aims and outline of the project are given below.
3.2 Project aims
The aim of this project is the development and testing of a new three-dimensional ap-
proach to the numerical modelling of masonry buildings using surface beams. It involves
extending the surface beam method of modelling masonry buildings to three dimensions;
the development of a procedure for determining properties for surface beams representing
masonry buildings; the inclusion in the new surface beam models of the ability to capture
the different behaviour of masonry in different modes of deformation; and the use of the
new beam models in 3D numerical models of building response to tunnelling.
Attention is focused here on the opportunity to simplify the modelling of the building,
rather than the soil or tunnel. It has been discussed above how complex features of numer-
ical simulation such as the sequential excavation of the tunnels, soil model that accounts for
small strain non-linearity, the inclusion of tunnel lining and surface structures are required
to ensure that the simulation predicts realistic surface settlements. It is thought, however,
that the full building structure is not required to be modelled. For the purpose of assessing
the building response in three dimensions, the objective is to develop a surface beam model
of a building that responds to ground movements as the full building does. This could be

CHAPTER 3. AIMS AND OUTLINE 46
considered as the opposite of the approach taken by structural engineers when modelling
full buildings but only including a simplified model for the ground.
The development of new numerical simulations of tunnelling necessitates the verification
of such models against case study data. There is currently available recent case study data
specifically related to building response to tunnelling from the JLE project which has to
date not been extensively utilised. The opportunity therefore exists to use this data for the
verification of any new methods developed and comparison with current numerical models.
3.3 Project outline
The soil-structure interaction problem outlined above is addressed in this research project
in three phases. In Phase 1 of the project, described in Chapters 4 and 5, finite ele-
ment analyses of masonry buildings are undertaken and the results used to develop models
for two new surface beams (an elastic and a non-linear model) with appropriate proper-
ties determined so that the beams react to ground movements like a full building facade.
Timoshenko (shear capable) beams are chosen to model the facades. These beams are
implemented into the OXFEM finite element program as described in Chapter 6, as 3D
elements allowing the full modelling of 3D movement.
Phase 2 involves finite element modelling of full masonry structures as a series of connected
surface Timoshenko beams in 3D with the beams modelled using the procedure developed
in Phase 1. Tunnel construction is then simulated underneath the buildings using the
numerical methods detailed in Chapter 7 and the simplified building response compared to
that of a full building model. Example analyses include symmetric and oblique alignments
of the building with respect to the tunnel and are described in Chapter 8.
Phase 3 involves comparison between assessments of ground movement and building re-
sponse made using the new simplified beam method and case study data. The buildings
used for the case studies detailed in Chapter 9 are Murdoch, Clegg and Neptune Houses
under which the London Underground Jubilee Line Extension was constructed.
Related Documents


