1 CHAPTER 1 INTRODUCTION 1.1 Introduction In many industries, the expectation behaviors of today‟s customer are much different from those of 20 years ago. They are now increasingly time poor, more savvy and more demanding. This is also similar for the construction industry in the public sector. The ministries as customers are demanding for better service quality from Jabatan Kerja Raya (JKR) and making continuous judgments of overall performance of the service provided. The acceptance of service quality measure is highly influenced by what the customer obtained in the first place. Perception is the considerable people decisive tool for level of fulfillment. Carrying out assessment from the customers‟ feedbacks is crucial in making standards in delivering quality of service provided and should be done periodically. It is the quality of service that the customers look upon and give rates notwithstanding the service provider itself (Edvardson, 1998). This is to note that the concept of perception from the customer predominantly become the important criteria in standard making process. Jabatan Kerja Raya Malaysia was established since 1872 and serves as a technical agency for the Government of Malaysia. JKR acts in implementation of development projects and infrastructure maintenance for customers including

Welcome message from author
This document is posted to help you gain knowledge. Please leave a comment to let me know what you think about it! Share it to your friends and learn new things together.
Transcript
1
CHAPTER 1
INTRODUCTION
1.1 Introduction
In many industries, the expectation behaviors of today‟s customer are
much different from those of 20 years ago. They are now increasingly time poor,
more savvy and more demanding. This is also similar for the construction
industry in the public sector. The ministries as customers are demanding for
better service quality from Jabatan Kerja Raya (JKR) and making continuous
judgments of overall performance of the service provided.
The acceptance of service quality measure is highly influenced by what
the customer obtained in the first place. Perception is the considerable people
decisive tool for level of fulfillment. Carrying out assessment from the
customers‟ feedbacks is crucial in making standards in delivering quality of
service provided and should be done periodically. It is the quality of service that
the customers look upon and give rates notwithstanding the service provider
itself (Edvardson, 1998). This is to note that the concept of perception from the
customer predominantly become the important criteria in standard making
process.
Jabatan Kerja Raya Malaysia was established since 1872 and serves as a
technical agency for the Government of Malaysia. JKR acts in implementation
of development projects and infrastructure maintenance for customers including

2
various ministries, departments, statutory bodies and state governments in
development of roads, buildings, airports, ports and jetties etc.
As technical agency, the main role of JKR is to give technical advisor in
project implementation, during various stages including planning, design,
procurement, execution and completion. Eventually, it is becomes one of JKR
core businesses. The JKR is expanding the organization‟s operational
nationwide at three major administrative level; the headquarters, state and
district and currently JKR has beyond 32,000 employees comprises of technical
and non-technical staffs.
This is including those who posted in technical unit at various ministries.
Technical staffs are multidiscipline including Civil and Structure Engineers,
Mechanical and Electrical Engineers, Architects and Quantity Surveyors. Over
3000 of the technical personnel are professional in the managerial level, middle
level and junior level that will support their main role.
Since establishment, JKR was entrusted to implement the entire
government project and no doubt, that all project was completed as expected.
All ministries and departments become JKR customers. However, since high
demand in project implementation in various plans, the government began to
propose Project Management Consultant (PMC) back in the 1990‟s. PMC is a
multi-disciplinary company consisting of experienced construction attorneys,
architects, and other professionals. They engaged by ministries or departments
on behalf of the government to implement the projects and give consultation
service in financial and project management issues. Ministries and departments
started to have their own technical unit and started to execute the project
themselves. In 2009, PMC method no longer implemented. This is because
many of the projects were handled by PMC faced a lot of problems during
implementation that related to technical issues. Furthermore PMC method
always ends up in doubling the cost of project.
3
Several numbers of projects were failed due to collapse, crack and
settlement and resulting in cost overrun. This issue had caused JKR to take over
the project for investigation, technical advice and recommendation. As
technical advisor to government agencies, JKR is expected to give solution prior
to the case. JKR believe this situation can be avoided at early stages and JKR
should involve especially during the implementation of the project.
Consequently, all non-technical departments shall refer to JKR whenever
to implement the physical projects according to (Arahan Perbendaharaan (AP)
182.1(a)). If JKR is unable to implement the project for them due to limited
resources, JKR would grant them to implement the project on their own.
However several ministries want to implement the project at their own without
referring JKR. This is due to unsatisfied performance of the JKR in
implementing project for example delay of work and do not achieve the standard
they require. As a result, several ministries such as Ministry of Wellbeing,
Housing and Local Government, Ministry of Education, Ministry of Defense are
still continuing the implementation of the projects on their own through
consultant engagement and JKR to support the ministries by sending the
technical personnel to these ministries as technical advisor. To overcome this
scenario under AP 186(b), ministries or departments only can proceed project
implementation on their own which subject to JKR capabilities. In order to
ensure the role of JKR still relevance in his role, the top management of JKR
formed a team to study in 2007. The study is to identify problems involving
services quality and come out with improvement strategy.
The target of this study is to evaluate and to assess the customer service
quality in public agency. In this matter, JKR serves the public agency in giving
technical advice in the implementation of physical projects to other government
departments and agencies. The MS ISO 9000 quality system is used in
monitoring procedures and implementation of the project. Upon completion of
each project, the customer‟s feedback form regarding service quality is
collected. The corresponding response rate from customer feedback survey for
the year 2007, 2008 and 2009 are 79%, 82% and 50% respectively (SPK, JKR).
4
The feedback form is a direct medium for the customer to state their level of
satisfaction during the period of services. All the data derived from the form
were then analyzed and the score is used to classified and conclude the customer
satisfaction rating for the project. Despite the use of such system and the data
collected, no comprehensive action was taken to utilize the data for upgrading
the service quality. The consequences were identified and numerous ministries
for instance the Ministry of Defense and Ministry of Wellbeing, Housing and
Local Government were no longer engaged JKR for their project and started to
implement the projects on their own. The consequences numerous ministries for
instance Ministry of Defense, Ministry of Education etc., no longer engaged
JKR but starting implement the projects on their own.
The major reason is inability to meet customer needs and delay in project
completion (Rahman A., 2009). In 2007, in order to assure an increase in the
performance of project delivery in the Ninth Malaysia Plan, a significant plan
was introduced and the plan was aimed to improve the ability to perform and
capacity in project management and delivery system. Customer Service Plan
(CISP) was introduced to expedite communication and connection between the
agency and the customer through the whole of the project period. This include
in the diagnostic of the customers‟ needs. In 2009, the study was done by the
consultant to determine the level of service quality and to identify the weakness
for improvement after implementing the CSIP. The overall result shows that
JKR service quality level is moderate and the crucial issues is not meet the
customers need in term of project completion and quality and incompetent
personnel. JKR as a leading service provider believed that they can improve in
all aspect. JKR has developed strategic objectives to emphasis on customer
focus and customer loyalty under theme 2, Strategic Framework 2012-2015.
JKR Malaysia then came up with a renewed strategic plan and strives for
excellence with aim on five (5) strategic themes in effort to achieve customer
satisfaction namely :-
1) Outstanding project delivery
2) Co-creative customer experience

5
3) Centre of technical excellent
4) Leading sustainability
5) Innovative organization
This study is to review the previous study done by Rahim, (2009) and
attempts to determine which dimension which influence most to JKR service
quality under new approach. Beside that the study also carried out to investigate
the divergence and inconsistency arises from customer anticipation and
perception in current service quality and identifies the area of improvement.
Furthermore it will conclude that with new strategic framework, is JKR having
make improvement. Hypotheses test also be carried out to analyze the
relationship between service quality, customer satisfaction and service
performance. The next section will review the related literature on service
quality and the following section will be the details on the research method used
for this study and followed by the final section where discover data analysis and
discussion and later conclude the findings and recommendation.
1.2 Research Problem
During providing services to customers, JKR have to work with
persistence to meet customer satisfaction. A successful project is a project
which complete within the time frame, within allocated budget, achieved
acceptable quality by customer and meets or exceeds customer satisfaction or
expectation (Keztner, 2008). Only with these four factors customer satisfaction
can be achieved. The customer is the judge of the quality of service, not the
service provider regardless of how well the service provider‟s records seem to
be (Edvardson 1998). There are many fundamental questions that arguable in
terms of the level of satisfaction or expectation to be met. For instance, what is
the nature of customers‟ service expectations? Are there any different types of
expectations? What factors influence the formation of these expectations? How
consistence is the expectations? Do they change over time? Do they vary among
6
service situations and the customers? How can organizations manage
expectations to enhance customers‟ perceptions of services? What an
organization can do to exceed customers‟ expectations? These sorts of questions
bring JKR in tough position in order to meet the customer satisfaction and in the
same time still relevant in term of roles.
In May 2007, Prof. Dato‟ Sri ir. Dr. Judin Abdul Karim, the former
Director General of JKR Malaysia had worked out JKR Strategic Framework
2007 – 2020 in relation to upgrading and improving the service quality for a
better customer satisfaction. The main idea is to improve the service quality
which finally hopes to meet customer satisfaction. One of the strategies is to
become a strategic partner to customers and increase their involvement and
satisfaction for the services provided. This strategies were tailored to the vision
and mission of JKR and help our customers realize and aware about the policy
information and deliver services through collaboration as a strategic partner.
JKR has conducting the study on Customer Satisfaction Index (CSI) in
December 2009. The objective of the study is to assess the views of
users/customers to the services and products provided by the JKR. The study
also wants to assess the customers‟ viewpoint JKR image and identify strategic
action for improvement. The result shows (figure 1.1 to 1.3) that customer
satisfaction level is moderate due to not meeting with customer expectation.
The study also concludes that projects under JKR implementation were poorly
managed. Due to that reason, customer had an impression that JKR is not
credible to perform the ability to implement projects in the future. The result of
the study also shows that JKR image as the main project implementer agency is
below moderate. This can caused disloyalty from customer as they keen to have
other project implementer than JKR to carry out their projects.
Although JKR is implementing strategies to improve the quality, the
numbers of ministries which go for self execution for projects are increasing.
The most of the issue faced by JKR is related to poor quality in services and
products delivered. In many situations JKR has tried very hard to manage the
customer expectation and addressed several relevant issues as follow:

7
a. How customers perceive and evaluate JKR services quality?
b. What are JKR managers‟ perceptions about the service quality?
Therefore, this study is to identify the problems and suggest remedial
action for improvement in order to ensure JKR achieved its core vision to be a
world-class service providers and Center of Excellence in Asset Management,
Project Management and Engineering.
Figure 1.1 : Result of JKR Customer Satisfaction Index (CSI) study,(2009)

8
Figure 1.2 : Result of level satisfaction, (2009)
Figure 1.3 : Based on JKR report in quality objective achievement (2012)

9
1.3 Research Questions
The study will address questions as below:
RQ1 : What is the main service dimensions (tangibility,
reliability, responsiveness, empathy and assurance)
influence more to JKR service quality?
RQ2 : What is the main attribute to reduce the gaps between
customer expectations and customer perception?
RQ3 : Does service performance positively influences customer
satisfaction?
1.4 Objectives of the study
The objectives of this study are as follows:
a) To identify the service quality dimension and their prioritization
to for improvement.
b) To investigate the attribute of JKR quality services which
influence most the gap
c) To analyze the relationship among service quality, service
performance and customer satisfaction within the context of the
JKR service

10
1.5 Significant of the study
This research helps to understand more about the quality of services of
JKR. The failure of delivering excellent service is mainly because most of the
JKR personnel do not understand the terms service quality. It is important for
them to know the dimensions of service quality as well as its attributes and their
prioritization in order to make improvement.
Previous study done by Abdul Rahim (2009) showed that reliability is
the most influential dimension in customer satisfaction and loyalty in JKR. His
study also showed that strong significant relationship between customer
expectation and customer perception and strong significant relationship of
service quality dimension on customer satisfaction. However, is that dimension
still relevant even after JKR implementing its strategic framework and enhance
the competencies and knowledge of his personnel?
JKR has released the new edition of JKR Strategic Framework 2012 –
2015, which introduced new approach of customer focus. One of the
approaches introduced is co-creative customer experience strategic themes.
These strategic themes consist of four (4) strategic ways which are :
(1) strengthen the customer involvement through partnership initiative
(2) delighted customer
(3) develop customer-centric workforce
(4) continuous the survey customer satisfaction
Meanwhile, the previous strategic frameworks only focus where the
customers become as strategic partner and increase customer involvement. This
research will review his study to determine the result of his study still relevance
after implementing new approach under new strategic framework. This study
also identifies the other signification relationship between service quality and
customer satisfaction. The research will test whether service performance has
strong relationship to the service quality and customer satisfaction. However this
11
study will not test the significant between customer expectation and customer
perception but the study will investigate the largest gap for improvement.
1.6 Scope of study and limitations
The research for this study will direct to the JKR Malaysia services in
project management and consultancy services only at the headquarters‟ level.
The study only focuses to new building projects and not including maintenance
project, rehabilitation project, conservation project and remedial work.
The study also aims the areas of service quality provided by JKR
Malaysia. Respondents will include customer who prepare the project budget
and engaged JKR directly as service provider and project implementer such as
ministries. However, this study does not involve technical quality or functional
quality of the project and also those who are indirectly involved with JKR in
implementing project such as contractors, suppliers and consultants. Due to
time constrain and ease of data collection, the project selection will cover
projects around the Klang Valley and Putrajaya only.
The outcome will reflect entirely based on JKR Malaysia‟s customer
who directly engaged to the JKR Malaysia services.

12
CHAPTER 2
LITERATURE REVIEW
2.1 Introduction
This chapter reviews the definition of service quality, model service
quality, quality service dimensions, customer satisfaction and service
performance. This chapter also explain the previous study related to service
quality.
2.2 Service Quality
There are many definitions of service quality which come from different
perspective and different authors. It is very difficult to come to a consensus
among them. However we can conclude that the service quality as something
intangible in a way that pleases the costumer and preferably gives some value to
that customer and expectation for loyalty. Service quality can be defined as the
total of the features and characteristic that bears on its ability to satisfy customer
needs. A service quality is usually rated as good service by the customer when
the service delivered meet their expectation and perception (Gronroos, 1984,
Parasuraman et al. 1985;1988). Parasuraman et al.(1985; Lewis and Mitchell
(1990) also define service quality as the differences between customers‟
expectation service and their perceived service. If the expectation is greater than
13
the service performance and perceived less than satisfactory it means that
customer dissatisfaction occurs. Forsythe; (2008), definition of service quality
may differ to different industries. For example, in construction area, he
mentioned that service delivery and production occur concurrently with the
express purpose of crafting a physical product on site. Whilst in other industry
say industrialised processes associated with production usually occur first and
service delivery comes second. It is also involves the customer perceptions of
how the work being carried out on site. It is important to raise that context of
service quality in construction is differ than many industries. Therefore, service
quality may require a new and needed dimension to construct rather that use the
establish dimension before.
2.2.1 SERVQUAL model in measuring of Service Quality
The previous studied show that SERVQUAL model used widely in
measuring service quality. The SERVQUAL model has been applied in service
and retailing organizations (Parasuraman et al, 1988; 1991) including banking
industries, credit card companies, motor repair shops and long distance
telecommunication. Service quality is a function of pre-purchase customers‟
expectation, perceived process quality and perceived output quality.
Parasuraman et al. (1988) define quality services as the gap between customers‟
expectation of service and their perception of base on their service experience.
The five (5) dimensions provide a diagnostic tool for organizations to identify
weaknesses in their service delivery systems (Parasuraman et al., 1991).
SERVQUAL has been used among building designers (Bubshait et al.(1999),
Love and Li (2000) and Love et al. (2000) and quantity surveyors (Procter and
Rwelamila,1999). Hoxley (2001) looked at whether service quality can be
considered in tender evaluations while Kim Wan Siu et al. (2001) focused on
mechanical and engineering maintenance services.
14
In project management, SERVQUAL model also widely used to
measure service quality and to determine the gaps. Furthermore, service quality
is essential during implementation the project because there are many quality
aspects to be taken care such as cost, time, quality, resources, procurement etc.
According to Duncan (p.6), project management can be define the application
of knowledge, skills, tools and technique to project activities in order to meet or
exceed stakeholder needs and expectations from a project. Meeting or
exceeding stakeholder or customer needs and expectations invariably involves
balancing competing demands among:
(1) Scope, time and quality
(2) Stakeholder with differing needs and expectations
(3) Identified requirements (need) and indentified requirement (expectations)
In project management, meeting customer expectations is also the
importance issue. Therefore, measuring the customers‟ satisfaction is crucial in
order to continuous improvement in managing project. SERVQUAL model is
one of the popular models to use to measure the service quality in project
management.
Referring to conceptualization of service quality explain by Parasuraman
et al. (1985), the original SERVQUAL instruments included 22 items for
assessing service quality based on customer‟s perception. The data collected
from the 22 attributes were then classified into five (5) dimensions, namely
tangible, reliability, responsiveness, assurance and empathy. There are a
number of ways in which SERVQUAL results can be used to help identify areas
for performance improvement.
15
2.2.2 Dimension of Service Quality
Parasuraman, Zeithaml, Berry‟s, (1985) was earlier design a conceptual
model of service quality and the first attempt is ten generic dimensions. This
was later refined to five dimensions and introduce the SERVQUAL model
(Parasuraman et al. (1988), consisting of :
(1) Reliability
The ability involves performing the promised service dependably and
accurately. It includes “Doing it right the first time” as Japan philosophy, which
is one of the most important service components for customer. Reliability also
extends to provide services when promised and maintain error-free records.
(2) Tangible
The physical facilities, equipment and appearance of personnel and
communication materials used to provide the service.
(3) Responsiveness
Always be prepared and ready to help customer with correct and certain
answers or actions and all were handled in professionalism, quick and mistake
recovery. The ability for the service provider to handled situations in a well-
timed manner is a demanding element of service quality for many customers.
(4) Assurance
Assurance refers to the knowledge and courtesy of employee and their
ability to inspire, convey trust and confidence including competence, courtesy,
credibility and security.
16
(5) Empathy
Empathy refers to the provision of caring, individualised attention the
firm provides to its customers including access, communication and
understanding the customers.
Since SERVQUAL model was introduced it becomes the most popular
model. It is also widely used in many organizations not only in marketing
industry but extended across most industries.
2.2.3 Service Quality in Malaysia Public Sector
According to Brysland & Curry (2001), the definition service quality in
public sector more complex and potentially problematic. It is related to strategic
and operational decision. Usually, it is hard to make any decision in public
sector because the nature of the government organization. Some services
provided by statue and no provision for retreat especially service related to
market economies or resources.
Usually, the difficulties in making decision for government agency due
to unclear performance target, lack of experimentation, lack of evaluation in
order to learn from experience and slow to abandon less successful programs
(Brysland, 2001). Problem in quality services is common to both the public and
private sector which are lack of vision, emphasis on short term gains and the
negative effects of performance evaluations. This has resulted in a number of
dilemmas which occur when service quality management practices derived from
the private sector are transferred to the public sector (Buckley, 2003). However,
it can be successfully applied in public sector, provided that it is appropriately
tailored and modified so as to fit the corresponding context (Chatzoglou,
Chazoudes, Vraimaki and Diamantidis, 2013). According to Kearsey and Varey
(1998), these dilemmas include;
multiple, non-financial, conflicting and ambiguous goals;
17
lack of agreement on mean-end;
environmental turbulence;
immeasurable outputs; and
effects of management intervention unknown.
There are two perspectives for the ongoing pursuit of service quality.
From the perspective of the service organization, there is a desire to survive and
compete in a global environment. From the perspective of the customer, there is
a desire for better quality services. Whereas service quality has achieved
considerable popularity across the private sector, the public sector has been
slower to take up the concept. However, service quality has now moved to the
forefront of public sector management as of the combined pressure of growing
customer expectations, an increased focus on revenue, and growing competition
between public and private sector organizations who offer identical services
(Agus et al., 2007).
Adapting quality management approaches in public sector has not been
easy (Brysland and Curry, 2001). Managers in the public sector are under
pressure to demonstrate that their services are customer focused and that
continuous performance improvement is being delivered.
2.2.4 Service Quality Dimension in Public Sector
Many studies have been done related to service quality in public sector
using SERVQUAL model and different results was found. Some result strongly
reflected actual situation but some need modification accordingly. For instance,
Brysland & Curry, (2001) conducted the study in two areas which are catering
and ground maintenance service. They used SERVQUAL model and
established five dimensions with related items under every single dimensions.
However they make some modification that they include another dimension
which is value for money because they feel this dimension need to be elicited,

18
particularly in existing public sector context, given the best value regime. The
advantage of the SERVQUAL is tested instrument can be comparatively to set a
benchmarking. This argument was support by previous study (Curry &
Brysland, 1999; Curry, 1999). The result shown with value for money has high
expectations and the gap score was higher than other five dimensions for both
areas of expectation and perception. As a conclusion, they recommend for a
further study, necessary to modify the dimensions and items to suit the service
provide and the number items applicable may vary. According to Curry (1999),
for the further study needs to tailor the SERVQUAL model to the environment it
is being applied. Not only in term of wording of expectations but also in
distribution of the items.
A study has been conducted in the public sector from different groups of
customers in United Kingdom. The result shown as following (Wisniewski,
2001):
Table 2.1: Comparative public sector SERVQUAL results in weight
dimension
Dimension Catering
service
Building
control
Development
control
Ground
maintenance
Housing
repair
Leisure
services
Library
service
Tangibles 20 12 12 25 15 23 18
Reliability 30 32 31 29 25 21 23
Responsive 20 23 22 16 22 19 22
Assurance 15 20 21 15 19 20 21
Empathy 15 14 14 15 19 17 16
From the table, reliability is the most influential dimension and critical to
public sector with the highest score. This followed by other dimensions which
are tangibles, responsiveness, assurance and empathy. In other words the group
of customers feel that each of industries is unable to perform the service as
promised dependably and accurately.
19
Currently, there are only a number of studies that were published based
on the topic of service quality in Malaysian public sector which exercised
SERVQUAL scale. Among those studies are Aliah and Tarmize (1998),
Sharifuddin (1998), Sharifah Latifah, Mokhtar and Arawati (2000) and Sharifah
Latifah (2001). Aliah and Tarmize applied SERVQUAL model consist of 25
attributes in their study. The study was conducted to estimate and forecast the
service quality provided by an income tax department in the country. To do the
survey, 300 questionnaires were distributed to the customers. What the result
shown came as no surprise. There was a significant disparity between the
customers‟ expectation with the services they get especially in the aspects of
reliability, responsiveness and empathy. These three aspects have a distinctive
difference as compared to assurance and tangibility. Based on the calculation,
the overall service quality is high. This shows that the zone of tolerance exists as
the income tax payer are willing to compromise with quality.
Other study was conducted by Sharifudin (1998) and used SERVQUAL
model to measure quality service at ten public transportation departments. 400
questionnaires were distributed to six were distributed to six state departments in
Penang, Selangor, Terengganu, Perlis, Melaka and Pahang and two department
branches at Taiping and Tapah. The result proved that customers‟ perception
was the main thing and with high vote. For that reason, this showed that the
customers‟ expectation were not achievable by the service provider.
Sharifah Latifah et al. (2000) used SERVQUAL model in her study to
resolve customer satisfaction as a result of TQM implementation in six
ministries. From 290 respondents out of 330 questionnaires distributed, the
result displays that responsiveness is the second lowest aspect after empathy
which indicates the needs for a significant change.
Later in year 2001, Sharifah Latifah has done another study to survey the
internal and external customer satisfaction in six ministries. Total 523
questionnaires were distributed to professional group and support group
meanwhile 300 questionnaires were distributed to middle manager and head of

20
divisions or units. 289 respondents form were collected. From the analysis, she
extracted three dimensions which have gap. The first factor is tangibles; the
second factor is the combination of reliability, responsiveness and assurance
while third factor is empathy. The result revealed that even though the
employees are highly satisfied with their organization, they are not able to
transform their satisfaction to deliver quality service to the customers.
Furthermore, winning quality award does not guarantee that external customers
will be fully satisfied with their service provision (IIhamie, 2009).
Other studies were conducted by Noor Hazilah and Phang, Firdaus (2005,
2006), Arawati, Baker and Kandampully (2007) and Wan Zahari, Maziah and
Newell (2008) did not used SERVQUAL model in measuring service quality in
Malaysia public hospitals, higher educations institutions and public department.
Arawati et al, (2007) used SERVPERF in determining the relationship between
the service quality, service performance and customer satisfaction in 86
Malaysia public departments. From nine to ten service quality dimension
proposed by Parasuraman et al, (1985), they only managed to extract three
dimensions. They label the three dimensions as responsiveness, access and
credibility. They also found out that all these three dimensions are related to
service performance and customer satisfaction.
Differently with Wan Zahari et al (2008), he developed a new model,
they named as FM-SERVQUAL in measuring facilities management service
provide by a local authority in Johor. The model adopted from Carman, (1990)
where the expectation and perception were combined into every items of the
dimension. The finding of the study revealed that five elements in technology
and ICT and six elements of property were identified to below decrease the
service quality level.
21
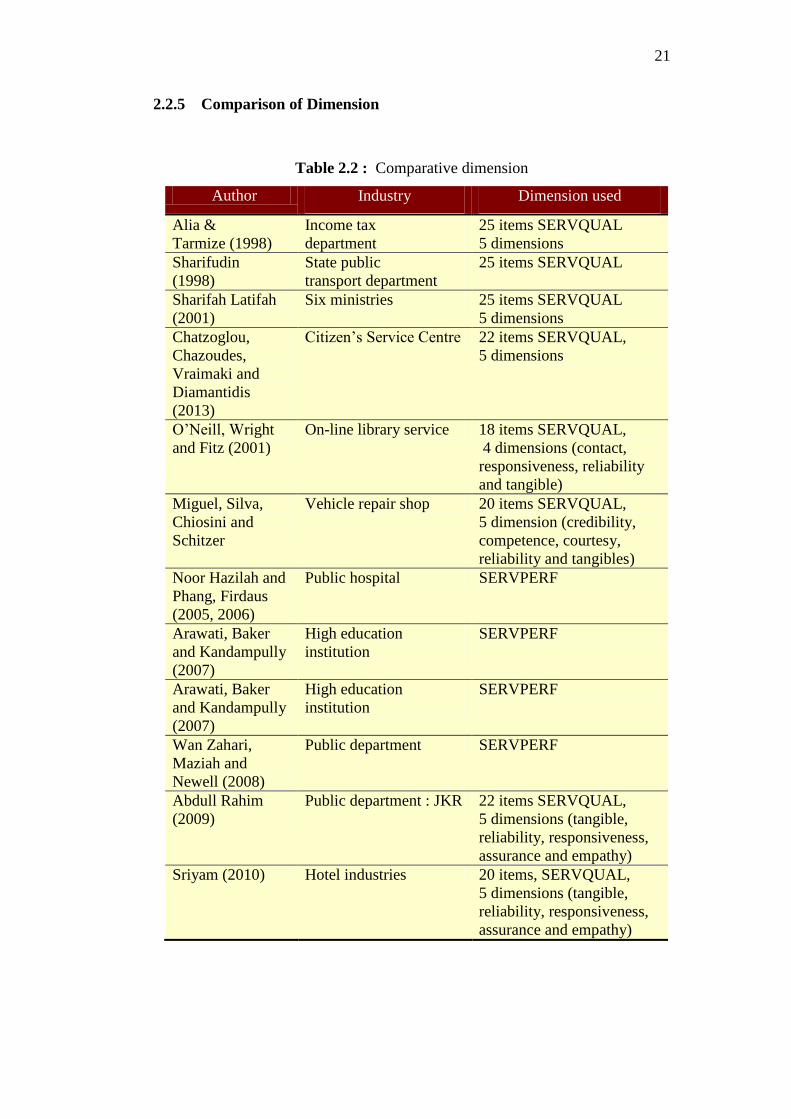
2.2.5 Comparison of Dimension
Table 2.2 : Comparative dimension
Author Industry Dimension used
Alia &
Tarmize (1998)
Income tax
department
25 items SERVQUAL
5 dimensions
Sharifudin
(1998)
State public
transport department
25 items SERVQUAL
Sharifah Latifah
(2001)
Six ministries 25 items SERVQUAL
5 dimensions
Chatzoglou,
Chazoudes,
Vraimaki and
Diamantidis
(2013)
Citizen‟s Service Centre 22 items SERVQUAL,
5 dimensions
O‟Neill, Wright
and Fitz (2001)
On-line library service 18 items SERVQUAL,
4 dimensions (contact,
responsiveness, reliability
and tangible)
Miguel, Silva,
Chiosini and
Schitzer
Vehicle repair shop 20 items SERVQUAL,
5 dimension (credibility,
competence, courtesy,
reliability and tangibles)
Noor Hazilah and
Phang, Firdaus
(2005, 2006)
Public hospital SERVPERF
Arawati, Baker
and Kandampully
(2007)
High education
institution
SERVPERF
Arawati, Baker
and Kandampully
(2007)
High education
institution
SERVPERF
Wan Zahari,
Maziah and
Newell (2008)
Public department SERVPERF
Abdull Rahim
(2009)
Public department : JKR 22 items SERVQUAL,
5 dimensions (tangible,
reliability, responsiveness,
assurance and empathy)
Sriyam (2010) Hotel industries 20 items, SERVQUAL,
5 dimensions (tangible,
reliability, responsiveness,
assurance and empathy)
22
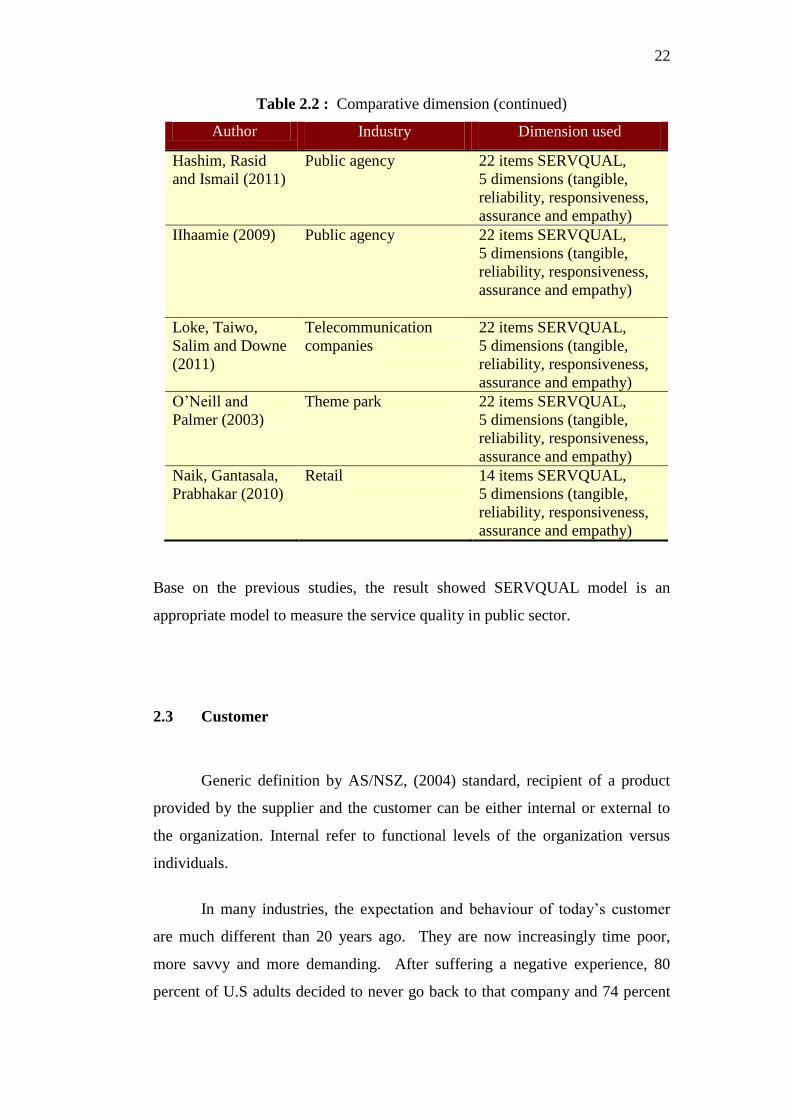
Table 2.2 : Comparative dimension (continued)
Author Industry Dimension used
Hashim, Rasid
and Ismail (2011)
Public agency 22 items SERVQUAL,
5 dimensions (tangible,
reliability, responsiveness,
assurance and empathy)
IIhaamie (2009) Public agency 22 items SERVQUAL,
5 dimensions (tangible,
reliability, responsiveness,
assurance and empathy)
Loke, Taiwo,
Salim and Downe
(2011)
Telecommunication
companies
22 items SERVQUAL,
5 dimensions (tangible,
reliability, responsiveness,
assurance and empathy)
O‟Neill and
Palmer (2003)
Theme park 22 items SERVQUAL,
5 dimensions (tangible,
reliability, responsiveness,
assurance and empathy)
Naik, Gantasala,
Prabhakar (2010)
Retail 14 items SERVQUAL,
5 dimensions (tangible,
reliability, responsiveness,
assurance and empathy)
Base on the previous studies, the result showed SERVQUAL model is an
appropriate model to measure the service quality in public sector.
2.3 Customer
Generic definition by AS/NSZ, (2004) standard, recipient of a product
provided by the supplier and the customer can be either internal or external to
the organization. Internal refer to functional levels of the organization versus
individuals.
In many industries, the expectation and behaviour of today‟s customer
are much different than 20 years ago. They are now increasingly time poor,
more savvy and more demanding. After suffering a negative experience, 80
percent of U.S adults decided to never go back to that company and 74 percent
23
registered a complaint or told others about problem they were facing (Right
Now Technologies, 2007)
2.3.1 Customer Satisfaction
Customer satisfaction, a term frequently used in marketing, is a measure
of how products and services supply by a company meet or surpass customer
expectation. There are many ways to define customer satisfaction and it is a
complex process (Besterfield, 1994; Kanji and Moura, 2002; Fecikova, 2004).
Customer satisfaction is the extent to which a product‟s perceived performance
matches a buyer‟s expectations (Kotler, 1998). It is depends on the product‟s
perceived performance in delivering value relative to buyer‟s and customer‟s
expectation. Customer satisfaction related to feeling of people whether happy or
unhappy after compare the product or service that they received to what they
expect (Palmer et.al, 1991). If the product‟s performance fails short of
expectation, the buyer is dissatisfied. If the performance matches or exceeds
expectations, the buyer is satisfied or delighted.
Today‟s world demands changes tremendously. Adapting to today‟s
economic world with eye to the future requires an organization to be totally
responsive to customers. Continuous improvement of processes, people, and
products aimed at customer satisfaction is essential. The “if it's not broken,
don't fix it” attitude does not promote the critical thinking necessary for growth.
Continuous improvement is the only way to survive.
According to Diaz and Ruiz (2002), the definition of customer
satisfaction is `an effective reaction to an accident during the dispensing of a
service‟. Complicating the level of satisfaction mean that customers may
perceive a virtually identical service encounter in a variety of different ways.
24
In this circumstance, it is very crucial to understand the customer‟s
behavioral. Organization definitely can‟t sustain the product or services without
any information about customer‟s behavioral and needs. Therefore, customer
satisfaction needs to be measured to obtain the level of expectation. One of the
approaches to measure customer satisfaction is via measurement on level of
importance and expectation toward service provide by organization (Report CSI
JKR, 2009).
2.3.2 Customer Expectation and Perception
Customer normally will look forward the service that they should
received when dealing delivery process experience. The totality of all those
needs and preferences, both tangible and intangibles, which are customer brings
to bear on the supplier services or goods. Needs and preferences are conceived
by the customer and translated into a personalised list which associated with the
proposed transaction. Expectations are really not well defined and may evolve as
the transaction progresses.
The customer will expect to acquire from a service provider and can be
define as customer expectation. They feel that service provider should offer
more than what would offer (Hsieh & Yuan, 2010). According to Parasuraman
et al. (1991), understanding customer expectation of a service played an
important role for delivering satisfactory services. In AS 3906 – 2004, quality of
services shows the guide to customer expectation. In many industries, the
expectation and behaviour of today‟s customer are much different than 20 years
ago. They are an increasing number of poor times, savvy and more demanding.
Previous researcher had presented that how customer assess the performance of
service provider based on a single level of expectation standard, which mean
refer to should offer only. However past researcher had extended the conceptual
model of expectation by pinpointing the critical element within customer
expectation (Hsieh & Yuan, 2010).
25
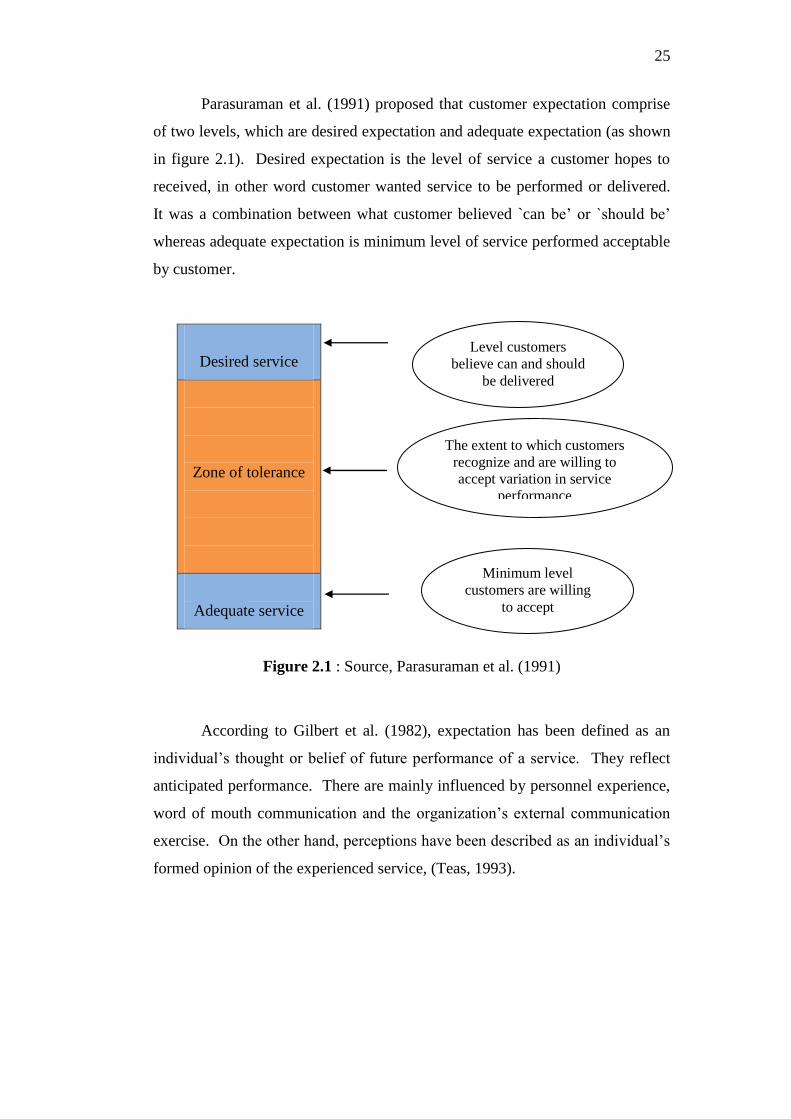
Parasuraman et al. (1991) proposed that customer expectation comprise
of two levels, which are desired expectation and adequate expectation (as shown
in figure 2.1). Desired expectation is the level of service a customer hopes to
received, in other word customer wanted service to be performed or delivered.
It was a combination between what customer believed `can be‟ or `should be‟
whereas adequate expectation is minimum level of service performed acceptable
by customer.
Desired service
Zone of tolerance
Adequate service
Figure 2.1 : Source, Parasuraman et al. (1991)
According to Gilbert et al. (1982), expectation has been defined as an
individual‟s thought or belief of future performance of a service. They reflect
anticipated performance. There are mainly influenced by personnel experience,
word of mouth communication and the organization‟s external communication
exercise. On the other hand, perceptions have been described as an individual‟s
formed opinion of the experienced service, (Teas, 1993).
Level customers
believe can and should
be delivered
The extent to which customers
recognize and are willing to
accept variation in service
performance
Minimum level
customers are willing
to accept
26
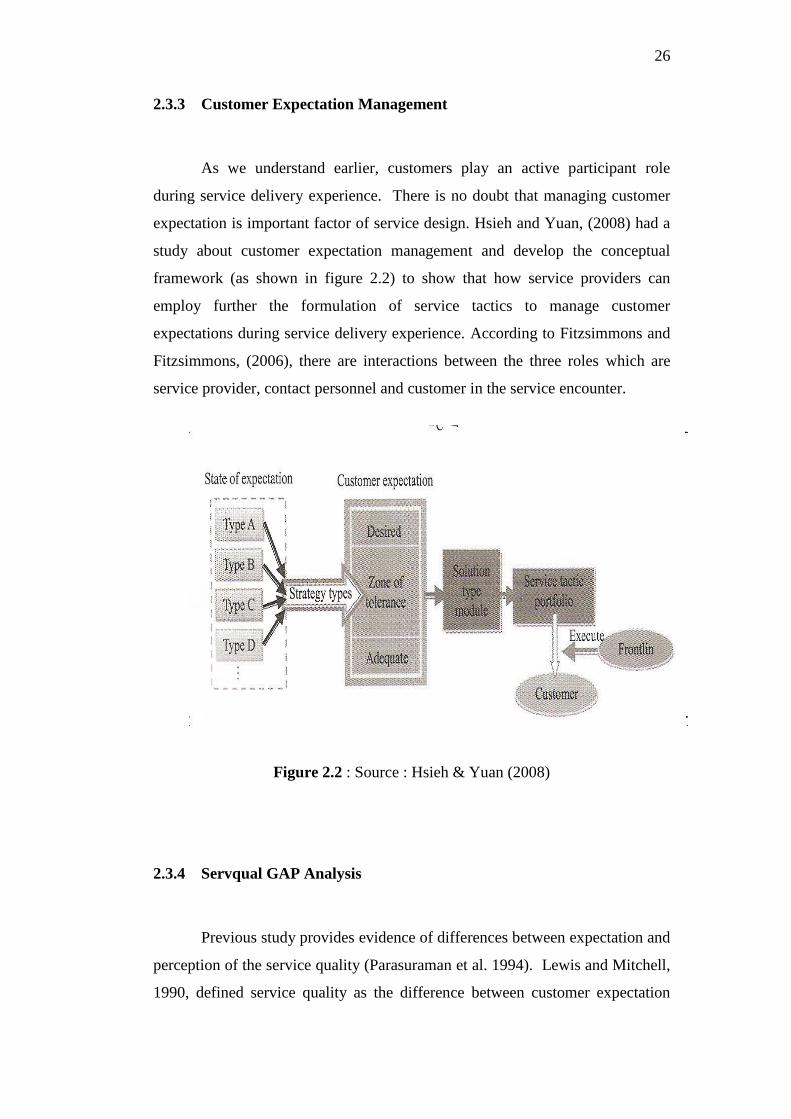
2.3.3 Customer Expectation Management
As we understand earlier, customers play an active participant role
during service delivery experience. There is no doubt that managing customer
expectation is important factor of service design. Hsieh and Yuan, (2008) had a
study about customer expectation management and develop the conceptual
framework (as shown in figure 2.2) to show that how service providers can
employ further the formulation of service tactics to manage customer
expectations during service delivery experience. According to Fitzsimmons and
Fitzsimmons, (2006), there are interactions between the three roles which are
service provider, contact personnel and customer in the service encounter.
Figure 2.2 : Source : Hsieh & Yuan (2008)
2.3.4 Servqual GAP Analysis
Previous study provides evidence of differences between expectation and
perception of the service quality (Parasuraman et al. 1994). Lewis and Mitchell,
1990, defined service quality as the difference between customer expectation

27
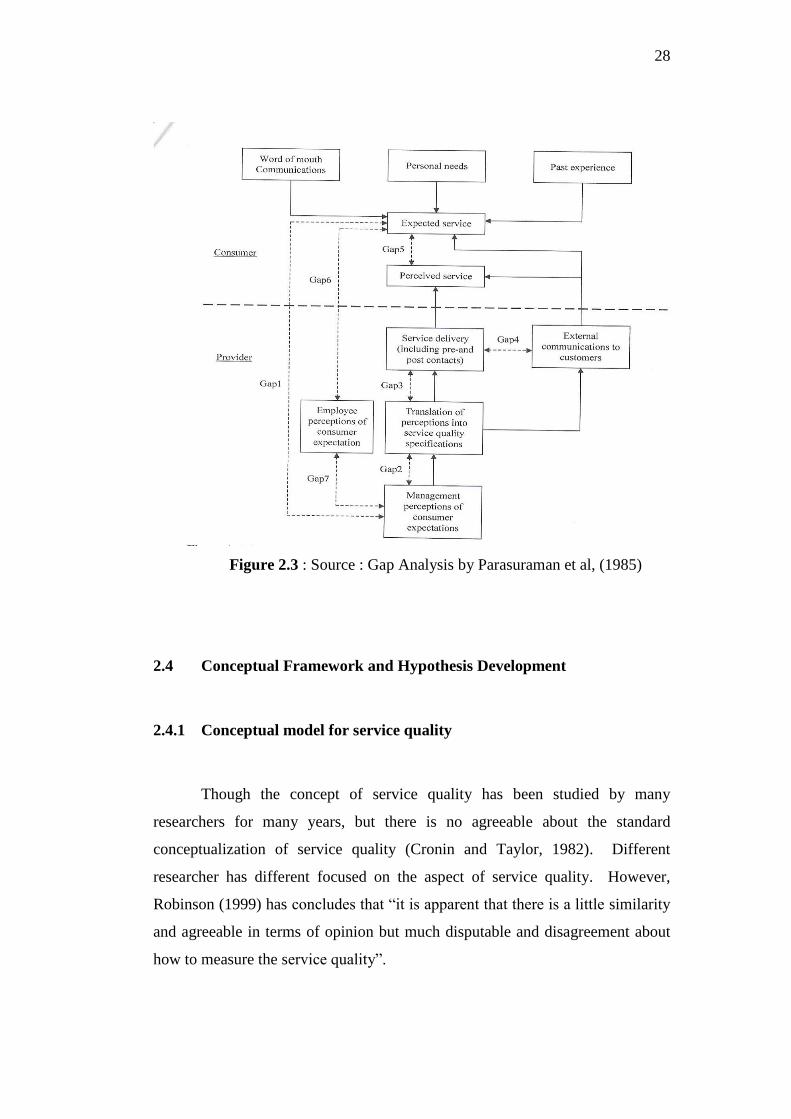
and customer perception of the service. Parasuraman et al. (1985) proposed that
service quality is a function of the differences between expectation and
performance along the quality dimensions. They developed a service quality
model (figure 2.1) base gap analysis. The various gap visualised in the model
are :
(1) Gap 1 : Difference between customers‟ expectation and
management‟s perceptions of those expectation, i.e not
knowing what customer expect
(2) Gap 2 : Difference between management‟s perceptions of
customers‟ expectation and service quality specification,
i.e improper service quality standards
(3) Gap 3 : Difference between service quality specification and
service actually delivered, i .e the service performance
gap
(4) Gap 4 : Difference between service delivery and external
communications to consumers about service delivery, i.e
whether promises match deliver?
(5) Gap 5 : Different between perceived service and expectation
service, i.e service quality gap.
The main usage of gap scores is to enable the service manager to access
current service quality and quantify gaps that existed. By using the service
quality dimension, will give better understanding about the customers‟
expectations either high or low and assess of where there may be relatively large
gaps. The result can use to focus on particular problem areas. It is also be used
to provide an overall understanding of the relative importance from customer‟s
perspective of the five service quality dimensions in terms of an individual
service and across different service by using dimension weight, (Wisniewski,
2001). Gap analysis is useful to analyze the customers who have exactly similar
needs. However, for those services that have different customer segments, it is
useful for comparison. In these surveys, the customer would respond to a series
of questions base on five (5) key of service dimensions which are reliability,
responsiveness, assurance, tangible and empathy.
28
Figure 2.3 : Source : Gap Analysis by Parasuraman et al, (1985)
2.4 Conceptual Framework and Hypothesis Development
2.4.1 Conceptual model for service quality
Though the concept of service quality has been studied by many
researchers for many years, but there is no agreeable about the standard
conceptualization of service quality (Cronin and Taylor, 1982). Different
researcher has different focused on the aspect of service quality. However,
Robinson (1999) has concludes that “it is apparent that there is a little similarity
and agreeable in terms of opinion but much disputable and disagreement about
how to measure the service quality”.

29
Based on all the arguments, many researchers were agreed and accepted
that service quality is a comparison between expectations and perceptions of
performance in delivery of the service. Perceived quality is the consumer‟s
judgment about an entity‟s overall excellence or superiority (Zeithaml, 1987).
It is clearly differs from objective quality as define by other researcher for
instance Garvin (1983).
According to Parasuraman et al, (1988), service quality represents a
customer‟s assessment of the overall level of service offered by an organization
and Bitner et al, 1990; Johnston, 1995 said this assessment is often based on
perceptions formulated during service encounter. Almost the service
dimensions stated in the conceptual model relate to the human-interaction
elements of service delivery regardless the technology. Thus, service quality as
a product of service dimensions comprised of employee-related behaviors and
organizational practices, facilities provided, have the capacity to influence
service performance and customer satisfaction.
This study is to identify JKR customer expectation in project delivery
service. The purpose is to analyze the relationships among service quality,
service performance, and customer satisfaction within the context of the public
sector and JKR as a case study. In order to measure the service quality, the
most important thing is to identify the dimensions that shall be used in
SERVQUAL model in order to get the precise result. Based on analysis on
certain dimension used by previous studies, a conceptual framework was
designed in order to initiate the study. The proposed conceptual model (as
shown in Figure 2.4) is based on four (4) existing service factors, each of which
has the largest group body of research. The service factors are:
(1) service quality
(2) service quality dimensions
(3) customer satisfaction
(4) service performance

30
Beside to improve levels of customer satisfaction (Parasuraman et al,
1991), Zeithaml and itner, (2000) revealed that service quality has also been
shown to provide benefits in terms of differentiation. Meanwhile, Buzzell and
Gale, (1987) agreed in market share, profitability and developing strategy
(Gronroos, 2000). The proposed model use is adopted from the original
SERVQUAL model developed by Parasuraman et al, (1988) and Agus et al,
(2007). The SERVQUAL model is accepted as a standard model for assessing
of various dimensions in service quality as said by Buttle, (1994), and based on
the concept of service-quality “gaps” by Parasuraman et al, (1985, 1988).
Adopted from previous study, five (5) original service dimensions
identified by Parasuraman et al. (1988) were used. The result showed from
previous study these dimensions are appropriate and reliable and can measure
service quality precisely in public sector. However the items shall be modified
according to the environment and practicality of the department and type of
service provided. For the purpose of this study, in measuring service quality in
JKR, the similar dimensions will be used. The five dimensions are tangible,
reliability, responsiveness, assurance and empathy. The researchers agree that
not all service-quality determinants have the same finding and effect on
customer quality perceptions and satisfaction. According to Agus et al., (2007),
it can be modified accordingly to suit the organization profile especially in terms
of items to assess.
The attributes for this study will be modified according to the role of
JKR during project implementation. JKR is involved from early phase of
project until completion and hand over to the customer. The phases involve in
the project including planning, design, procurement, execution and closing.
Every phases were involved all those five dimensions. All five dimensions in
SERVQUAL model shall be cross reference to these project phases then items
under phases within the dimension shall be measure. The items has been
designed based on six quality dimensions where related and influent most in
project phases. The items are time, cost, quality, safety, attitude and
communication. These items also have some measurement under their smaller

31
items. By using the phases of the project will drive the customer more
understanding and familiar on what measurement to be evaluate. The propose
respondents for this study are from technical background so there are familiar
enough about the project life cycle except for managerial level.
Figure 2.4 : Conceptual Model for SERVQUAL for study
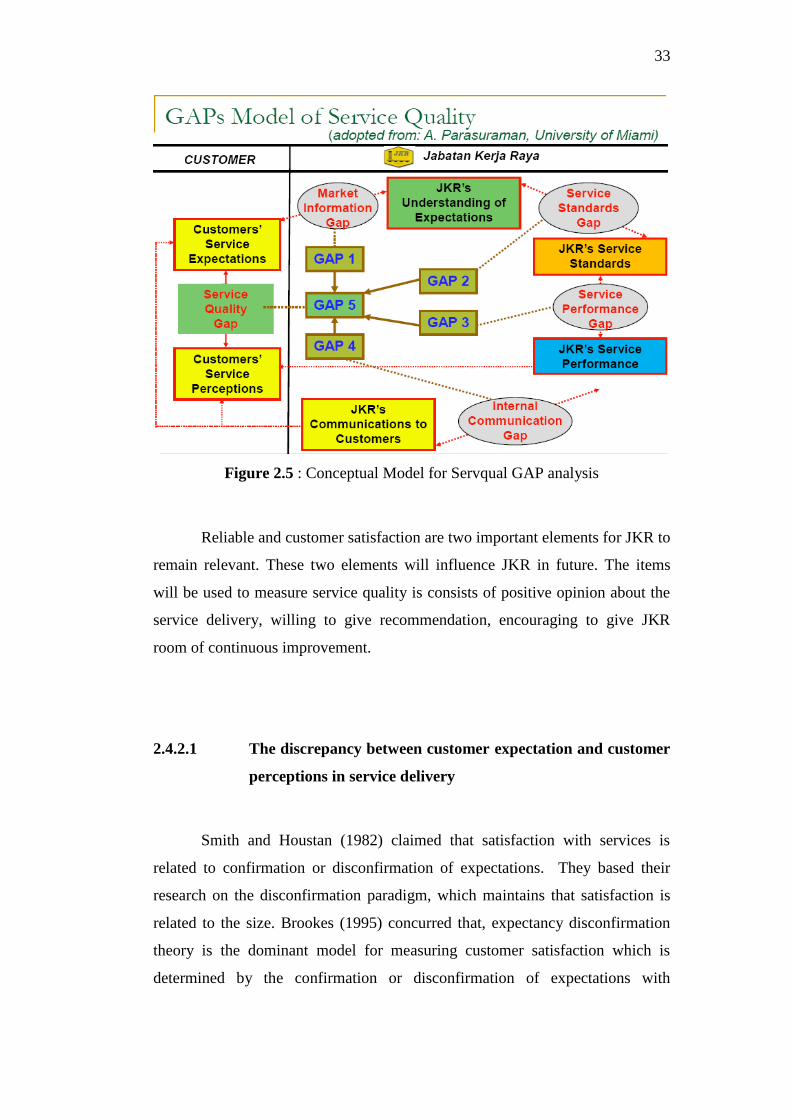
2.4.2 Conceptual model SERVQUAL Gap analysis
The conceptual model presented for this study is based on service
concept relationship which is widely recognized within the private sector.
Therefore, the aim of this study is to test these relationships with the context of
the JKR particularly and to public sector as general. However some
modification has been made to the model to suit the policies, requirements, job
descriptions, roles and responsibilities of the department.
Tangible
Reliability
Responsiveness
Assurance
Empathy
Service
Quality
Service
Performance
Customer
Satisfaction
I am satisfied with the
services provide by
your employees
Project life cycle
Planning/Design/procurement/
Execution/Closing
I am satisfied with the
services provide by
your department
Over the past 3 years,
the time taken to get
feedback and
information needed
has shortened
Over the past 3 years,
services given by
employees to
customers have
improved
H2
H1
H3
32
For the purpose of the evaluation of the model, evaluation will be
making perfectly base on five (5) service dimensions which are introduced by
Parasuraman (1988) and tied up with dimensions which spell out in the
conceptual model. For gap 1, market information gap refer to tangible, where
related extensiveness of the information provided by JKR in the data base. Gap
2, service standards gap refer to reliability, where related to standardization of
procedure provided and ability to performing the promised service dependably
and accurately and conforming the procedures with zero defect. It includes
“Doing it right the first time” as Japan philosophy, which is one of the most
important service components for customer. Gap 3, service performance gap,
even though service performance here is similar to the service performance at
conceptual model for service quality, but here refer to measurement of
knowledge and courtesy of employee and their ability to inspire, convey trust
and confidence including competence, courtesy, credibility and security and
professionalism of the JKR‟s officer. In the other word refer to assurance
dimension. Whilst service performance in the concept model above refer to
evaluation by customers‟ particularly base on the quality and speed of service
delivery by department. Meanwhile, gap 4, internal communication gap refer to
responsiveness, where related to willingness to help customer and provide a
prompt service to customer such as quick respond to any issues raise by
customer, quick service, professionalism in handling and recovering from
mistakes especially professional communication. Lastly gap 5, where
combination of the four (4) gaps above to become gaps which refer to empathy
where these dimensions very crucial to ensure satisfaction and loyalty of the
customer. This gap related to the provision of caring, individualised attention
the firm provides to its customers including access, communication and
understanding the customers. Hence, in order to find the precise result the
appropriate model was designed adopted from Parasuraman (1988) (as shown in
figure 2.5).
33
Figure 2.5 : Conceptual Model for Servqual GAP analysis
Reliable and customer satisfaction are two important elements for JKR to
remain relevant. These two elements will influence JKR in future. The items
will be used to measure service quality is consists of positive opinion about the
service delivery, willing to give recommendation, encouraging to give JKR
room of continuous improvement.
2.4.2.1 The discrepancy between customer expectation and customer
perceptions in service delivery
Smith and Houstan (1982) claimed that satisfaction with services is
related to confirmation or disconfirmation of expectations. They based their
research on the disconfirmation paradigm, which maintains that satisfaction is
related to the size. Brookes (1995) concurred that, expectancy disconfirmation
theory is the dominant model for measuring customer satisfaction which is
determined by the confirmation or disconfirmation of expectations with
34
perceptions of the perceived performance on various service items (Danaher and
Haddrell, 1996).
Previous studies also provide evidence of differences between
expectation and perceptions of service quality (Parasuraman et al., 1994).
Rahman A. (2007) and Hashim et. Al (2009), also showed the result to prove
that there are relationship between customer expectation and perception. In this
relationship brought the scenario where different value of expectation and
perception show the gap. The gap values represent the area need to be
improved. The largest gap in negative value shows the criticalness of
requirement for improvement.
2.5 Hypothesis development
The purpose of this study was to obtain a better understanding among
service quality, customer satisfaction and service performance. The hypothesis
development of this study was derived from previous studies and literature and
design according to the service quality provided by JKR. There are three (3)
hypotheses to be tested in this study related to service quality and conjunction to
the conceptual model for SERVQUAL (as shown in figure 2.4):
H1 : That service quality positively influences customer satisfaction.
H2 : That service quality positively influences service performance
H3 : That service performance positively influences customer
satisfaction
2.5.1 The relationship between service quality and customer satisfaction
Satisfaction can be considered at two levels: the transaction or encounter
level and overall satisfaction (Bitner and Hubbert, 1994). Initially, Cronin and

35
Taylor (1992) hypothesized that satisfaction is an antecedent of service quality.
However, their research with a multi-industry sample showed, in a LISREL
analysis, an opposite relationship. Quality appears to be only one of the service
factors contributing to the customer's satisfaction judgments‟ (Cronin and
Taylor, 1992). Spreng and Mackoy (1996), who test a modified version of a
model proposed by Oliver (1993), that sought to integrate the satisfaction and
service quality literature. It is also provide support for service quality as being
and forerunner to satisfaction. More recently, this relationship has also been
confirmed from a study in a health-care setting by Deruyter et al. (1997), who
also show that service quality should be treated as an forerunner of service
satisfaction.
Iacobucci et al. (1995) conclude that the key difference between service
quality and customer satisfaction is that quality relates to managerial delivery of
the service while satisfaction reflects customers' experiences with that service.
They argue that quality improvements that are not based on customer needs will
not lead to improved customer satisfaction. Similar to Dick and Basu (1994),
Anderson and Fornell (1994), Iacobucci et al. (1995), and Rust and Oliver
(1994), “quality is one dimension on which satisfaction is based” and they view
service quality as an antecedent to satisfaction. Bolton and Drew (1994) point
out, customer satisfaction depends on preexisting or contemporaneous attitudes
about the service quality.'' Bitner et al. (1994) and Anderson et al. (1994) also
point to this link by suggesting that improved service quality will result in a
satisfied customer and suggest that to a large extent this relationship is intuitive.
Therefore, my first hypothesis is as follows:
H1 : That service quality positively influences customer satisfaction
2.5.2 The relationship between service quality and service performance
This relationship will show to what extend the every each of dimensions
under service quality will effect the delivery of service performance. The
36
research will find the influences of each of dimensions to service performance
and which dimensions will effect more to the service performance which is
required for more attention to improve service performance delivery. Therefore,
my second hypothesis is as follows:
H2 : That service quality positively influences service performance
2.5.3 The Relationship between Service Performance and Customer
Satisfaction
In accordance with the conceptual model show in figure 2.4, customer
satisfaction was measured in terms of department, employees and hardware and
software. Whereas service performance measure in terms of time taken to obtain
feedback, provide information and resolve customer problem and quality of the
service provided by employee. Therefore, my third hypothesis is as follows:
H3 : That service performance positively influences customer
satisfaction
2.6 Organization performance JKR
The need for change has driven initiative in public sector as pressure to
improve performance. According Curry, 2001, based on report KPMG (1997),
there are four factors influenced the change in public sector which are
technology, customer expectations, economy and organizational pressure.
Adapting the quality management is not easy in public sector. Drucker (1980)
identified several steps to be taken such as :
(1) clear performance target
(2) increase of experimental attitude
(3) learning from experience through feedback or evaluation
(4) abandon unnecessary programs
37
The organization will be more effective, efficient, economic and
contribute to quality as a whole when organization more focus to these four (4)
key areas which stated in Audit Commission 1993, (Brysland & Curry, 2001) :
(1) Quality communication
(2) Quality of specification
(3) Quality of delivery
(4) Quality of people and system
Total Quality Management (TQM) programme in place are more
customer-focused in their project management practices than those organizations
with no TQM programme. Bryde & Robinson (2007) had done the study to
explore the influent of the TQM programme on the level of focus in project
management which refer to customer focused. Using Cronbach‟s alpha test, the
result showed companies with TQM programme are more likely to be customer-
focused in their practise for managing project. They made conclusion,
organization might be able to use elements of a TQM programme to facilitate
the introduction of the customer-focused in project management. For instance,
establishing best-practise from one the findings of Taylor and Wright‟s study, if
an organization wished to move towards a `partnership-type‟ approach project
management that typical requires a high level of customer-focus (Winch et al.,
1998).
2.6.1 JKR Vision
JKR vision is to become a world-class service provider and centre of
excellence in asset management, project management and engineering services
for the development of nation‟s infrastructure through creative and innovative
human capital and state-of-the-art technology.
38
2.6.2 Role of JKR in Achieving National Mission (Vision 2020)
JKR role is to develop and deliver the national infrastructure in each of
the five year Malaysia Planning in concurrent with National Mission (Vision
2020) agenda. As a technical advisor to the Malaysian government which
contribute directly in nation-building through (Annual report, 2012):
Helping their clients deliver policy outcomes and services through
working with them as strategic partner
Standardizing their processes and systems to deliver consistent outcomes
Providing effective and innovative asset and project management
Strengthening their existing engineering competencies
Developing their human capital and new competencies
Upholding integrity in delivering their services
Build harmonious relationships with the community
Taking good care of the environment in delivering their services
2.6.3 National Vision - Vision 2020
Wawasan 2020 or Vision 2020 is a Malaysian ideal introduced by the
former prime minister of Malaysia, Tun Dr. Mahathir Mohammad during the
tabling of the Sixth Malaysia Plan in 1991. The objective of the vision is to shift
the current nation into developed country by 2020. The target is to develop the
country in terms of national unity and social cohesion, economy, social justice,
political stability, system of government, quality of life, social and spiritual
values, national pride and confidence. By the year 2020, Malaysia should be a
united nation, with a confident Malaysian society, infused by strong moral and
ethical values, living in a society that is democratic, liberal and tolerant, caring,
economically just and equitable, progressive and prosperous and in full
possession of an economy that is competitive, dynamic, robust and resilient.
39
Under the development of the vision, Malaysia has identified nine
central strategic challenges that will be confronted us from the moment of our
birth as an independent nation which are:
(1) establishing a united Malaysian nation with a sense of common and
shared destiny. This must be a nation at peace with itself, territorially
and ethnically integrated, living in harmony and full and fair partnership,
made up of one 'Bangsa Malaysia' with political loyalty and dedication to
the nation.
(2) creating a psychologically liberated, secure, and developed Malaysian
Society with faith and confidence in itself, justifiably proud of what it is,
of what it has accomplished, robust enough to face all manner of
adversity. This Malaysian Society must be distinguished by the pursuit
of excellence, fully aware of all its potentials, psychologically
subservient to none, and respected by the peoples of other nations.
(3) fostering and developing a mature democratic society, practicing a form
of mature consensual, community-oriented Malaysian democracy that
can be a model for many developing countries.
(4) establishing a fully moral and ethical society, whose citizens are strong
in religious and spiritual values and imbued with the highest of ethical
standards.
(5) establishing a matured, liberal and tolerant society in which Malaysians
of all colours and creeds are free to practice and profess their customs,
cultures and religious beliefs and yet feeling that they belong to one
nation.
(6) establishing a scientific and progressive society, a society that is
innovative and forward-looking, and one of that is not only a consumer
of technology but also a contributor to the scientific and technological
civilization of the future.
40
(7) establishing a fully caring society and a caring culture, a social system in
which society will come before self, in which the welfare of the people
will revolve not around the state or the individual but around a strong
and resilient family system.
(8) ensuring an economically just society. This is a society in which there is
a fair and equitable distribution of the wealth of the nation, in which
there is full partnership in economic progress. Such a society cannot be
in place so long as there is the identification of race with economic
function, and the identification of economic backwardness with race.
(9) establishing a prosperous society, with an economy that is fully
competitive, dynamic, robust and resilient.
2.6.4 10th Malaysia Plan
Under the 10th Malaysian Plan, current government has identified five
thrusts with specific programmed to deliver the outcomes needed for the
achievement of Vision 2020:
To move the economy up the value chain
To raise the capacity for knowledge and innovation and nurture first
class mentality
To address persistent socio-economic inequalities constructively and
productively
To improve the standard and sustainability of quality life
To strengthen the institutional and implementation capacity
Therefore, as one of the government agencies that have been given
mandate to develop national infrastructure, JKR Malaysia involved directly in
implementing and delivering the above outcomes.

41
2.6.5 Strategic service quality improvement
In order to successfully implementing these vision 2020 programs
especially 10th Malaysia Plan, JKR Malaysia under the new Director General
Dato‟ Seri Ir. Hj. Mohd. Noor Bin Yaacob has roll out the second planned, JKR
strategic Framework 2012 – 2015 as continuity from first strategic framework
document planned for 2007-2010. The main purpose of rolling out this strategic
framework is to maneuver the department into the right direction in executing
their role thus helping the government to successfully implementing vision
2020. The main focus of this strategic framework is to meet customer‟s
satisfaction by:
Understanding and being sensitive to their needs
Being friendly and helpful to them
Listening attentively to what they say
Being responsive to changes in their needs
By meeting the customer expectation, JKR Malaysia is hoping to be, a
performance oriented organization focusing on achieving customer desired
outcomes.
JKR exist to work as strategic partner with our clients to deliver
outcomes of government projects and policies, be the leader in asset
management and engineering excellence for the nation and deliver the nation‟s
infrastructure. In order to JKR to stay relevant in their role, JKR have to deliver
the good service. These days, several ministries and department, are not keen to
engage JKR service in implementation of their projects. The strong reasons that
they used is JKR can‟t deliver project on time as promised, poor in quality and
incompetence personnel. JKR as a leading service provider believed that they
can improve in all aspect. JKR has developed strategic objectives to emphasis
on customer focus and customer loyalty under theme 2, Strategic Framework
2012-2015.
42
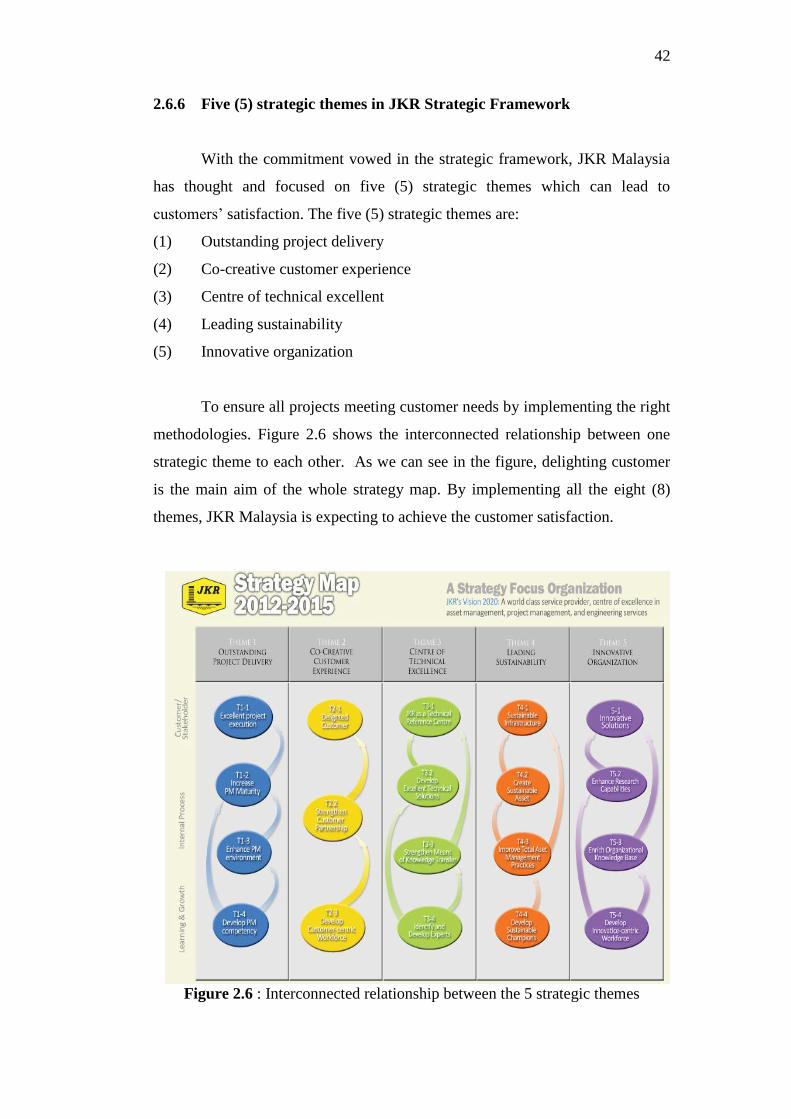
2.6.6 Five (5) strategic themes in JKR Strategic Framework
With the commitment vowed in the strategic framework, JKR Malaysia
has thought and focused on five (5) strategic themes which can lead to
customers‟ satisfaction. The five (5) strategic themes are:
(1) Outstanding project delivery
(2) Co-creative customer experience
(3) Centre of technical excellent
(4) Leading sustainability
(5) Innovative organization
To ensure all projects meeting customer needs by implementing the right
methodologies. Figure 2.6 shows the interconnected relationship between one
strategic theme to each other. As we can see in the figure, delighting customer
is the main aim of the whole strategy map. By implementing all the eight (8)
themes, JKR Malaysia is expecting to achieve the customer satisfaction.
Figure 2.6 : Interconnected relationship between the 5 strategic themes
43
2.6.7 Meeting customer satisfaction approach
To ensure JKR keeping the quality first and sustain, JKR has develop the
system called Sistem Pengurusan Kualiti (SPK). All the officers must use the
system when managing the project to ensure standardization. The system
becomes a tool for evaluating the JKR performance based on project delivery
while for customer satisfaction, evaluated based on customer satisfaction index.
To have continuous improvement based on customer focus, JKR has programme
two types of survey to be conducted in every two years. The surveys that they
conducted are:
(1) Customer (clients) satisfaction survey to identify the level of customer
satisfaction
(2) Employee satisfaction survey where JKR created awareness on Customer
Service Improvement Plan (CSIP) among our staff with the introduction
of CSIP in JKR Senior Officers Conference in May 2007
JKR also established JKR one call centre for customer and the public for
continuous improvement and this centre is running 24 hours per day. Moreover,
JKR also created the room for public complaint in their website. The complaints
will be entertained with three working days as per Customer Charter. For
enhance the personnel competencies, JKR has include customer service as one
of the subjects covered in induction course for new staff intakes starting in 2007.
Furthermore, JKR also made and introduced the importance of soft skills for
project managers in 2006.
2.6.8 JKR service performance
Recently JKR has conducted survey for both target participants to
evaluate the performance of JKR based on project delivered for year 2011.
Based on the survey, the result shows that the Customer Objectives
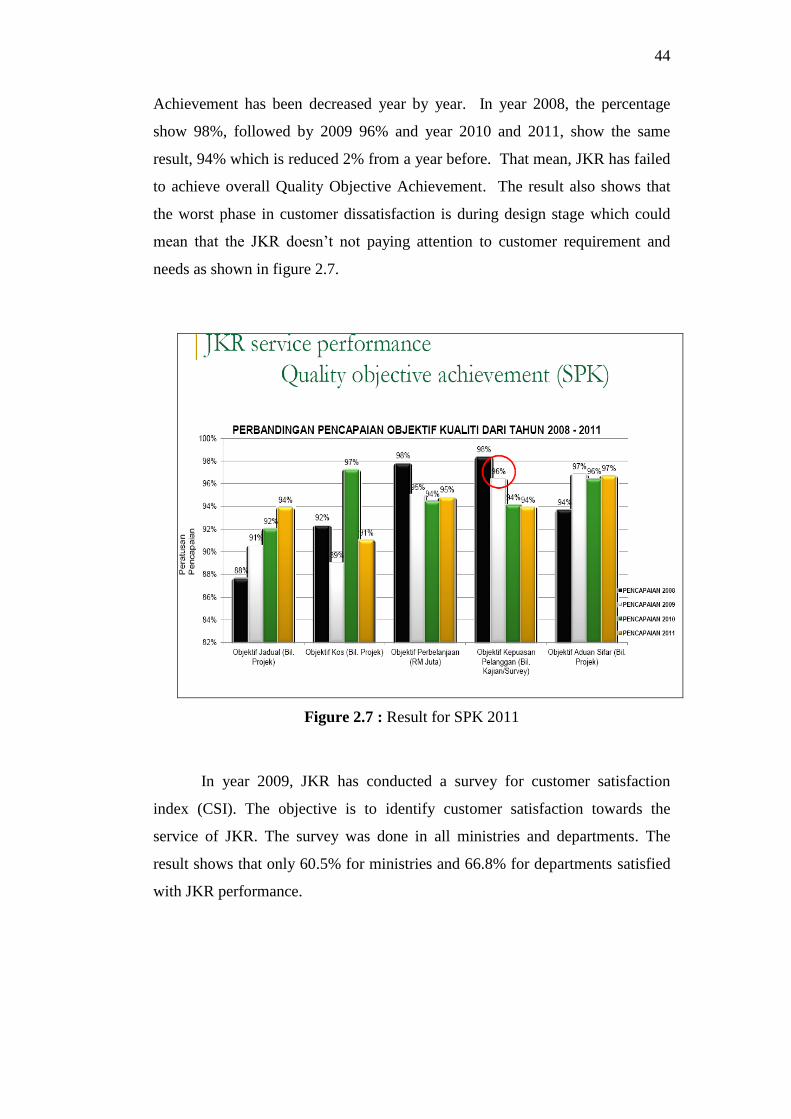
44
Achievement has been decreased year by year. In year 2008, the percentage
show 98%, followed by 2009 96% and year 2010 and 2011, show the same
result, 94% which is reduced 2% from a year before. That mean, JKR has failed
to achieve overall Quality Objective Achievement. The result also shows that
the worst phase in customer dissatisfaction is during design stage which could
mean that the JKR doesn‟t not paying attention to customer requirement and
needs as shown in figure 2.7.
Figure 2.7 : Result for SPK 2011
In year 2009, JKR has conducted a survey for customer satisfaction
index (CSI). The objective is to identify customer satisfaction towards the
service of JKR. The survey was done in all ministries and departments. The
result shows that only 60.5% for ministries and 66.8% for departments satisfied
with JKR performance.

45
The result overall shows that level of satisfaction are moderate as shown
in figure 2.8 and 2.9.
Figure 2.8 : Result for CSI in 2009
Despite, JKR had implemented the framework to improve on the
performance in delivering the projects, but until today there are several
ministries and department are still not entrust JKR in total. Why is this
happening? So this study will reveal the reason why JKR is still not meeting
customer satisfaction despite the improvement that been made.

46
Figure 2.9 : Result for CSI in 2009
Figure 2.10 : Result for CSI in 2009
47
CHAPTER 3
METHODOLOGY
3.1 Introduction
The survey was conducted in the concept of service quality, customer
satisfaction and service performance in JKR service and to indentify relationship
between them which influent the service quality JKR as overall. To assess the
current service quality provided by JKR, I adopted the service quality
dimensions of Parasuraman et al. (1991) which are reliability, responsiveness,
assurance, tangibles and empathy. However, all the five dimensions will be
related to the project phase. The project phases are planning, design,
procurement, execution/construction and handing over.
3.2 Data collection method
Data collection will be carry out by using a survey. The survey is
considered as the fast and quick step in accessing information about the
respondents. Survey is a research technique in which a sample is interviewed in
some form or the sample‟s behavior is observed and described. The survey was
done based on a listed questionnaires adopted from previous studies that has
been done in public sector. This is because there are two different target
respondents been identified. The questionnaire will be distributed to respected
48
respondents which identified earlier and the result of the survey will be
analyzed. The questionnaire distributed by hand to respondent and together with
a little bit explanation regarding the objectives of the research which was
attempted to improve JKR services to encourage them to participate in the study.
3.3 Sampling Technique
Sampling is important to derive a good conclusion for a study. The
probability sampling technique with simple random sampling approach has been
choosing to carry out the data collection. This sampling technique is used
because the population is known and the target respondents have been identified.
3.4 Targets respondents
The population or sampling unit in this study is manager level and
technical unit in identified ministries whom directly engage JKR as service
provider. Manager level means that the person identified who can decide to
engage the JKR and preparing the budget. The personnel‟s are known as Chief
Secretary (KSU or Ketua Setiausaha), Deputy Chief Secretary (TKSU or
Timbalan Ketua Setiausaha) or Section Secretary (SUB or Setiausaha
Bahagian). Whilst technical unit are those who are JKR staff posted in various
ministries. The idea is to get picture of their role in ministries and personnel
experience in ministries and personal opinion about the JKR. However for this
study, the managerial level, who involved for this survey is SUB Pembangunan,
who directly was involved in preparing budget and make recommendation for
KSU approval. In other words, the role of SUB Pembangunan is to manage the
financial of the Ministry and make recommendation whether to engage JKR or
other parties.
49
The total ministries that been identified are 16 ministries from JKR‟s database
which are directly engage JKR. The ministries are:
(1) Ministry of Foreign Affair
(2) Ministry of Tourism and Culture Malaysia
(3) Ministry of High Education
(4) Ministry of Energy, Green Technology and Water
(5) Ministry of Urban Wellbeing, Housing and Local Government
(6) Ministry of Works
(7) Ministry of Trade and Industry Malaysia
(8) Ministry of Agriculture
(9) Ministry of Defence
(10) Ministry of Natural Resources and Environmental
(11) Ministry of Federal Territories
(12) Ministry of Human Resources
(13) Ministry of Youth and Sports
(14) Ministry of Finance
(15) Ministry of Transport
(16) Ministry of Health
All ministries located in Klang Valley and Putrajaya which was chosen
earlier for the purpose of the study. There are three personnel from managerial
level and five personnel with professional background from technical unit at
every selected ministry as target respondents.
3.5 Sample size
The sampling size for this study uses a simple random sampling
approach. The sample size selection is based on level of decision maker on
behalf of ministries and professional level. There are three (3) personnel from
managerial level and five (5) personnel with professional background from
technical unit at every selected ministry as target respondents. The

50
questionnaires were given personally to the respondents. However, the feedback
are base on availability, willingness and agreeable of the respondents to
participate in the survey. The total respondents are 128 persons as show in table
3.1 below:
Table 3.1 : Sample size
Item Population Estimate targets Sample size
1 16 ministries
2 Managerial level
3 x 16 = 48
48 48
3 Technical unit
5 x 16 = 80
80 80
Total 128 128
3.6 Questionnaire development
The questionnaires were done in English in order to make fulfill the
research objective. The questionnaires are consists of four (4) main sections.
First section is the demographic detail related to respondent‟s background.
Second section is consists of 49 questions related to service quality model. This
section is where five (5) dimensions of service quality model are included which
are reliability, responsiveness, assurance, tangible and empathy. All questions
been prepared based on project implementation process that are planning stage,
design stage, procurement stage, execution stage and handing over stage. The
answer of each question shall be included in two difference angle which are
customer perceived/perception and customer expectation. They will expect a
gap between these two areas and the gap need to be assessed. By performing
service quality gap analysis, the result is expected to show the desirable
improvement in service quality. In related to five dimensions of service quality
model that been explained above, there are question for every dimension. For
reliability there are fourteen (14) questions to be answered, eleven (11)
51
questions for responsiveness, twelve (12) questions for assurance, eight (8)
questions for tangible and four (4) questions for empathy. Third section consists
of two parts, first part measuring customer satisfaction toward JKR whilst
second part measuring performance level of JKR. There are nine (9) and six (6)
questions in each part to be answered by respondents respectively. The last
section is prepared for to comment and recommendation by respondents.
A seven-point of Likert Scale were used as measurement level. The
measurement will make between sections II to section III which service quality,
customer satisfaction and JKR performance whilst section IV, which are
comment and recommendation will not measure at all. It will be used as
supporting for the improvement. The seven-point scales ranging from „1‟
strongly disagree to „7‟ strongly agree. The scale seems to be valid and correct
measurement as many previous researches has used to measure the topic on
service quality, customer satisfaction and performance level (Rahim, 2009;
Agus et al. 2007; Forsythe, 2008; Hashim, H., Rasid, S.Z.A. and Ismail
W.K.W. ,2011).
3.6.1 Service Quality
Service quality consists of five dimensions namely reliability,
responsiveness, assurance, tangibles and empathy. All dimensions are similar
dimensions has been used by Rahim (2009), (2011), Hashim, H., Rasid, S.Z.A.
and Ismail, W.K.W. (2011), JKR (2009), Agus et al. (2007) in their study.
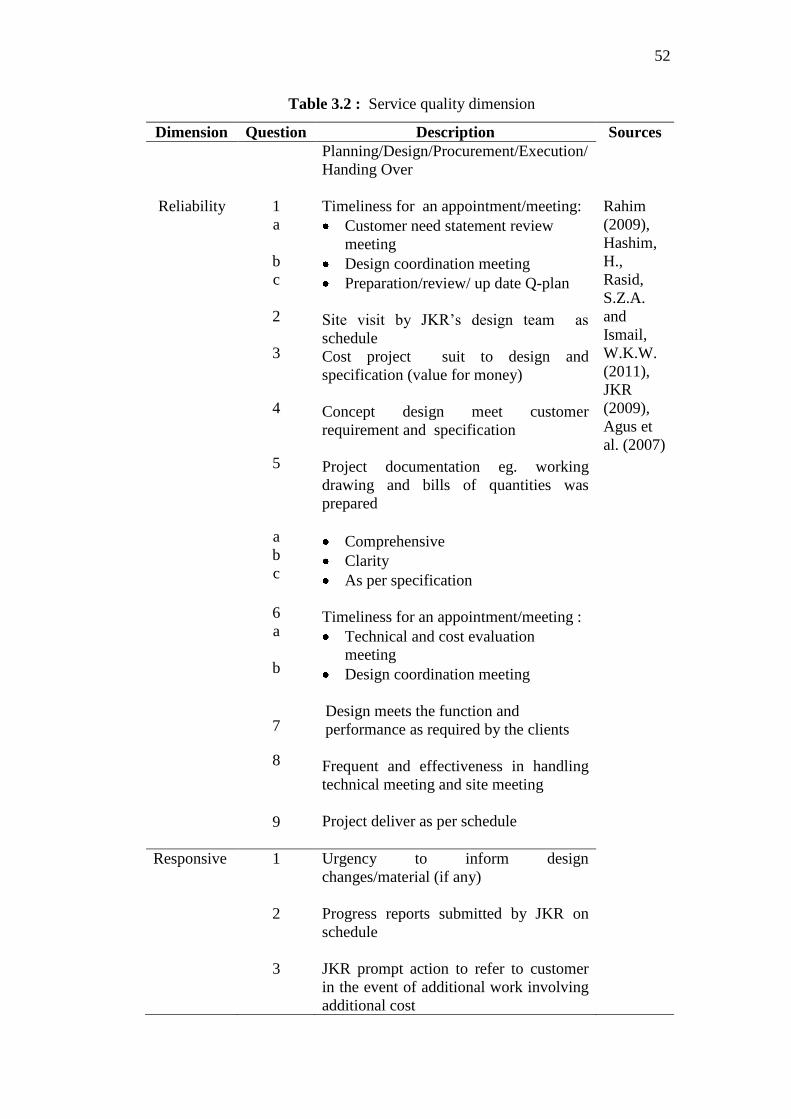
52
Table 3.2 : Service quality dimension
Dimension Question Description Sources
Reliability
1
a
b
c
2
3
4
5
a
b
c
6
a
b
7
8
9
Planning/Design/Procurement/Execution/
Handing Over
Timeliness for an appointment/meeting:
Customer need statement review
meeting
Design coordination meeting
Preparation/review/ up date Q-plan
Site visit by JKR‟s design team as
schedule
Cost project suit to design and
specification (value for money)
Concept design meet customer
requirement and specification
Project documentation eg. working
drawing and bills of quantities was
prepared
Comprehensive
Clarity
As per specification
Timeliness for an appointment/meeting :
Technical and cost evaluation
meeting
Design coordination meeting
Design meets the function and
performance as required by the clients
Frequent and effectiveness in handling
technical meeting and site meeting
Project deliver as per schedule
Rahim
(2009),
Hashim,
H.,
Rasid,
S.Z.A.
and
Ismail,
W.K.W.
(2011),
JKR
(2009),
Agus et
al. (2007)
Responsive
1
2
3
Urgency to inform design
changes/material (if any)
Progress reports submitted by JKR on
schedule
JKR prompt action to refer to customer
in the event of additional work involving
additional cost

53
Table 3.2 : Service quality dimension (continued)
Dimension Question Description Sources
4
5
6
a
b
c
7
8
9
JKR prompt action to respond if
customer request for changes
Preparation or projected cash flow of
project expenses by JKR
Regular maintenance plan by the
contractor to customer are:
Comprehensive and clarity
Timeliness
Comprehensive service
Officer responsive to the feedback from
customer
Project status reported on schedule to
customer
Imminence to give instruction to
contractor or repairs if there are reports
of damage
Rahim
(2009),
Hashim,
H.,
Rasid,
S.Z.A.
and
Ismail,
W.K.W.
(2011),
JKR
(2009),
Agus et
al. (2007)
Assurance
1
2
a
b
c
3
4
5
6
7
8
Adherence to the schedule of the
construction phase and completion of the
project by JKR
Schedule of testing submitted:
Comprehensive
Clarity
Adherence to the execution schedule
Quality material used as per specification
Quality of work compliance to
specification
JKR emphasizes issues related to the
environment and the safety of consumers
during the planning stage
Security monitoring of site by contractor
Monitoring and compliance to
environmental requirement on site and
surrounding areas
Project is save for used
Rahim
(2009),
Hashim,
H.,
Rasid,
S.Z.A.
and
Ismail,
W.K.W.
(2011),
JKR
(2009),
Agus et
al. (2007)
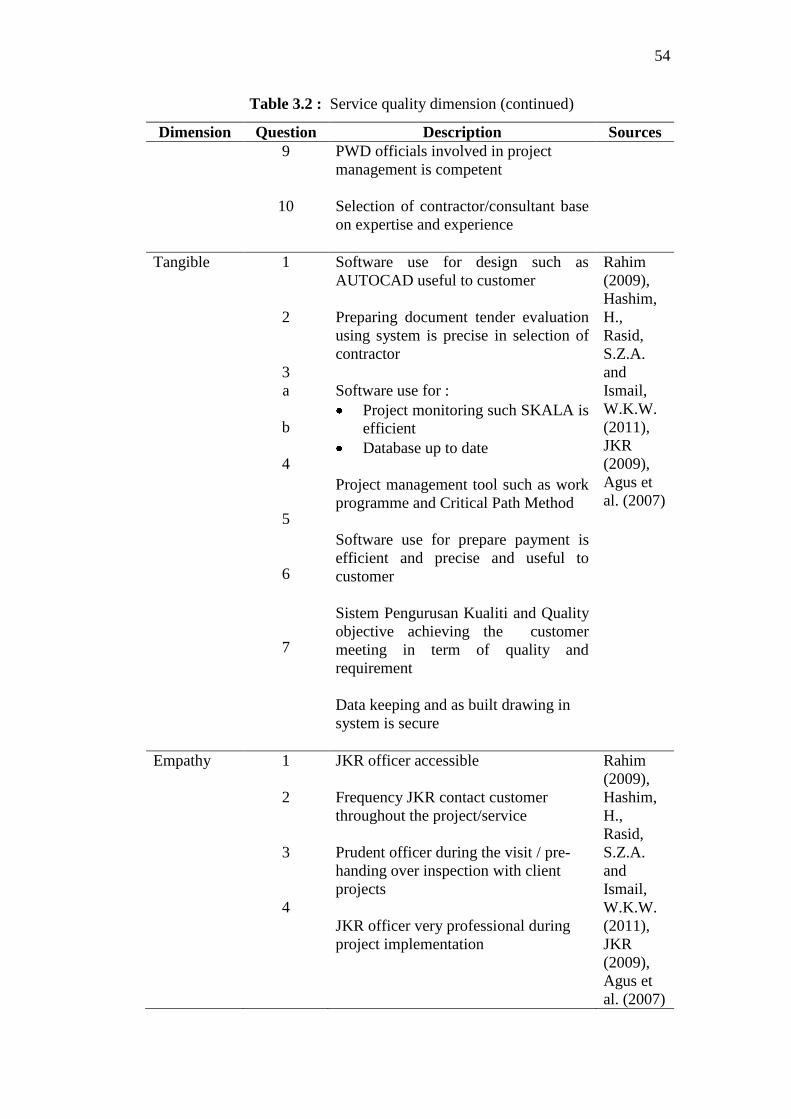
54
Table 3.2 : Service quality dimension (continued)
Dimension Question Description Sources
9
10
PWD officials involved in project
management is competent
Selection of contractor/consultant base
on expertise and experience
Tangible
1
2
3
a
b
4
5
6
7
Software use for design such as
AUTOCAD useful to customer
Preparing document tender evaluation
using system is precise in selection of
contractor
Software use for :
Project monitoring such SKALA is
efficient
Database up to date
Project management tool such as work
programme and Critical Path Method
Software use for prepare payment is
efficient and precise and useful to
customer
Sistem Pengurusan Kualiti and Quality
objective achieving the customer
meeting in term of quality and
requirement
Data keeping and as built drawing in
system is secure
Rahim
(2009),
Hashim,
H.,
Rasid,
S.Z.A.
and
Ismail,
W.K.W.
(2011),
JKR
(2009),
Agus et
al. (2007)
Empathy 1
2
3
4
JKR officer accessible
Frequency JKR contact customer
throughout the project/service
Prudent officer during the visit / pre-
handing over inspection with client
projects
JKR officer very professional during
project implementation
Rahim
(2009),
Hashim,
H.,
Rasid,
S.Z.A.
and
Ismail,
W.K.W.
(2011),
JKR
(2009),
Agus et
al. (2007)

55
3.6.2 Customer Satisfaction
According to Churcill and Surprenant (1982), satisfaction is similar to an
attitude, as it can assess as the sum of the satisfactions with various attributes of
the product and service. However, while attitude is a pre-decision construct,
satisfaction is a post-decision experience construct (LaTour and Peat, 1979).
Satisfaction can be two levels; the transaction or encounter level and overall
satisfaction (Bitner and Hubbert, 1994).
However, according to Levesque and McDougall (1996), satisfaction is
conceptualized as an overall, customer attitude towards a service provider.
Similarly, Andreassen and Lindestad (1998) claimed customer satisfaction is the
accumulated experience of a customer‟s purchase and consumption experiences.
It was therefore, client satisfaction develop in this paper will be measured
through overall satisfaction toward the services.
Therefore in this study, customer satisfaction constructs where measured
through overall satisfaction of customer on the department and their service
offered (Bitner, 1990; Bolton & R.N & Drew. H.J, 1991). In this section, the
degree of satisfaction towards service quality of JKR is set from 1 to 5. In
addition, the translation of level ranking was analyzed follow criteria of
customers‟ satisfaction designed by Best (1977:174) as table below.
Table 3.3 : Customer satisfaction ranking level
Score Level of satisfaction
1.00 – 1.80 Lowest
1.81 – 2.61 Low
2.62 – 3.41 Average
3.42 – 4.21 Good
4.22 – 5.00 Very good

56
Table 3.4 : Customer satisfaction dimensions
Dimension Question Description Sources
Customer
satisfaction
1
a
b
c
d
e
2
3
4
5
I'm fully satisfied with JKR during :
Planning stage
Design stage
Procurement stage
Execution/construction stage
Handing over stage
JKR always fulfills my expectation
My experience with JKR are excellent
JKR has never disappointed me so far
Project delivery completely functional,
aesthetic, easy maintenance, good
workmanship and perfect finishing
Rahim
(2009),
Hashim,
H., Rasid,
S.Z.A. and
Ismail,
W.K.W.
(2011),
JKR
(2009);
Agus et al.
(2007)
3.6.3 Service performance
For purpose of the evaluation of the service quality model, service
performance is evaluated by customer on the basis of the quality and speed of
service delivery and quick respond, (Agus et al, (2007). There are six (6)
question suggested by Agus et al (2007), Rahim (2009) and Rasid, S.Z.A. and
Ismail, W.K.W. (2011). Adopted from three those three researchers, the
questions were measuring the effectiveness and efficiency of the JKR service
delivery, prompt respond to the customer need and consistency of the
improvement.
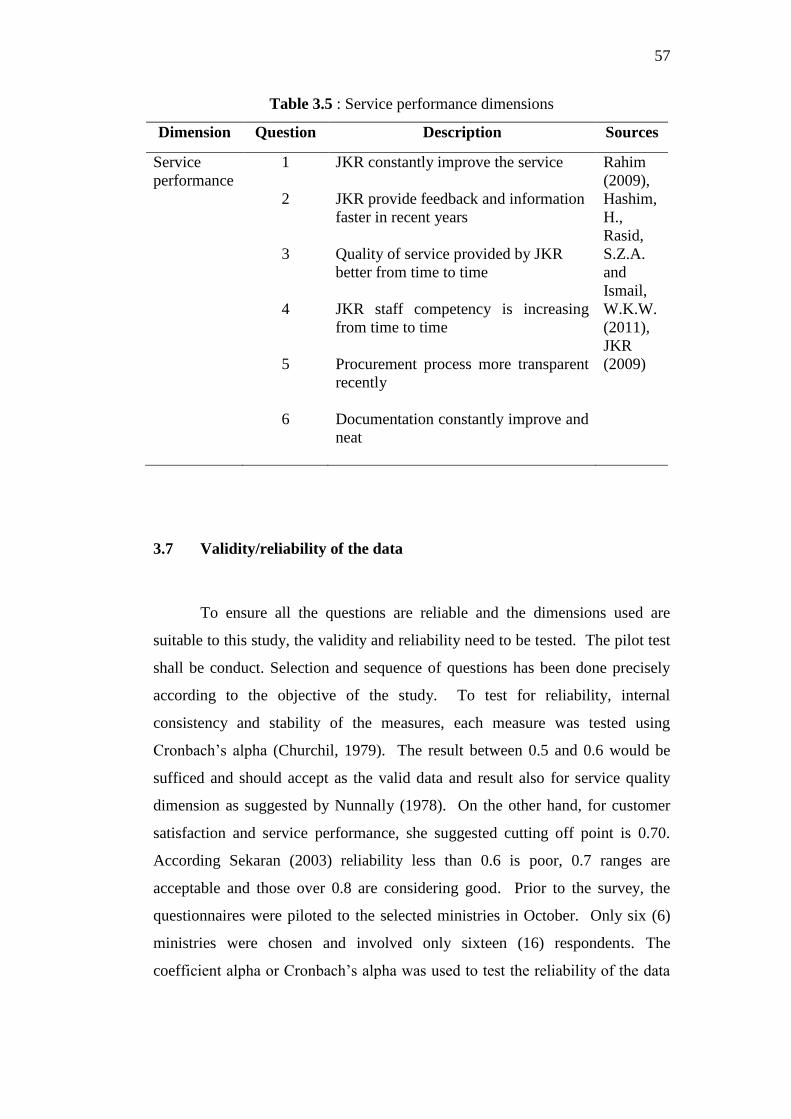
57
Table 3.5 : Service performance dimensions
Dimension Question Description Sources
Service
performance
1
2
3
4
5
6
JKR constantly improve the service
JKR provide feedback and information
faster in recent years
Quality of service provided by JKR
better from time to time
JKR staff competency is increasing
from time to time
Procurement process more transparent
recently
Documentation constantly improve and
neat
Rahim
(2009),
Hashim,
H.,
Rasid,
S.Z.A.
and
Ismail,
W.K.W.
(2011),
JKR
(2009)
3.7 Validity/reliability of the data
To ensure all the questions are reliable and the dimensions used are
suitable to this study, the validity and reliability need to be tested. The pilot test
shall be conduct. Selection and sequence of questions has been done precisely
according to the objective of the study. To test for reliability, internal
consistency and stability of the measures, each measure was tested using
Cronbach‟s alpha (Churchil, 1979). The result between 0.5 and 0.6 would be
sufficed and should accept as the valid data and result also for service quality
dimension as suggested by Nunnally (1978). On the other hand, for customer
satisfaction and service performance, she suggested cutting off point is 0.70.
According Sekaran (2003) reliability less than 0.6 is poor, 0.7 ranges are
acceptable and those over 0.8 are considering good. Prior to the survey, the
questionnaires were piloted to the selected ministries in October. Only six (6)
ministries were chosen and involved only sixteen (16) respondents. The
coefficient alpha or Cronbach‟s alpha was used to test the reliability of the data
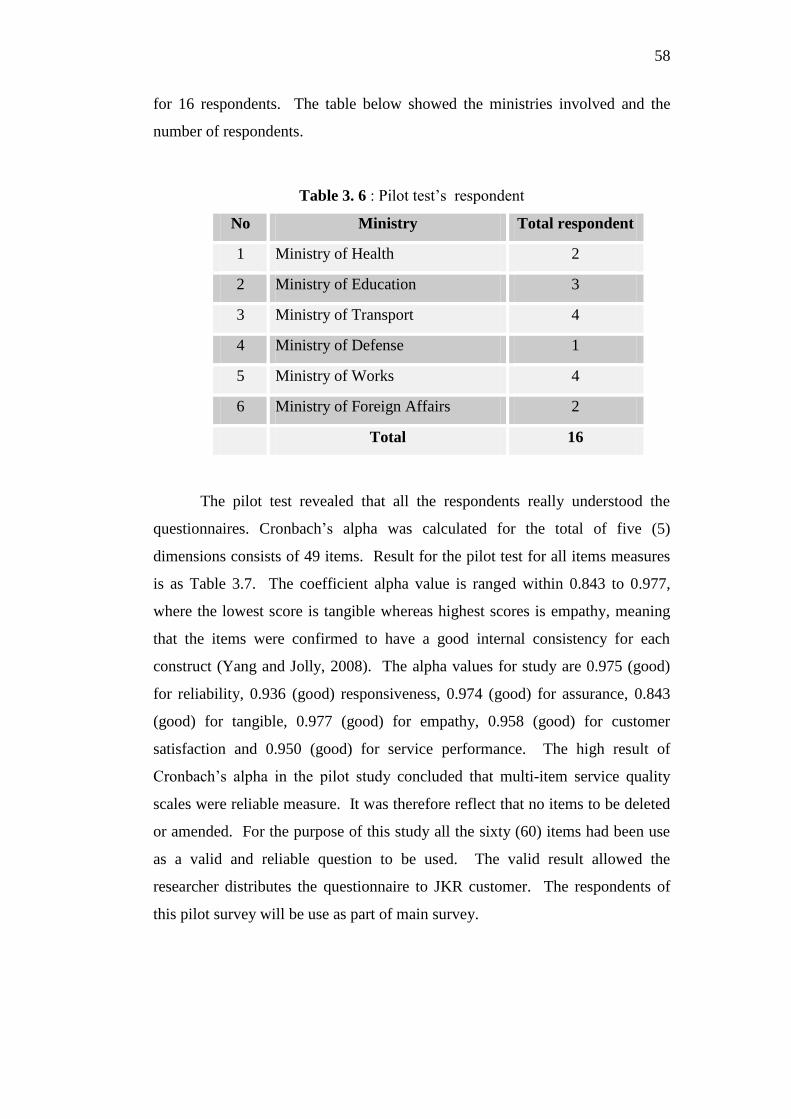
58
for 16 respondents. The table below showed the ministries involved and the
number of respondents.
Table 3. 6 : Pilot test‟s respondent
No Ministry Total respondent
1 Ministry of Health 2
2 Ministry of Education 3
3 Ministry of Transport 4
4 Ministry of Defense 1
5 Ministry of Works 4
6 Ministry of Foreign Affairs 2
Total 16
The pilot test revealed that all the respondents really understood the
questionnaires. Cronbach‟s alpha was calculated for the total of five (5)
dimensions consists of 49 items. Result for the pilot test for all items measures
is as Table 3.7. The coefficient alpha value is ranged within 0.843 to 0.977,
where the lowest score is tangible whereas highest scores is empathy, meaning
that the items were confirmed to have a good internal consistency for each
construct (Yang and Jolly, 2008). The alpha values for study are 0.975 (good)
for reliability, 0.936 (good) responsiveness, 0.974 (good) for assurance, 0.843
(good) for tangible, 0.977 (good) for empathy, 0.958 (good) for customer
satisfaction and 0.950 (good) for service performance. The high result of
Cronbach‟s alpha in the pilot study concluded that multi-item service quality
scales were reliable measure. It was therefore reflect that no items to be deleted
or amended. For the purpose of this study all the sixty (60) items had been use
as a valid and reliable question to be used. The valid result allowed the
researcher distributes the questionnaire to JKR customer. The respondents of
this pilot survey will be use as part of main survey.
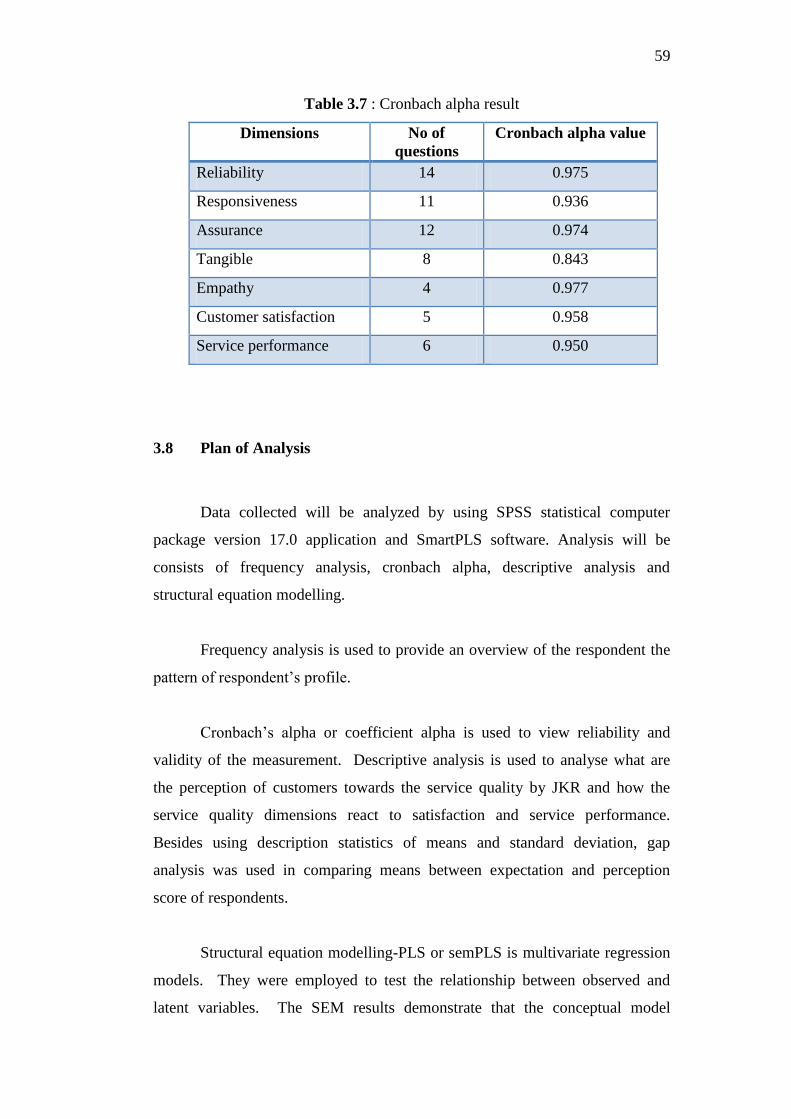
59
Table 3.7 : Cronbach alpha result
Dimensions No of
questions
Cronbach alpha value
Reliability 14 0.975
Responsiveness 11 0.936
Assurance 12 0.974
Tangible 8 0.843
Empathy 4 0.977
Customer satisfaction 5 0.958
Service performance 6 0.950
3.8 Plan of Analysis
Data collected will be analyzed by using SPSS statistical computer
package version 17.0 application and SmartPLS software. Analysis will be
consists of frequency analysis, cronbach alpha, descriptive analysis and
structural equation modelling.
Frequency analysis is used to provide an overview of the respondent the
pattern of respondent‟s profile.
Cronbach‟s alpha or coefficient alpha is used to view reliability and
validity of the measurement. Descriptive analysis is used to analyse what are
the perception of customers towards the service quality by JKR and how the
service quality dimensions react to satisfaction and service performance.
Besides using description statistics of means and standard deviation, gap
analysis was used in comparing means between expectation and perception
score of respondents.
Structural equation modelling-PLS or semPLS is multivariate regression
models. They were employed to test the relationship between observed and
latent variables. The SEM results demonstrate that the conceptual model

60
measurement that being implemented is suitable. The SEM been used to
analyse how much service quality dimension described customer satisfaction
and customer satisfaction described service performance. It also analyzes the
relationship of JKR service quality and service performance are related each
other.
Structural equation models (SEM) are very popular in many disciplines.
The partial least squares (PLS) approach to SEM offers an alternative to
covariance based SEM, which is especially suited for situations when data is
abnormal distributed. PLS path modeling is referred to as soft–modeling–
technique with minimum demands regarding measurement scales, sample sizes
and residual distributions. The semPLS package provides the capability to
estimate PLS path models within the R programming environment. Different
setups for the estimation of factor scores can be used. Furthermore it contains
modular methods for computation of bootstrap confidence intervals, model
parameters and several quality indices. Various plot functions help to evaluate
the model. The well known mobile phone dataset from marketing research is
used to demonstrate the features of the package. Structural Equation Model-
PLS or semPLS is used due to its capacity that can analyze more than 2
regressions with abnormal data distribution. SemPLS also can produce better
prediction thus more precise result could obtain compare to normal SEM.
To measure validity of the data, average variance extracted (AVE =
convergent validity) are well above the minimum required level of 0.50, thus
demonstrating convergent validity and consider the acceptable value for model
fit.
61
CHAPTER 4
DATA ANALYSIS
4.1 Introduction
This chapter presents the analysis of the study consisting of respondent
profiles, level of customers‟ perceived and expectation and analysis of customer
satisfaction and service performance.
4.2 Frequency analysis
4.2.1 Respondents profile
Respondent profile for this survey consists of numerous personnel in
managerial level and technical personnel in 16 ministries which identified earlier.
The total questionnaires distributed were 128 questionnaires where every
ministry has been distributed 8 questionnaires. There are three (3) questionnaires
distributed to managerial level and five (5) questionnaires to technical personnel
with professional background. However until analysis was done only 110
questionnaires were received and valid to be used which is 85.94% response rate.
All respondents was answered all the questions given and generally the score
recorded between `5‟ to `7‟.
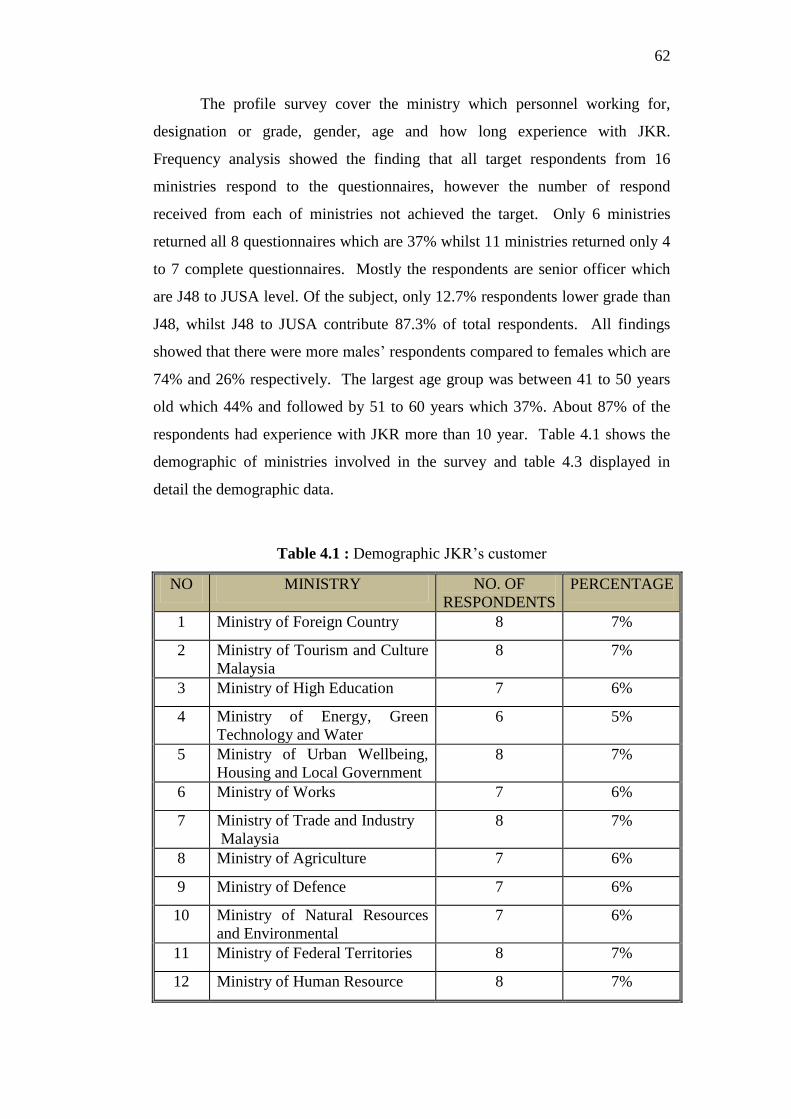
62
The profile survey cover the ministry which personnel working for,
designation or grade, gender, age and how long experience with JKR.
Frequency analysis showed the finding that all target respondents from 16
ministries respond to the questionnaires, however the number of respond
received from each of ministries not achieved the target. Only 6 ministries
returned all 8 questionnaires which are 37% whilst 11 ministries returned only 4
to 7 complete questionnaires. Mostly the respondents are senior officer which
are J48 to JUSA level. Of the subject, only 12.7% respondents lower grade than
J48, whilst J48 to JUSA contribute 87.3% of total respondents. All findings
showed that there were more males‟ respondents compared to females which are
74% and 26% respectively. The largest age group was between 41 to 50 years
old which 44% and followed by 51 to 60 years which 37%. About 87% of the
respondents had experience with JKR more than 10 year. Table 4.1 shows the
demographic of ministries involved in the survey and table 4.3 displayed in
detail the demographic data.
Table 4.1 : Demographic JKR‟s customer
NO MINISTRY NO. OF
RESPONDENTS
PERCENTAGE
1 Ministry of Foreign Country 8 7%
2 Ministry of Tourism and Culture
Malaysia
8 7%
3 Ministry of High Education 7 6%
4 Ministry of Energy, Green
Technology and Water
6 5%
5 Ministry of Urban Wellbeing,
Housing and Local Government
8 7%
6 Ministry of Works 7 6%
7 Ministry of Trade and Industry
Malaysia
8 7%
8 Ministry of Agriculture 7 6%
9 Ministry of Defence 7 6%
10 Ministry of Natural Resources
and Environmental
7 6%
11 Ministry of Federal Territories 8 7%
12 Ministry of Human Resource 8 7%
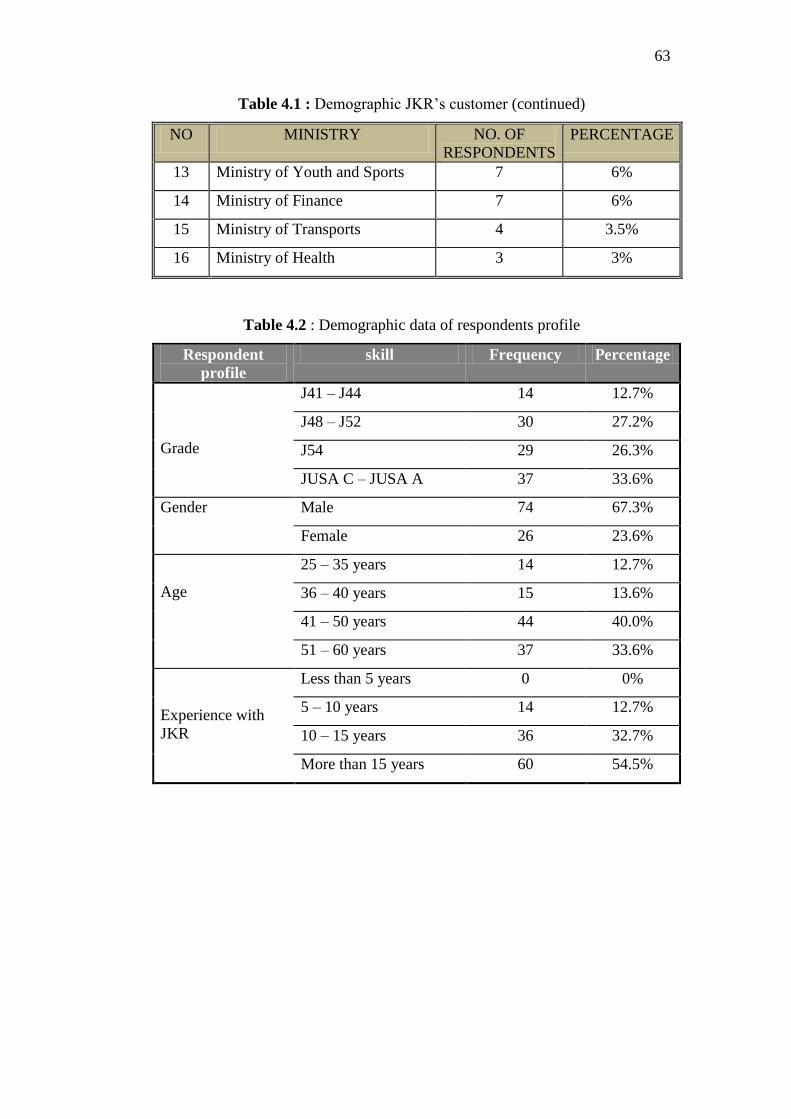
63
Table 4.1 : Demographic JKR‟s customer (continued)
NO MINISTRY NO. OF
RESPONDENTS
PERCENTAGE
13 Ministry of Youth and Sports 7 6%
14 Ministry of Finance 7 6%
15 Ministry of Transports 4 3.5%
16 Ministry of Health 3 3%
Table 4.2 : Demographic data of respondents profile
Respondent
profile
skill Frequency Percentage
Grade
J41 – J44 14 12.7%
J48 – J52 30 27.2%
J54 29 26.3%
JUSA C – JUSA A 37 33.6%
Gender Male 74 67.3%
Female 26 23.6%
Age
25 – 35 years 14 12.7%
36 – 40 years 15 13.6%
41 – 50 years 44 40.0%
51 – 60 years 37 33.6%
Experience with
JKR
Less than 5 years 0 0%
5 – 10 years 14 12.7%
10 – 15 years 36 32.7%
More than 15 years 60 54.5%
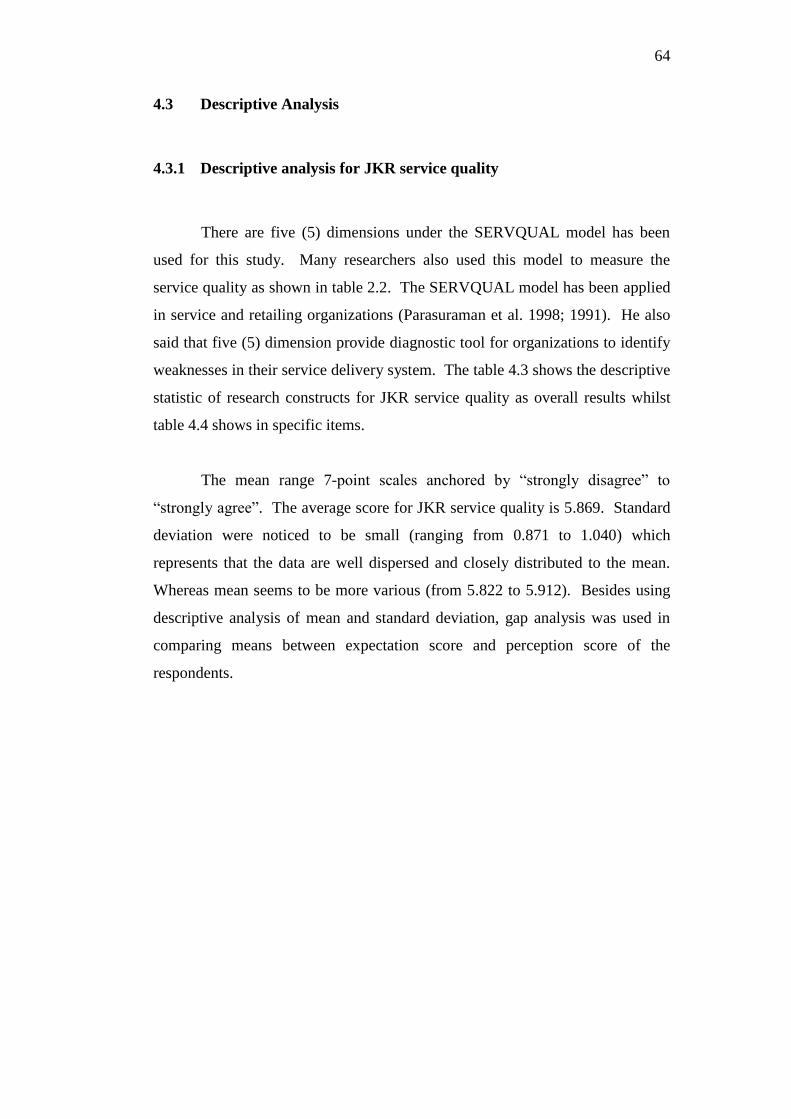
64
4.3 Descriptive Analysis
4.3.1 Descriptive analysis for JKR service quality
There are five (5) dimensions under the SERVQUAL model has been
used for this study. Many researchers also used this model to measure the
service quality as shown in table 2.2. The SERVQUAL model has been applied
in service and retailing organizations (Parasuraman et al. 1998; 1991). He also
said that five (5) dimension provide diagnostic tool for organizations to identify
weaknesses in their service delivery system. The table 4.3 shows the descriptive
statistic of research constructs for JKR service quality as overall results whilst
table 4.4 shows in specific items.
The mean range 7-point scales anchored by “strongly disagree” to
“strongly agree”. The average score for JKR service quality is 5.869. Standard
deviation were noticed to be small (ranging from 0.871 to 1.040) which
represents that the data are well dispersed and closely distributed to the mean.
Whereas mean seems to be more various (from 5.822 to 5.912). Besides using
descriptive analysis of mean and standard deviation, gap analysis was used in
comparing means between expectation score and perception score of the
respondents.
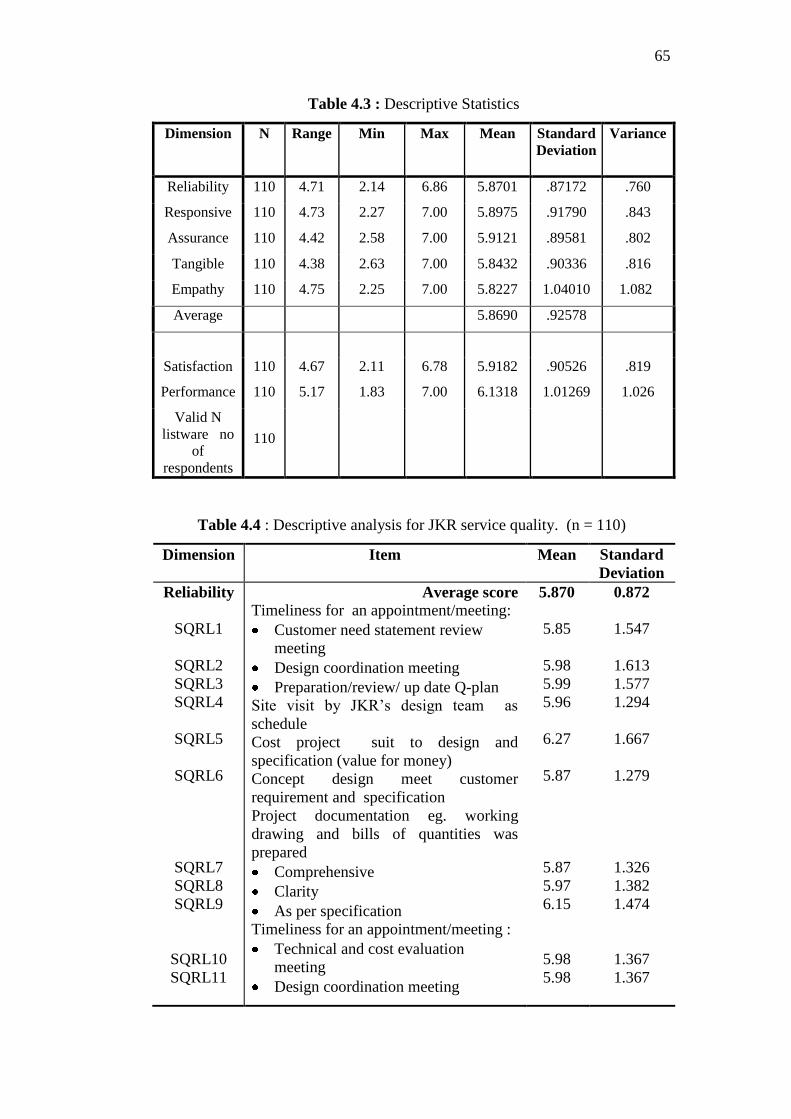
65
Table 4.3 : Descriptive Statistics
Dimension N Range Min Max Mean Standard
Deviation
Variance
Reliability 110 4.71 2.14 6.86 5.8701 .87172 .760
Responsive 110 4.73 2.27 7.00 5.8975 .91790 .843
Assurance 110 4.42 2.58 7.00 5.9121 .89581 .802
Tangible 110 4.38 2.63 7.00 5.8432 .90336 .816
Empathy 110 4.75 2.25 7.00 5.8227 1.04010 1.082
Average 5.8690 .92578
Satisfaction 110 4.67 2.11 6.78 5.9182 .90526 .819
Performance 110 5.17 1.83 7.00 6.1318 1.01269 1.026
Valid N
listware no
of
respondents
110
Table 4.4 : Descriptive analysis for JKR service quality. (n = 110)
Dimension Item Mean Standard
Deviation
Reliability Average score 5.870 0.872
SQRL1
SQRL2
SQRL3
SQRL4
SQRL5
SQRL6
SQRL7
SQRL8
SQRL9
SQRL10
SQRL11
Timeliness for an appointment/meeting:
Customer need statement review
meeting
Design coordination meeting
Preparation/review/ up date Q-plan
Site visit by JKR‟s design team as
schedule
Cost project suit to design and
specification (value for money)
Concept design meet customer
requirement and specification
Project documentation eg. working
drawing and bills of quantities was
prepared
Comprehensive
Clarity
As per specification
Timeliness for an appointment/meeting :
Technical and cost evaluation
meeting
Design coordination meeting
5.85
5.98
5.99
5.96
6.27
5.87
5.87
5.97
6.15
5.98
5.98
1.547
1.613
1.577
1.294
1.667
1.279
1.326
1.382
1.474
1.367
1.367
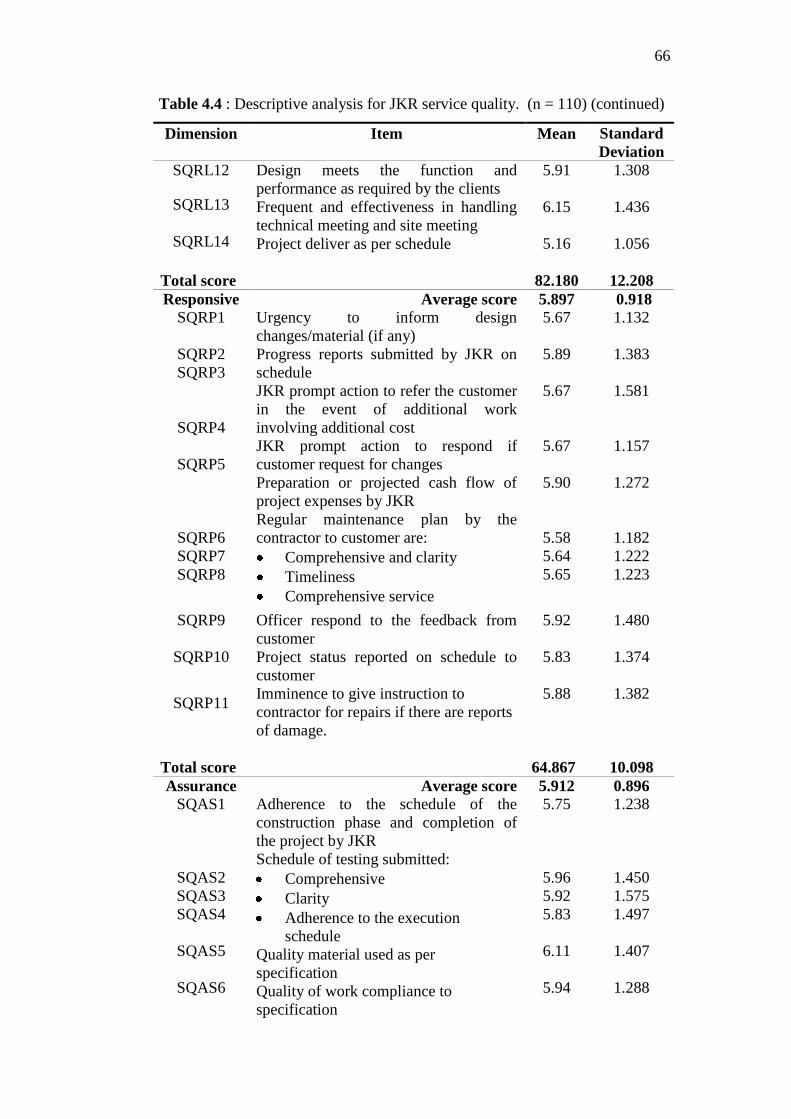
66
Table 4.4 : Descriptive analysis for JKR service quality. (n = 110) (continued)
Dimension Item Mean Standard
Deviation
SQRL12
SQRL13
SQRL14
Design meets the function and
performance as required by the clients
Frequent and effectiveness in handling
technical meeting and site meeting
Project deliver as per schedule
5.91
6.15
5.16
1.308
1.436
1.056
Total score 82.180 12.208
Responsive Average score 5.897 0.918
SQRP1
SQRP2
SQRP3
SQRP4
SQRP5
SQRP6
SQRP7
SQRP8
Urgency to inform design
changes/material (if any)
Progress reports submitted by JKR on
schedule
JKR prompt action to refer the customer
in the event of additional work
involving additional cost
JKR prompt action to respond if
customer request for changes
Preparation or projected cash flow of
project expenses by JKR
Regular maintenance plan by the
contractor to customer are:
Comprehensive and clarity
Timeliness
Comprehensive service
5.67
5.89
5.67
5.67
5.90
5.58
5.64
5.65
1.132
1.383
1.581
1.157
1.272
1.182
1.222
1.223
SQRP9
SQRP10
SQRP11
Officer respond to the feedback from
customer
Project status reported on schedule to
customer
Imminence to give instruction to
contractor for repairs if there are reports
of damage.
5.92
5.83
5.88
1.480
1.374
1.382
Total score 64.867 10.098
Assurance Average score 5.912 0.896
SQAS1
SQAS2
SQAS3
SQAS4
SQAS5
SQAS6
Adherence to the schedule of the
construction phase and completion of
the project by JKR
Schedule of testing submitted:
Comprehensive
Clarity
Adherence to the execution
schedule
Quality material used as per
specification
Quality of work compliance to
specification
5.75
5.96
5.92
5.83
6.11
5.94
1.238
1.450
1.575
1.497
1.407
1.288

67
Table 4.4 : Descriptive analysis for JKR service quality. (n = 110) (continued)
Dimension Item Mean Standard
Deviation
SQAS7
SQAS8
SQAS9
SQAS10
SQAS11
SQAS12
JKR emphasizes issues related to the
environment and the safety of consumers
during the planning stage
Security monitoring of site by contractor
Monitoring and compliance to
environmental requirement on site and
surrounding areas
Project is save for used
PWD officials involved in project
management is competent
Selection of contractor/consultant base on
expertise and experience
5.89
5.86
5.83
6.13
6.01
5.71
1.225
1.407
1.289
1.623
1.544
1.171
Total score 70.944 10.752
Tangible Average score 5.843 0.903
SQTG1
SQTG2
SQTG3
SQTG4
SQTG5
SQTG6
SQTG7
SQTG8
Software use for design such as
AUTOCAD useful to customer
Preparing document tender evaluation
using system is precise in selection of
contractor
Software use for :
Project monitoring such SKALA is
efficient
Database up to date
Project management tool such as work
programme and Critical Path Method
Software use for prepare payment is
efficient and precise and useful to
customer
Sistem Pengurusan Kualiti and Quality
objective achieving the customer
meeting in term of quality and
requirement
Data keeping and as built drawing in
system is secure
2.90
5.17
4.92
5.12
5.01
4.42
5.75
5.31
0.478
1.138
1.059
1.320
1.115
0.932
1.258
1.046
Total
score
46.744 7.224
Empathy Average score 5.822 1.404
SQEM1
SQEM2
SQEM3
JKR officer accessible
Frequency JKR contact customer
throughout the project/service
Prudent officer during the visit / pre-
handing over inspection with client
projects
5.56
5.94
6.28
1.453
1.116
1.483
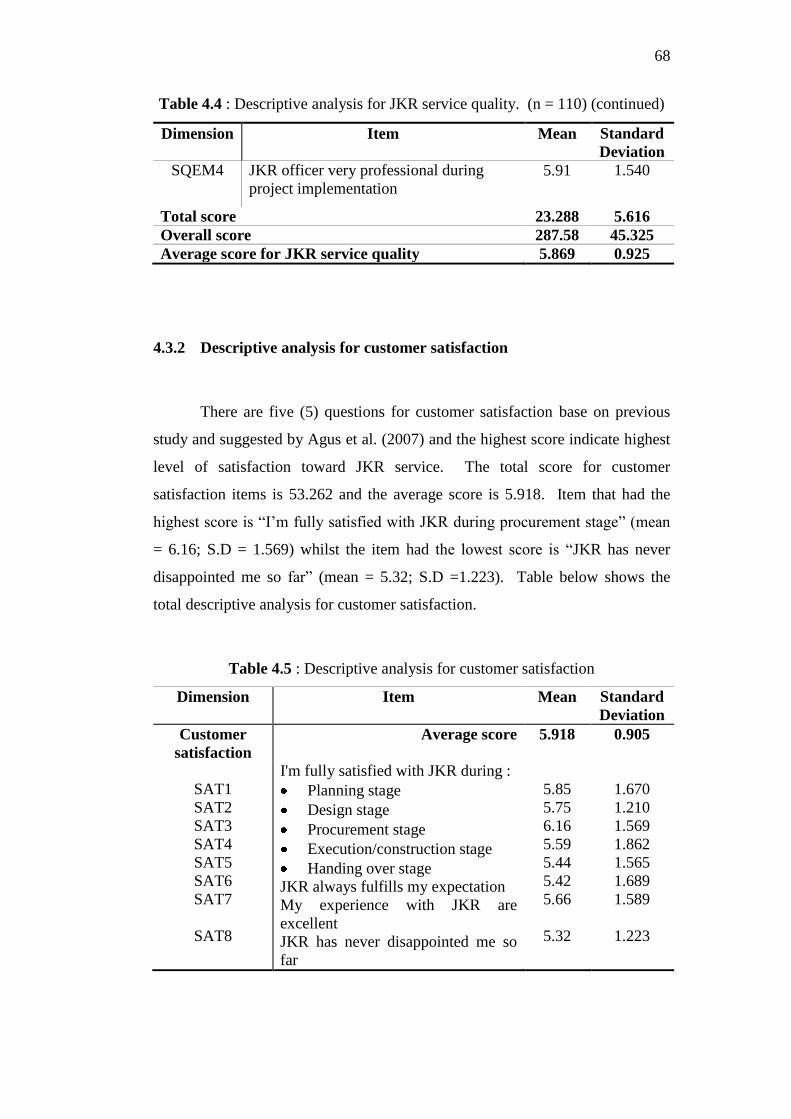
68
Table 4.4 : Descriptive analysis for JKR service quality. (n = 110) (continued)
Dimension Item Mean Standard
Deviation
SQEM4
JKR officer very professional during
project implementation
5.91 1.540
Total score 23.288 5.616
Overall score 287.58 45.325
Average score for JKR service quality 5.869 0.925
4.3.2 Descriptive analysis for customer satisfaction
There are five (5) questions for customer satisfaction base on previous
study and suggested by Agus et al. (2007) and the highest score indicate highest
level of satisfaction toward JKR service. The total score for customer
satisfaction items is 53.262 and the average score is 5.918. Item that had the
highest score is “I‟m fully satisfied with JKR during procurement stage” (mean
= 6.16; S.D = 1.569) whilst the item had the lowest score is “JKR has never
disappointed me so far” (mean = 5.32; S.D =1.223). Table below shows the
total descriptive analysis for customer satisfaction.
Table 4.5 : Descriptive analysis for customer satisfaction
Dimension Item Mean Standard
Deviation
Customer
satisfaction
Average score 5.918 0.905
SAT1
SAT2
SAT3
SAT4
SAT5
SAT6
SAT7
SAT8
I'm fully satisfied with JKR during :
Planning stage
Design stage
Procurement stage
Execution/construction stage
Handing over stage
JKR always fulfills my expectation
My experience with JKR are
excellent
JKR has never disappointed me so
far
5.85
5.75
6.16
5.59
5.44
5.42
5.66
5.32
1.670
1.210
1.569
1.862
1.565
1.689
1.589
1.223
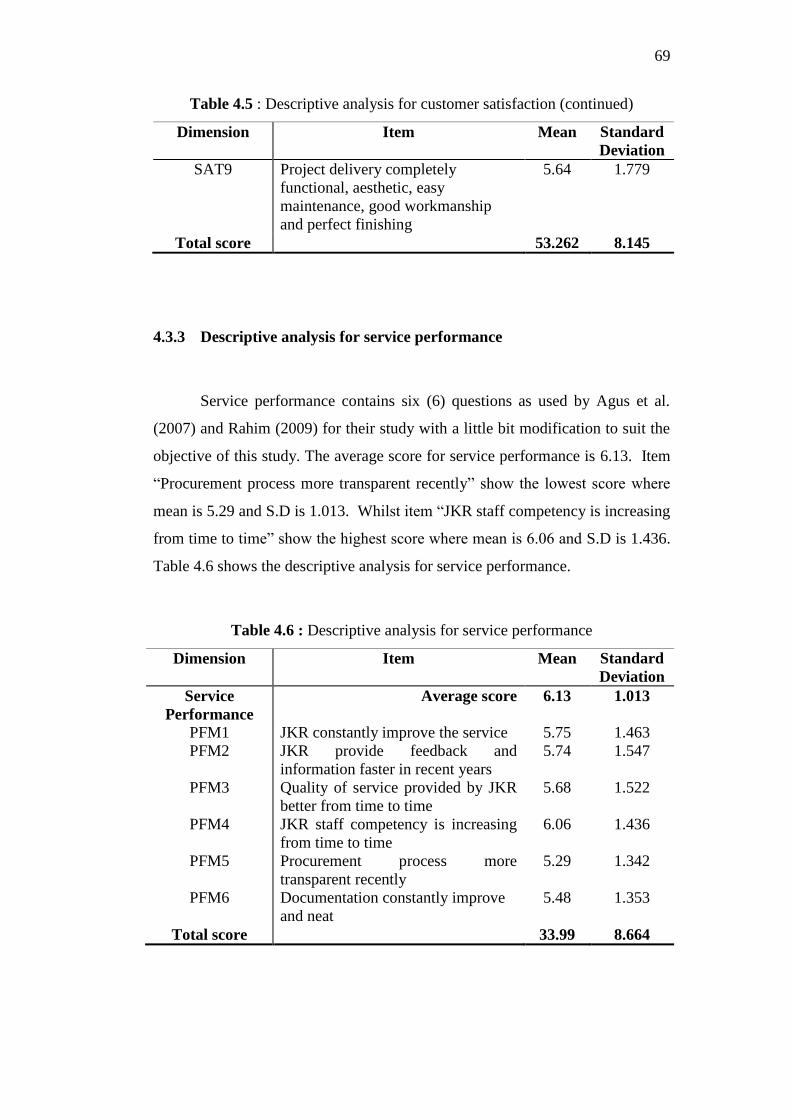
69
Table 4.5 : Descriptive analysis for customer satisfaction (continued)
Dimension Item Mean Standard
Deviation
SAT9 Project delivery completely
functional, aesthetic, easy
maintenance, good workmanship
and perfect finishing
5.64 1.779
Total score 53.262 8.145
4.3.3 Descriptive analysis for service performance
Service performance contains six (6) questions as used by Agus et al.
(2007) and Rahim (2009) for their study with a little bit modification to suit the
objective of this study. The average score for service performance is 6.13. Item
“Procurement process more transparent recently” show the lowest score where
mean is 5.29 and S.D is 1.013. Whilst item “JKR staff competency is increasing
from time to time” show the highest score where mean is 6.06 and S.D is 1.436.
Table 4.6 shows the descriptive analysis for service performance.
Table 4.6 : Descriptive analysis for service performance
Dimension Item Mean Standard
Deviation
Service
Performance
Average score 6.13 1.013
PFM1
PFM2
PFM3
PFM4
PFM5
PFM6
JKR constantly improve the service
JKR provide feedback and
information faster in recent years
Quality of service provided by JKR
better from time to time
JKR staff competency is increasing
from time to time
Procurement process more
transparent recently
Documentation constantly improve
and neat
5.75
5.74
5.68
6.06
5.29
5.48
1.463
1.547
1.522
1.436
1.342
1.353
Total score 33.99 8.664
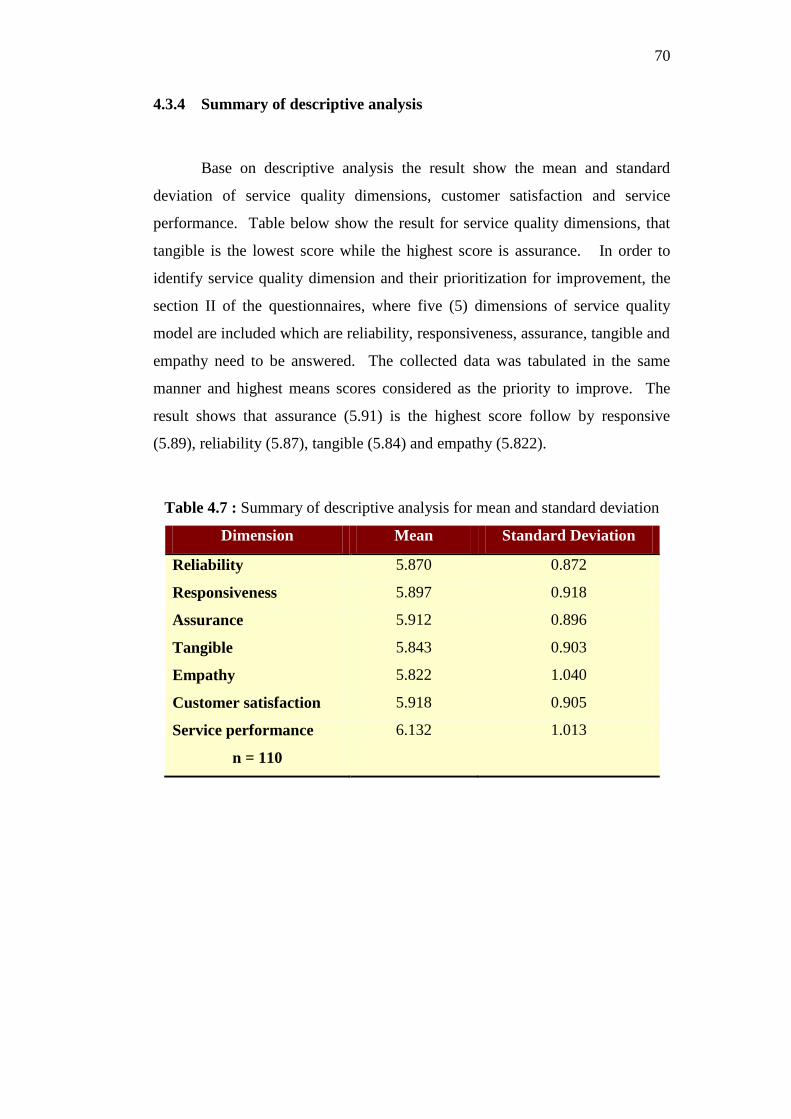
70
4.3.4 Summary of descriptive analysis
Base on descriptive analysis the result show the mean and standard
deviation of service quality dimensions, customer satisfaction and service
performance. Table below show the result for service quality dimensions, that
tangible is the lowest score while the highest score is assurance. In order to
identify service quality dimension and their prioritization for improvement, the
section II of the questionnaires, where five (5) dimensions of service quality
model are included which are reliability, responsiveness, assurance, tangible and
empathy need to be answered. The collected data was tabulated in the same
manner and highest means scores considered as the priority to improve. The
result shows that assurance (5.91) is the highest score follow by responsive
(5.89), reliability (5.87), tangible (5.84) and empathy (5.822).
Table 4.7 : Summary of descriptive analysis for mean and standard deviation
Dimension Mean Standard Deviation
Reliability 5.870 0.872
Responsiveness 5.897 0.918
Assurance 5.912 0.896
Tangible 5.843 0.903
Empathy 5.822 1.040
Customer satisfaction 5.918 0.905
Service performance
n = 110
6.132
1.013
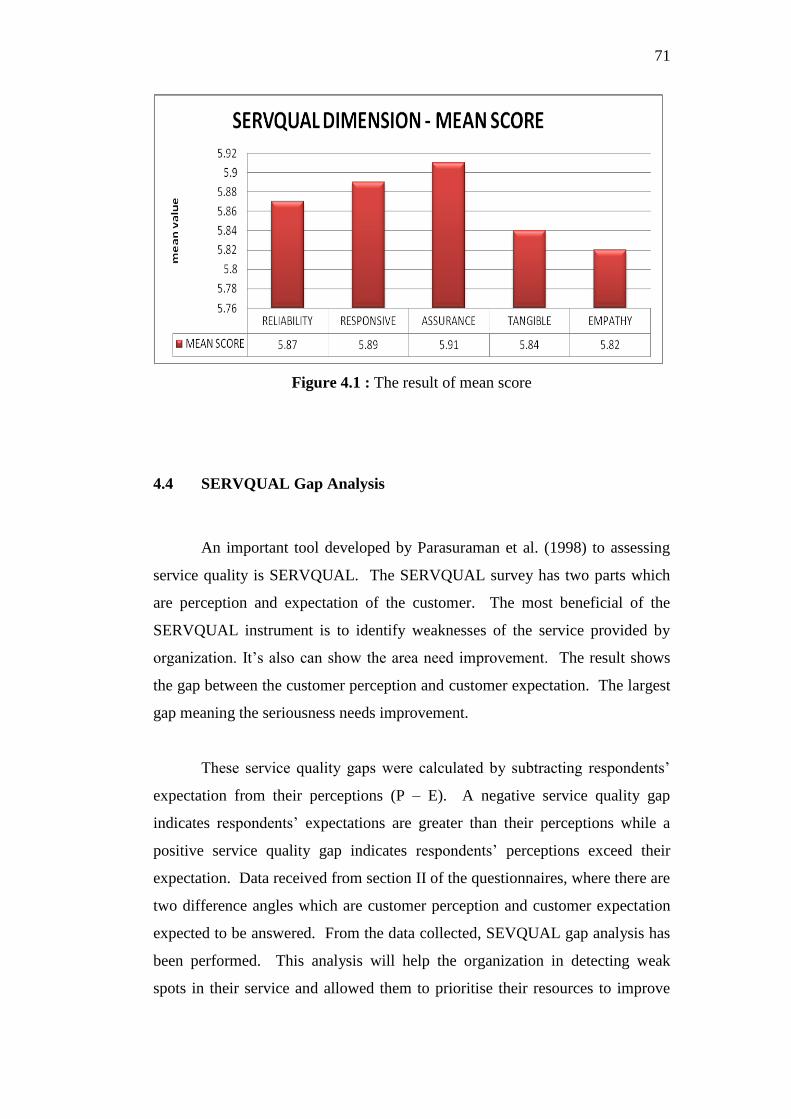
71
Figure 4.1 : The result of mean score
4.4 SERVQUAL Gap Analysis
An important tool developed by Parasuraman et al. (1998) to assessing
service quality is SERVQUAL. The SERVQUAL survey has two parts which
are perception and expectation of the customer. The most beneficial of the
SERVQUAL instrument is to identify weaknesses of the service provided by
organization. It‟s also can show the area need improvement. The result shows
the gap between the customer perception and customer expectation. The largest
gap meaning the seriousness needs improvement.
These service quality gaps were calculated by subtracting respondents‟
expectation from their perceptions (P – E). A negative service quality gap
indicates respondents‟ expectations are greater than their perceptions while a
positive service quality gap indicates respondents‟ perceptions exceed their
expectation. Data received from section II of the questionnaires, where there are
two difference angles which are customer perception and customer expectation
expected to be answered. From the data collected, SEVQUAL gap analysis has
been performed. This analysis will help the organization in detecting weak
spots in their service and allowed them to prioritise their resources to improve
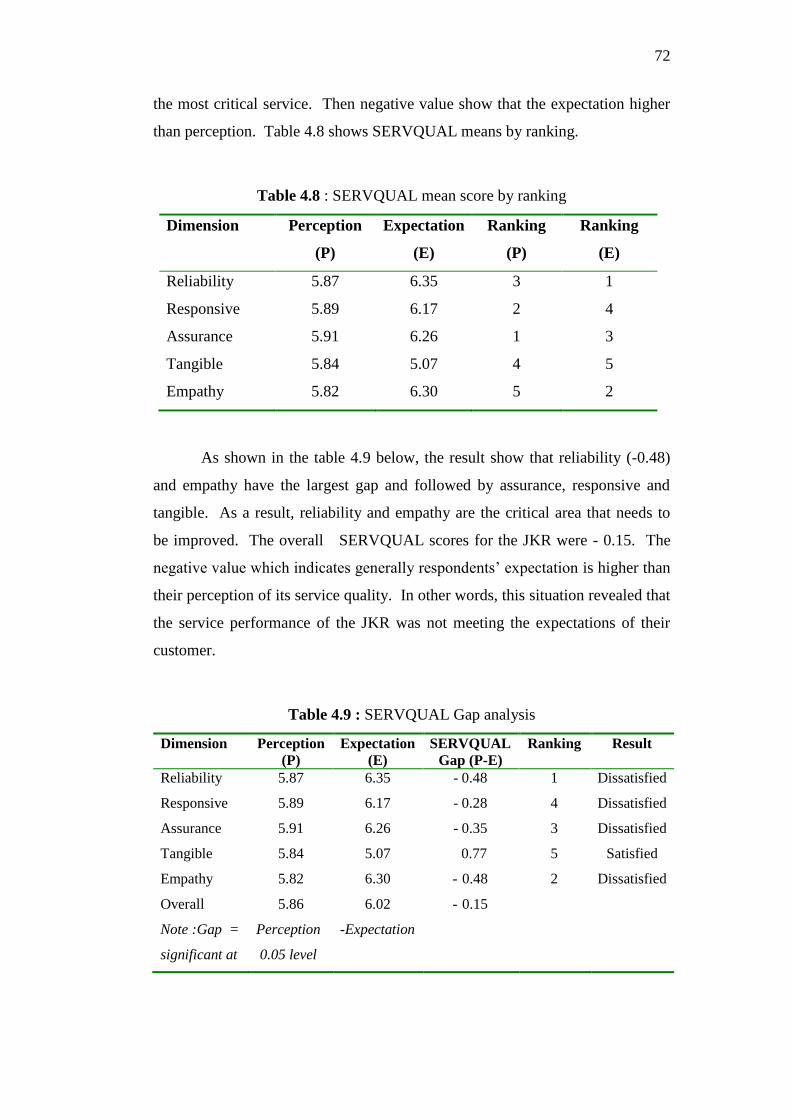
72
the most critical service. Then negative value show that the expectation higher
than perception. Table 4.8 shows SERVQUAL means by ranking.
Table 4.8 : SERVQUAL mean score by ranking
Dimension Perception
(P)
Expectation
(E)
Ranking
(P)
Ranking
(E)
Reliability 5.87 6.35 3 1
Responsive 5.89 6.17 2 4
Assurance 5.91 6.26 1 3
Tangible 5.84 5.07 4 5
Empathy 5.82 6.30 5 2
As shown in the table 4.9 below, the result show that reliability (-0.48)
and empathy have the largest gap and followed by assurance, responsive and
tangible. As a result, reliability and empathy are the critical area that needs to
be improved. The overall SERVQUAL scores for the JKR were - 0.15. The
negative value which indicates generally respondents‟ expectation is higher than
their perception of its service quality. In other words, this situation revealed that
the service performance of the JKR was not meeting the expectations of their
customer.
Table 4.9 : SERVQUAL Gap analysis
Dimension Perception
(P)
Expectation
(E)
SERVQUAL
Gap (P-E)
Ranking Result
Reliability 5.87 6.35 - 0.48 1 Dissatisfied
Responsive 5.89 6.17 - 0.28 4 Dissatisfied
Assurance 5.91 6.26 - 0.35 3 Dissatisfied
Tangible 5.84 5.07 0.77 5 Satisfied
Empathy
Overall
Note :Gap =
significant at
5.82
5.86
Perception
0.05 level
6.30
6.02
-Expectation
- 0.48
- 0.15
2 Dissatisfied
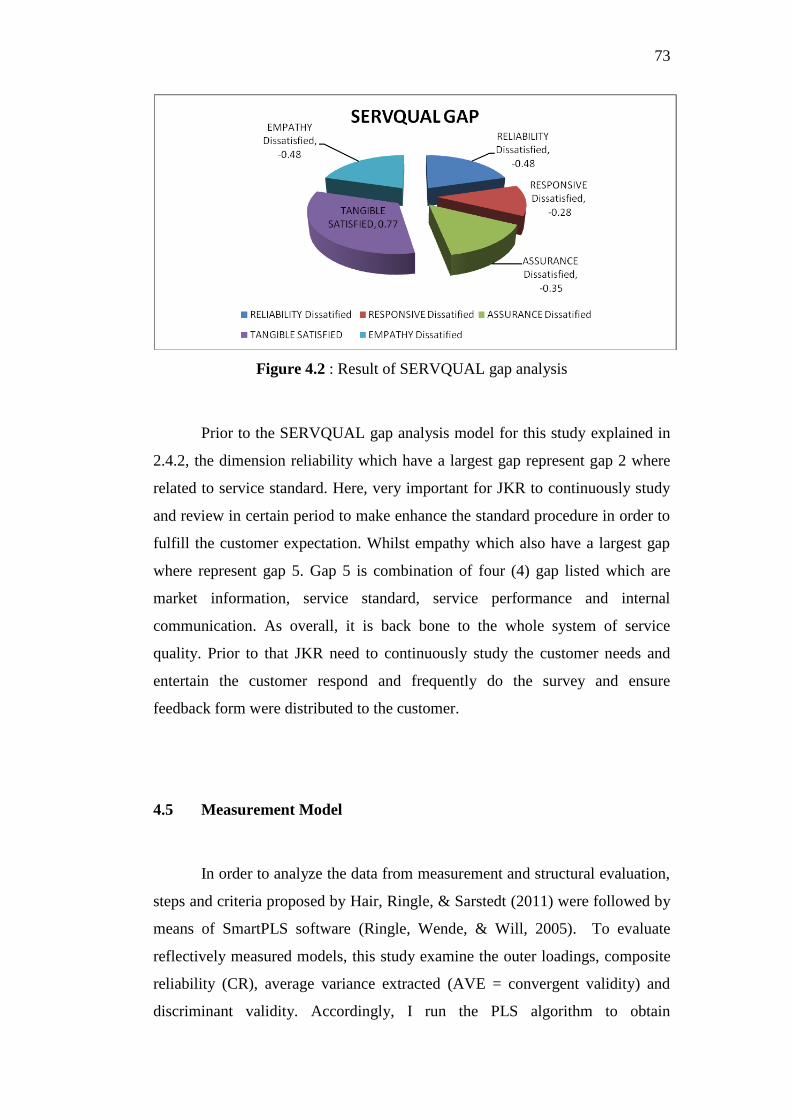
73
Figure 4.2 : Result of SERVQUAL gap analysis
Prior to the SERVQUAL gap analysis model for this study explained in
2.4.2, the dimension reliability which have a largest gap represent gap 2 where
related to service standard. Here, very important for JKR to continuously study
and review in certain period to make enhance the standard procedure in order to
fulfill the customer expectation. Whilst empathy which also have a largest gap
where represent gap 5. Gap 5 is combination of four (4) gap listed which are
market information, service standard, service performance and internal
communication. As overall, it is back bone to the whole system of service
quality. Prior to that JKR need to continuously study the customer needs and
entertain the customer respond and frequently do the survey and ensure
feedback form were distributed to the customer.
4.5 Measurement Model
In order to analyze the data from measurement and structural evaluation,
steps and criteria proposed by Hair, Ringle, & Sarstedt (2011) were followed by
means of SmartPLS software (Ringle, Wende, & Will, 2005). To evaluate
reflectively measured models, this study examine the outer loadings, composite
reliability (CR), average variance extracted (AVE = convergent validity) and
discriminant validity. Accordingly, I run the PLS algorithm to obtain

74
information to evaluate Reflective Measurement Models. As shown in below
table and figure 1 all outer loadings of the reflective constructs are well above
the minimum threshold value of 0.6 except SQA12, SQRL4 and SQRL5 were
deleted due to low loading. Additionally, all three reflective constructs have
high levels of internal consistency reliability, as demonstrated by the above
composite reliability values. The AVE values (convergent validity) are well
above the minimum required level of 0.50, thus demonstrating convergent
validity for all three constructs.
Table 4.10 : Construct Validity
Construct Item Loading AVEa
CRb
Cronbachs
Alpha
SQAc
SQA1 0.833 0.618 0.947 0.937
SQA2 0.771
SQA3 0.744
SQA4 0.725
SQA5 0.784
SQA6 0.794
SQA7 0.849
SQA8 0.843
SQA9 0.802
SQA10 0.835
SQA11 0.643
SQEM SQEP1 0.861 0.757 0.926 0.893
SQEM2 0.866
SQEM3 0.839
SQEM4 0.913
SQREc
SQRL1 0.853 0.629 0.953 0.946
SQRL2 0.793
SQRL3 0.776
SQRL6 0.714
SQRL7 0.770
SQRL8 0.766
SQRL9 0.777
SQRL10 0.840
SQRL11 0.834
SQRL12 0.839
SQRL13 0.792
SQRL14 0.746
SQRP SQRP1 0.758 0.633 0.950 0.941
SQRP2 0.748
SQRP3 0.840
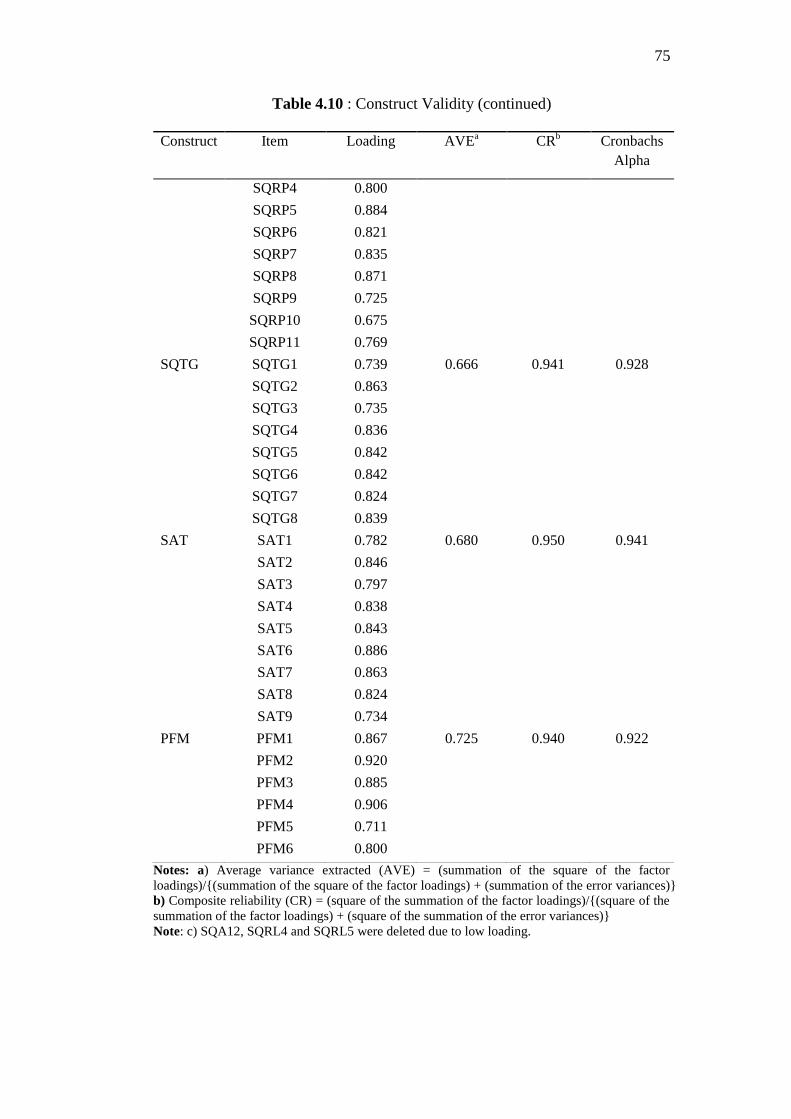
75
Table 4.10 : Construct Validity (continued)
Construct Item Loading AVEa
CRb
Cronbachs
Alpha
SQRP4 0.800
SQRP5 0.884
SQRP6 0.821
SQRP7 0.835
SQRP8 0.871
SQRP9 0.725
SQRP10 0.675
SQRP11 0.769
SQTG SQTG1 0.739 0.666 0.941 0.928
SQTG2 0.863
SQTG3 0.735
SQTG4 0.836
SQTG5 0.842
SQTG6 0.842
SQTG7 0.824
SQTG8 0.839
SAT SAT1 0.782 0.680 0.950 0.941
SAT2 0.846
SAT3 0.797
SAT4 0.838
SAT5 0.843
SAT6 0.886
SAT7 0.863
SAT8 0.824
SAT9 0.734
PFM PFM1 0.867 0.725 0.940 0.922
PFM2 0.920
PFM3 0.885
PFM4 0.906
PFM5 0.711
PFM6 0.800
Notes: a) Average variance extracted (AVE) = (summation of the square of the factor
loadings)/{(summation of the square of the factor loadings) + (summation of the error variances)}
b) Composite reliability (CR) = (square of the summation of the factor loadings)/{(square of the
summation of the factor loadings) + (square of the summation of the error variances)}
Note: c) SQA12, SQRL4 and SQRL5 were deleted due to low loading.

76
Figure 4.3 : Measurement Model
Table 4.11 : Discriminant Validity
Construct SAT SPF SQ SQEM SQRL SQRP SQTG
SAT 0.825*
SPF 0.673 0.851
SQ 0.534 0.562 0.744
SQEM 0.454 0.519 0.569 0.870
SQRL 0.542 0.435 0.294 0.036 0.793
SQRP 0.647 0.557 0.418 0.175 0.175 0.796
SQTG 0.683 0.485 0.466 0.217 0.217 0.047 0.816
*Note: Diagonals (Numbers in bold) represent the average variance extracted (AVE) while the
other entries represent the squared correlations. The off-diagonal values in the above matrix are
the correlations between the latent constructs.
The off-diagonal values in the above matrix are the correlations between
the latent constructs. Table 3 shows that indicate there is discriminant validity
between all the constructs. Moreover, refer to table 4, comparing the loadings
across the columns in the above matrix indicates that an indicator‟s loadings on
its own construct are in all cases higher than all of its cross loadings with other
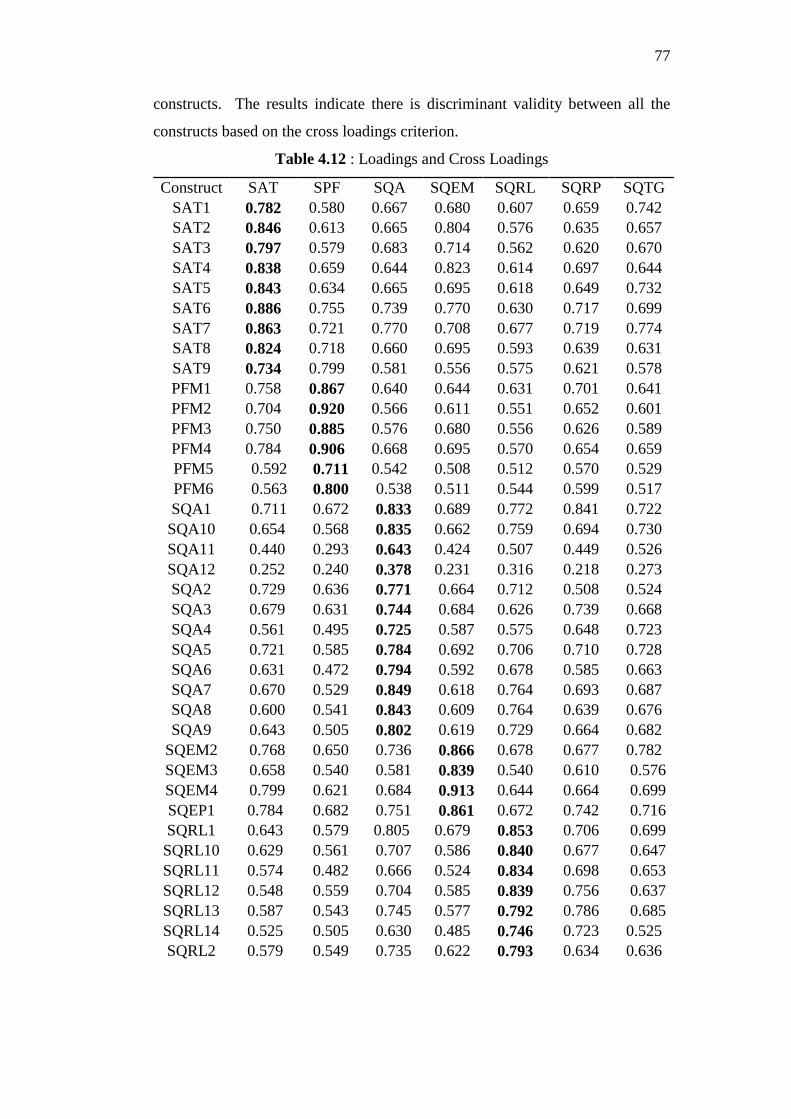
77
constructs. The results indicate there is discriminant validity between all the
constructs based on the cross loadings criterion.
Table 4.12 : Loadings and Cross Loadings
Construct SAT SPF SQA SQEM SQRL SQRP SQTG
SAT1 0.782 0.580 0.667 0.680 0.607 0.659 0.742
SAT2 0.846 0.613 0.665 0.804 0.576 0.635 0.657
SAT3 0.797 0.579 0.683 0.714 0.562 0.620 0.670
SAT4 0.838 0.659 0.644 0.823 0.614 0.697 0.644
SAT5 0.843 0.634 0.665 0.695 0.618 0.649 0.732
SAT6 0.886 0.755 0.739 0.770 0.630 0.717 0.699
SAT7 0.863 0.721 0.770 0.708 0.677 0.719 0.774
SAT8 0.824 0.718 0.660 0.695 0.593 0.639 0.631
SAT9 0.734 0.799 0.581 0.556 0.575 0.621 0.578
PFM1 0.758 0.867 0.640 0.644 0.631 0.701 0.641
PFM2 0.704 0.920 0.566 0.611 0.551 0.652 0.601
PFM3 0.750 0.885 0.576 0.680 0.556 0.626 0.589
PFM4 0.784 0.906 0.668 0.695 0.570 0.654 0.659
PFM5 0.592 0.711 0.542 0.508 0.512 0.570 0.529
PFM6 0.563 0.800 0.538 0.511 0.544 0.599 0.517
SQA1 0.711 0.672 0.833 0.689 0.772 0.841 0.722
SQA10 0.654 0.568 0.835 0.662 0.759 0.694 0.730
SQA11 0.440 0.293 0.643 0.424 0.507 0.449 0.526
SQA12 0.252 0.240 0.378 0.231 0.316 0.218 0.273
SQA2 0.729 0.636 0.771 0.664 0.712 0.508 0.524
SQA3 0.679 0.631 0.744 0.684 0.626 0.739 0.668
SQA4 0.561 0.495 0.725 0.587 0.575 0.648 0.723
SQA5 0.721 0.585 0.784 0.692 0.706 0.710 0.728
SQA6 0.631 0.472 0.794 0.592 0.678 0.585 0.663
SQA7 0.670 0.529 0.849 0.618 0.764 0.693 0.687
SQA8 0.600 0.541 0.843 0.609 0.764 0.639 0.676
SQA9 0.643 0.505 0.802 0.619 0.729 0.664 0.682
SQEM2 0.768 0.650 0.736 0.866 0.678 0.677 0.782
SQEM3 0.658 0.540 0.581 0.839 0.540 0.610 0.576
SQEM4 0.799 0.621 0.684 0.913 0.644 0.664 0.699
SQEP1 0.784 0.682 0.751 0.861 0.672 0.742 0.716
SQRL1 0.643 0.579 0.805 0.679 0.853 0.706 0.699
SQRL10 0.629 0.561 0.707 0.586 0.840 0.677 0.647
SQRL11 0.574 0.482 0.666 0.524 0.834 0.698 0.653
SQRL12 0.548 0.559 0.704 0.585 0.839 0.756 0.637
SQRL13 0.587 0.543 0.745 0.577 0.792 0.786 0.685
SQRL14 0.525 0.505 0.630 0.485 0.746 0.723 0.525
SQRL2 0.579
0.549 0.735 0.622 0.793 0.634 0.636
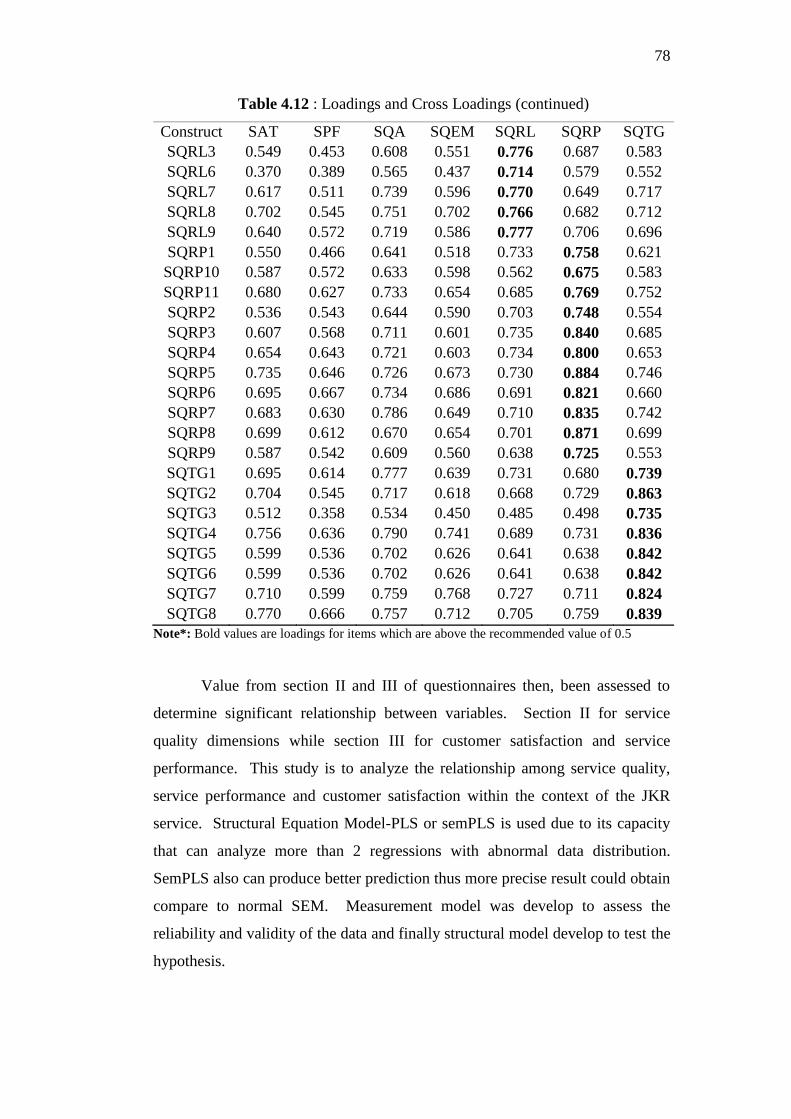
78
Table 4.12 : Loadings and Cross Loadings (continued)
Construct SAT SPF SQA SQEM SQRL SQRP SQTG
SQRL3 0.549 0.453 0.608 0.551 0.776 0.687 0.583
SQRL6 0.370 0.389 0.565 0.437 0.714 0.579 0.552
SQRL7 0.617 0.511 0.739 0.596 0.770 0.649 0.717
SQRL8 0.702 0.545 0.751 0.702 0.766 0.682 0.712
SQRL9 0.640 0.572 0.719 0.586 0.777 0.706 0.696
SQRP1 0.550 0.466 0.641 0.518 0.733 0.758 0.621
SQRP10 0.587 0.572 0.633 0.598 0.562 0.675 0.583
SQRP11 0.680 0.627 0.733 0.654 0.685 0.769 0.752
SQRP2 0.536 0.543 0.644 0.590 0.703 0.748 0.554
SQRP3 0.607 0.568 0.711 0.601 0.735 0.840 0.685
SQRP4 0.654 0.643 0.721 0.603 0.734 0.800 0.653
SQRP5 0.735 0.646 0.726 0.673 0.730 0.884 0.746
SQRP6 0.695 0.667 0.734 0.686 0.691 0.821 0.660
SQRP7 0.683 0.630 0.786 0.649 0.710 0.835 0.742
SQRP8 0.699 0.612 0.670 0.654 0.701 0.871 0.699
SQRP9 0.587 0.542 0.609 0.560 0.638 0.725 0.553
SQTG1 0.695 0.614 0.777 0.639 0.731 0.680 0.739
SQTG2 0.704 0.545 0.717 0.618 0.668 0.729 0.863
SQTG3 0.512 0.358 0.534 0.450 0.485 0.498 0.735
SQTG4 0.756 0.636 0.790 0.741 0.689 0.731 0.836
SQTG5 0.599 0.536 0.702 0.626 0.641 0.638 0.842
SQTG6 0.599 0.536 0.702 0.626 0.641 0.638 0.842
SQTG7 0.710 0.599 0.759 0.768 0.727 0.711 0.824
SQTG8 0.770 0.666 0.757 0.712 0.705 0.759 0.839
Note*: Bold values are loadings for items which are above the recommended value of 0.5
Value from section II and III of questionnaires then, been assessed to
determine significant relationship between variables. Section II for service
quality dimensions while section III for customer satisfaction and service
performance. This study is to analyze the relationship among service quality,
service performance and customer satisfaction within the context of the JKR
service. Structural Equation Model-PLS or semPLS is used due to its capacity
that can analyze more than 2 regressions with abnormal data distribution.
SemPLS also can produce better prediction thus more precise result could obtain
compare to normal SEM. Measurement model was develop to assess the
reliability and validity of the data and finally structural model develop to test the
hypothesis.
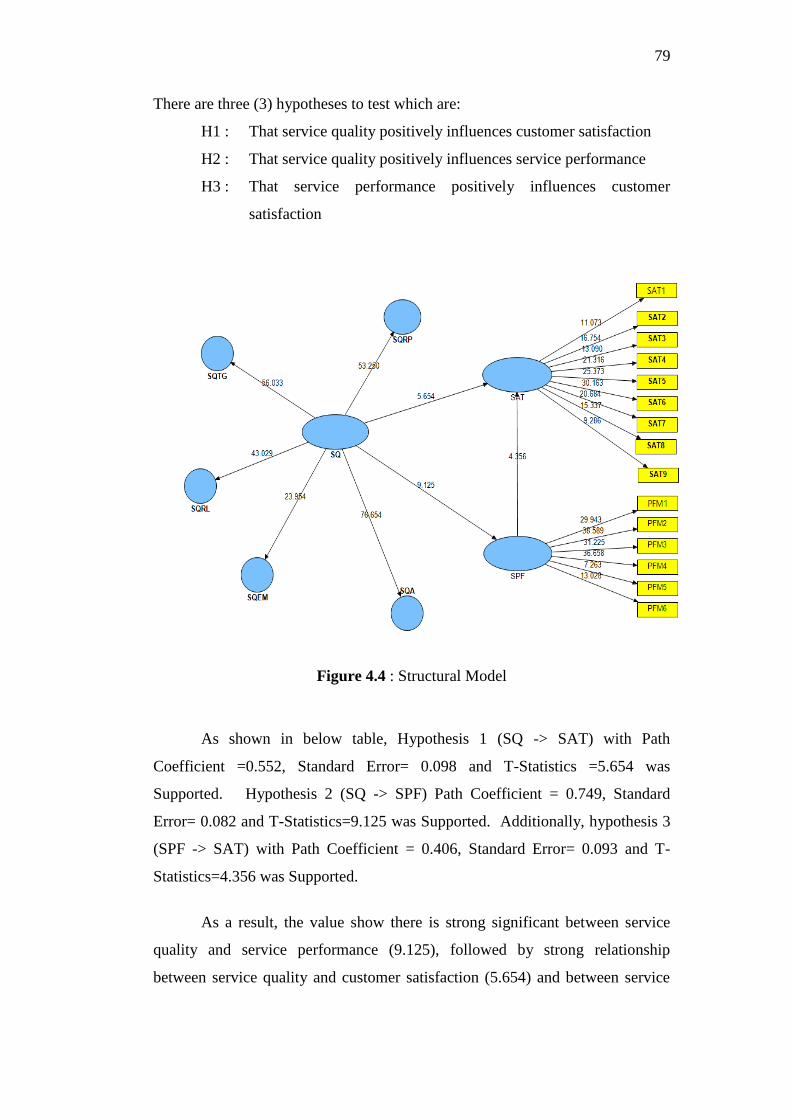
79
There are three (3) hypotheses to test which are:
H1 : That service quality positively influences customer satisfaction
H2 : That service quality positively influences service performance
H3 : That service performance positively influences customer
satisfaction
Figure 4.4 : Structural Model
As shown in below table, Hypothesis 1 (SQ -> SAT) with Path
Coefficient =0.552, Standard Error= 0.098 and T-Statistics =5.654 was
Supported. Hypothesis 2 (SQ -> SPF) Path Coefficient = 0.749, Standard
Error= 0.082 and T-Statistics=9.125 was Supported. Additionally, hypothesis 3
(SPF -> SAT) with Path Coefficient = 0.406, Standard Error= 0.093 and T-
Statistics=4.356 was Supported.
As a result, the value show there is strong significant between service
quality and service performance (9.125), followed by strong relationship
between service quality and customer satisfaction (5.654) and between service

80
performance and customer satisfaction (4.356). Overall result shows in the
table below.
Table 4.13 : Structural Model for hypotheses result
Hypothesis Path Path
Coefficient
Standard
Error
T-
Statistics
Decision
H1 SQ -> SAT 0.552 0.098 5.654* Supported
H2 SQ -> SPF 0.749 0.082 9.125* Supported
H3 SPF -> SAT 0.406 0.093 4.356* Supported
*t-Statistic > 2.58 (sig. level = 1 %)
R ² values of 0.75, 0.50, or 0.25 for endogenous latent variables in the
structural model can be described as substantial, moderate, or weak, respectively
and use bootstrapping to assess the path coefficients‟ significance (Hair et al.,
2011). The minimum number of bootstrap samples is 5,000, and the number of
cases should be equal to the number of observations in the original sample.
Critical t-values for a two-tailed test are 1.65 (significance level = 10 percent),
1.96 (significance level = 5 percent), and 2.58 (significance level = 1 percent) as
shown in above table.
Table 4.14 : R value and Q value
Endogenous
Construct
R
Q2
SAT 0.806 0.508
SPF 0.562 0.367
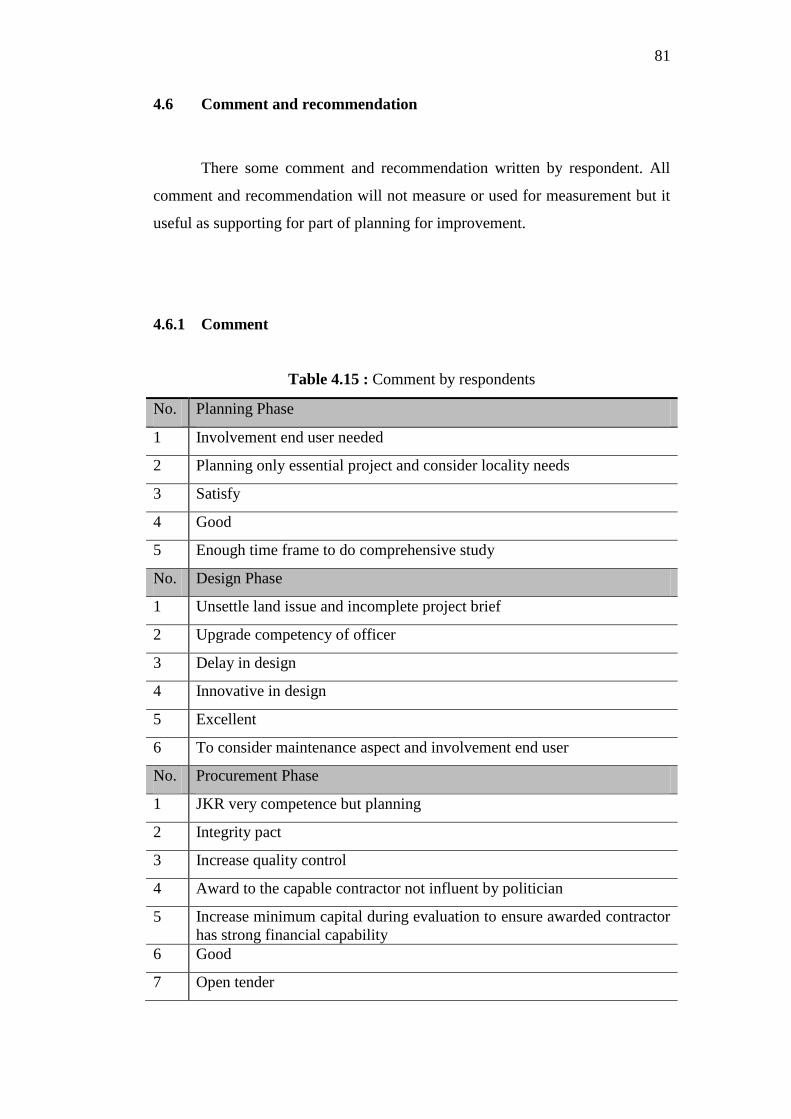
81
4.6 Comment and recommendation
There some comment and recommendation written by respondent. All
comment and recommendation will not measure or used for measurement but it
useful as supporting for part of planning for improvement.
4.6.1 Comment
Table 4.15 : Comment by respondents
No. Planning Phase
1 Involvement end user needed
2 Planning only essential project and consider locality needs
3 Satisfy
4 Good
5 Enough time frame to do comprehensive study
No. Design Phase
1 Unsettle land issue and incomplete project brief
2 Upgrade competency of officer
3 Delay in design
4 Innovative in design
5 Excellent
6 To consider maintenance aspect and involvement end user
No. Procurement Phase
1 JKR very competence but planning
2 Integrity pact
3 Increase quality control
4 Award to the capable contractor not influent by politician
5 Increase minimum capital during evaluation to ensure awarded contractor
has strong financial capability
6 Good
7 Open tender
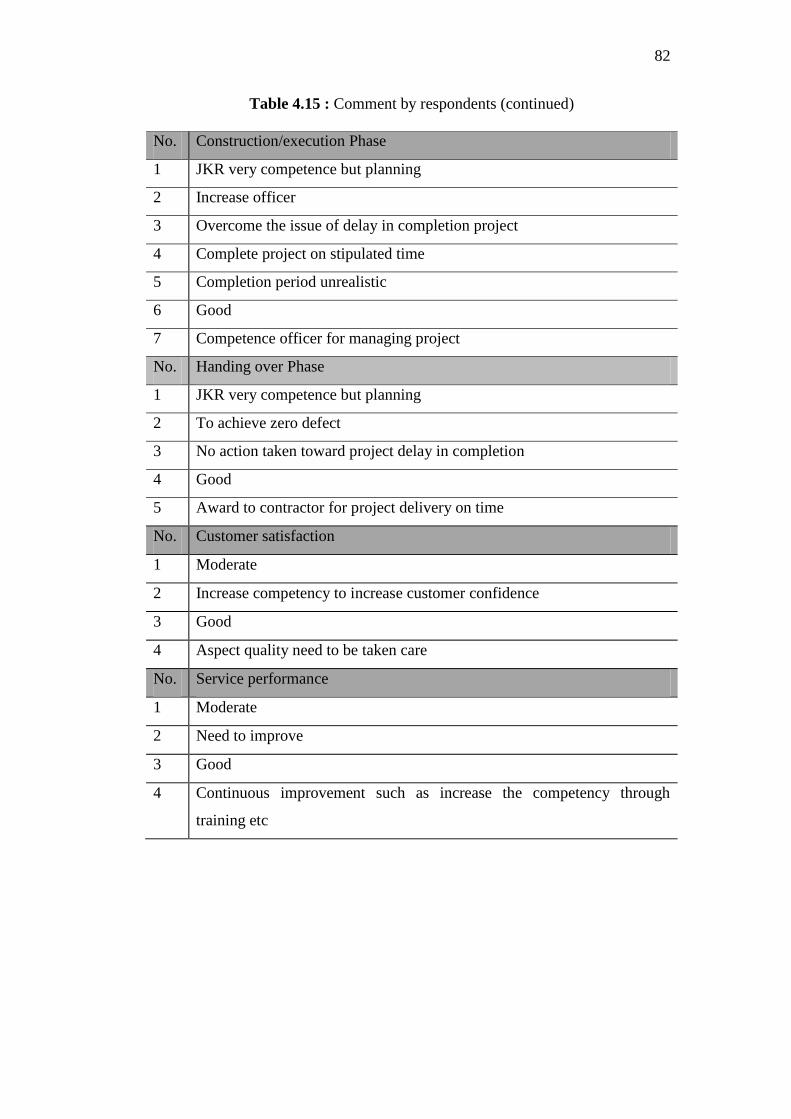
82
Table 4.15 : Comment by respondents (continued)
No. Construction/execution Phase
1 JKR very competence but planning
2 Increase officer
3 Overcome the issue of delay in completion project
4 Complete project on stipulated time
5 Completion period unrealistic
6 Good
7 Competence officer for managing project
No. Handing over Phase
1 JKR very competence but planning
2 To achieve zero defect
3 No action taken toward project delay in completion
4 Good
5 Award to contractor for project delivery on time
No. Customer satisfaction
1 Moderate
2 Increase competency to increase customer confidence
3 Good
4 Aspect quality need to be taken care
No. Service performance
1 Moderate
2 Need to improve
3 Good
4 Continuous improvement such as increase the competency through
training etc
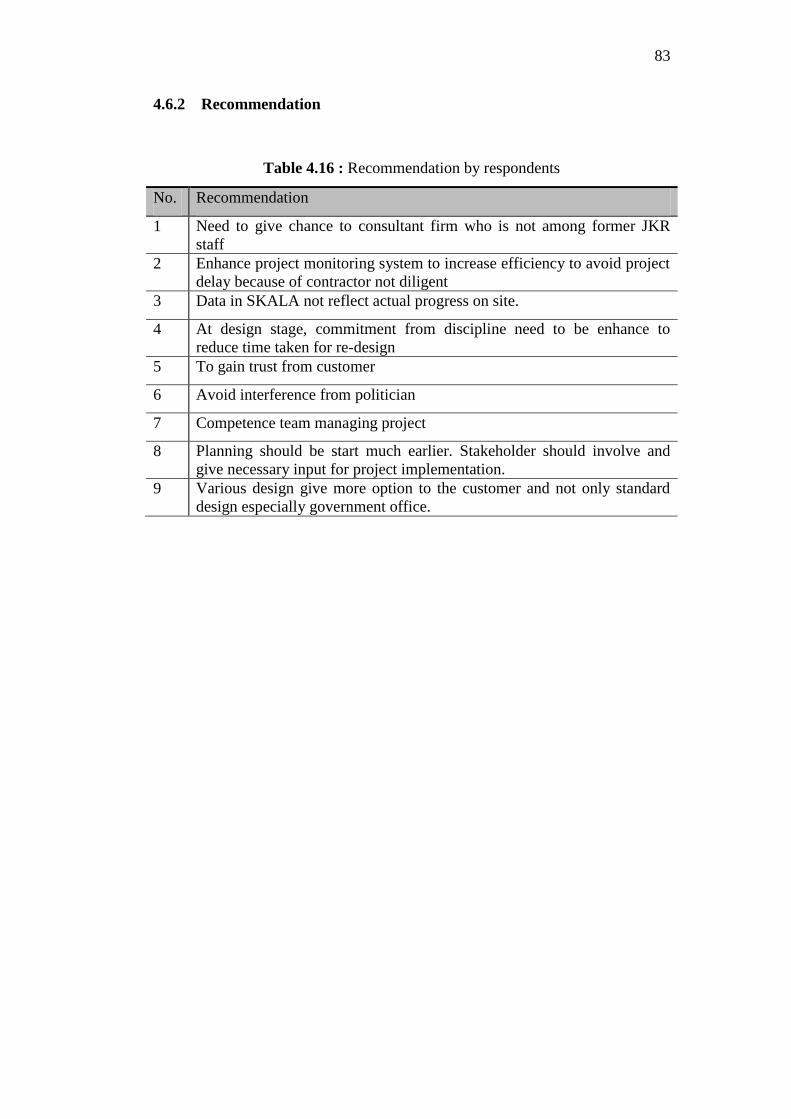
83
4.6.2 Recommendation
Table 4.16 : Recommendation by respondents
No. Recommendation
1 Need to give chance to consultant firm who is not among former JKR
staff
2 Enhance project monitoring system to increase efficiency to avoid project
delay because of contractor not diligent
3 Data in SKALA not reflect actual progress on site.
4 At design stage, commitment from discipline need to be enhance to
reduce time taken for re-design
5 To gain trust from customer
6 Avoid interference from politician
7 Competence team managing project
8 Planning should be start much earlier. Stakeholder should involve and
give necessary input for project implementation.
9 Various design give more option to the customer and not only standard
design especially government office.
84
CHAPTER 5
CONCLUSION AND RECOMMENDATION
5.1 Discussions
The purpose of this study is to examine JKR service quality and its effect
to customer satisfaction and service performance. The first objective of this
study is to assess the most priority dimensions influent in JKR service quality
for sustainable and improvement where necessary. The second objective is to
evaluate the gap between customer perception and expectation and come out
with improvement strategic to mitigate the largest gap and the final objective is
to analyze the relationship among service quality, customer satisfaction and
service performance within the context of the JKR service.
During the survey period, the research was distributed the questionnaires
form personally to relevant respondents. However, most of managerial level
reluctant to give cooperation. This is because they are too busy or they don‟t
want their personnel opinion will reflect to the result. As a result, all the finding
and result not totally appear actual situation as overall. However, for indication
of level of satisfaction and performance and to detect the weaknesses for make
improvement the result still reliable.
From the five (5) dimensions, result shows; mean indicate that
dimension assurance has the highest scores followed by responsive, reliability,
tangible, and empathy. The questions related to assurance are reflect that how
JKR keeping their promise to deliver project on time with valued cost and
acceptable or extensive quality, competency of officer involve and fair in

85
selection of contractor and consultant. However deliver project on time become
a crucial issues because its involved cost to the customer for instance involved
extra rental, loss of profit etc. Prior to the respond of the questionnaires, that
most of the respondents answer for tangible‟s question is neutral. This is
because all the software regardless any phases of project implementation, the
customer not directly involve for instance AUTOCAD software, the customer
only involve during preparing project brief or need statement but not during
design development. Only after completely finished the design, the customer
can comment the design base on their experience such as flow, material,
requirement, accommodation. However, there is area that customer can involve
where the customer can monitor the cashflow and progress project through
SKALA. Prior to this issue, JKR need to review any system to open more
assess to customer to involve in any phases of project implementation in order to
tailor the strategic to strengthen the customer involvement in any aspect.
SERVQUAL gap analysis was performed to investigate the gap between
customer expectation and customer perception. The results reveal that reliability
and empathy has a largest gap and critically need improvement. When talk
about reliability and empathy, both dimensions are related to department and
employees commitments. Reliability is related to consistency of service
delivery whilst empathy is related to professionalism and competency. Both of
dimensions is main support to the excellent service quality delivered.
The SEM approach was used to test the constructs conceptual framework
between JKR service quality, customer satisfaction and service performance.
The result confirmed that the five dimensions which are reliability,
responsiveness, assurance, tangible and empathy are distinct construct for JKR
service quality. The result indicated that JKR service quality consists of five (5)
dimensions has an appropriate reliability. Each dimension has a significant
relationship with service quality. In the JKR service quality, assurance (0.962)
has the high contribution followed by reliability, responsiveness, tangible and
empathy. This indicates that customer looking for service. This means that
86
customer is more concern on the overall services provided by the JKR to have
good relationship with customer.
Additionally, the result showed a significant relationship between JKR
service quality and customer satisfaction. This indicates that high level of
service quality will lead to service performance. The result is consistent with a
study Agus et al. (2007), who stated that service quality dimensions play as an
important indicator for service performance. Similarly, Rahim, A. (2009)
identified that service quality with a customer loyalty is significantly influenced
service performance.
Besides that, the relationship between customer satisfaction and service
performance show a significant relationship. Additionally, the result indicates
that customer is more satisfied with problem solve by JKR, overall services that
better than expected and services provided by JKR. In the JKR service quality
context, customer will service performance was based on willingness to
recommend the improvement and willingness to tell good reputation. The result
consistent with the study Agus et al. (2007), indicate a significant relationship
between patient satisfaction and service performance. The study concludes that
the understanding service quality is important for JKR to more understanding
their customer‟s needs. It also helps them to improve the service quality
delivered.
5.2 Conclusion
There are three (3) objectives of this study achieved from the research
exercises described in the research methodology. Hence, the conclusion that
can be explained as follows.
All five service quality dimension introduce by Parasuraman (1991) are
relevant to the JKR service quality. Prioritization the service quality will help

87
JKR to focus the crucial issues to make improvement meanwhile still need to
attempt the issues less critical. For instance, the study show the result, mean
score indicate that dimension assurance has the highest scores follow by
responsive, reliability, tangible, and empathy. The questions related to
assurance are reflect that how JKR keeping their promise to deliver project on
time with valued cost and acceptable or extensive quality, competency of officer
involve and selection of contractor and consultant. However deliver project
with acceptable value and quality become crucial issues because its involved
cost to the customer for instance involved cost for rectification if doesn‟t meet
quality and building not save for occupy. Mislead in awarding contractor can
cause project not deliver on time.
To sustain the roles and relevance and built in trust by customer, JKR
need to ensure that they need work closely to the client especially during design
stage and construction stage and the same time JKR has to built up officer‟s
competency in order to convict the customers in any relevant issues and come
out with method of evaluation more precise and thorough. According to
Parasuraman et al. (1988), assurance is knowledge and courtesy of employee
and their ability to inspire, convey trust and confidence including competence,
courtesy, credibility and security.
SERVQUAL gap analysis has been introduces to measure the weakness
of the organisation in service delivery and to help organization to make
improvement. The objective of this study is to investigate the gap and perceived
level of service quality in JKR. It was found that customer perception scores
were below the expectations scores that produced the largest gap for reliability
and empathy and this followed by assurance, responsive and tangible.
According to Parasuraman et al. (1988), reliability is the ability involves
performing the promised service dependably and accurately while empathy is
caring, individualised attention the firm provides to its customers including
access, communication and understanding the customers. When look at the
questionnaire for reliability, the first question that was asked whether JKR was
able to deliver their promises on time. According to Macauly (1993), nothing
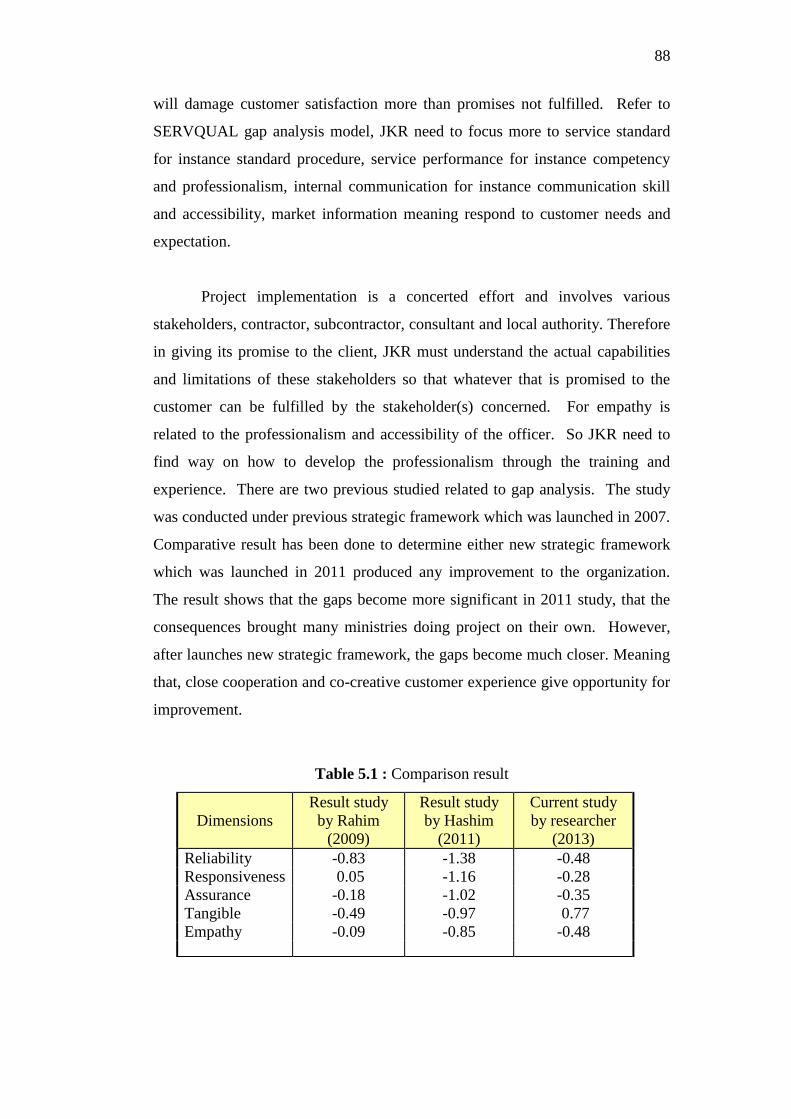
88
will damage customer satisfaction more than promises not fulfilled. Refer to
SERVQUAL gap analysis model, JKR need to focus more to service standard
for instance standard procedure, service performance for instance competency
and professionalism, internal communication for instance communication skill
and accessibility, market information meaning respond to customer needs and
expectation.
Project implementation is a concerted effort and involves various
stakeholders, contractor, subcontractor, consultant and local authority. Therefore
in giving its promise to the client, JKR must understand the actual capabilities
and limitations of these stakeholders so that whatever that is promised to the
customer can be fulfilled by the stakeholder(s) concerned. For empathy is
related to the professionalism and accessibility of the officer. So JKR need to
find way on how to develop the professionalism through the training and
experience. There are two previous studied related to gap analysis. The study
was conducted under previous strategic framework which was launched in 2007.
Comparative result has been done to determine either new strategic framework
which was launched in 2011 produced any improvement to the organization.
The result shows that the gaps become more significant in 2011 study, that the
consequences brought many ministries doing project on their own. However,
after launches new strategic framework, the gaps become much closer. Meaning
that, close cooperation and co-creative customer experience give opportunity for
improvement.
Table 5.1 : Comparison result
Dimensions
Result study
by Rahim
(2009)
Result study
by Hashim
(2011)
Current study
by researcher
(2013)
Reliability -0.83 -1.38 -0.48
Responsiveness 0.05 -1.16 -0.28
Assurance -0.18 -1.02 -0.35
Tangible -0.49 -0.97 0.77
Empathy -0.09 -0.85 -0.48
89
There are three (3) hypotheses developed in conceptual framework
which is to analyze the relationship among service quality, service performance
and customer satisfaction within the context of the JKR service. The result was
confirmed established relationship among service quality, customer satisfaction
and service performance. The study highlighted the important role played by
employees (in terms of assurance, responsive and reliability) in improving
customer satisfaction and service performance. The result also show that the
stronger relationship between service quality and service performance rather
than between service quality and customer satisfaction and between service
performance and customer satisfaction. Other meaning is relationship between
service quality and service performance more crucial for improvement. As a
conclusion the level of JKR service quality need to be improve in order to
enhance the customer satisfaction and improve service performance. JKR need
to study and develop the strategy to ensure the officer play the important role
with adequate competency and professionalism.
As overall conclusion, this study has important implication to the
management of service quality provided by JKR. JKR need to take immediate
action to resolve issues related to the weakness encounter ensure JKR can
improve the service delivered to achieve customer satisfaction into high level.
Strong correlation between service quality, customer satisfaction and
service performance give indicator to organization to perform well in any angle
to sustain relevant and customer loyalty.
Once attributes of service quality from customer perspective known
clearly and understood, JKR should anticipate improvement action rather than
react to the dissatisfaction.
90
5.3 Recommendation
JKR vision towards achieving excellence in service delivery is through
the objective of total customer satisfaction, both internal and external. This
means meeting or exceeding customer expectations and requires establishing
and maintaining a customer-driven organisational culture that focuses on doing
whatever it takes to value for the customer.
Continuous improvement of processes, people and product services aim
at customer satisfaction is essential and is the only survive way.
The study demonstrates the usefulness of the servqual approach as a
good measure of service quality. Even though this study demonstrate the
dimension‟s priority for improvement, but continuous improvement for
dimension less important is necessary to sustain excellent.
Effective implementation plan for co-creative customer experience
strategies need to be developed and it demand strong support and continuous
commitment from leaderships at all levels to successfully execute plan. Even
though the researcher have done comparison study on SERVQUAL gap analysis
and the result shows that new strategic framework given more opportunity for
improvement, however the result for this study still a lot of arguable in term of
reliability. JKR need to study whether the improvement made by 2013, survey
of new strategic framework is really significance or just coincidence due to
government policy or it could be different target respondent doing the survey,
hence different feedback on the study.

91
REFERENCES
Agus, A., Barker, S. and Kandampully, J. (2007), “An exploratory study of
service Quality In the Malaysian Public Service Sector”, International
Journal of Quality & Reliability Management, Vol.24 No. 2, pp.177-190.
Andreassen, T.W and Lindsted. (1998), “A customer loyalty and complex
service; the impact of corporate image in quality; customer satisfaction
and loyalty for customers with varying degrees of service expertise”,
Internal Journal of Service Industry Management, Vol. 9 No. 1, pp 7-23.
Best, J.W. (1977), “Hotel front office management”, 3rd
. ed Englewood Cliff, NJ
: Prentice Hall, Inc.
Bitner, M.J (1990), “Evaluating service encounters: the effect of physical
surroundings and employee responses”, Journal of Marketing, No. 54,
April, pp. 69-82.
Bitner, M.J. and Hubbert, A.R. (1994) “Encounter satisfaction versus overall
satisfaction versus quality”, in Rust, R.T. and Oliver, T.I. (Eds) Service
quality: New Directions in Theory and Practice, Sage, Thousand Oaks,
CA., pp. 70-94
Black, S., Briggs, S., Keogh, W. (2001), “Service quality performance
measurement in public/private sector”, Managerial Auditing Journal,
16/7, pp. 400-405.
Bolton, R.N. and Drew, H.J. (1991), “A multistage model of customers‟
assessment of service quality and value”, Journal of Customer Research,
Vol. 17 No. 174, pp. 375-384.
Bryde, D.J. & Robinson, L., (2007), “The relationship between total quality
management and the focus of project management practices”, The TQM
Magazine, Vol. 19, pp. 50-61.

92
Brysland, A. and Curry, A., (2001), “Service improvements in public services in
public services using SERVQUAL”, Managing Service Quality, Vol. 11.
No. 6, pp. 389-401.
Camilleri, D. and O‟Callaghan, M. (1998), “Comparing public and private
hospital care service quality”, International Journal of Healthcare
Quality Assurance, 11/4, pp. 127-133
Carman, (1990), “Customer perceptions of service quality : an assessment of the
SERVQUAL dimensions”, Journal of Retailing, Vol. 66 pp. 47
Chatzoglou, P., Chatzoudes, D., Vraimaki, E. and Diamantidis, A., (2013),
“Service quality in public sector : the case of the citizen‟s service centers
(CSCs) of Greece”, International Journal of Productivity and
Performance Management, Vol. 62, No. 6, pp. 583-605.
Churcill, G.A. Jr. And Surprenant, C. (1982), “An investigation into the
determinants of customer satisfaction”, Journal of Market Research, No.
Xix, November, pp. 491-504
Churcill, G.A. Jr. (1979), “A paradigm for developing better measures of
marking constructs”, Journal of Marketing Research, Vol. 16, pp. 64-73
Dadfar, H. And Brege, S., Semnani, S.S.E., (2013), “Customer involvement in
service production, delivery and quality : the challenges and opportunity,
International Journal of Quality and Service Science”, Vol. 5, No. 1, pp.
45-65.
Drucker, Peter. (1980), “The deadly sins in public administration”, Public
Administration Review, Vol. 40 No. 2, pp. 103-106
Edvardsson, B., (1998), “Service Quality Improvement Managing Service
Quality”, 8(2): 142-149.
Edvardsson, B. (1998), “Service quality improvement”, Managing Service
Quality, Vol. 8, No. 2, pp. 142-149
Forsythe, (2008), “Modeling customer perceived service quality in housing
construction”, Engineering, Construction and Architectural
Management”, Vol. 15, No. 5, pp. 485-496
Fitzsimmons, J.A and Fitzsimmons, M.J, “ Service management: operations,
strategy and information technology”, McGraw-Hill, Boston MA
93
Gilbert, A. Churcill, J.R. and Surprenant, C., (1998), “Expectations and norms in
models of customer satisfaction”, Journal of marketing Research, Vol.
19, November, p. 3
Hair, J. F., Ringle, C. M., & Sarstedt, M. (2011). PLS-SEM: INDEED A
SILVER BULLET. Journal of Marketing Theory and Practice, 19(2),
139-151.
Hashim, H., Rasid, S.Z.A. and Ismail, W.K.W. (2011), “Customer service
quality in a public agency in Malaysia : Towards a customer-focused
public organization”, Australia Journal of Basic and Applied Sciences,
5(9):1777-1783.
Harun, M.D. (2012), “Meeting customer expectations : JKR project delivery
services”, Conference paper Senior Conference, JKR, Langkawi.
Helms,M.M and Mayo, D.T, (2008), “Assessing poor quality service :
perceptions of customer service representatives”, International Journal
of Managing Service Quality, Vol. 18 No. 6, pp. 610-622
Hsieh, Y.H. and Yuan, S.T. (2010), “Modeling service experience experience
design process with customer expectation management”, Kybernets, Vol.
39, No. 7, pp. 1128-1144
IIhaamie, A.G.A. (2009), “Service quality in Malaysia public service : some
findings”, IAENG, pp. 40-45.
Kang, G. and James, J., “Service quality dimensions : an examination of
Gronroos‟s service quality model”, Managing Service Quality, Vol. 14,
No. 4, pp. 266-277.
KPMG, (1997), “Organization service the public : transformation to the 21st
century”, KPMG, New York, pp. 74
Kumar, P. and Nandi, V.T., “ Analyzing quality Gap, case of public sector bank
in South Delhi”, IJEMR, Vol. 1, Issue 4.
LaTour, S.A. and Peat, N.C., (1979), “Conceptual and methodological issues in
satisfaction research”, in Wilkie. W.L (Ed.), Advances in Consumer
Research, No. 6, Association for Consumer Research, Ann Arbor, ML.
Levesque, T. And McDougall, G. (1996), “Determinants of customer
satisfaction in retail banking”, International Journal of Banking
Marketing, Vol. 14 No. 7, pp. 12-20.
94
Loke, S.P., Taiwo, A.A., Salim, H.M. and Downe, A.G., (2011), “Service
quality and customer satisfaction in a telecommunication service
provider”, International Conference on Financial Management and
Economics, Vol. 11, IACSIT Press, Singapore.
Miguel, P.A.C, Silva, M.T.D, Chiosini, E.L. and Schutzer, K., “Assessment of
service quality dimensions : a study in a vehicle repair service chain”,
Naik, C.N.K, Gantasala, S.B., Prabhakar, G.V. (2010), “Service quality and its
effect on customer satisfaction in retailing”, European Journal of Social
Science, Vol. 16. No. 2, pp. 231-243.
Nwankwo, S. and Richardson, B., (1994), “Measuring and archieving quality
customer service in public sector”, Managing Service Quality, Vol. 6, No.
6, pp. 32-36.
Ojasala, F., (2001), “Managing customer expectations in professional services”,
Managing Service Quality, Vol. 11, No. 3, pp. 200-212.
O‟Neill, M. and Palmer, A., (2003), “An exploratory study of the effects of
experience on customer perceptions of the service quality construct”,
Managing Service Quality, Vol. 13, No. 3, pp. 187-196.
Parasuraman, A., Zeithaml, V.A. and Berry, L.L, (1988), “ Alternative scale for
measuring service quality : a comparative assessment based on
psychometric and diagnostic criteria”, Journal of Retailing, Vol. 70, No.
3, pp. 201-230.
Parasuraman, A., Zeithaml, V.A. and Berry, L.L, (1994), “SERVQUAL : a
multiple-item scale for measuring consumer perceptions of service
quality”, Journal of Retailing, Vol. 64, No. 1, pp. 12-40.
Parasuraman, A., Zeithaml, V.A. and Berry, L.L, (1985), “A conceptual model
of service quality and its implications for future research”,
Ringle, C. M., Wende, S., & Will, A. (2005). SmartPLS 2.0: www.smartpls.de
Robinson, L. (2003), “Committed to quality : the use of quality schemes in UK
public leisure services”, Managing Service Quality, Vol. 13, No. 3, pp.
247-255
Robledo, M.A., (2001), “Measuring and managing service quality : integrating
customer expectations”, Managing Service Quality, Vol. 11, No. 1, pp.
22-31.
95
Shahin, A., “SERVQUAL and model of service quality gaps : A framework for
determining and prioritizing critical factors in delivering quality
services”.
Speller, S. and Ghobadian, A. (1993), “Change for public sector”, Managing
Service Quality, pp. 29-34.
Strategic Framework 2007-2010, Jabatan Kerja Raya Malaysia.
Strategic Framework 2012-2015, Jabatan Kerja Raya Malaysia.
Taylor, W.A. and Wright, G.H. (2003), “A longitudinal study of TQM
implementation : factors influencing success and failure”, Omega : The
International Journal of Management Science, Vol. 31, No. 2, pp. 97-
111
Teas, R.K (1993), “Expectations, performance evaluation and consumers‟
perception of quality”, Journal of Marketing, October, Vol. 57, pp. 18-24
Winch, G., Usmani, A. and Edkins, A, (1998), “Towards total project quality : a
gap analysis approach‟, Construction Management & Economics, Vol.
16, No. 2, pp. 193-207
Wisniewski, M. (2001), “Using SERVQUAL to assess customer satisfaction
with public sector services”, Managing Service Quality, Vol. 11, No. 6,
pp. 380-388.
Related Documents